
A Quantitative Evaluation of the Masking effect arising from Proximity of Injection site to the...
11
World Journal of Nuclear Medicine Volume 5, Number 2, April 2006 Published by WFNMB Online: www.wjnm.org World Journal of Nuclear Medicine Volume 5, Number 2, April 2006,pp 73-140 ISSN 1450-1147 WORLD FEDERATION OF NUCLEAR MEDICINE AND BIOLOGY
Transcript of A Quantitative Evaluation of the Masking effect arising from Proximity of Injection site to the...

World Journal of Nuclear Medicine
Volume 5, Number 2, April 2006
Published by WFNMB
Online: www.wjnm.org
Wo
rld J
ou
rna
l of N
ucle
ar M
ed
icin
eV
olu
me 5
, Nu
mb
er 2
, Ap
ril 20
06
,pp
73
-1
40
ISS
N 1
45
0-
11
47
WORLDFEDERATION
OFNUCLEAR
MEDICINEAND
BIOLOGY

World Journal of Nuclear Medicine, Volume 5, Number 2, April 2006
A Quantitative Evaluation of the Masking effect arising from Proximity of Injection site to the Adjacent Lymph Nodes in Lymphoscintigraphy: A Phantom Study
1 1 2 1 3 3 1Sabbir Ahmed ASM , Demir M , Demir B , Sayman HB , Tugrul AB , Dirlik E , Uslu I
1Department of Nuclear Medicine, Cerrahpasa Medical Faculty, Istanbul University, Istanbul, Turkey2Department of Physics, Faculty of Science, Istanbul University, Istanbul, Turkey3 Nuclear Energy Institute, Istanbul Technical University, Istanbul, Turkey
CorrespondenceDr. A.S.M. Sabbir AhmedNukleer Tip ABDIstanbul Universitesi Cerrahpasa Tip Fakultesi34303, Cerrahpasa, Istanbul, TurkeyE-mail: [email protected]
Abstract
Lymphoscintigraphy essentially requires appropriate choice of collimators for resolving relatively small amounts of radio tracer in the sentinel nodes against injection-site. A novel flat phantom made of Plexiglass with multiple holes (simulating lymph nodes) has been designed to determine the range and intensity of masking effect of the injection site (IS) on surrounding pixels for in-plane and gradually deeper placed hotspots. The newly developed phantom has 18 holes, one central hole with 3700 KBq Tc-99m pertechnetate and 17 other holes, each with 37 KBq of Tc-99m pertechnetate. The in-plane hotspots (number 10, hotspots with equal depth) are arranged in a helical fashion at distances of 5, 10, 15… 50 mm from the centre. The gradually deeper placed hotspots (number 7) are arranged in a linear array with equal linear distances from each other. The study was conducted by placing the phantom at different depths (1, 3, 5, and 7 cm) in a container filled with water without/with background activity (to simulate 1-day and 2-day protocols) of 370 KBq of Tc-99m pertechnetate/5 Litres of water. The study was performed with Siemens Orbiter 7500 Digitrac gamma camera using 3 separate collimators consecutively: low energy all purpose (LEAP), low energy high resolution (LEHR) and medium energy all purpose (MEAP). The static images of 1M counts were acquired in 256x256 matrix, word mode on to an ADAC Pegasys (II) computer system for processing. Relative intensity per pixel for each hotspot (both for in-plane and
gradually deeper hotspots) and the count/pixel values for doughnut shaped circular ROIs were calculated. The image-profiles for the linear hotspots were generated to calculate full widths at half maximum (FWHM) using ADAC Pegasys software program, and the visualizing status of the gradually deeper placed hotspots was studied at different color-contrast windows. No significant difference was observed between 1-day and 2-day protocol. The cutoff distance for blurring effect was found as 12-15 mm surrounding the injection site (IS) and was minimum for MEAP. Images were better identified with high color-contrast window. MEAP collimator was found to be producing minimum masking (blurring) effect from injection site to nearby hotspots for both in-plane and gradually deeper placed hotspots and hence exhibited higher effectiveness of detecting small hotspots at higher visual color-contrast window.
Lymphoscintigraphy (LS) is an important diagnostic tool for lymphatic mapping, which is now being increasingly used as a guide for cancer surgery. The basic principle of the technique is based on migration of radiocolloids or radiolabelled macromolecules of some specific sizes and properties through lymphatics after introduction into appropriate tissue planes. The sentinel node (SN) is the first lymph node to receive cancer cells metastasizing from the primary tumour. Through this process radioactivity is measured in draining lymphatic basin by an auditory signal producing gamma probe for pinpointing the location of the sentinel nodes. Gamma probe directed mapping is based on the identification of “hot” lymph nodes by scintigraphy. As the radioactive tracer flows along lymphatic chain, the SN should be the first and only hot node if mapping is performed within 20-30 minutes after injection of the tracer
Key words: Lymphoscintigraphy, Masking Effect, Collimator, Phantom
World J Nucl Med 2006;5:119-128
Introduction
Medical Physics
119

(1). As more time passes, the tracer continues up the nodal chain and hence non-sentinel nodes become hot. If the SN is found tumor free by biopsy, then other nodes might be assumed to be free of metastasis (2,3). This helps the surgeons to spare the patients from unnecessary extensive lymph node dissection.The technique requires one or more interstitial injection in an appropriate tissue plane. The selection of proper injection site (IS) depends on size, type and location of tumours and varies from institution to institution. The amount of injected dose of radioactivity is also very important because of the artifacts from the injection site that mask the nearby lymph nodes (4). Apart from this, the conventional characteristics of different collimators have some limitations of identifying and locating regions under certain size, which is called spatial resolution. An improper choice of collimator associates decreasing count rates, degradation of image resolution, reduction of image contrast and production of different artifacts in the image (5).The distribution of radio colloid in the lymphatic channels and the quality of image depend on size, site and type of tumor, amount of injected dose, size of injected particles and distance of injection site from tumour (1,2,6). Rettenbacher et al. found an identification rate of 94% in the case of close injection distance (2-5 mm) from either the melanoma or the biopsy scar. On the other hand, the identification rate was 100% when the distance was 10 mm or more (7).Yip et al. (8) have reported in their study the normal location of internal mammary and axillary lymph nodes to be at an
average depth of 3.0 1.1 cm with a range of 1.0-7.1 cms. In their study, the average lymph node depth was classified according to the weight of the patients, with average depths of 2.5, 3.1 and 3.7 cm for patients weighing less than 60, 60-75 and more than 75 kgs respectively.From another study conducted by Cox et al. (9), a greater incidence of positive sentinel lymph nodes (SNs) were found in patients who had invasive tumours of increasing size: 16% with tumour size between 0.1 mm and 1 cm, 32.8% with tumor size between 1-2 cm and 40.8% with tumor size between 2-5 cm.It may be noted that image noise is a common phenomenon in planar imaging and plays a significant role on the quality of the final image. The main sources of noise are: background radioactivity, attenuation or scattering of radiation inside patient's body or electronic noise. Attenuation is a phenomenon in which the amount of detected radiation is reduced by some physical processes such as scattering or absorption. Gamma ray and X-ray photons of the energy used in nuclear medicine imaging (60 to 600 keV) can undergo two kinds of interactions in materials: Photoelectric absorption and Compton scattering (5). In the scattering process, the photon is deflected from its straight-line motion by an interaction. The scattered photon has less energy; the greater its angle of
±
deflection, the greater the energy lost. Photon attenuation in any medium increases with depth inside that medium. That results flattening of peaks of the image profiles (10). Usually conventional image quality is analyzed in terms of signal to noise ratio (S/N) (10).The blurring effect emanating from the brightest points in an image masks the surrounding region and is considered as an obvious effect. This effect arises because the gamma rays penetrate preferentially along those paths that intersect the septal walls for the shortest distance. Rays that intersect the walls at oblique angles have longer pathways through the septa and, therefore, are attenuated more than rays traveling perpendicular to the septa walls. Thus, the penetration occurs preferentially along lines connecting the centres of the adjacent holes. The penetration generally occurs along the directions that correspond to combinations of lattice basis vectors having the shortest length (5). The penetrating radiations constitute a diffuse background and thus reduce contrast of the images. In some clinical cases among the breast cancer patients (women), it is difficult to identify the sentinel node because of the existence of too many hot spots or diffusely hot axilla. Generally, this situation occurs when the radio colloid passes through the SN to the second echelon node and further downstream nodes (11). In order to assess the number of hot spots for this type of clinical situation, 1-day and 2-day protocols have been proposed by Koizumi et al (12). But, during lymphoscintigraphy, blurring effect emerged from the injection site masks nearby hotspots and makes it difficult to identify individual hot spot. In the present work, a multifocal (simulating lymph nodes) flat phantom was designed and tested with different collimators at different depths in water for the following purposes: (i) to calculate the relative pixel intensity (the contribution of high activity site to surrounding pixels) in order to quantify the intensity of masking/blurring effect emerged from injection site to nearby in-plane hotspots, (ii) to measure the range of masking effect surrounding the injection site, (iii) to study the visualizing status among gradually deeper hotspots at different visual color-contrast window, (iv) to study how relative pixel intensity (RPI) varies with depth and (v) to find the suitability of monitor-calibration with this phantom before lymphoscintigraphy.
Designing the phantomThe phantom used in the study was designed with two sets of holes, one set arranged in a helical manner and the second arranged in a linear array (both sets of holes simulate lymph nodes) on a plexiglass block (20x15x5cm). The arrangement of the holes was aimed at studying the masking effects resulting from a central hole containing high radioactivity (simulating the injection site) on the low activity hotspots, simulating lymph nodes (Figures 1, 2). The holes arranged in helical fashion (numbered as 1-10;
Materials and methods
120
Sabbir Ahmed ASM, Demir M, Demir B, et al.
World Journal of Nuclear Medicine, Volume 5, Number 2, April 2006

termed in the text as hotspots) were drilled on plane surface of the block with same depth and radius (1.5 cm and 0.2 cm respectively). The central hole (simulating injection site) was made with same radius (0.2 cm) but with a depth of 0.5 cm. The distances of the holes (1-10) from the centre (0) were 5 mm, 10 mm, 15 mm…50 mm respectively. The angular distance between two consecutive holes to the
centre was 36 degrees. The linear holes (termed in the text as lesion and numbered as A, B, C, D, E, F and G), were arranged with gradually increasing depths (A = 1, B = 1.5, C = 2, … …G = 4 cm) having same radius (0.2 cm) and equal linear spacings between them. The centre-to-centre (CC) distance between central hole (0) and lesion A (0-A) was 8 mm and the nearest surface to surface (SS) distance
Figure 1. Schematic diagram of the self-designed multi-focal flat phantom used in the study. The phantom used in the study was designed with two sets of holes, one set arranged in a helical manner (Hole Nos. 1-10) and the second arranged in a linear array (Holes A-G). The central hole “O” which simulates the injection site is at the centre (Red arrow)
World Journal of Nuclear Medicine, Volume 5, Number 2, April 2006
Sabbir Ahmed ASM, Demir M, Demir B, et al.
121
between 0 and A was 4 mm. The CC and SS distances for all other linear holes were same from each other (Figures 1, 2).Preparing point sources To prepare the point sources, 370 MBq of Tc-99m pertechnetate was diluted in 500 ml saline in order to obtain
a specific activity of 740 KBq/mL. Fifty l of saline was dropped into tiny plastic tube (each 0.5 cm long and 0.15 cm
µ
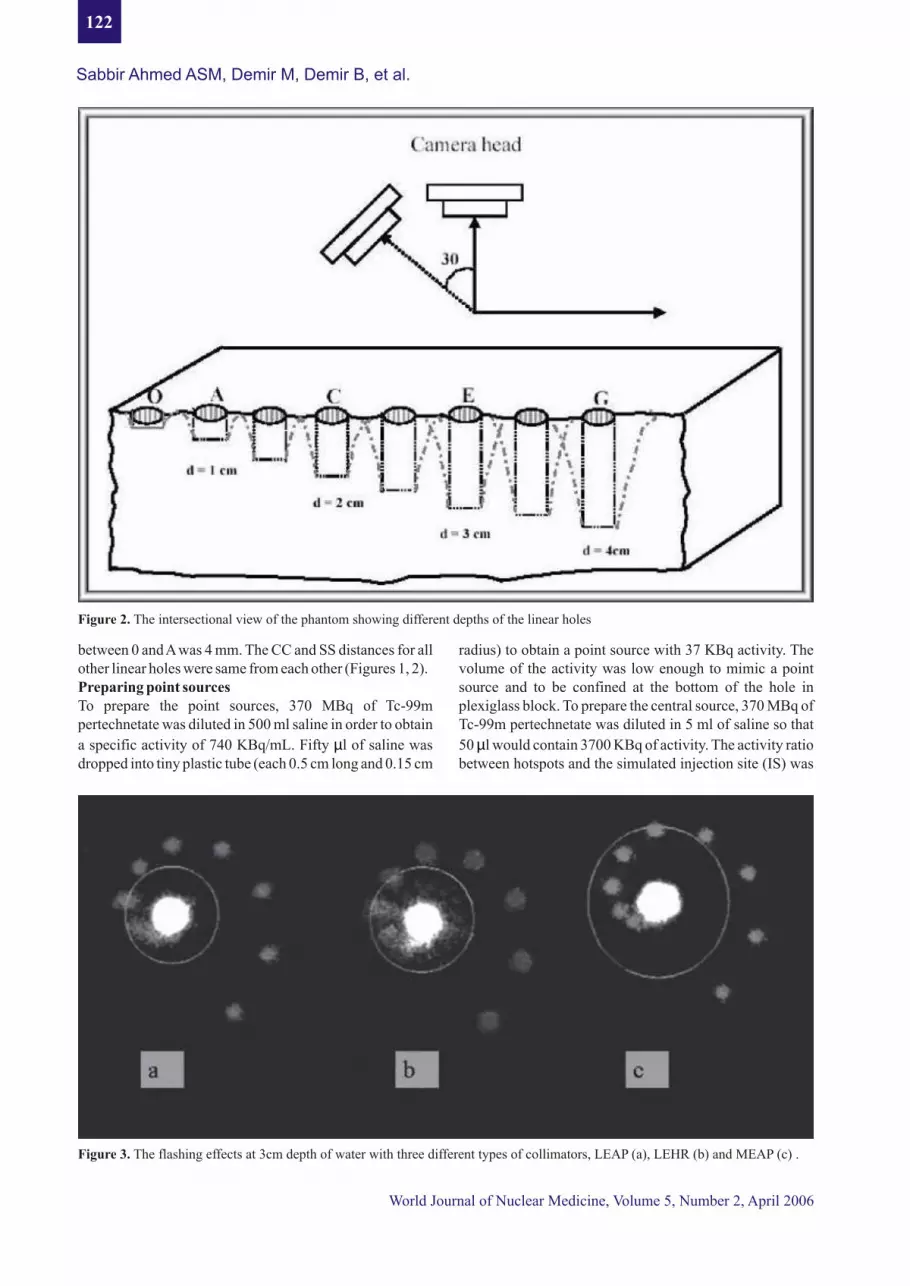
radius) to obtain a point source with 37 KBq activity. The volume of the activity was low enough to mimic a point source and to be confined at the bottom of the hole in plexiglass block. To prepare the central source, 370 MBq of Tc-99m pertechnetate was diluted in 5 ml of saline so that
50 l would contain 3700 KBq of activity. The activity ratio between hotspots and the simulated injection site (IS) was
µ
Figure 3. The flashing effects at 3cm depth of water with three different types of collimators, LEAP (a), LEHR (b) and MEAP (c) .
Figure 2. The intersectional view of the phantom showing different depths of the linear holes
122
Sabbir Ahmed ASM, Demir M, Demir B, et al.
World Journal of Nuclear Medicine, Volume 5, Number 2, April 2006
1:100 (2). The open faces of all the tubes were closed with plastic covers and then were placed tightly inside the holes of the Plexiglass-block.
Working with the phantomThe phantom along with the mounted point sources was immersed in a container (capacity 5 liter) at different depths in water consecutively: (i) all the holes (hotspots 1-10) were
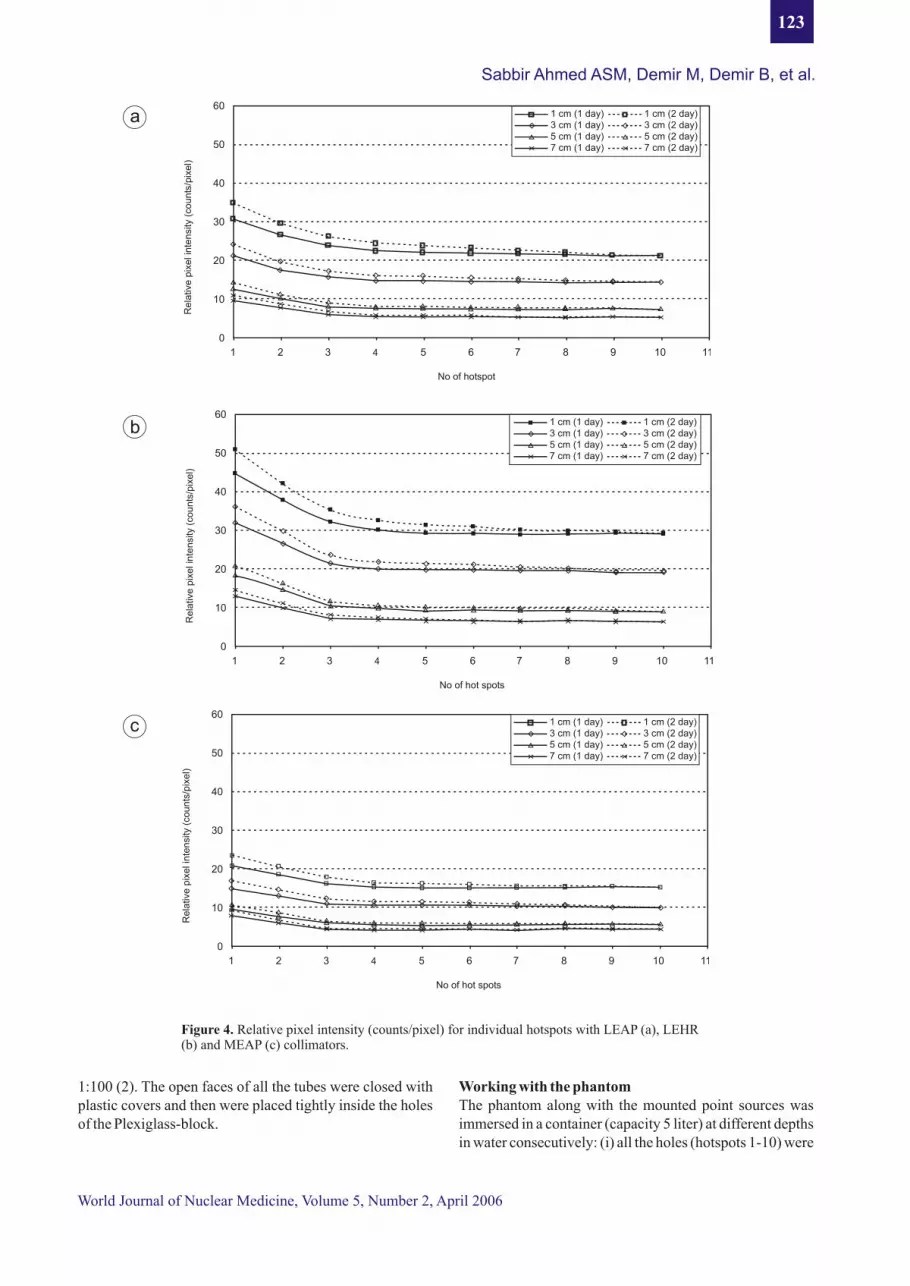
Figure 4. Relative pixel intensity (counts/pixel) for individual hotspots with LEAP (a), LEHR (b) and MEAP (c) collimators.
World Journal of Nuclear Medicine, Volume 5, Number 2, April 2006
Sabbir Ahmed ASM, Demir M, Demir B, et al.
60
50
40
30
20
10
0
Re
lativ
e p
ixe
l in
ten
sity
(co
un
ts/p
ixe
l)
1 2 3 4 5 6 7 8 9 10 11
No of hot spots
1 cm (1 day) 1 cm (2 day)3 cm (1 day) 3 cm (2 day)5 cm (1 day) 5 cm (2 day)7 cm (1 day) 7 cm (2 day)
c
1 2 3 4 5 6 7 8 9 10 11
No of hot spots
60
50
40
30
20
10
0
Re
lativ
e p
ixe
l in
ten
sity
(co
un
ts/p
ixe
l)
1 cm (1 day) 1 cm (2 day)3 cm (1 day) 3 cm (2 day)5 cm (1 day) 5 cm (2 day)7 cm (1 day) 7 cm (2 day)
b
60
50
40
30
20
10
0
Re
lativ
e p
ixe
l in
ten
sity
(co
un
ts/p
ixe
l)
1 2 3 4 5 6 7 8 9 10 11
No of hotspot
1 cm (1 day) 1 cm (2 day)3 cm (1 day) 3 cm (2 day)5 cm (1 day) 5 cm (2 day)7 cm (1 day) 7 cm (2 day)
a
123
0 5 10 15 20 25 30 35 40 45 50 55
Distance from the center
Co
un
ts p
er
pix
el
14
12
10
8
6
4
2
0
LEAPLEHRMEAP
0 5 10 15 20 25 30 35 40 45 50 55
14
12
10
8
6
4
2
0
Distance from center (cm)
Co
un
ts p
er
pix
el
LEAPLEHRMEAP
0 5 10 15 20 25 30 35 40 45 50 55
14
12
10
8
6
4
2
0
Distance from center (cm)
Co
un
ts p
er
pix
el
LEAPLEHRMEAP
0 5 10 15 20 25 30 35 40 45 50 55
14
12
10
8
6
4
2
0
Distance from center (cm)
Co
un
ts p
er
pix
el
LEAPLEHRMEAP
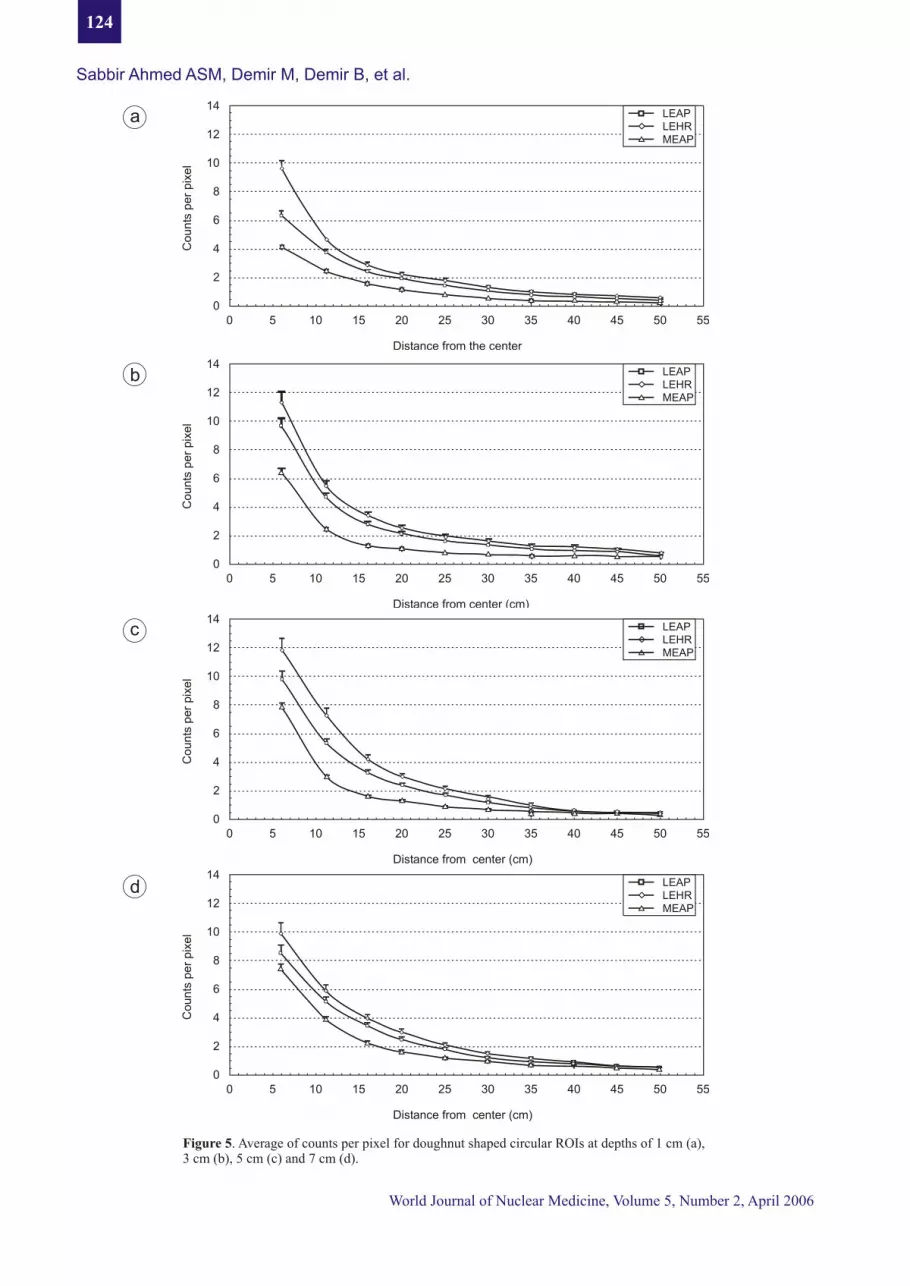
Figure 5. Average of counts per pixel for doughnut shaped circular ROIs at depths of 1 cm (a),3 cm (b), 5 cm (c) and 7 cm (d).
a
b
c
d
124
Sabbir Ahmed ASM, Demir M, Demir B, et al.
World Journal of Nuclear Medicine, Volume 5, Number 2, April 2006

Les
ion
num
ber
Gra
de
FW
HM
(m
m)
Gra
de
G-1
5.0
- 6.
0C
I
Cle
arly
ide
ntif
ied
G-2
6.0
- 7.
0F
I
Fai
rly
iden
tifi
ed
G-3
7.0
- 8.
0A
I
Ave
rage
ide
ntif
ied
G-4
> 8
.0H
I
Har
dly
iden
tifi
edT
able
1:
Det
erm
inat
ion
of v
isua
lizi
ng s
tatu
s am
ong
grad
uall
y de
eper
hot
spot
s w
ith
diff
eren
t co
mbi
nati
ons
of c
olli
mat
ors
and
dept
h in
wat
er fo
r dif
fere
nt v
isua
l win
dow
con
tras
t
World Journal of Nuclear Medicine, Volume 5, Number 2, April 2006
Sabbir Ahmed ASM, Demir M, Demir B, et al.
125

placed at a depth of 1 cm inside water by setting the top plane of the plexiglass plate at the water level (depth of IS (d )=0.5, d =1.5 cm; difference =1.5 - 0.5 = 1.0) (ii) The IS hole
holes (hotspots 1-10) were placed at a depth of 3 cm inside water. To do so, the central plastic tube (hole 0) was raised 2 cm up from the initial position by mounting on other tubes and was set at water level (iii) The central tube was raised 4cm up to set the hotspots at 5cm depth in water and (iv) The central hole was raised 6 cm up to set the holes at 7cm depth in water. To avoid contamination and unnecessary exposure, the personnel working with the phantom used disposable gloves and shield-aprons. Scintillation image acquisitionThe scintillation images were taken placing the phantom under the camera-head. The study was performed by Siemens Orbiter 7500 Digitrac gamma camera that was interfaced with ADAC Pegasys II workstation. Three parallel-hole collimators were used: i) Low energy all purpose (LEAP), ii) Low energy high resolution (LEHR) and iii) Medium energy all purpose (MEAP). The septal length, septal thickness, hole diameter for LEAP were 23.6 mm, 0.20 mm, 1.43 mm; for LEHR 23.6mm, 0.16 mm, 1.11 mm and for MEAP 40.6 mm, 1.14 mm, and 2.94 mm respectively (13). Static images were acquired (1,000,000 counts) with 256x256x16 matrix at a zoom factor of 2. The duration of each study lasted for about 1 hr. from beginning to end. In order to fulfill 1-day lymphoscintigraphy image acquisition protocol, no background activity was mixed with the water in the container. But, to satisfy the 2-day protocol, 370 KBq of Tc-99m was uniformly mixed with the water (amount 5 liter) to simulate background activity. AnalysisThe analysis was done in following steps; Step 1: Images were taken following both 1-day and 2-day protocols with all the point sources (holes 0-10) placed in the phantom and then with all the helical point sources (holes 1-10) except central one (hole no. 0). The former one was performed to satisfy 1-day protocol and the later one to satisfy 2-day protocol (discarding injection site). Counts for each hotspot were calculated individually in both images by drawing identical circular regions of interest (ROIs) (i.e. containing equal number of pixels). The difference in ROI
st ndcounts between 1 and 2 images calculated for individual hotspots were divided by the corresponding pixel-number (i.e. counts/pixel) and hence determining the relative pixel intensity (RPI) for each hotspot. Step 2: Images were taken (both with 1-day & 2-day protocol) by only placing the high activity point source (IS) at the centre and removing all others. Then ten (10) circular ROIs (Radius 5 mm, 10mm, 15 mm… …50 mm) were drawn centreing the central source in such a way that each circle passed through centre of each hotspot (Hole nos. 1-10). Total counts and numbers of pixels were calculated for each circular ROI. The counts and pixel values for each ROI were subtracted from the corresponding values of the
preceding ROI. Counts per pixel were calculated for each doughnut shaped region (Figure 1, 3). Step 3: Point sources were placed only in linear array (lesions A-G) along with central one and image profiles for the linear set of lesions were generated to calculate the corresponding FWHM (full width at half maximum) values for each lesion with different collimators at different visual
0color-contrast windows. Two views (perpendicular and 30 slant with the vertical line) of images (Figure 2) were acquired only with 1-day protocol by placing the top plane of the phantom at water level. The lesions were classified into four groups (G-1, … … G-4) according to the calculated values of FWHM. The lesions with considerable lower FWHM exhibited higher spatial resolution and were detected with higher clarity.Step 4: The image was taken with all the point sources mounted on the linear holes (A, B, … … G). Then point source A was taken off from the hole and the phantom was imaged. Count per pixel was calculated for ROI “A” from the two images (with/without mounting A). RPI (counts/pixel) for lesion-A was calculated from the difference of these two values. In a similar way, RPIs were calculated for other linear holes (B-G). One more image was also taken with the central one. All the images (step 1, 2, 3 and 4) were analyzed by ADAC Pegasys II analytic package program and then numeric values were transferred to MS Office Excel for further calculations. The images obtained in step 1, 2 & 4 were analyzed at a visual color-contrast window of (53, 8191). This window was optimized from the results obtained in step-3.
No significant difference was observed between 1-day and 2-day protocols. Figures 4a-4c show RPI for each hotspot (1, 2…. 10) of the phantom at four conditions (1 cm, 3 cm, 5 cm and 7 cm depth in water) for three collimators. The RPI
rdvalues were almost linear after 3 hotspot (approximately 15 mm from the centre). Further the value was found to be minimum for MEAP (Figure 4c) at all the depths and maximum for LEHR (Figure 4b). The slopes in the curves (Figures 4a-4c) within 1-3 hotspots for both the protocols demonstrate the blurring effect emerged from the centre (injection site) to these nearby points.The average pixel counts for each doughnut-shaped circular ROI at the interval of two consecutive hotspots are shown in figures 5a-5d for three collimators at different depths of water. The +Y error bar shows the 2-day protocol data. All the graphs tend to be linear beyond 12-13 mm distance (cutoff distance) from the centre in both the protocols. The classification of lesions (gradually deeper) according to the calculated FWHM values for two views (perpendicular and 30 slant) with different collimators at different visual color-contrast window are summarized in
Results
Sabbir Ahmed ASM, Demir M, Demir B, et al.
126
World Journal of Nuclear Medicine, Volume 5, Number 2, April 2006
table-1. The FWHM values were observed to be increasing with increasing depth of lesion for all the collimators. Figure 6 shows how the relative pixel intensity (counts/pixel) increases with depth among gradually deeper hotspots. The effect of the high activity simulating injection site (IS) to the nearby lesions are shown with the +Y error bar.
The quality of scintillation images is characterized by a few physical factors that can be measured or calculated for the image or imaging system. Image evaluation depends on relative dose distribution in the organ. On the other hand the predictive accuracy depends on efficiency and performance along with experiences of the related personnel. Image degradation is manifested by a number of factors. The concept of relative pixel intensity only includes the blurring effect emerging from the high activity spot simulating IS to the surrounding region.
-5The background activity (7.4x10 kBq/l) in the 2-day protocol was determined after considering the physical and biologic half-life of Tc-99m. The intention was to find a quantitative measurement of image degradation boosted by the background activity, which arises during the study. With 2-day protocol, the relative intensity was increased by as much as 9-10% (for first 2-3 hotspots nearest to the IS) and 1-2 % in case of distant hotspots as depicted in figures 4a-c & 5a-d.The blurring effect looked more intense among the gradually deeper hotspots than that among in-plane hotspots. In both instances the hot spots (simulating sentinel lymph node) within 4 mm radial distance from the simulated injection site (IS) would most likely remain unresolved on the scintigraphic images. This limitation requires the surgeons to depend mostly on the hand-held gamma probe to detect sentinel lymph nodes during surgery which may be present at a radius of less than 5 mm from the injection site during surgery. According to the camera specification (Siemens Orbiter 7500 Digitrac), septal penetration energy (at 5% level) for LEAP and LEHR is 160 KeV. For MEAP, this energy is 295 KeV (13). The FWHM values (0 cm distance in air) for LEAP, LEHR and MEAP are 4.9 mm, 5.1 mm and 6.0 mm respectively. These values are 7.9 mm, 9.3 mm and 12.3 mm at 10 cm distance in air (13). In the present study, 140 KeV Tc-99m was used and it is obvious that penetrating components for LEAP & LEHR were much higher than that for MEAP and would produces more blurring surrounding the injection site. This blurring affects the image quality
considerably while working with very low activities (e.g. 37 KBq in lymphoscintigraphy). At the same time it may be noted that background activity produces some signal noises that would largely affect the detection of very small focal hot spots. As the range of lymph node depth is considered to be
Discussion
≅
Sabbir Ahmed ASM, Demir M, Demir B, et al.
World Journal of Nuclear Medicine, Volume 5, Number 2, April 2006
generally between 1.0 and 7.5 cm inside human body (8), this study was designed using water as scattering medium placing phantom at depths; 1 cm, 3 cm, 5 cm and 7 cm. The calculated FWHM values were found slightly higher than those of the camera specification (measured in air) due to different attenuation and scattering coefficients of water and air. It is evident from the results that detection of tiny spots largely depends on the visual color- contrast window of the monitor. A monitor that is not properly calibrated and profiled will misrepresent images it displays. As the monitor is the primary assessment tool in review and editing of digital images, its color accuracy is crucial. The phantom described in this study is very suitable for monitor- calibration and fixing the color-contrast prior to lymphoscintigraphy.
Choice of appropriate collimator still remains one of the most important factors in lymphoscintigraphy for the detection of sentinel lymph node. This choice is relative and depends on the objective and purpose of the study. We have observed in the present study that the injection site produces minimum blurring effect on the surrounding when a MEAP collimator was used, as compared to LEAP or LEHR collimators. It is also possible to detect small hotspot with h igher v isual color-contras t window dur ing lymphoscintigraphy using a MEAP collimator.
This work was supported by the Research fund of the University of Istanbul. Project Number: 1682/15082001
1. Mortin DL, Chan AD. The concept of sentinel node localization: How it started? Semin Nucl Med 2000; 30(1): 4-10.
2. Aiazraki NP, Styblo T, Grant SF, Cohen C, Larsen T, Aarsvold JN. Sentinel node staging of early breast cancer using lymphoscintigraphy and the intraoperative gamma-detecting probe. Semin Nucl Med 2000; 30(1): 56-64.
3. Glass EC, Essener RE, Giuliano AE. Sentinel node localization in breast cancer. Semin Nucl Med 1999; 29(1): 57-68.
4. Berman CG, Choi J, Hersh MR, Clark RA. Melanoma lymphoscintigraphy and lymphatic mapping. Semin Nucl Med. 2000; 30(1): 49-55.
5. Henkin RE, Boles MA, Dillehay GL, Halama GL, Zimmer M, eds. Nuclear medicine Year Book. St Louis, Mosby, 1996; pp 96-221
6. McMaster KM, Tuttle TM, Carlson DJ, et al. Sentinel lymph node biopsy for breast cancer: a suitable
Conclusion
Acknowledgements
References
127

World Journal of Nuclear Medicine, Volume 5, Number 2, April 2006
alternative to routine axillary dissection in multi-institutional practice when optimal technique is used. J Clin Oncol 2000; 18:2560-2566.
7. Ret tenbacher L, Kol ler J , Kassmann H, Holzmannhofer J, Rettenbacher T, Galvan G. Reproducibility of lymphoscintigraphy in cutenous melanoma: Can we accurately detect the sentinel lymph node by expanding the tracer injection distance from the tumor site? J Nucl Med 2001; 42(3): 424-431.
8. Yip TC, Ege GN. Determination of depth distribution of internal mammary lymph nodes on lateral lymphoscintigraphy. Clin Radiol 1985; 36(2): 149-52.
9. Cox CE, Pendas S, Cox JM, et al. Guidelines for sentinel node biopsy and lymphatic mapping of patents with breast cancer. Annals Surgery 1998; 227(5): 645-55.
10. Sorenson JA and Phelps ME. Physics in Nuclear Medicine. 2nd edn. Florida: Grune & Stratton, Inc; 1987: 408-420.
11. Mariani D, Moresco L, Viale G, et al. Radioguided sentinel lymph node biopsy in breast cancer surgery. J Nucl Med. 2001; 42: 1198-1215.
12. Koizumi M, Nomura E, Yamada Y, et al. Sentinel node detection using Tc-99m rhenium sulphide colloid in breast cancer patients: evaluation of 1 day and 2 day protocols, and a dose-finding study. Nucl Med Commun. 2003; 24, 663-670.
13. SRP Orbiter CCI & SPECT / SPECT. Collimator catalog no. A 91001-M2360-G003-01, Siemens Medical Systems, Inc, Illinois, PA 06014.
128
Sabbir Ahmed ASM, Demir M, Demir B, et al.