A Quality Driven Approach to Managing Collection and Analysis
10
A Quality Driven Approach to Managing Collection and Analysis Claude Turmelle 1 , Serge Godbout 1 , Keven Bosa 1 , Fraser Mills 1 1 Statistics Canada, 100 Tunney’s Pasture Driveway, Ottawa, ON, Canada, K1A 0T6 Abstract Statistics Canada is undergoing a redesign of its business surveys. One key component of the new framework is the active collection and analysis management methodology. Using historical and partially collected data, key estimates and quality indicators are produced while collection is still underway. These quality indicators are then compared to previously set quality targets to determine if more effort is required or if active collection can be terminated. If collection needs to continue, item scores are calculated in order to gauge a unit’s impact on the quality indicator of each key estimate. These scores are then aggregated within each unit, to create a global unit score. Based on these, decisions regarding follow up activities are made. This talk will describe the quality driven active collection and analysis management methodology. Some preliminary empirical results and potential savings in the new Canadian Integrated Business Statistics Program will also be discussed. Key Words: Business Surveys, Adaptive Design, Quality Indicators, Selective Editing 1 Introduction 1.1 Context In 2009, Statistics Canada launched the Corporate Business Architecture (CBA) review initiative. Growing financial pressures led to this process to review Statistics Canada’s business model and survey infrastructure. The CBA main objectives were to achieve further efficiencies, enhance quality and improve responsiveness in the delivery of its statistical programs. As described in [6], [9], [11] and [12], the new Integrated Business Statistics Program (IBSP) was developed to help Statistics Canada achieve the above mentioned CBA objectives for business surveys. The IBSP defines a new survey model and infrastructure that over one hundred business surveys will be using by 2017. One of the main goals of the IBSP is to achieve greater efficiency in processing its survey data, while producing estimates of similar, if not better, quality. To do this, a new adaptive design has been developed to manage data collection activities as well as data analysis (see [6], [7] and [9]). The Rolling Estimates (RE) model is a processing strategy that combines active collection management, editing, imputation, estimation and analysis. It allows estimates and quality indicators to be produced periodically as soon as an acceptable amount of survey and administrative data are available. Collection and data analysis efforts can then be actively managed by monitoring the progression of these quality indicators and through
-
Upload
khangminh22 -
Category
Documents
-
view
2 -
download
0
Transcript of A Quality Driven Approach to Managing Collection and Analysis

A Quality Driven Approach to Managing
Collection and Analysis
Claude Turmelle
1, Serge Godbout
1, Keven Bosa
1,
Fraser Mills
1
1 Statistics Canada, 100 Tunney’s Pasture Driveway, Ottawa, ON, Canada, K1A 0T6
Abstract
Statistics Canada is undergoing a redesign of its business surveys. One key component of
the new framework is the active collection and analysis management methodology. Using
historical and partially collected data, key estimates and quality indicators are produced
while collection is still underway. These quality indicators are then compared to previously
set quality targets to determine if more effort is required or if active collection can be
terminated. If collection needs to continue, item scores are calculated in order to gauge a
unit’s impact on the quality indicator of each key estimate. These scores are then
aggregated within each unit, to create a global unit score. Based on these, decisions
regarding follow up activities are made.
This talk will describe the quality driven active collection and analysis management
methodology. Some preliminary empirical results and potential savings in the new
Canadian Integrated Business Statistics Program will also be discussed.
Key Words: Business Surveys, Adaptive Design, Quality Indicators, Selective Editing
1 Introduction
1.1 Context
In 2009, Statistics Canada launched the Corporate Business Architecture (CBA) review
initiative. Growing financial pressures led to this process to review Statistics Canada’s
business model and survey infrastructure. The CBA main objectives were to achieve further
efficiencies, enhance quality and improve responsiveness in the delivery of its statistical
programs. As described in [6], [9], [11] and [12], the new Integrated Business Statistics
Program (IBSP) was developed to help Statistics Canada achieve the above mentioned CBA
objectives for business surveys. The IBSP defines a new survey model and infrastructure that
over one hundred business surveys will be using by 2017.
One of the main goals of the IBSP is to achieve greater efficiency in processing its survey
data, while producing estimates of similar, if not better, quality. To do this, a new adaptive
design has been developed to manage data collection activities as well as data analysis (see
[6], [7] and [9]). The Rolling Estimates (RE) model is a processing strategy that combines
active collection management, editing, imputation, estimation and analysis. It allows
estimates and quality indicators to be produced periodically as soon as an acceptable amount
of survey and administrative data are available. Collection and data analysis efforts can then
be actively managed by monitoring the progression of these quality indicators and through

unit prioritization. Data analysis can start sooner, thus increasing the timeliness of annual
estimates and the prioritization of units contributes to reducing the amount of resources
dedicated to manual editing.
The original description of the RE model was given in [7]. A more detailed description of the
methodology surrounding the process was presented in [9] and [12]. This paper heavily
borrows from [9], but also seeks to provide some of the latest updates on the methodology
and implementation.
1.2 The IBSP Survey Processing Model
In the IBSP, an optimal use of the resources available will be reached by limiting manual
interventions to the more influential units. To achieve this, the estimates and their quality
must be taken into account during collection and processing rather than only near the end. To
do this, the IBSP will implement an iterative approach (Figure 1) called the Rolling Estimates
(RE) model. In this model, once enough data from administrative sources and collection have
been received, a series of automated processes will be run, right through to producing
estimates and their quality indicators. The current plan is to produce these “rolling estimates”
at least once a month during a 4 to 5 month period.
The RE will produce key estimates and related quality indicators. Using these results,
decisions will be made whether to stop active collection or not. When the quality indicators
have reached pre-specified targets for a given geography-industry domain, active collection
can stop in that domain and resources can be redirected towards other domains, as required.
Figure 1: Rolling Estimates Model
The RE will also produce measure of impact scores, for each unit, at each iteration. Active
collection will be based on lists of non-responding units or units that failed collection edits,
prioritized by their unit scores. Active analysis (also called Selective Editing) will mainly
focus on respondents significantly influencing key estimates and their quality or non-
respondents that are not eligible for collection follow-up (e.g. hard refusals).

2 Sampling and Estimation Methodology
We are interested in measuring a set of parameters vd vdkk U
Y y
, for the combinations of
variables of interest vy ( 1,...,v V ) and domains of interest d ( 1,...,d D ), for a population
U of size N.
As described in [11] and [12], a sample s of size n is drawn using a 2-phase design with
stratified Bernoulli sampling at both phases. Unit or item non-response will be handled by
imputation, defining the non-overlapping subset, vr vms s s , as the set of k units having
respectively reported( )R
vk vky y and imputed ( )I
vky values for the variable of interest vy . The set
of respondents is identified as vrs , and non-respondents, vms .
The estimator for the totals ( )ˆ IMP
vdY under imputation is given by:
( ) ( ) ( ) ( ) ( )
( ) *
ˆvr vm
IMP E R E I
vd k vdk k vdkk s k s
E
k vdkk s
Y w y w y
w y
. (1)
The estimation weight ( ) 1E
k k ksw g is the inverse of the sampling probability k resulting
from the 2-phase design calibrated to known totals. See [10] for more on calibration.
3 Active Management Framework
Some of the collection and analysis activities (referred to as treatments), like fax or email
follow-ups, have a relatively low unit cost while other have significant marginal costs, such as
telephone follow-up for non-response or failed-edit (see [5]), and manual editing. For
simplicity, they are all grouped here into one single treatment T.
3.1 Key Estimates, Importance Factors and Quality Targets
The active management parameterization is done through the setting of 3 basic concepts: the
list of key estimates, their importance factors and their quality targets. An estimate is
identified from 3 attributes: a statistical measure (e.g. total, mean, ratio, etc.), a variable (or
many for multivariate statistical measures like ratios) and a domain. In the first years of IBSP,
key estimates will consist of totals only.
All key estimates are assigned an importance factor vd , used to weigh their relative
importance in the active management system, and a quality target vdQT to determine when the
quality of an estimate is deemed sufficient for its use. The derivation of vd and vdQT is
discussed in section 5.
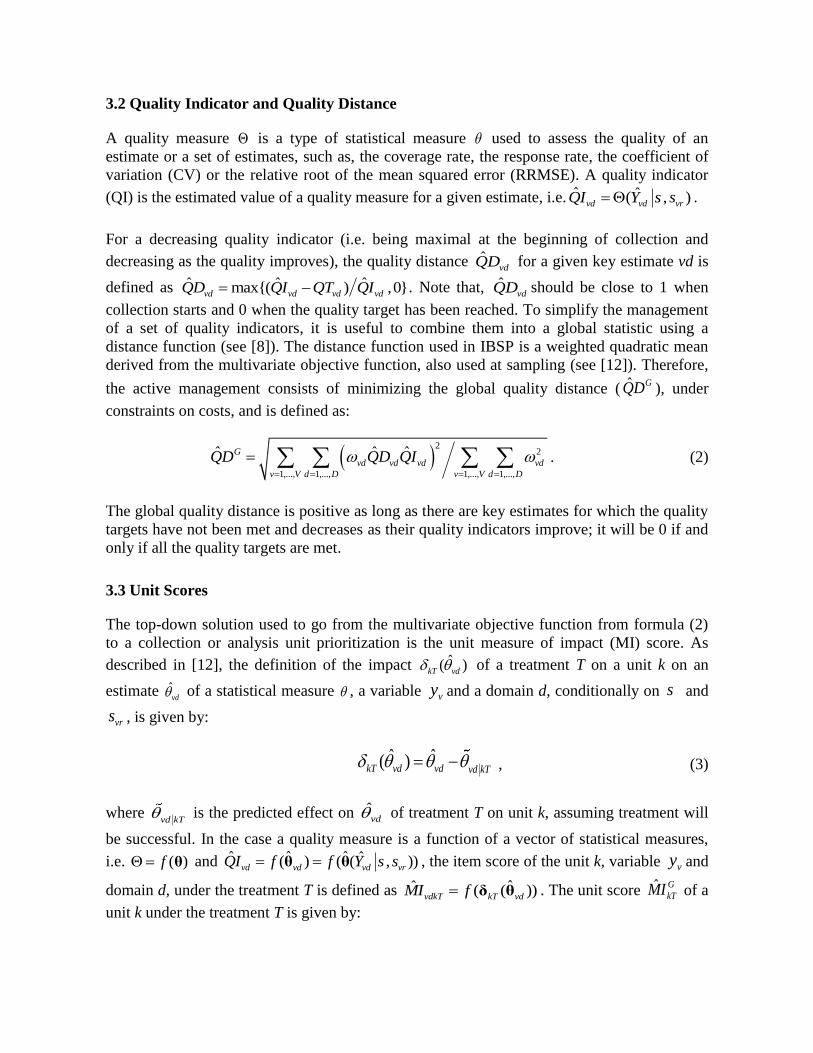
3.2 Quality Indicator and Quality Distance
A quality measure is a type of statistical measure used to assess the quality of an
estimate or a set of estimates, such as, the coverage rate, the response rate, the coefficient of
variation (CV) or the relative root of the mean squared error (RRMSE). A quality indicator
(QI) is the estimated value of a quality measure for a given estimate, i.e. ˆ ˆ( , )vd vd vrQI Y s s .
For a decreasing quality indicator (i.e. being maximal at the beginning of collection and
decreasing as the quality improves), the quality distance ˆvdQD for a given key estimate vd is
defined as ˆ ˆ ˆmax{( ) ,0}vd vd vd vdQD QI QT QI . Note that, ˆvdQD should be close to 1 when
collection starts and 0 when the quality target has been reached. To simplify the management
of a set of quality indicators, it is useful to combine them into a global statistic using a
distance function (see [8]). The distance function used in IBSP is a weighted quadratic mean
derived from the multivariate objective function, also used at sampling (see [12]). Therefore,
the active management consists of minimizing the global quality distance ( ˆ GQD ), under
constraints on costs, and is defined as:
2
2
1,..., 1,..., 1,..., 1,...,
ˆ ˆ ˆG
vd vd vd vd
v V d D v V d D
QD QD QI
. (2)
The global quality distance is positive as long as there are key estimates for which the quality
targets have not been met and decreases as their quality indicators improve; it will be 0 if and
only if all the quality targets are met.
3.3 Unit Scores
The top-down solution used to go from the multivariate objective function from formula (2)
to a collection or analysis unit prioritization is the unit measure of impact (MI) score. As
described in [12], the definition of the impact ˆ( )kT vd of a treatment T on a unit k on an
estimate ˆvd of a statistical measure , a variable vy and a domain d, conditionally on s and
vrs , is given by:
ˆ ˆ( )kT vd vd vd kT
, (3)
where vd kT
is the predicted effect on ˆvd of treatment T on unit k, assuming treatment will
be successful. In the case a quality measure is a function of a vector of statistical measures,
i.e. ( )θf and ˆ ˆ ˆ ˆ( ) ( ( , ))vd vd vd vrQI f f Y s s θ θ , the item score of the unit k, variable vy and
domain d, under the treatment T is defined as ˆˆ ( ( ))vdkT kT vdMI f δ θ . The unit score ˆ G
kTMI of a
unit k under the treatment T is given by:

2 2
1,..., 1,..., 1,..., 1,...,
ˆˆ ˆ( )G
kT vd vd vdkT vd
v V d D v V d D
MI QD MI
. (4)
This unit score measures the impact a unit has on the global distance between the quality
indicators and their targets. The score of a unit will be:
Positive if it has a positive MI score for at least one key estimate for which the quality
target has not been met yet;
Zero if all its MI scores are zero or all its positive MI scores correspond to key
estimates which have met their target.
4 Quality Measures
In IBSP, in order to actively manage collection follow up efforts as well as analysis in an
integrated way, two quality measures are defined and then combined into one.
4.1 Total Variance
First, as described in [9], in the IBSP the total variance is used to measure the variability of
the key estimates, and measure the impact of nonresponse and imputation. The estimate of the
total variance can be decomposed into the naïve sampling variance, ˆOrdV , for which we
consider the imputed values as reported, the correction term, ˆDifV , proposed in [10] and
simplified by [4], to compensate for the effect of the imputation, the non-response variance
term, ˆNRV , and the covariance term, ˆ
MixV . The estimation of the total variance ˆTotV is the sum
of these four components:
( ) ( ) ( ) ( ) ( )ˆ ˆ ˆ ˆ ˆ ˆ ˆ ˆ ˆ ˆ( ) ( ) ( ) ( ) ( )IMP IMP IMP IMP IMP
Tot vd Ord vd Dif vd NR vd Mix vdV Y V Y V Y V Y V Y . (5)
More information about how those components of variance are derived can be found in [2]
and [3]. The resulting unit total impact, obtained by changing the status of the unit from non-
respondent to respondent and by considering its imputed values as reported, is therefore given
by:
( ) ( ) ( ) ( )ˆ ˆ ˆ ˆ ˆ ˆ ˆ ˆ( ( )) ( ( )) ( ( )) ( ( ))IMP IMP IMP IMP
kT tot vd kT Dif vd kT NR vd kT Mix vdV Y V Y V Y V Y . (6)
A detailed definition of each component can be found in [9].
4.2 Relative Deviation from Predicted Values
In order to identify potential problems with reported data and measure the potential impact on
the estimates, another quality measure is defined, called here the Relative Deviation from
Predicted Values (RDPV). Prior to the beginning of collection, predicted values ( )P
vdky are

generated from tax data and historical data, for each unit k in the sample and for each key
estimate vd. Using these predicted values, predicted key estimates can be computed and
compared to the current estimates produced using the collected and imputed data. The
resulting quality indicator can be formulated as:
2 2
( ) * ( ) ( ) * ( )
, ,
( )
( ) * ( )
( ) ( )
ˆ( )ˆ
E P E P
k edit k vdk vdk k edit k vdk vdk
k s k sIMP
vd E IMPk vdk vd
k s
w i y y w i y y
RDPV Yw y Y
, (7)
where kediti , is a manual editing status indicator and is set to 1 when unit k has not been
reviewed yet and is set to 0 when the value *
vdky has been confirmed or manually edited. It
therefore follows that the unit impact score is defined as:
2( ) * ( ) ( ) * ( )
, ,( )
( ) ( )
( ) ( )ˆ( )
ˆ ˆ
E P E Pk edit k vdk vdk k edit k vdk vdkIMP
kT vd IMP IMP
vd vd
w i y y w i y yRDPV Y
Y Y
. (8)
kT will be equal to 0 if unit k has been manually edited or if * ( )P
vdk vdky y , otherwise it will be
greater than 0.
4.3 Pseudo Relative Root of the Mean Squared Error (PRRMSE)
Finally, the Total Variance and the Relative Deviation from Predicted Values are combined to
form the main IBSP quality indicator, called here the Pseudo RRMSE, and is formulated as:
1/2
21 2( ) ( ) ( ) ( ) ( )ˆ ˆ ˆ ˆ ˆ ˆ( ) ( ) ( )IMP IMP IMP IMP IMP
vd vd tot vd vd vdPRRMSE Y Y V Y Y RDPV Y
, (9)
where is a constant between 0 and 1 (currently set at 0.1 in IBSP) used to control the
impact of the RDPV on the combined quality indicator. Clearly, with the addition of the ,
plus the fact that the RDPV is not estimating the real bias of ( )ˆ IMP
vdY , the Pseudo RRMSE
defined here is not a good estimator of the real RRMSE of ( )ˆ IMP
vdY . This is not a problem
though since the goal of this quality indicator is not to estimate the RRMSE but rather to help
identify units with the most impact on data quality. The resulting item score of unit k under
treatment T based on the Pseudo RRMSE is given by:
1/2
21 2( ) ( ) ( ) ( ) ( )ˆ ˆ ˆ ˆ ˆ ˆ ˆ( ) ( ( )) ( )IMP IMP IMP IMP IMP
vdkT vd vd kT tot vd vd kT vdMI Y Y V Y Y RDPV Y
. (10)
5 Implementation
For the last year or so, the IBSP team has been working on implementing the above
framework. As mentioned before, the active management strategy is based on three
components: the key estimates, their importance factors and their quality targets. Therefore,

for each IBSP survey, key variables and key domains were identified and combined to create
the list of key estimates. Then, importance factors were generated and quality targets were set.
The strategy used to derive the importance factors and quality targets is discussed in the
following sections.
5.1 Importance Factors
For each survey, a list of key variables vy ( 1,...,v V with 4 5V or ) and domains of
interest d ( 1,...,d D ) were identified. In general, the domains of interest d were defined
through geography and industry classifications. Let 1d (1 11,...,d D ) and 2d (
2 21,...,d D )
represent the geography and industry domains respectively, with 1 2d d d ( 1,...,d D with
1 2D D D ). Using historical values, estimates of domain totals 1 2 1 2
ˆ hist
vd d vd d kkY y were
computed for 1,...,v V , 1 11,...,d D and
2 21,...,d D . Using this, the importance factors
vd were defined as:
1 20
1 1 2
1 2
1
ˆ ˆˆ
ˆ ˆ ˆ
p pp
vd vd dvvd vd d
T v vd
Y YY
Y Y Y
, (11)
where 1 1 22
ˆ ˆvd vd dd
Y Y , 11
ˆ ˆv vdd
Y Y and ˆ ˆT vv
Y Y . The constants 0 1 2, andp p p are
between 0 and 1 and are used to control the distribution of the importance factors vd . Values
of 0 1 2, and/orp p p close to 0 will result in similar importance put on the different variables
and/or domains of interest. Values close to 1 will result in importance factors that are more
variable and proportional to the different ratios in formula (11). The concept is the same as
the well known power-allocation found in [1].
The importance of the different variables vy is determined first. Since key variables were
deemed of similar importance, 0p was set at 0.1. Then, for each variable vy , the importance of
each domain is derived. In the IBSP, 1d represents the provincial dimension, the most
important dimension. Since it’s very important for the IBSP to produce provincial estimates
of similar quality, the provincial importance are determined first (i.e., 1d appears before 2d in
the hierarchical structure used above) and 1p was set at 0.1. The industrial dimension is
represented by 2d and since the requirement was that their importance be a bit more
proportional to their provincial economic contribution, 2p was set at 0.5. Note that this
methodology could easily be generalised to more than 2 dimensions.
5.2 Quality Targets
Next, quality targets vdQT were required for all key estimates. Starting from the second year of
the IBSP, historical estimates and quality indicators for all key estimates will be available and

usable as a starting point to set up the quality targets for the next cycle. On the other hand, for
the first year, since these historical quality targets were not available, expected sampling
variances from the sampling stage were used as a starting point to determine an initial set of
reasonable and conservative quality targets.
5.3 Collection operations
The unit scores ˆ G
kTMI will be used to create priority groups for collection and analysis
operations. For example, units in the top 5% will be put in priority group 1. The following
10% will be put in priority group 2, and so on. Collection efforts will be managed based on
those priorities.
Not all units are eligible for collection follow-up. Sometimes appointments have been set up,
or units have been identified as hard refusals. The priority units that are eligible for collection
will be assigned to collection follow-up and the ineligible ones will be handled by analysts.
Up until now, weighted response rates were used as targets to decide when active collection
could be stopped for a specific survey. In the IBSP, the collection operations will be centered
on the active management methodology described above. On the other hand, for the first year,
since our understanding of how the quality indicators will evolve throughout collection and
since our quality targets are not based on historical knowledge, response rates will be used to
complement the methodology presented here. To be more specific, the collection activities
will stop for a specific survey if both its global quality distance ˆ GQD and its weighted
response rate have reached pre-specified targets.
6 2012 Empirical Study
In order to evaluate the potential gains on quality and cost that could be achieved through the
Rolling Estimates, an empirical study was performed in 2012 using the data from 46 different
annual business surveys (40 using paper questionnaires and 6 using electronic
questionnaires). Four iterations of Rolling Estimates were run (July, August, September, and
October) using the methodology described above, and the results were compared to the ones
obtained in production. The study mainly focused on nonresponse follow up activities. A
detailed description of this study can be found in [9]. Only a summary of the results will be
presented here.
6.1 Summary of results
From Table 1 below, we can observe that at the first iteration in July, with only 47% of the
collection units being followed up for non response, 76% of the quality targets were already
reached. Between July and October production, which flagged 53% of the collection units for
non-response follow-up, only an additional 9% of key estimates reached their targets.
The Rolling Estimates study created four successive prioritization lists, one per iteration,
containing the collection units having the largest impact on the global quality distance. The
units on the list were assumed resolved by the next iteration. The combination of the
prioritized collection units from these four iterations and the collection units followed up
before the first iteration contains 34% fewer units than the set of all collection units followed
up in production. The results are even stronger for the 6 surveys using electronic
questionnaires, with a reduction of 49% of the number of collection units prioritized for non-
response follow-up. This can be explained by the new follow-up procedures implemented for
the surveys using electronic questionnaires: the early telephone follow-up activities are
replaced by email reminders, without significant impact on the response progress (see [5]).
Because there was a lower proportion of telephone follow-ups done before the first Rolling
Estimates iteration, the potential for relative savings is larger.
Table 1: Results by Survey Group
Survey
Groups
Number
of Key
Estimates
Percentage of
quality targets met
Percentage of collection units
followed up for non-response
Regular
production
RE Empirical
Study
Regular
production
RE Empirical
Study
July October October Before
July
July-
October Overall reduction
TOTAL
(46 surveys) 8,600 76% 85% 98% 47% 53% 34%
Non-EQ*
(40 surveys) 7,600 76% 85% 98% 51% 49% 31%
EQ*
(6 surveys) 1,000 71% 82% 99% 22% 78% 49%
7 Conclusions
The key features of this innovative active management strategy are the dynamic Rolling
Estimates model driven by improved quality indicators.
The quality indicators, combining sampling and imputation variances, plus a measure of
deviation to flag potential problematic errors in the data, give an accurate picture of the
current quality of all the key estimates. With the importance factors and the quality targets,
the framework converts the multivariate objective into a univariate problem, allowing the
IBSP to more easily, and efficiently, manage collection and analysis activities. The Rolling
Estimates model provides regular, relevant and output-oriented pictures of the quality
progress and, in a timely fashion, identifies the estimates that meet the targeted quality so the
resources are dynamically redirected to focus on the remaining estimates.
The empirical study has shown that, at a given collection follow-up capacity, the Rolling
Estimates model with a unit prioritization based on quality indicators and unit scores can
improve the quality of the data while also reducing significantly the number of follow-ups
required to meet quality targets. However, due to the limitations of the study, the achieved,
theoretical reductions compared with the current survey production cannot be blindly
transposed to IBSP. The level of savings that can be expected depends on the collection
strategy, the desired level of quality, and the choice of key estimates and their relative
importance.
The empirical study demonstrated the feasibility and the power of the model, but also
highlighted major requirements on the collection, analysis, processing, and methodology
services and on their interactions. The strategy, parameterized through key estimates,
importance factors and quality targets, has to be carefully set up. Collection progress needs to
be closely monitored so that the joint efforts between collection staff and analysts may
maximize non-response and edit resolutions.
The first cycle of the IBSP will go into production in the summer of 2014. The plan is to start
with reasonable expectations in terms of data quality and savings, and then use the experience
from the first few years to assess the efficiency of the framework under the IBSP model.
References [1] Bankier, M. (1988). Power allocations: Determining sample Sizes for subnational areas. The
American Statistician, Vol. 42, 174-177
[2] Beaumont, J-F. and Bissonnette, J. (2011). Variance estimation under composite imputation:
The methodology behind SEVANI. Survey Methodology, Vol. 37, 171-180.
[3] Beaumont, J-F., Bissonnette, J. and Bocci, C.(2010). SEVANI, version 2.3, Methodology
Guide. Internal report, Methodology Branch, Statistics Canada.
[4] Beaumont, J.-F., and Bocci, C. (2009). Variance Estimation when Donor Imputation is Used
to Fill in Missing Values. Canadian Journal of Statistics, 37, 400-416.
[5] Claveau, J., Leung, J. and Turmelle, C. (2012). Embedded Experiment for Non-Response
Follow-Up Methods of Electronic Questionnaire Collection. Proceedings of the ICES IV
Conference.
[6] Godbout, S., (2011). Normalisation du traitement des données après la collecte dans les
enquêtes-entreprises à Statistique Canada. Symposium international de 2011 sur la
méthodologie.
[7] Godbout, S., Beaucage, Y. and Turmelle, C. (2011). Quality and Efficiency using a Top-
Down Approach in the Canadian’s Integrated Business Statistics Program. Conference of
European Statisticians, Work Session on Statistical Data Editing. Ljubljana, Slovenia (9-
11 May 2011).
[8] Hedlin, D. (2008). Local and Global Score Functions in Selective Editing. United Nations
Statistical Commission and Economic Commission for Europe, Conference of European
Statisticians, Work Session on Statistical Data Editing, Vienna, Austria 2008.
[9] Mills, F., Godbout, S., Bosa, K. and Turmelle, C. (2013), Multivariate Selective Editing in
the Integrated Business Statistics Program, Proceedings of the Joint Statistical Meeting
2013, American Statistical Association.
[10] Särndal, C.E., Swensson, B. and Wretman, J. (1992). Model Assisted Survey Sampling.
New York, Springer-Verlag, 694 p.
[11] Turmelle, C. and Beaucage, Y. (2013), The Integrated Business Statistics Program -
Using a Two-Phase Design to Produce Reliable Estimates, Proceedings of the 2013
Statistics Canada International Symposium.
[12] Turmelle, C., Godbout, S. and Bosa, K. (2012). Methodological Challenges in the
Development of Statistics Canada’s New Integrated Business Statistics Program.
Proceedings of the ICES IV Conference.