
A Qualitative and Localized Evaluation for 3D Indoor Scene ...
54
A Qualitative and Localized Evaluation for 3D Indoor Scene Synthesis by Hsin Liu M.Sc., National Tsing Hua University, Taiwan, 1994 B.Sc., Chung Yuan Christian University, Taiwan, 1992 Thesis Submitted in Partial Fulfillment of the Requirements for the Degree of Master of Science in the School of Computing Science Faculty of Applied Sciences c Hsin Liu 2019 SIMON FRASER UNIVERSITY Spring 2019 Copyright in this work rests with the author. Please ensure that any reproduction or re-use is done in accordance with the relevant national copyright legislation.
-
Upload
khangminh22 -
Category
Documents
-
view
1 -
download
0
Transcript of A Qualitative and Localized Evaluation for 3D Indoor Scene ...
A Qualitative and Localized Evaluationfor 3D Indoor Scene Synthesis
by
Hsin Liu
M.Sc., National Tsing Hua University, Taiwan, 1994B.Sc., Chung Yuan Christian University, Taiwan, 1992
Thesis Submitted in Partial Fulfillment of theRequirements for the Degree of
Master of Science
in theSchool of Computing ScienceFaculty of Applied Sciences
c© Hsin Liu 2019SIMON FRASER UNIVERSITY
Spring 2019
Copyright in this work rests with the author. Please ensure that any reproductionor re-use is done in accordance with the relevant national copyright legislation.

Approval
Name: Hsin Liu
Degree: Master of Science
Title: A Qualitative and Localized Evaluation for 3DIndoor Scene Synthesis
Examining Committee: Chair: KangKang YinAssociate Professor
Hao ZhangSenior SupervisorProfessor
Parmit ChilanaSupervisorAssistant Professor
Manolis SavvaExaminerAssistant Professor
Date Defended: April 29, 2019
ii

Ethics Statement
iii
Abstract
We presented a novel evaluation method for assessing synthesized 3D indoor scenes. Byexploiting the concept of local flaw identification in a navigable 3D viewer, this work wasable to address the subjectivity, ambiguity, and low fidelity issues existing in conventionalexperiments. As a result, our method managed to produce a more consistent and reliableassessment outcome for a synthetic scene and to disclose meaningful information that willhelp scholars to investigate their research further. Two user studies were carried out todemonstrate and validate the effectiveness of our method.
Keywords: 3D Indoor Scene Synthesis; Human Computer Interaction; Virtual Reality
iv

Dedication
This thesis is dedicated to my beloved late father, for I never stop missing him. May hissoul be with God eternally.
v

Acknowledgements
First and foremost, I would like to sincerely thank my senior supervisor, Dr. Richard Zhang,for his wise guidance and continuous help throughout my study. I would also like to thank Dr.Parmit Chilana for being my supervisor and supporting my research, Dr. Manolis Savva forbeing my examiner, and Dr. KangKang Yin for being the chair of my examining committee.Furthermore, I am grateful to Dr. Binay Bhattacharya who granted my admission to SFUin the first place and made happen my dream of youth and my middle age adventure.
I want to thank all my friends in Taiwan and Canada for helping me complete the userstudy. I also wish to give special thanks to Fiber for organizing it in Taiwan for me, andAkshay and Manyi for providing their data and suggestions from their research. Also thanksto Dr. Jerry Clarkson for proofreading my thesis.
Lastly and most importantly, I want to thank my wife and my two daughters for theirendless love and unconditional support throughout my life. Above all, my mother deservesmy wholehearted appreciation for I know she is always proud of me.
Thank God almighty for everything.
vi
Table of Contents
Approval ii
Ethics Statement iii
Abstract iv
Dedication v
Acknowledgements vi
Table of Contents vii
List of Tables ix
List of Figures x
1 Introduction 11.1 Motivation . . . . . . . . . . . . . . . . . . . . . . . . . . . . . . . . . . . . 21.2 Overview . . . . . . . . . . . . . . . . . . . . . . . . . . . . . . . . . . . . . 31.3 Contribution . . . . . . . . . . . . . . . . . . . . . . . . . . . . . . . . . . . 31.4 Thesis organization . . . . . . . . . . . . . . . . . . . . . . . . . . . . . . . . 3
2 Related Work 52.1 Virtual Reality . . . . . . . . . . . . . . . . . . . . . . . . . . . . . . . . . . 52.2 Scene synthesis . . . . . . . . . . . . . . . . . . . . . . . . . . . . . . . . . . 62.3 Evaluation and user studies . . . . . . . . . . . . . . . . . . . . . . . . . . . 8
3 Discussion and Approach 93.1 Low Fidelity . . . . . . . . . . . . . . . . . . . . . . . . . . . . . . . . . . . . 103.2 Ambiguity . . . . . . . . . . . . . . . . . . . . . . . . . . . . . . . . . . . . . 11
3.2.1 Visual ambiguity . . . . . . . . . . . . . . . . . . . . . . . . . . . . . 113.2.2 Verbal ambiguity . . . . . . . . . . . . . . . . . . . . . . . . . . . . . 12
3.3 Subjectivity . . . . . . . . . . . . . . . . . . . . . . . . . . . . . . . . . . . . 133.4 Our approach . . . . . . . . . . . . . . . . . . . . . . . . . . . . . . . . . . . 13
vii
4 Evaluation 194.1 Research questions . . . . . . . . . . . . . . . . . . . . . . . . . . . . . . . . 194.2 Methodology . . . . . . . . . . . . . . . . . . . . . . . . . . . . . . . . . . . 20
4.2.1 User Study 1 . . . . . . . . . . . . . . . . . . . . . . . . . . . . . . . 204.2.2 User study 2 . . . . . . . . . . . . . . . . . . . . . . . . . . . . . . . 22
4.3 Summary of findings . . . . . . . . . . . . . . . . . . . . . . . . . . . . . . . 234.3.1 Improvement of Consistency . . . . . . . . . . . . . . . . . . . . . . . 234.3.2 Enhancement of Reliability . . . . . . . . . . . . . . . . . . . . . . . 254.3.3 Discussion . . . . . . . . . . . . . . . . . . . . . . . . . . . . . . . . . 27
5 Conclusion and Future Work 305.1 Limitation . . . . . . . . . . . . . . . . . . . . . . . . . . . . . . . . . . . . . 305.2 Future work . . . . . . . . . . . . . . . . . . . . . . . . . . . . . . . . . . . . 31
5.2.1 Best view . . . . . . . . . . . . . . . . . . . . . . . . . . . . . . . . . 315.2.2 Extension to more applications . . . . . . . . . . . . . . . . . . . . . 315.2.3 Smart flaw indication . . . . . . . . . . . . . . . . . . . . . . . . . . 315.2.4 Unwanted factors handling . . . . . . . . . . . . . . . . . . . . . . . 31
Bibliography 32
Appendix A The User Interface 37A.1 2D Score . . . . . . . . . . . . . . . . . . . . . . . . . . . . . . . . . . . . . . 37A.2 3D Score . . . . . . . . . . . . . . . . . . . . . . . . . . . . . . . . . . . . . . 38A.3 Training Section . . . . . . . . . . . . . . . . . . . . . . . . . . . . . . . . . 38A.4 3D Local . . . . . . . . . . . . . . . . . . . . . . . . . . . . . . . . . . . . . . 39
Appendix B Statistic Result 40B.1 Average scores . . . . . . . . . . . . . . . . . . . . . . . . . . . . . . . . . . . 40B.2 Standard deviation . . . . . . . . . . . . . . . . . . . . . . . . . . . . . . . . 42B.3 Number of flawed objects identified . . . . . . . . . . . . . . . . . . . . . . . 44
viii

List of Tables
Table 3.1 A template for the causes of flaws, with explanations and examples. . 15
Table 4.1 The distribution for the margin of votes for pseudo-GT . . . . . . . . 27
ix
List of Figures
Figure 2.1 Illustrations for Photo-realism (left) and Functional realism (right) 6Figure 2.2 Example of Scene Modeling from X, where X was a paragraph of text
[1]. . . . . . . . . . . . . . . . . . . . . . . . . . . . . . . . . . . . . 7Figure 2.3 An example of evaluation. The user study in [2]. . . . . . . . . . . . 8
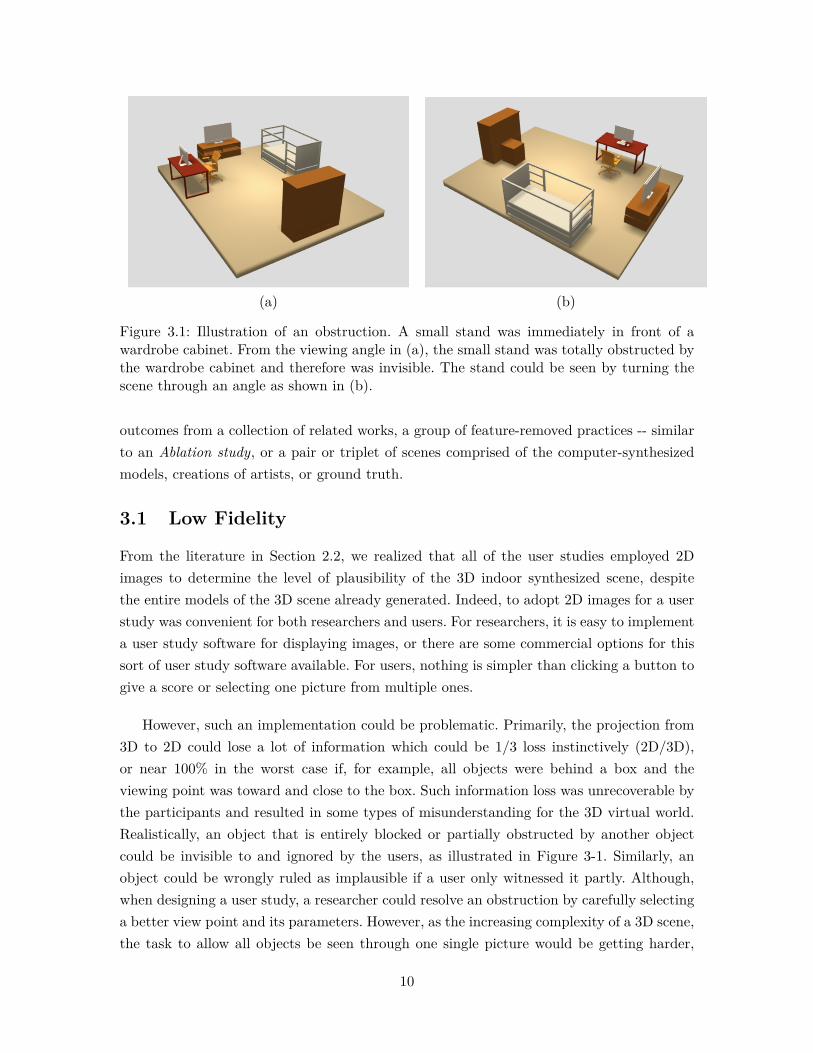
Figure 3.1 Illustration of an obstruction. A small stand was immediately infront of a wardrobe cabinet. From the viewing angle in (a), the smallstand was totally obstructed by the wardrobe cabinet and thereforewas invisible. The stand could be seen by turning the scene throughan angle as shown in (b). . . . . . . . . . . . . . . . . . . . . . . . 10
Figure 3.2 Illustration of a visual ambiguity. A TV stand on the left side of (a)looked normal, but it actually faced backward as shown in (b). . . 11
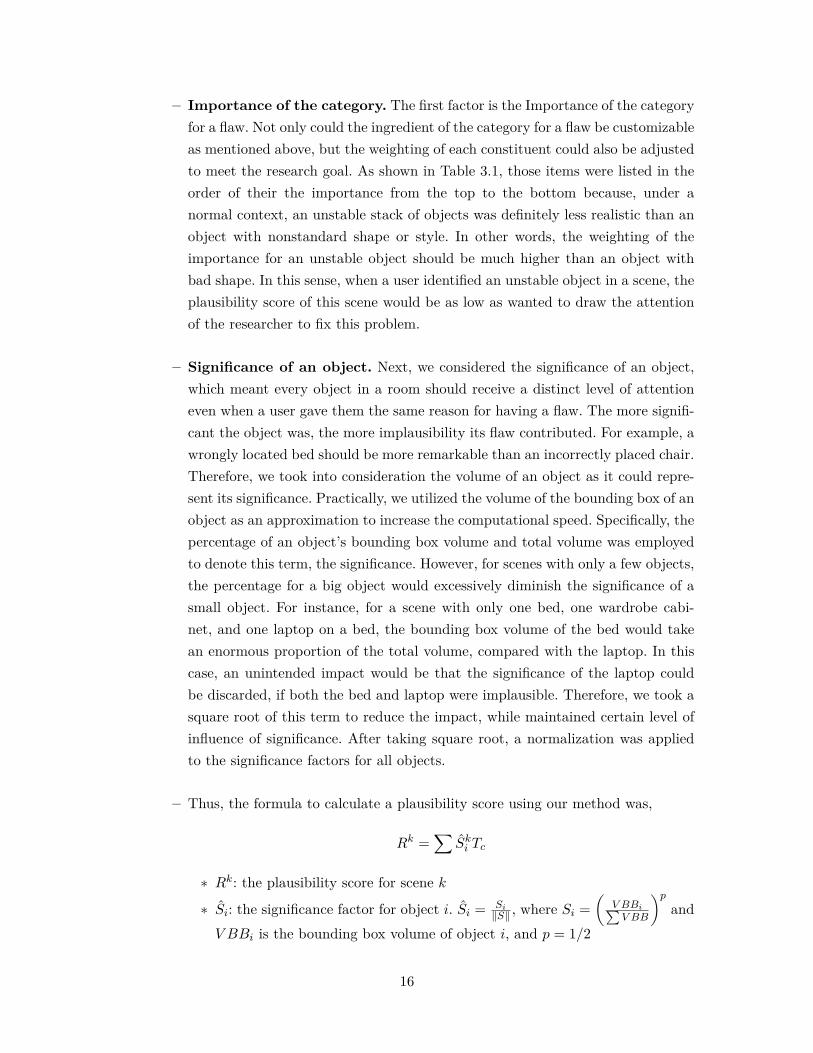
Figure 3.3 The implementation of our software. . . . . . . . . . . . . . . . . . 17
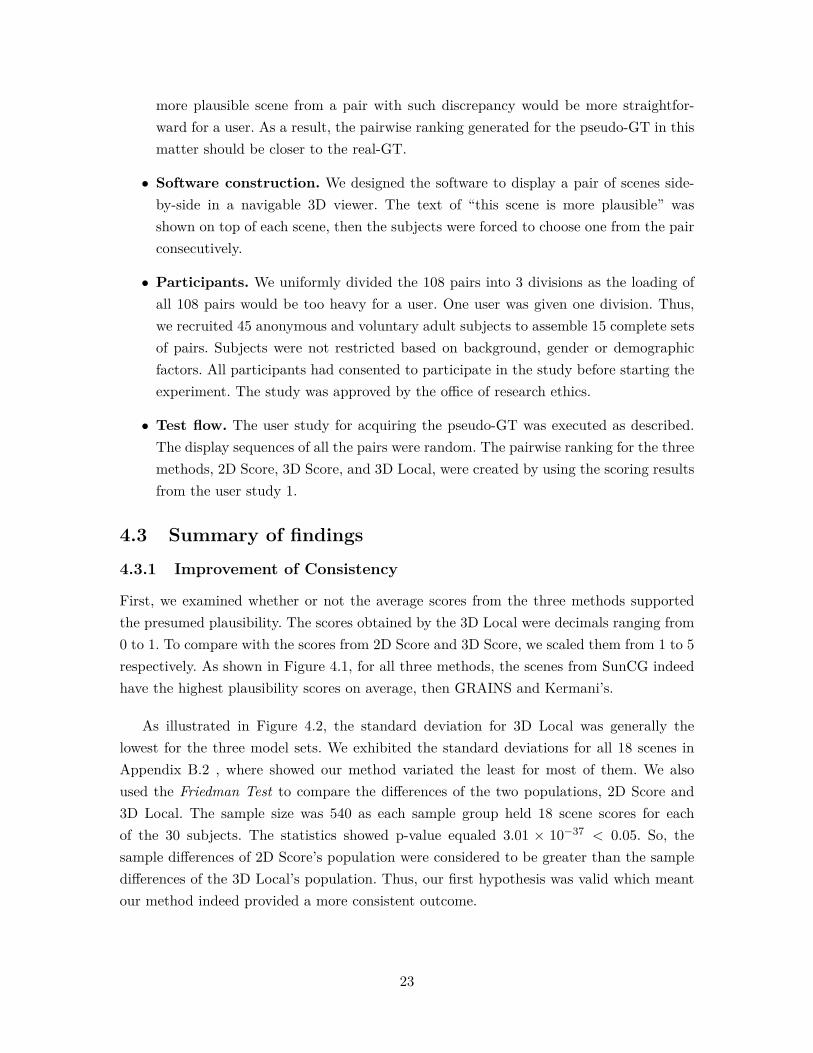
Figure 4.1 The average scores for the three model sets with respect to the threedifferent methods. . . . . . . . . . . . . . . . . . . . . . . . . . . . . 24
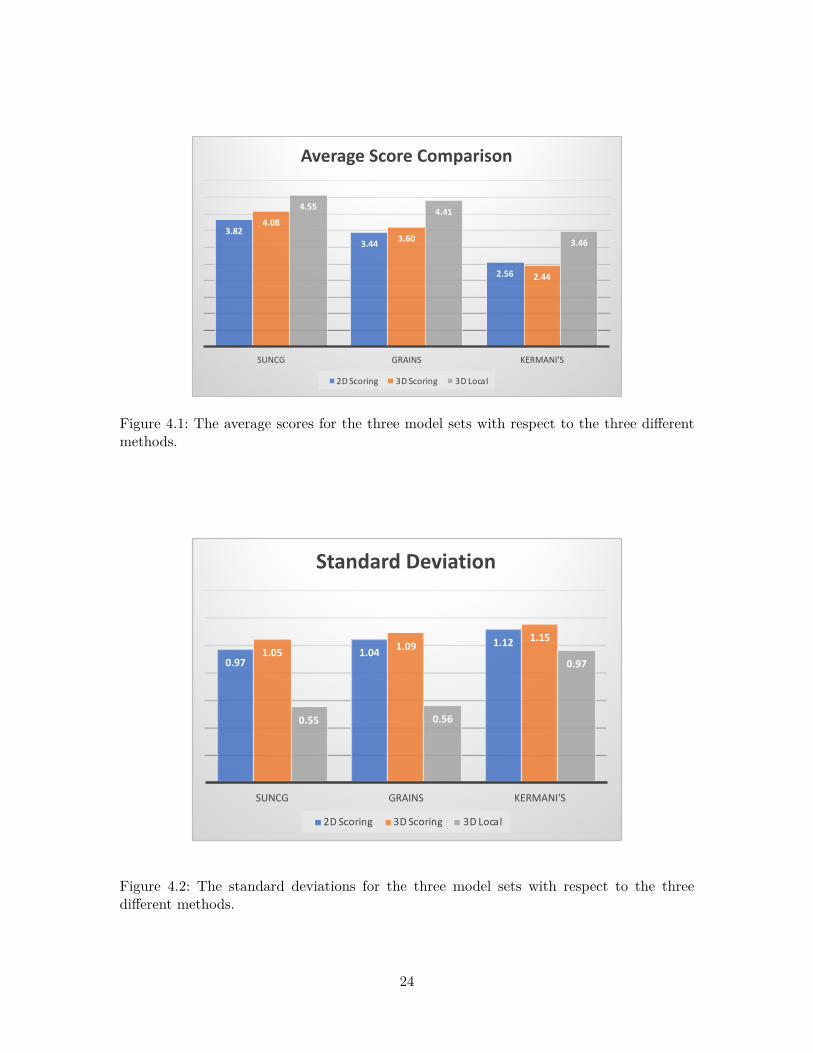
Figure 4.2 The standard deviations for the three model sets with respect to thethree different methods. . . . . . . . . . . . . . . . . . . . . . . . . 24
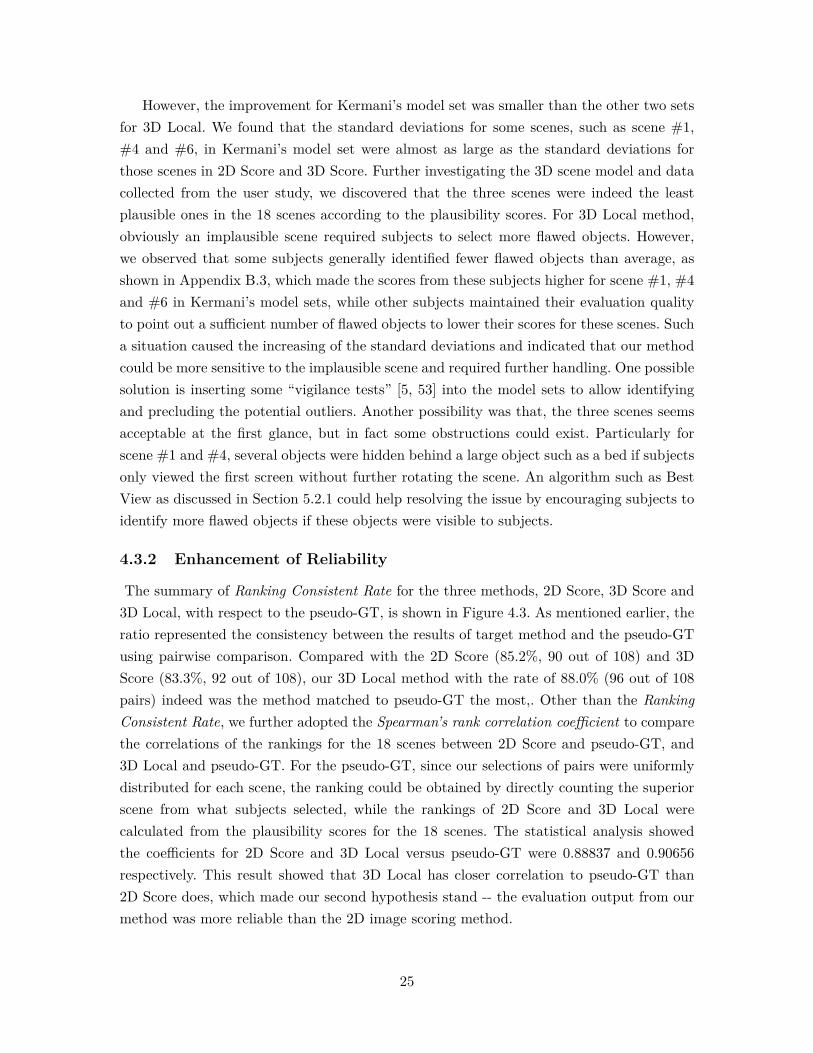
Figure 4.3 The consistency ratio to the pseudo-GT for the three methods byusing the Pairwise ranking. . . . . . . . . . . . . . . . . . . . . . . 26
Figure 4.4 Left: the scene #2 in SunCG model data. Right: the user evaluationresults. . . . . . . . . . . . . . . . . . . . . . . . . . . . . . . . . . 28
Figure 4.5 The time consumption comparison for the three methods. . . . . . 29
x
Chapter 1
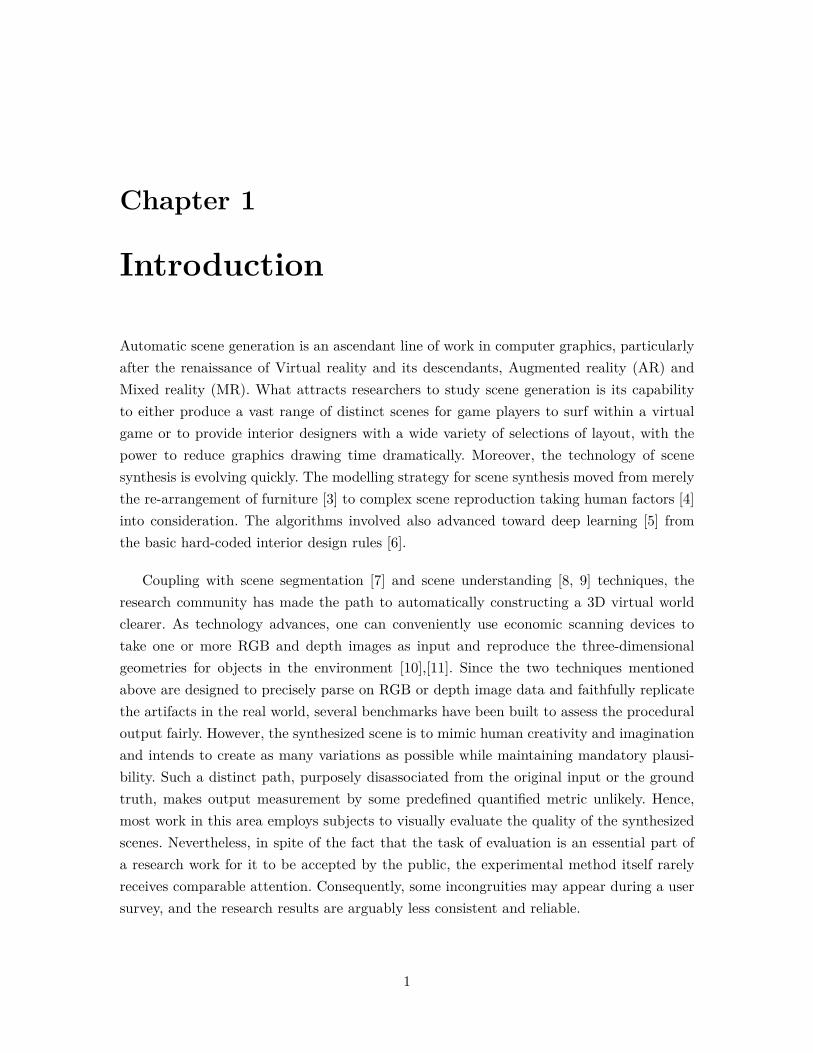
Introduction
Automatic scene generation is an ascendant line of work in computer graphics, particularlyafter the renaissance of Virtual reality and its descendants, Augmented reality (AR) andMixed reality (MR). What attracts researchers to study scene generation is its capabilityto either produce a vast range of distinct scenes for game players to surf within a virtualgame or to provide interior designers with a wide variety of selections of layout, with thepower to reduce graphics drawing time dramatically. Moreover, the technology of scenesynthesis is evolving quickly. The modelling strategy for scene synthesis moved from merelythe re-arrangement of furniture [3] to complex scene reproduction taking human factors [4]into consideration. The algorithms involved also advanced toward deep learning [5] fromthe basic hard-coded interior design rules [6].
Coupling with scene segmentation [7] and scene understanding [8, 9] techniques, theresearch community has made the path to automatically constructing a 3D virtual worldclearer. As technology advances, one can conveniently use economic scanning devices totake one or more RGB and depth images as input and reproduce the three-dimensionalgeometries for objects in the environment [10],[11]. Since the two techniques mentionedabove are designed to precisely parse on RGB or depth image data and faithfully replicatethe artifacts in the real world, several benchmarks have been built to assess the proceduraloutput fairly. However, the synthesized scene is to mimic human creativity and imaginationand intends to create as many variations as possible while maintaining mandatory plausi-bility. Such a distinct path, purposely disassociated from the original input or the groundtruth, makes output measurement by some predefined quantified metric unlikely. Hence,most work in this area employs subjects to visually evaluate the quality of the synthesizedscenes. Nevertheless, in spite of the fact that the task of evaluation is an essential part ofa research work for it to be accepted by the public, the experimental method itself rarelyreceives comparable attention. Consequently, some incongruities may appear during a usersurvey, and the research results are arguably less consistent and reliable.
1
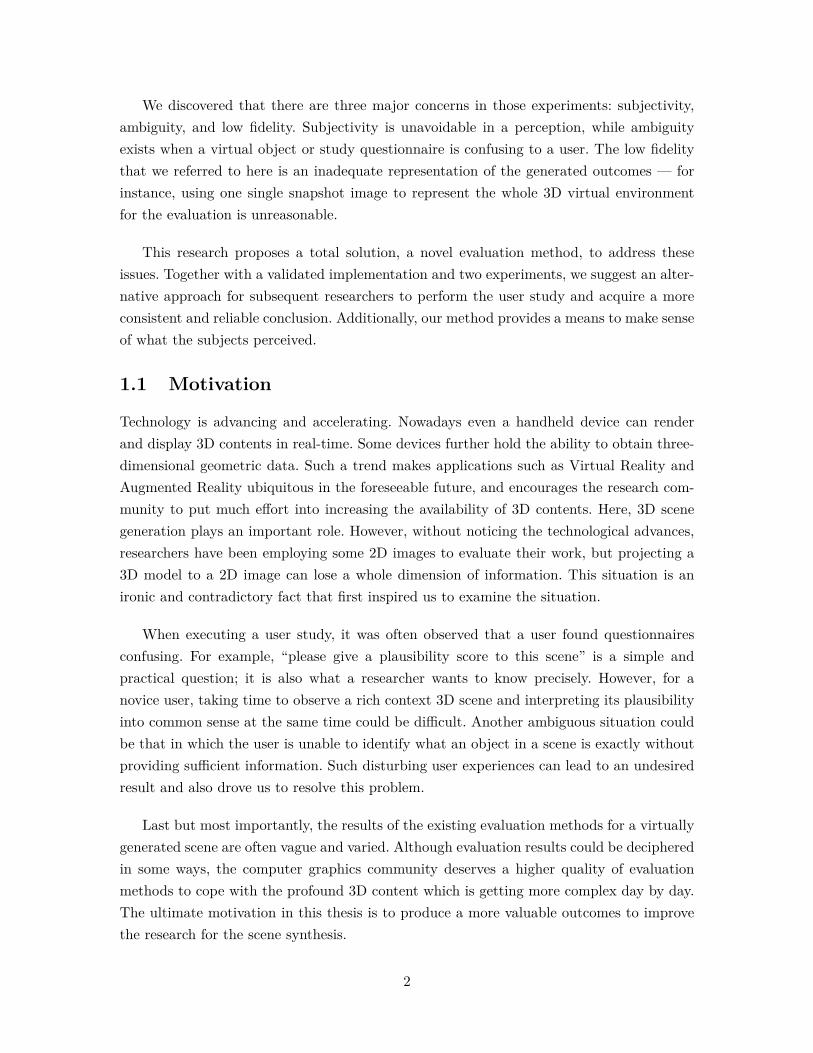
We discovered that there are three major concerns in those experiments: subjectivity,ambiguity, and low fidelity. Subjectivity is unavoidable in a perception, while ambiguityexists when a virtual object or study questionnaire is confusing to a user. The low fidelitythat we referred to here is an inadequate representation of the generated outcomes — forinstance, using one single snapshot image to represent the whole 3D virtual environmentfor the evaluation is unreasonable.
This research proposes a total solution, a novel evaluation method, to address theseissues. Together with a validated implementation and two experiments, we suggest an alter-native approach for subsequent researchers to perform the user study and acquire a moreconsistent and reliable conclusion. Additionally, our method provides a means to make senseof what the subjects perceived.
1.1 Motivation
Technology is advancing and accelerating. Nowadays even a handheld device can renderand display 3D contents in real-time. Some devices further hold the ability to obtain three-dimensional geometric data. Such a trend makes applications such as Virtual Reality andAugmented Reality ubiquitous in the foreseeable future, and encourages the research com-munity to put much effort into increasing the availability of 3D contents. Here, 3D scenegeneration plays an important role. However, without noticing the technological advances,researchers have been employing some 2D images to evaluate their work, but projecting a3D model to a 2D image can lose a whole dimension of information. This situation is anironic and contradictory fact that first inspired us to examine the situation.
When executing a user study, it was often observed that a user found questionnairesconfusing. For example, “please give a plausibility score to this scene” is a simple andpractical question; it is also what a researcher wants to know precisely. However, for anovice user, taking time to observe a rich context 3D scene and interpreting its plausibilityinto common sense at the same time could be difficult. Another ambiguous situation couldbe that in which the user is unable to identify what an object in a scene is exactly withoutproviding sufficient information. Such disturbing user experiences can lead to an undesiredresult and also drove us to resolve this problem.
Last but most importantly, the results of the existing evaluation methods for a virtuallygenerated scene are often vague and varied. Although evaluation results could be decipheredin some ways, the computer graphics community deserves a higher quality of evaluationmethods to cope with the profound 3D content which is getting more complex day by day.The ultimate motivation in this thesis is to produce a more valuable outcomes to improvethe research for the scene synthesis.
2
1.2 Overview
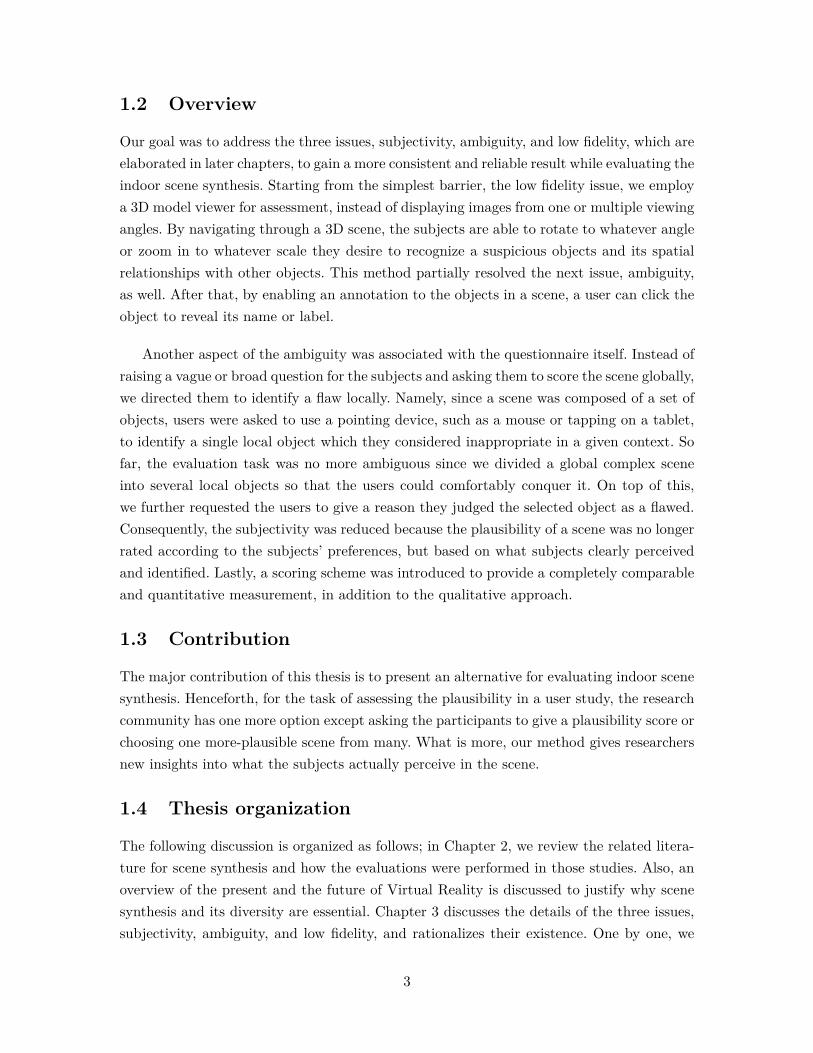
Our goal was to address the three issues, subjectivity, ambiguity, and low fidelity, which areelaborated in later chapters, to gain a more consistent and reliable result while evaluating theindoor scene synthesis. Starting from the simplest barrier, the low fidelity issue, we employa 3D model viewer for assessment, instead of displaying images from one or multiple viewingangles. By navigating through a 3D scene, the subjects are able to rotate to whatever angleor zoom in to whatever scale they desire to recognize a suspicious objects and its spatialrelationships with other objects. This method partially resolved the next issue, ambiguity,as well. After that, by enabling an annotation to the objects in a scene, a user can click theobject to reveal its name or label.
Another aspect of the ambiguity was associated with the questionnaire itself. Instead ofraising a vague or broad question for the subjects and asking them to score the scene globally,we directed them to identify a flaw locally. Namely, since a scene was composed of a set ofobjects, users were asked to use a pointing device, such as a mouse or tapping on a tablet,to identify a single local object which they considered inappropriate in a given context. Sofar, the evaluation task was no more ambiguous since we divided a global complex sceneinto several local objects so that the users could comfortably conquer it. On top of this,we further requested the users to give a reason they judged the selected object as a flawed.Consequently, the subjectivity was reduced because the plausibility of a scene was no longerrated according to the subjects’ preferences, but based on what subjects clearly perceivedand identified. Lastly, a scoring scheme was introduced to provide a completely comparableand quantitative measurement, in addition to the qualitative approach.
1.3 Contribution
The major contribution of this thesis is to present an alternative for evaluating indoor scenesynthesis. Henceforth, for the task of assessing the plausibility in a user study, the researchcommunity has one more option except asking the participants to give a plausibility score orchoosing one more-plausible scene from many. What is more, our method gives researchersnew insights into what the subjects actually perceive in the scene.
1.4 Thesis organization
The following discussion is organized as follows; in Chapter 2, we review the related litera-ture for scene synthesis and how the evaluations were performed in those studies. Also, anoverview of the present and the future of Virtual Reality is discussed to justify why scenesynthesis and its diversity are essential. Chapter 3 discusses the details of the three issues,subjectivity, ambiguity, and low fidelity, and rationalizes their existence. One by one, we
3

supply a countermeasure for each of them, followed by a comprehensive implementation. Toshow the effectiveness of our solution, we present our experiments in Chapter 4 along withtheir results. We conclude our work and its limitation, possible applications, and futuredirections in Chapter 5.
4
Chapter 2
Related Work
2.1 Virtual Reality
Virtual Reality has a long history and the field is still expanding. Steuer first claimed “thekey to defining virtual reality in terms of human experience rather than technological hard-ware is the concept of presence”, and “many perceptual factors help to generate this sense,including input from some or all sensory channels” [12, p. 75]. The concept of “telepres-ence,” or “presence” for short, was then becoming the most critical factor for assessing aVirtual Reality system. While recent development emphasizes multimodal sensory inputs[13] as Steuer expected, visual stimulation remains the primary input [14]. Research hasalso found that the greater the level of visual realism, the greater the sense of presence[15, 16]. For visual realism forged by the computer graphics domain, Ferwerda introducedthree varieties of realism [17]: physical realism, photo-realism and functional realism. Perthe author’s statement, physical realism and photo-realism are computationally expensive,so, for interactive applications such as Virtual Reality, their applicability would be limited.Therefore, he suggested the third standard of functional realism to accommodate a widerange of rendering styles depended on the need of interactivity. A typical example of mak-ing use of functional realism is flight simulators, where the system provides the functionallyrealistic information to allow the trainees to learn the skills virtually and then transferinto the real world [17]. Thus, functional realism could be applied to various domains as it“allows an observer to make reliable visual judgments and to perform useful visual tasks”[17, p. 293], regardless of what kind of rendering style one intends to apply or how muchcomputational cost one intends to spend to achieve true physical realism or photo-realism.
Since Virtual Reality has virtually endless applications in fields such as entertainment,education, health care and engineering [18], the demand for modelling the 3D virtual envi-ronment is unarguably enormous and ever increasing. Nevertheless, for an artist or graphicdesigner to create a virtual scene where every object has the correct shape, size, posi-tion, motion and material to fulfill the functional realism is extremely time-consuming andexperience-dependent. In order to cope with such a tedious task, the research community
5

Figure 2.1: Illustrations for Photo-realism (left) and Functional realism (right)https://www.autodesk.ca/en/products/rendering/overviewhttps://commons.wikimedia.org/wiki/File:980310-N-7355H-003_Simulator_Training.jpg
has been motivated to develop a means to generate a handful of plausible scenes aided bythe computer semi-automatically or even fully-automatically, so that the artist can focuson developing aesthetics.
2.2 Scene synthesis
Among applications of Virtual Reality, the indoor scene is omnipresent, especially for gam-ing, interior design, and training. There are various approaches to generating an indoorscene. A comprehensive analytic report from Ma [19] compiled and categorized the worksof indoor scene synthesis into several classes. We updated the recent studies based on hisarticle and added one more class, the neural network, to summarized the research activitiesin this line of work as follows.
For creating the objects in a virtual indoor scene, artists now have many options otherthan building from scratch. They can make use of the existing 3D models or modify tem-plates from prepared repositories, such as the large collections of 3D models, the 3D ware-house [20] and ShapeNet [21]. Otherwise, they can capture the object from the real worldand transform it to a 3D model [22]. With the availability of the 3D models for every in-dividual object, the task of synthesizing a reasonable indoor scene is then to decide whatobjects and how many of those objects should appear in the scene and where an objectshould be placed. The first category, the Suggestive Scene Modeling [19], was a preliminaryapproach and an interactive and user-centric tool [23, 24, 25], which semi-automaticallyassisted artists to expedite the design process with prompts. Another early category, theFurniture Layout Optimization [3, 26, 6, 27], was a distinct path in scene synthesis as itprincipally focused on arranging a prescribed set of furniture to optimally satisfy certainconstraints or rules and specifically targeted to the interior design industry.
6
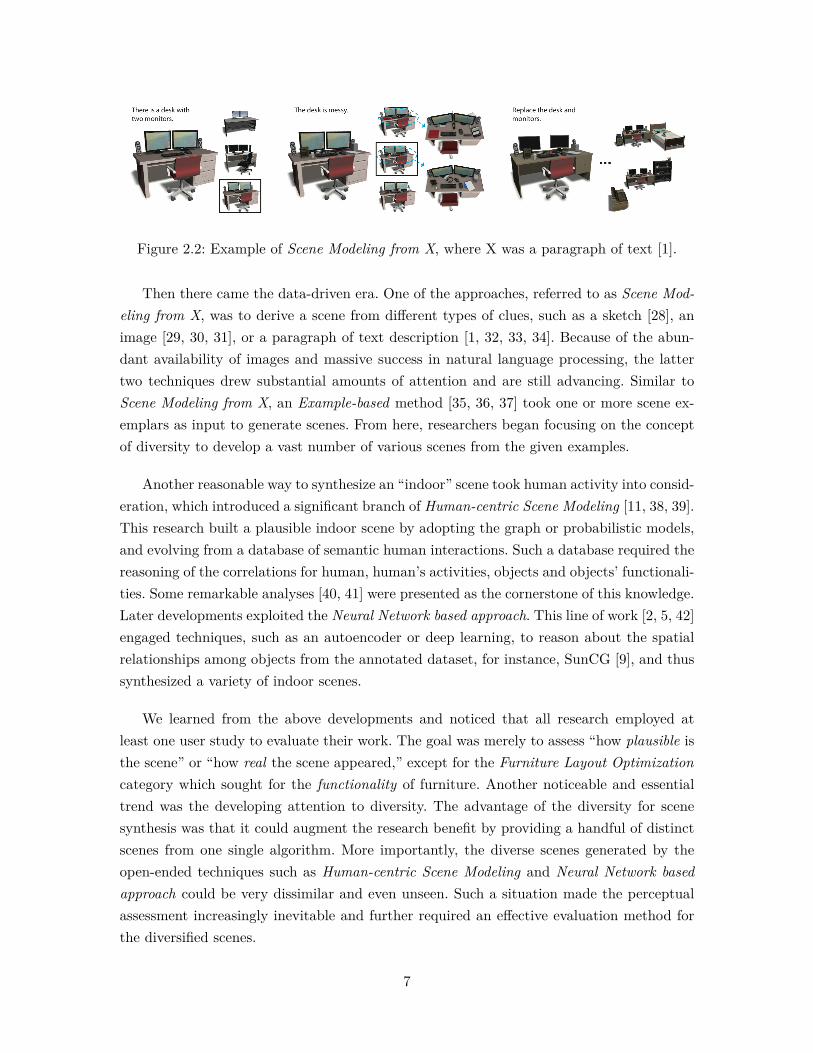
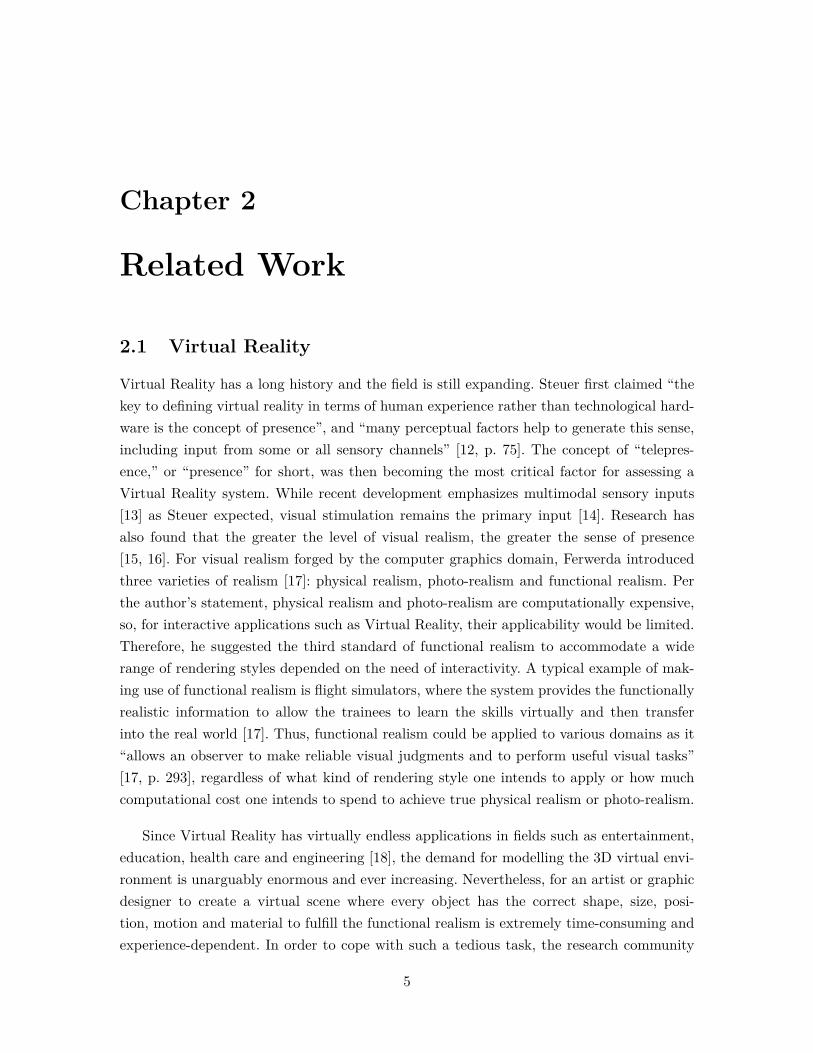
Figure 2.2: Example of Scene Modeling from X, where X was a paragraph of text [1].
Then there came the data-driven era. One of the approaches, referred to as Scene Mod-eling from X, was to derive a scene from different types of clues, such as a sketch [28], animage [29, 30, 31], or a paragraph of text description [1, 32, 33, 34]. Because of the abun-dant availability of images and massive success in natural language processing, the lattertwo techniques drew substantial amounts of attention and are still advancing. Similar toScene Modeling from X, an Example-based method [35, 36, 37] took one or more scene ex-emplars as input to generate scenes. From here, researchers began focusing on the conceptof diversity to develop a vast number of various scenes from the given examples.
Another reasonable way to synthesize an “indoor” scene took human activity into consid-eration, which introduced a significant branch of Human-centric Scene Modeling [11, 38, 39].This research built a plausible indoor scene by adopting the graph or probabilistic models,and evolving from a database of semantic human interactions. Such a database required thereasoning of the correlations for human, human’s activities, objects and objects’ functionali-ties. Some remarkable analyses [40, 41] were presented as the cornerstone of this knowledge.Later developments exploited the Neural Network based approach. This line of work [2, 5, 42]engaged techniques, such as an autoencoder or deep learning, to reason about the spatialrelationships among objects from the annotated dataset, for instance, SunCG [9], and thussynthesized a variety of indoor scenes.
We learned from the above developments and noticed that all research employed atleast one user study to evaluate their work. The goal was merely to assess “how plausible isthe scene” or “how real the scene appeared,” except for the Furniture Layout Optimizationcategory which sought for the functionality of furniture. Another noticeable and essentialtrend was the developing attention to diversity. The advantage of the diversity for scenesynthesis was that it could augment the research benefit by providing a handful of distinctscenes from one single algorithm. More importantly, the diverse scenes generated by theopen-ended techniques such as Human-centric Scene Modeling and Neural Network basedapproach could be very dissimilar and even unseen. Such a situation made the perceptualassessment increasingly inevitable and further required an effective evaluation method forthe diversified scenes.
7
Figure 2.3: An example of evaluation. The user study in [2].
2.3 Evaluation and user studies
There are many studies regarding the evaluation of Virtual Reality in the literature [43,44, 45, 46]. In [45], the author emphasized the importance of navigability. In [43, p. 833],a heuristic evaluation guideline of virtual reality applications was proposed. The researchernoted that “the VE and behaviour of objects should correspond as closely as possible to theuser’s expectation of real world objects; their behaviour; and affordances for task action”and should particularly notice problems like creating unexpected effects such as movingthrough walls or floating objects. More specifically, in his thoughts about the user study[47, p. 20], the author pointed out that “no matter how efficient a visualization techniquemay be, or how well motivated from theory, if it doesn’t convey information effectively, it’sof little use.”
All this research suggested was that, either the application itself or its evaluation neededto be as close as possible to the real scenario that a user would experience. Since VirtualReality is the target application for scene synthesis, the above guideline stimulated us toinspect how far apart the conventional evaluation was from what Virtual Reality required.Such an inspection further steered us to formulate a navigable and real-world faithful eval-uation method for the research community.
8
Chapter 3
Discussion and Approach
In this chapter, we first examine the conventional evaluation method for indoor scene synthe-sis and its existing problems, and the symptoms, root causes, and effects of these problems.After that, we propose a novel approach, a new evaluation method, to remedy those issues.
The conventional evaluation method we refer to here is defined as a user study, whichdemonstrates the subjects with one or multiple 2D images for an indoor scene and inquiresabout them with a questionnaire in order to obtain a score or a ranking.
The standard implementation of showing a single image was to render a three-dimensionalscene and project it to a two-dimensional plane according to a pre-determined viewing set-ting, where the projection method could be a parallel projection or perspective projection.For the case of multiple images, several viewing positions, such as top/front/back/side views,with the identical rendering parameters were applied to the same scene.
There were two general types of questionnaires employed by the conventional evaluationmethod. The first type was to ask subjects “which of these scenes is more Y ?”, wherethe keyword Y was normally a perceptive terminology, such as “plausible,” “functional,”“natural,” or “reasonable,” depending on the type of research and the answer that theresearchers in this domain wanted to know. As an example, “functional” seemed an idealterminology for the Furniture Layout Optimization introduced in Chapter 2. For the sake ofconvenience, we used “plausible” to represent this terminology in the following discussion.The second type of questionnaire was to require subjects to “provide a Y’ score to the sceneon a scale of Z ,” where Z was usually a Likert Scale from 1 to 5 or 7. In most cases, Y’was a noun form of Y . For example, if Y was “plausible,” Y’ would be “plausibility”.
The first type of questionnaire was clearly a compare-and-select action from severalimplementations to be judged, while the second questionnaire was implicitly of the sameform because the purpose of requesting a score was literally to obtain the ordinal informationfor comparing those implementations. These implementations could be a set of generated
9
(a) (b)
Figure 3.1: Illustration of an obstruction. A small stand was immediately in front of awardrobe cabinet. From the viewing angle in (a), the small stand was totally obstructed bythe wardrobe cabinet and therefore was invisible. The stand could be seen by turning thescene through an angle as shown in (b).
outcomes from a collection of related works, a group of feature-removed practices -- similarto an Ablation study, or a pair or triplet of scenes comprised of the computer-synthesizedmodels, creations of artists, or ground truth.
3.1 Low Fidelity
From the literature in Section 2.2, we realized that all of the user studies employed 2Dimages to determine the level of plausibility of the 3D indoor synthesized scene, despitethe entire models of the 3D scene already generated. Indeed, to adopt 2D images for a userstudy was convenient for both researchers and users. For researchers, it is easy to implementa user study software for displaying images, or there are some commercial options for thissort of user study software available. For users, nothing is simpler than clicking a button togive a score or selecting one picture from multiple ones.
However, such an implementation could be problematic. Primarily, the projection from3D to 2D could lose a lot of information which could be 1/3 loss instinctively (2D/3D),or near 100% in the worst case if, for example, all objects were behind a box and theviewing point was toward and close to the box. Such information loss was unrecoverable bythe participants and resulted in some types of misunderstanding for the 3D virtual world.Realistically, an object that is entirely blocked or partially obstructed by another objectcould be invisible to and ignored by the users, as illustrated in Figure 3-1. Similarly, anobject could be wrongly ruled as implausible if a user only witnessed it partly. Although,when designing a user study, a researcher could resolve an obstruction by carefully selectinga better view point and its parameters. However, as the increasing complexity of a 3D scene,the task to allow all objects be seen through one single picture would be getting harder,
10
(a) (b)
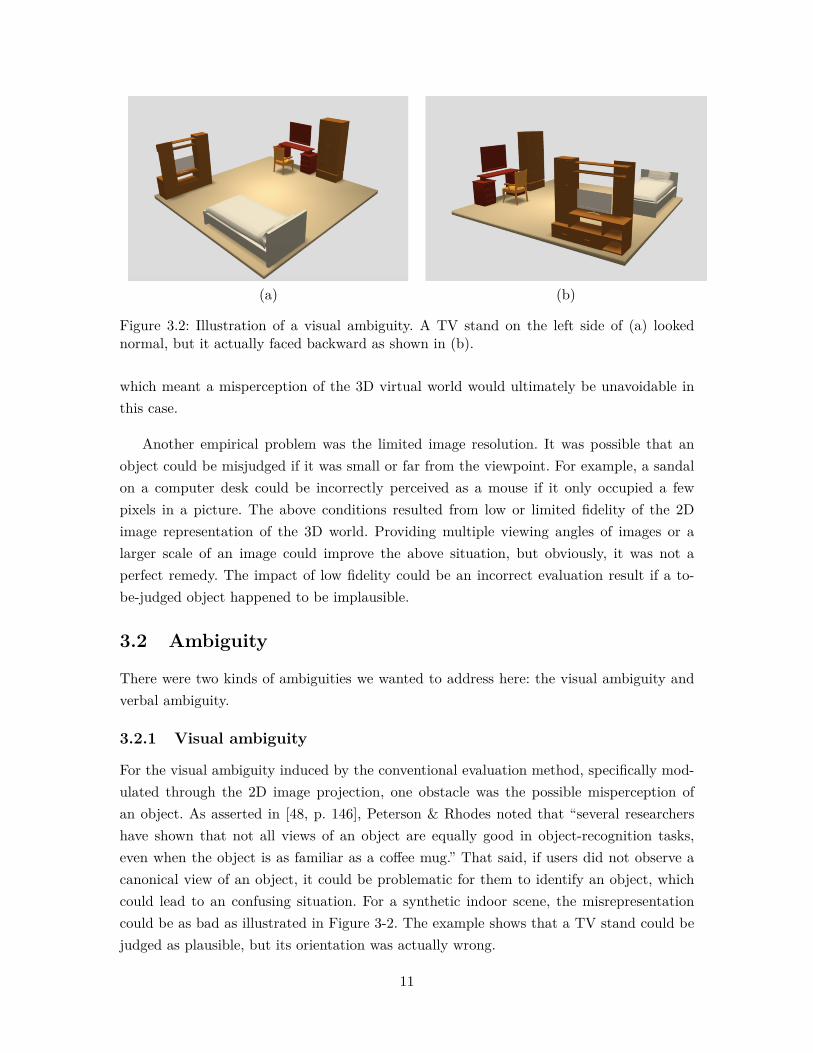
Figure 3.2: Illustration of a visual ambiguity. A TV stand on the left side of (a) lookednormal, but it actually faced backward as shown in (b).
which meant a misperception of the 3D virtual world would ultimately be unavoidable inthis case.
Another empirical problem was the limited image resolution. It was possible that anobject could be misjudged if it was small or far from the viewpoint. For example, a sandalon a computer desk could be incorrectly perceived as a mouse if it only occupied a fewpixels in a picture. The above conditions resulted from low or limited fidelity of the 2Dimage representation of the 3D world. Providing multiple viewing angles of images or alarger scale of an image could improve the above situation, but obviously, it was not aperfect remedy. The impact of low fidelity could be an incorrect evaluation result if a to-be-judged object happened to be implausible.
3.2 Ambiguity
There were two kinds of ambiguities we wanted to address here: the visual ambiguity andverbal ambiguity.
3.2.1 Visual ambiguity
For the visual ambiguity induced by the conventional evaluation method, specifically mod-ulated through the 2D image projection, one obstacle was the possible misperception ofan object. As asserted in [48, p. 146], Peterson & Rhodes noted that “several researchershave shown that not all views of an object are equally good in object-recognition tasks,even when the object is as familiar as a coffee mug.” That said, if users did not observe acanonical view of an object, it could be problematic for them to identify an object, whichcould lead to an confusing situation. For a synthetic indoor scene, the misrepresentationcould be as bad as illustrated in Figure 3-2. The example shows that a TV stand could bejudged as plausible, but its orientation was actually wrong.
11
Another source of visual ambiguity could be the perception of imperfect or inappropriateattributes of an object. For example, the recent development for scene synthesis evaluationwas to colour-code “the objects in each scene image according to their category so thatparticipants would make judgments based on the types of objects present and their ar-rangement, and not based on extraneous factors such as object materials” [5, p. 8]. Suchan approach reduced a user’s bias or preference for the material attribute of an object andtransferred the user’s attention to focus on the spatial arrangement in the scene. Neverthe-less, since the objects in a category were rendered in the same colour, all objects in thiscategory would become less distinguishable and could look more confusing to the users,particularly without depth information in a 2D image.
3.2.2 Verbal ambiguity
As defined at the beginning of this chapter, a verbal questionnaire was a mandatory elementfor the conventional user studies. For example, participants were often asked “which of thesescenes is more plausible?” However, less attention was drawn to the questionnaire itself. Thepotential problem here was that the terminology “plausible” was too broad and vague fora user to understand, especially a non-expert subject. From an informal interview withthe subjects, we found that the questions they asked before starting the survey were asfollows: “what do you mean by plausible?”, “does plausible mean reasonable?” or: “I feellike every scene is plausible to me,” etc. On the other hand, when we asked why they madesuch a selection if we observed their selection seemed unreasonable, some of they answered:“I just feel like it.” Indeed, the response to “which of these scenes is more plausible?”was the fundamental answer a researcher was eager to know. And “plausible” was such acomprehensive but concise term to perfectly represent and cover all design choices, such asobject occurrence, arrangement and many others, from the point of view of the researchers.However, since it was too global for a non-expert subject to understand, if we did notspecify plainly enough, participants would interpret the “plausibility” in their own way. Asolution could be breaking down the “plausible” question into several sub-questions, suchas “in which of these scenes has a proper number of objects?”, “in which of these scenes’objects are appropriate?”, “which of these scenes’ objects are appropriately arranged?” anditeratively to turn one questionnaire into a set of questionnaires. However, this solutionwould make the survey lengthy and repetitious. Therefore, researchers had the dilemma ofwhether to be simple and confuse users or to be complex and trouble researchers.
“How to choose a proper Y ?” was another verbal situation that agitated researchers.In the literature, we found that most papers used “plausible” as their keyword, but someused “real/realistic,” or “functionality/naturalness” to depict a scene. These were all goodcandidates for keywords, but they also suffered the same issues as “plausible.” As one canimagine, since the users perceived the meaning of “plausibility” differently, the scores they
12
rated would be varied too. Therefore, such ambiguous situations could bring about unreliableresults.
3.3 Subjectivity
Undoubtedly, the evaluation of 3D scene synthesis using the methodology defined aboveis perceptional, and human perception is subjective. In particular, a user’s perception forthe plausibility of a scene could be affected by unintended factors, such as the attributesof an object -- material, size, or shape. Even the settings of lighting or shading in therendering condition could influence the visual perception of a virtual environment. Thetechnique of colour-coding the objects that Wang et al. [5] adopted could eliminate theeffect from the object materials. Nevertheless, there were other attributes that could causesuch influence on visual perception, which was observed in research occasionally. As Li etal. [2, p. 11] stated, subjects without technical background “are more sensitive to objectshapes (e.g., relative size) than object relations and overall layout.” Not only was therea bias toward the object attributes, but also much evidence showed a preference amonguser groups. “Graphics/Vision researchers pay more attention to object placements such astheir orientation and their relative positions. This is why they tend to give slightly higherscores to all scenes” [2, p. 11]. Another observation from the informal interview was thatsome subjects claimed they never gave the highest or lowest score, without any reason.Although some techniques could reduce these conditions [49], such subjectivity could havean inevitable impact and thus cause a noticeable deviation to the evaluation results.
3.4 Our approach
Zeroing in on the above three issues, we devised an integral solution: a 3D local flaw iden-tification method, comprised of a 3D model viewer with the ability to locally annotate anobject, allowing a user to highlight a flawed object and subsequently indicate a reason forits flaw.
• 3D model viewer. For the Low Fidelity issue, our remedy was to use a 3D modelviewer. Since we already possessed the complete 3D scene, we did not have to take theaforementioned risks to perceive it from 2D images. In the literature, there were notmany reasons to adopt 2D images for evaluating a 3D scene. A practical justificationwas to adopt the similar approach in the field of image processing. Yet Yu et al. [3]suggested that their user study “involved static 2D image viewing rather than 3Dscene navigation so as to eliminate differences due to varying degrees of skill amongthe participants in using navigation software.” Nevertheless, technology is advancing.Not only are there more and more 3D software and games available on flat displayor cellphones, there are also many affordable head-mounted display devices popular
13
nowadays. End users are familiar with 3D visualization capable devices enough, sosuch concern should not be an issue anymore. For example, Google Maps is a well-known program; some people use its 3D navigation function every day. If we allowusers to manipulate and navigate in a 3D virtual scene for evaluating its plausibility,there could be an opportunity for them to discover a blocked object. They wouldnever have to guess what object was behind a wardrobe if they only saw it partiallybecause this situation could be quickly dealt with by turning the scene through anangle. Besides, theoretically, a 3D model viewer has infinite fidelity, so the restrictedresolution issue would no longer exist. Consequently, the chance that a user could bemissing or unable to identify an object was dramatically reduced.
• Localization and annotation. A navigable 3D model viewer resolved not only thelow fidelity issue but also part of the ambiguity issue. It enabled a user to inspect asuspicious object by zooming in or probing from different viewing angles. To be precise,our system further implemented an annotation function to allow a user to click anobject locally to display its annotation. By doing this, the users were able to clarifyevery ambiguous object which might have been mis-identified in the conventionalevaluation method. Thus, the above-mentioned visual ambiguities produced by theuncanonical view or inappropriate attribute would be eliminated.
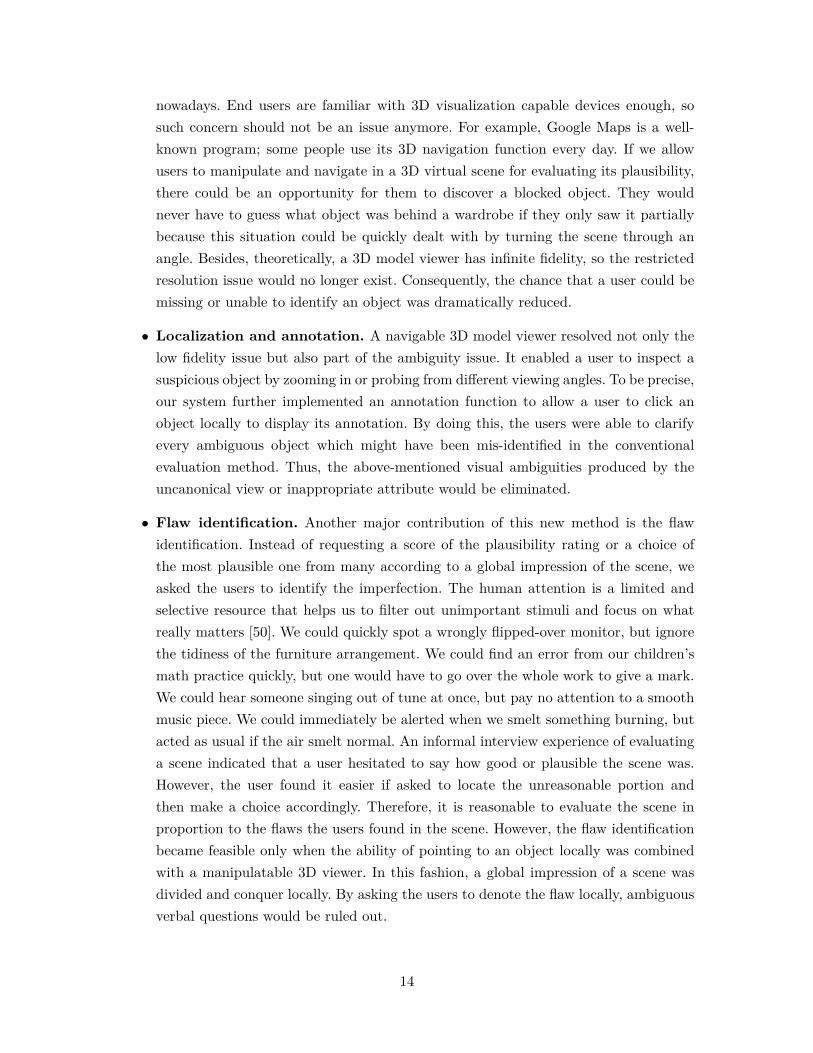
• Flaw identification. Another major contribution of this new method is the flawidentification. Instead of requesting a score of the plausibility rating or a choice ofthe most plausible one from many according to a global impression of the scene, weasked the users to identify the imperfection. The human attention is a limited andselective resource that helps us to filter out unimportant stimuli and focus on whatreally matters [50]. We could quickly spot a wrongly flipped-over monitor, but ignorethe tidiness of the furniture arrangement. We could find an error from our children’smath practice quickly, but one would have to go over the whole work to give a mark.We could hear someone singing out of tune at once, but pay no attention to a smoothmusic piece. We could immediately be alerted when we smelt something burning, butacted as usual if the air smelt normal. An informal interview experience of evaluatinga scene indicated that a user hesitated to say how good or plausible the scene was.However, the user found it easier if asked to locate the unreasonable portion andthen make a choice accordingly. Therefore, it is reasonable to evaluate the scene inproportion to the flaws the users found in the scene. However, the flaw identificationbecame feasible only when the ability of pointing to an object locally was combinedwith a manipulatable 3D viewer. In this fashion, a global impression of a scene wasdivided and conquer locally. By asking the users to denote the flaw locally, ambiguousverbal questions would be ruled out.
14
Principal Category Flaw Category Explanation Example
Interpenetration objects penetrate each other Two wardrobe cabinets intersect
Floating object object unreasonably suspends in the air A floating chair
Unstable induce physically unstability A book with its centre of gravity outside of the table
Wrong existence shouldn't appear here A bed in a kitchen
Should be a pair shoule be pairwise A single nightstand alongside to a bed
Missing companion lack of a typical companion A a desk alone without a chair
Wrong location object isn't in its reasonable location A desk lamp on the ground
Bad orientation object is improperly oriented A monitor face to the wall
Poor clearance insufficient clearance between objects Not enough space betweem a sofa and a coffee table
Bad alignment mis-alignment of objects Mis-alignment of a bed and 2 nightstands
Bad shape or style object shape or style doesn't match to the scene A lazy chair in front of a desk
Bad size or color object size or color doesn't match to the scene A oversize lamp
Physics Error
Occurrence error
Arrangement error
Functional error
Modelling error
Table 3.1: A template for the causes of flaws, with explanations and examples.
• Flaw cause. To reduce the impact of subjectivity, our method explicitly asked theparticipants to select a reason they identified an object as a flaw. This way, we forcedthe users to clearly express their perception. An interesting idea here was that thelist of reasons shown to the participants was customizable. In other words, dependingon the need of research, the designer could include or exclude a specific category.For instance, in Furniture Layout Optimization method defined in chapter 2, theInterior Design Guidelines, such as Clearance, Circulation, Pairwise Relationshipsand Conversation, were the fundamental principles for algorithms of this line of work[6]. In this situation, the reasons for flaws could be phrased as, “insufficient Clearance”or “poor Circulation,” etc., so that the users would be implicitly guided to perceivehow well the arrangement of furniture is. On the other hand, for the line of workinvolving a Neural Network based approach, the researchers mostly considered twofactors, the models of co-occurrence and arrangement for a set of objects [2]. Toevaluate such work, the reasons for flaws could be, “wrong existence,” “should be apair,” “missing companion,” “wrong location,” and “wrong orientation”, where theformer three phrases were for verifying the co-occurrence model and the latter twowere for checking the arrangement model. In Table 3.1, we demonstrated a templateof some possible reasons that could be exploited to cover most of the needs for theindoor synthesis. Such an operation was innovative to the best of our knowledge.
• Scoring formula: Up to this point, our methods had qualitatively addressed thethree issues, the low fidelity, ambiguity and subjectivity. However, we still needed ascoring method for researchers to quantitatively measure and compare the ups anddowns for various algorithms. An unsophisticated method was to count the numberof flaws, but a better approach was to take into account some critical factors andcompute a appropriately score.
15
– Importance of the category. The first factor is the Importance of the categoryfor a flaw. Not only could the ingredient of the category for a flaw be customizableas mentioned above, but the weighting of each constituent could also be adjustedto meet the research goal. As shown in Table 3.1, those items were listed in theorder of their the importance from the top to the bottom because, under anormal context, an unstable stack of objects was definitely less realistic than anobject with nonstandard shape or style. In other words, the weighting of theimportance for an unstable object should be much higher than an object withbad shape. In this sense, when a user identified an unstable object in a scene, theplausibility score of this scene would be as low as wanted to draw the attentionof the researcher to fix this problem.
– Significance of an object. Next, we considered the significance of an object,which meant every object in a room should receive a distinct level of attentioneven when a user gave them the same reason for having a flaw. The more signifi-cant the object was, the more implausibility its flaw contributed. For example, awrongly located bed should be more remarkable than an incorrectly placed chair.Therefore, we took into consideration the volume of an object as it could repre-sent its significance. Practically, we utilized the volume of the bounding box of anobject as an approximation to increase the computational speed. Specifically, thepercentage of an object’s bounding box volume and total volume was employedto denote this term, the significance. However, for scenes with only a few objects,the percentage for a big object would excessively diminish the significance of asmall object. For instance, for a scene with only one bed, one wardrobe cabi-net, and one laptop on a bed, the bounding box volume of the bed would takean enormous proportion of the total volume, compared with the laptop. In thiscase, an unintended impact would be that the significance of the laptop couldbe discarded, if both the bed and laptop were implausible. Therefore, we took asquare root of this term to reduce the impact, while maintained certain level ofinfluence of significance. After taking square root, a normalization was appliedto the significance factors for all objects.
– Thus, the formula to calculate a plausibility score using our method was,
Rk =∑
Ski Tc
∗ Rk: the plausibility score for scene k
∗ Si: the significance factor for object i. Si = Si‖S‖ , where Si =
(V BBi∑
V BB
)p
andV BBi is the bounding box volume of object i, and p = 1/2
16
Figure 3.3: The implementation of our software.
∗ Tc: the importance factor for category c
• Implementation details. Since we wanted to extend our method into the researchcommunity to benefit both the researchers and users, some practical details wereconsidered. In our implementation, a web-based program was made mandatory forthe sake of being carried out in a crowdsourcing platform such as Amazon mTurk.Furthermore, since the evaluation method was being used as an application for theuser study, we bore usability and convenience in mind and minimized the numberof taps or clicks to 2, for a user to identify a flaw and its reason. As illustrated inFigure 3.3, when a user clicked an object, such as the table, our programs wouldhighlight a contour around it. Simultaneously, a dropdown menu appeared to displaythe annotation of the table and also a set of flaw reasons for the user to select. Fora floor lamp that had been identified with a flaw of “Wrong location,” our programwould keep it highlighted with the flaw label above it, so that the users could visualizewhich objects had been identified.
In essence, our approach to evaluating a synthesized scene aimed to overcome the issuesthat existed in the conventional method, based on a 3D model viewer and the qualitativetechniques of localization, annotation, and flaw identification. It was why we advocate a nav-igable 3D model as it was a substantial basis to make possible of the rest of the techniques.We expected our system would produce a more consistent and reliable result compared with
17

the conventional 2D image method, and the hypotheses of our experiments were based onthose facilities. A bonus merit of our implementation was to provide meaningful knowledgealong with the outcome to enable further analysis by researchers. We explain the merit inthe next chapter.
18
Chapter 4
Evaluation
4.1 Research questions
The purpose of our method was to reduce the impact of the three issues, subjectivity,ambiguity, and low fidelity, and lead to a better evaluation result than the conventionalmethod. Based on the above observations and the proposed approaches, we formalized ourresearch question as follows.
• Does the use of a 3D local flaw identification method increase the consistency andreliability of the evaluation result for indoor scene synthesis?
As discussed in the beginning of previous chapter, there were several variants for the con-ventional method. To be specific, here we chose the single 2D image implementation withthe first type of questionnaire as the basis of our comparison. The reason was that it hasbeen the common practice and the numeric scoring result is comparable to our method.We also picked the most popular usage of “plausible” as the keyword of Y and set Z as aLikert Scale from 1 to 5. Thus, to address this research question, we formed the followingtwo hypotheses.
• H1: The evaluation output from the 3D local flaw identification method is more con-sistent than the 2D image scoring method.
• H2: The evaluation output from the 3D local flaw identification method is more reliablethan the 2D image scoring method.
To validate the effectiveness of our method, two experiments were conducted to support thehypotheses and to answer the research question. The details of experiments and analysis ofthe results are elaborated in the rest of this chapter.
19
4.2 Methodology
4.2.1 User Study 1
The first user study was to verify the improvement of consistency. The measurement wetook here was the standard deviations and differences among the scores obtained from themethods to be compared. The lower the differences for all scores distributed, the higher theconsistency the method is.
• Model sets. We selected three model sets of indoor scene as test data to displayto the participants. Precisely, we adopted the model sets established in [2], whichwere the training set [9], the proposed set [2] and the baseline set from Kermani etal. [37]. The three model sets were expected to have different levels of plausibility todemonstrate the effectiveness for the target methods we compared. For convenience,we referred to the first one as SunCG with the highest relative plausibility, the secondone as GRAINS with the lesser plausibility and the last one as Kermani’s.
• Participants. 30 adult subjects were recruited anonymously and voluntarily. Therewere 10 subjects in Computer Graphics related field, 10 in Computer Science but notComputer Graphics related field and 10 for non-Computer Science users. The partic-ipants were not restricted based on gender or demographic factors. All participantshad consented to participate in the study before starting the experiment. The studywas approved by the office of research ethics.
• Apparatus. The study was carried out online, so an internet capable computer ortablet device was required to enter this study.
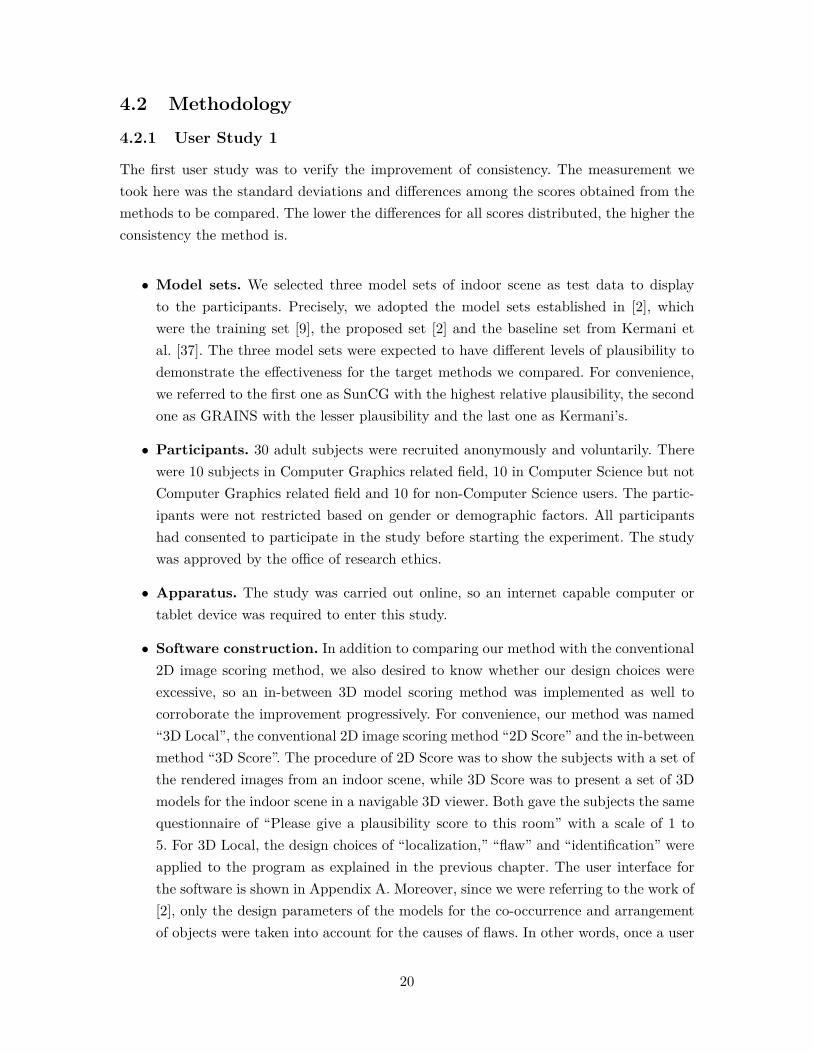
• Software construction. In addition to comparing our method with the conventional2D image scoring method, we also desired to know whether our design choices wereexcessive, so an in-between 3D model scoring method was implemented as well tocorroborate the improvement progressively. For convenience, our method was named“3D Local”, the conventional 2D image scoring method “2D Score” and the in-betweenmethod “3D Score”. The procedure of 2D Score was to show the subjects with a set ofthe rendered images from an indoor scene, while 3D Score was to present a set of 3Dmodels for the indoor scene in a navigable 3D viewer. Both gave the subjects the samequestionnaire of “Please give a plausibility score to this room” with a scale of 1 to5. For 3D Local, the design choices of “localization,” “flaw” and “identification” wereapplied to the program as explained in the previous chapter. The user interface forthe software is shown in Appendix A. Moreover, since we were referring to the work of[2], only the design parameters of the models for the co-occurrence and arrangementof objects were taken into account for the causes of flaws. In other words, once a user
20
clicked to select an object as flawed, the menu would pop up with 5 options, “wrongexistence,” ”should be a pair,” “missing companion,” “wrong location” and “wrongorientation,” for selection. The first three options belonged to the co-occurrence modeland the last two options were associated with the arrangement model. Meanwhile, theimportance factor Tc was set to 2:2:2:1:1 respectively in our experiment, as the co-occurrence error was considered more severe than an arrangement error.
• Test data. Six 3D indoor scenes were picked from each of the three model sets whichwere generated for the user study of [2]. All the three methods, i.e. 2D Score, 3DScore and 3D Local, held the same 3D models for the 18 scenes. For 3D Score and3D Local, the initial viewing position of each scene was set to be identical to theone in 2D Score, but the subjects could navigate its 3D model freely as explained.It is worth mentioning that the graphics rendering conditions for both 3D Score and3D Local were the same but different from 2D Score. In fact, the rendered imagesof the 18 scenes for 2D Score were directly retrieved from [2]. There were rationalesbehind this decision. First, we wanted to replicate and compare the result of theconventional method, the 2D Score, so it should be reasonable to re-use those images.The second reason was that to apply the complex rendering conditions, such as therealistic lightings or textures, could be problematic for an online application as we hadno idea how much computing power a client’s device had and it could seriously affectthe navigability of the 3D viewer. In consequence, the outcome could be affected bythe low fidelity or ambiguity issues caused by users’ device that we intended to avoid.Therefore, we preferred to employ a simpler renderer and gain back the navigability.After all, as discussed in the related work, the functional realism is more fundamentalthan the photo-realism.
• Training section. A noteworthy detail was that, since the 3D Local was a novelapproach for an evaluation task, most subjects would not have enough experience todigest the concept of local flaw identification and to operate it well. Therefore, weprepared a training section to demonstrate each flaw with a scenario to teach thesubjects to understand its meaning. So, there were five screens of the five flaw causes.
• Test flow. We adopted a within-subject approach for this experiment. Namely, a userwas shown the rendered images of 18 scenes in 2D Score section first, and then the3D models of the same 18 scenes for 3D Score and 3D Local sections. The displaysequences of those scenes were random. The training section was arranged right beforethe 3D Local section.
21
4.2.2 User study 2
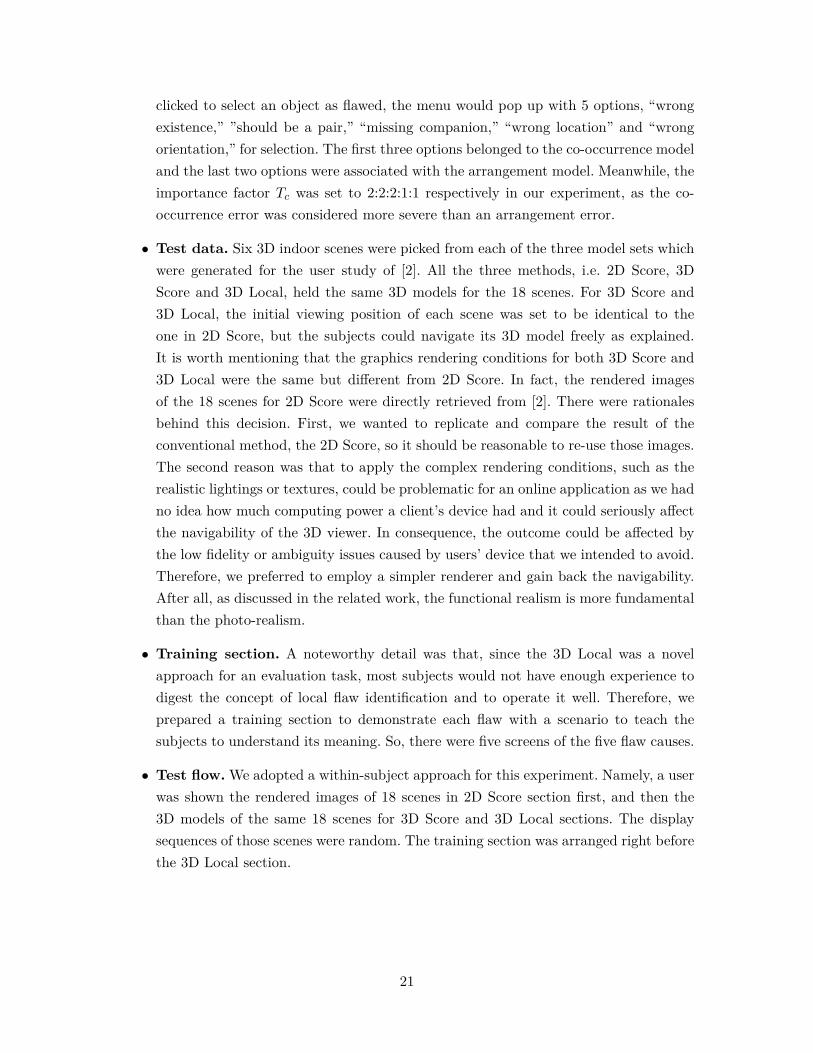
To verify the second hypothesis, the improvement of reliability, we needed to have a groundtruth as a judgment base so that the outcomes from every method could be compared to it.The closer the outcome to the ground truth, the more reliable the method was assumed tobe. The ground truth we referred to here meant the exact plausibilities for a set of scenes.Let us assume there did exist the ground truth and the way we made use of it was to utilizeits pairwise ranking elaborated as follows.
If the exact plausibility for each scene was known, for two scenes in any pair, one couldcompare their plausibilities to generate the ranking for this pair and consequently obtainthe entire rankings for all pairs, which was the pairwise ranking for this set of scenes. Asfor each method to be evaluated in this work, we could also obtain its pairwise rankingfor the same set of scenes by comparing the scores rated by the subjects. Then for eachand every pair, we compared whether its ranking in the proposed method agreed with thecorresponding ranking in the ground truth. In the end, we got the ratio of the number ofagreements versus the total number of pairs. The ratio represented how close the pairwiseranking of the target method was to the ground truth. The higher the ratio, the closer theresult to the ground truth.
However, in reality, we did not have a ground truth for the plausibilities, but empiricallywe could approximate its pairwise ranking via human perception. The approach was toutilize the pairwise comparison similar to the Ranking Consistent Rate or the Visual Turingtest exploited in [51, 52]. This was another reason we exploited the pairwise ranking ofground truth as we could approach it directly by using pairwise comparison without knowingthe ground truth. Therefore, the second user study was to present the subjects with a pairof scenes and ask them to select the one which is more plausible. The result to exhaustivelyinquire all pairs for a set of scenes could serve as the approximation of the ground truth.For convenience, we referred the approximated ground truth as pseudo-GT and the realground truth as real-GT.
• Model sets. The same as the first user study.
• Apparatus. The same as the first user study.
• Test data. The same 18 scenes from the first user study were employed. If we thor-oughly enumerated all pairs, there were C(18, 2) = 153 pairs. In fact, for pseudo-GTpairwise ranking, we only made use of 108 pairs, where each pair consisted of one scenefrom each model set, i.e. to exclude the case that both scenes in a pair came from thesame model set. The reason here was, as mention earlier, each model set was expectedto have a different level of plausibility, so we believed that to compare and select a
22
more plausible scene from a pair with such discrepancy would be more straightfor-ward for a user. As a result, the pairwise ranking generated for the pseudo-GT in thismatter should be closer to the real-GT.
• Software construction. We designed the software to display a pair of scenes side-by-side in a navigable 3D viewer. The text of “this scene is more plausible” wasshown on top of each scene, then the subjects were forced to choose one from the pairconsecutively.
• Participants. We uniformly divided the 108 pairs into 3 divisions as the loading ofall 108 pairs would be too heavy for a user. One user was given one division. Thus,we recruited 45 anonymous and voluntary adult subjects to assemble 15 complete setsof pairs. Subjects were not restricted based on background, gender or demographicfactors. All participants had consented to participate in the study before starting theexperiment. The study was approved by the office of research ethics.
• Test flow. The user study for acquiring the pseudo-GT was executed as described.The display sequences of all the pairs were random. The pairwise ranking for the threemethods, 2D Score, 3D Score, and 3D Local, were created by using the scoring resultsfrom the user study 1.
4.3 Summary of findings
4.3.1 Improvement of Consistency
First, we examined whether or not the average scores from the three methods supportedthe presumed plausibility. The scores obtained by the 3D Local were decimals ranging from0 to 1. To compare with the scores from 2D Score and 3D Score, we scaled them from 1 to 5respectively. As shown in Figure 4.1, for all three methods, the scenes from SunCG indeedhave the highest plausibility scores on average, then GRAINS and Kermani’s.
As illustrated in Figure 4.2, the standard deviation for 3D Local was generally thelowest for the three model sets. We exhibited the standard deviations for all 18 scenes inAppendix B.2 , where showed our method variated the least for most of them. We alsoused the Friedman Test to compare the differences of the two populations, 2D Score and3D Local. The sample size was 540 as each sample group held 18 scene scores for eachof the 30 subjects. The statistics showed p-value equaled 3.01 × 10−37 < 0.05. So, thesample differences of 2D Score’s population were considered to be greater than the sampledifferences of the 3D Local’s population. Thus, our first hypothesis was valid which meantour method indeed provided a more consistent outcome.
23
3.823.44
2.56
4.08
3.60
2.44
4.55 4.41
3.46
SUNCG GRAINS KERMANI'S
Average Score Comparison
2D Scoring 3D Scoring 3D Local
Figure 4.1: The average scores for the three model sets with respect to the three differentmethods.
0.971.04
1.121.05 1.09
1.15
0.55 0.56
0.97
SUNCG GRAINS KERMANI'S
Standard Deviation
2D Scoring 3D Scoring 3D Local
Figure 4.2: The standard deviations for the three model sets with respect to the threedifferent methods.
24
However, the improvement for Kermani’s model set was smaller than the other two setsfor 3D Local. We found that the standard deviations for some scenes, such as scene #1,#4 and #6, in Kermani’s model set were almost as large as the standard deviations forthose scenes in 2D Score and 3D Score. Further investigating the 3D scene model and datacollected from the user study, we discovered that the three scenes were indeed the leastplausible ones in the 18 scenes according to the plausibility scores. For 3D Local method,obviously an implausible scene required subjects to select more flawed objects. However,we observed that some subjects generally identified fewer flawed objects than average, asshown in Appendix B.3, which made the scores from these subjects higher for scene #1, #4and #6 in Kermani’s model sets, while other subjects maintained their evaluation qualityto point out a sufficient number of flawed objects to lower their scores for these scenes. Sucha situation caused the increasing of the standard deviations and indicated that our methodcould be more sensitive to the implausible scene and required further handling. One possiblesolution is inserting some “vigilance tests” [5, 53] into the model sets to allow identifyingand precluding the potential outliers. Another possibility was that, the three scenes seemsacceptable at the first glance, but in fact some obstructions could exist. Particularly forscene #1 and #4, several objects were hidden behind a large object such as a bed if subjectsonly viewed the first screen without further rotating the scene. An algorithm such as BestView as discussed in Section 5.2.1 could help resolving the issue by encouraging subjects toidentify more flawed objects if these objects were visible to subjects.
4.3.2 Enhancement of Reliability
The summary of Ranking Consistent Rate for the three methods, 2D Score, 3D Score and3D Local, with respect to the pseudo-GT, is shown in Figure 4.3. As mentioned earlier, theratio represented the consistency between the results of target method and the pseudo-GTusing pairwise comparison. Compared with the 2D Score (85.2%, 90 out of 108) and 3DScore (83.3%, 92 out of 108), our 3D Local method with the rate of 88.0% (96 out of 108pairs) indeed was the method matched to pseudo-GT the most,. Other than the RankingConsistent Rate, we further adopted the Spearman’s rank correlation coefficient to comparethe correlations of the rankings for the 18 scenes between 2D Score and pseudo-GT, and3D Local and pseudo-GT. For the pseudo-GT, since our selections of pairs were uniformlydistributed for each scene, the ranking could be obtained by directly counting the superiorscene from what subjects selected, while the rankings of 2D Score and 3D Local werecalculated from the plausibility scores for the 18 scenes. The statistical analysis showedthe coefficients for 2D Score and 3D Local versus pseudo-GT were 0.88837 and 0.90656respectively. This result showed that 3D Local has closer correlation to pseudo-GT than2D Score does, which made our second hypothesis stand -- the evaluation output from ourmethod was more reliable than the 2D image scoring method.
25
83.3%
85.2%
88.0%
2D Score 3D Score 3D Local
Pairwise Ranking Comparison
Figure 4.3: The consistency ratio to the pseudo-GT for the three methods by using thePairwise ranking.
However, the reliability for 3D Local did not enhance enough to meet our expectation.We further inspected and learned some important facts. First of all, the 2D Score methodhas certain accuracy, and we did not pick the scenes specifically or arrange the objectsspecially to demonstrate the capability of our method. As mentioned in the experimentsetting, the 18 scenes were just chosen from the scenes employed by the user study of [2].Secondly, there were 14 pairs of 2D Score disagreed with 3D Local, where 10 out of these14 pairs were for 3D Local to agree with pseudo-GT and 4 pairs were for 2D Score to agreewith pseudo-GT. Further, 3 out of the 10 pairs for 3D Local were one-vote margin, while1 out of 4 pairs for 2D Score was one-vote margin. The one-vote margin meant that, forthe 15 complete sets forming entire pairwise comparison, the ratio of votes to decide theranking of one pair for the pseudo-GT was 7:8 or 8:7. With the condition for only onevote of difference, adding a few more subjects to obtain more votes could possibly reversethe ranking. Therefore, if the 3 pairs with one-vote margin were turned to favor 2D Score,the enhancement of reliability for our method would decline. On the other hand, if the 1pair with one-vote margin was turned to favor 3D Local, the enhancement ratio would behigher. Such a situation was arguable, and, of course, we could largely increase the numberof subjects to attempt to reduce the chance of one-vote margin until the margin becomessignificant enough. In our experiment, there are 12 pairs of one-vote margin as shown inTable 4.1. Another easier way is to scrap the pairs with one-vote margin in the pseudo-GTto eliminate the argument. However, no matter how many subjects are recruited, the resultis still a pseudo-GT.
26
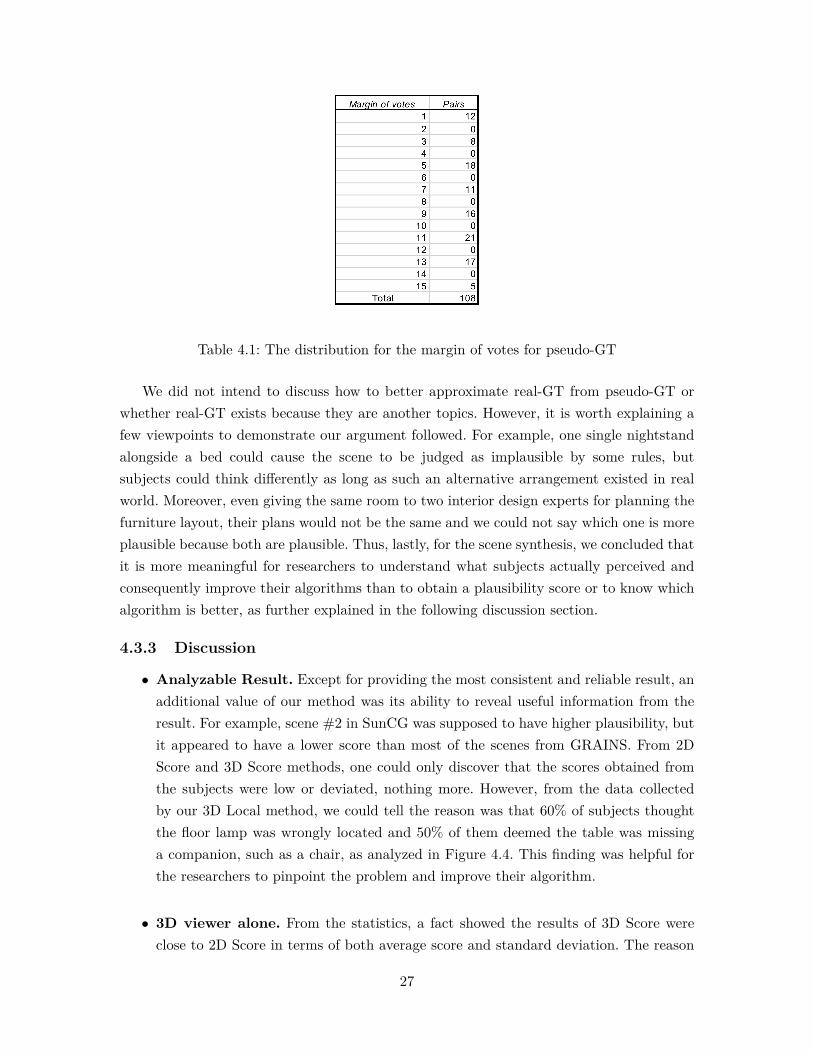
Table 4.1: The distribution for the margin of votes for pseudo-GT
We did not intend to discuss how to better approximate real-GT from pseudo-GT orwhether real-GT exists because they are another topics. However, it is worth explaining afew viewpoints to demonstrate our argument followed. For example, one single nightstandalongside a bed could cause the scene to be judged as implausible by some rules, butsubjects could think differently as long as such an alternative arrangement existed in realworld. Moreover, even giving the same room to two interior design experts for planning thefurniture layout, their plans would not be the same and we could not say which one is moreplausible because both are plausible. Thus, lastly, for the scene synthesis, we concluded thatit is more meaningful for researchers to understand what subjects actually perceived andconsequently improve their algorithms than to obtain a plausibility score or to know whichalgorithm is better, as further explained in the following discussion section.
4.3.3 Discussion
• Analyzable Result. Except for providing the most consistent and reliable result, anadditional value of our method was its ability to reveal useful information from theresult. For example, scene #2 in SunCG was supposed to have higher plausibility, butit appeared to have a lower score than most of the scenes from GRAINS. From 2DScore and 3D Score methods, one could only discover that the scores obtained fromthe subjects were low or deviated, nothing more. However, from the data collectedby our 3D Local method, we could tell the reason was that 60% of subjects thoughtthe floor lamp was wrongly located and 50% of them deemed the table was missinga companion, such as a chair, as analyzed in Figure 4.4. This finding was helpful forthe researchers to pinpoint the problem and improve their algorithm.
• 3D viewer alone. From the statistics, a fact showed the results of 3D Score wereclose to 2D Score in terms of both average score and standard deviation. The reason
27
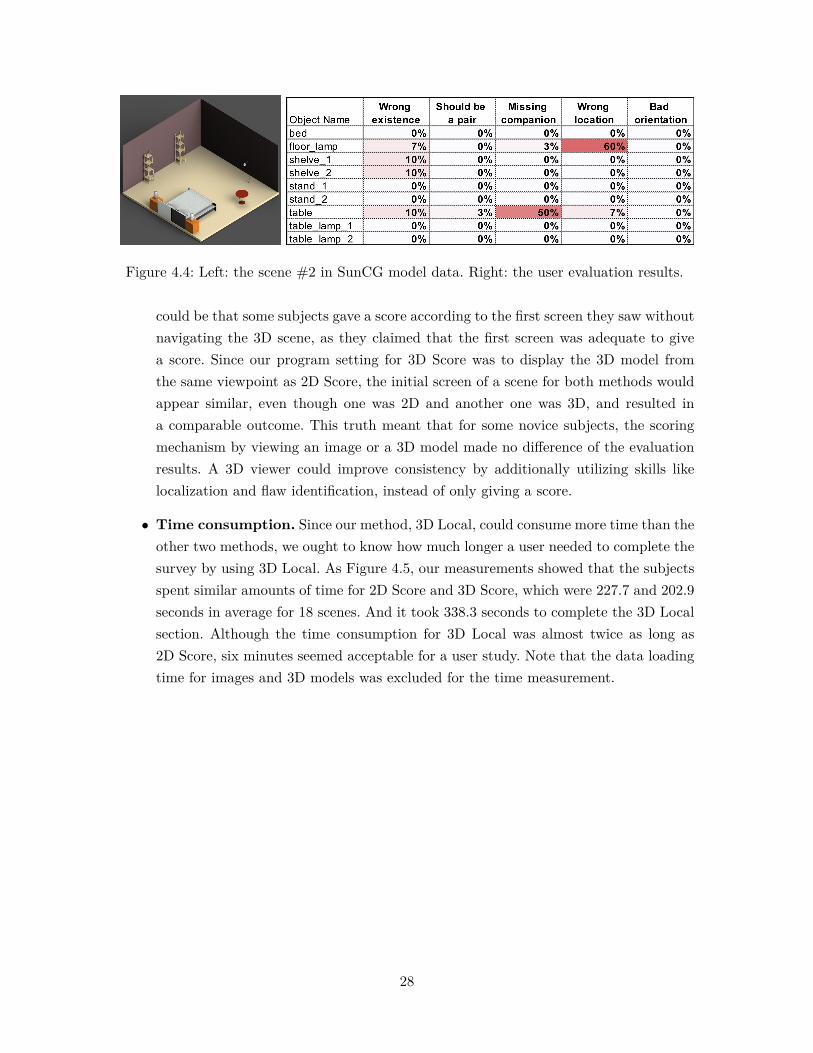
Figure 4.4: Left: the scene #2 in SunCG model data. Right: the user evaluation results.
could be that some subjects gave a score according to the first screen they saw withoutnavigating the 3D scene, as they claimed that the first screen was adequate to givea score. Since our program setting for 3D Score was to display the 3D model fromthe same viewpoint as 2D Score, the initial screen of a scene for both methods wouldappear similar, even though one was 2D and another one was 3D, and resulted ina comparable outcome. This truth meant that for some novice subjects, the scoringmechanism by viewing an image or a 3D model made no difference of the evaluationresults. A 3D viewer could improve consistency by additionally utilizing skills likelocalization and flaw identification, instead of only giving a score.
• Time consumption. Since our method, 3D Local, could consume more time than theother two methods, we ought to know how much longer a user needed to complete thesurvey by using 3D Local. As Figure 4.5, our measurements showed that the subjectsspent similar amounts of time for 2D Score and 3D Score, which were 227.7 and 202.9seconds in average for 18 scenes. And it took 338.3 seconds to complete the 3D Localsection. Although the time consumption for 3D Local was almost twice as long as2D Score, six minutes seemed acceptable for a user study. Note that the data loadingtime for images and 3D models was excluded for the time measurement.
28
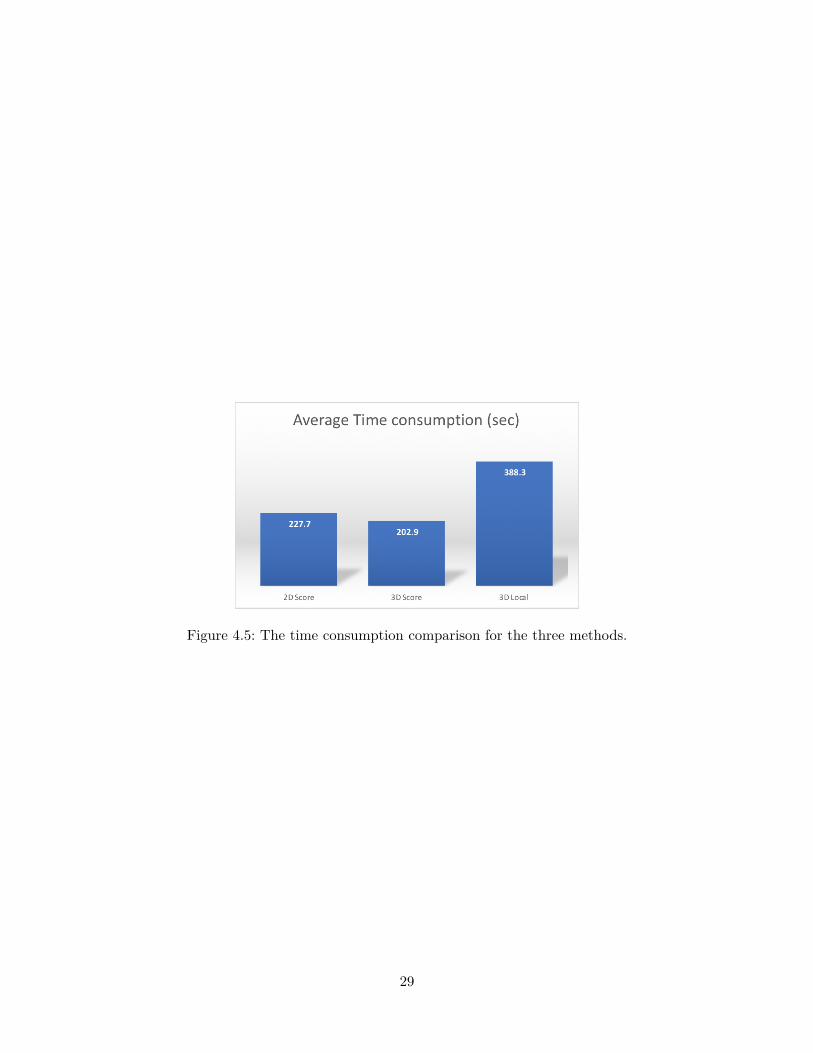
Figure 4.5: The time consumption comparison for the three methods.
29
Chapter 5
Conclusion and Future Work
In this thesis, we proposed a novel approach to evaluating 3D indoor scene syntheses.Through observing the existing subjectivity, ambiguity and low fidelity issues, we developedan integrated solution to overcome the potential deficiencies. With the collaboration ofthree qualitative techniques, localization, annotation, and flaw identification, a navigable3D model viewer could assist in assessing a computer-generated scene better and providing acomparable numeric result aside from the conventional image scoring method. Localizationplayed a vital role in dividing and conquering the global scene, while the mechanism offlaw identification helped capture the human response in the way of selective attention.The scoring recipe of our method not only took the significant factor of an object intoconsideration, it also gave the flexibility for researchers to adjust the focus of outcome tosuit their need.
In summary, an alternative measure to precisely classify and discretely quantify humanperceptions was presented. By accomplishing two experiments, we demonstrated that ourproposal was more consistent and reliable than the conventional method. Moreover, itsadvantage of providing analyzable results that enable the researchers to investigate furtherwas unique and practical.
5.1 Limitation
• Restricted photo-realism. The approach proposed in this thesis was the first at-tempt of its kind. As explained above, we aimed to assess the functional realism ofa scene, so our implementation did not work toward a photo-realistic application.The concern was to ensure that the interactability was not sacrificed by spendingcomputational power on rendering as , in this thesis, we were comparing our methodwith others. However, if our approach was designated a dedicated tool to evaluate theplausibility of a synthetic scene, better rendering, material, or textures should makepossible the creation of scenes that are as realistic as possible so that subjects couldperceive the 3D scene more accurately.
30
5.2 Future work
5.2.1 Best view
Per our observation, some subjects did not navigate the 3D scene throughout to locate theflaw as we instructed. For developing a tool for the user study, one ought to consider user-friendliness and usability, so one direction for future work would be to integrate a mechanismto display the initial scene from an optimal viewpoint, like the Best View technique [54].By doing this, the subjects would be able to perceive the most salient objects at first glanceand then the results could be more reliable.
5.2.2 Extension to more applications
Our original intention started from resolving the evaluation issues for indoor scene synthe-sis. However, this approach could be extended to the other domains related to computer-generated models, for example, to synthetic 3D shapes or outdoor scenes.
5.2.3 Smart flaw indication
Another interesting direction would be to allow additional actions when the subjects identifya flaw. For example, to display a second level of dropdown menu to delete an object if an userselects the “wrong existence” as its flaw, or to show an option of rotation if an user selects“bad orientation.” Further, the software could display the effect of deletion or rotation tolet the user confirm the result. Such an intelligent algorithm or suggestive function couldcatch what the subjects perceive in more precise way.
5.2.4 Unwanted factors handling
In our first experiment, we intentionally omitted the unwanted factors such as object at-tributes from the menu that displayed to subjects for selecting a flaw. Our purpose was toforce subjects to concentrate on the effect of design choices in [2]. Yet, one possible futurework is to compare the options of excluding or including the unwanted factors. Such a workis to examine a condition that, given an arguable object attribute, for example the objectshape, does exist, if we prohibit subjects’ perception on this attribute by excluding it frommenu, will subjects just throw their perception away or they turn to select other relatedflaw to present their discontents? In other words, it seems worth to research whether amore consistent and reliable evaluation result could be obtained, if we display the unwantedfactors for subjects to select and then lower or discard the weightings of these factors.
31

Bibliography
[1] Rui Ma, Hao Zhang, Akshay Gadi Patil, Matthew Fisher, Manyi Li, Sören Pirk, Binh-Son Hua, Sai-Kit Yeung, Xin Tong, and Leonidas Guibas. Language-driven synthesisof 3D scenes from scene databases. ACM Transactions on Graphics, 37(6):1–16, dec2018.
[2] Manyi Li, Akshay Gadi Patil, Kai Xu, Siddhartha Chaudhuri, Owais Khan, ArielShamir, Changhe Tu, Baoquan Chen, Daniel Cohen Or, Hao Zhang, Daniel Cohen-Or,and Hao Zhang. {GRAINS}: Generative Recursive Autoencoders for INdoor Scenes.ACM Transactions on Graphics, 38(1), 2019.
[3] Lap-Fai Yu, Sai-Kit Yeung, Chi-Keung Tang, Demetri Terzopoulos, Tony F. Chan, andStanley J. Osher. Make it home. ACM Transactions on Graphics, 30(4):1, jul 2011.
[4] Q. Fu, X. Chen, X. Wang, S. Wen, B. Zhou, and H. Fu. Adaptive synthesis of indoorscenes via activity-associated object relation graphs. ACM Transactions on Graphics,36(6), 2017.
[5] Kai Wang, Angel X Chang, Daniel Ritchie, and Manolis Savva. Deep ConvolutionalPriors for Indoor Scene Synthesis. ACM Transactions on Graphics, 37(4):14, 2018.
[6] Paul Merrell, Eric Schkufza, Zeyang Li, Maneesh Agrawala, and Vladlen Koltun. In-teractive furniture layout using interior design guidelines. In ACM SIGGRAPH 2011papers on - SIGGRAPH ’11, page 1, New York, New York, USA, 2011. ACM Press.
[7] Nathan Silberman, Derek Hoiem, Pushmeet Kohli, and Rob Fergus. Indoor Segmen-tation and Support Inference from RGBD Images. In Lecture Notes in ComputerScience (including subseries Lecture Notes in Artificial Intelligence and Lecture Notesin Bioinformatics), volume 7576 LNCS, pages 746–760. 2012.
[8] Angela Dai, Angel X Chang, Manolis Savva, Maciej Halber, Thomas Funkhouser, andMatthias Nießner. ScanNet: Richly-annotated 3D reconstructions of indoor scenes. InProceedings - 30th IEEE Conference on Computer Vision and Pattern Recognition,CVPR 2017, volume 2017-Janua, pages 2432–2443, feb 2017.
[9] Shuran Song, Fisher Yu, Andy Zeng, Angel X. Chang, Manolis Savva, and ThomasFunkhouser. Semantic scene completion from a single depth image. Proceedings - 30thIEEE Conference on Computer Vision and Pattern Recognition, CVPR 2017, 2017-Janua:190–198, 2017.
[10] Yu-Xin Wu, Ralph Martin, Yu-Kun Lai, Kang Chen, and Shi-Min Hu. Automaticsemantic modeling of indoor scenes from low-quality RGB-D data using contextualinformation. ACM Transactions on Graphics, 33(6):1–12, 2014.
32
[11] Matthew Fisher, Manolis Savva, Yangyan Li, Pat Hanrahan, and Matthias Nießner.Activity-centric scene synthesis for functional 3D scene modeling. ACM Transactionson Graphics, 34(6):1–13, 2015.
[12] Jonathan Steuer. Defining Virtual Reality: Dimensions Determining Telepresence.Journal of Communication, 42(4):73–93, dec 1992.
[13] Alan Chalmers, D Howard, and C Moir. Real virtuality: a step change from virtualreality. Proceedings of the 25th Spring Conference on Computer Graphics, 1(212):9–16,2009.
[14] A. Kobayashi, Chang Song, L.F. Hodges, H.Q. Dinh, and N. Walker. Evaluating theimportance of multi-sensory input on memory and the sense of presence in virtualenvironments. Proceedings IEEE Virtual Reality (Cat. No. 99CB36316), pages 222–228, 2003.
[15] Claudia Hendrix and Barfield Woodrow. Environments as a Function of Visual DisplayParameters. Presence, 5(3):274–289, 1996.
[16] Woodrow Barfield and Claudia Hendrix. The effect of update rate on the sense ofpresence within virtual environments. Virtual Reality, 1(1):3–15, 1995.
[17] James A. Ferwerda. Three varieties of realism in computer graphics. Proceedings SPIEHuman Vision and Electronic . . . , SPIE 5007(2003):290–297, 2003.
[18] Wikipedia Contributors. Applications of virtual reality, 2019.
[19] Rui Ma. Analysis and Modeling of 3D Indoor Scenes. pages 1–34, jun 2017.
[20] 3D Warehouse. 3D Warehouse, 2019.
[21] Angel X. Chang, Thomas Funkhouser, Leonidas Guibas, Pat Hanrahan, Qixing Huang,Zimo Li, Silvio Savarese, Manolis Savva, Shuran Song, Hao Su, Jianxiong Xiao, Li Yi,and Fisher Yu. ShapeNet: An Information-Rich 3D Model Repository. SIGGRAPHASIA 2016 Posters on - SA ’16, pages 1–2, dec 2015.
[22] Richard A. Newcombe, Shahram Izadi, Otmar Hilliges, David Molyneaux, DavidKim, Andrew J. Davison, Pushmeet Kohli, Jamie Shotton, Steve Hodges, and An-drew Fitzgibbon. KinectFusion: Real-time dense surface mapping and tracking. 201110th IEEE International Symposium on Mixed and Augmented Reality, ISMAR 2011,45(2):127–136, feb 2011.
[23] Matthew Fisher and Pat Hanrahan. Context-based search for 3D models. ACM Trans-actions on Graphics, 29(6):1, 2010.
[24] Manolis Savva, Angel X. Chang, and Maneesh Agrawala. SceneSuggest: Context-driven3D Scene Design. feb 2017.
[25] Lap Fai Yu, Sai Kit Yeung, and Demetri Terzopoulos. The clutterpalette: An interactivetool for detailing indoor scenes. IEEE Transactions on Visualization and ComputerGraphics, 22(2):1138–1148, 2016.
33
[26] T. Germer and M. Schwarz. Procedural arrangement of furniture for real-time walk-throughs. Computer Graphics Forum, 28(8):2068–2078, 2009.
[27] Peter Kán and Hannes Kaufmann. Automatic Furniture Arrangement Using GreedyCost Minimization. In IEEE Conference on Virtual Reality and 3D User Interfaces(IEEE VR), pages 1–8, 2018.
[28] Kun Xu, Kang Chen, Hongbo Fu, Wei-Lun Sun, and Shi-Min Hu. Sketch2Scene: sketch-based co-retrieval and co-placement of 3D models. ACM Transactions on Graphics(TOG), 32(4):123, 2013.
[29] Hamid Izadinia and Steven M Seitz. Im2Cad. 2017 IEEE Conference on ComputerVision and Pattern Recognition (CVPR), pages 5134–5143, 2017.
[30] Tianqiang Liu, Aaron Hertzmann, Wilmot Li, and Thomas Funkhouser. Style Com-patibility for 3D Furniture Models. ACM Trans. Graph. (SIGGRAPH), 34(4):1–9,2015.
[31] Siyuan Huang, Siyuan Qi, Yixin Zhu, Yinxue Xiao, Yuanlu Xu, and Song-Chun ChunZhu. Holistic 3D Scene Parsing and Reconstruction from a Single RGB Image. InThe European Conference on Computer Vision (ECCV), volume 11211 LNCS, pages194–211, sep 2018.
[32] Angel Chang, Will Monroe, Manolis Savva, Christopher Potts, and Christopher D.Manning. Text to 3D Scene Generation with Rich Lexical Grounding. may 2015.
[33] Angel X Chang, Mihail Eric, Manolis Savva, and Christopher D Manning. SceneSeer:3D Scene Design with Natural Language. CoRR, pages 1–10, feb 2017.
[34] Angel X Chang, Manolis Savva, and Christopher D Manning. Learning Spatial Knowl-edge for Text to 3D Scene Generation. Proceedings of the 2014 Conference on EmpiricalMethods in Natural Language Processing (EMNLP 2014), pages 2028–2038, 2014.
[35] Matthew Fisher, Daniel Ritchie, Manolis Savva, Thomas Funkhouser, and Pat Han-rahan. Example-based synthesis of 3D object arrangements. ACM Transactions onGraphics, 31(6):1, nov 2012.
[36] Lucas Majerowicz, Ariel Shamir, Alla Sheffer, and Holger H. Hoos. Filling your shelves:Synthesizing diverse style-preserving artifact arrangements. IEEE Transactions onVisualization and Computer Graphics, 20(11):1507–1518, 2014.
[37] Z. Sadeghipour Kermani, Z. Liao, P. Tan, and H. Zhang. Learning 3D scene synthesisfrom annotated RGB-D images. Eurographics Symposium on Geometry Processing,35(5):197–206, 2016.
[38] Rui Ma, Honghua Li, Changqing Zou, Zicheng Liao, Xin Tong, and Hao Zhang. Action-driven 3D indoor scene evolution. ACM Transactions on Graphics, 35(6):1–13, 2016.
[39] Siyuan Qi, Yixin Zhu, Siyuan Huang, Chenfanfu Jiang, and Song-Chun Zhu. Human-centric Indoor Scene Synthesis Using Stochastic Grammar. Conference on ComputerVision and Pattern Recognition (CVPR), 2018.
34
[40] Manolis Savva, Angel X. Chang, Pat Hanrahan, Matthew Fisher, and MatthiasNießner. SceneGrok: Inferring Action Maps in 3D Environments. ACM Transactionson Graphics, 33(6):212:1—-212:10, 2014.
[41] Manolis Savva, Angel X Chang, Pat Hanrahan, Matthew Fisher, and Matthias Nießner.PiGraphs: Learning Interaction Snapshots from Observations. ACM Trans. Graph.Article, 35(12):971–978, 2016.
[42] Zaiwei Zhang, Zhenpei Yang, Chongyang Ma, Linjie Luo, Alexander Huth, EtienneVouga, and Qixing Huang. Deep Generative Modeling for Scene Synthesis via HybridRepresentations. ACM Trans. Graph, 37(6):18, aug 2018.
[43] Alistair Sutcliffe and Brian Gault. Heuristic evaluation of virtual reality applications.Interacting with Computers, 16(4):831–849, 2004.
[44] S. Livatino and C. Koffel. Handbook for Evaluation Studies in Virtual Reality. In2007 IEEE Symposium on Virtual Environments, Human-Computer Interfaces andMeasurement Systems, number June, pages 1–6. IEEE, jun 2007.
[45] B Sousa Santos, P Dias, S Silva, L Capucho, N Salgado, F Lino, V Carvalho, andC Ferreira. Usability Evaluation in Virtual Reality: A User Study Comparing ThreeDifferent Setups. Virtual Reality, 2008.
[46] Cedric Bach and Dominique L. Scapin. Comparing inspections and user testing forthe evaluation of virtual environments. International Journal of Human-ComputerInteraction, 26(8):786–824, 2010.
[47] Robert Kosara, C.G. Healey, V. Interrante, D.H. Laidlaw, and Colin Ware. User studies:why, how, and when? IEEE Computer Graphics and Applications, 23(4):20–25, jul 2003.
[48] Mary A Peterson and Gillian Rhodes. Perception of faces, objects, and scenes: Analyticand holistic processes. Oxford University Press, 2003.
[49] Peter E. Rossi, Zvi Gilula, and Greg M. Allenby. Overcoming scale usage heterogeneity:A bayesian hierarchical approach. Journal of the American Statistical Association,96(453):20–31, 2001.
[50] Wikipedia Contributors. Attentional control, 2019.
[51] Yeji Shen and Tingting Jiang. Ranking Consistent Rate: New evaluation criterionon pairwise subjective experiments. Proceedings - International Conference on ImageProcessing, ICIP, 2016-Augus:2077–2081, 2016.
[52] Qi Shan, Riley Adams, Brian Curless, Yasutaka Furukawa, and Steven M. Seitz. Thevisual turing test for scene reconstruction. Proceedings - 2013 International Conferenceon 3D Vision, 3DV 2013, pages 25–32, 2013.
[53] Richard Zhang, Phillip Isola, and Alexei A Efros. Colorful image colorization. InBastian Leibe, Jiri Matas, Nicu Sebe, and Max Welling, editors, European conferenceon computer vision, volume 319 of Lecture Notes in Computer Science, pages 649–666,Cham, aug 2016. Springer, Springer International Publishing.
35

[54] Michela Mortara and Michela Spagnuolo. Semantics-driven best view of 3D shapes.Computers and Graphics (Pergamon), 33(3):280–290, 2009.
36
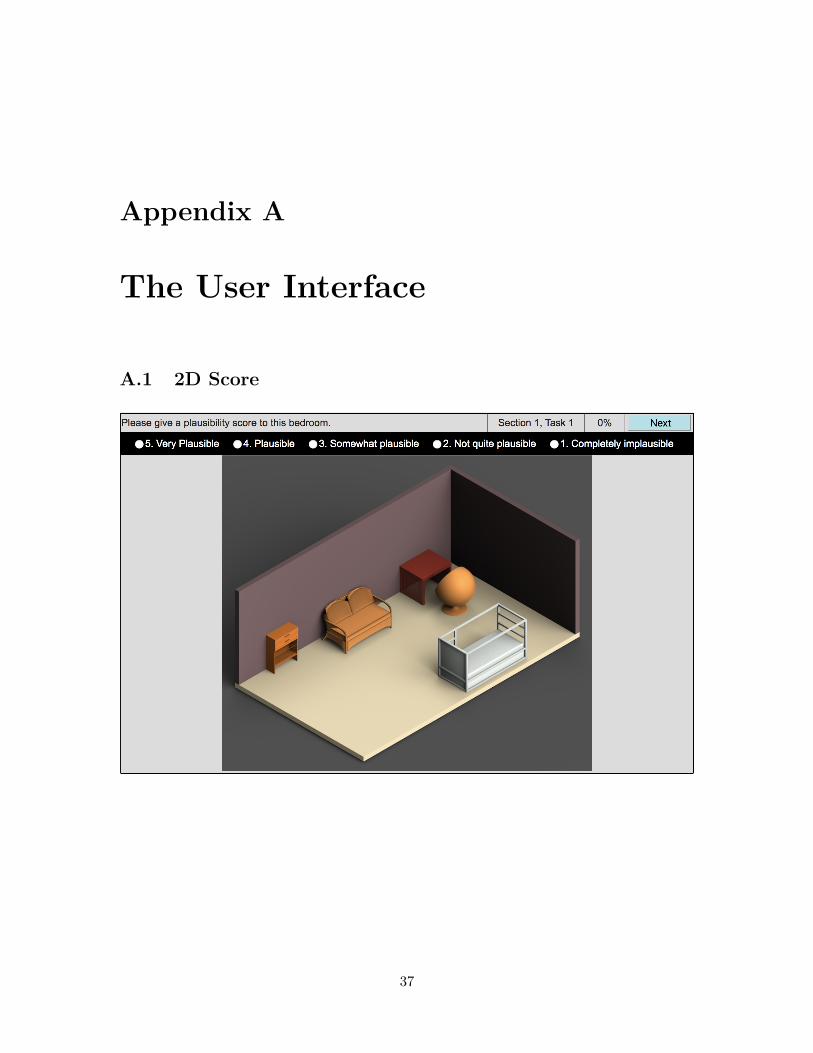
Appendix A
The User Interface
A.1 2D Score
37
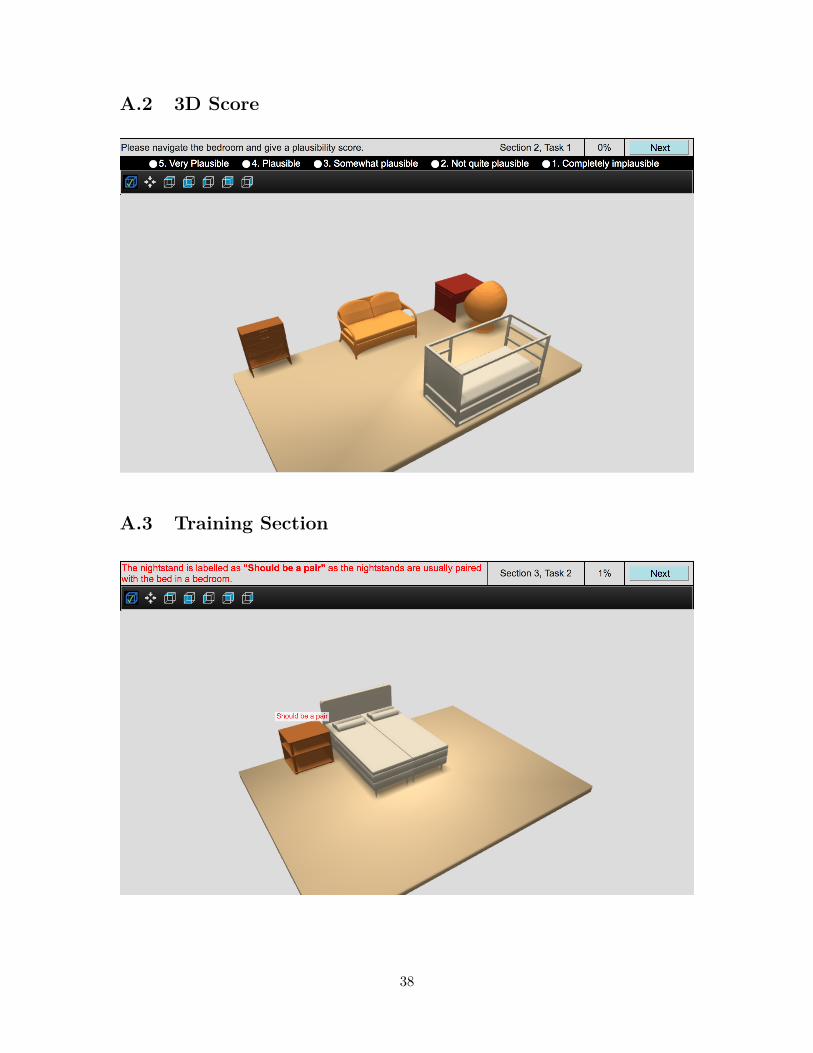
A.2 3D Score
A.3 Training Section
38
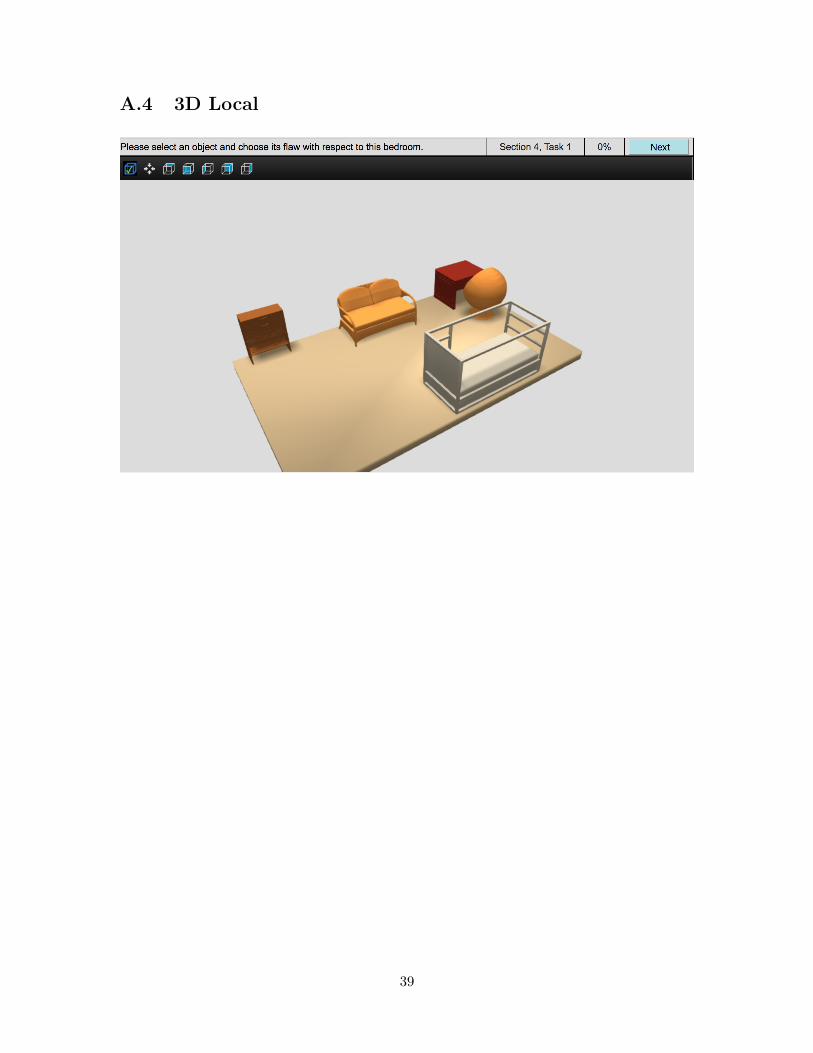
A.4 3D Local
39
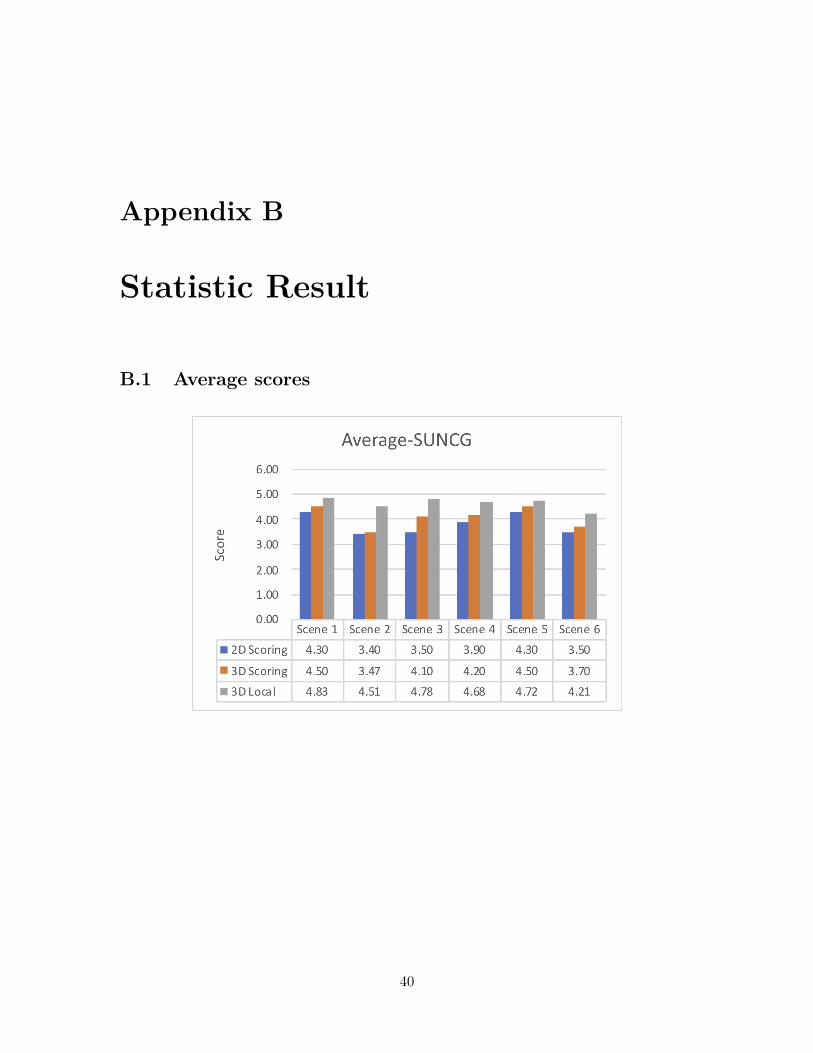
Appendix B
Statistic Result
B.1 Average scores
40
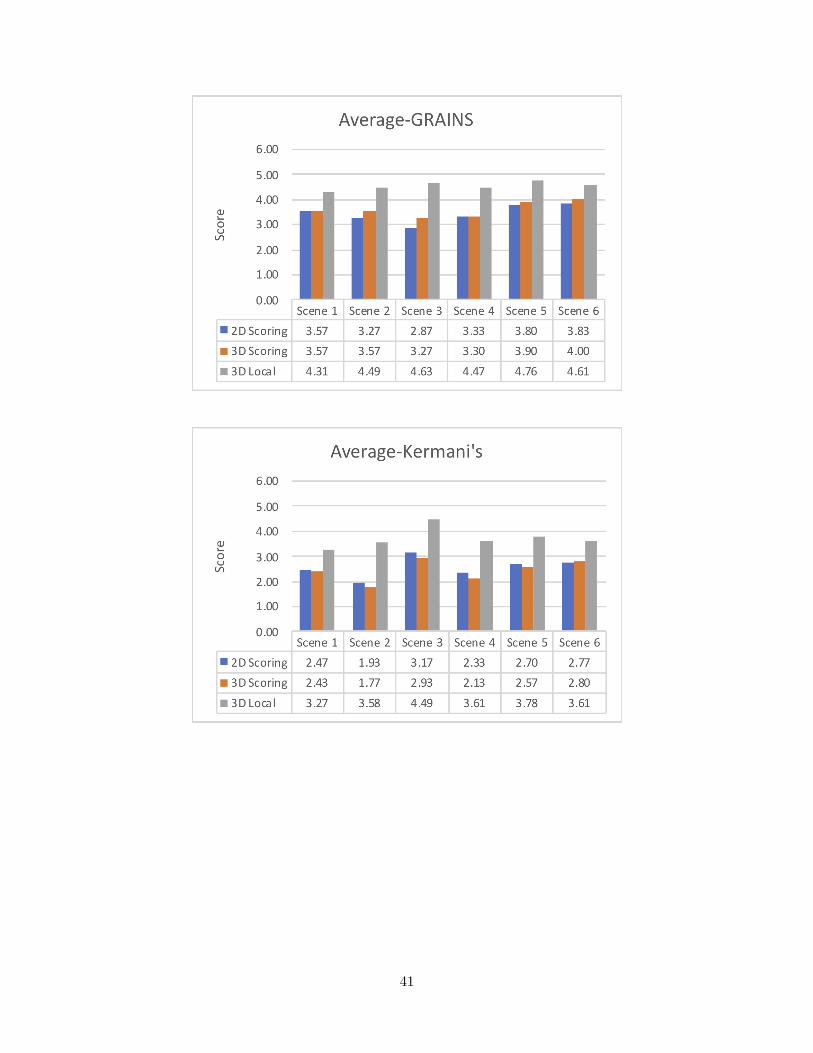
41
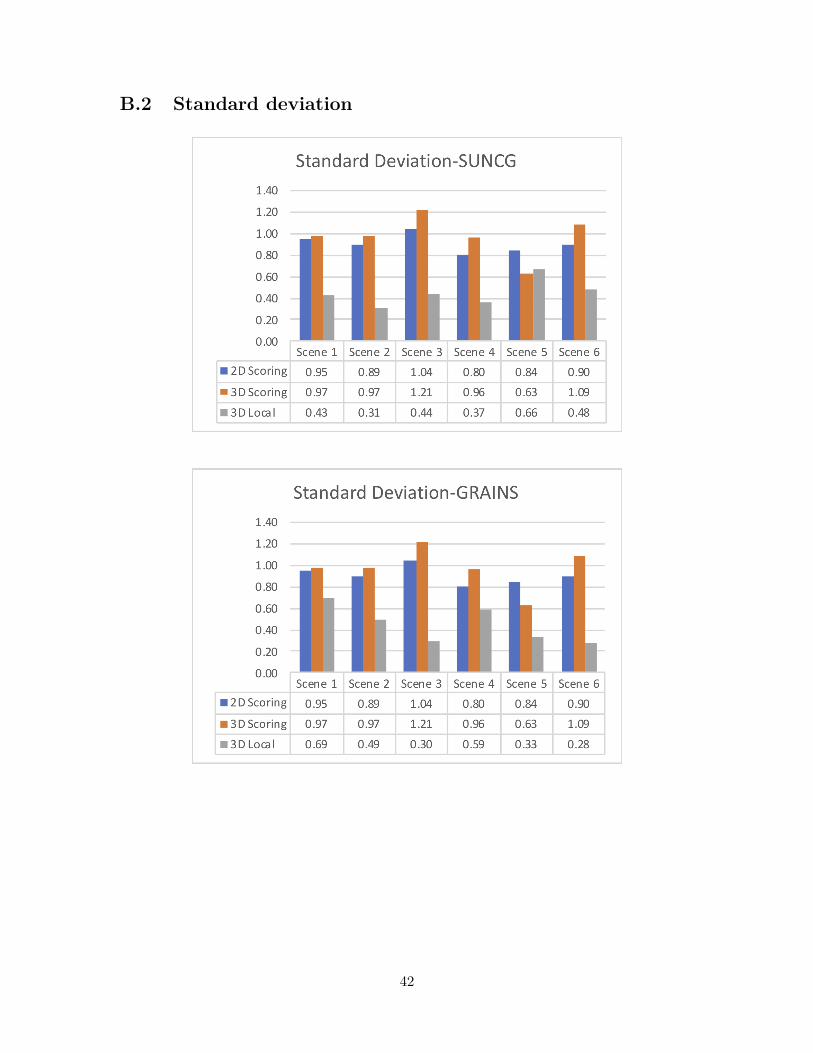
B.2 Standard deviation
42
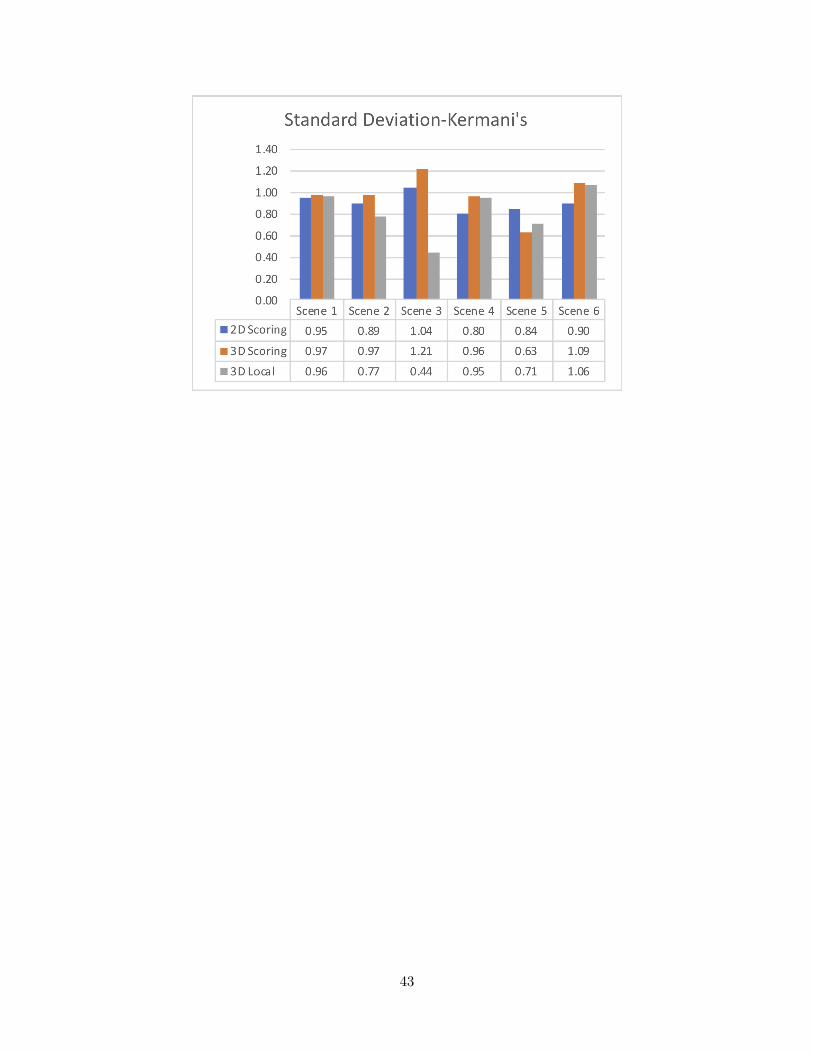
43

B.3 Number of flawed objects identified
44