A Protocol for Characterizing the Impact of Collateral Flow after Distal Middle Cerebral Artery...
25
A protocol for characterizing the impact of collateral flow after distal middle cerebral artery occlusion R. Anthony DeFazio 1 , Sean Levy 1 , Carmen L. Morales 1 , Rebecca V. Levy 1 , Kunjan R. Dave 1 , Hung W. Lin 1 , Tatjana Abaffy 2 , Brant D. Watson 1 , Miguel A. Perez-Pinzon 1 , and Victoria Ohanna 1 1 Cerebral Vascular Disease Research Center, Department of Neurology, Miller School of Medicine, University of Miami, Miami, FL 33136 2 Department of Molecular and Cellular Pharmacology, University of Miami, Miami, FL 33136 I. SUMMARY In humans and in animal models of stroke, collateral blood flow between territories of the major pial arteries has a profound impact on cortical infarct size. However, there is a gap in our understanding of the genetic determinants of collateral formation and flow, as well as the signaling pathways and neurovascular interactions regulating this flow. Previous studies have demonstrated that collateral flow between branches of the anterior cerebral artery (ACA) and the middle cerebral artery (MCA) can protect mouse cortex from infarction after middle cerebral artery occlusion. Because the number and diameter of collaterals varies among mouse strains and after transgenic manipulations, a combination of methods is required to control for these variations. Here, we report an inexpensive approach to characterizing the cerebrovascular anatomy, and in vivo monitoring of cerebral blood flow as well. Further, we introduce a new, minimally invasive method for the occlusion of distal MCA branches. These methods will permit a new generation of studies on the mechanisms regulating collateral remodeling and cortical blood flow after stroke. II. KEYWORDS Photothrombosis; anastomoses; collateral blood flow; quantum dots; vessel painting; laser speckle imaging III. INTRODUCTION Tissue plasminogen activator (tPA) and mechanical interventions (e.g., the Merci retriever) are front-line treatments for acute stroke in the clinic. However, many patients cannot receive tPA owing to risk for hemorrhagic stroke and other factors, and mechanical interventions cannot access all clots. Thus, additional approaches to the treatment of stroke are urgently needed. Collateral flow enhancement represents a major therapeutic target [1], yet little is known about the factors that regulate collateral flow under physiological or pathophysiological conditions. Using vascular casting, previous studies have demonstrated vascular remodeling and collateral flow after stroke [2]. In terms of basic cerebral vascular anatomy, Majid et al were among the first to recognize the variability of ischemic injury after focal ischemia among common mouse strains [3]. Keum and Marchuk demonstrated wide variation among mouse strains in cortical infarct volume after distal middle cerebral artery (MCA) occlusion using electrocautery and transection of the distal MCA trunk [4]. Based on these initial findings, a series of careful and comprehensive publications from Faber’s group have demonstrated a direct relationship between collateral vessel number and diameter on cortical infarct volume after distal MCA NIH Public Access Author Manuscript Transl Stroke Res. Author manuscript; available in PMC 2011 May 16. Published in final edited form as: Transl Stroke Res. 2011 March ; 2(1): 112–127. doi:10.1007/s12975-010-0044-2. NIH-PA Author Manuscript NIH-PA Author Manuscript NIH-PA Author Manuscript
-
Upload
independent -
Category
Documents
-
view
2 -
download
0
Transcript of A Protocol for Characterizing the Impact of Collateral Flow after Distal Middle Cerebral Artery...
A protocol for characterizing the impact of collateral flow afterdistal middle cerebral artery occlusion
R. Anthony DeFazio1, Sean Levy1, Carmen L. Morales1, Rebecca V. Levy1, Kunjan R. Dave1,Hung W. Lin1, Tatjana Abaffy2, Brant D. Watson1, Miguel A. Perez-Pinzon1, and VictoriaOhanna1
1 Cerebral Vascular Disease Research Center, Department of Neurology, Miller School of Medicine,University of Miami, Miami, FL 331362 Department of Molecular and Cellular Pharmacology, University of Miami, Miami, FL 33136
I. SUMMARYIn humans and in animal models of stroke, collateral blood flow between territories of the major pialarteries has a profound impact on cortical infarct size. However, there is a gap in our understandingof the genetic determinants of collateral formation and flow, as well as the signaling pathways andneurovascular interactions regulating this flow. Previous studies have demonstrated that collateralflow between branches of the anterior cerebral artery (ACA) and the middle cerebral artery (MCA)can protect mouse cortex from infarction after middle cerebral artery occlusion. Because the numberand diameter of collaterals varies among mouse strains and after transgenic manipulations, acombination of methods is required to control for these variations. Here, we report an inexpensiveapproach to characterizing the cerebrovascular anatomy, and in vivo monitoring of cerebral bloodflow as well. Further, we introduce a new, minimally invasive method for the occlusion of distalMCA branches. These methods will permit a new generation of studies on the mechanisms regulatingcollateral remodeling and cortical blood flow after stroke.
II. KEYWORDSPhotothrombosis; anastomoses; collateral blood flow; quantum dots; vessel painting; laser speckleimaging
III. INTRODUCTIONTissue plasminogen activator (tPA) and mechanical interventions (e.g., the Merci retriever)are front-line treatments for acute stroke in the clinic. However, many patients cannot receivetPA owing to risk for hemorrhagic stroke and other factors, and mechanical interventionscannot access all clots. Thus, additional approaches to the treatment of stroke are urgentlyneeded. Collateral flow enhancement represents a major therapeutic target [1], yet little isknown about the factors that regulate collateral flow under physiological or pathophysiologicalconditions.
Using vascular casting, previous studies have demonstrated vascular remodeling and collateralflow after stroke [2]. In terms of basic cerebral vascular anatomy, Majid et al were among thefirst to recognize the variability of ischemic injury after focal ischemia among common mousestrains [3]. Keum and Marchuk demonstrated wide variation among mouse strains in corticalinfarct volume after distal middle cerebral artery (MCA) occlusion using electrocautery andtransection of the distal MCA trunk [4]. Based on these initial findings, a series of careful andcomprehensive publications from Faber’s group have demonstrated a direct relationshipbetween collateral vessel number and diameter on cortical infarct volume after distal MCA
NIH Public AccessAuthor ManuscriptTransl Stroke Res. Author manuscript; available in PMC 2011 May 16.
Published in final edited form as:Transl Stroke Res. 2011 March ; 2(1): 112–127. doi:10.1007/s12975-010-0044-2.
NIH
-PA Author Manuscript
NIH
-PA Author Manuscript
NIH
-PA Author Manuscript

occlusion [5–9]. The stage has thus been set for direct manipulations of the collateral systemvia preconditioning and/or transgenic strategies (e.g. [7]), as well as post-strokepharmacological approaches. This protocol paper describes the tools necessary to move thefield forward with a relatively simple and inexpensive approach combining a rapid, cost-effective assay for cerebrovascular (i.e., pial vessel) structure, procedures for laser specklecontrast imaging of cerebral blood flow, and a minimally invasive stroke model compatiblewith adult and aged mice.
IV. MATERIALSAddresses for companies are provided at the first instance.
Vessel painting (necessary additional details are provided in [10])DiI [1,1′-dioctadecyl-3,3,3′,3′-tetramethylindocarbocyanine perchlorate] (product D-282,Invitrogen; Carlsbad, California).
Two 50 mL centrifuge tubes (VWR, West Chester, Pennsylvania)
PE-50 tubing (Intramedic, Becton Dickinson Company, Sparks, Maryland)
Pressure gauge from blood pressure cuff (available at local drug store)
Pressurized air tank (a 1-2L empty plastic bottle with air tight cap will suffice)
27 gauge Luer stub (beveled at 45° for cardiac insertion)
Syringe pump (Harvard Apparatus, Holliston, Massachusetts).
Please refer to the primary reference for details regarding the preparation of the DiI sucrosesolution and other materials [10].
Standard fluorescence microscope with 4–5× objective compatible with fluorescence, atetramethylrhodamine excitation/emission filter set, a digital camera for imaging, and imageacquisition software.
Dual femoral artery and vein cathetersMicroRenathane® tubing (MRE-025, Braintree Scientific, Braintree, Massachusetts)
1 cc syringes (Becton Dickinson Company)
Luer stub tubing adapter (27 gauge, Becton Dickinson Company)
100 uL Hamilton Syringe, model 710LT, 80601 (Hamilton Company, Reno, Nevada).
Surgical tools: 2 #7 curved forceps (Roboz INOX), iridectomy scissors (part 15000–03, FineScience Tools, Foster City, California), tool sterilizer (“Bactizapper”, VWR)
0.9% sodium chloride for injection (Hospira, Lake Forest, Illinois)
Heparin, sodium injection, 1000 USP units/ml (APP Pharmaceuticals, Schaumburg, Illinois)
Note: To make heparinized saline: combine sodium chloride for injection with heparin, 1 USPunit/ml.
1% lidocaine HCl (Hospira, Lake Forest, Illinois)
DeFazio et al. Page 2
Transl Stroke Res. Author manuscript; available in PMC 2011 May 16.
NIH
-PA Author Manuscript
NIH
-PA Author Manuscript
NIH
-PA Author Manuscript
Betadine topical disinfectant (VWR)
7-0 black braided silk suture, non-absorbable (code 103-S, Deknatel, Research Triangle Park,North Carolina).
Microvessel clip: S&T vascular clamp, 3.5mm × 1mm jaw, 7mm long (part number 00396-01,Fine Science Tools).
Animal handling equipment and suppliesMouse temperature control and warming pad (part numbers: 21060-90 8×11cm heating pad;21052-00 Temperature controller; 21051-00 Power supply; 21060-01 rectal probe, all fromFine Science Tools).
Brain temperature controller: thermoregulatory lamp system (custom system similar to modelTCAT-2AC, Braintree Scientific) with needle temperature probe in ipsilateral temporalismuscle and ceramic heat element (Repticare 100W ceramic emitter, Zoo Med, San Luis Obispo,California).
Anesthesia system: Ohio isoflurane vaporizer (OHIO-100, Parkland Scientific, Coral Springs,Florida); vacuum recapture system (Fluovac and Fluosorber, Harvard Apparatus); stereotaxicframe with integrated tooth bar and anesthesia delivery; surgical microscope with 40×magnification and 20× eye pieces (Carl Zeiss Microimaging, Thornwood, New York).Anesthesia induction box (AB-1, Braintree Scientific). Oxygen and nitrous oxide gas tanks(Airgas) and manifold (Parkland Scientific).
Arterial blood pressure monitoring: transducer (BP-100, iWorx, Dover, New Hampshire),amplifier (Bridge Bio amplifier, ETH-255, CB Sciences, Dover, New Hampshire), digitizer(MiniDigi, Molecular Devices, Sunnyvale, California) and acquisition software (Axoscope,Molecular Devices).
Small animal shaver (model 32375, Braintree Scientific)
Microdrill (MD-1200, Braintree Scientific)
AKWA Tears, lubricant opthalamic ointment (Akorn, Buffalo Grove, Illinois).
Mineral oil (sterilized with a 0.4 μm pore size polycarbonate membrane filter)
Cotton-tipped applicators (VWR)
Bioadhesive (Vetbond, 3M, St. Paul, Minnesota)
Local anesthetic (Xylocaine, APP Pharmaceuticals)
Buprenorphine (0.05 mg/kg BID, controlled substance available from the institutional Divisionof Veterinary Resources)
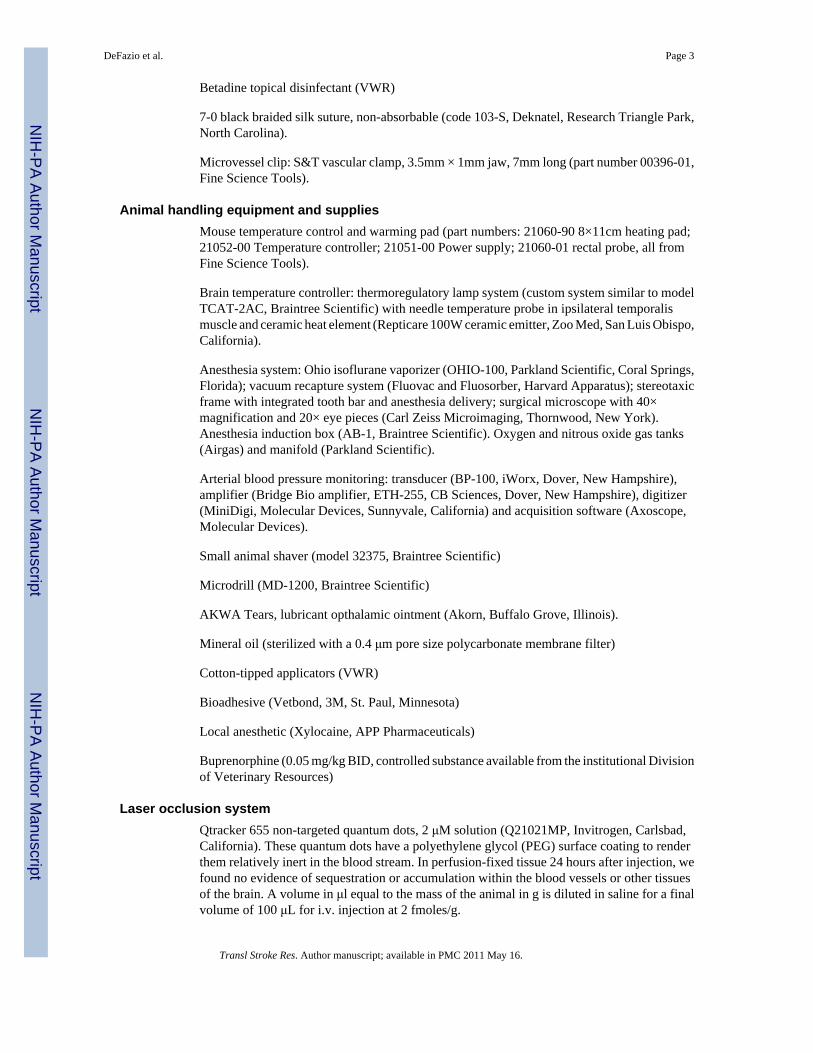
Laser occlusion systemQtracker 655 non-targeted quantum dots, 2 μM solution (Q21021MP, Invitrogen, Carlsbad,California). These quantum dots have a polyethylene glycol (PEG) surface coating to renderthem relatively inert in the blood stream. In perfusion-fixed tissue 24 hours after injection, wefound no evidence of sequestration or accumulation within the blood vessels or other tissuesof the brain. A volume in μl equal to the mass of the animal in g is diluted in saline for a finalvolume of 100 μL for i.v. injection at 2 fmoles/g.
DeFazio et al. Page 3
Transl Stroke Res. Author manuscript; available in PMC 2011 May 16.
NIH
-PA Author Manuscript
NIH
-PA Author Manuscript
NIH
-PA Author Manuscript
A750 mm optical rail is mounted on the stereotaxic frame at a 13° angle from vertical to ensurethat the beam of the laser(mounted at the distal end of the rail) is approximately perpendicularto the skull surface overlying the cortical region of interest. The following items are listed inorder of their mounting on the optical rail (farthest from the animal first):
Continuous wave (CW) diode-pumped Nd:YAG solid-state laser (DPSS) with 100 mW outputpower emitted at the frequency-doubled wavelength of 532 nm, with analog and digitalmodulation, 2mm output beam diameter (model LS-532-00100-CWM-SD-05-OEM-0, OEMLaser Systems, East Lansing, Michigan). The laser power is controlled via analog modulationcircuitry. Use the laser power meter to determine the analog voltages to obtain 200μW, 5 mW,and 40 mW.
Uniblitz Shutter (model LS-6, Vincent Associates, Rochester, New York) and shutter controllerSD-10 (current model: VMM-T1, Vincent Associates).
10× laser beam expander (model 50-25-10×-532, Special Optics, Wharton, New Jersey)
Cylindrical lenses, 250 mm focal length(2× part number LJ1267RM-A, Thorlabs, Newton,New Jersey), rotational mounts (2× CRM1 mounted on four rods on the PRM1 rotation mount,Thorlabs) and mounting components for optical rail(Thorlabs).
Beam positioner: In-line positioner (part number 12-4015-20-532, Special Optics; a Risleyprism pair is also commercially available, model 12-2002-532, Special Optics).
750 mm optical rail for mounting laser (CVI-Melles Griot, Albuquerque, NM), opticalmounting components (Thorlabs).
A handheld laser power meter is crucial for these experiments (LaserCheck, Coherent, SantaClara, California).
580 nm long pass filter for visualizing quantum dot emission (BLP01-561R-25, Semrock,Rochester, New York).
Laser speckle contrast imaging systemQICAM-IR Fast 1394 firewire infrared-sensitive camera (QImaging, Surrey, BritishColumbia, Canada). The Rolera-XR is the current replacement; however, an inexpensiveanalog camera with IR sensitivity can also produce effective laser speckle images using a videoframe grabber). Mounting rod and adjustable clamp (Thorlabs). We use Image Pro Plus (v5.1,Media Cybernetics, Bethesda, Maryland) for image acquisition via the computer’s firewireport. Acquisition computer: Dell 530s with 4Gb RAM, 500Gb hard disk, Intel E8400 (3.0GHz)processor, firewire card.
Zoom lens assembly: 6.5× Zoom (model 1-6265), 1.0× Standard Adapter (1-6015), 0.5× LensAttachment (1-60110) and C-mount Coupler (1-6010). All components based on the Zoom6000 system (Navitar, Rochester, NY). A band pass filter at 785 nm is used to reject room lightand other artifacts (part number 785/62, Semrock).
Diode laser at 785 nm, Sanyo model DL7140-201S (Thorlabs) and a laser diode controller (e.g.LDC201CU, Thorlabs; however, a simple laser diode controller can be assembled for under$200. A wiring diagram and parts list are available from the corresponding author); focusinglens from fiber optic light source; mounting rod and adjustable clamp
DeFazio et al. Page 4
Transl Stroke Res. Author manuscript; available in PMC 2011 May 16.
NIH
-PA Author Manuscript
NIH
-PA Author Manuscript
NIH
-PA Author Manuscript
All devices are mounted on rods attached to the main plate of the stereotaxic device. Dependingon the magnitude of floor vibrations, it may be necessary to use vibration isolation pads (e.g.part #0205050, Sorbothane, Kent, Ohio).
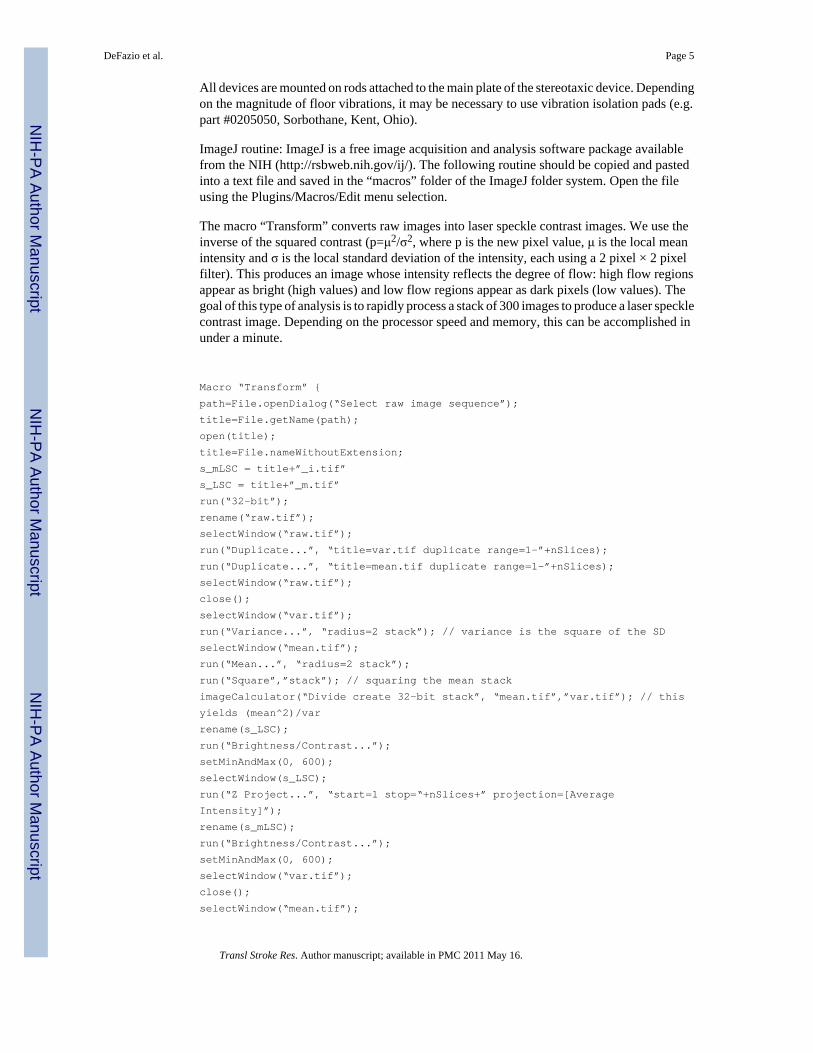
ImageJ routine: ImageJ is a free image acquisition and analysis software package availablefrom the NIH (http://rsbweb.nih.gov/ij/). The following routine should be copied and pastedinto a text file and saved in the “macros” folder of the ImageJ folder system. Open the fileusing the Plugins/Macros/Edit menu selection.
The macro “Transform” converts raw images into laser speckle contrast images. We use theinverse of the squared contrast (p=μ2/σ2, where p is the new pixel value, μ is the local meanintensity and σ is the local standard deviation of the intensity, each using a 2 pixel × 2 pixelfilter). This produces an image whose intensity reflects the degree of flow: high flow regionsappear as bright (high values) and low flow regions appear as dark pixels (low values). Thegoal of this type of analysis is to rapidly process a stack of 300 images to produce a laser specklecontrast image. Depending on the processor speed and memory, this can be accomplished inunder a minute.
Macro “Transform” {path=File.openDialog(“Select raw image sequence”);title=File.getName(path);open(title);title=File.nameWithoutExtension;s_mLSC = title+”_i.tif”s_LSC = title+”_m.tif”run(“32-bit”);rename(“raw.tif”);selectWindow(“raw.tif”);run(“Duplicate...”, “title=var.tif duplicate range=1-”+nSlices);run(“Duplicate...”, “title=mean.tif duplicate range=1-”+nSlices);selectWindow(“raw.tif”);close();selectWindow(“var.tif”);run(“Variance...”, “radius=2 stack”); // variance is the square of the SDselectWindow(“mean.tif”);run(“Mean...”, “radius=2 stack”);run(“Square”,”stack”); // squaring the mean stackimageCalculator(“Divide create 32-bit stack”, “mean.tif”,”var.tif”); // this yields (mean^2)/varrename(s_LSC);run(“Brightness/Contrast...”);setMinAndMax(0, 600);selectWindow(s_LSC);run(“Z Project...”, “start=1 stop=“+nSlices+” projection=[Average Intensity]”);rename(s_mLSC);run(“Brightness/Contrast...”);setMinAndMax(0, 600);selectWindow(“var.tif”);close();selectWindow(“mean.tif”);
DeFazio et al. Page 5
Transl Stroke Res. Author manuscript; available in PMC 2011 May 16.
NIH
-PA Author Manuscript
NIH
-PA Author Manuscript
NIH
-PA Author Manuscript

close();selectWindow(s_mLSC);saveAs(“tiff”);}
The macro “percent_difference” can be used to calculate the percent change relative to abaseline image. The utility of this macro requires that the images be precisely registered.Misalignment renders the images unusable. We use this routine to visualize acute changes inblood flow (baseline and the acute phase after occlusion, ~1 hour). It is very difficult to realignimages for comparison at 24 hours.
macro “percent_difference” {requires(“1.34m”);title = “percent_difference”;//Open relevant filesbase=File.openDialog(“Selectbaseline”);post=File.openDialog(“Selectpost-lesionfile”);base=File.getName(base);post=File.getName(post);open(base);open(post);//calculate the differenceimageCalculator(“Subtract create 32-bit”, post, base);rename(“difference.tif”);//divide difference by the baseline imageimageCalculator(“Divide create 32-bit”, “difference.tif”, base);//emphasize relative decreasessetMinAndMax(−1,0);//use color lut “fire” to displayrun(“Fire”);//close unnecessary windowsselectWindow(base);close();selectWindow(post);close();selectWindow(“difference.tif”);close();//save imagerename(“pdiff -” + base + “ -” + post + “.tif”);saveAs(“tiff”);}
V. METHODSAll procedures with animals must be approved by the local Animal Care and Use Committee(ACUC). These procedures were approved by the University of Miami IACUC. Your localACUC may require modifications to these procedures.
Vessel paintingThe vessel painting protocol enables rapid visualization of the architecture of pial arteries. Thisallows the characterization of the impact of transgenic or pharmacological pretreatments on
DeFazio et al. Page 6
Transl Stroke Res. Author manuscript; available in PMC 2011 May 16.
NIH
-PA Author Manuscript
NIH
-PA Author Manuscript
NIH
-PA Author Manuscript
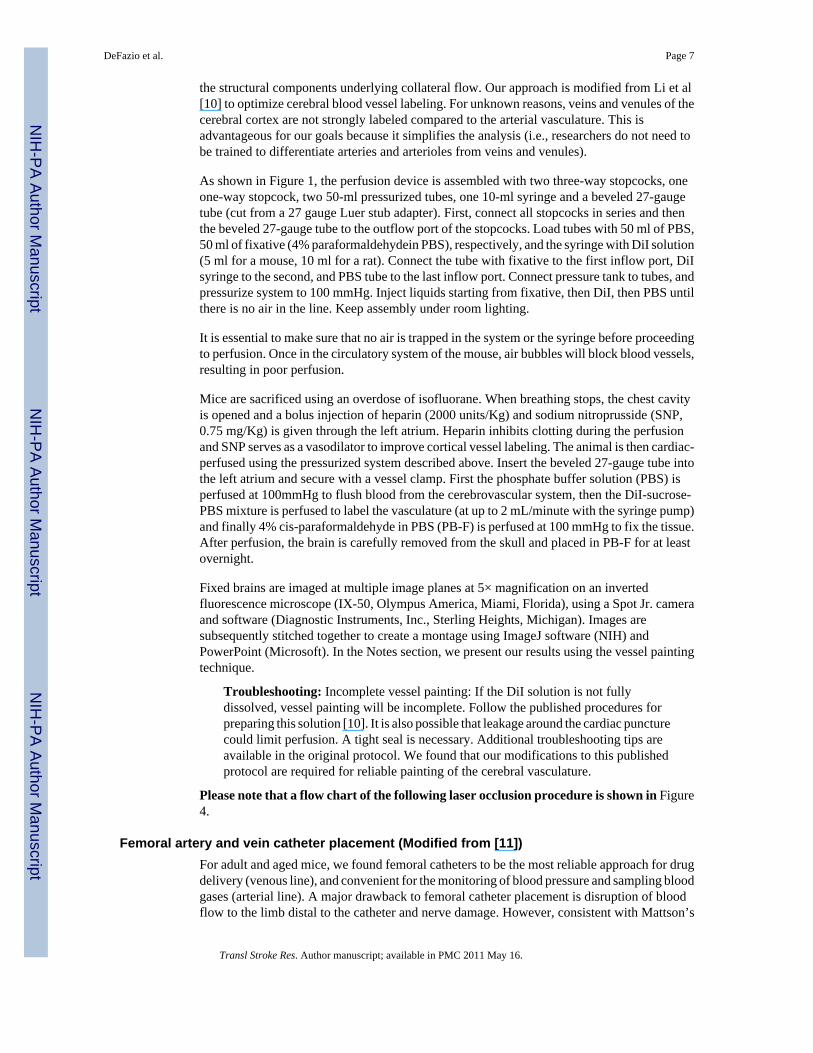
the structural components underlying collateral flow. Our approach is modified from Li et al[10] to optimize cerebral blood vessel labeling. For unknown reasons, veins and venules of thecerebral cortex are not strongly labeled compared to the arterial vasculature. This isadvantageous for our goals because it simplifies the analysis (i.e., researchers do not need tobe trained to differentiate arteries and arterioles from veins and venules).
As shown in Figure 1, the perfusion device is assembled with two three-way stopcocks, oneone-way stopcock, two 50-ml pressurized tubes, one 10-ml syringe and a beveled 27-gaugetube (cut from a 27 gauge Luer stub adapter). First, connect all stopcocks in series and thenthe beveled 27-gauge tube to the outflow port of the stopcocks. Load tubes with 50 ml of PBS,50 ml of fixative (4% paraformaldehydein PBS), respectively, and the syringe with DiI solution(5 ml for a mouse, 10 ml for a rat). Connect the tube with fixative to the first inflow port, DiIsyringe to the second, and PBS tube to the last inflow port. Connect pressure tank to tubes, andpressurize system to 100 mmHg. Inject liquids starting from fixative, then DiI, then PBS untilthere is no air in the line. Keep assembly under room lighting.
It is essential to make sure that no air is trapped in the system or the syringe before proceedingto perfusion. Once in the circulatory system of the mouse, air bubbles will block blood vessels,resulting in poor perfusion.
Mice are sacrificed using an overdose of isofluorane. When breathing stops, the chest cavityis opened and a bolus injection of heparin (2000 units/Kg) and sodium nitroprusside (SNP,0.75 mg/Kg) is given through the left atrium. Heparin inhibits clotting during the perfusionand SNP serves as a vasodilator to improve cortical vessel labeling. The animal is then cardiac-perfused using the pressurized system described above. Insert the beveled 27-gauge tube intothe left atrium and secure with a vessel clamp. First the phosphate buffer solution (PBS) isperfused at 100mmHg to flush blood from the cerebrovascular system, then the DiI-sucrose-PBS mixture is perfused to label the vasculature (at up to 2 mL/minute with the syringe pump)and finally 4% cis-paraformaldehyde in PBS (PB-F) is perfused at 100 mmHg to fix the tissue.After perfusion, the brain is carefully removed from the skull and placed in PB-F for at leastovernight.
Fixed brains are imaged at multiple image planes at 5× magnification on an invertedfluorescence microscope (IX-50, Olympus America, Miami, Florida), using a Spot Jr. cameraand software (Diagnostic Instruments, Inc., Sterling Heights, Michigan). Images aresubsequently stitched together to create a montage using ImageJ software (NIH) andPowerPoint (Microsoft). In the Notes section, we present our results using the vessel paintingtechnique.
Troubleshooting: Incomplete vessel painting: If the DiI solution is not fullydissolved, vessel painting will be incomplete. Follow the published procedures forpreparing this solution [10]. It is also possible that leakage around the cardiac puncturecould limit perfusion. A tight seal is necessary. Additional troubleshooting tips areavailable in the original protocol. We found that our modifications to this publishedprotocol are required for reliable painting of the cerebral vasculature.
Please note that a flow chart of the following laser occlusion procedure is shown in Figure4.
Femoral artery and vein catheter placement (Modified from [11])For adult and aged mice, we found femoral catheters to be the most reliable approach for drugdelivery (venous line), and convenient for the monitoring of blood pressure and sampling bloodgases (arterial line). A major drawback to femoral catheter placement is disruption of bloodflow to the limb distal to the catheter and nerve damage. However, consistent with Mattson’s
DeFazio et al. Page 7
Transl Stroke Res. Author manuscript; available in PMC 2011 May 16.
NIH
-PA Author Manuscript
NIH
-PA Author Manuscript
NIH
-PA Author Manuscript
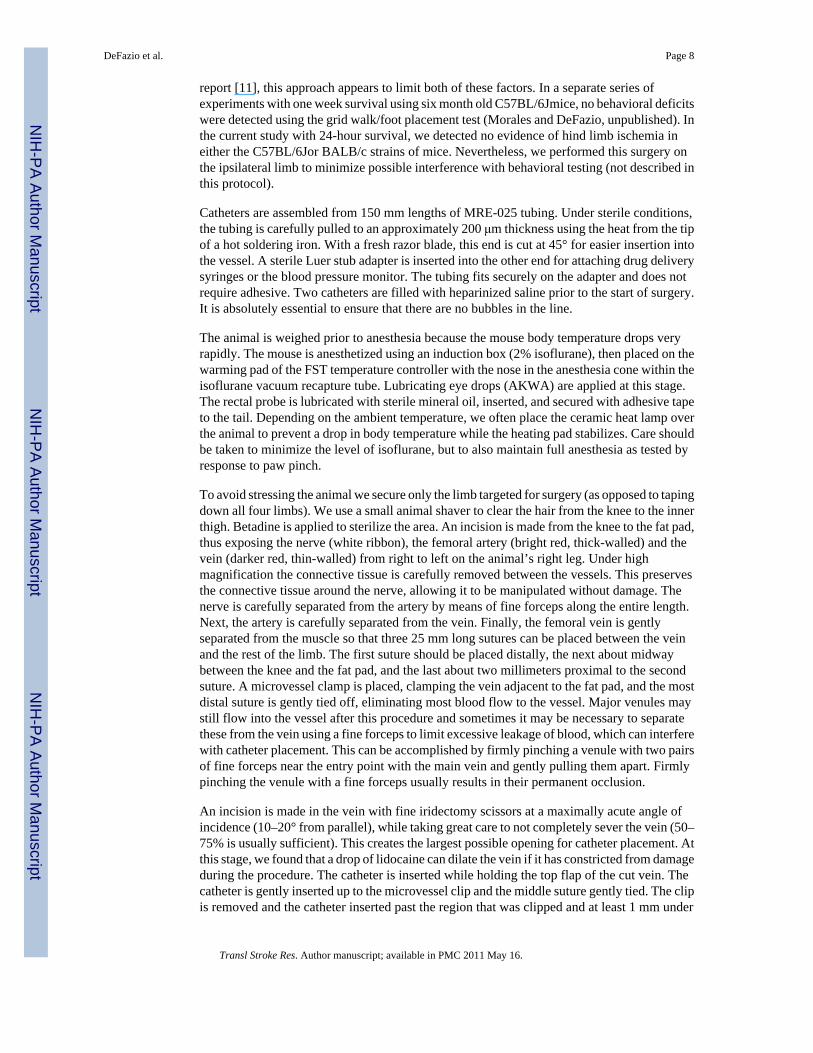
report [11], this approach appears to limit both of these factors. In a separate series ofexperiments with one week survival using six month old C57BL/6Jmice, no behavioral deficitswere detected using the grid walk/foot placement test (Morales and DeFazio, unpublished). Inthe current study with 24-hour survival, we detected no evidence of hind limb ischemia ineither the C57BL/6Jor BALB/c strains of mice. Nevertheless, we performed this surgery onthe ipsilateral limb to minimize possible interference with behavioral testing (not described inthis protocol).
Catheters are assembled from 150 mm lengths of MRE-025 tubing. Under sterile conditions,the tubing is carefully pulled to an approximately 200 μm thickness using the heat from the tipof a hot soldering iron. With a fresh razor blade, this end is cut at 45° for easier insertion intothe vessel. A sterile Luer stub adapter is inserted into the other end for attaching drug deliverysyringes or the blood pressure monitor. The tubing fits securely on the adapter and does notrequire adhesive. Two catheters are filled with heparinized saline prior to the start of surgery.It is absolutely essential to ensure that there are no bubbles in the line.
The animal is weighed prior to anesthesia because the mouse body temperature drops veryrapidly. The mouse is anesthetized using an induction box (2% isoflurane), then placed on thewarming pad of the FST temperature controller with the nose in the anesthesia cone within theisoflurane vacuum recapture tube. Lubricating eye drops (AKWA) are applied at this stage.The rectal probe is lubricated with sterile mineral oil, inserted, and secured with adhesive tapeto the tail. Depending on the ambient temperature, we often place the ceramic heat lamp overthe animal to prevent a drop in body temperature while the heating pad stabilizes. Care shouldbe taken to minimize the level of isoflurane, but to also maintain full anesthesia as tested byresponse to paw pinch.
To avoid stressing the animal we secure only the limb targeted for surgery (as opposed to tapingdown all four limbs). We use a small animal shaver to clear the hair from the knee to the innerthigh. Betadine is applied to sterilize the area. An incision is made from the knee to the fat pad,thus exposing the nerve (white ribbon), the femoral artery (bright red, thick-walled) and thevein (darker red, thin-walled) from right to left on the animal’s right leg. Under highmagnification the connective tissue is carefully removed between the vessels. This preservesthe connective tissue around the nerve, allowing it to be manipulated without damage. Thenerve is carefully separated from the artery by means of fine forceps along the entire length.Next, the artery is carefully separated from the vein. Finally, the femoral vein is gentlyseparated from the muscle so that three 25 mm long sutures can be placed between the veinand the rest of the limb. The first suture should be placed distally, the next about midwaybetween the knee and the fat pad, and the last about two millimeters proximal to the secondsuture. A microvessel clamp is placed, clamping the vein adjacent to the fat pad, and the mostdistal suture is gently tied off, eliminating most blood flow to the vessel. Major venules maystill flow into the vessel after this procedure and sometimes it may be necessary to separatethese from the vein using a fine forceps to limit excessive leakage of blood, which can interferewith catheter placement. This can be accomplished by firmly pinching a venule with two pairsof fine forceps near the entry point with the main vein and gently pulling them apart. Firmlypinching the venule with a fine forceps usually results in their permanent occlusion.
An incision is made in the vein with fine iridectomy scissors at a maximally acute angle ofincidence (10–20° from parallel), while taking great care to not completely sever the vein (50–75% is usually sufficient). This creates the largest possible opening for catheter placement. Atthis stage, we found that a drop of lidocaine can dilate the vein if it has constricted from damageduring the procedure. The catheter is inserted while holding the top flap of the cut vein. Thecatheter is gently inserted up to the microvessel clip and the middle suture gently tied. The clipis removed and the catheter inserted past the region that was clipped and at least 1 mm under
DeFazio et al. Page 8
Transl Stroke Res. Author manuscript; available in PMC 2011 May 16.
NIH
-PA Author Manuscript
NIH
-PA Author Manuscript
NIH
-PA Author Manuscript
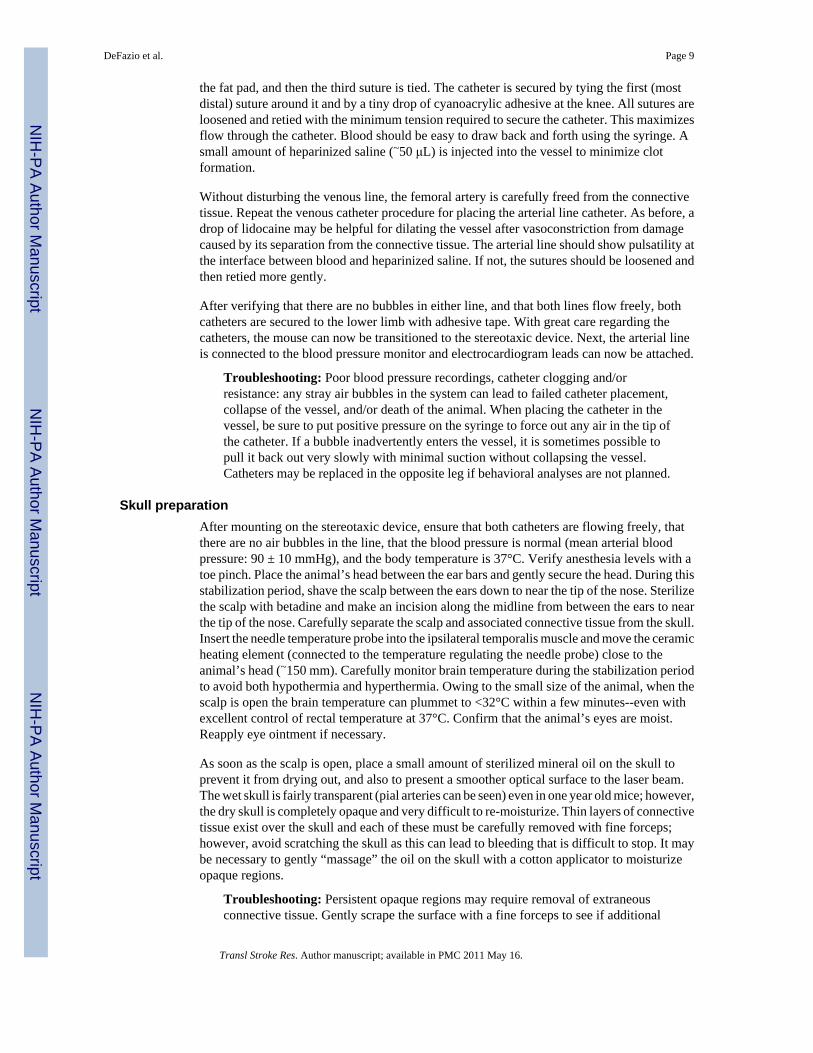
the fat pad, and then the third suture is tied. The catheter is secured by tying the first (mostdistal) suture around it and by a tiny drop of cyanoacrylic adhesive at the knee. All sutures areloosened and retied with the minimum tension required to secure the catheter. This maximizesflow through the catheter. Blood should be easy to draw back and forth using the syringe. Asmall amount of heparinized saline (~50 μL) is injected into the vessel to minimize clotformation.
Without disturbing the venous line, the femoral artery is carefully freed from the connectivetissue. Repeat the venous catheter procedure for placing the arterial line catheter. As before, adrop of lidocaine may be helpful for dilating the vessel after vasoconstriction from damagecaused by its separation from the connective tissue. The arterial line should show pulsatility atthe interface between blood and heparinized saline. If not, the sutures should be loosened andthen retied more gently.
After verifying that there are no bubbles in either line, and that both lines flow freely, bothcatheters are secured to the lower limb with adhesive tape. With great care regarding thecatheters, the mouse can now be transitioned to the stereotaxic device. Next, the arterial lineis connected to the blood pressure monitor and electrocardiogram leads can now be attached.
Troubleshooting: Poor blood pressure recordings, catheter clogging and/orresistance: any stray air bubbles in the system can lead to failed catheter placement,collapse of the vessel, and/or death of the animal. When placing the catheter in thevessel, be sure to put positive pressure on the syringe to force out any air in the tip ofthe catheter. If a bubble inadvertently enters the vessel, it is sometimes possible topull it back out very slowly with minimal suction without collapsing the vessel.Catheters may be replaced in the opposite leg if behavioral analyses are not planned.
Skull preparationAfter mounting on the stereotaxic device, ensure that both catheters are flowing freely, thatthere are no air bubbles in the line, that the blood pressure is normal (mean arterial bloodpressure: 90 ± 10 mmHg), and the body temperature is 37°C. Verify anesthesia levels with atoe pinch. Place the animal’s head between the ear bars and gently secure the head. During thisstabilization period, shave the scalp between the ears down to near the tip of the nose. Sterilizethe scalp with betadine and make an incision along the midline from between the ears to nearthe tip of the nose. Carefully separate the scalp and associated connective tissue from the skull.Insert the needle temperature probe into the ipsilateral temporalis muscle and move the ceramicheating element (connected to the temperature regulating the needle probe) close to theanimal’s head (~150 mm). Carefully monitor brain temperature during the stabilization periodto avoid both hypothermia and hyperthermia. Owing to the small size of the animal, when thescalp is open the brain temperature can plummet to <32°C within a few minutes--even withexcellent control of rectal temperature at 37°C. Confirm that the animal’s eyes are moist.Reapply eye ointment if necessary.
As soon as the scalp is open, place a small amount of sterilized mineral oil on the skull toprevent it from drying out, and also to present a smoother optical surface to the laser beam.The wet skull is fairly transparent (pial arteries can be seen) even in one year old mice; however,the dry skull is completely opaque and very difficult to re-moisturize. Thin layers of connectivetissue exist over the skull and each of these must be carefully removed with fine forceps;however, avoid scratching the skull as this can lead to bleeding that is difficult to stop. It maybe necessary to gently “massage” the oil on the skull with a cotton applicator to moisturizeopaque regions.
Troubleshooting: Persistent opaque regions may require removal of extraneousconnective tissue. Gently scrape the surface with a fine forceps to see if additional
DeFazio et al. Page 9
Transl Stroke Res. Author manuscript; available in PMC 2011 May 16.
NIH
-PA Author Manuscript
NIH
-PA Author Manuscript
NIH
-PA Author Manuscript
layers are present. A minimal amount of mineral oil should be used, but completecoverage is necessary for long-duration recordings.
Thinning the skullWe use the approach of [12], with the exception that we only thin the region over the distalMCA branch of interest (approximately 1mm × 2 mm). Yang’s approach is critical because itensures optimal thinning of the skull. Briefly, a microdrill and 1mm carbide ball bit are usedto gently thin the skull over the region of interest. Be careful to cool the skull with mineral oilduring this procedure. Once the outer layer of the skull is removed, the spongy bone layer canbe removed with gently scraping using a dull forceps. The remaining layer can be thinned morewith the carbide bit, with great care taken not to break through. The pial arteries should appearvery clear through the remaining bone. Be sure to clean the bone fragments from the skull asthese will interfere with laser speckle imaging.
Troubleshooting: Many useful tips are provided in reference [12]. Be very carefulwhen thinning the last layer as small tears in the skull can compromise recordings ofcerebral blood flow. We prefer the thin skull approach; however, it should be notedthat many groups use a craniotomy, especially when using rats. The main drawbacksto large craniotomies include the loss of intracranial pressure and difficultiesassociated with long-term repeated imaging sessions.
Baseline laser speckle imagingAt this stage, verify the absence of bubbles in the catheters, body and brain temperature, heartrate and blood pressure, and depth of anesthesia. Position the laser speckle camera (QICAM-IR Fast 1394) so that the field of view consists of the hemisphere of interest plus a fewmillimeters of the contralateral cortex. The same magnification should be used for allexperiments because the speckle contrast depends on the pixel size. Once the field of view isestablished, confirm that the 785 nm laser intensity is neither too weak (no signal detected bycamera) nor too strong (the camera is saturated). If necessary, adjust the position of the 785nm laser to vary the power and uniformity of illumination. The infrared camera is necessaryfor this step, as the human eye is not very sensitive to 785 nm. Use the image acquisitionsoftware to collect 300 images, 7 msec exposure time, minimum interval between frames.Using the provided ImageJ routines, run the “transform” macro to process the 300 frames. Thismacro has the following steps: make the image stack 32 bits, duplicate the raw data, apply a2×2 mean filter to the raw data and square the result, apply a 2×2 variance filter on the copyof the raw data, divide the square of the mean-filtered images by the variance-filtered images,and average all the frames (to obtain, for example, Figure 6A). If the resulting image is blurry,confirm that the mouse skull is stable and free from macroscopic movements associated withbreathing. It may be necessary to tighten the stereotaxic device ear bars and/or adjust thedistance of the camera from the specimen to refocus.
When images of adequate quality (i.e. focus and clarity) are acquired, verify the absence ofbubbles in the catheters, body and brain temperature, heart rate and blood pressure, and depthof anesthesia. Take three sets of 300 images to establish a baseline. Withdraw 55 μL of bloodfor blood gas analysis (values for this study are reported in Table 1).
Troubleshooting:
Blurry laser speckle images: Be sure to secure the camera relative to the stereotaxicdevice. Vibrations are a major source of blurriness. Focusing the camera can also beproblematic and may require iterative laser speckle contrast imaging and refocusingto obtain the best focal plane. It may also be necessary to rotate either the mouse orthe camera to obtain the best imaging plane.
DeFazio et al. Page 10
Transl Stroke Res. Author manuscript; available in PMC 2011 May 16.
NIH
-PA Author Manuscript
NIH
-PA Author Manuscript
NIH
-PA Author Manuscript
Patchy laser speckle images: It is necessary the skull be completely smooth and freefrom debris. These will appear as dark or bright blotches in the laser speckle contrastimages. Many of these can be removed with gentle scraping or very light milling withthe microdrill.
Abnormal or variable laser speckle images: Unstable anesthesia or other signs ofanimal distress may result in variable laser speckle contrast images. Be sure to monitorheart rate and blood pressure to ensure these are stable during recordings.
Quantum dot-facilitated laser occlusion—Please see the Notes section below where wediscuss the role of quantum dots in photothrombosis.
To initiate quantum dot-facilitated occlusion of the targeted distal MCA branch: Remove thetop cylindrical lens, set the laser power to about 200 μW. With a single cylindrical lens, theGaussian beam from the laser is transformed into a line. Focus the line on the surface of theskull. Use the beam positioner to place the beam over the artery of interest. Figure 5A showsa low magnification image of vessel painting and a distal MCA branch. Align the beam alongthe vessel as in Figure 5B (higher magnification) and refocus. Reposition the second cylindricallens and rotate until a short line appears. Adjust the height of the second cylindrical lens to setthe length (100–150 μm) of the irradiating beam (similar to Figure 5B). Inject half the dose ofthe quantum dots. Increase the 532nm laser power to ~5 mW and view the brilliant redfluorescence emission of the quantum dots through the eyepiece and a 580nm long pass filter.Fluorescence emission from the quantum dots allows one to precisely focus the beam withinthe vessel and is crucial for the success of the method. The emission should appear as a sharpred line; if not, repeat the fine tuning of the focal point, orientation and length of the beam. Donot proceed beyond this point without the laser beam sharply focused within the vessel lumenas evidenced by the red emission of the quantum dots between the arterial borders.
Ensure that there is no bleeding on the skull and that thinning the skull has removed allcalvarium vessels that can interfere with the pial artery irradiation. Minor bleeding from theskull usually desists after a few minutes; we have rarely encountered persistent bleeding beyond5 minutes. After quantum dot injection, calvarium vessels will appear as very bright, but fine,vessels within the skull. Repeat the thinning process if these vessels appear. With the shutterclosed, set the laser power to 40 mW. Set the shutter controller for repeated 600 msec exposuresat 1 sec intervals. Use the image acquisition software to continuously acquire 300 frames at200 msec intervals. Activate the shutter to begin the laser irradiation. Inject the remainder ofthe quantum dot dose and flush the catheter with 100 μL saline. Deliver 20 pulses at 40 mWafter the full quantum dot dosage. This provides a peak (average) intensity of 800 (160) W/cm2. Process the image files using the ImageJ macros to determine if occlusion occurred. Ifnot, turn the laser power down to 5 mW and repeat the alignment procedure, paying particularattention to the distance of the first (closest to the animal) cylindrical lens. This lens sets thefocal plane of the system. If all these parameters have been optimized, it may be necessary tothin the skull further.
After occlusion, irradiation with white light under high magnification is used to directlyvisualize the clot, and most importantly the lack of red blood cells. Successful clots are pale,presumably consisting of platelets, with few to no red blood cells present in the area ofocclusion. At either end of the clot, red blood cells will cap the pale portion of the clot forwards(in the distal direction) to the next branch of the artery and backwards (proximal direction) tothe previous branch.
We routinely monitor cerebral blood flow for 45–90 minutes after laser occlusion.
DeFazio et al. Page 11
Transl Stroke Res. Author manuscript; available in PMC 2011 May 16.
NIH
-PA Author Manuscript
NIH
-PA Author Manuscript
NIH
-PA Author Manuscript
Troubleshooting: Failure of laser occlusion: In our experience, the two mostcommon failures are poor targeting of the vessel and an inadequately thinned skull.It is absolutely crucial to the success of this procedure that the laser line be focusedon the interior of the vessel in three dimensions (i.e. depth as well as the x-y plane).This is refined under low laser power after the quantum dot injection. A sharp line ofbright red fluorescence should appear within the vessel. Optimal thinning of the skullrequires much practice and patience. It is possible to repeat the thinning process andlaser occlusion 2–3 times without seriously confounding the experiment, providedthat the laser is always confined to the interior of the vessel. At maximum power (40mW) the laser line can rapidly occlude microvessels and induce micro-infarctionsbeyond the targeted distal MCA branch. It is essential to refine the position of thebeam with great care prior to increasing laser power.
Awakening the animalWe allow the animals to survive for 1–7 days after injury. It is necessary to carefully close thescalp with minimal amounts of bioadhesive and to carefully remove the catheters, tie off thevein and artery, and close the leg wound (also with bioadhesive). We provide buprenorphine(0.05 mg/kg BID) to minimize the pain and discomfort of the mice. Keep the animal warm for24 hours. We accomplish this using incubator set to 30°C.
For repeated monitoring over the long term, anesthetize the animal for each session as describedabove and mount in the stereotaxic device. Reopen the scalp and clean the skull with sterilemineral oil and a cotton-tipped applicator. We have used laser speckle imaging at 4 hours, 24hours, and 3 days in a subset of animals. After imaging, close the scalp with a minimum amountof bioadhesive (being careful not to get any on the skull) and a drop of xylocaine. We providebuprenorphine (0.05 mg/kg BID) after every imaging session. Laser speckle images duringbaseline, one minute post-occlusion, one hour post-occlusion and one day after injury areshown in Figures 6-9.
VI. NOTESTo validate the vessel painting approach, we painted the cerebral vessels of mice from twostrains, BALB/c and C57BL/6J, known to have major differences in collateral number [6]. Ourresults are very similar to the more expensive and technically challenging approach of vascularcasting. The images in Figure 2 are a montage of 6–10 images obtained at 5× magnification.ACA and MCA pial arteries are traced in PowerPoint to produce the green and black lines inFigure 2C-F. The red lines indicate communicating vessels (anastomoses) between the ACAand MCA arteries. It is apparent from these images that a striking difference in ACA-MCAanastomoses persists at 6 months of age as previously described in 3 month-old mice [6]. InFigure 3, the ACA-MCA territory is shown at higher magnification and individual anastomosesare indicated with black arrows. We counted the total number of anastomoses on the visiblepial surface in one hemisphere, including: ACA-MCA, ACA-ACA, MCA-MCA, posteriorcerebral artery (PCA)-MCA, PCA-ACA, and PCA-PCA anastomoses. Quantification ofresults from five BALB/c and six C57BL/6Jmice are shown in Figure 3C. Although muchlower in number than the C57BL/6J, we detected at least 2 ACA-MCA anastomoses in everyBALB/c mouse at six months of age. This is greater than the number previously reported forthree month old BALB/c mice (average <1, [6]). This suggests that collateral developmentcontinues into adulthood in these mice.
Figures 6 and 8 show representative laser speckle images from BALB/c and C57BL/6Jmice.Quantification of the laser speckle contrast images is shown in Figure 7. This is obtained withthe “percent_difference” macro provided above. This degree of quantification can be difficultowing to alignment issues if the mouse skull moves during the experiment or after repositioning
DeFazio et al. Page 12
Transl Stroke Res. Author manuscript; available in PMC 2011 May 16.
NIH
-PA Author Manuscript
NIH
-PA Author Manuscript
NIH
-PA Author Manuscript
the mouse 24 hours after the initial imaging session. In this case, consistent regions of interestcan be defined either within the vessel or in the parenchyma in both images to enablequantification of long-term changes in perfusion.
In both strains, clots were persistent for 24 hours. Laser speckle images revealed that BALB/c mice showed little or no flow in the occluded territory (Figures 6 and 8). However, as shownin Figure 8, retrograde perfusion was detected with laser speckle imaging (indicated by thewhite arrow). We use the term retrograde because the clot is readily apparent under directvisualization and laser speckle shows no signal in the area of the clot (black arrows). A side-by-side comparison of the pseudo-colored laser speckle contrast images is shown in Figure 9.Pseudo-color can bring out subtle differences and renders the comparison of retrograde flowmore dramatic (i.e. Figure 9D).
We next examined the neuropathological impact of occlusion of a distal branch of the MCAin these two mouse strains. After laser occlusion, persistent clots were formed in both strainsas verified by laser speckle imaging at 24 hours and direct visualization. To characterizeinfarction, animals were perfusion fixed with formalin:acetic acid:methanol (FAM), the brainsremoved and paraffin-embedded using standard procedures (e.g., [13]). We used hematoxylinand eosin staining of 10 μm sections taken every 100 μm between lambda and bregma. Wequantified infarct volume by measuring the area of infarction on each section and multiplyingby the distance between sections. Very minimal infarction was observed in the C57BL/6Jmiceand only superficially at the site of irradiation. In contrast, >2 mm3 infarction was observed in4 of 5 BALB/c mice tested (Figure 10Cand D). Thus, collateral flow determines infarct volumeeven at the level of distal branches of the middle cerebral artery. This suggests that a singlecollateral may be sufficient to rescue the territory of a distal MCA branch (see schematic inFigure 10A). This is supported by the observation that one of the BALB/c had an infarctionvolume indistinguishable from the C57BL/6Jgroup, suggesting that the occluded MCA arterywas also fed by an ACA anastomosis.
Future studies will combine these approaches with in vivo two-photon microscopy and invivo vessel painting techniques currently under development.
The non-traditional role of quantum dots in photothrombosisThe purpose of photothrombosis is to induce endothelial damage by means of the most effectivephotoproduct known, singlet molecular oxygen. This results in rapid adherence anddegranulation of the blood’s first responders to injury - platelets. Aggregation of new plateletsthen occurs in a self-sensitized fashion as a nonlinear function of beam intensity [14]. One verycurious aspect of our observations is that the standard photothrombosis dyes erythrosin B androse bengal were unable to induce stable occlusion in distal MCA branches of the mouse(DeFazio and Watson, unpublished observations). Given the published low quantum yield forsinglet oxygen generation by quantum dots and their inversely corresponding brightness asfluorescent indicators [15], we can only offer that quantum dots are operationally much moreeffective. One drawback of rose bengal and erythrosin B is that they will bind to any membrane,and thus can photooxidize platelets, which will not then respond to normal stimuli [16]. If,however, quantum dots do not photooxidize platelets during irradiation in the relatively low-flowing pial arteries, then the effective density of reactive platelets will be increased.
The lack of membrane binding offers a potential explanation for the efficacy of Qtracker 655non-targeted quantum dots in mediating laser occlusion of distal MCA arteries. We remarkthat quantum dots have not been used before to induce photothrombosis; in fact, our originalintention was to use them to simply leverage the excellent fluorescence properties of theseagents to delineate accurately the desired pial artery under the skull (5 mW setting as above),but we noticed while testing various laser powers that thrombosis was occurring, with stable
DeFazio et al. Page 13
Transl Stroke Res. Author manuscript; available in PMC 2011 May 16.
NIH
-PA Author Manuscript
NIH
-PA Author Manuscript
NIH
-PA Author Manuscript

occlusion observed at 40 mW. To summarize, we believe the advantage of Qtracker 655 non-targeted quantum dots to be twofold in this context: (1) their fluorescence properties allowprecise positioning of the excitation beam, and (2) the lack of membrane binding may limitdamage to platelets during photothrombosis.
AcknowledgmentsSupported by the University of Miami Scientific Awards Committee (RAD) and NIH grants NS034773 and NS045676(MAP).
VII. REFERENCES1. Bang OY, Saver JL, Buck BH, Alger JR, Starkman S, Ovbiagele B, et al. Impact of collateral flow on
tissue fate in acute ischaemic stroke. J Neurol Neurosurg Psychiatry. 2008 Jun; 79(6):625–9. [PubMed:18077482]
2. Wei L, Erinjeri JP, Rovainen CM, Woolsey TA. Collateral growth and angiogenesis around corticalstroke. Stroke. 2001 Sep; 32(9):2179–84. [PubMed: 11546914]
3. Majid A, He YY, Gidday JM, Kaplan SS, Gonzales ER, Park TS, et al. Differences in vulnerability topermanent focal cerebral ischemia among 3 common mouse strains. Stroke. 2000 Nov; 31(11):2707–14. [PubMed: 11062298]
4. Keum S, Marchuk DA. A locus mapping to mouse chromosome 7 determines infarct volume in amouse model of ischemic stroke. Circ Cardiovasc Genet. 2009 Dec; 2(6):591–8. [PubMed: 20031639]
5. Chalothorn D, Faber JE. Formation and maturation of the native cerebral collateral circulation. J MolCell Cardiol. 2010 Mar 25.
6. Zhang H, Prabhakar P, Sealock R, Faber JE. Wide genetic variation in the native pial collateralcirculation is a major determinant of variation in severity of stroke. J Cereb Blood Flow Metab. 2010May; 30(5):923–34. [PubMed: 20125182]
7. Chalothorn D, Zhang H, Smith JE, Edwards JC, Faber JE. Chloride intracellular channel-4 is adeterminant of native collateral formation in skeletal muscle and brain. Circ Res. 2009 Jul 2; 105(1):89–98. [PubMed: 19478202]
8. Clayton JA, Chalothorn D, Faber JE. Vascular endothelial growth factor-A specifies formation ofnative collaterals and regulates collateral growth in ischemia. Circ Res. 2008 Oct 24; 103(9):1027–36. [PubMed: 18802023]
9. Chalothorn D, Clayton JA, Zhang H, Pomp D, Faber JE. Collateral density, remodeling, and VEGF-A expression differ widely between mouse strains. Physiol Genomics. 2007 Jul 18; 30(2):179–91.[PubMed: 17426116]
10. Li Y, Song Y, Zhao L, Gaidosh G, Laties AM, Wen R. Direct labeling and visualization of bloodvessels with lipophilic carbocyanine dye DiI. Nat Protoc. 2008; 3(11):1703–8. [PubMed: 18846097]
11. Mattson DL. Long-term measurement of arterial blood pressure in conscious mice. Am J Physiol.1998 Feb; 274(2 Pt 2):R564–70. [PubMed: 9486319]
12. Yang G, Pan F, Parkhurst CN, Grutzendler J, Gan WB. Thinned-skull cranial window technique forlong-term imaging of the cortex in live mice. Nat Protoc. 2010; 5(2):201–8. [PubMed: 20134419]
13. Dave KR, DeFazio RA, Raval AP, Dashkin O, Saul I, Iceman KE, et al. Protein kinase C epsilonactivation delays neuronal depolarization during cardiac arrest in the euthermic arctic ground squirrel.J Neurochem. 2009 Aug; 110(4):1170–9. [PubMed: 19493168]
14. Watson BD, Dietrich WD, Prado R, Ginsberg MD. Argon laser-induced arterial photothrombosis.Characterization and possible application to therapy of arteriovenous malformations. J Neurosurg.1987 May; 66(5):748–54. [PubMed: 3572500]
15. Samia AC, Chen X, Burda C. Semiconductor quantum dots for photodynamic therapy. J Am ChemSoc. 2003 Dec 24; 125(51):15736–7. [PubMed: 14677951]
16. Zieve PD, Solomon HM, Krevans JR. The effect of hematoporphyrin and light on human platelets.I. Morphologic, functional, and biochemical changes. J Cell Physiol. 1966 Apr; 67(2):271–9.[PubMed: 5332364]
DeFazio et al. Page 14
Transl Stroke Res. Author manuscript; available in PMC 2011 May 16.
NIH
-PA Author Manuscript
NIH
-PA Author Manuscript
NIH
-PA Author Manuscript
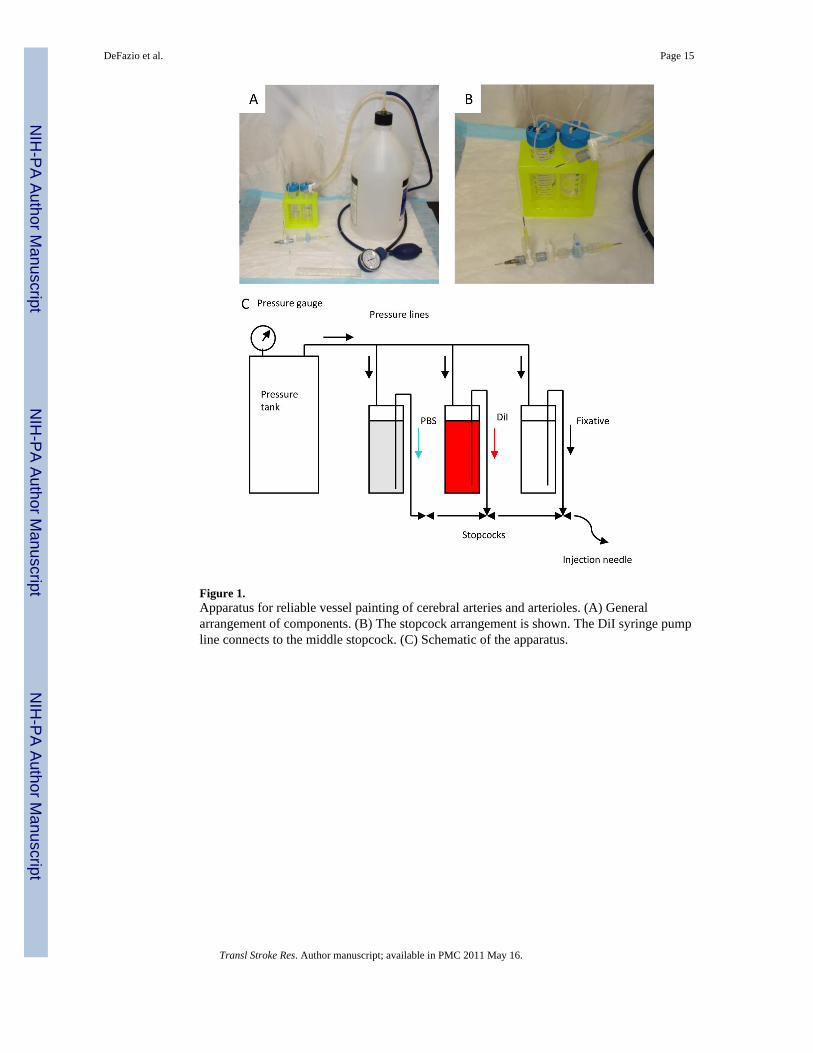
Figure 1.Apparatus for reliable vessel painting of cerebral arteries and arterioles. (A) Generalarrangement of components. (B) The stopcock arrangement is shown. The DiI syringe pumpline connects to the middle stopcock. (C) Schematic of the apparatus.
DeFazio et al. Page 15
Transl Stroke Res. Author manuscript; available in PMC 2011 May 16.
NIH
-PA Author Manuscript
NIH
-PA Author Manuscript
NIH
-PA Author Manuscript

Figure 2.Vessel painting reveals strain-specific variation in pial vessel architecture at six months of age.(A) Ventral view of a BALB/c mouse brain after vessel painting. (B) Dorsal view of the corticalpial vessels. (C & D) Tracing the major ACA (green) and MCA (black) vessels and theirconnections (red) in the BALB/c mouse. (E & F) Increased collateral density in C57BL/6Jmice.
DeFazio et al. Page 16
Transl Stroke Res. Author manuscript; available in PMC 2011 May 16.
NIH
-PA Author Manuscript
NIH
-PA Author Manuscript
NIH
-PA Author Manuscript
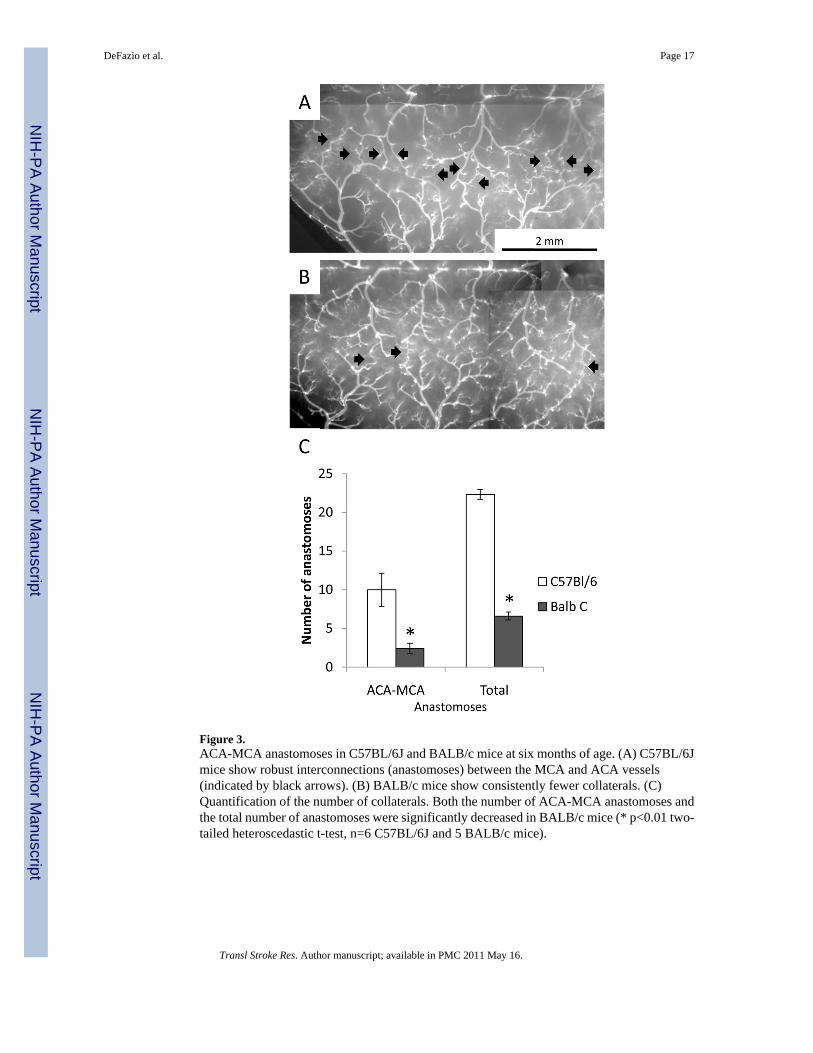
Figure 3.ACA-MCA anastomoses in C57BL/6J and BALB/c mice at six months of age. (A) C57BL/6Jmice show robust interconnections (anastomoses) between the MCA and ACA vessels(indicated by black arrows). (B) BALB/c mice show consistently fewer collaterals. (C)Quantification of the number of collaterals. Both the number of ACA-MCA anastomoses andthe total number of anastomoses were significantly decreased in BALB/c mice (* p<0.01 two-tailed heteroscedastic t-test, n=6 C57BL/6J and 5 BALB/c mice).
DeFazio et al. Page 17
Transl Stroke Res. Author manuscript; available in PMC 2011 May 16.
NIH
-PA Author Manuscript
NIH
-PA Author Manuscript
NIH
-PA Author Manuscript

Figure 4.Flow chart of procedures. Note that the diamond indicates a decision point. If there is noocclusion, repeat the laser occlusion procedure to improve targeting. Alternatively, it may benecessary to thin the skull more.
DeFazio et al. Page 18
Transl Stroke Res. Author manuscript; available in PMC 2011 May 16.
NIH
-PA Author Manuscript
NIH
-PA Author Manuscript
NIH
-PA Author Manuscript
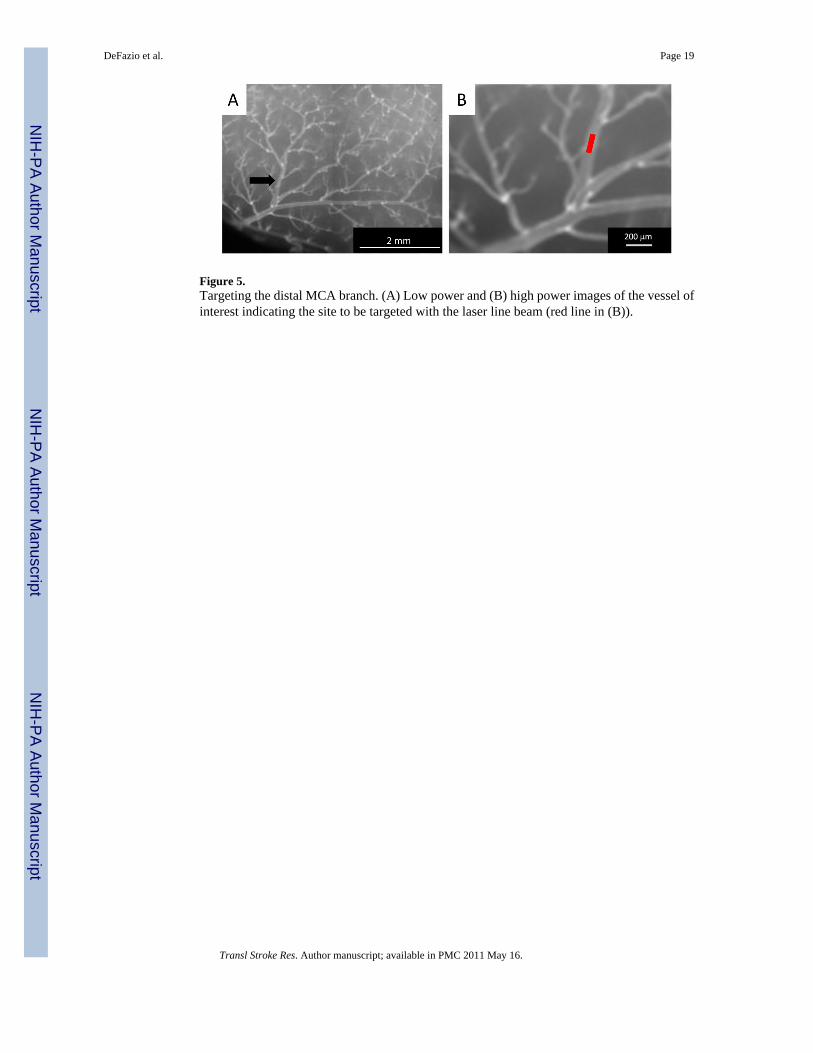
Figure 5.Targeting the distal MCA branch. (A) Low power and (B) high power images of the vessel ofinterest indicating the site to be targeted with the laser line beam (red line in (B)).
DeFazio et al. Page 19
Transl Stroke Res. Author manuscript; available in PMC 2011 May 16.
NIH
-PA Author Manuscript
NIH
-PA Author Manuscript
NIH
-PA Author Manuscript
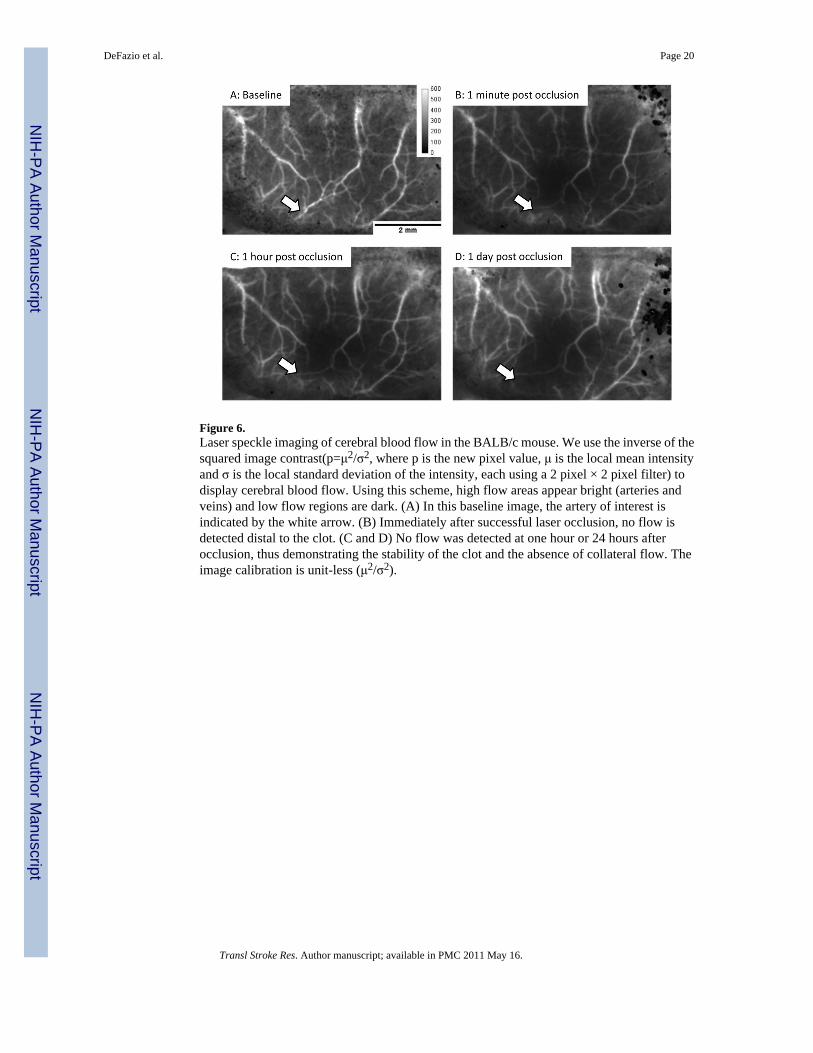
Figure 6.Laser speckle imaging of cerebral blood flow in the BALB/c mouse. We use the inverse of thesquared image contrast(p=μ2/σ2, where p is the new pixel value, μ is the local mean intensityand σ is the local standard deviation of the intensity, each using a 2 pixel × 2 pixel filter) todisplay cerebral blood flow. Using this scheme, high flow areas appear bright (arteries andveins) and low flow regions are dark. (A) In this baseline image, the artery of interest isindicated by the white arrow. (B) Immediately after successful laser occlusion, no flow isdetected distal to the clot. (C and D) No flow was detected at one hour or 24 hours afterocclusion, thus demonstrating the stability of the clot and the absence of collateral flow. Theimage calibration is unit-less (μ2/σ2).
DeFazio et al. Page 20
Transl Stroke Res. Author manuscript; available in PMC 2011 May 16.
NIH
-PA Author Manuscript
NIH
-PA Author Manuscript
NIH
-PA Author Manuscript
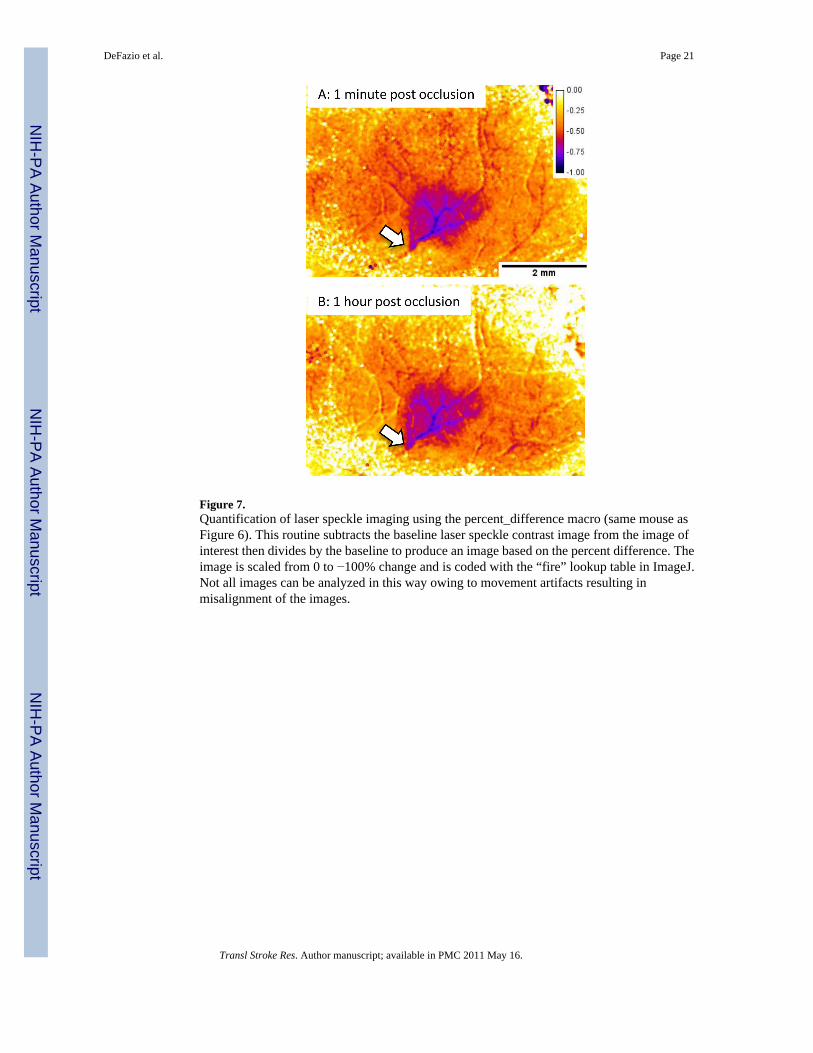
Figure 7.Quantification of laser speckle imaging using the percent_difference macro (same mouse asFigure 6). This routine subtracts the baseline laser speckle contrast image from the image ofinterest then divides by the baseline to produce an image based on the percent difference. Theimage is scaled from 0 to −100% change and is coded with the “fire” lookup table in ImageJ.Not all images can be analyzed in this way owing to movement artifacts resulting inmisalignment of the images.
DeFazio et al. Page 21
Transl Stroke Res. Author manuscript; available in PMC 2011 May 16.
NIH
-PA Author Manuscript
NIH
-PA Author Manuscript
NIH
-PA Author Manuscript

Figure 8.Retrograde flow after laser occlusion in a C57BL/6J mouse. (A) Baseline image beforeocclusion; black arrows indicate the extent of the clot after laser occlusion. (B) Shortly afterocclusion, the laser speckle signal decreases within the targeted artery distal to the site ofocclusion (white arrow is distal, black arrows indicate site of occlusion). (C) At 24 hours,retrograde perfusion of the distal artery branches has increased (white arrow); however, theclot persisted as a dark signal in the laser speckle image and by direct visualization (blackarrows).
DeFazio et al. Page 22
Transl Stroke Res. Author manuscript; available in PMC 2011 May 16.
NIH
-PA Author Manuscript
NIH
-PA Author Manuscript
NIH
-PA Author Manuscript
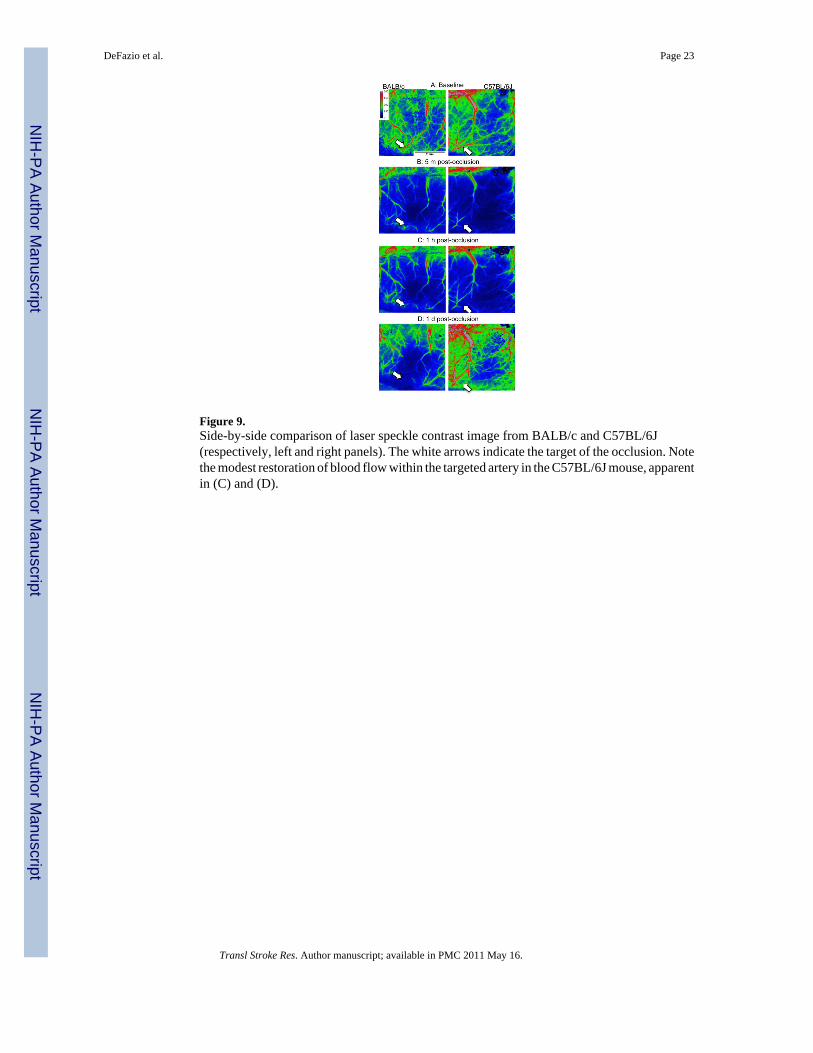
Figure 9.Side-by-side comparison of laser speckle contrast image from BALB/c and C57BL/6J(respectively, left and right panels). The white arrows indicate the target of the occlusion. Notethe modest restoration of blood flow within the targeted artery in the C57BL/6J mouse, apparentin (C) and (D).
DeFazio et al. Page 23
Transl Stroke Res. Author manuscript; available in PMC 2011 May 16.
NIH
-PA Author Manuscript
NIH
-PA Author Manuscript
NIH
-PA Author Manuscript
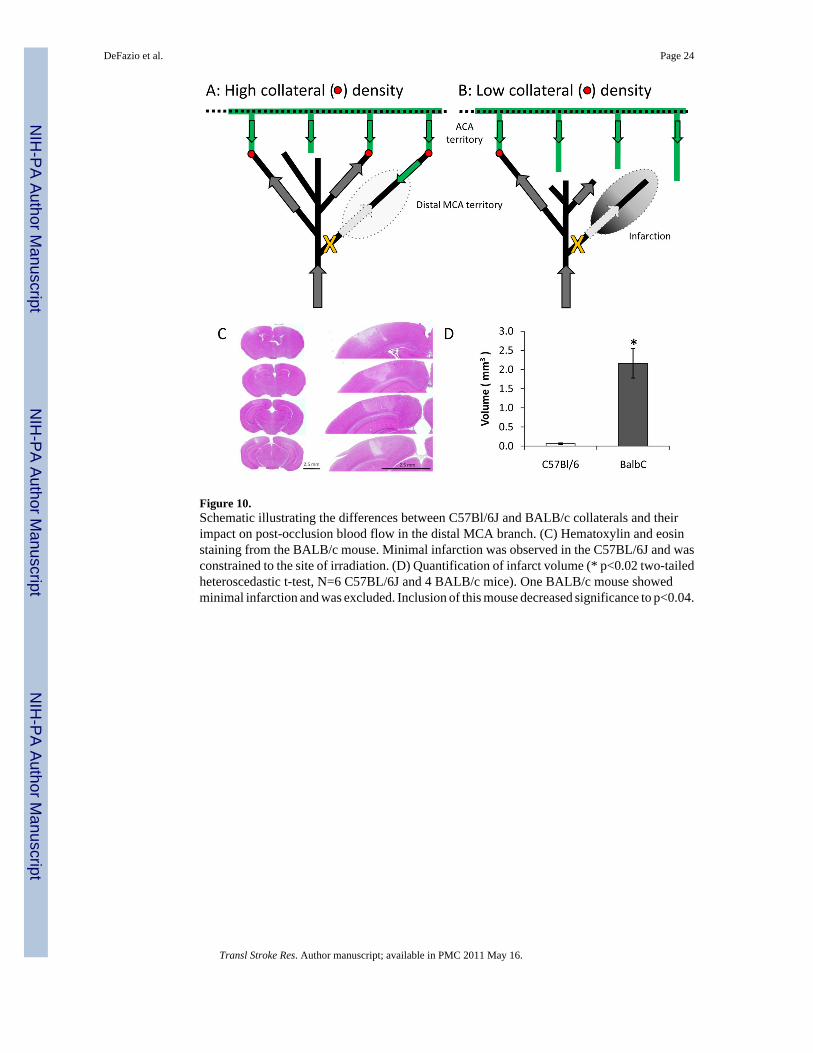
Figure 10.Schematic illustrating the differences between C57Bl/6J and BALB/c collaterals and theirimpact on post-occlusion blood flow in the distal MCA branch. (C) Hematoxylin and eosinstaining from the BALB/c mouse. Minimal infarction was observed in the C57BL/6J and wasconstrained to the site of irradiation. (D) Quantification of infarct volume (* p<0.02 two-tailedheteroscedastic t-test, N=6 C57BL/6J and 4 BALB/c mice). One BALB/c mouse showedminimal infarction and was excluded. Inclusion of this mouse decreased significance to p<0.04.
DeFazio et al. Page 24
Transl Stroke Res. Author manuscript; available in PMC 2011 May 16.
NIH
-PA Author Manuscript
NIH
-PA Author Manuscript
NIH
-PA Author Manuscript
NIH
-PA Author Manuscript
NIH
-PA Author Manuscript
NIH
-PA Author Manuscript
DeFazio et al. Page 25
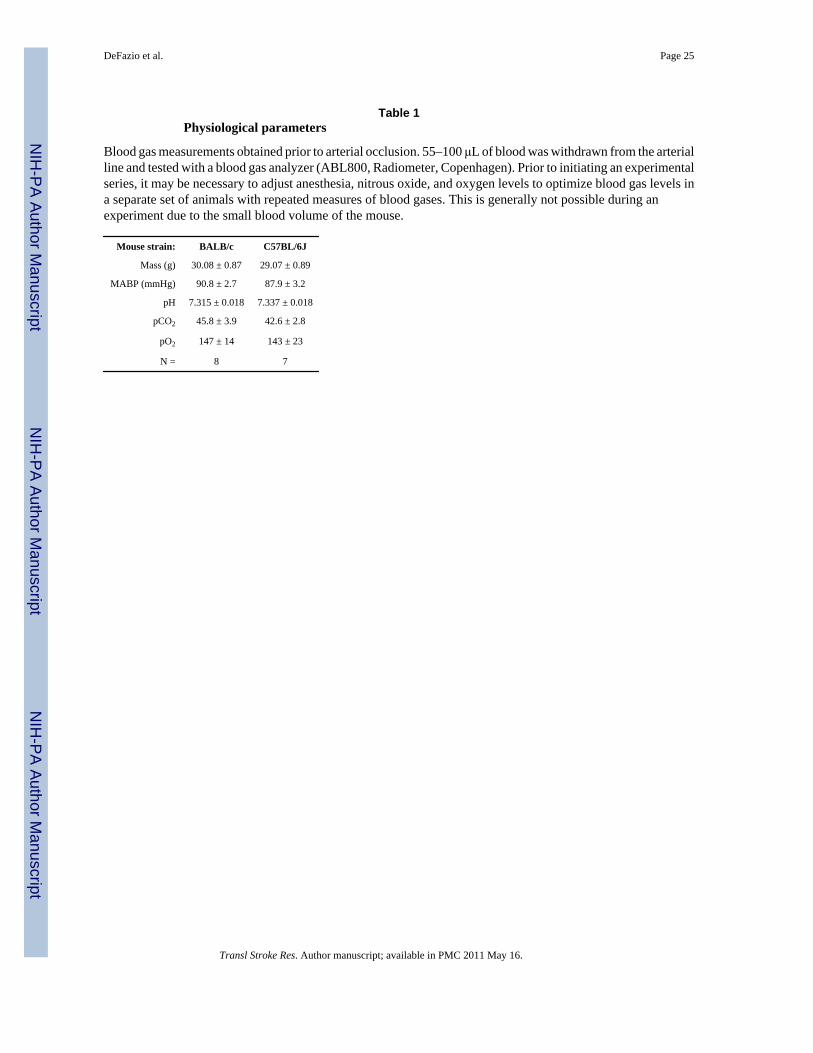
Table 1Physiological parameters
Blood gas measurements obtained prior to arterial occlusion. 55–100 μL of blood was withdrawn from the arterialline and tested with a blood gas analyzer (ABL800, Radiometer, Copenhagen). Prior to initiating an experimentalseries, it may be necessary to adjust anesthesia, nitrous oxide, and oxygen levels to optimize blood gas levels ina separate set of animals with repeated measures of blood gases. This is generally not possible during anexperiment due to the small blood volume of the mouse.
Mouse strain: BALB/c C57BL/6J
Mass (g) 30.08 ± 0.87 29.07 ± 0.89
MABP (mmHg) 90.8 ± 2.7 87.9 ± 3.2
pH 7.315 ± 0.018 7.337 ± 0.018
pCO2 45.8 ± 3.9 42.6 ± 2.8
pO2 147 ± 14 143 ± 23
N = 8 7
Transl Stroke Res. Author manuscript; available in PMC 2011 May 16.