Dust Palliative Selection and Application Guide - Benton ...
A PREDlCTlVE MODEL FOR SURVIVAL IN METASTATIC CANCER PATIENTS
ATTENDING AN OUT-PATIENT PALLIATIVE RADIOTHERAPY CLINIC
by
Edward Chow MBBS, FRCPC
A thesis submitted in conformity with the requirements for the degree of MSc (Clinical Epidemiology), Graduate Department of Health Administration,
University of Toronto
O Copyright by Edward Chow (2001)

National Library 1*1 of Canada Bibliothèque nationale du Canada
Acquisitions and Acquisitions et Bibliographie Semices services bibliographiques
395 WeUington Sireet 395, rue Wellington Ottawa ON K I A O N 4 Ottawa ON K 1 A ON4 canada Canada
The author has granted a non- L'auteur a accordé une licence non exclusive Licence dowing the exclusive permettant à la National Library of Canada to Bibliothèque nationale du Canada de reproduce, Ioan, dism%ute or sen reproduire, prêter, distribuer ou copies of this thesis in microform, vendre des copies de cette thèse sous paper or electronic formats. la forme de microfiche/film, de
reproduction sur papier ou sur format électronique.
The author retains ownership of the L'auteur conserve la propriété du copyright in this thesis. Neither the droit d'auteur qui protège cette thèse. thesis nor substantial extracts fiom it Ni la thèse ni des extraits substantiels may be printed or otherwise de celle-ci ne doivent être imprimés reproduced without the author's ou autrement reproduits sans son permission. autorisation.
MSc Thesis
A Predictive Model for Survival in Metastatic Cancer Patients Attending an Out-Patient
Palliative Radiotherapy Clinic
Student:
Supervisor:
Edward Chow MBBS, FRCPC Radiation Oncologist
tan Tannock MD, PhD, FRCPC Medical Oncologist
Cornmittee Members: Andrea Bezjak MD. MSc. FRCPC Radiation Oncolog ist
Tony Panzarella MSc Statistician
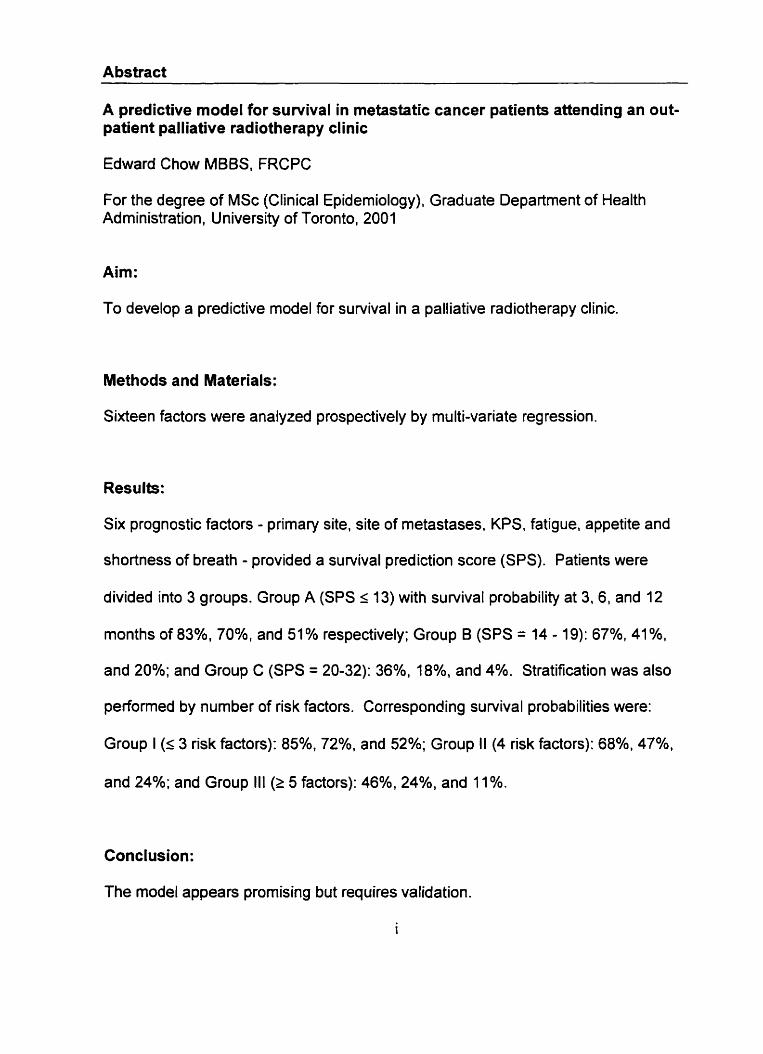
Abstract
A predictive model for survival in metastatic cancer patients attending an out- patient palliative radiotherapy clinic
Edward Chow MBBS, FRCPC
For the degree of MSc (Clinical Epidemiology), Graduate Department of Health Administration, University of Toronto, 2001
Aim:
To develop a predictive model for survival in a palliative radiotherapy clinic.
Methods and Materials:
Sixteen factors were analyzed prospectively by multi-variate regression.
Results:
Six prognostic factors - primary site. site of metastases, KPS. fatigue, appetite and
shortness of breath - provided a survival prediction score (SPS). Patients were
divided into 3 groups. Group A (SPS s 13) with survival probability at 3. 6, and 12
months of 83%, 70%, and 51 % respectively; Group B (SPS = 14 - 19): 67%, 41 %,
and 20%; and Group C (SPS = 20-32): 36%, 18%. and 4%. Stratification was also
performed by number of risk factors. Corresponding survival probabilities were:
Group 1 (1 3 risk factors): 85%, 72%, and 52%; Group 11 (4 risk factors): 68%, 47%,
and 24%; and Group III (z 5 factors): 46%. 24%, and 11 %.
Conclusion:
The model appears promising but requires validation.
Table of Contents
Abstract ........................................................................................................................... i
Acknowledgements ........................................................................................................ iv
Chapter 1: Introduction .................................................................................................... 1
Rationale / Relevance .................................................................................... 2
Review of Literature ....................................................................................... 4
Summary of Current Literature ...................................................................... 9
................................................................................ Chapter 2: Methods and Materials 12
........................................................................... RRRP Database 12
............................................... Development of a Predictive Model 14
.................................................................. Item Generation 14
................................. Continuous Versus Categorical Data 15
....................................................................................... Statistical Analysis 17
.......................................................................... Primary Outcome 17
Handling of Missing Data ............................................................. 17
................................................... Minimum Subject Requirements 18
.............................................................................. Item Reduction 18
............................................................................ Model Selection 19
. . ........................................................................ Univanate Analysis 20
..................................................................... Multivariate Analysis 21
Risk Group Statification ................................................................. 22
....................................... Means for Studying Predictive Accuracy 24
......................................................................... Software Package 26
........................................................................................................ Chapter 3: Results 27
............................................................................................ Demographics 27
................ Univariate Analysis of Effects of Prognostic Factors on Survival 29
Multivariate Analysis ................................................................................... 30
Performance of the Model ......................................................................... 32
Risk Group Stratification ............................................................................. 32
Chapter 4: Discussion ................................................................................................... 37
...................................................... Statistical vs Judgemental Approaches 38
Choice of Measurement TooI ................................................................... 40
.................................................. Choice of Co-Variates in Item Generation 41
Difference in Median Survival and KPS ...................................................... 43
Prognostic Factors ...................................................................................... 44
................................................................................... Potential Limitations 46
Future Work ................................................................................................ 48
Potential Use of the Model ................................................................... 49
Application of the Future Validated Model .................................................. 51
List of Tables ................................................................................................................. 54
List of Figures ...................... ... ................................................................................. 74
......................................................................................................... List of Appendices 86
Ethics Approval ........................................................................................................... 126
.................................................................................................................. References 127

Acknowledgements
We thank the following members of the Rapid Response Radiotherapy Program at
the Toronto-Sunnybrook Regional Cancer Centre for their contribution to the
prospective database:
Radiation Oncolog ists Dr. C. Danjoux Dr. C. Hayter Dr. A. Loblaw Dr. E. Szumacher Dr. R. Wong
Radiation Theraoists Ms. R. Connolly Ms. L. Holden
Nurses Ms. L. Andersson Ms. J. Pope
Statisticians Ms. E. Franssen Ms. K. Fung
Data Entry Research Assistants Ms. R. Norton-Tkalec Ms. L. Wyles
and Dr. M. Fitch's students
We thank Ms. D. Nywening for secretarial assistance.
This project is partly funded by the Department of Radiation Oncology. University of
Toronto. Geoffrey H. Wood Foundation Grant. Toronto-Sunnybrook Regional Cancer
Centre Radiation Program Fund and Cancer Care Ontario.
Cha~ter 1 : Introduction
When cancer advances to a stage that control or curative therapy is no longer an
appropriate or desired treatment option, one of the issues addressed frequently by
patients and families is estimating the remaining time of survival.
Unfortunately, studies have shown that it is difficult to estimate accurately the
survival once the disease is progressive and uncontrollable.
The classification of patients with advanced cancer into groups with similar and
predictable survival has the potential to lead to improvement in therapeutic and care
strateg ieç, and to minimize risks of undertreatment or overtreatrnent.
Rationale 1 Relevance
Predicting the life expectancy of teminally il1 cancer patients is one of the most
difficult and least welcomed tasks in the oncology and palliative care comrnunity.
However, such an estimate is of vital importance for patients and their families to
confront end-of-life issues and plan their remaining time together. Medical
professionals and health care administrators also require such estimates to guide
appropriate clinical decisions, plan supportive services and allocate resource
utilization (1).
Physicians are often required to predict patient survival at times of referral to hospice
prograrns and enrollment into clinical trials (2). However, clinicians are often overly
optimistic in the survival prediction of teminally il1 cancer patients (3, 4). A 1993
report from the US. National Hospice Organization showed that more than 50% of
patients with end of life cancer were not given access to hospice programs (5) or
were referred too late in the course of their illness to take full advantage of the
available hospice services (6). Pessimistic prediction also happens but is less
common (7).
This group of fragile patients is prone to sudden death from unexpected events such
as infection and bleeding (8). Inaccurate prediction of suwival often results in
inadequate access to palliative care. Optirnistic prediction may deter patients from
being involved in palliative programs at an earlier stage. Patient preferences about
the trade-off between the risks and benefits associated with treatment strateg ies are
often based on perceptions of prognosis. Inaccurate perceptions can lead to
unrealistic expectations (2). Weeks and colleagues found that patients with
optimistic prognostic misperceptions often request medical therapies that most
physicians would consider futile. These same patients were 8.5 times as likely to
favor receiving aggressive, life-extending medical care than were patients with more
accurate estimates of their 6-month survival. More disturbingly, those with overly
optimistic prognoses were more likely to die in hospital on mechanical ventilation
than were those patients with more realistic estimates of their survival potential. The
authors suggest that terminal cancer patients' optimistically miscalibrated prognostic
estimates may lead them to choose hig hly aggressive, invasive and ultimately futile
medical care rather than palliative care (9).
Other than the clinicians' impression, survival prediction can be made from clinical
parameters, biochemical variables, or a combination of both. Studies employing
perfomance status, patient symptornatology, quality of life measures and
biochemical parameters have been performed to complement the clinicians'
estimates (1 0-1 2).
Terminally il1 cancer patients represent a heterogeneous group, ranging from
ambulatory and independent to moribund and bed-bound. Constructing common
prognostic predictors for such a diverse group poses challenges to investigators
(13). Moreover, most of these studies are observational in nature and are based on
small retrospective series, thus making comparisons across studies difficult.
Review of Literature
Two recent systematic reviews have been performed on the survival prediction of
terminally il1 cancer patients (14, 15). one of which (14) was performed as part of the
preparation for this thesis.
The objectives of Our review were to examine the predictive ability of prognostic
factors and to determine the accuracy of physicians' estimates in predicting the
survival of terminal cancer patients (14). A Medline search was conducted of articles
in English published between 1966 and March 2000 concerning survival prediction
of terminally il1 cancer patients. The keywords used for the search included
"forecastinglclinical prediction", "prognosis/prognostic factorsn, "survival" and
"neoplasm metastasis". Additional articles were identified by performing searches in
Cancerlit (1 983 - March 2000), Embase (1 991 - March 2000), Pubmed (1 966 -
March 2000), Cochrane and from the reference sections of the relevant articles and
reviews.
Studies were included if they met the following criteria: a) patients aged 18 and
above were included and b) the study included a range of histologies representative
of those seen in hospices, palliative care programs and outpatient palliative
oncology settings. Since it is not cornmon practice to perform routine blood work in
these patients, studies utilizing biochemical and molecular markers were generally
excluded.
Articles on clinicians' prediction of survival and prognostic factors are al1 descriptive
studies (category of evidence: III) (Appendix 1). However, if they represent well-
designed cohort studies, especially from more than one center or research group,
their levels of evidence become II - a (table 1). For studies testing prognostic
factors, those that have adequate sample sizes to test for independent predictors
(at least 10 outcome events per variable tested), and were subsequently validated.
will constitute level II - a evidence (table 2).
Three hundred and eighty-one abstracts were found. Manual checking of abstracts
was perforrned in order to select appropriate articles as outlined in the
inclusion/exclusion criteria. Articles confined to one primary cancer site. or those
utilizing biochemical and molecular studies were excluded. Twelve articles on
clinicians' prediction and nineteen articles on prognostic factors were identified to
examine these aspects of clinical prediction of survival in terminally il1 cancer
patients. Clinicians' prognostic accuracy was assessed by comparing patients'
actual survival to the predicted survival. Results of the studies are summarized in
table 1 (3, 4. 7, 16-24).
Clinicians' prediction of survival was based on the clinical experience of the
physicians and the para-medical staff. The estimates of survival reported in table 1
were obtained from a diverse group of physicians and health care professionals.
In general, clinicians' overall survival estimates tended to be inaccurate in the
optimistic direction in nine of the twelve studies (3, 4, 7. 16-1 9. 23, 24). The
definition of 'optimistic error' varied among studies but it is clear that patients often
do not live as long as their physicians predict.
Prognostic deteninants for terrninally il1 cancer patients have been increasingly
investigated in the last two decades. Nineteen articles were identified which
examined the prognostic indicators of survival. They are listed in table 3 ( 7, 1 0, 1 1 ,
16, 18-20, 25-35).
To determine prognostic predictors, rnultivariate analysis is often employed following
the evaluation of each variable that is statistically significant in univariate analysis. A
large number of outcome events are needed if many variables are included in the
analysis. In general, results of models having fewer than 10 outcome events per
independent variable are thought to have questionable accuracy (36, 37) and the
usual tests of statistical significance may be invalid. Several studies (1 1, 18, 29, 31,
32) suffer from this deficiency. As with al1 statistical models, the results of
multivariate analyses require validation to protect against unrecognized problems
and limitations (38). Cornmon methods for validating models include 1) perforrning a
test analysis on a sub-sample of patients followed by a subsequent validation
analysis on the rernaining patients; 2) repeating the analysis on an independent
sample of patients; and 3) using the 'jackknife' or 'bootstrap' procedures (39) in
which the same analysis is performed multiple times on a series of subsets from the
same data set in order to evaluate the stability of the predictive ability of the model.
Only a few studies underwent such validation processes (20, 35, 40) (table 2).
Among al1 prognostic determinants, performance status appears to be an
independent prognostic factor in at least 13 of the studies (7, 10, 16, 19, 20, 25-27,
29, 31, 33-35, 40). The Karnofsky Performance Scale (KPS) is the most widely
used tool to quantify the functional status of cancer patients (41, 42). The KPS is an
1 1-point rating scale which ranges from normal functioning (1 00) to dead (O)
(Appendix 2).
Yates and associates observed that KPS scores accurately predicted early deaths,
but high initial KPS scores did not necessarily correlate with long suwival (25). Mor
et al further confirmed the direct relationship between KPS and survival (p<0.001)
and found that lower KPS levels were likely to represent a "death-imminent" status,
suggesting a hig h specificity for lower KPS levels (26).
In light of the potential limitations of KPS, the assessment of clinicai symptoms in
combination with KPS and clinicians' prediction was employed in a large study by
Reuben et at (10) to help improve the ability to predict survival. They used data from
the National Hospice Study (NHS), a multicentre study that compared hospice and
conventional terminal care in 40 hospices and 14 non-hospice medical care settings.
Fourteen symptom-related items together with KPS were analyzed on a total of 1592
patients. They found that in addition to performance status. which was the most
statistically significant clinical factor in estimating survival time, five other symptorns
also had independent prognostic values. These were shortness of breath, eating
problems or anorexia, trouble swallowing, dry mouth and weight loss. The
prevalence of these symptoms among patients with cancer of various primary and
rnetastatic sites supports the concept of a common final clinical pathway in patients
with advanced malignancies - the terminal cancer syndrome (1 0). This observation
has also been reported by other investigators (27. 31). Prognostic indicators of
survival in other studies are detailed in table 3 and in the following surnmary.
Summary of Current Literature
1. Functional or performance status was best correlated with the length of survival
in 13 studies (7. 10. 16, 19, 20, 25-27, 29, 31. 33-35).
2. Anorexia, weight loss and dysphagia were the next strongest predictors for
survival as demonstrated in 7 of the studies (10, 18, 20, 27, 34, 35. 40). These
symptoms comprise part of the ' terminal cancer syndrome' as identified by
Reuben et al (10).
3. Cognitive failure and confusion were associated with shorter life span in 3 studies
(1 1 18. ) The site of the primary and extent of metastatic disease were
predictive of suwival in 2 studies (29. 32).
4. Clinicians' predictions tended to be overly optimistic (3. 4, 7. 16-1 9, 23, 24).
There is fair evidence (grade 6) to support using performance status and clinical
parameters together with clinicians' prediction to help survival prediction. However,
there is weak evidence (grade D) to support that clinicians' prediction alone be
employed for the prediction of survival (Appendix 1) and in fact they can be
misleading .
Vigano et al performed a similar systematic review and concluded:
1. variables definitely associated with decreased survival were: low performance
status, clinical estimation of survival, cognitive impairment, anorexia, dyspnoea,
xerostomia, weight loss, and dysphagia;
2. variables possibly associated were: male gender, primary cancer site, pain.
serum albumin, and tachycardia;
3. variables probably not associated were: increasing age, fever, marital status,
nausea, and anaemia (15).
The two systematic reviews were on prognostic factors for survival in end-stage
cancer patients, regardless of their original primaries. These prognostic factors were
generally available in regular clinical practice (14, 15).
Most studies were in hospice settings and only one article was in a palliation setting
employing radiation as a palliative modality. Grabowski et al in their article "Factors
predictive of completion of treatment and survival after palliative radiation therapy"
analyzed 12 variables in 97 patients undergoing palliative radiation and concluded
that performance status, site of primary, and solitary vs. multiple metastases were
predictors (29). However, Harrell et al have provided arguments that for regression
modeling, the number of events (deaths) should be at least ten times the number of
potential prognostic parameters ( i.e. degrees of freedom) that could be included in
the model; otherwise, the model will have questionable accuracy and usual tests of
statistica l sig nificance become invalid (36). Gra bows ki's model therefore suffered
from 'overfitting'. Furthenore, there is no mention in their paper as to whether the
results of the multivariate analysis have been validated for an independent group of
patients to protect against unrecognized problems and limitations.
In surnmary. most studies are small, retrospective series with statistical errors and
lack of validation. In particular, there is no existing well-developed and validated
predictive model in the setting of an out-patient palliative radiotherapy clinic.
Approximately 50% of the work load in radiation oncology practice is symptom
palliation. The choice of optimal radiotherapy dose fractionation is often based on
the radiation oncologist's estimate of patients' survival. The objective of this thesis
was to develop a predictive model for survival in an out-patient palliative
radiotherapy clinic to assist with (1) prognosis, (2) therapeutic decision making, for
example, end of life planning and radiotherapy dose fractionations. and (3) digibility
requirernents for enrollment and stratification in clinical trials.
Chapter 2: Methods and Materials
At the Toronto-Sun~ybrook Rzgional Cancer Centre, the Rapid Response
Radiotherapy Program (RRRP), a pilot program in Ontario. was started in 1996 to
provide timely palliative radiotherapy. The intent of the program was to provide
quick access to radiotherapy to relieve suffering and irnprove quality of life in this
group of patients with terminal cancer. Their care is shared with community care
physicians who continue to provide the overall management of palliative care.
Resources are mobilized so as to allow consultation and radiotherapy to occur on
the same day to reduce unnecessary difficult trips for patients to cancer centers.
The referrals are mainly from the oncologists and palliative care physicians in the
Greater Toronto Area.
RRRP Database
A prospective database has been set up for patients referred for palliative
radiotherapy at RRRP since January 1999 (Appendix 3). We accept referrals of new
patients with metastatic cancer who have not seen previously a radiation oncologist
at our centre. Other patients continue to receive care from their own radiation
oncolog ists. The referral requires a patholog ical diag nosis of cancer and
documentation of metastatic disease either by pathological confirmation, clinical
examination or imaging studies. Patients were enrolled into the database if they
were able to speak English, give verbal consent and complete symptom
assessment. Patients were excluded frorn the database if they were confused.
refused, or were unable to complete the symptorn assessment. Patients in the
prospective database seen in the calendar year of 1999 served as a training set to
develop the predictive model for survival. Ethical approval was obtained for this
project.
During the initial consultation, patient demographics, cancer history, disease status
and symptom profiles were collected. Patients were asked to rate their symptom
distress using the modified Edmonton Symptom Assessrnent Scale (ESAS). This
includes a total of 9 syrnptoms (pain, fatigue, nausea, depression, anxiety,
drowsiness, appetite, sense of well-being and shortness of breath) using an 11 point
categorical scaie (0-1 0, O = lack of symptorn, 1 0 = worst possible symptorn). The
equivalent total daily dose of oral morphine for initial analgesic consumption during
the preceding 24 hours was recorded. Analgesic consumption at the first visit was
classified as none, non-opioids, weak opioids (e.g. codeine) and strong opioids (e.g.
morphine and hydromorphone).
Two health care professionals (a nurse and a radiation therapist) have been trained
to collect the data including the modified Edmonton Symptom Assessrnent Scale
scores. If one of them was absent from the clinic due to vacation, conference or sick
leave. no collection of data in that particular clinic took place because of the heavy
clinical workload. Data entry was performed by our research assistants using the
Oracle Database System.
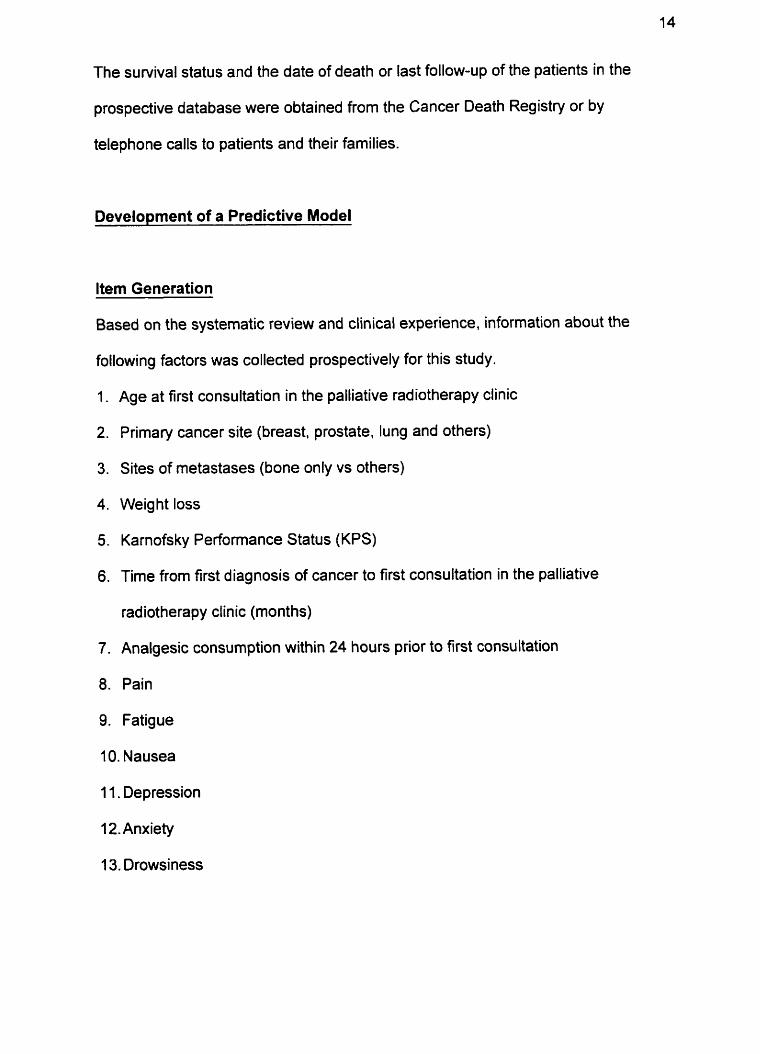
The survival status and the date of death or last follow-up of the patients in the
prospective database were obtained from the Cancer Death Registry or by
telephone calls to patients and their families.
Development of a Predictive Modal
Item Generation
Based on the systematic review and clinical experience, information about the
following factors was collected prospectively for th is study.
Age at first consultation in the palliative radiotherapy clinic
Primary cancer site (breast, prostate. lung and others)
Sites of metastases (bone only vs others)
Weig ht loss
Karnofsky Performance Status (KPS)
Time from first diagnosis of cancer to first consultation in the palliative
radiotherapy clinic (months)
Analgesic consumption within 24 hours prior to first consultation
Pain
Fatigue
10. Nausea
1 1. Depression
12. Anxiety
13. Drowsiness
14. Appetite
15. Sense of well-being
16. Shortness of breath
Continuous Versus Categorical Data
Although the handling of variables as continuous has the advantage of retaining al1
the information, it may not be clinically practical to physicians when the outcome is
reported in ternis of hazard ratio per unit increase which may be difficult to interpret.
It may be easier to work with categorical variables. Categorization into several
subgroups is preferable if one wants to retain more information. This would also
allow some idea of how the risk varies across the range of values of the prognostic
factor. The choice of the best cut-off for continuous characteristics is important. The
median value or the quartiles of variable distribution are commonly used to divide
patients into two or more subgroups if clear clinical-biological criteria are not
available. However, it is not certain that this approach can identify the cutoff with the
best discriminating capacity. Selecting a cut-off point to distinguish risk groups by
computing a statisticai significance level for al1 possible cut-off points and then
selecting the one with the smallest significance level is another alternative.
Of the 16 potential prognostic factors (known as co-variates), we dichotomized the
following :
a) age at first consultation for palliative radiotherapy at the median age of 68 (>
68 vs s 68)
b) site of metastases (bone only vs others)
c) weight loss (2 10% over 6 months vs < 10%)
d) Karnofsky Performance Status (KPS) (> 50 vs 1 50)
e) time from first diagnosis of cancer to first consultation in the palliative
radiotherapy c l i c (> 12 months vs 12 months)
We categorized the remaining CO-variates into 4 su bg roups.
Primary cancer site had 4 subgroups: breast. prostate, lung , and others.
Analgesic consumption in the preceding 24 hours was categorized as:
a) none
b) non-opioids
c) weak opioids (e.g. codeine)
d) strong opioids (e.g . morphine and hydromorp hone)
This grouping was common in palliative radiotherapy trials for bone metastases (43
- 51).
The severity of pain has been classified into none (O), mild (1 - 3). moderate (4 - 7).
and severe (8 - 10) in the literature (43, 45 - 50, 52 - 55). In order to avoid different
cut-off points for the 9 symptoms. we subdivided al1 the nine symptoms in ESAS into
the same 4 subgroups. To test the robustness of this approach, we also analysed
the data by using the following alternative cut-offs:
(i) none (O), mild (1 - 4), moderate (5 - 7). and severe (8 - 10);
(ii) none (0 - 1). mild (2 - 4), moderate (5 - 7), and severe (8 - 10).
Statistical Analysis
Primarv Outcome
Time to death from al1 causes was taken as the primary outcome. Patients who
were lost to follow-up were censored at their last clinic visit. Patients who were still
alive at the time of reporting were censored on the date of the telephone interview
which established their status. Survival times were measured from the date of first
consultation at RRRP.
Handling of Missing Data
Patients who were included in the database were compared with those not included.
The following characteristics that could be obtained from the electronic medical
records at the cancer centre were used for the comparison:
1. Age at first visit
2. Gender
3. Primary cancer site
4. Overall survival
Among patients included in the database, any CO-variates with at least 20% missing
values were eliminated from the analysis following a recommendation by Stephen
George in his paper "Identification and assessrnent of prognostic factors" (56). If the
CO-variate had less than 20% missing values, we estimated the missing value with
the rnedian of that CO-variate (method 1). To test the robustness of method 1 we
also employed the following methods:
Method 2: Discarding the subjects with the missing data.
Method 3: Matching other patients with similar CO-variate characteristics (age at first
visit, primary cancer site, site of metastases, weight loss. KPS, time from first
diagnosis of cancer to first consultation at Our clinic, and the analgesic consumption)
and replacing the missing value with the mode of that co-variate .
Method 4: Assigning a random number generated by the computer to the missing
value.
Minimum Subject Requirements
When separating the patients into prognostic subgroups on the basis of differences
within a CO-variate. for a CO-variate to be potentially prognostic, one would expect a
substantial difference in outcomes arnong the subgroups. A minimum number of
subjects is required in each subgroup for cornparisons to be meaningful (56). We
required arbitrarily at least 15 subjects in each subgroup.
Item Reduction
The purposes of item reduction employing univariate and multivariate analyses are
3-fold:
1. To eliminate redundant or inappropriate items.
2. To reduce the model to a manageable and feasible nurnber of items.
3. To create a sensible and valid prognostic model.
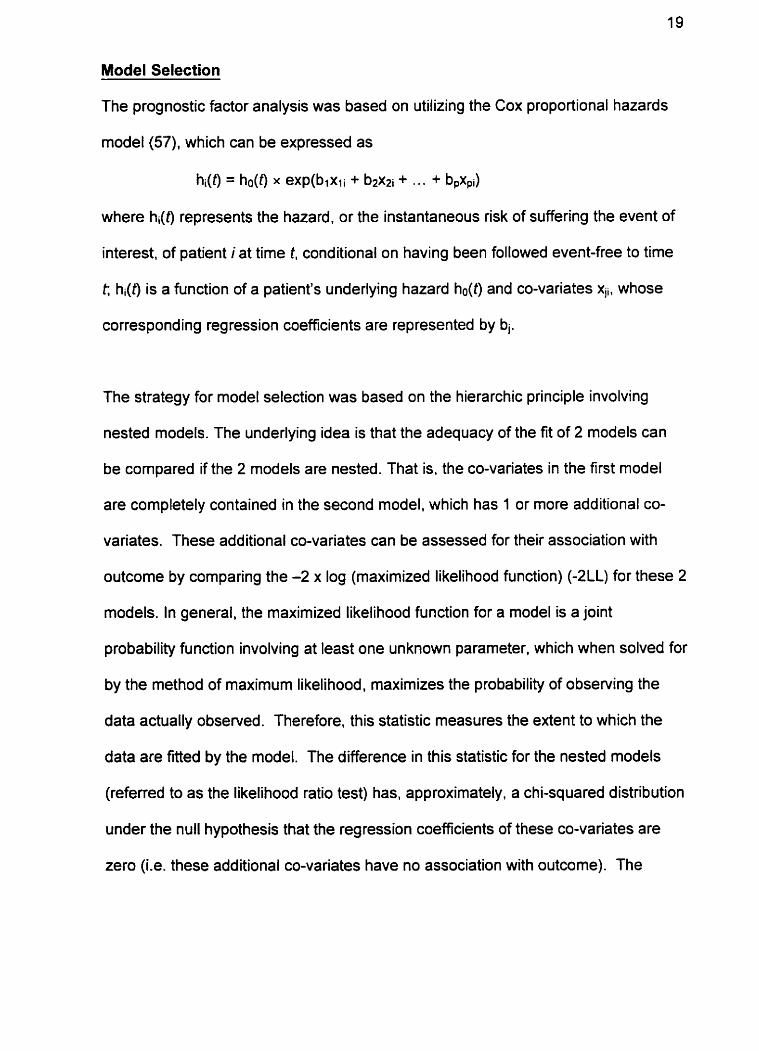
Model Selection
The prognostic factor analysis was based on utilizing the Cox proportional hazards
model (57), which can be expressed as
hi(Q = ha(t) x exp(bixii + b2xZi + ... + bpXpi)
where hi(t) represents the hazard, or the instantaneous risk of suffering the event of
interest, of patient i at time t, conditional on having been followed event-free to time
hi(t) is a function of a patient's underlying hazard ho(t) and CO-variates Xji, whose
corresponding regression coefficients are represented by bi.
The çtrateg y for mode1 selection was based on the hiera rchic princi ple involving
nested models. The underlying idea is that the adequacy of the fit of 2 models can
be cornpared if the 2 models are nested. That is, the CO-variates in the first model
are completely contained in the second model, which has 1 or more additional CO-
variates. These additional CO-variates can be assessed for their association with
outcome by comparing the -2 x log (maximized likelihood function) (-2LL) for these 2
models. In general, the maximized likelihood function for a model is a joint
probability function involving at least one unknown parameter, which when solved for
by the method of maximum likelihood, maximizes the probability of observing the
data actually observed. Therefore, this statistic measures the extent to which the
data are fitted by the model. The difference in this statistic for the nested models
(referred to as the likelihood ratio test) has, approximately, a chi-squared distribution
under the nul1 hypothesis that the regression coefficients of these CO-variates are
zero (Le. these additional CO-variates have no association with outcorne). The
number of degrees of freedom for this chi-squared distribution is the difference in the
number of parameters being fitted in the 2 models.
Univariate Analysis
Each of the 16 CO-variates was first examined individually for its association with
outcorne using Cox's proportional hazards model and the likelihood ratio test (see
above). As each of the CO-variates was defined as a categorical variable. one or
more dummy variables (Le. 011) were used in each case. In general. for k categories
k-1 dummy variables are required. For example, for primary site each of the sites
lung, prostate and others is explicitly defined by either a 1 (if patient belongs to that
site) or O (patient does not belong to that site). lmplicit in this is that the fourth
primary site category (breast), is defined when each of the 3 indicator variables
equals zero.
To protect against overfitting of the model. a rule of thumb suggested by Harrell et
al. was incorporated; namely. the number of events (deaths) should exceed the
number of potential CO-variate degrees of freedom by a ratio of at least 10 (36). To
this end and to adjust for multiple cornparisons based on the multiple CO-variates
under consideration a significance level of 1% was chosen to guide decisions for CO-
variate inclusion in the subsequent multivariate analysis.
Univariate results were illustrated using Kaplan-Meier survival plots (58) and su~ i va l
curves were cornpared using the log rank test or. if the CO-variate was ordinal, the
log rank test for trend (59).
Multivariate Analysis
Co-variates found to be statistically significant from the univariate analysis were then
ftted jointly into a Cox model. In the presence of multiple CU-variates, sorne might
cease to be important. Each CO-variate starting from the least statistically significant
was dropped individually from the model and the -2LL's from the nested models
were compared with and without that CO-variate. If the value of the difference in -2LL
was not increased significantly, the CO-variate was discarded. Once a CO-variate was
dropped, the effect of omitting each of the remaining CO-variates in turn was
examined.
Co-variates from the univariate analysis, which were not statistically significant on
their own, were at this point re-introduced into the model, one at a time. This
acknowledges the possibility that in the presence of other CO-variates these CO-
variates might show themselves to be statistically significant. This process may also
result in CO-variates found previously to be statistically significant losing their
significance.
The abave procedure avoids the use of a rigid significance level, so the muitivariate
analysis used a 10% level of significance to guide decisions about CO-variate entry
or omission (60). The results of the multivariate analysis were summarized using P-
values and 95% confidence intervals for CO-variate hazard ratios (HR). A HR is a
ratio of the risks for different subgroups of a CO-variate. For example, for a binary
CO-variate such as gender where males are coded as 1 and fernales O. a hazard
ratio of 1.75 would imply that the risk of dying among males is 1.75 tirnes higher than
among females.
Risk Group Stratification:
1. Partial Score Method
This approach was employed in the studies of survival prediction by ltalian and
Japanese investigators (3435). In order to obtain an easy-to-handle prog nostic
score for the prognostic factors retained in the final model. the value of each
statistically significant regression CO-efficient was divided by the smallest statistically
significant regression CO-efficient using a 10% level of sig nificance and the results
were rounded to the nearest integer, or to the nearest integer + 0.5. They were then
multiplied by 2 to obtain whole numben (partial scoresj. The survival prediction
score (SPS) for a given patient was obtained by adding together histher appropriate
partial scores. Three risk groups with approximately equal numbers of patients in
each group based on the SPS were modeled.
2. Number of Risk Factors Method
One method of risk group identification is based on the total number of risk factors a
patient possesses. This approach was adopted in constructing the International
lndex for aggressive Non-Hodg kin's Lymphoma (6 1 ). The final prognostic CO-
variates from the multivariate analysis in general were classified as risk factors. For
those CO-variates with more than 2 subgroups, only those subgroups with a
significant p value (~0.1) were classified as risk factors (table 11).
3. Prognostic lndex INomogram Method
The third approach used to estimate prognosis in new subjects employed the
prognostic index (PI) frorn a Cox regression model. The term in the Cox regression
model by which the CO-variates of the subject affect hislher hazard is b~x l i + b2x2, +
. .. + bPxpi . Denoting this expression PI, the Cox model equation simplifies to h (t, x)
= ~~(t)e' ' .
Estimation of Pl for a given subject was the first step in estimating the prognosis of
that subject. The PI for a subject defined his/her place within the prognostic
'spectrum' defined by the model. The PI could be utilized further in the estimation of
a survival curve, the probability of surviving for a given time and the median survival
time for the subject.
From the Cox model, the cumulative survival probability S (1. x) was estimated
corresponding to any combination of the CO-variates x = x~ . . . x, From equation
k(t. x) = -logeS(t, x). solving for S(t, x) this became S(t, x) = e-'-(LX! Following from
the assumption of proportionality of the Cox model. L(t, x) = k,(t)eP'. Since L,(t) was
estimated in a Cox analysis for the whole range of time t frorn zero to the longest
observation time, it was thus possible using these equations to estimate I(t , x) and
then S(t, x), which was the estirnated survival curve corresponding to a given value
of PI or a given combination of CO-variates. For a subject having the CO-variates
giving a certain PI. the median survival time was estimated as the time t for which
the estimated median survival curve S (t, x) reached 0.5. This was repeated for the
whole range of the possible PI values (62). This approach has been employed in
the literature (63.64). The probabilities of survival at 3. 6. and 12 months and the
median survival for the possible combinations of PI were computed in the
nomogram.
Means for Studying Predictive Accuracy
Indices of predictive accuracy are useful for judging the clinical utility of a predictive
model and for comparing the merits of cornpeting predictive models. There are two
major components of predictive accuracy: calibration (reliability) and discrimination.
Calibration refers to the amount of agreement between predicted and observed
outcornes. For example, if the patients of a given risk group are predicted to have
an 80% chance of surviving at least 6 rnonths, then 80% of such patients should
sunrive at least 6 months if the rnodel is reliable.
A list of survival probabilities was generated at al1 the event times for our 395
patients, based on the values of the selected CO-variates in the tinal model for each
patient. All patients were divided randomly into 8 groups (approximately 50 in each).
The average predicted survival probability of patients against the actual fraction of
patients surviving past 3, 6 and 12 months within each risk group was plotted.
Discrimination is the ability of a predictive model to discern patients having good
outcomes from those having poor outcomes. A model predicting an 80% likelihood
of living 6 months for everyone may have no discrimination ability.
Harrell et al proposed a general- purpose index of predictive discrimination called C
for "concordance". The C index is the probability that for a randomly chosen pair of
patients, the predicted and observed outcomes are concordant, Le. the patient
having the better outwme is the one having the better predicted outcorne. A value
of 0.5 indicates no predictive discrimination and a value of 1 .O indicates perfect
separation of patients with different outcomes (65).
The p-value as a criterion to select statistically significant CO-variates allows for the
hypothesis of no effect in the given sample to be ruled out but is not a measure of
clinical importance. Moreover, finding in a data-set statistically signifiant CO-
variates does not necessarily mean that a lot is understood about prognosis. In
linear regression. the proportion of variability in the outconie which is explained by a
model is measured by the multiple correlation coefficient R~ and therefore a greater
predictive value can usually be assigned to a model with greater R ~ . An analogous
measure for the predictive strength of a survival regression model in terms of the
amount of explained variability is as follows. As the likelihood is a measure of the
explained variation, the difference between the log-likelihood LL@) of the selected
model and the log-likelihood of the model with no covariates LL(0) can be
transformed into a measure of the proportion of explained variation, as follows:
1 -exp[-~(LL@)-LL(o))/N] (N= number of patients) (66).
Software Package
All analyses were carried out using SAS software (67).
Chapter 3: Results
Demoqraphics
A total of 483 patients were seen in consultation at RRRP in 1999. Three hundred
and ninety-five patients (82%) were included in the database that formed the training
set for the predictive model for survival.
Patient characteristics are summarited in table 4. There were 198 male and 197
female patients. The median age was 68 years. Lung, breast, and prostate cancers
were the rnost common primary sites. One third of Our patients presented with more
than 10% weight loss over the last 6 months.
One patient was lost to follow-up after the first visit and was censored at that time.
The median survival of the 395 patients was 19.4 weeks (range O - 103 weeks).
Three hundred and twenty-one patients had died and 74 remained alive at the time
of reporting. The rnedian follow-up of the surviving patients was 69 weeks and for
the entire group, 18.7 weeks.
Eighty-eight patients were not included in the database. Of those, 73 patients had
died and the median survival of this group was 15 weeks. When compared by age
at first visit, gender, primary cancer site, status (alive or dead), and median survival,
there were no statistically significant differences between patients included and not
included in the database (table 5). The overall survival curves of the 2 groups are
shown in figure 1.
Of those included in the database, seventy-six patients (19%) came from a hospital
or hospice at the time of first consultation. Bone metastases were diagnosed in 70%
of the patients and visceral metastases, 69%. One hundred and thirteen patients
(29%) presented with bone metastases only. Seventy-two patients (1 8%) were
referred because of brain metastases. Other events that stimulated referral were
bleeding, shortness of breath, tumour mass. spinal cord compression or cauda
equina syndrome.
Wthin 3 months prior to the first clinic visit. 109 (28%), 103 (26%) and 55 (14%)
patients had received palliative chemotherapy. hormonal therapy and
bisphophonates respectively.
The distribution of analgesic consumption in the study cohort was none in 102
(26%), non-opioids in 44 (1 1%), weak opioids in 54 (14%) and strong opioids in 195
(49%). Their median total daily morphine equivalent was 20 mg (range O - 18000
mg). Their symptom distress according to the modified Edmonton Symptom
Assessment Scale is listed in table 6. Fatigue was rated as the most severe
symptom followed by appetite and poor sense of well-being. Three hundred and
twenty eight (83%) patients were treated with palliative radiotherapy for symptom
control.
Univariate analysis of effects of prognosüc factors on survival
The frequency distributions of the 16 CO-variates that were included are shown in
figure 2. Data were complete for age, primary cancer site, site of metastases,
weight loss, KPS, and analgesic consumption. None of the remaining 10 CO-variates
had more than 20% missing values and each subgroup formed by grouping values
of each CO-variate had more than 15 patients (table 7). There was no significant
correlation among the 1 6 CO-variates.
The missing values were replaced by the median in al1 analyses. The robustness of
this method was tested by other methods and there was no change in the statistical
significance, except for pain in method 3 (p = 0.02) (table 8). We analysed the data
with Our preferred cut-offs for the ESAS symptoms and the other two alternatives for
the cut-offs as listed in the methods section. There was again no statistically
significant diverence. Based on the selection criteria of p < 0.01 for influence on
survival from the univariate analysis, 12 of the 16 CO-variates were chosen to enter
the initial regression model. The 12 CO-variates were primary cancer site, site of
metastases, weight loss, KPS, time from first diagnosis of cancer to first consultation
at RRRP, fatigue, nausea, depression, drowsiness, appetite, sense of well-being
and shortness of breath. Their survival curves are shown in figures 3a-p. The total
number of degrees of freedom on entry of selected CO-variates into the regression
model was 28 (table 9). Since there were 321 deaths in the database, the maximum
allowed degrees of freedom was 32 in order to avoid overfitting according to
Harrell's rule of thumb (36). The remaining four CO-variates were not significant in
the univariate analysis. They were age at first visit, analgesic consumption within
the last 24 hours of clinic visit, pain, and anxiety. They were, however, re-introduced
at a later stage in the multivariate analysis as described earlier.
Multivariate analysis
The model generated from the regression analysis contained 6 significant CO-
variates: prirnary cancer site, site of metastases, KPS, fatigue, appetite, and
shortness of breath (table 10). The overall p values for the CO-variates and their
hazard ratios are listed in table 10. The hazard ratio represents the ratio of the risks
between that subgroup and the subgroup with the best outcome within that CO-
variate.
For the partial score method, the p value for each subgroup was calculated. The
steps for calculating the partial scores were as follows (table 1 1):
1. Using a 10% level of significance, the value of each statistically significant
regression CO-efficient (p) was divided by the smallest statistically significant
regression CO-efficient (p of 0.261 65 for shortness of breath score 1 - 3)
among al1 regression CO-efficients.
2. The result was rounded to the nearest integer, or to the nearest integer + 0.5.
3. It was then multiplied by 2 to obtain a whole number (partial score).
4. A zero was assigned to the partial score if p > 0.1.
The partial score approach could be used in this setting since al1 variables were
categorical and represented by the same dummy variable system as described in
the statistical section. Examples of using the partial score method were as follows.
The regression CO-efficient (P) for prostate was 0.66386 (p = 0.0031), when this was
divided by the smallest significant P (0.261 65). this yielded 2.5372. When rounded
to the nearest integer, or to the nearest integer + 0.5, this became 2.5. This was
then multiplied by 2 to give a partial score of 5 (whole number). Similarly, P for lung
was 0.74021 (p c 0.0001), when this was divided by 0.26165, this yielded 2.82901.
On rounding, this becarne 3.0. Again. this was multiplied by 2 to give a partial score
of 6 (whole number). The p-values for fatigue score 1 - 3, appetite scores of 1 - 3
and 4 - 7 were > 0.1, therefore the partial scores for these subgroups were assigned
zero.
Our univariate analysis showed that the survival rate at 6 months was at 30%
(standard error = 5.4%) for patients scoring 4 - 7 on the shortness of breath scale
and 36% (standard error = 8.0%) for those scoring 8-1 0 respectively (table 7). This
most likely stemmed from the srnall sample size in the subgroup of 8-1 0. The
median survival of the 2 subgroups was the same (14 weeks). There was no reason
to believe that patients in the subgroup 8-10 survived longer than the counterparts in
the subgroup of 4-7. To maintain face validity, we assigned the same partial score of
4 to the subgroup of 8-10 as to the subgroup of 4-7.
Performance of the Model
The discrimination index of the model with the final 6 CO-variates was greater than
0.7 (table 12). The calibration is shown in figure 4. The analogous R~ of the model
was 0.31.
Risk G r o u ~ Stratification
1. Partial Score Method
The Survival Prediction Score (SPS) is defined as the sum of the partial scores for
primary cancer site, site of metastases, KPS, fatigue, appetite and shortness of
breath. The SPS ranged from O to 32. The frequency of the SPS is plotted in figure
5. Three risk groups based on the SPS were modeled. Using the SPS, 1331395
(34%) patients were classified in Group A when the SPS was 13 or less. 1291395
(33%) patients were in Group B when the SPS was 14-1 9, and 1331395 (34%)
patients were in Group C when the SPS was 20 or more. Patients in Group A had a
3-month, 6-month, and 12-month survival estimate of 83%, 70%. and 51 %
respectively; patients in Group BI 67%. 41%, and 20% respectively; and patients in
Group C , 36%. 18%. and 4% respectively (pc0.0001) (table 13 and figure 7).
Median survival and 95% confidence interval (95% CI) for each group were: Group A
= 53 weeks (38 -70 weeks), Group B = 19 weeks (17 -26 weeks), Group C = 8
weeks (6 -10 weeks) (p<0.0001).
Examples of using the SPS for specific patients are as follows: the SPS for a patient
with breast cancer, bone metastases only, KPS = 70, fatigue score of 5, appetite
score of 4 and shortness of breath score of 3 was: O + O + O + 4 + O +2= 6 (Group
A). The SPS for a patient with prostate cancer, bone metastases only, KPS = 40,
fatigue score of 9, appetite score of 6 and shortness of breath score of 2 was: 5 + O
+ 6 + 5 + O +2= 18 (Group 0). Another patient with lung cancer, both bone and
visceral metastases, KPS = 30, fatigue score of 10, appetite score of 9 and
shortness of breath score of 9, had a SPS of 6 + 6 + 6 + 5 + 4+ 4 = 31 (Group C)
(table 13).
Figure 6 dernonstrates that patients classified in the three risk groups had a very
different survival experience. It also shows the goodness of fit between the
estimated survival curves frorn Cox's mode1 and the actual outcorne estimated by
the Kaplan and Meier method.
2. Number of Risk Factors Method
The three groups were also stratified based on the total number of risk factors that
patients possessed. For those CO-variates with more than 2 subgroups, only those
subgroups with a p value ~ 0 . 1 were ciassified as risk factors (table 11). They
included:
a) prostate. lung, and others for the primary cancer site;
b) the subgroups of 4 - 7 and 8 - 10 for the fatigue;
c) the subgroup of 8 - 10 for the appetite;
d) the subgroups of 1 - 3 and 4 - 7 for shortness of breath. To maintain face
validity for reasons rnentioned earlier. the subgroup of 8-10 was classified as a
ris k factor too.
The 6 risk factors were (1) non breast cancer patients, (2) patients with metastases
in sites other than bone only. (3) KPS 5 50, (4) fatigue score 2 4. (5) appetite score
of > 8 and (6) shortness of breath > 1. The frequency distribution for total number of
risk factors possessed by patients is listed in figure 7.
With this procedure. 981395 (25%) patients were classified in Group I when they had
3 or less risk factors. 11 71395 (30%) patients were in Group II when they had 4 risk
factors, and 1801395 (46%) patients with 5 to 6 risk factors were in Group III.
Patients in Group I had a 3, 6, and 12 month survival of 85%. 72%. and 52%
respectively; patients in Group 11, 68%. 47%, and 24% respectively; and patients in
Group 111,46%. 24%. and 11% respectively (pc0.0001) (table 14 and figure 8).
Median survival and 95% confidence interval (95% Cl) for each group were: Group I
= 62 weeks (41 - 70 weeks), Group II = 24 weeks (18 - 29 weeks), and Group III =
11 weeks (9 - 14 weeks) (p<0.0001) (table 14).
Examples of using the num ber of risk factors for the sarne set of patients are as
follows: the number of risk factors for a breast cancer patient with bone only
metastases, KPS = 70. fatigue score of 5, appetite score of 4 and shortness of
breath score of 3 was 2 (Group 1). The number of risk factors for the prostate cancer
patient with bone only metastases, KPS = 40, fatigue score of 9, appetite score of 6
and shortness of breath score of 2 was 4 (Group II). Similarly, the patient with lung
cancer, both bone and viscerai metastases, KPS = 30, fatigue score of 10, appetite
score of 9 and shortness of breath score of 9 had 6 risk factors (Group III) (table 14).
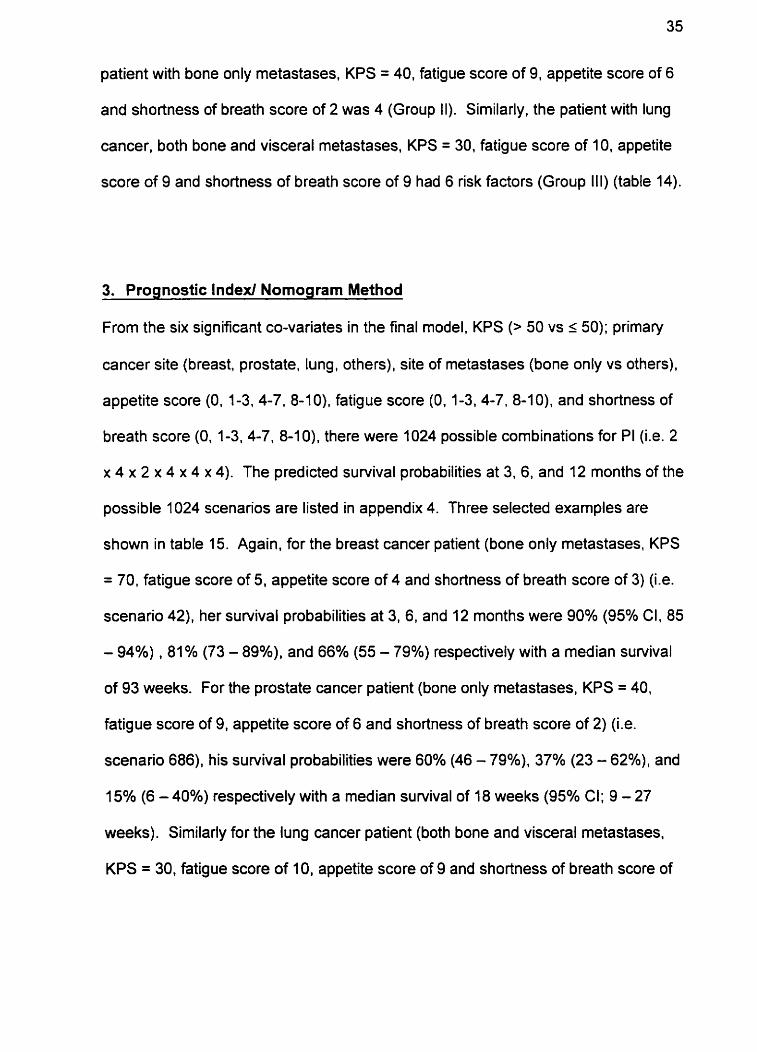
3. Prognostic Index1 Nomogram Method
From the six significant CO-variates in the final model, KPS (> 50 vs a 50); primary
cancer site (breast, prostate, lung, others), site of metastases (bone only vs others),
appetite score (0, 1-3.4-7. 8-10). fatigue score (0. 1-3.4-7, 8-10), and shortness of
breath score (0, 1-3. 4-7, 8-1 O), there were 1024 possible combinations for PI (Le. 2
x 4 x 2 x 4 x 4 x 4). The predicted survival probabilities at 3, 6, and 12 months of the
possible 1024 scenarios are listed in appendix 4. Three selected examples are
shown in table 15. Again, for the breast cancer patient (bone only metastases, KPS
= 70, fatigue score of 5, appetite score of 4 and shortness of breath score of 3) (Le.
scenario 42), her suwival probabilities at 3, 6, and 12 months were 90% (95% CI. 85
- 94%) ,81% (73 - 89%), and 66% (55 - 79%) respectively with a median suwival
of 93 weeks. For the prostate cancer patient (bone only metastases, KPS = 40,
fatigue score of 9, appetite score of 6 and shortness of breath score of 2) (Le.
scenario 686), his survival probabilities were 60% (46 - 79%). 37% (23 - 62%), and
15% (6 - 40%) respectively with a median survival of 18 weeks (95% CI; 9 - 27
weeks). Similarly for the lung cancer patient (both bone and visceral metastases.
KPS = 30, fatigue score of 10, appetite score of 9 and shortness of breath score of
9) (Le. scenario 896), the survival probabilities were 13% (5 - 33%). 2% (O - 11 %),
and 0% (O - 2%) respectively with a median suwival of 5 weeks (95% CI; 3 - 7
weeks).
Chapter 4: Discussion
Many treatment goals and decisions are dependent on how advanced the cancer is.
For patients presenting with the early stages of cancer, treatment is aimed at cure,
remission. or control of the disease. As the illness progresses and the patient's
condition deteriorates. the burden of treatments may begin to outweigh their
benefits. Others rnay present with metastatic disease at initial diagnosis. When cure
or remission is not possible, treatment goals may change appropriately from
prolonging life to controlling symptoms and improving the quality of life. The
transition from traditional to palliative care can be very difficult in caring for patients
with advanced cancer. The detemination of the prognosis and life expectancy is
critical to the discussion of care for patients with terminal disease.
It is dificult to determine prognoses, as patients with advanced cancer may develop
an acute illness (e.g. pulrnonary ernbolus, sepsis) resulting in unexpected death. On
the other hand, studies have shown that most patients who enroll in a hospice do so
late in the course of their disease, when they may not benefit from al1 the services
the hospice has to offer (5, 6, 68, 69). Moreover, a shortened length of stay in a
hospice has been associated with increased suicida1 ideation experienced by
patients (7O), as well as more ditficult bereavement for careg ivers (71). These
studies ernphasize the importance of continued research in this area to predict
survival more accurately in patients near the end of life.
To date, assessing life expectancy for patients with advanced cancer has been
relatively inaccu rate. Studies have attempted to identify specific prog nostic factors
for patients near the end of life. However. most of them are small retrospective
studies and suffer from statistical flaws. We attempted to analyze the potential
prognostic factors collected prospectively in this group of patients with sound
statistical methodology.
Statistical vs Judgernental Approaches
The selection of multiple potential prognostic factors for a prognostic model and the
approach to reducing them to a manageable and feasible nurnber can be dictated by
empirical data or based on clinical judgement. These are called respectively the
statistical and the judgemental approaches.
The statistical approach uses large databases to identify CO-variates which are CO-
related with an outcome of interest. Although these statistical approaches are
mostly empirically based, they al1 include some elements of judgment. Overt
judgements are eliminated by the statistical process but subtle judgements are
imbedded in the process.
The judgemental approach is used either when no empirical data are available;
when the goal is to develop a measure of a clinical concept such as disease activity
or disease severity where there is no gold standard; or when by the time the data
are collected the clinical environment may have changed to the point that any
prediction derived from these data may be outmoded.
Methods of choosing and weighing candidate items to describe a clinical judgement
include tradition, conventional wisdom, personal experience or consensus as a
guide to what is important. Both the Apgar score (72,73) and the Glasgow Coma
Scale (74, 75) are 2 examples of the judgemental approach. In 1953, Virginia Apgar
proposed the Apgar Score as a means of evaluating the physical condition of infants
shortly after delivery. Each of the five easily identifiable characteristics - heart rate,
respiratory effort, muscle tone, reflex irritability , and colour - was assessed and
assigned a value of O - 2. The total score is the sum of the five components (72).
The Glasgow Coma Scale was developed by Teasdale and Jennett. It is composed
of independent observations of three aspects of behavior: eye opening (on a scale of
1 - 4), the best motor responsiveness (1 - 6), and the best verbal responsiveness (1
- 5). which, when summed, yield an overall numerical rating between 3 and 15 (74,
75).
Since the clinicians' estimate of survival of patients with metastatic cancer is often
incorrect and there has been only one article from the radiation oncology setting to
guide the judgemental approach, we preferred to ernploy the statistical approach in
Our rnodel.
Choice of Measurement Tool
The Edmonton Symptom Assessment Scale (ESAS) was designed by Bruera and
associates. It consists of nine 100mm visual analog scales (VAS) for pain, activity,
nausea, depression, anxiety, drowsiness, appetite, sense of well being and
shortness of breath (O = lack of symptom, 100 = worst possible symptom). It is a
simple and useful method for the açseçsment of patients receiving palliative care,
and can be applied repeatedly to a very il1 population (76). The ESAS was slightly
rnodified by Philip et al for the Australian population in their longitudinal study (77).
The variable 'weakness' was substituted for 'activity' as performance status was
reported regularly, and a measurement of pain relief was added. These authors
concluded that the modified ESAS had satisfactory face, construct and criterion
validity as well as repeatability when compared with both the Rotterdam Symptom
Checklist and the Brief Pain lnventory (BPI).
Chang and associates noted that the ESAS distress score correlated most closely
with the physical symptom subscales of the Functional Assessrnent of Cancer
Therapy (FACT) and the Memorial Symptom Assessment Scale (MSAS) as well as
with KPS (78). The ESAS individual item and summary scores showed good interna1
consistency and correlated appropriately with corresponding measures from the
FACT and MSAS instruments, Individual items between the instruments correlated
well. Pain ratings in the ESAS, MSAS, and FACT correlated best with the "worst-
pain" item of the Brief Pain lnventory (BPI). These authors confimed that ESAS
was a valid instrument.
Paice and Cohen examined the validity of a verbally administered O - 1 0 numeric
(pain intensity) rating scale with the VAS using convergence methods. The
correlation between the two was strong and statistically significant (r = 0.847, p <
0.001), supporting the validity of the former. They concluded that the verbally
administered O - 10 numeric rating scale provides a useful alternative to the VAS.
particularly as more contact with patients is established via telephone (79).
We have therefore further modified the ESAS to an 1 1- point categorical scale (0-1 0,
O = lack of symptom. 10 = worst possible symptom) to facilitate a subsequent
telephone follow-up. Since the ESAS has been used extensively as a measurement
tool in palliative care services, our use of the modified ESAS allows us to compare
symptoms of patients across studies.
Choice of Co-Variates in Item Generation
Performance status, and symptoms comprising part of the 'terminal cancer
syndrome' as identified by Reuben et al (10) were most predictive of survival in the
literature. We have therefore included weight loss, KPS, and the symptoms in the
ESAS in the item generation phase of Our study. The usual cut-off for weight loss in
the literature is 10% over the last 6 months. Since the majority of our patients were
referred for palliation of bone pain, we included both the severity of pain and
analgesic consumption as potential prognostic factors.
Initially high KPS scores do not necessarily result in longer survival because scores
frequently drop precipitously. In contrast. very low scores (1 0 - 20) are associated
with death within 3 months. Most of Our patients were ambulatory. In view of the
KPS distribution in Our study population, we have arbitrarily divided Our patients into
KPS s 50 (KPS 50 = requiring considerable assistance from others and frequent
medical care) and KPS >5O (KPS 60 = requiring occasional assistance from others
but able to care for most needs).
From ciinical experience in the clinic. patients with breast and prostate cancers
survive longer in general when compared with those suffering from lung cancer; and
patients with bone only metastases live longer than patients with visceral
metastases. These observations explain the rationale for including the primary
cancer site and site of metastasis in the univariate analysis. Primary cancer site was
further categorized into 4 subgroups because patients with primaries of lung, breast.
and prostate comprised the majority of the referrals.
The duration between first diagnosis of cancer and diagnosis of metastatic disease
may reflect the aggressiveness of the disease. The time of first diagnosis of cancer
could be accurately obtained from the pathology report or from the history. Since it
was difficult to ascertain the date of diagnosis of first metastasis. we chose the time
from first diagnosis of cancer to first consultation in the palliative radiotherapy clinic
as a 'surrogate'. Based on the distribution of such time, we chose 12 months as the
cut-off.
The age of the patient rnay influence not only Our recommendation of the treatment
options, but also our prediction of their remaining lifespan. Since increasing age is
probably not associated with decreased s u ~ i v a l in a hospice setting (15).
categorizing age into several subgrou ps is not necessary.
It is not common practice to perform routine blood work in patients attending out-
patient palliative radiotherapy clinics. We have not included any biochemical nor
molecular markers in Our prospective database. Moreover, the clinicians' prediction
is often incorrect in the optimistic direction. Furthemore, the prediction of the
clinician is likely to depend on experience and training and is poorly reproducible,
and therefore we did not include this variable.
Difference in Median Survival and KPS
Since most of the studies which used prognostic factors to predict survival were
performed in hospices and palliative care programs, the reported median survival
was usually no longer than 12 weeks (1 5). To date, one of the better palliative
prognostic predictions for the staging of terminally il1 cancer patients was developed
by a group of Italian clinicians. They employed a training set of 519 patients. with
subsequent successful validation in their testing set of 451 patients, to develop their
model. The median survival of the 2 sets of patients was 32 and 33 days
respectively . They therefore reported the results with reference to 30-day survival
probability (35, 40).
Patients attending out-patient palliative radiotherapy clinics represent a less
advanced group when cornpared with those in hospices. The median survival of Our
395 patients was 136 days (1 9.4 weeks). Grabowski et al reported a median
survival of 4 months in 97 patients who undennient radiation treatment for metastatic
cancers. Because of the longer median survival, they reported the prog nostic
predictors at 2,4, 8, and 16 months (29). In the present study we have chosen to
evaluate survival at 3, 6 and 12 months.
Karnofsky Performance Status has been regarded as the most important predictor
for survival. Patients attending the palliative radiotherapy clinics had better KPS
scores when compared with those in the hospices (table 16). One therefore needs
to exercise caution in comparing the patient populations and extrapolating the
prognostic predictors from hospice settings to out-patient palliative radiotherapy
clinics or vice versa.
Prognostic Factors
We identified primary cancer site, site of metastases, KPS, fatigue, appetite, and
shortness of breath as significant prognostic factors in the model generated from
multivariate regression analysis. In previous studies of patients in their last months
of survival, the site of the primary and extent of metastatic disease were predictive of
survival in only 2 of 19 studies (29, 32). Most studies of advanced terminally il1
cancer patients such as in hospice facilities suggest the survival of those patients is
not significantly correlated to primary cancer site, initial extent of disease at
presentation, and current sites of metastases. Patients attending radiotherapy
clinics are mostly ambulatory , representing a less advanced group of patients.
Performance status has shown the best correlation with the length of survival in the
literature (7, 10, 16, 19, 20, 25-27, 29. 31, 33-35). Symptoms comprising part of the
'terminal cancer syndrome' identified by Reuben et al were strong predictors of poor
survival, including appetite and shortness of breath (10). The significant predictors
in Our rnodel were consistent with the above observation and also in keeping with
those identified in the systematic review by Vigano et al (table 17) (1 5). Weig ht loss.
however, was not statistically significant in our multivariate analysis, although the
appetite score 8 - 10 was a significant predictor.
Llobera and colleagues identified the presence of asthenia as a major predictor of
short survival (80). Asthenia is a Greek word meaning without strength. It has been
defined as 'profound tiredness occurring after usual or minimal effort, accompanied
by an unpleasant anticipatory sensation of generalized weakness'. It is a
devastating symptom for which few effective treatments exist (81). Vigano et al
reported anorexia and fatigue to be the syrnptoms given the highest scores for
distress among terminal cancer patients. Anorexia. asthenia, and weight loss are
the hallmark of cancer cachexia (82). In Our population, fatigue, appetite, and poor
sense of well-being received the highest scores for the symptom distress using the
modified ESAS (table 6). Fatigue was an independent predictor of survival in Our
model.
Based on the final model, we generated 3 risk groups with different levels of survival
using 3 different methods: (1) partial score method, (2) number of risk factors
method, and (3) prognostic index lnomogram method. The first and third methods
took into account the different prognostic weightings whereas the second assurned
equal weighting among the 6 prognostic factors. However, the nomogram requires a
table andlor calculator, and is less appealing to daily practice. The former 2
methods can be condensed in pocket-size tables for easy reference (tables 18 and
19). The nomogram permits the assignment of a survival probability to each case
without calculation. Alternatively the normogram results can be readily retrieved in a
palm pilot program. Nevertheless, the partial score method is preferable because of
its inclusion of the prognostic weightings of the predictors and easy applicability.
Potential Limitations
Our study has several limitations. We have not included al1 of our patients in the
year 1999. The model was developed from mentally competent English speaking
patients. There may be potential important prognostic factors that have been omitted
in the item generation phase of our study. Our dichotomizing some CO-variates and
categorizing the others into subgroups may not identify the cutoffs with the best
discriminating capacity. As mentioned earlier, the sample size was small for the
subgroup of patients with shortness of breath scores of 8 - 10.
Coates and associates reported that the global scale and the scales of physical,
role, emotional, cognitive and social function in the European Organization for
Research and Treatment of Cancer (EORTC) QLQ-C30 Quality of Life (QL) Scores
were each significantly predictive of subsequent survival duration in univariate
analyses. Single-item QL scores for overall physical condition and overall quality of
life. and the global and social functioning scales remained independently prognostic
after allowing for performance status and age, and, among solid tumor patients,
metastatic site (83).
The prognostic value of patient-rated performance status has been assessed (84 -
87). Loprinzi et al asked 11 15 patients with advanced lung or colorectal cancer to
rate their KPS and the Eastern Cooperative Oncology Group (ECOG) performance
status and answer questions about their nutritional status before receiving
chemotherapy (84). Physicians also rated the patients' performance status. In a Cox
multivariate analysis, both the physician-judged and patient-judged performance
status were independent significant predictors of survival. Physicians tended to give
a higher rating of performance status than did the patients themselves. In addition,
patient's own rating on nutritional factors such as appetite and food intake was a
significant independent predictor fur survival.
Some investigators have reported that non-clinical attributes of patients, such as
religion (88, 89) and social support (90). affect survival of patients. Cancer patients
suffer frorn a number of psychosocial problems related to the progression of their
disease as well as medical interventions. Anxiety and depression are very common
problems among them. Psychotherapy, both group and individual, has been shown
to be effective in improving quality of life, and in some cases, there is evidence of
extended survival time (91 - 93). Moreover. Phillips and King studied whether
persons were able to prolong life until they had reached a symbolically rneaningful
event. They showed that Jewish mortality fell sharply below the expected level just
before Passover and rose by an equal amount above expected immediately
afterwards. In contrast, non-Jewish control groups showed no significant fluctuation
of rnortality around Passover. They concluded that some Jews were briefly able to
prolong life until after the Jewish holiday. They suggested that symbolic meaningful
events in the patient's life and culture may have a pronounced short-terni impact on
mortality (94). Others have found that psychosocial factors are not associated with
survival in teminally il1 hospice patients (1 0, 95).
Future Work
The final model based on simple clinical CO-variates proved to be statistically
significant in a multivariate analysis. It does not require any invasive investigations
including blood sampling, or any assistance from experienced physicians. The
present study stresses the importance of patient's subjective symptoms. Three
approaches were employed in risk group stratification. The model appears
promising in this population (training set). Although the calibration and
discrimination of Our predictive model from the training set was satisfactory. the
analogous R~ was 0.31. Most of the investigators do not report the R~ result of their
predictive model in the literature, therefore it is difficult to interpret the actual
correlation of the analogous R* with the predictive ability of the model in the
subsequent validation sets. Personal communication with statistician colleagues
indicates that most of the predictive models reported in the literature have R~ less
than 0.4. Nevertheless, our current models from the training set will need to be
validated in an independent series (testing test). Work is in progress to validate the
model in the prospective database of year 2000. If the model is successfully
validated in the testing test, it needs to be externally validated in similar settings in
other cancer centres. Other future projects would include the comparison of
predictive ability between the partial score method and number of risk factor
methods, and comparison of the current model with that derived from recursive
partitioning .
Potential Use of the Validated Model
The model would facilitate the decision to shift from cure to care and the subsequent
enrollment of the patient in a hospice program (for example, patients in Groups C or
III would be most eligible for hospice admissions). Counselling with the patients and
families on expected survival can be guided by the model. This would help the
patients to have realistic expectations to guide their planning of end-of life issues
and treatment expectations.
Patients could be classified
trials. thereby ensuring that
into prognostically homogeneous subgroups for clinical
important prognostic factors are well balanced between
treatment groups. Patients with advanced solid tumors may be included in phase I
clinical trials. In such studies, the benefit expected is generally lower than the
likelihood of toxicity and may even be non-existent if the patient's life expectancy is
too short. It would thus be of crucial importance to select patients for phase I studies
that have a fair chance of sornewhat longer survival and adequate tolerance in order
to assess longer term toxicity (96. 97). Patients in Groups C or III have less than
three months of life expectancy and, as they would not be assessable for the
toxicity. they should not be treated in a phase I clinical trial. In contrast, patients in
Groups A or I would have a life expectancy of more than six months and might
experience the therapeutic benefit of a phase I clinical trial. whatever the possible
toxicity .
The same consideration applies to the radiotherapy trials of bone metastases. Price
et al reported a prospective randomized trial of single and multifraction radiotherapy
schedules in the treatment of painful bony metastases. Cornpliance with the follow
up was limited due to early death of the patients. Thirty percent of the study patients
died within three rnonths of randornization (52). This threatened the validity of the
study conclusion. Patients in Groups C or III with median sunivals of 8 and 11
weeks respectively rnay not be ideal candidates for future bone metastases trials.
Palliative radiation therapy plays a crucial role in maintaining quality of life for many
advanced cancer patients. For those predicted to have brief sumival (e.g. patients in
Groups C or III), protracted radiation schedules are a burden for the patient
notwithstanding the health economic issues this raises (98). Patients in this
category might be more appropriately treated with single fractionation for bone
metastases, and perhaps with steroid and supportive care only in patients with brain
metastases in view of the questionable effectiveness of whole brain radiotherapy in
patients with brief survival. Certain groups of patients may be expected to have
prolonged survival. Patients in Groups A or I would be examples. In these cases. the
use of more conventional fraction size and longer overall treatment time rnay be
warranted (99). considering the potential long-term morbidity associated with a rapid
fractionation scheme (29).
Application of the Future Validated Model
Research airned at identifying prognostic factors of survival in advanced cancer
patients is not only delicate but also risky. The probabilistic nature of the model
acquired has to be emphasized and the use of the model requires great caution in
the individual case. The survival prediction can be given only in ternis of a
probability (1 00).
The model shouid not delay patient access to palliative and supportive care services
at an early phase in the iilness when such intervention would be appropriate in
meeting patient I families expectations and needs.
Guidelines have been suggested for evaluation of the methods used and of the
findings from the studies on the prognostic factors. Readers should ask the
following questions before they apply the model to their practice (101):
1 . Epidemiolog ical validity
a) whether the sample of patients was representative and well-defined at a
similar point in the course of the disease
b) whether follow-up was sufficiently long and complete
c) whether the outcome criteria used were objective and unbiased
d) whether there was adjustment for important prognostic factors
2. Biostatistical consistency
a) the likelihood of the outcome event(s) in a specific period of time
b) the precision of the estimates of the likelihood
3. Clinical applicability
a) whether the study patients were similar to one's own
b) whether the results will lead directly to selecting or avoiding therapy
c) whether the results are useful for reassuring or counselling patients
Studies involving multiple centers may offer the best chance of developing an
accurate predictive mode1 for survival in palliative setting (1 3). Future research
should focus on KPS. terminal cancer syndrome, and should perhaps incorporate
psychosocial correlates while avoiding routine blood work. A bedside model. the
Apgar Score, has been established for prognostic detemination of beginning of life

(72). A similar system applied judiciously would be of equal value at life's end and
may assist in dealing with the difficult question of "how long do I have to live?" (31).
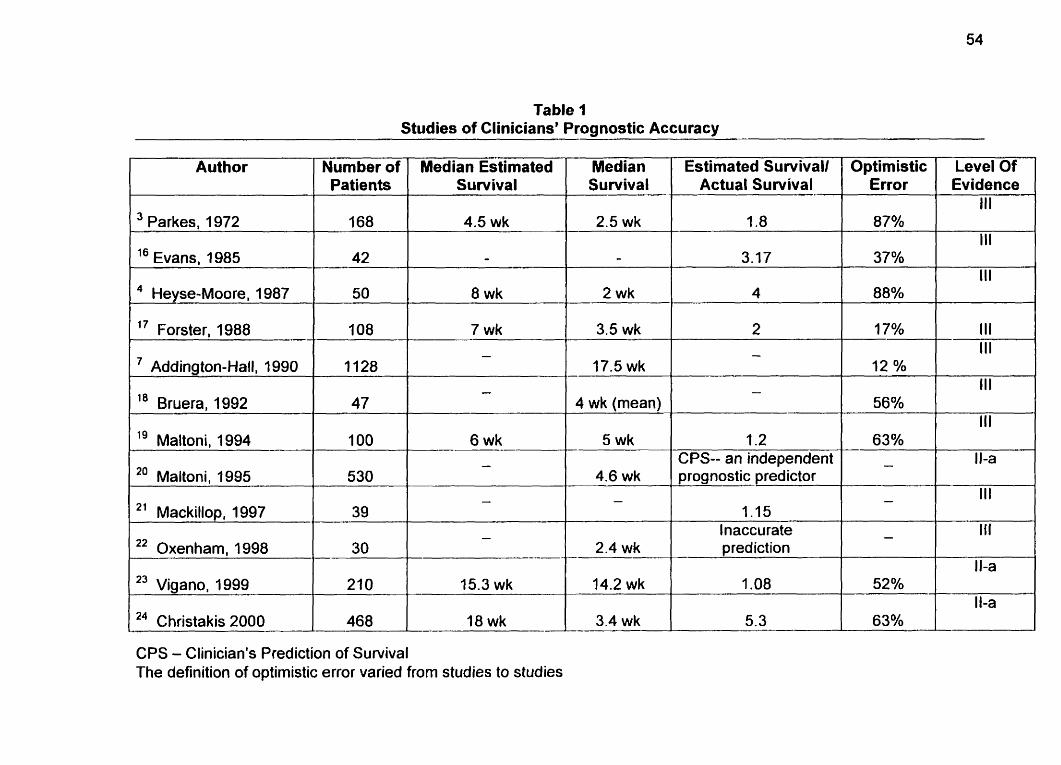
Table 1 Studies of Clinicians' Prognostic Accuracy
Median Estirnated Sun, ival
Median Estimated Survivall Survival Actual Survival
Optimistic Level Of Error Evidence
Nurnber of Patients
1 '' Evans. 1985
Heyse-Moore, 1987
l 7 Forster. 1988 III III
12 % III
56% 111
- 63% - Il-a
Addington-Hall. 1990 0 4 wk (mean)
/ l g Maltoni. 1994 5 wk 1.2 CPS-- an independent 1 20 Maltoni. 1995 4.6 wk prognostic predictor
I Inaccurate 2' Mackillop, 1997
22 Oxenham, 1998
23 Vigano, 1999
24 Christakis 2000
2.4 wk prediction
-
CPS - Clinician's Prediction of Survival The definition of optimistic error varied from studies to studies
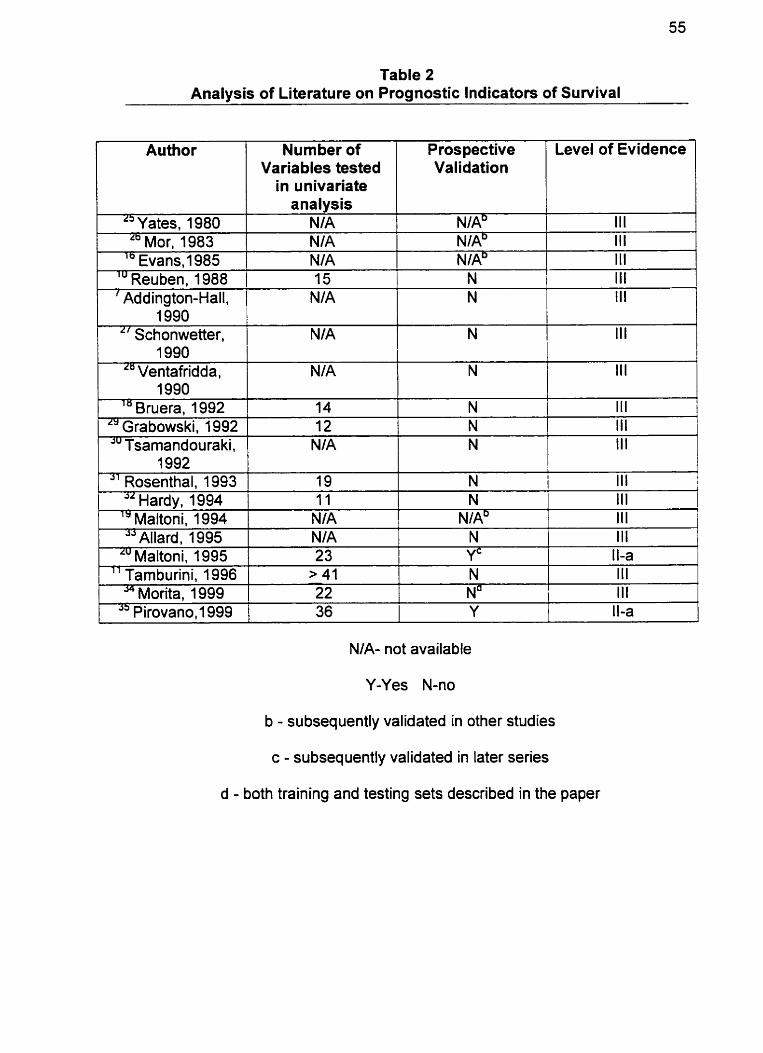
Table 2 Analysis of Literature on Prognostic lndicators of Suwival
1 1 Variables tested 1 Validation 1 1 Author
I 1 in univariate 1 I Nurnber of Prospective / Level of Evidence
" Yates, 1980 Lb Mor. 1983
L
" va ni, 1985 l u Reuben, 1988 ' Addington-Hall.
L
.'" Tsarnandouraki. 1 NIA 1 N 1 Ill
analysis NIA NIA NIA 15
NIA 1990 1
NIA" NIAD
N
N
" Schonwetter. 1990
Ventafridda, IWO
" Bruera, 1992 1 Grabowski. 1992
1992 Rosenthal. 1 993
Hardv. 1994
III III
NIAb
III
III
NIA
NIA
14 12
" altoh hi, 1994 JJ Allard. 1 995
Lu Maltoni. 1995
NIA- not available
Y-Yes N-no
b - subsequently validated in other studies
c - subsequently validated in later series
d - both training and testing sets described in the paper
III
19 11
" Tamburini, 1996 S+ Morita. 1999
N 1 III
N 1 III
N
N N
III 1
III NIA NIA
> 41 1 N
N
Ill
l III III
NIA' N
L
III
11 1
23
22 I Na I III
Yc 1 1 La
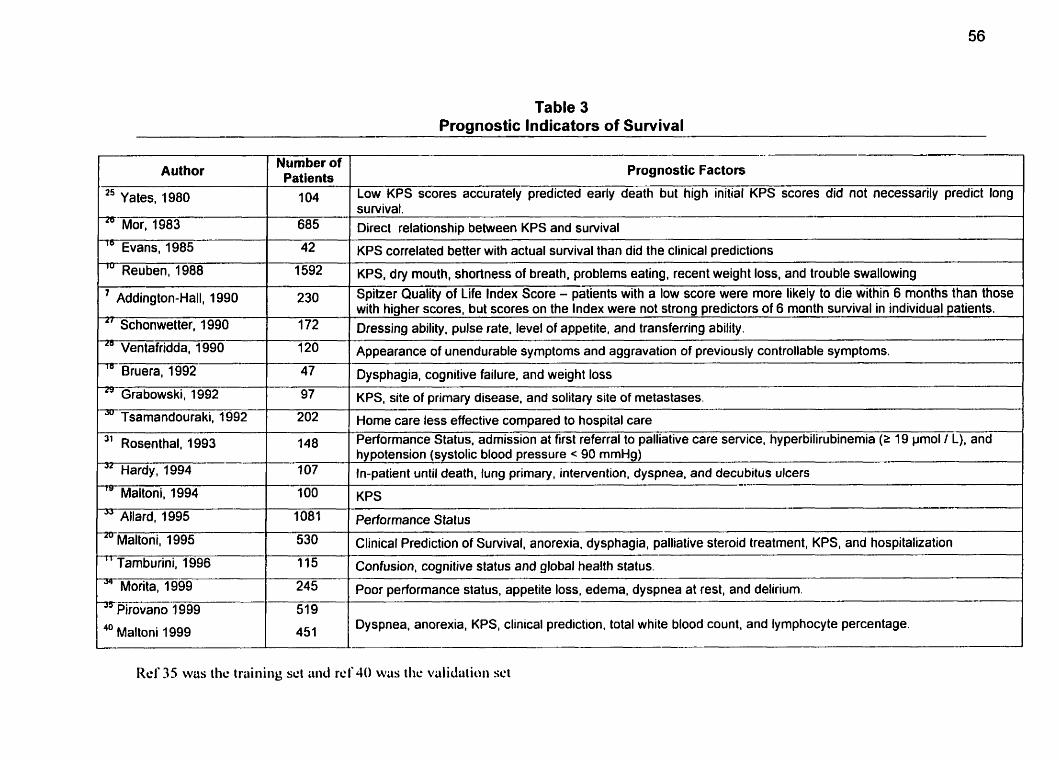
Table 3 Prognostic lndicators of Survival
Prognostic Factors Author Number of Patients
Mor, 1983 1
1 685 f 1 " Y a tes, 1 980 '1041
Addington-Hall, 1990
Schonwetter, 1990
Ventafridda, 1990
Bruera, 1992
" Evans, 1985
'" Reuben, 1988
42
1592
" Grabowski, 1992
JU Tsarnandouraki, 1992
" Tamburini, 1996
Morita, 1999
97
202
Rosenthal, 1993
Hardy, 1994
78 Maltoni, 1994
JJ Allard, 1995
-~aitoni, 1995
148
1 07
O0
1081
530
Low KPS scores accurately predicted early death but high initial KPS scores did not necessarily predict long
Pirovano 1999
40 Maltoni 1999
survivat. Direct relationship between KPS and survival
519
451
- - -- - --
KPS correlated better with actual survival than did the clinical predictions -
KPS, dry mouth, shortness of breath, problems eating, recent weight loss, and trouble swallowing
Spitzer Quality of Life lndex Score - patients with a low score were more likely to die within 6 rnonths than those with higher scores, but scores on the lndex were not strong predictors of 6 month sunrival in individual patients. Dressing ability, pulse rate, level of appetite, and transferring ability.
Appearance of unendurable symptoms and aggravation of previously controllable symptoms.
Dysphagia, cognitive failure, and weight loss -
KPS, site of primary disease, and solitary site of metastases.
Home care less effective compared to hospital care Performance Status, admission at first referral to palliative care service, hyperbilirubinemia (2 19 pmol 1 L), and hypotension (systolic blood pressure < 90 mmHg) In-patient until death, lung primary, intervention, dyspnea, and decubitus ulcers
KPS
Performance S tatus
Clinicat Prediction of Sunrival, anorexia, dysphagia, palliative steroid treatment, KPS, and hospitalization --
onf fui ion, cognitive G t u s and global health statu~. --
Poor~~rformance statu~, appetite loss, ederna, dyspnea at rest, and delirium.
Dyspnea, anorexia, KPS, clinical prediction, total white blood count, and lymphocyte percentage.
Rel' 35 wus the trüiiiiiig set üiid r d JO was i l ic valiclütioii sci
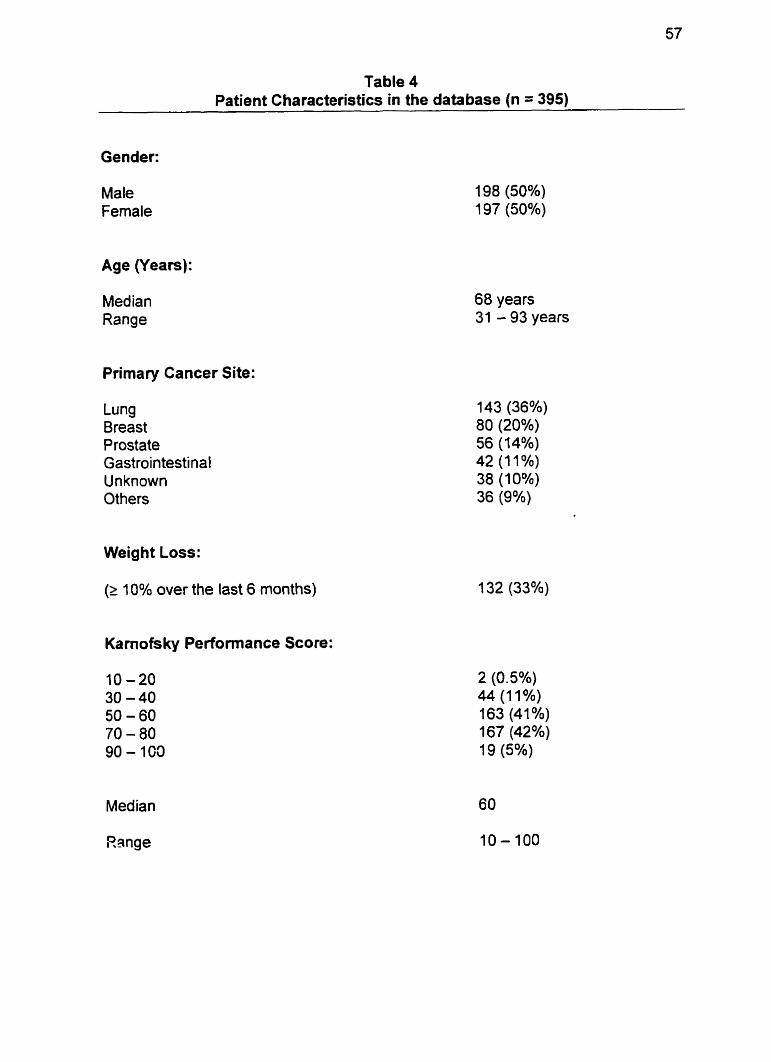
Table 4 Patient Characteristics in the database (n = 395)
Gender:
Male Female
Age (Years):
Median Range
Primary Cancer Site:
Lung Breast Prostate Gastrointestinal Unknown Others
68 years 31 - 93 years
Weight Loss:
(2 10% over the last 6 months)
Kamofsky Performance Score:
Range
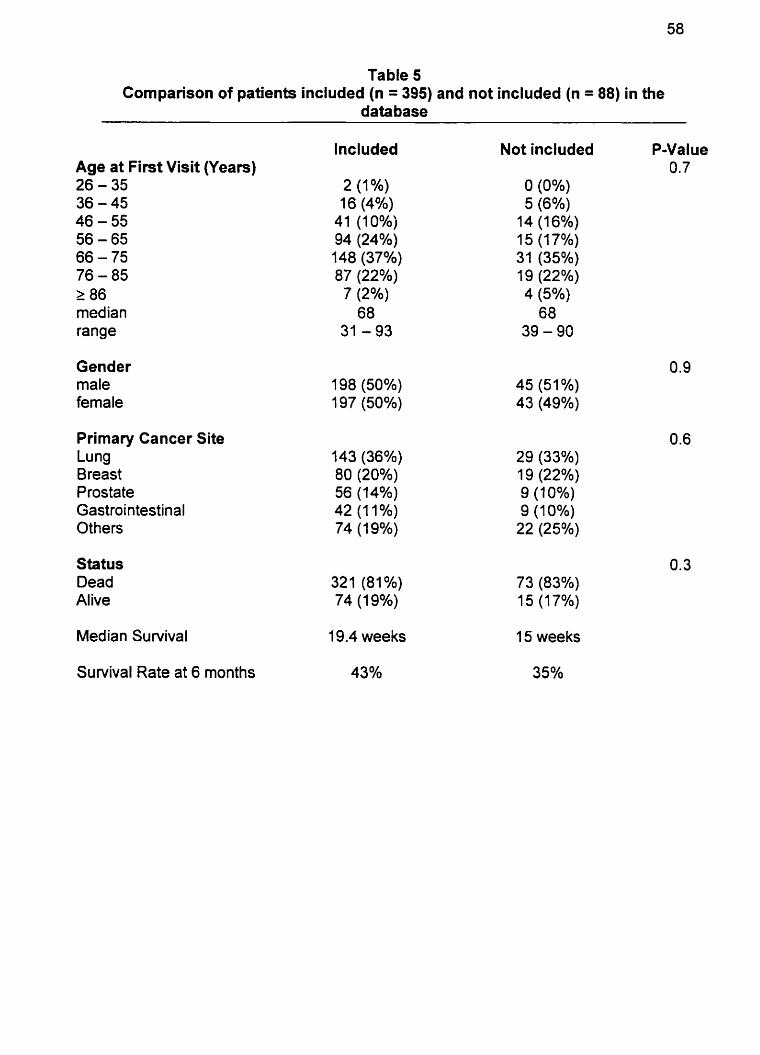
Table 5 Cornparison of patients included (n = 395) and not included (n = 88) in the
data base
Age at First Visit (Years) 26 - 35 36 - 45 46 - 55 56 - 65 66 - 75 76 - 85 2 86 med ian range
Gender male female
Primary Cancer Site Lung Breast Prostate Gastrointestinal Others
Status Dead Alive
lncluded
19.4 weeks
Not included P-Value 0.7
O (0%) 5 (6%)
14 (16%) 1 5 (1 7%) 31 (35%) 19 (22%) 4 (5%) 68
39 - 90
1 5 weeks
Sunrival Rate at 6 months 43% 35%
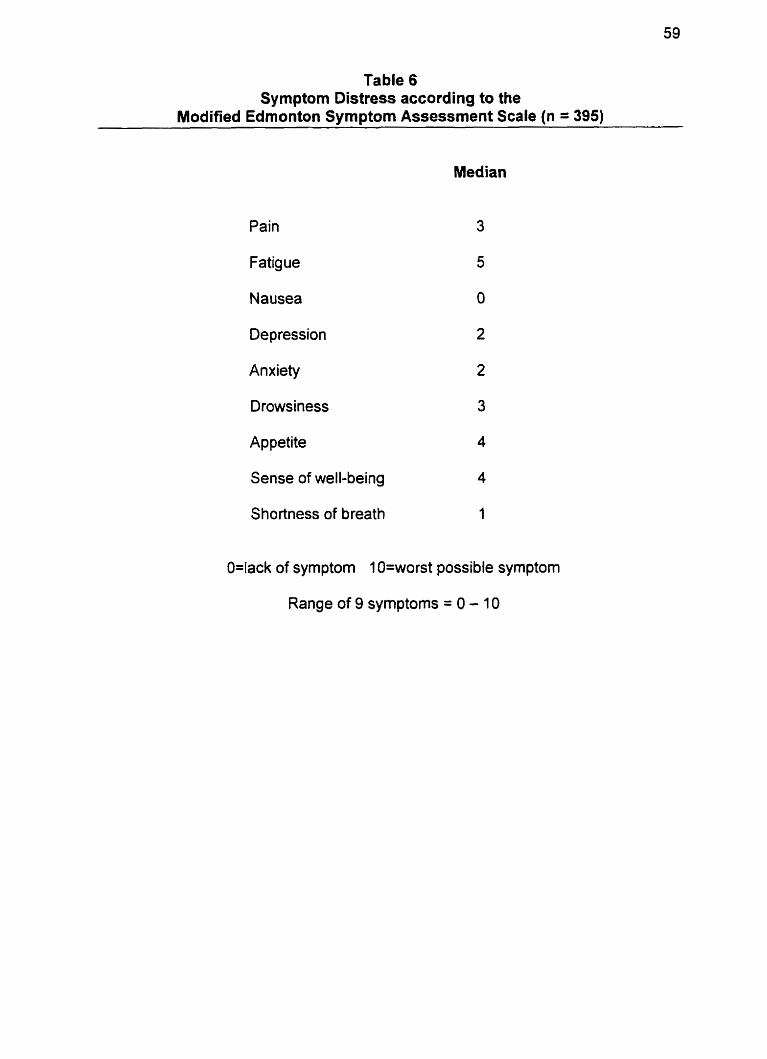
Table 6 Symptom Distress according to the
Modified Edmonton Symptorn Assessrnent Scale (n = 395)
Pain
Fatigue
Nausea O
Depression
Anxiety
Drowsiness
Appetite 4
Sense of well-being 4
Shortness of breath 1
O=lack of symptom 1 O=worst possible symptom
Range of 9 symptoms = O - 10
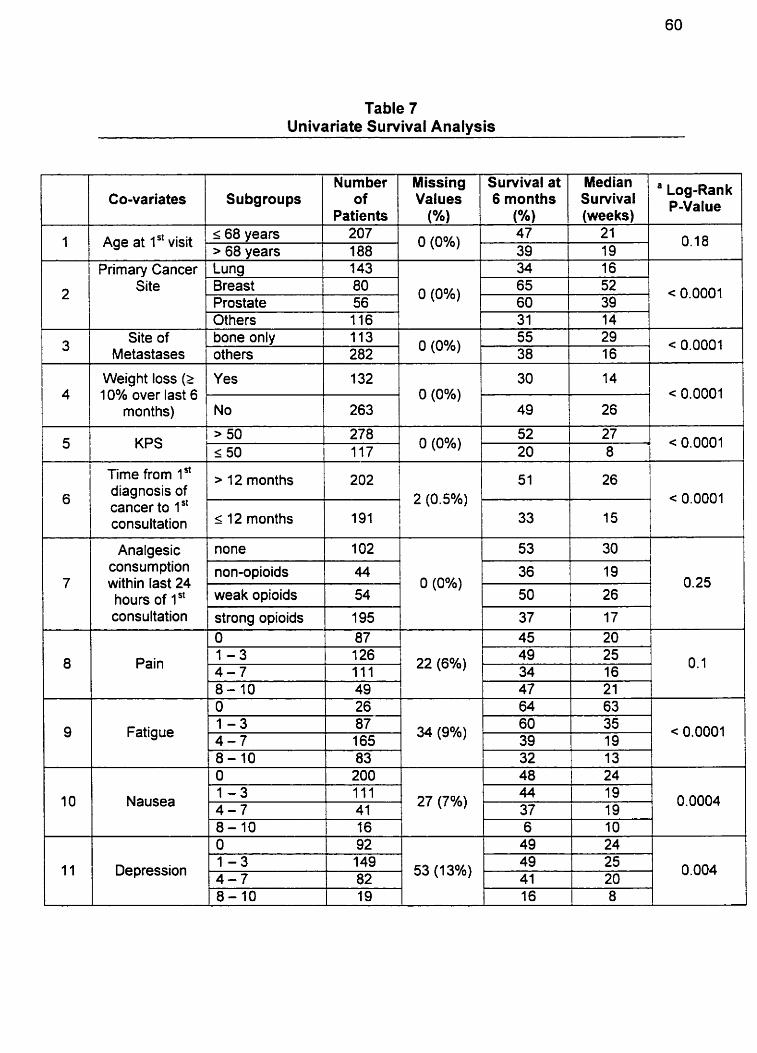
Table 7 Univariate Suwival Analysis
1
2
Co-va riates
Age at 1" visit
1 1 1 Others 1
116 1
Primary Cancer Site
3
1
4
Subgroups
- 1 68 years > 68 vears . Lung Breast Prostate
31 Site of
Metastases
e t o s (2 1 1 :: 1 :: 1 10% over last 6 O (0%) < 0.0001
months)
Missing Values
(%)
O (0%)
Number of
Patients
207 .
188
14
i I
l
278 117 5
IÏme '" > 12 months 1 202 1 1 S I 1 26 1 diagnosis of < 0.0001
consultation ' l2 month= cancer to lSt
191 33 15
7
Survival at 6 months
(%) - 47
39
< 0.0001
I I 1
bone only others
consumption non-opioids within last 24 01 O(O%) )l 0.25 hours of 1 st weak opioids
8
143 80 56
O (0%) 113 282
O (0%) KPS
l l Fatigue
Median Survival (weeks)
21 19
> 50 1 50
consultation
Pain
10
, Log-Ran P-Value
0.1 8
O (0%)
55 38
I
1 - 3 -
Nausea 4 - 7 27 (7%) 1 0.0004
8-10 16
l l1 I Depression
52
strong opioids O 1 - 3 4 - 7
34 1 16
29 16
27
87 165
1 - 3
65 60
< 0.0001
, i ~ 0 . 0 0 0 1
195 87 126 11 1
34 (9%) 11 < 0.0001
52 39
82
37 45
53(13%) )l 0.004
17 20
22 (6%) 49 1 25 . 34 16 I o. 1
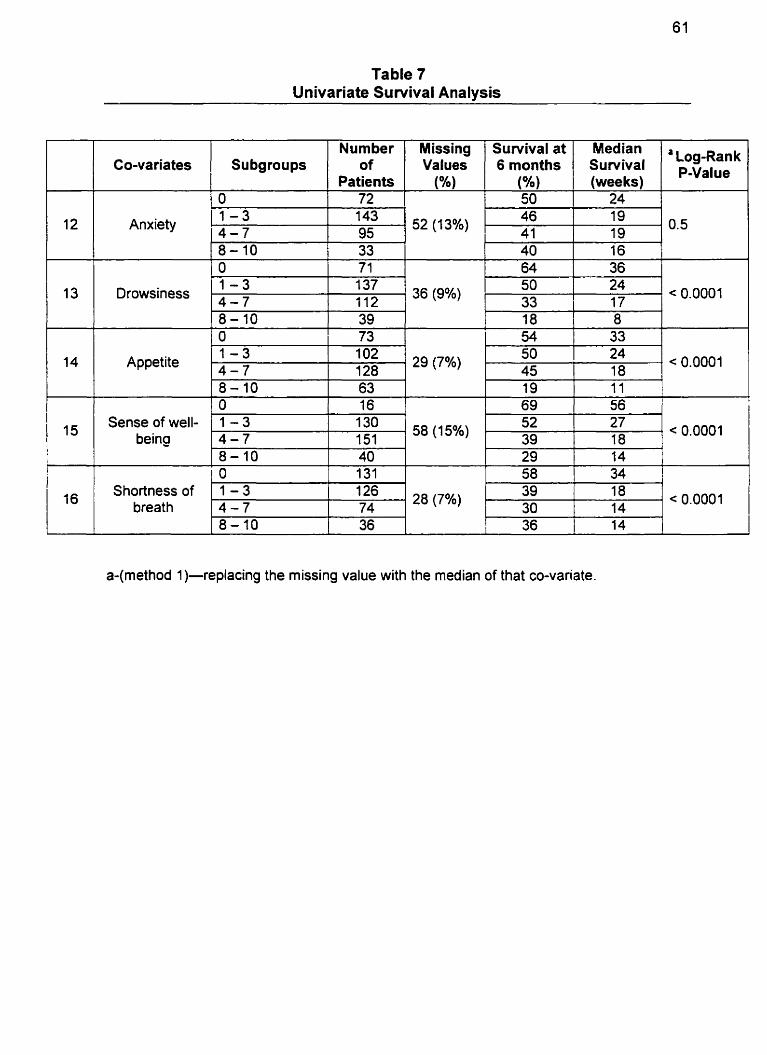
Table 7 Univariate Suwival Analysis
L J L
1 - 3 Drowsiness - '37 36 (9%)
50 24 112 33 17 < 0.0001
Co-variates
Anxiety 1 - 3 14 -7
Subgroups Nurnber
of Patients
143 /52(13%) 95
Appetite
a-(method 1)-replacing the missing value with the median of that CO-variate.
Missing Values
(%)
Survival at 6 months
(%)
Sense of well- being
Shortness of breath
Median Survival (weeks)
O. 5
I
8-10 O 1 - 3 -
a L ~ ~ - R ~ ~ ~ PYalue
46 41
39 73
'O2 .
128
1 - 3 4 - 7 8-10 O 1 - 3 4 - 7
19 19
< 0.0001
18
58 (15%)
28 (7%)
130 151 40 131 126 74
8 k
c 0.0001
< 0.0001
52 39 29
. 58 39 30
I
27 18 14 34 18 14
'
33 24 18
a 29 (7%)
54 50 45
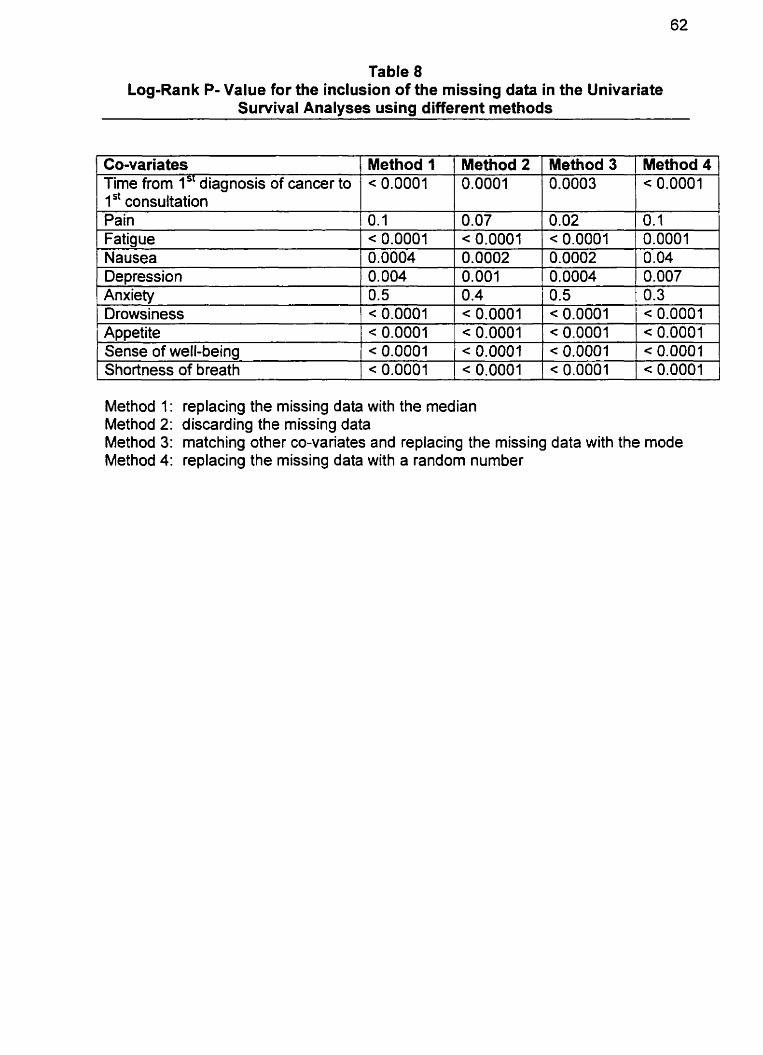
Table 8 Log-Rank P- Value for the inclusion of the missing data in the Univariate
Survival Analyses using different methods
Co-variates Time from 1 diagnosis of cancer to 1 st consultation Pain Fatigue Nausea Depression
Method 1 < 0.0001
0.1 < 0.0001 0.0004 0.004
Anxiety Drowsiness Appetite
Method 2 1 Method 3
0.5 < 0.0001 < 0.0001
Sense of well-being Shortness of breath
Method 4
< 0.0001 < 0.0001
Method 1: replacing the missing data with the median Method 2: discarding the missing data Method 3: matching other CO-variates and replacing the missing data with the mode Method 4: replacing the missing data with a random number
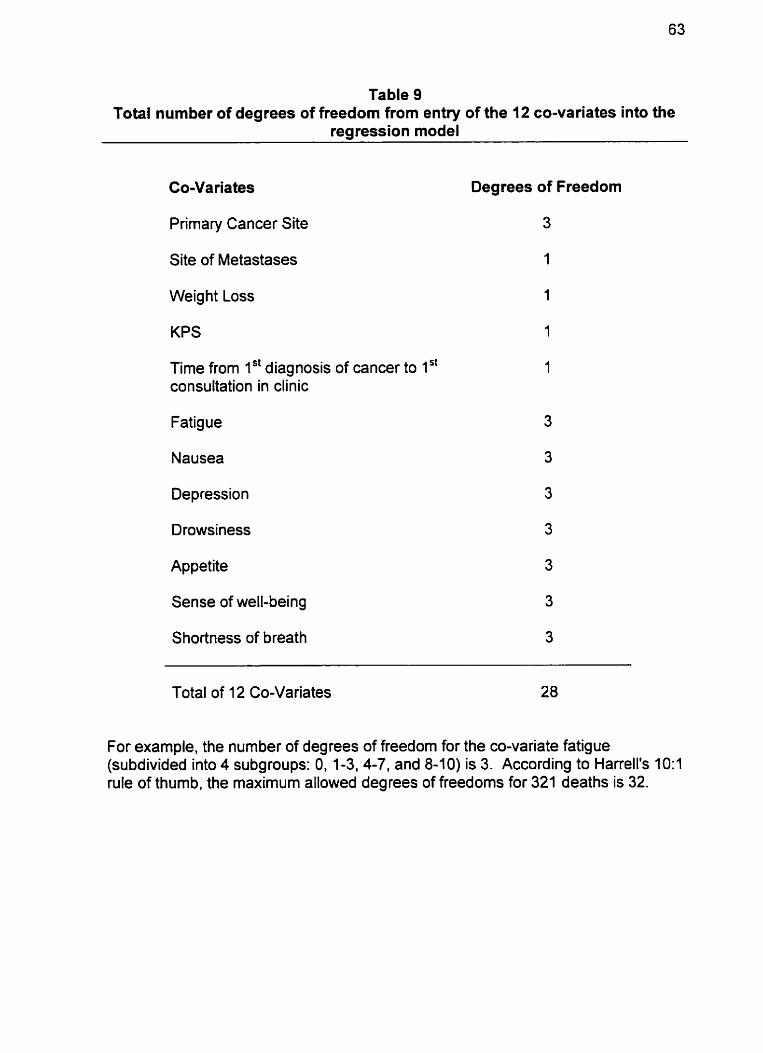
Table 9 Total number of degrees of freedom from entry of the 12 CO-variates into the
regression mode1
Co-Variates
Primary Cancer Site
Site of Metastases
Weight Loss
KPS
Time from 1'' diagnosis of cancer to 1 " consultation in clinic
Fatigue
Nausea
Depression
Drowsiness
Appetite
Sense of well-being
Shortness of breath
Degrees of Freedom
Total of 12 Co-Variates 28
For example, the number of degrees of freedom for the CO-variate fatigue (subdivided into 4 subgroups: 0, 1-3,4-7, and 8-1 0) is 3. According to Harrell's 10:l rule of thumb, the maximum allowed degrees of freedoms for 321 deaths is 32.
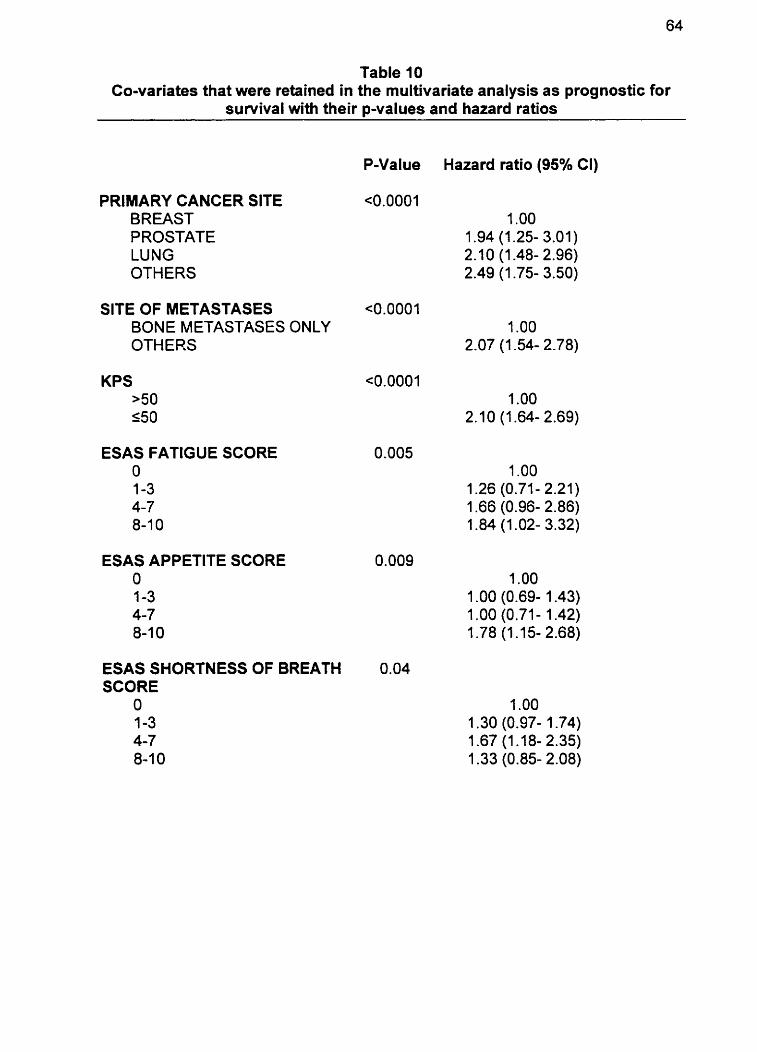
Table I O Co-variates that were retained in the multivariate analysis as prognostic for
suwival with their p-values and hazard ratios
PRIMARY CANCER SlTE BREAST PROSTATE LUNG OTHERS
SlTE OF METASTASES BONE METASTASES ONLY OTHERS
KPS >50 150
ESAS FATIGUE SCORE O 1-3 4-7 8-1 0
ESAS APPETITE SCORE O 1-3 4-7 8-1 O
ESAS SHORTNESS OF BREATH SCORE
O 1-3 4-7 8-1 O
Hazard ratio (95% CI)
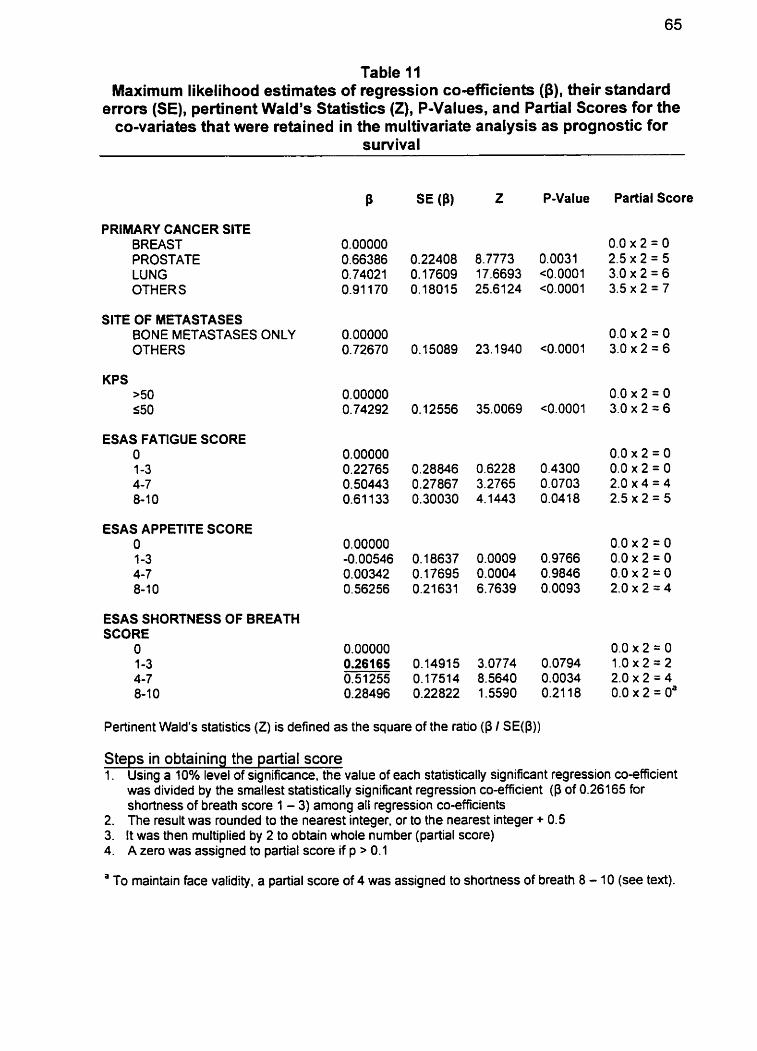
Table II Maximum likelihood estimates of regression cosfficients ($), their standard
errors (SE), pertinent Wald's Statistics (Z), P-Values, and Partial Scores for the CO-variates that were retained in the multivariate analysis as prognostic for
survival
8 SE (Pl z P-Value Partial Score
PRIMARY CANCER SITE BREAST 0.00000 0.0 x 2 = O PROSTATE 0.66386 0.22408 8.7773 0.0031 2.5 x 2 = 5 LUNG 0.74021 0.17609 17.6693 ~0.0001 3.0 x 2 = 6 OTHERS 0.91 170 0.18015 25.6124 ~0.0001 3.5 x 2 = 7
SITE OF METASTASES BONE METASTASES ONLY 0.00000 0.0 x 2 = O OTHERS 0.72670 0.15089 23.1940 ~0.0001 3.0 x 2 = 6
KPS >50 550
ESAS FATIGUE SCORE O 0.00000 0.0 x 2 = O 1 -3 0.22765 0.28846 0.6228 0.4300 0.0 x 2 = O 4-7 0.50443 0.27867 3.2765 0.0703 2.0 x 4 = 4 8-1 0 0.61 133 0.30030 4.1443 0.0418 2.5 x 2 = 5
ESAS APPETITE SCORE O O. 00000 0.0 x 2 = O 1-3 -0.00546 0.18637 0.0009 0.9766 0.0 x 2 = O 4-7 0.00342 0.17695 0.0004 0.9846 0.0 x 2 = O 8-1 0 0.56256 0.21631 6.7639 0.0093 2.0 x 2 = 4
ESAS SHORTNESS OF BREATH SCORE
O 0.00000 0.0 x 2 = O 1-3 0.26165 0.1491 5 3.0774 0.0794 1 .O x 2 = 2 4-7 0.51255 0.17514 8.5640 0.0034 2.0 x 2 ;= 4 8-1 0 0.28496 0.22822 1 .5590 0.21 18 0.0 x 2 = Oa
Pertinent Wald's statistics (Z) is defined as the square of the ratio (P / SE@))
Steps in obtaining the partial score 1. Using a 10% level of significance, the value of each statistically significant regression coefficient
was divided by the smdlest statistically significant regression CO-efficient (P of 0.26165 for shortness of breath score 1 - 3) among ail regression co-efficients
2. The result was rounded to the neatest integer, or to the nearest integer + 0.5 3. It was then multiplied by 2 to obtain whole number (partial score) 4. A zero was assigned to partial score if p > 0.1
a To maintain face validity, a partial score of 4 was assigned to shortness of breath 8 - 10 (see text).
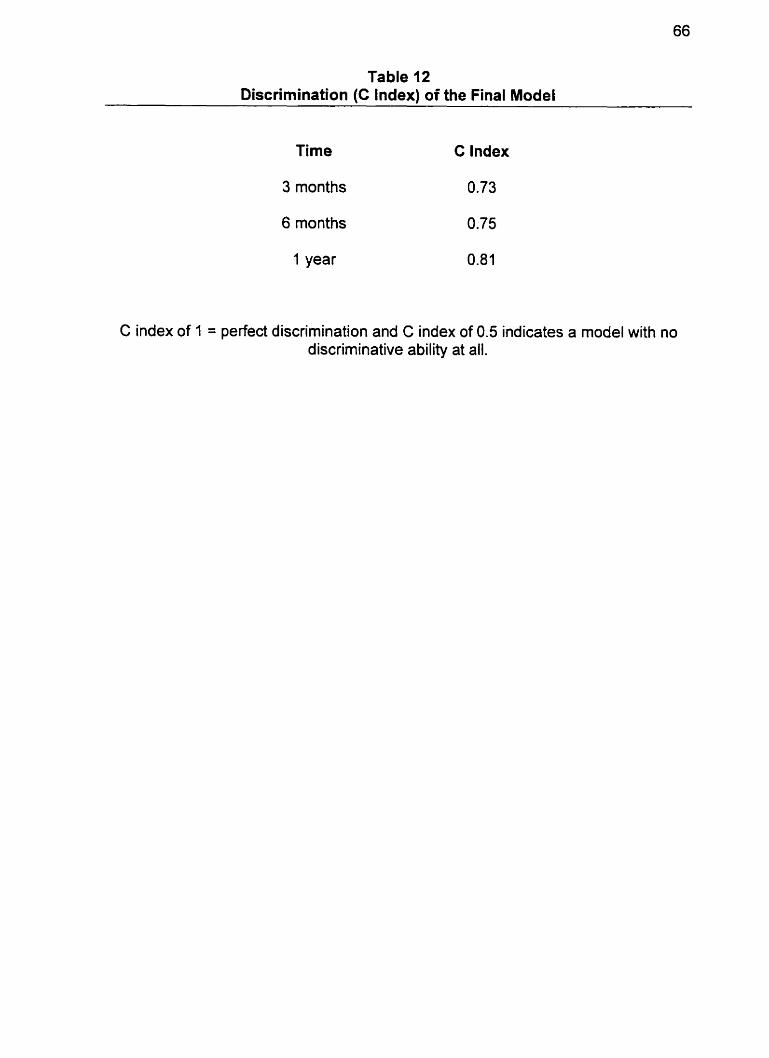
Table 12 Discrimination (C Index) of the Final Model
Time C Index
3 months
6 months
1 year
C index of 1 = perfect discrimination and C index of 0.5 indicates a mode1 with no discriminative ability at all.
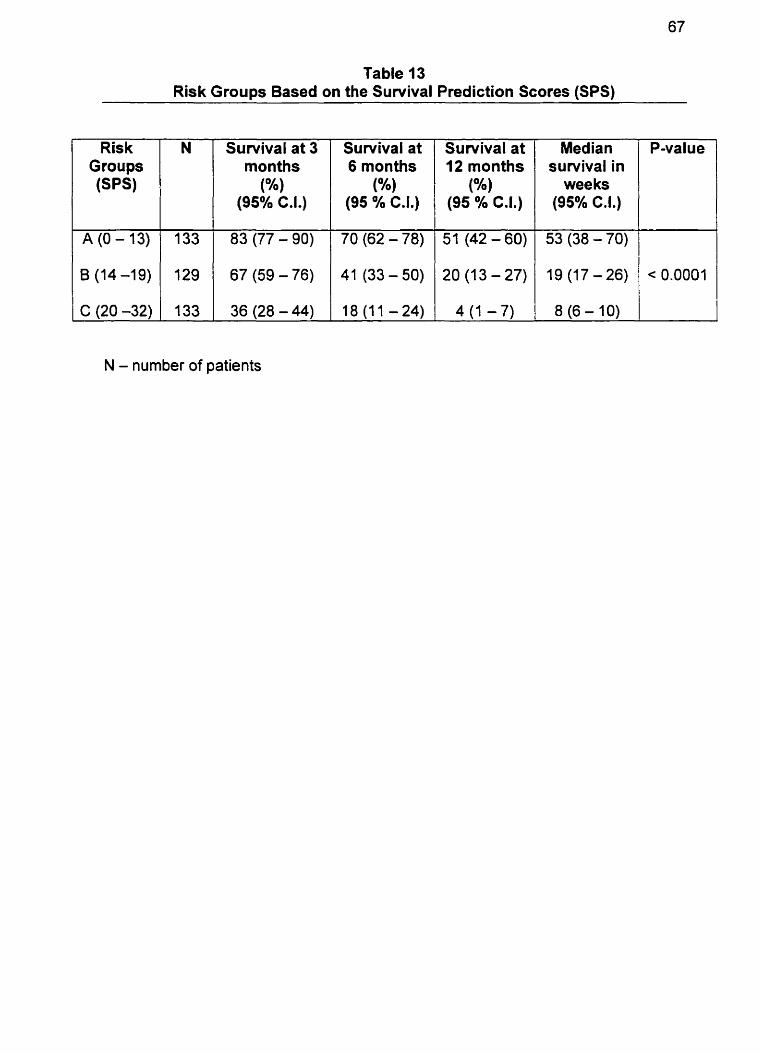
Table 13 Risk Groups Based on the Survival Prediction Scores (SPS)
Suwival at 12 months
(O/.)
(95 Oh C.I.)
51 (42 - 60)
20 (13-27)
4 (1 - 7)
Ris k Groups ( S W
N - number of patients
N Median survival in
wee ks (95% C.I.)
P-value Survival at 3 monttis
(%) (95% C.I.)
Survival at 6 months
(%) (95 % C.I.)
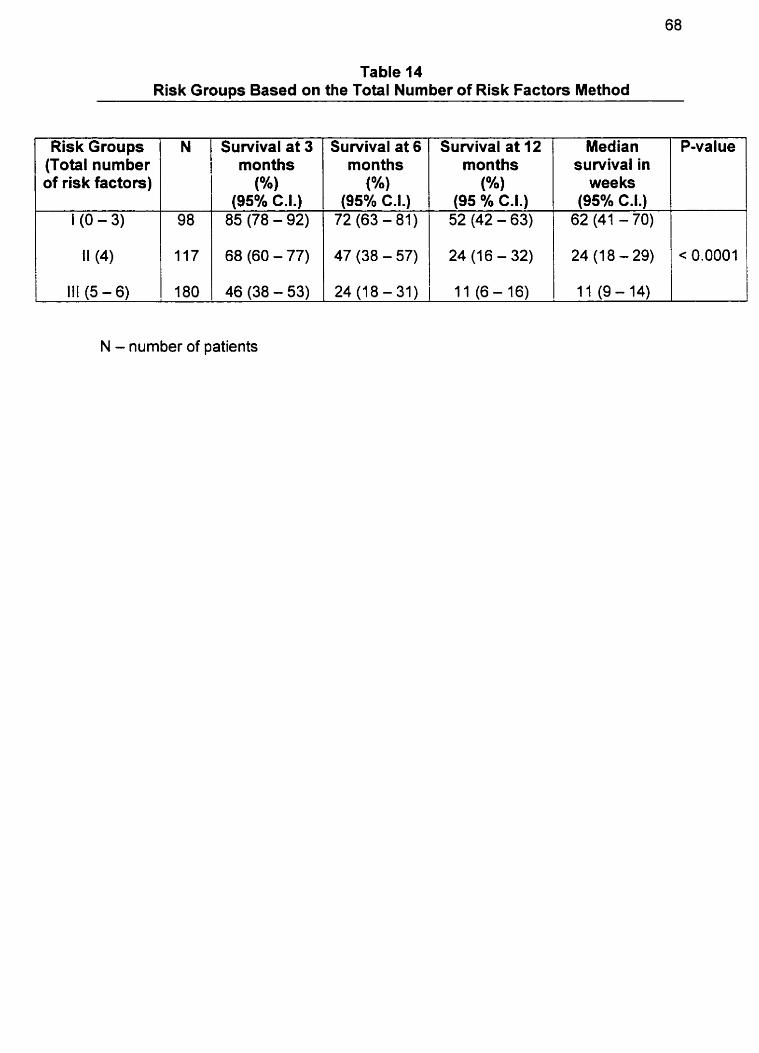
Table 14 Risk Groups Based on the Total Number of Risk Factors Method
N - number of patients
P-value Risk Groups (Total number of risk factors)
1 (O - 3)
Survival at 6 months
(%) (95% C.I.)
72 (63 - 81)
N
98
Survival at 12 months
( O h )
(95 % C.I.) 52 (42 - 63)
Survival at 3 months
(%) (95% C.I.) 85 (78 - 92)
Median survivai in
wee ks (95% C.I.)
62 (41 - 70)
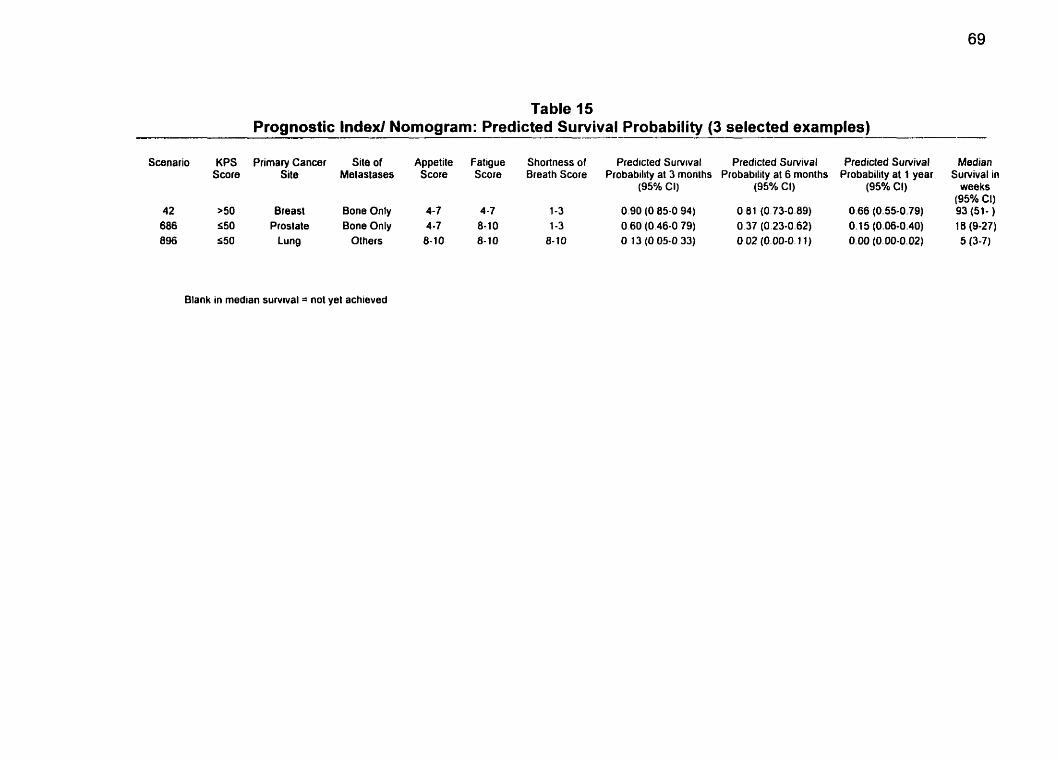
Table 15 Prognostic lndexl Nomogram: Predicted Survival Probability (3 selected examples)
Scenario KPS Primary Cancer Site of Appetiie Fatigue Shortness of Predicted Survrval Predicted Survival Predicted Sumival Median Score Site Melastases Score Score Breath Score Probability at 3 monlhs Probability at 6 monlhs Probability al 1 year Survival in
(95% CI) (95% CI) (95% CI) weeks (95% Cl)
42 >50 Breast Bone Only 4-7 4-7 1-3 0.90 (O 85-0 94) O 81 (0.73-0.89) 0.66 (0.55-0.79) 93 (51- ) 686 550 Prostale Bona Only 4 -7 8-10 1-3 O 60 (0.46-0 79) 0.37 (0.23-0.62) O. 15 (0.06-0.40) 16 (9-27) 896 550 Lung Others 8-10 8-10 8-10 O 13 (O 05-0 33) O 02 (0.00-0.1 1) 0.00 (0.00-0.02) 5 (3-7)
Blank in median sunrival = not yel achieved
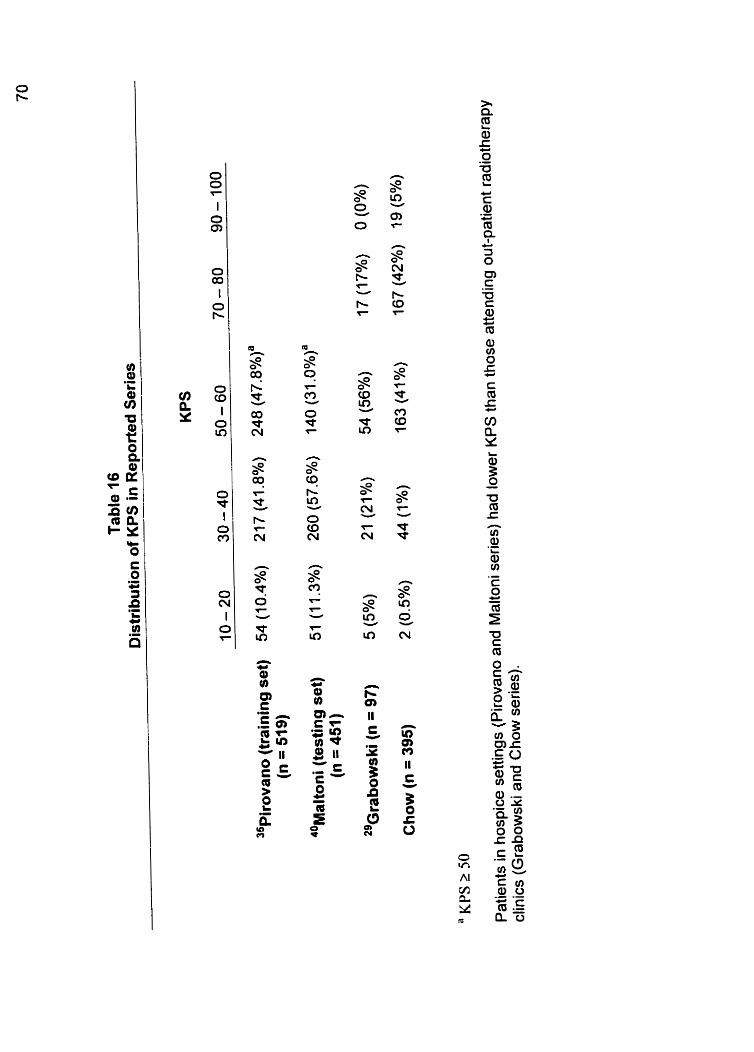
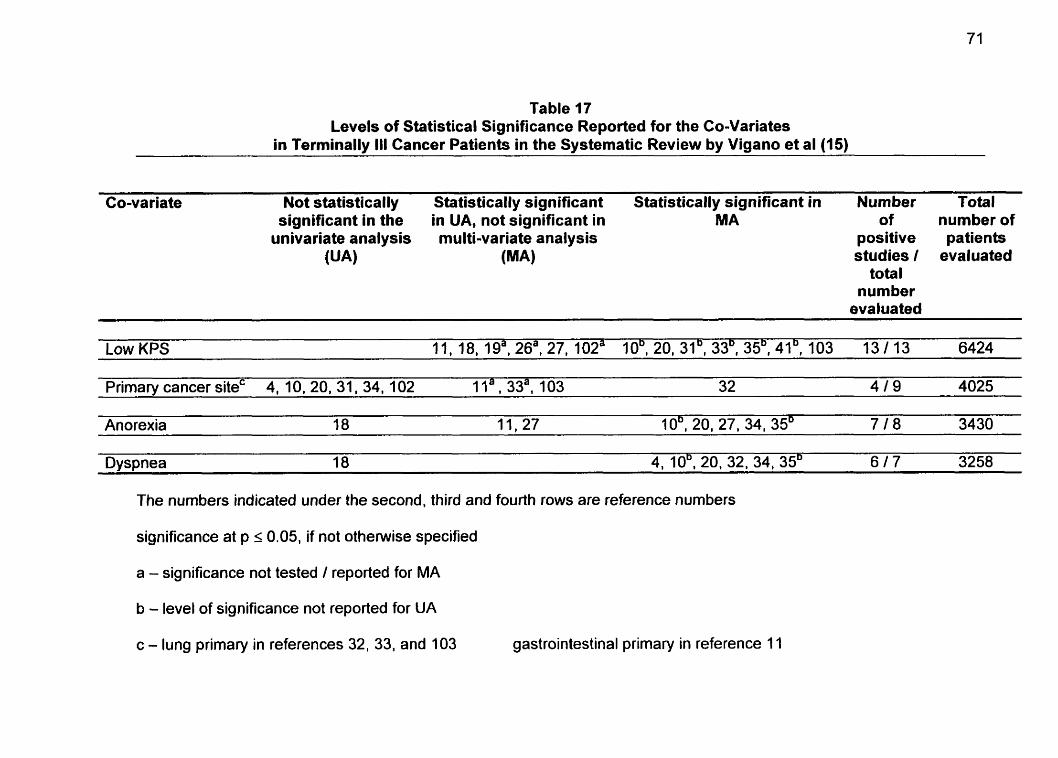
Table 17 Levels of Statistical Significance Reported for the Co-Variates
in Terminally III Cancer Patients in the Systematic Review by Vigano et al (15)
Co-variate Not statistically Statistically significant Statistically significant in Number Total significant in the in UA, not significant in MA of number of
univariate analysis multi-variate analysis positive patients (UA) (MA) studies 1 evaluated
total number
evaluated
Low KPS 11.18.19a.26a.27.102a 10~.20~31~.33~,35~,41~.103 13/13 6424
Primarv cancer siteC 4. 10. 20. 31. 34. 102 1 la, 33a1 103 32 4 1 9 4025
Anorexia 18 11,27 10'. 20, 27. 34. 35' 7 1 8 3430
Dyspnea 18 4, 10'. 20, 32, 34, 35D 6 1 7 3258
The nurnbers indicated under the second, third and fourth rows are reference numbers
significance at p 5 0.05, if not otherwise specified
a - significance not tested 1 reported for MA
b - level of significance not reported for UA
c - lung primary in references 32, 33, and 103 gastrointestinal primary in reference 11
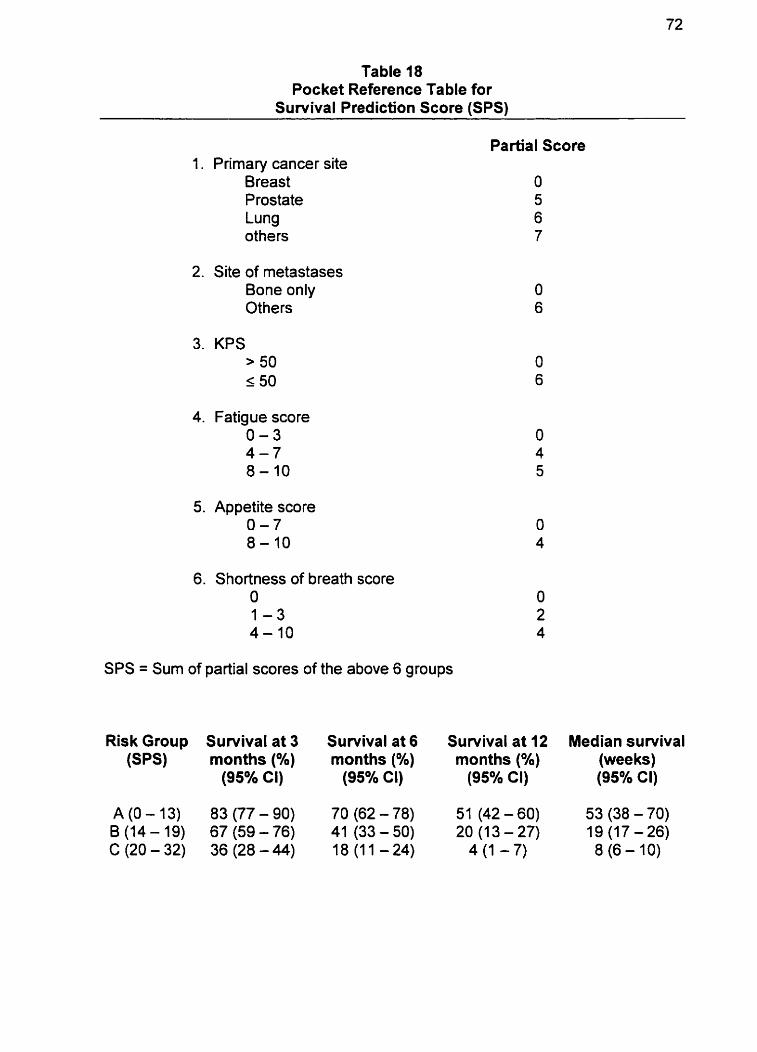
Table 18 Pocket Reference Table for
Survival Prediction Score (SPS)
1. Primary cancer site Breast Prostate Lung others
2. Site of metastases Bone only Others
3. KPS > 50 5 50
4. Fatigue score 0 - 3 4 - 7 8-10
5. Appetite score 0 - 7 8-10
6. Shortness of breath score O 1 - 3 4-10
Partial Score
SPS = Sum of partial scores of the above 6 groups
Risk Group Survival at 3 Survival at 6 Survival at 12 Median survival (sps) months (Oh) months (%) months (%) (wee ks)
(95% CI) (95% Cl) (95% CI) (95% Cl)
A (O- 13) 83 (77- 90) 70 (62-78) 51 (42 - 60) 53 (38 -70) B (14 - 19) 67 (59 - 76) 41 (33 - 50) 20 (1 3 - 27) 19 (17-26) C(20-32) 36(28-44) 18(11-24) 4(1 -7) 8 (6 - 10)
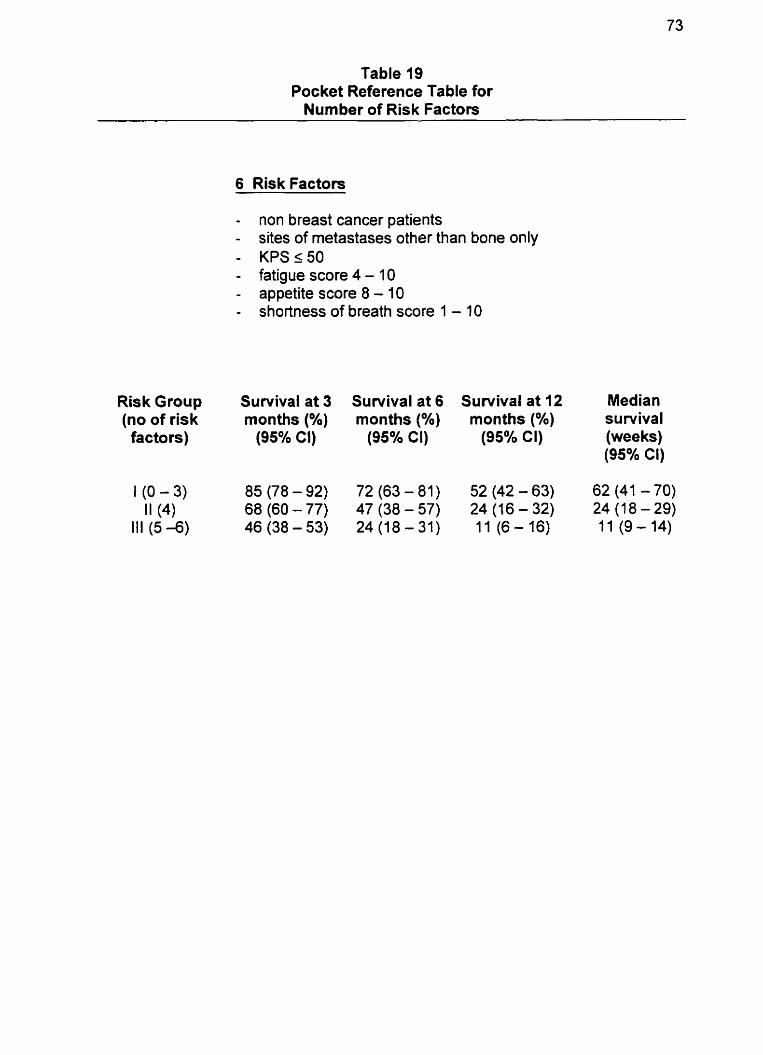
Table 19 Pocket Reference Table for
Number of Risk Factors
6 Risk Factors
- non breast cancer patients - sites of metastases other than bone only - KPSs50 - fatigue score 4 - 1 0 - appetite score 8 - 10 - shortness of breath score 1 - 10
Risk Group Sunrival at 3 Sunrival at 6 Survival at 12 Median (no of risk months (%) months (%) months (Oh) survival factors) (95% CI) (95% CI) (95% CI) (wee ks)
(95% Cl)
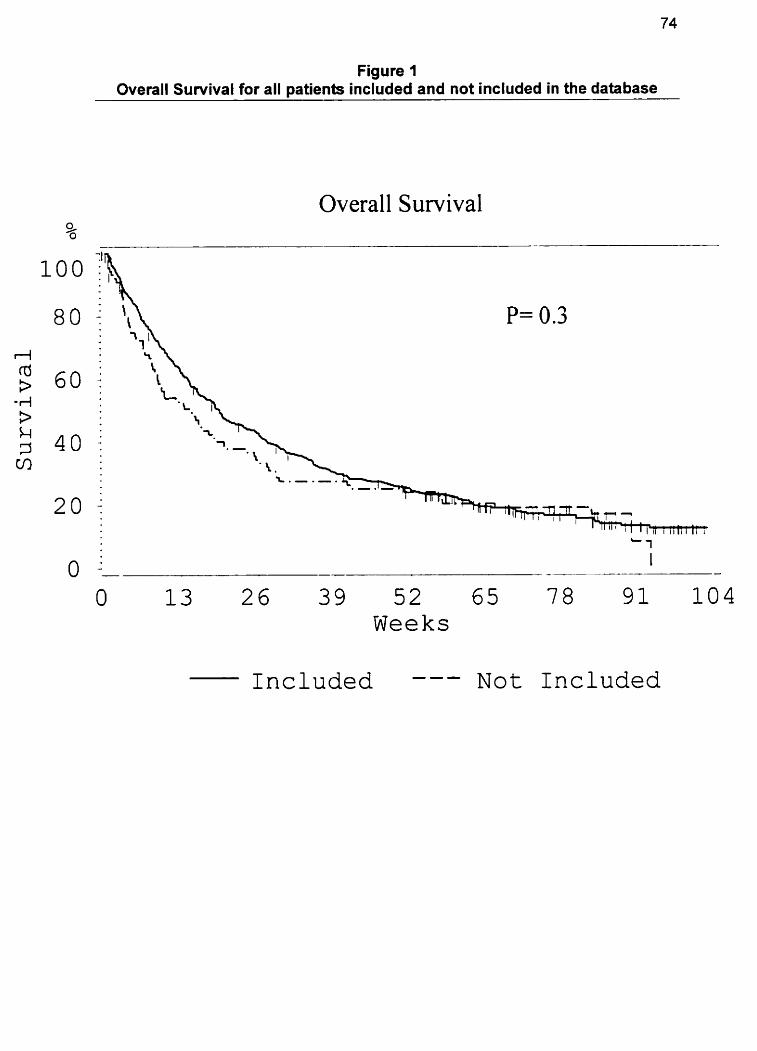
Figure 1 Overall Survival for ail patients included and not included in the database
Overall Survival
-- - -
13 2 6 3 9 5 2 65 78 Weeks
I n c l u d e d --- N o t Included
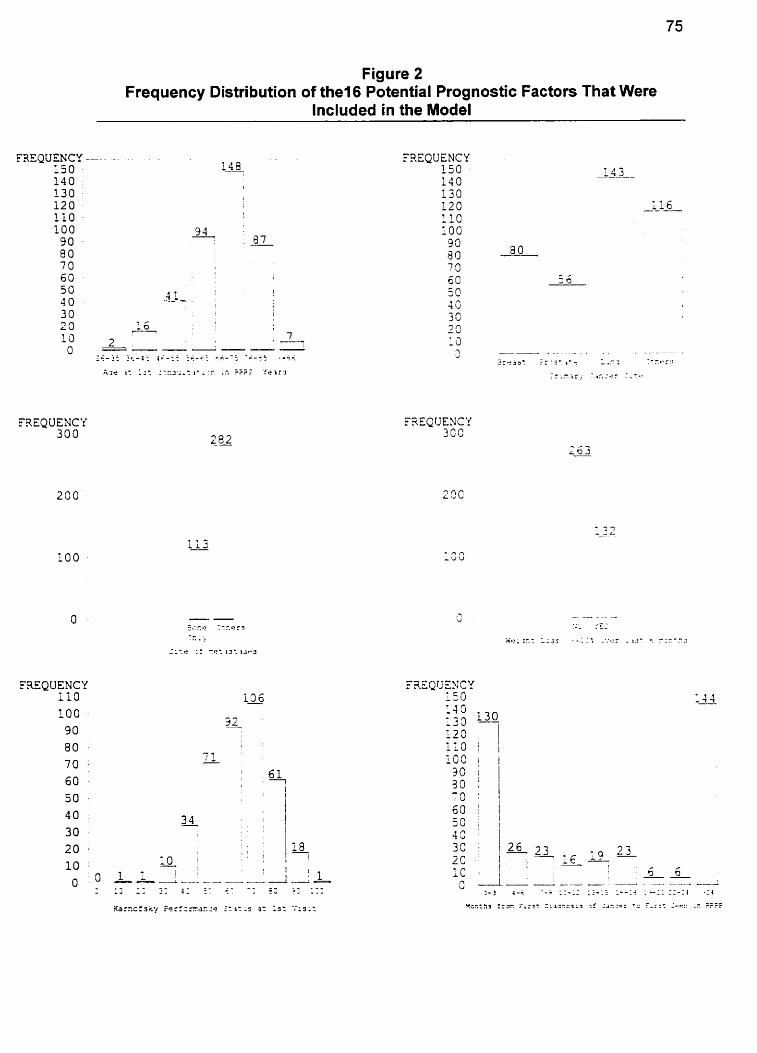
Figure 2 Frequency Distribution of the1 6 Potential Prognostic Factors That Were
lncluded in the Model
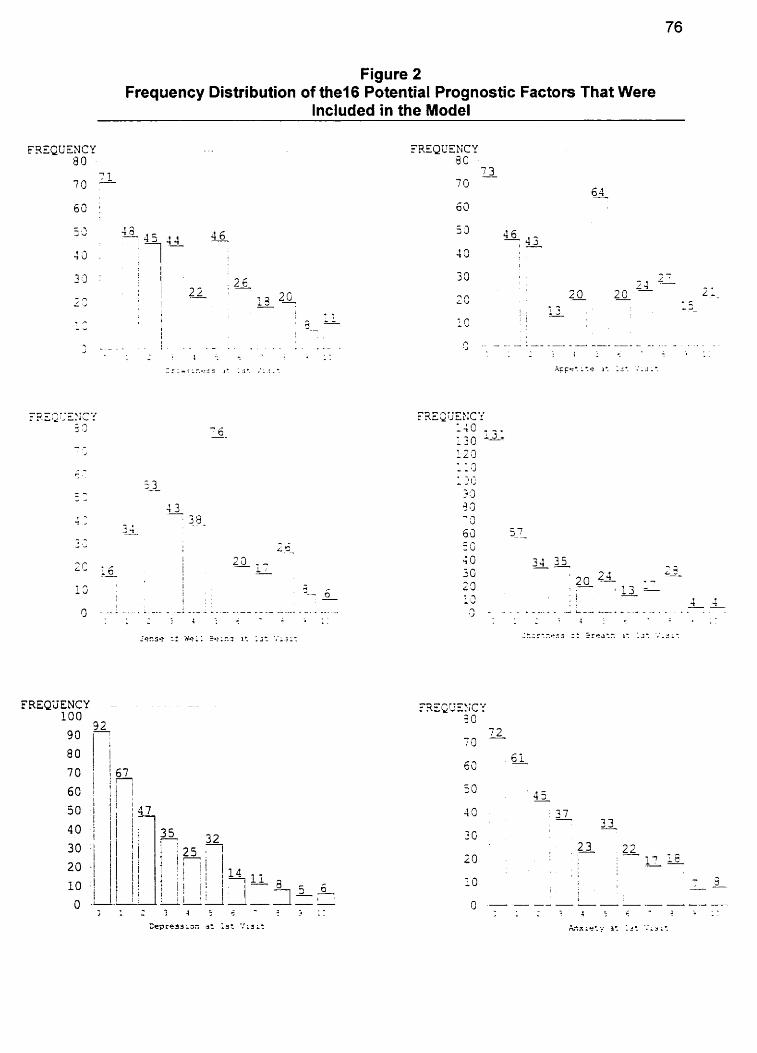
Figure 2 Frequency Distribution of the16 Potential Prognostic Factors That Were
lncluded in the Model
FRFQUENCY
6 3 CI:
50 4 5
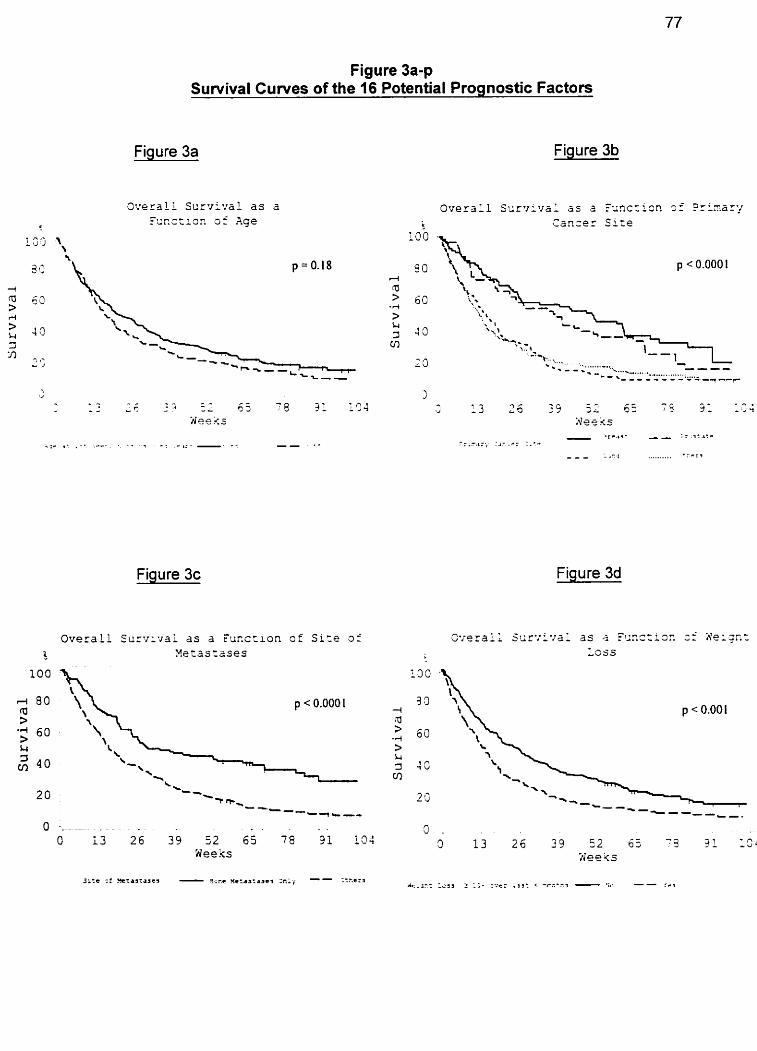
Figure 3a-p Survival Cuwes of the 16 Potential Prognostic Factors
Fiaure 3a Figure 3b
L O O - r. ,. L J J
Figure 3c Figure 3d
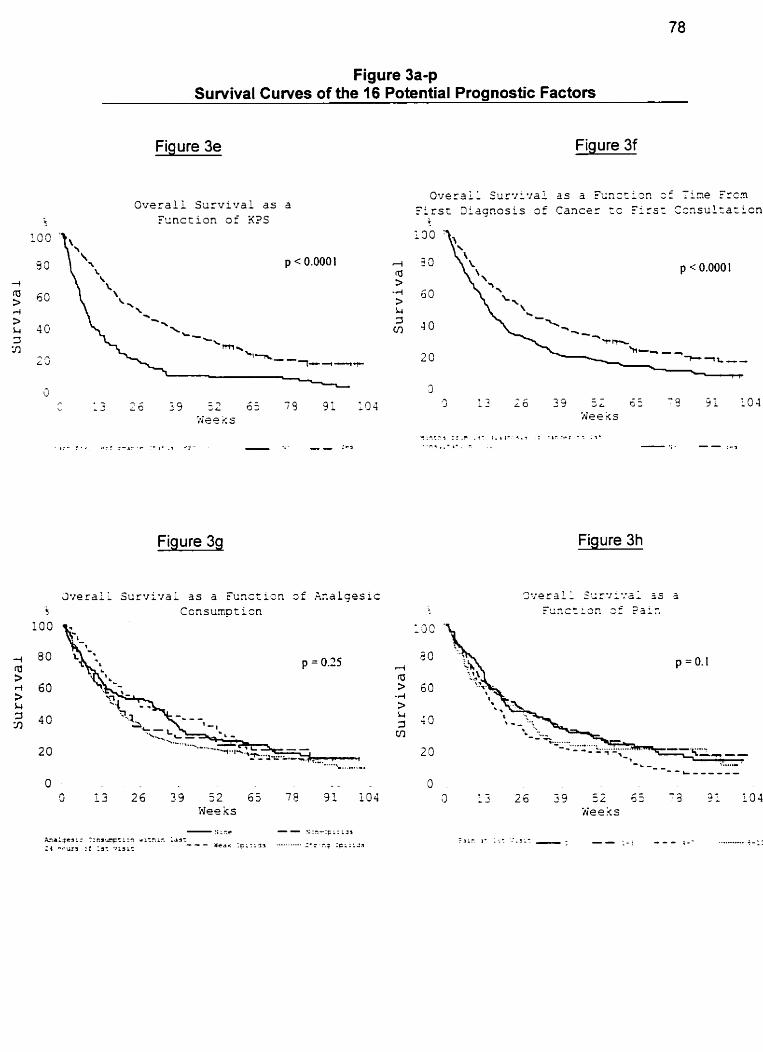
Figure 3a-p Survival Cuwes of the 16 Potential Prognostic Factors
Fiaure 3e Figure 3f
Figure 39 Figure 3h
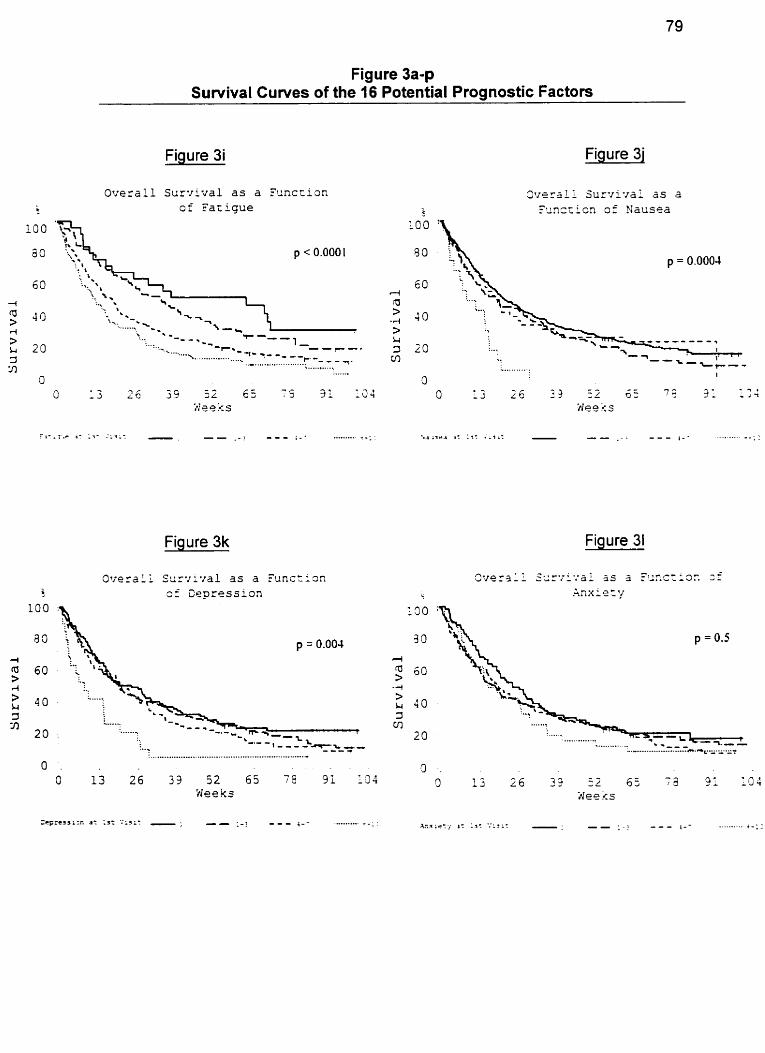
Figure 3a-p Survival Curves of the 16 Potential Prognostic Factors
Figure 3i Figure 31
Overal l S u r v i v a l a s a T u n c ~ i a n o f F a t i g u e
L O O
50
Figure 3k Figure 31
O v e r a l l Surw~r*za l 3s a E'unct iûn 3 f Cepress ion
..................................................................- O . 0 13 2 6 3 3 52 65 79 31 1.34
Wee ks
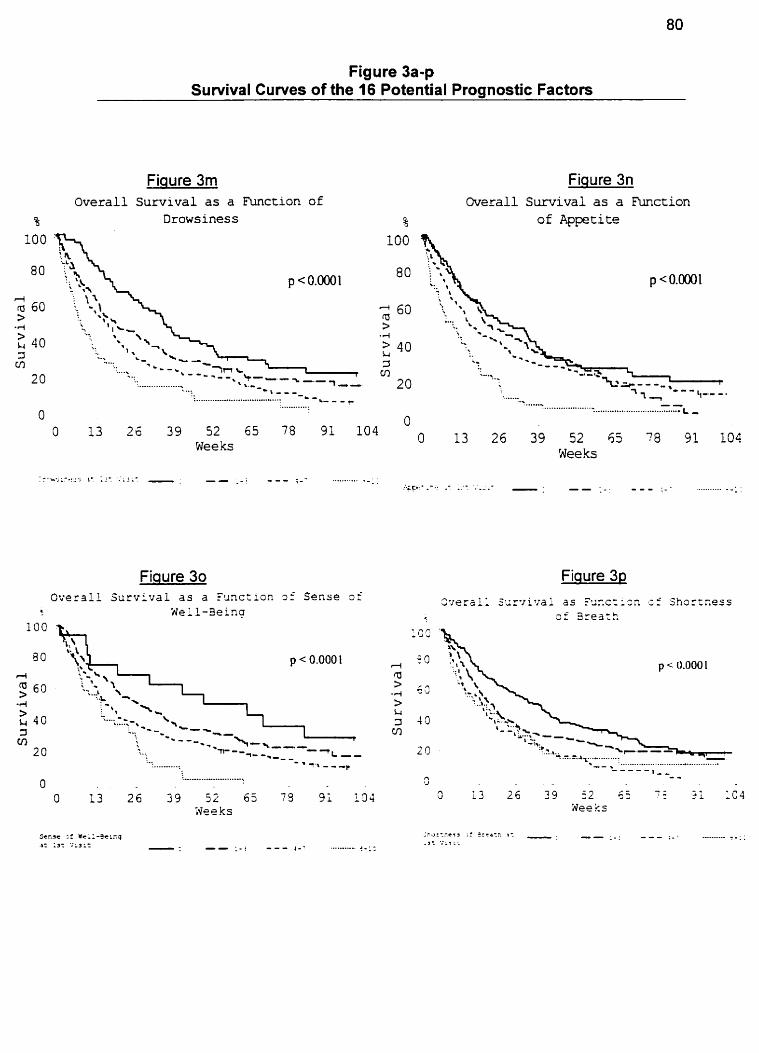
Figure 3a-p Survival Curves of the 16 Potential Prognostic Factors
Fiaure 3rn Overall Survival as a kinction of
Drowsiness
Figure 3n ûvsrall Survival as a Function
of Appetite
Fiqure 30 Overall S u r v i v a i as a %~c:ion 9: S e n s e of
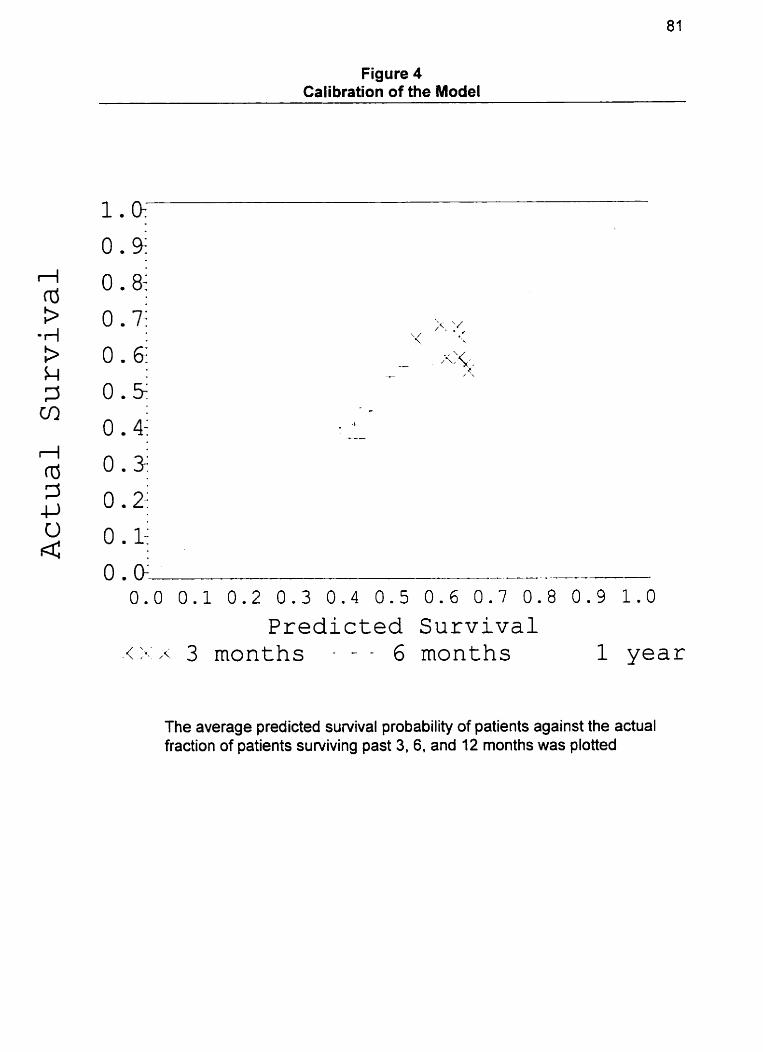
Figure 4 Calibration of the Model
Predicted Survival 1 year
The average predicted suwival probability of patients against the actual fraction of patients surviving past 3, 6, and 12 months was plotted
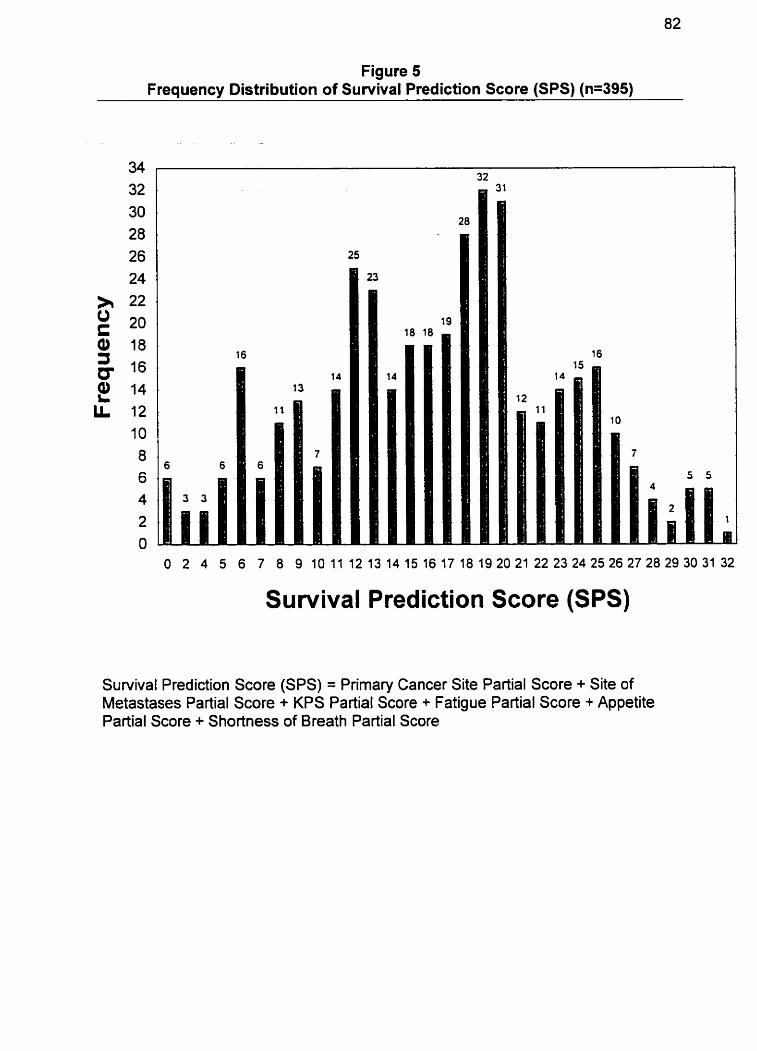
Figure 5 Frequency Distribution of Survival Predicüon Score (SPS) (n=395)
O 2 4 5 6 7 8 9 10 11 12 13 14 15 16 17 18 19 20 21 22 23 2425262728 29 30 31 32
Survival Prediction Score (SPS)
Survival Prediction Score (SPS) = Primary Cancer Site Partial Score + Site of Metastases Partial Score + KPS Partial Score + Fatigue Partial Score + Appetite Partial Score + Shortness of Breath Partial Score
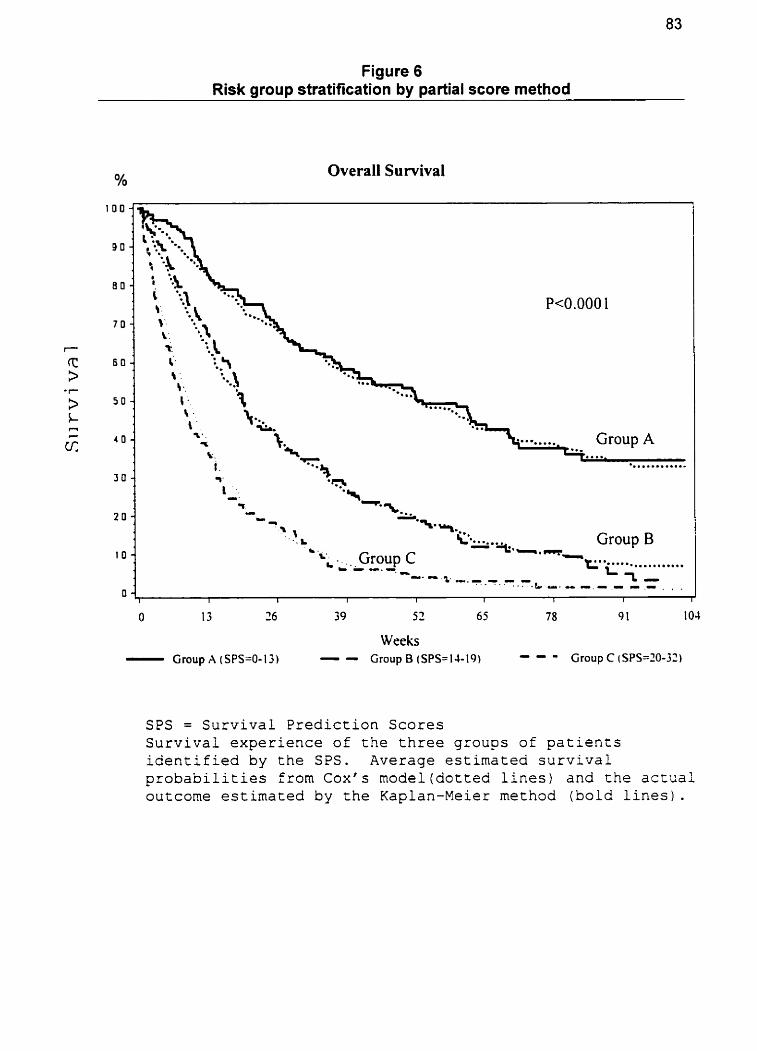
Figure 6 Risk group stratification by partial score method
Oh Overall Survival
Group
Weeks - Group A (SPS=O-13) - - Group B (SPS=IJ-19)
SPS = Survival Prediction Scores Survival experience of the three groups of patients identified by the SPS. Average estimated survival probabilities from C o x ' s model(dotted lines) and the a c t u a l outcorne estimated by the Kaplan-Meier method (bold lines).
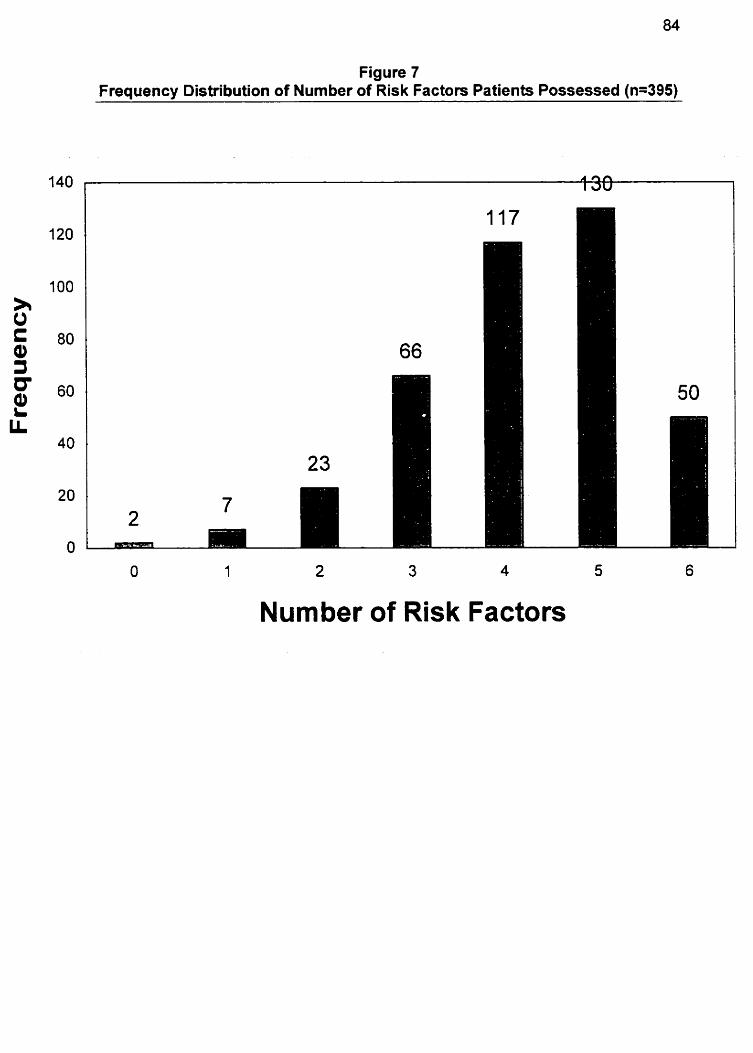
Figure 7 Frequency Distribution of Number of Risk Factors Patients Possessed (n=395)
1 2 3 4 5
Number of Risk Factors
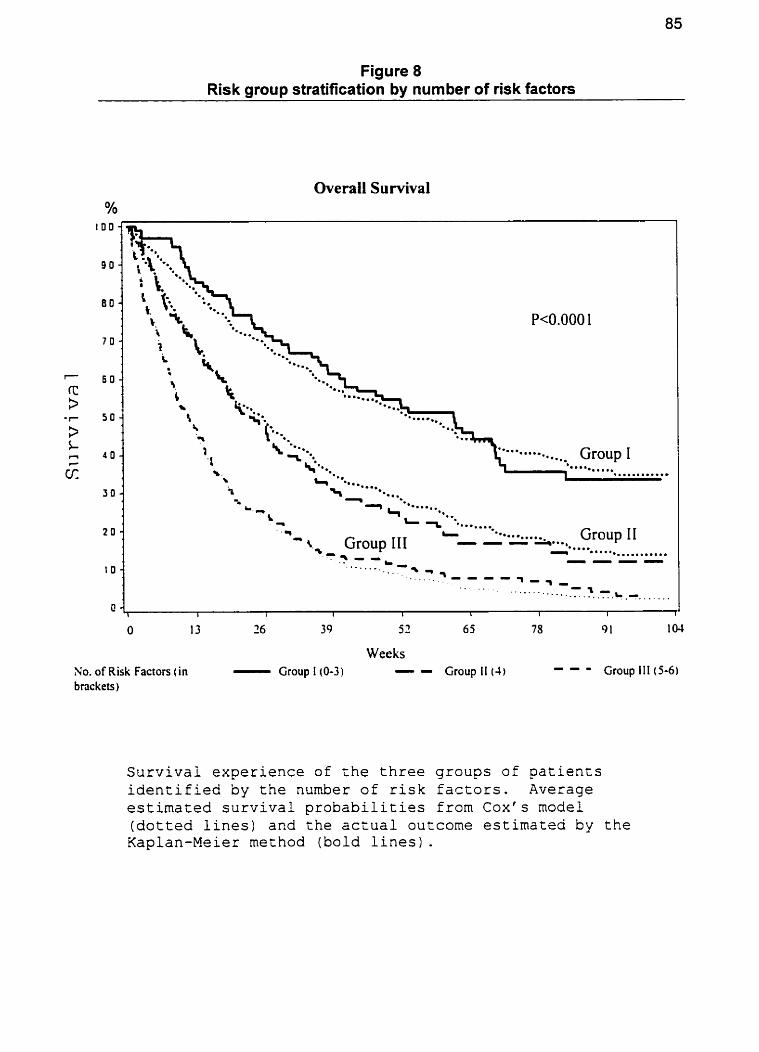
Figure 8 Risk group stratification by number of risk factors
Overail Survival Y0
- Y - - -
I) -*...... **.. '- ....m......
- * -
+ L T - .......... Group 11 ' r Group III - - - .-..O - ...... * a . . * ............ +- . - - . . ---- ........ .:. 7 5
. . , . . - - - - . . . * . . _ - 1 - q -
. . . . . . . . . . . - -.. 1 ..... .. -_. . .-.L .O..
Weeks No. of Risk Factors ( in - Group I(0-3) - - Group II (4) - - - Group III (5-6)
bnckets )
Survival experience of the three groups of patients identified by the number of risk factors. Average estimated survival probabilities from Cox's mode1 (dotted lines) and the actual outcome estimated by the Kaplan-Meier method ( b o l d lines).
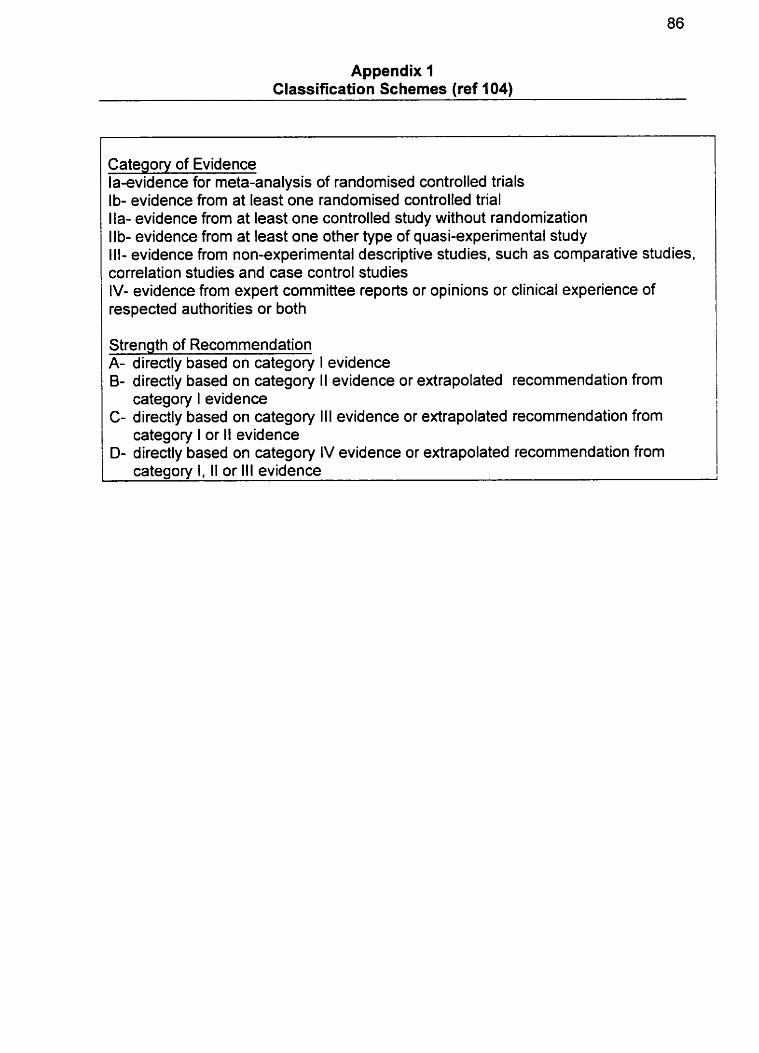
Appendix 1 Classification Schemes (ref 104)
Category of Evidence laevidence for meta-analysis of randomised controlled trials Ib- evidence from at least one randomised controlled trial Ila- evidence from at least one controlled study without randomization Ilb- evidence from at least one other type of quasi-experimental study III- evidence from non-experimental descriptive studies, such as comparative studies, correlation studies and case control studies IV- evidence from expert committee reports or opinions or clinical experience of respected authorities or both
Strength of Recommendation A- directly based on category B- directly based on category
category I evidence
I evidence II evidence or extrapolated recommendation from
C- directly based on category III evidence or extrapolated recommendation from category I or II evidence
D- directly based on category IV evidence or extrapolated recommendation from category I, II or III evidence
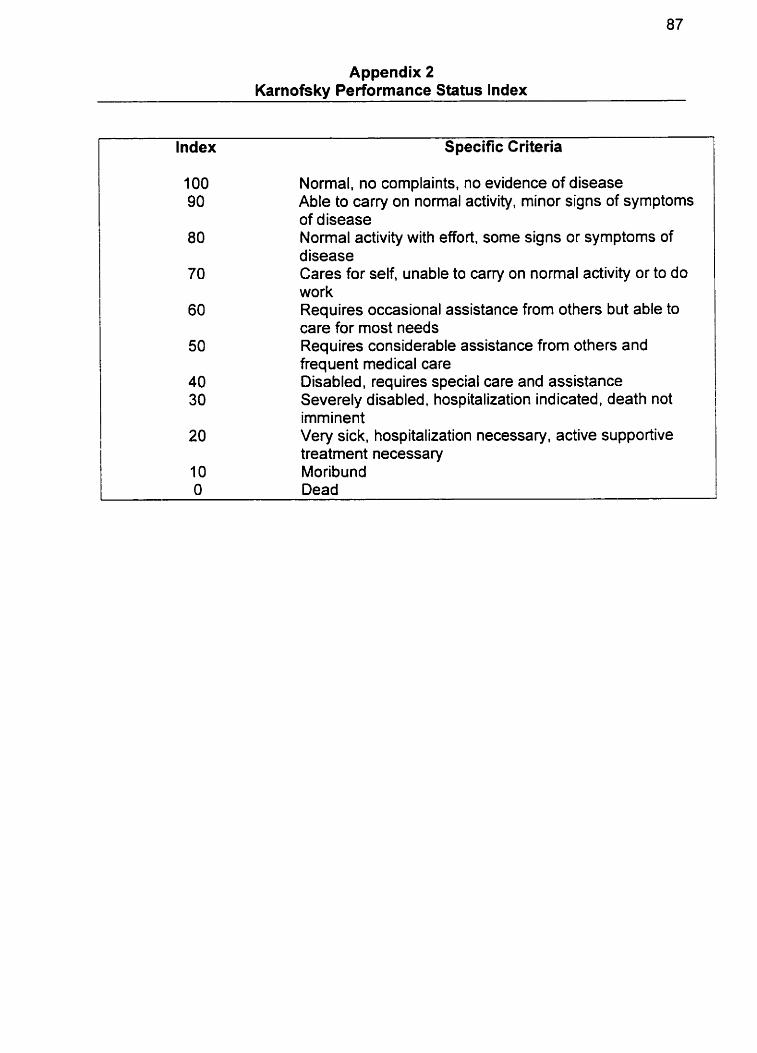
Appendix 2 Karnofsky Performance Status lndex
Index S pecific Criteria
1 O0 Normal. no complaints, no evidence of disease 90 Able to carry on normal activity. minor signs of symptoms
of d isease 80 Normal activity with effort. some signs or symptoms of
disease 70 Cares for self, unable to carry on normal activity or to do
work 60 Requires occasional assistance frorn others but able to
care for most needs 50 Requires considerable assistance from others and
frequent medical care 40 Disabled, requires special care and assistance 30 Severely disabled, hospitalization ind icated, death not
imminent 20 Very sick, hospitalization necessary, active supportive
treatrnent necessary I O Moribund O Dead
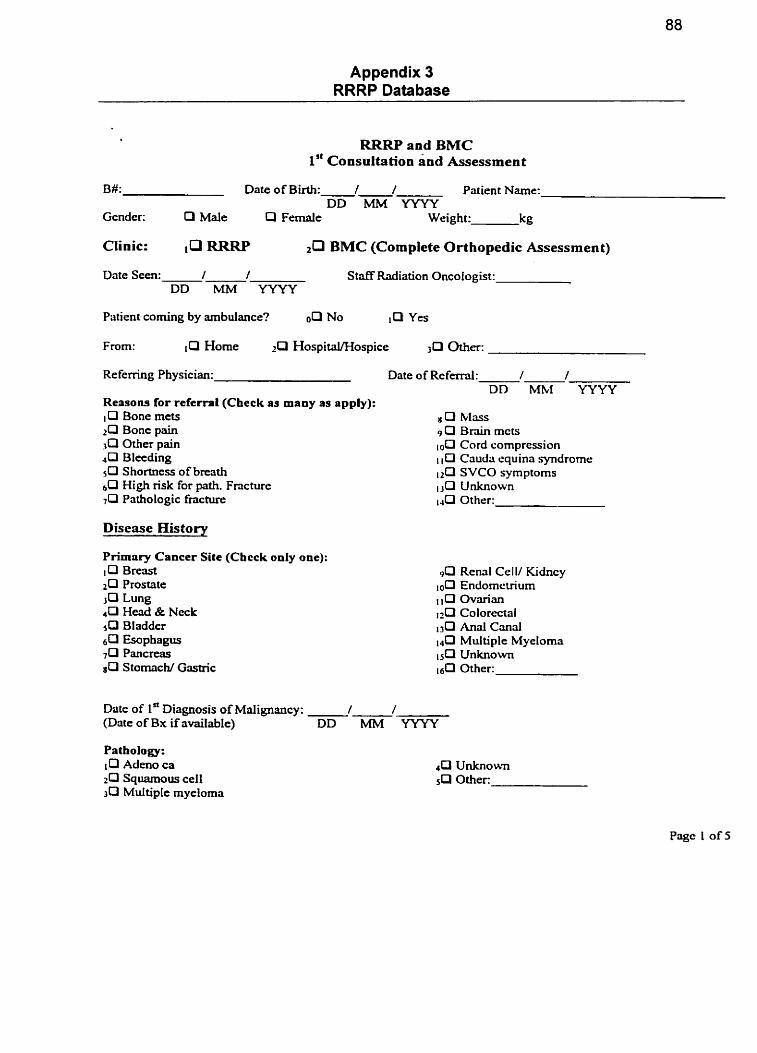
Appendix 3 RRRP Database
RRRP and BMC 1'' Consultation and Assessrnent
B#: Date of Birth: 1 / Patient Name: DD MM YYYY
Gcnder: O Mate Q F e d e Weight: kg
Clinic: RRW &l %MC (Complete Orthopedic Assessmen t)
Date Seen: / / DD MM YYYY
Staff Radiation Oncotogist:
Patient corning by ambulance? oO No lm Yes
From: P Home rP Hospital/Hospice m e r :
Re femng Physician: Date of Rc f d : / / DD MM YYYY
Rersons for referral (Chcck as many as apply): 10 Bone mcts zCI Bonc pain &l Other pain 4 0 Bleeding 5 0 Shortness of breath b13 High risk for path. Fracture 7 0 Pathologie frrrcture
Disease History
P r i m ~ r y Cancer Site (Chcck only one): IO Br- 2 0 Prostate 3C3 Lung 4 0 W d & Ncck 5 0 Bladda 6 0 Esophagus 7 0 Pancreas sO Stotnach/ Gastric
8 O Mass 9 0 Bmin mcts
Cord compression 1 1 O Caudri equina syndrome
SVCO symptoms isCI Unknown 1 4 C l Other:
90 Rend CelV Kidncy 10[3 Endomcuiurn
0vmia.n ~0 Colorectal 1 3 0 Anal Cmd
Multiple Myelorna 1 5 0 Unknown 16Q Other:
Date of 1' Diagnons of Maiignancy: . . (Date of Bx if rivailable) DD MM YYYY
Pathology: 10 Admo ca 2 0 Squamous ce11 3 0 Multiple myeloma
4 U Unknown Other
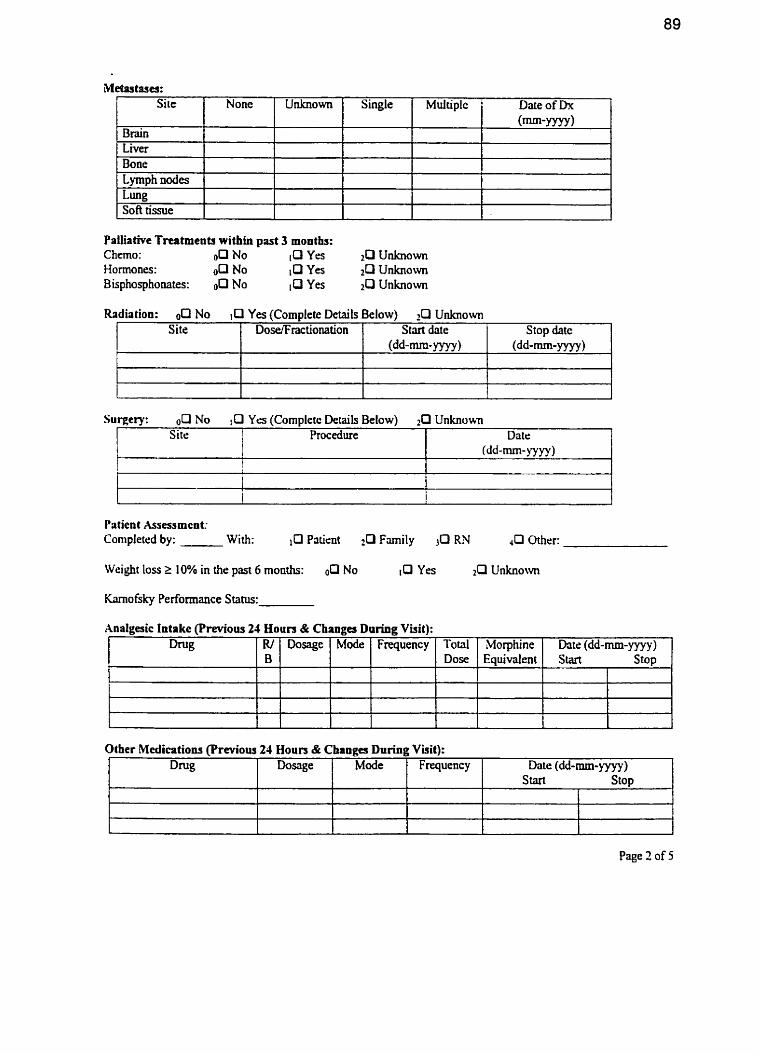
Palliative Treatments within past 3 months: Chemo : o[II No [O Yrs 2 0 Unknown Hormones: 00 No ,O Yes 2R Unknown Bisphosphonates: No Yes 2 0 Unkriown
r9astrues: Sile
Radiation: oQ No Yes (Complete Details Below) 10 Unknowvn
Patient Asessmcnt: Completcd by: With: ,O Patient Family >O LU LI mer:
None
Site
t
Surgery: No 10 Yes (Cornpletc Details Below) 2Cl Unknown
Weight l o s 2 10% in the past 6 rnonths: OP No 10 Y- 20 Unknown
Brain L ~ e ï Bone Lymph nodes Lung SOA tissue
Site i Procedure
1
h o f s k y Performance Status:
Unknown
DoselFractionation
Date (dd-mm-lyyy)
Xnalgesic Intake (Previous 24 Houn & Changes Dnring Visit):
i
I
Single
Stvt date (dd-mm- yyyy )
Page 2 of 5
Stop date (dd-mm-yyyy )
Other Medications (Previous 24 Houn & Changes During Visit):
Multiplc Date of h (mm-yyy~)
D W Mode Dosage Frquency Date (dd-mm- yyyy ) S tart Stop
I
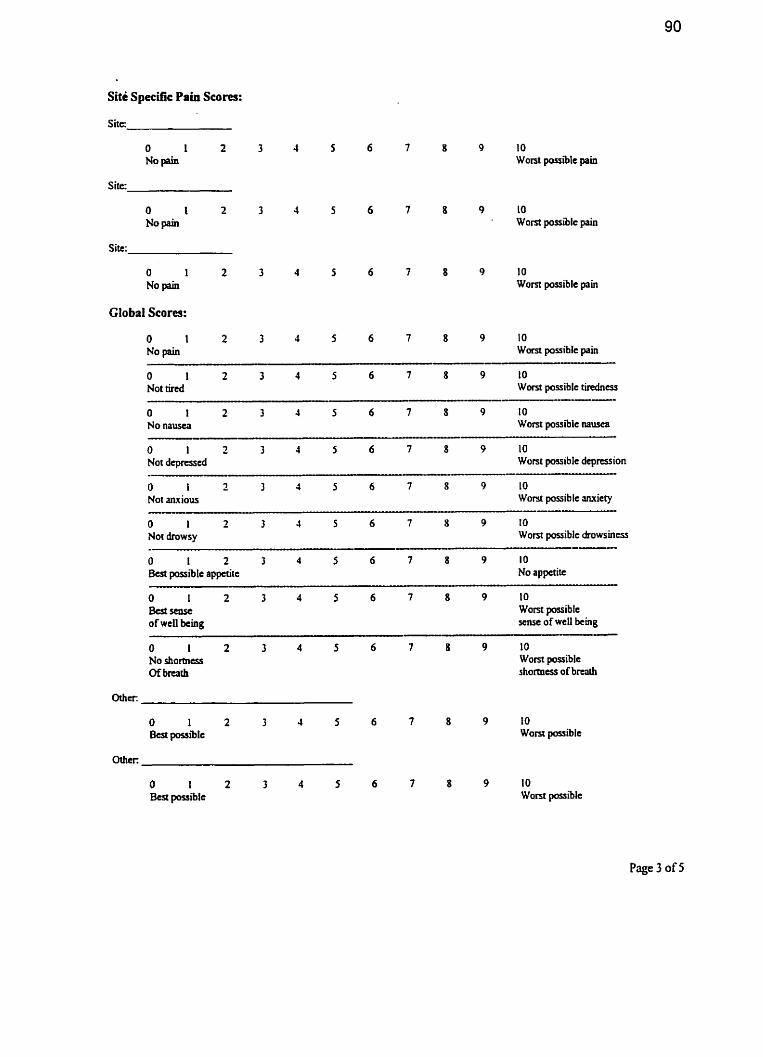
Site Specific Pain Scores:
S i t c
O 1 2 No pain
Site:
10 W o n t possible pain
8 9 10 ' Worst possible pain
8 9 10 Worst possible pain
Global Scores:
O 1 2 3 4 5 6 7 8 9 10 No pain Wom passible pain
O 1 2 3 4 5 6 7 8 9 10 Not rired Worst possible tindnas
O 1 2 3 4 5 6 7 8 9 10 Not depresscd Worst passible depression
O i 2 3 4 5 6 7 8 9 1 O Not mious Worst possible ~ut ie ty -- O i 2 3 4 5 6 7 8 9 IO Not drowsy Wont possible ârowsincss
O 1 2 3 4 5 6 7 8 9 1 O But~asc Wom posiblc of wcll king sense of wcll king
-. . - - - - - . - -- -
O 1 2 3 4 5 6 7 8 9 10 No shortness Wom possible Of brcath shormcss of brurb
8 9 10 Wont possible
Page 3 of 5
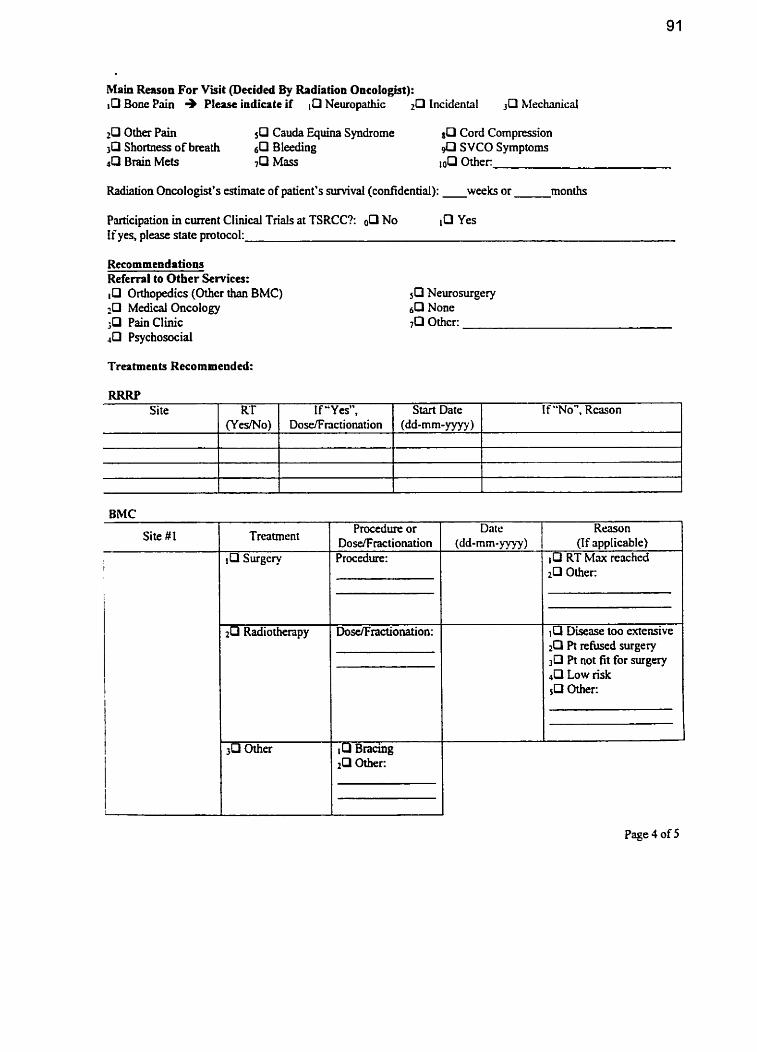
Main Reason For Viiit Oecided %y Radiation Oncologist): 10 Boue Pain + Pl- indicate if Neuropathic Lncidental Mechanical
2P Other Pain &l Cauda Quina Syndrome *Cl Cord Compression Shortness of breath 6 0 BIeeding SVCO Symptoms
JP Brain Mets 7 0 ûther:
Radiation Oncologist's estimate of patient's survival (confidentid): weeks or months
Participation in cment Clinical Trials at TSRCC?: No Yes If yes, please state protocol:
Referrpl to Other SeMces: Orthopedics (Othcr than BMC)
4 Medical Onco Iogy ;O Pain Clinic 40 Psychosocial
Treatmcnts Recommeaded:
BMC
RRRP
Site #1 Procedure or
DosefFractionation
If "No", Rason 1
Site
Dale (dd-mm- yyyy)
Reasun (If applicable)
RT Max rcachcd 2 0 Other:
RT (YcsMo)
, Q Disease too extensive IO Pt refused surgery
Pt not fit for surgery 4 0 Low risk 5P Oîher-
Page 4 of 5
If "Ya", Dose/Fnction.ation
Start Date (dd-mm-yyyy)
Site #2 Procedure or Dose/Fractionation Procedure:
Bncing 2[3 Other:
(if applicable) 10 RT Max reached
O Discase too extensive $3 Pt rehised surgery
Pt not fit for sucgery 4 0 Low risk
ûther:
IO Referring Physicians
BMC + ,O Phonc Clinic Date: . DD MM YYYY
30 RRRP + i Q Phone Chic Date: 1 / DD ml YYYY
Li Orthopedic Clinic (Other than BMC)
Page 5 of 5
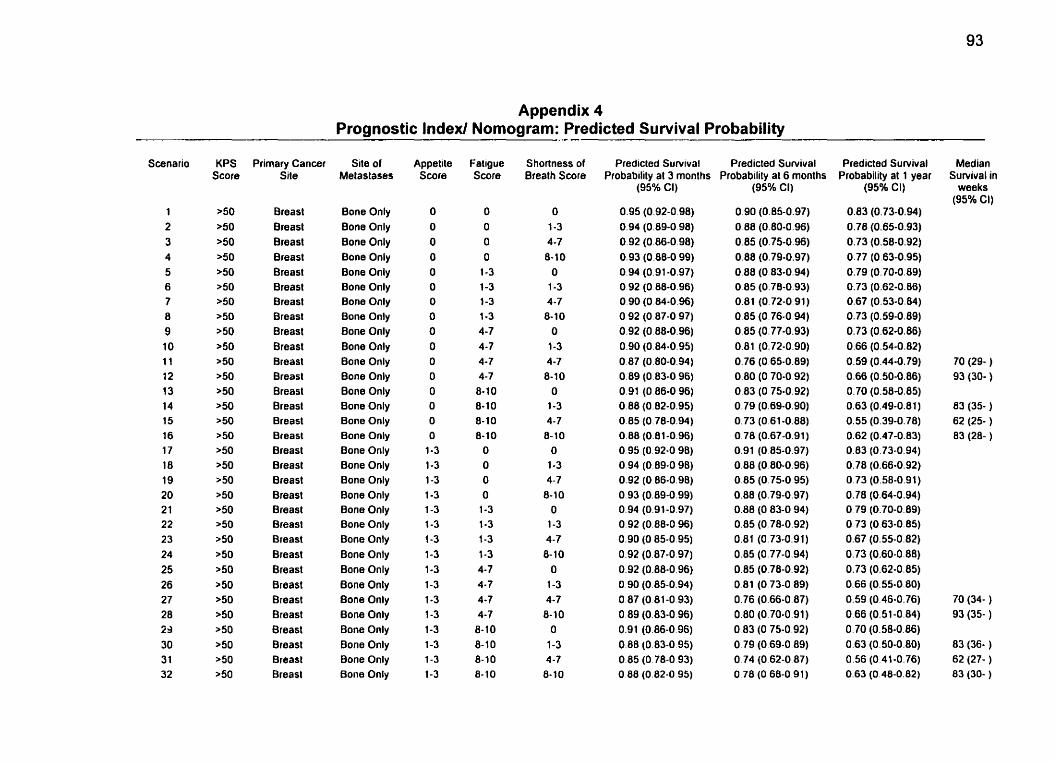
Appendix 4 Prognostic Index! Nomogram: Predicted Survival Probability
Scenario
1 2 3 4 5 6 7 8 9 1 O 11 12 13 14 15 16 17 18 19 20 21 22 23 24 25 26 27 28 29 30 3 1 32
Primary Cancer Site
Breast Breast Breast Breast Breast Breast Breast Breast Breasl Breasl Breast Breast Breasl Breasl Breast Breast Breast Breast Breast Breast Breast Breast Breast Breast Breast Breast Breast Breast Breast Breast Breasl Breast
Site of Metastases
Bone Only Bone Only Bone Only Bone Only Bone Only Bone Only Bone Only Bone Only Bone Only Bone Only Bone Only Bone Only Bone Only Bone Only Bone Only Bone Only Bone Only Bone Only Bone Only Bone Only Bone Only Bone Only Bone Only Bone Only Bone Only Bone Only Bone Only Bone Only Bone Only Bone Only Bone Only Bone Only
Appetite Score
O O O O O O O O O O O O O O O
O 1-3 1-3 1-3 1-3 1-3 1-3 1-3 1-3 1-3 1-3 1-3 1-3 1-3 1-3 1-3 1-3
Fatigue Score
O O O O
1-3
1-3 1-3 1-3 4-7 4-7 4-7 4-7 8- 10 8-10 8-10 8-10
O O O O
1-3 1-3 1-3 1-3 4-7 4-7 4-7 4-7
8- 10 8- 10 8- 10 8- 10
Shortness of Bmath Score
O 1-3 4 -7 6-10
O 1-3 4-7 8-10
O
1-3 4-7 8-10
O 1-3 4-7 8-10
O 1-3 4-7
8-10 O
1-3 4-7 8- 1 O
O 1-3 4-7 8-10
O 1-3 4-7 8- 10
Predicted Survival Predicted Survival Probability al 3 rnonths Probabtlity al 6 months
(95% Cl) (95% CI)
Predicted Survival Probability al 1 year
(95% CI)
Median Survival in
weeks (95% CI)
70 (29- ) 93 (30- )
83 (35- ) 62 (25- ) 83 (28- )
70 (34- ) 93 (35- )
83 (36- ) 62 (27- ) 83 (30- )
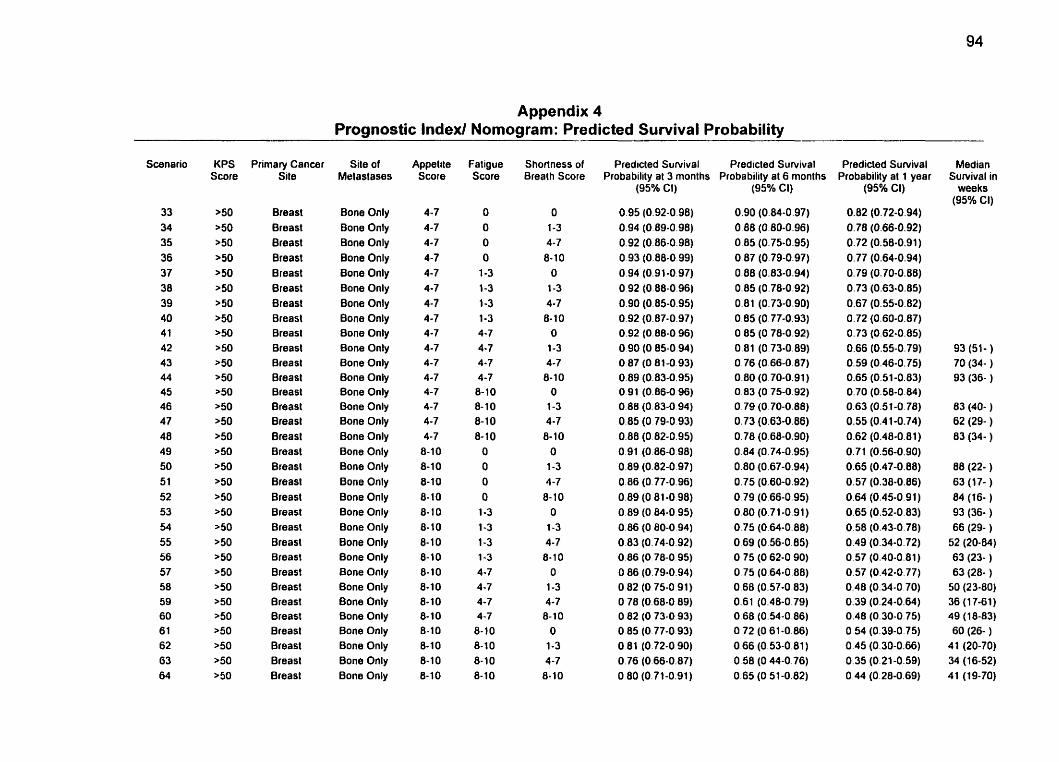
Appendix 4 Prognostic Index1 Nomogram: Predicted Survival Probability
Scenario
33 34 35 36 37 38 39 40 4 1 42 4 3 44 4 5 46 47 48 49 50 5 1 52 53 54 55 56 57 58 59 60 61 62 63 64
Primary Cancer Site
Breast Breast Breast Breast Breast Breast Breast Breasl Breast Breast Breasl Breast Breasl Breast Breasl Breasl Breast Breast Breast Breasl Breast Breast Breasl Breast Breast Breast Breast Breast Breast Breast Breast Breast
Site of Metastases
Bone Only Bone Only Bone Only Bone Only Bone Only Bone Only Bone Only Bone Only Bone Only Bone Only Bone Only Bone Only Bone Only Bone Only Bone Only Bone Only Bone Only Bone Only Bone Only Bone Only Bone Only Bone Only Bone Only Bone Only Bone Only Bone Only Bone Only Bone Only Bone Only Bone Only Bone Only Bone Only
AppeLte Score
4-7 4-7 4-7 4-7 4-7 4-7 4-7 4-7 4-7 4-7 4-7 4-7 4-7 4-7 4-7 4-7
8-10 8-10 8-10 8-10 8-10 8-10 8-10 8-10 8-10 8-10 8-10 8-10 8- 10 8-10 8-10 8-10
Fatigue Score
O O O O
1-3 1-3 1-3 1-3 4-7 4-7 4-7 4-7 8-10 8- 10 8-10 8- 1 O
O O O O
1-3 1-3 1-3 1-3 4-7 4-7 4-7 4-7 8- 10 8-10 8- 10 8-10
Shortness of Breath Score
O 1-3 4-7 8- 10
O 1-3 4-7 8-10
O 1-3 4-7 8-10
O 1-3 4-7 8-10
O 1-3 4-7 8- 10
O 1-3 4-7 8-10
O 1-3 4-7 8-10
O 1-3 4-7 8- 10
Predicled Survival Predicted Survival Probability at 3 months Probability al 6 months
(95Oh CI)
0.95 (0.92-0.98) 0.94 (0.89-0.98) 0.92 (0.86-0.98) 0.93 (0.88.0.99) 0.94 (0.91-0.97) O 92 (0.88-0.96) 0.90 (0.85-0.95) 0.92 (0.87-0.97) 0.92 (0.88-0.96) O 90 (O 85-0.94) O 87 (O 81-0.93) 0.89 (0.83-0.95) 0.91 (0.86-0 96) 0.80 (0.83-0 94) 0.85 (O 79-0.93) 0.88 (0.82-0.95) 0.91 (0.86-0 98) 0.89 (0.82-0.97) 0.86 (0.77-0.96) 0.89 (O 81-0.98) O 89 (O 84-0 95) 0.86 (O 80-0.94) O 83 (0.74-0.92) 0.86 (O 78-0.95) O 86 (0.79-0.94) O82 (075-0 91) O 78 (0.68-0 89) O 82 (O 73-0.93) O 85 (O 77-0 93) O 81 (0.72-0 90) 0.76 (0.66-0.87) O 80 (0.71-0.91)
(95% CI)
0.90 (0.84-0.97) 0.88 (0.80-0.96) 0.85 (0.75-0.95) 0.87 (O.? 9-0.97) 0.88 (0.83-0.94) 0.85 (0.78-0.92) 0.81 (0.73-0.90) 0.85 (0.77-0.93) 0 85 (0.78-0.92) 0.81 (0.73-0.89) O 76 (0.66-0.87) 0.80 (0.70-0.91) 0.83 (O 75-0.92) 0.79 (O 70-0.88) 0.73 (0.63-0.86) 0.78 (0.68-0.90) 0.84 (0.74-0.95) 0.80 (0.67-0.94) 0.75 (0.60-0.92) 0.79 (0.66-0.95) 0.80 (0.71-0.91) 0.75 (0.64-0.88) 0.69 (0.56-0.85) O 75 (0.62-0 90) 0.75 (0.64-0.88) 0.68 (0.57-0.83) 0.61 (0.48-0.79) 0.68 (0.54-0.86) 0.72 (0.61-0.86) 0.66 (0.53-0.81) 0.50 (O 44-0.76) 0.65 (0.51-0.82)
Predicted Survival Probability al 1 year
(95% CI)
0.82 (0.72-0.94) 0.78 (0.66-0.92) 0.72 (0.58-0.91) 0.77 (0.64-0.94) 0.79 (0.70-0.88) 0.73 (0.63-0.85) 0.67 (0.55-0.82) 0.72 (0,60-0.87) 0.73 (0.62-0.85) 0.66 (0.55-0.79) 0.59 (0.46-0.75) 0.65 (0.51-0.83) 0.70 (0.58-0.84) 0.63 (0.51-0.78) 0.55 (0.4 1-0.74) 0.62 (0.48-0.81) 0.71 (0.56-0.90) 0.65 (0.47-0.88) 0.57 (0.38-0.86) 0.64 (0.45-0.91) 0.65 (0.52-0.83) 0.56 (0.43-0.78) 0.49 (0.34-0.72) 0.57 (0.40-0.81) 0.57 (0.42-0.77) 0.48 (0.34-0.70) 0.39 (0.24-0.64) 0.48 (0.30-0.75) O 54 (0.39-0.75) 0.45 (0.30-0.66) 0.35 (0.21-0.59) 0.44 (0.28-0.69)
Median Suivival in
weeks (95% CI)
93 (51- ) 70 (34- ) 93 (36- )
83 (40- ) 62 (29- ) 83 (34- )
88 (22- ) 63 (1 7- ) 84 (16- ) 93 (36- ) 66 (29- )
52 (20-84) 63 (23- ) 63 (28- )
50 (23-80) 36 (1 7-61) 49 (18-83) 60 (26- )
41 (20-70) 34 (16-52) 41 (19-70)
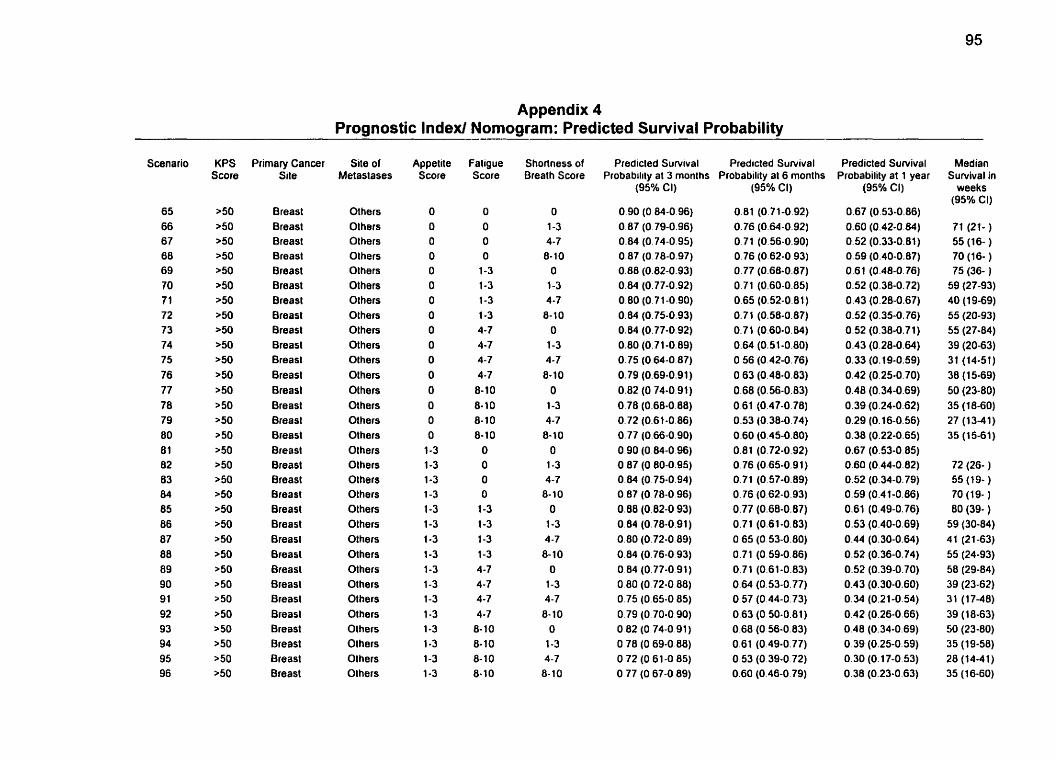
Appendix 4 Prognostic Index/ Nomogram: Predicted Survival Probability
Scenario
65 66 67 68 69 70 7 1 72 73 74 75 76 77 78 79 80 8 1 82 83 84 85 86 87 88 89 90 91 92 93 94 95 96
Prirnary Cancer Site
Breast Breasl Breast Breasl Breasl Breasl h a s t Breast Breast Breasl Breast Breasl Breast Breasl Breast Breasl 8reasl Breasl Breast Breasl Breasl Breast Breast Breasl Breasl Breasl Breast Breasl Breasl Breasl Breasl Breasl
Site of Metaslases
Others Others Others Others Olhers Others Olhers Others Olhers Others Others OLhers Others Others Olhers Olhers Others Others Others Others Others Others Olhers Olhers Olhers Olhers Olhers Olhers Olhers Olhers Olhers Olhers
Appelite Score
O O O O O O O O O O O O O O O O
1-3 1-3 1-3 1-3 1-3 1-3 1-3 1-3 1-3 1-3 1-3 1-3 1-3 1-3 1-3 1-3
Faligue Score
O O O O
1-3 1-3 1-3 1-3 4-7 4-7 4-7 4-7
8-10 8- 10 8-10 8-10
O O O O
1-3 1-3 1-3 1-3 4-7 4-7 4-7 4 -7
8- 10 8- 10 8- 10 8- 1 O
Shorlness of Brealh Score
O 1-3 4-7
6-10 O
1-3 4-7
8-10 O
1-3 4-7
8-10 O
1-3 4-7
8-10 O
1-3 4-7
8-10 O
1-3 4-7
8- 1 O O
1-3 4-7 8- 1 O
O 1-3 4-7
8- 10
Predicled Survival Predicled Suwival Probability at 3 months Probability al 6 rnonths
(95% Cl)
0.90 (O 84-0.96) O 87 (0.79-0.96) 0.04 (0.74-0.95) 0.87 (0.78-0.97) 0.88 (0.82-0.93) 0.84 (0.77-0.92) 0.80 (0.71 -0.90) 0.84 (0.75-0.93) 0.84 (O.? 7-0.92) 0.80 (0.71-0.89) 0.75 (0.64-0.87) 0.79 (0.69-0.91) 0.82 (O 74-0.91) 0.78 (0.68-0.88) 0.72 (0.61-0.86) 0.77 (0.66-0.90) 0.90 (0.84-0 96) O 87 (0.80-0.95) 0.84 (0.75-0.94) 0.87 (O 78-0 96) 0.80 (0.82-0.93) 0.84 (0.78-0.91) 0.80 (0.72-0.89) 0.84 (0.76-0 93) O 84 (0.77-0 91) O 80 (0.72-0 88) 0.75 (0.65-0 85) 0.79 (O 70-0.90) O 82 (O 74-0 91) O 78 (O 69-0 88) O 72 (O 61 -0 85) O 77 (O 67-0 89)
(95% CI)
Predicted Survival Probability at 1 year
(95% Cl)
Median Sunrival in
weeks (95% Cl)
71 (21- ) 55 (16- ) 70 (16- ) 75 (36- )
59 (27-93) 40 (1 9-69) 55 (20-93) 55 (27-84) 39 (20-63) 31 (14-51) 38 (1 5-69) 50 (23-80) 35 (1 8-60] 27 (13-41) 35 (15-61)
72 (26- ) 55 (19- ) 70 (1 9- )
80 (39- ) 59 (30-84) 41 (21-63) 55 (24-93) 58 (29-84) 39 (23-62) 31 (17-48) 39 (18-63) 50 (23-80) 35 (19-58) 28 (14-41) 35 (16-60)
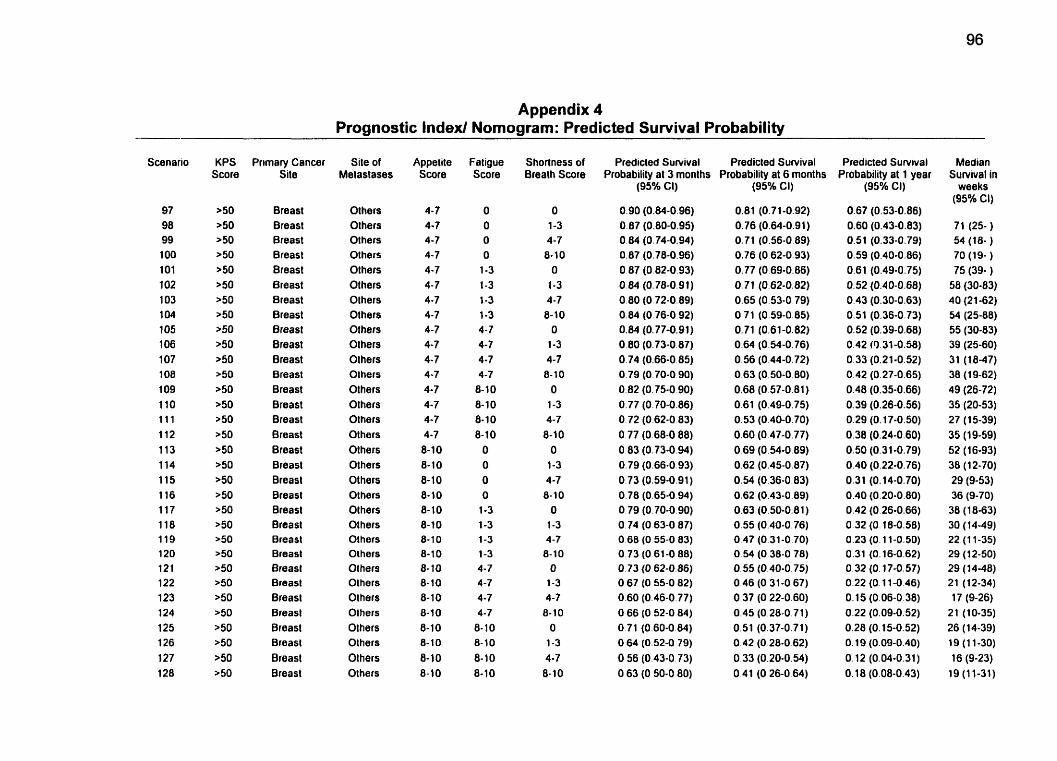
Appendix 4 -- Prognostic Index1 Nomogram: Predicted Survival Probability
Scenario
97 98 99 1 O0 1 O1 102 1 O3 104 1 O5 1 O6 1 O7 1 O8 1 O9 110 1 1 1 112 113 114 115 Il6 117 118 119 120 121 122 123 124 125 126 127 128
Primary Cancer Site
Breast Breast Breast Breast Breast Breast Breast Breast Breast Breast Breast Breast Breast Breast Breast Breast 8reast Breast Breasl Breast Breast Breast Breast Breast Breast Breast Breast Breast Breasl Breasl Breasl Breast
Site of Metastases
Olhers Others Others Others Others Others Others Others Others Olhers Olhers Olhers Olhers Others Others Others Others Olhers Others Others Others Others Olhers Olhers Others Others Olhers Olhers Olhers Olhers Olhers Others
Appetite Score
4-7 4-7 4-7 4-7 4-7 4-7 4-7 4-7 4-7 4-7 4-7 4-7 4-7 4-7 4-7 4-7 8-10 8- 10 8-10 8-10 8- 1 O 8-10 8-1 0 8-10 8-10 8- 10 8-10 8-10 8-10 8-10
8-10 8-10
Fatigue Score
O O O O 1-3 1-3 1-3 1-3 4-7 4-7 4-7 4-7 8-10 8-10 8-10 8-10 O O O O 1-3 1-3 1-3 1-3 4-7 4-7 4-7 4-7 8- 1 O 8- 10 8-10 8-10
Shortness of Breath Score
O 1-3 4-7 8-10 O 1-3 4-7 8-10 O 1-3 4-7 8- 1 O O 1-3 4-7 8-10 O 1-3 4-7 8- 10 O 1-3 4-7 8-10
O 1-3 4-7 8-10 O 1-3 4-7 8-10
Predicted Suivival Predicted Sunrival Probabilitv at 3 months Probabilitv at 6 months
(9j% Cl)
0.90 (0.84-0.96) 0.87 (0.80-0.95) 0.84 (0.74-0.94) 0.87 (0.78-0.96) O 87 (0.82-0.93) 0.84 (0.78-0.91) 0.80 (0.72-0.89) 0.84 (0.76-0.92) 0.84 (0.77-0.91) 0.80 (0.73-0.87) 0.74 (0.66-0 85) 0.79 (O 70-0 90) 0.82 (0.75-0 90) 0.77 (0.70-0.86) O 72 (0.62-0 83) 0.77 (0.68-0 88) O 83 (0.73-0.94) 0.79 (0.66.0.93) 0.73 (0.59-0.91) 0.78 (0.65-0.94) 0.79 (0.70-0.90) 0.74 (O 63-0 87) O 68 (O 55-0 83) 0.73 (O 61-0 88) O 73 (O 62-0.86) O 67 (O 55-0 82) 0.60 (0.46-0.77) O 66 (O 52-0 84) 0.71 (0.60-0.84) O 64 (0.52-0 79) O 56 (O 43-0 73) O 63 (O 50-0 80)
(950~ CI)
0.81 (0.71-0.92) 0.76 (0.64-0.91) 0.71 (0.56-0.89) 0.76 (0.62-0.93) 0.77 (0.69-0.86) 0.71 (0.62-0.82) 0.65 (0.53-0.79) 0.71 (0.59-0.85) 0.71 (0.61-0.82) 0.64 (0.54-0.76) 0.56 (0.44-0.72) 0.63 (0.50-0 80) 0.60 (O 57-0.81) 0.61 (0.49-0.75) 0.53 (0.40-0.70) 0.60 (0.47-0.77) 0.69 (0.54-0.89) 0.62 (0.45-0.87) 0.54 (0.36-0.83) 0.62 (0.43-0.89) 0.63 (0.50-0.81) 0.55 (0.40-0.76) 0.47 (0.31-0.70) 0.54 (0.38-0.78) O. 55 (0.40-0.75) 0.46 (0.31-0 67) O 37 (O 22-0.60) 0.45 (0.28-0.71) 0.51 (0.37-0.71) 0.42 (0.28-0 62) 0.33 (0.20-0.54) O 4 1 (O 26-0.64)
Predicted Sunrival Probability at 1 year
(95% CI)
0.67 (0.53-0.86) 0.60 (0.43-0.83) 0.51 (0.33-0.79) 0.59 (0.40-0.86) 0.61 (0.49-0.75) 0.52 (0.40-0.68) 0.43 (0.30-0.63) 0.51 (0.36-0.73) 0.52 (0.39-0.68) 0.42 (9.31-0.56) 0.33 (0.21-0.52) 0.42 (0.27-0.65) 0.48 (0.35-0.66) 0.39 (0.26-0.56) 0.29 (0.17-0.50) 0.38 (0.24-0.60) 0.50 (0.31-0.79) 0.40 (0.22-0.76) 0.31 (0.14-0.70) 0.40 (0.20-0.80) 0.42 (0.26-0.66) 0.32 (0.18-0.58) 0.23 (O. 11-0.50) 0.31 (O. 16-0.62) 0.32 (0.17-0.57) 0.22 (O. 1 1-0.46) 0.15 (0.06-0.38) 0.22 (0.09-0.52) 0.28 (O. 15-0.52) O. 19 (0.09-0.40) O. 12 (0.04-0.31) O. 18 (0.08-0.43)
Median Sunrival in
weeks (95% CI)
71 (25- ) 54 (18- ) 70 (19- ) 75 (39- ) 58 (30-83) 40 (2 1-62) 54 (25-88) 55 (30-83) 39 (25-60) 31 (18-47) 38 (1 9-62} 49 (26-72) 35 (20-53) 27 (15-39) 35 (19-59) 52 (16-93) 38 (12-70) 29 (9-53) 36 (9-70) 38 (1 8-63) 30 (1449) 22 (1 1-35) 29 (1 2-50) 29 (1 4-48) 21 (12-34) 17 (9-26) 21 (10-35) 26 (14-39) 19 (1 1-30) 16 (9-23) 19 (1 1-31)
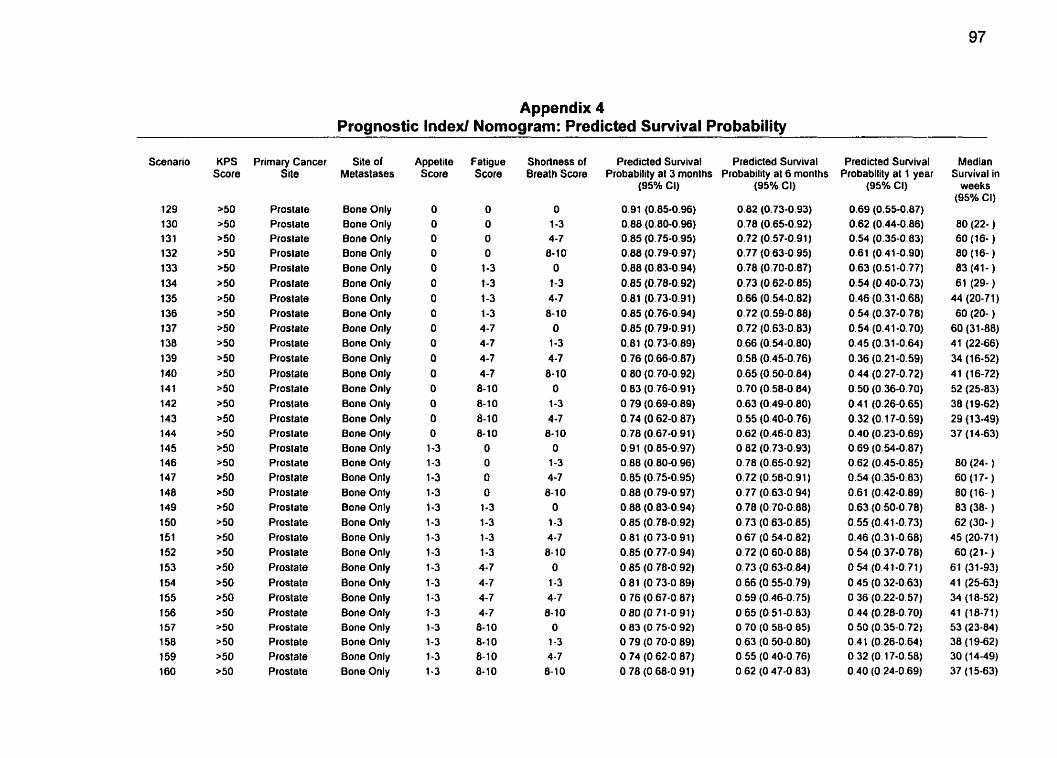
Appendix 4 Prognostic Index1 Nomogram: Predicted Survival Probability
Scenario
129 130 131 132 133 1 34 135 136 137 138 139 140 14 1 142 143 144 145 146 147 148 149 150 151 152 153 1 54 155 1 56 157 1 58 159 160
Primary Cancer Site
Prostate Prostate Prostate Prostate Prostate Prostate Prostate Prostate Prostate Prostate Plostate Prostate Plostate Prostate Prostate Prostate Prostate Prostate Prostate Prostate Prostate Prostate Prostate Prostate Prostate Prostate Prostate Prostate Prostate Prostate Prostale Prostate
Site of Metastases
Bone Only Bone Only Bone Only Bone Only Bone Only Bone Only Bone Only Bone Only Bone Only Bone Only Bone Only Bone Only Bone Only Bone Only Bone Only Bone Only Bone Only Bone Only Bone Only Bone Only Bone Only Bone Only Bone Only Bone Only Bone Only Bone Only Bone Only Bone Only Bone Only Bone Only Bone Only Bone Only
Appel ite Score
O O O O O O O O O O O O O O O O
1-3 1-3 1-3 1-3 1-3 1-3 1-3 1-3 1-3 1-3 1.3 1-3 1-3 1-3 1-3 1-3
Fatigue score
O O O O
1-3 1-3 1-3 1-3 4-7 4-7 4-7 4-7 8-10 8-10 8-10 8-10
O O O O 1-3 1-3 1-3 1-3 4-7 4-7 4-7 4-7 8-10 8-10 8- 1 O 8- 10
Shortness of Breath Score
O 1-3 4-7 8-10
O 1-3 4-7 8-10
O 1-3 4-7 8-10
O 1-3 4-7 8-10
O 1-3
4-7 8-10
O 1-3 4-7 8- 1 O
O 1-3 4-7 8-10
O
1-3 4-7 8- 10
Predided Survival Predicted Survival Probability al 3 rnonlhs Probability al 6 months
(95% Ci)
0.91 (0.85-0.96) 0.88 (0.80-0.96) 0.85 (0.75-0.95) 0.88 (0.79-0.97) 0.88 (0.83-0.94) 0.85 (0.78-0.92) 0.81 (0.73-0.91) 0.85 (0.76-0.94) 0.85 (0.79-0.91) 0.81 (0.73-0.89) 0.76 (0.66-0.87) 0.80 (0.70-0.92) 0.83 (O 76-0.91) 0.79 (0.69-0.89) 0.74 (0.62-0.87) 0.78 (0.67-0.91) 0.91 (0.85-0.97) 0.88 (0.80-0.96) 0.85 (0.75-0.95) 0.88 (0.79-0.97) 0.88 (0.83-0.94) 0.85 (0.78-0.92) 0.81 (O 73-0 91) 0.85 (0.77-0.94) 0.85 (0.78-0.92) 0.81 (O 73-0 89) O 76 (0.67-0 87) O 80 (0.71-0 91) O 83 (O 75-0 92) 0.79 (O 70-0.89) O 74 (O 62-0 87) O 78 (O 68-0 9 1 )
(95% CI)
0.82 (0.73-0.93) 0.78 (0.65-0.92) 0.72 (0.57-0.91) 0.77 (0.63-0.95) 0.78 (0.70-0.87) 0.73 (0.62-0.85) 0.66 (0.54-0.82) 0.72 (0.59-0.88) 0.72 (0.63-0.83) 0.66 (0.54-0.80) 0.58 (0.45-0.76) 0.65 (0.50-0.84) 0.70 (0.58-0 84) 0.63 (0.49-0.80) 0.55 (0.40-0.76) 0.62 (0.46-0 83) 0.82 (0.73-0.93) 0.78 (0.65-0.92) 0.72 (0.50.0.91) 0.77 (0.63-0 94) 0.78 (0.70-0.88) 0.73 (0.63-0.85) O 67 (0.54-0.82) 0.72 (0.60-0.88) 0.73 (0.63-0.84) 0.66 (0.55-0.79) 0.59 (0.46-0.75) 0.65 (0.51-0.83) 0.70 (O 58-0.85) 0.63 (0.50-0.80) O 55 (O 40-0.76) O 62 (O 47-0.83)
Predicted Survival Probability at 1 year
(95Oh CI)
0.69 (0.55-0.87) 0.62 (0.44-0.86) 0.54 (0.35-0.83) 0.61 (0.41-0.90) 0.63 (0.51-0.77) 0.54 (0.40-0.73) 0.46 (0.31-0.68) 0.54 (0.37-0.78) 0.54 (0.4 1-0.70) 0.45 (0.31-0.64) 0.36 (0.21-0.59) 0.44 (0.27-0.72) 0.50 (0.36-0.70) 0.41 (0.26-0.65) 0.32 (0.17-0.59) 0.40 (0.23-0.69) 0.69 (0.54-0.87) 0.62 (0.45-0.85) 0.54 (0.35-0.83) 0.61 (0.42-0.89) 0.63 (0.50-0.78) 0.55 (0.41-0.73) 0.46 (0.31-0.68) 0.54 (0.37-0.78) 0.54 (0.41-0.71) 0.45 (0.32-0.63) 0.36 (0.22-0.57) 0.44 (0.28-0.70) 0.50 (0.35-0.72) 0.41 (0.26-0.64) 0.32 (O. 17-0.58) 0.40 (0.24-0.69)
Median Survival in
weeks (95% CI)
80 (22- ) 60 (16- ) 80 (16- ) 83 (41- ) 61 (29- )
44 (20-71) 60 (20- )
60 (3 1-88) 41 (22-66) 34 (16-52) 41 (16-72) 52 (25-83) 38 (19-62) 29 (1 3-49) 37 (14-63)
80 (24- ) 60 (1 7- ) 80 (16- ) 83 (38- ) 62 (30- )
45 (20-71) 60 (21- )
61 (31-93) 41 (25-63) 34 (18-52) 41 (18-71) 53 (23-84) 38 (19-62) 30 (14-49) 37 (1 5-63)
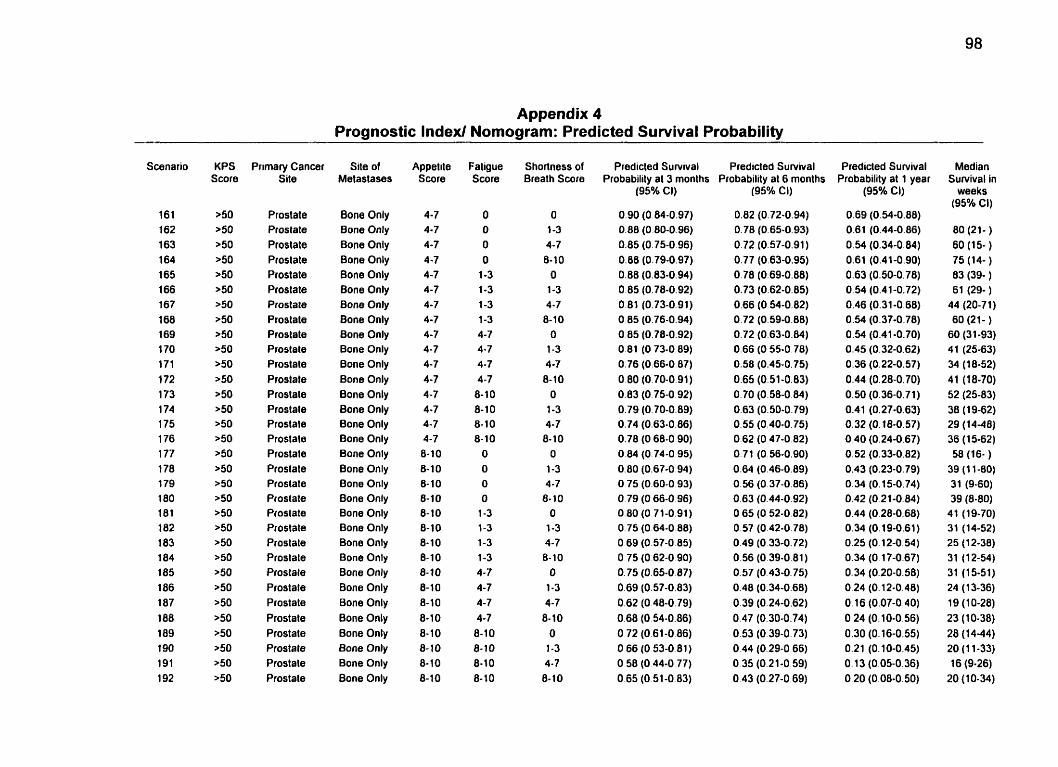
Appendix 4 Prognostic Index/ Nomogram: Predicted Survival Probability
Scanario
161 162 163 1 64 165 1 66 167 168 169 1 70 171 1 72 173 1 74 175 1 76 177 178 179 180 181 182 183 184 185 186 187 188 189 190 191 192
Prirnary Cancer Site
Prostate Prostate Prostate Prostate Prostate Prostate Prostate Prostate Proslate Prostate Proslale Proslate Prostate Prostate Prostate Prostate Prostate Prostate Prostate Prostate Piostate Prostate Prostate Prostate Prostale Prostate Prostate Prostate Prostate Prostate Prostate Prostate
Site of Melaslases
Bone Only Bone Only Bone Only Bone Only Bone Only Bone Only Bone Only Bone Only Bone Only Bone Only Bone Only Bone Only Bone Only Bone Only Bone Only Bone Only Bone Only Bone Only Bone Only Bone Only Bone Only Bone Only Bone Only Bone Only Bone Only Bone Only Bone Only Bone Only Bone Only Bone Only Bone Only Bone Only
Appelite Score
4-7 4-7 4-7 4-7 4-7 4-7 4-7 4-7 4-7 4-7 4-7 4-7 4-7 4-7 4-7 4-7 8-10 8-10 8-10 8-10 8-10 8-10 8-10 8-10 8-10 8-10 8-10 8-10 8-10 8-10 8-10 8-10
Fatigue Score
O O O O
1-3 1-3 1-3 1-3 4-7 4-7 4-7 4 -7 8-10 8-10 8-10 8-10
O O O
O
1-3 1-3 1-3 1-3 4-7 4-7 4-7 4-7 8-10 8-10 8-10 8-10
Shorîness of Breath Score
O 1-3 4-7 8-10
O 1-3 4-7 8-10
O 1-3 4-7 8- 1 O
O 1-3 4-7 8-10
O
1-3 4-7 6-10
O 1-3 4-7 8- 10
O 1-3 4-7
8-10 O 1-3 4-7 6-10
Predicted Suwival Predicled Suwival Probability al 3 months Probability at 6 months
(95% Cl) (95% CI)
Predicled Survival Probability at 1 year
(95% CL)
0.69 (0.54-0.88) 0.61 (0.44-0.86) 0.54 (0.34-0.84) 0.61 (0.41-0.90) 0.63 (0.50-0.78) 0.54 (0.41-0.72) 0.46 (0.31-0.68) 0.54 (0.37-0.78) 0 . 9 (0.41-0.70) 0.45 (0.32-0.62) 0.36 (0.22-0.57) 0.44 (0.28-0.70) 0.50 (0.36-0.71) 0.41 (0.27-0.63) 0.32 (O. 18-0.57) 0.40 (0.24-0.67) 0.52 (0.33-0.82) 0.43 (0.23-0.79) O 34 (O. 15-0.74) 0.42 (0.21-0.84) 0.44 (0.28-0.68) 0.34 (0.19-0.61) 0.25 (0.12-0.54) 0.34 (O. 17-0.67) 0.34 (0.20-0.58) 0.24 (0.12-0.48) O. 16 (0.07-0.40) 0.24 (0.10-0.56) 0.30 (0.16-0.55) 0.21 (0.10-0.45) 0.13 (0.05-0.36) 0.20 (0.08-0.50)
Median Survival in
weeks (95% CI)
80 (21- )
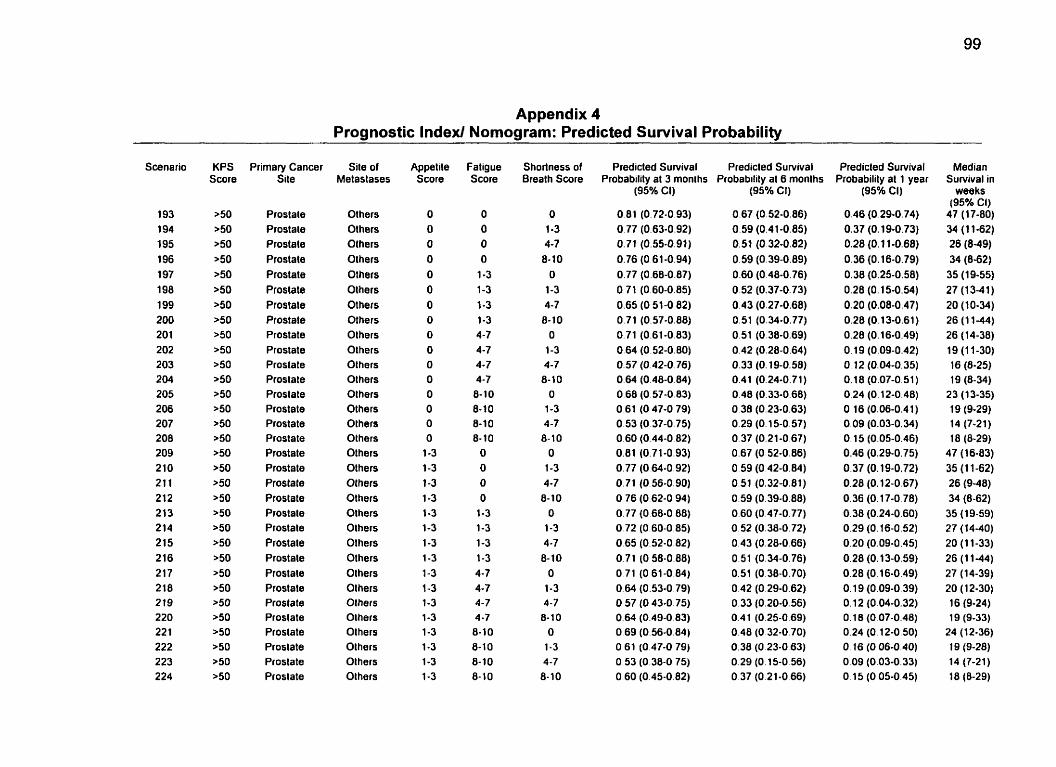
Appendix 4 Prognostic lndexl Nomogram: Predicted Survival Probability
. .
Scenario
193 194 195 196 197 198 199 200 201 202 203 204 205 206 207 208 209 210 21 1 212 2 13 214 215 2 16 217 2 18 219 220 22 1 222 223 224
KPS Score
>50 >50 >50 >50 >50 >50 >50 >50 >50 >50 >50 ~ 5 0 a50 >50 >50 >50 >50 >50 >50 ~ 5 0 250 >50 >50 >50 >50 a50 >50 ~ 5 0 >50 >50 >50 >50
Primary Cancer Site
Proslate Prostale Prostate Prostate Prostate Prostate Prostate Prostate Prostate Prostate Prostate Prostate Prostate Prostate Prostate Prostate Prostate Prostate Prostate Prostate Prostale Proslate Prostale Prostate Prostale Prostate Prostate Prostate Prostate Prostate Prostate Prostate
Sile of Metastases
Olhers Olhers Others Others Others Others Others Others Others Others Others Olhers Others Others Others Others Others OLhers Others Others Olhers Olhers Others Others Olhers Olhers Others Olhers Others Others Others Olhers
Appet ite Score
O O O O O O O O O
O O O O O O O
1-3 1-3 1-3 1-3 1-3 1-3 1-3 1-3 1-3 1-3 1-3 1-3 1-3 1-3 1-3 1-3
Fatigue Score
O O O O
1-3 1-3 1-3 1-3 4-7 4-7 4-7 4-7 8-10 8-10 8-1 0 8- 10
O O O O
1-3 1-3 1-3 1-3 4-7 4-7 4-7 4-7 8-10 8-10 8-10 8- 1 O
Shorîness of Brealh Score
O 1-3 4-7 8-10
O 1-3 4-7 8-10
O 1-3 4-7 8-10
O
1-3 4-7 8- 10
O 1-3 4-7 8- 10
O 1-3 4-7 8-10
O 1-3 4-7 8- 10
O 1-3 4-7 8- 10
Predicted Survival Predicted Sunrival Probability al 3 months Probability al 6 months
(95% Ci)
0.81 (0.72-0.93) O 77 (0.63-0.92) 0.71 (0.55-0.91) 0.76 (0.61-0.94) 0.77 (0.68-0.87) 0 71 (0.60-0.85) 0.65 (0.51-0.82) 0.71 (0.57-0.88) 0.71 (0.61-0.83) 0.64 (0.52-0.80) 0.57 (0.42-0.76) 0.64 (0.48-0.84) 0.68 (0.57-0.83) 0.61 (0.47-0.79) 0.53 (0.37-0.75) 0.60 (0.44-0.82) 0.81 (0.71-0.93) 0.77 (O 64-0.92) O. 71 (0.56-0.90) O 76 (0.62-0.94) 0.77 (O 68-0.88) 0.72 (0.60-0.85) 0.65 (0.52-0.82) 0.71 (O 58-0.88) O71 (061-0.84) 0.64 (0.53-0.79) O 57 (O 43-0.75) 0.64 (0.49-0 83) 0.69 (0.56-0.84) O 61 (0.47-0 79) O 53 (0.38-0 75) 0.60 (0.45-0 82)
(95% Cl)
0.67 (0.52-0.86) 0.59 (0.41-0.85) 0.51 (0.32-0.82) 0.59 (0.39-0.89) 0.60 (0.48-0.76) 0.52 (0.37-0.73) 0.43 (0.27-0.68) 0.51 (0.34-0.77) 0.51 (0.38-0.69) 0.42 (0.28-0.64) 0.33 (O. 19-0.58) 0.41 (0.24-0.71) 0.48 (0.33-0.68) 0.38 (0.23-0.63) 0.29 (0.15-0.57) 0.37 (0.21-0 67) 0.67 (O 52-0.86) 0.59 (0.42-0.84) 0.51 (0.32-0.81) 0.59 (0.39-0.88) 0.60 (0.47-0.77) 0.52 (0.38-0.72) 0.43 (0.28-0.66) 0.51 (0.34-0.76) 0.51 (0.38-0.70) 0.42 (0.29-0.62) 0.33 (0.20-0.56) 0.41 (0.25-0.69) 0.48 (O 32-0.70) 0.38 (O 23-0.63) 0.29 (0.15-0.56) O 37 (0.21-0.66)
Predicted Survival Probability al 1 year
(95% CI)
0.46 (0.29-0.74) 0.37 (O. 19-0.73) 0.28 (O . 1 1-0.68) 0.36 (O. 16-0.79) 0.38 (0.25-0.58) 0.28 (O. 15-0.54) 0.20 (0.08-0.47) 0-28 (0.13-0.61) 0.28 (0.16-0.49) O. 19 (0.09-0.42) O 12 (0.04-0.35) 0.18 (0.07-0.51) 0.24 (O. 12-0.48) O. 16 (0.06-0.4 1 ) 0,09 (0.03-0.34) O. 15 (0.05-0.46) 0.46 (0.29-0.75) 0.37 (O. 19-0.72) 0.28 (O. 12-0.67) O 36 (O. 17-0.78) 0.38 (0.24-0.60) 0.29 (0.16-0.52) 0.20 (0.09-0.45) 0.28 (O. 13-0.59) 0.28 (0.16-0.49) O. 19 (0.09-0.39) O. 12 (0.04-0.32) O. 18 (0.07-0.48) 0.24 (0.12-0.50) O. 16 (0.06-0.40) 0.09 (0.03-0.33) O. 15 (0.05-0.45)
- --
Median Survival in
weeks (95% Ci)
47 (17-80) 34 (1 1-62) 26 (8-49) 34 (8-62)
35 (19-55) 27 (1341) 20 (10-34) 26 (1 1-44) 26 (14-38) 19 (1 1-30) 16 (8-25) 19 (8-34)
23 (13-35) 19 (9-29) 14 (7-21) 18 (8-29)
47 (16-83) 35 (1 1-62) 26 (9-48) 34 (8-62) 35 (1 9-59) 27 (1440) 20 (1 1-33) 26 (1 1-44) 27 (14-39) 20 (12-30) 16 (9-24) 19 (9-33)
24 (12-36) 19 (9-28) 14 (7-21) 18 (8-29)
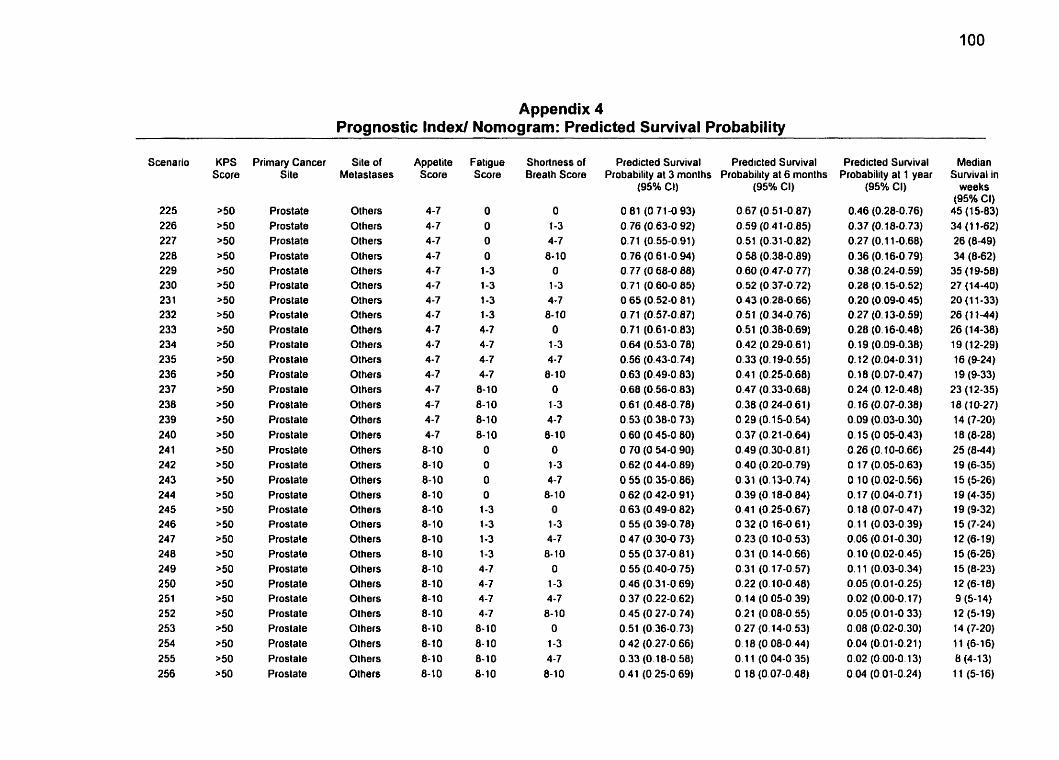
Appendix 4 Prognostic Index1 Nomogram: Predicted Survival Probability
-
Scenario
225 226 227 228 229 230 23 1 232 233 234 235 236 237 238 239 240 24 1 242 243 244 245 246 247 248 249 2 50 251 252 253 254 255 2 56
Primary Cancer Site
Prostate Prostate Prostate Prostate Prostate Prostate Prostate Prostale Prostale Prostate Prostate Prostate Prostate Prostate Prostate Prostate Prostate Prostate Prostate Proslale Prostate Prostale Prostate Prostate Prostate Prostate Prostate Prostate Prostate Prostate Prostate Prostate
Site of Melastases
Others Others Others Others Olhers Others Others Others Others Others Others Ot hers Others Others Others Others Others Others Others Others Others Others Others Olhers Olhers Others Olhers Olhers Others Olhers Others Olhers
Appetite Score
4-7 4-7 4-7 4-7 4-7 4 -7 4-7 4-7 4-7 4-7 4-7 4-7 4-7 4-7 4-7 4-7
6-10 8- 1 O 8-1 0 8-10 8-10 8-10 8-10 8-10 8- 10 8-10 8-10 8-10 8-10 8-10 8-10 8-10
Fatigue Score
O O O O
1-3 1-3 1-3 1-3 4-7 4-7 4-7 4-7 8-10 8-10 8-10 8-10
O O O O
1-3 1-3 1-3 1-3 4-7 4-7 4-7 4-7
8- 10 8-10 8-10 8- 10
Shortness of Breath Score
O 1-3 4-7
8-10 O
1-3 4-7
8-10 O
1-3 4-7
8- 10 O
1-3 4-7 8-10
O 1-3 4-7
8- 10 O
1-3 4-7 8- 10
O 1-3 4-7
8-10 O
1-3 4-7
8-10
Predicted SuNival Predicted SuNival Probability at 3 months Probabilily at 6 months
(95% Cl)
0.67 (0.51-0.87) 0.59 (O 41-0.85) 0.51 (0.31-0.82) 0.58 (0.38-0.09) 0.60 (0.47-0.77) 0.52 (0.37-0.72) 0.43 (0.28-0.66) 0.51 (0.34-0.76) 0.51 (0.36-0.69) 0.42 (0.29-0.61) 0.33 (O. 19-0.55) 0.41 (0.25-0.68) 0.47 (0.33-0.68) 0.38 (O 24-0.61) O 29 (0.15-0.54) 0.37 (0.21-0.64) 0.49 (0.30-0.81) 0.40 (0.20-0.79) 0.31 (0.13-0.74) 0.39 (0. 18-0.84) 0.41 (0.25-0.67) O 32 (0.16-0 61) 0.23 (0.10-0.53) 0.31 (O. 14-0.66) 0.31 (O. 17-0.57) 0.22 (0.10-0.48) 0.14 (O 05-0.39) 0.21 (O 08-0.55) O 27 (0.14-0 53) O. 18 (0.08-0.44) O. 1 1 (O 04-0 35) O 18 (0.07-0.48)
Predicted Survival Probabilily at 1 year
(95% Ci)
0.46 (0.28-0.76) 0.37 (0.18-0.73) 0.27 (0.1 1-0.68) 0.36 (0.16-0.79) 0.38 (0.24-0.59) 0.28 (O. 15-0.52) 0.20 (0.09-0.45) O. 27 (O. 13-0.59) 0.28 (0.16-0.46) O. 19 (0.09-0.38) O. 12 (0.04-0.31) O. 18 (0.07-0.47) 0.24 (O. 12-0.48) O. 16 (0.07-0.38) 0.09 (0.03-0.30) o. 15 (0.05-0.43) 0.26 (0.10-0.66) O. 17 (0.05-0.63) O. 1 O (0,OZ-0.56) 0.17 (0.04-0.71) O. 18 (0.07-0.47) 0.1 1 (0.03-0.39) 0,os (0.01-0.30) 0.10 (0.02-0.45) O. 1 1 (0.03-0.34) 0.05 (0.01-0.25) 0.02 (0.00-0.17) 0.05 (0.01-0 33) 0.08 (0.02-0.30) 0.04 (0.01-0.21) 0.02 (0.00-0.13) 0.04 (0.01-0.24)
Median Sunrival in
weeks (95% CI)
45 (15-83) 34 (1 1-62) 26 (8-49) 34 (862)
35 (19-58) 27 (14-40) 20 (1 1-33) 26 (1 1-44) 26 (14-38) 19 (1 2-29) 16 (9-24) 19 (9-33)
23 (12-35) 18 (10-27) 14 (7-20) 18 (8-28) 25 (844) 19 (6-35) 15 (5-26) 19 (4-35) 19 (9-32) 15 (7-24) 12 (6-19) 15 (6-26) 15 (8-23) 12 (6-18) 9 (5-14) 12 (5-19) 14 (7-20) 11 (6-16) 8 (4-1 3) 11 (5-16)

Appendix 4 Prognostic Index1 Nomogram: Predicted Survival Probability
Scenario
257 258 259 260 261 262 263 264 265 266 267 268 269 270 27 1 272 273 274 275 276 277 278 279 280 281 282 283 264 285 286 287 288
Primary Cancer Sile
Lung Lung Lung Lung Lung Lung Lung Lung Lung Lung Lung Lung Lung Lung Lung Lung Lung Lung Lung lung Lung Lung Lung Lung Lung Lung Lung Lung Lung Lung Lung Lung
Site of Metastases
Bone Only Bone Only Bone Only Bone Only Bone Only Bone Only Bone Only Bone Only Bone Only Bone Only Bone Only Bone Only Bone Only Bone Only Bone Only Bone Only Bone Only Bone Only Bone Only Bone Only Bone Only Bone Only Bone Only Bone Only Bone Only Bone Only Bone Only Bone Only Bone Only Bone Only Bone Only Bone Only
Appelite Score
O O O O O O O O O O O O O O O O
1-3 1-3 1-3 1-3 1-3 1-3 1-3 1-3 1-3 1-3 1-3 1-3 1-3 1-3 1-3 1-3
Fatigue Score
O O O O
1-3 1-3 1-3 1-3 4 -7 4-7 4- 7 4-7 8-10 8-10 8-10 8-10
O
O O O
1-3 1-3 1-3 1-3 4-7 4-7 4-7 4-7 8-10 8-10 8- 10 8- 10
Shorlness of Brealh Score
O 1-3 4-7 8- 10
O 1-3 4-7 8- 1 O
O 1-3 4-7 8- 10
O 1-3 4-7 8- 1 O
O 1-3 4-7
8-10 O
1-3 4-7 8-10
O 1-3 4-7 8- 10
O
1-3 4-7 8- 10
Predicled Survival Predicted Survival Probabilily al 3 months Probability al 6 months
(95% CI)
0.90 (0.84-0.96) O 87 (0.79-0.96) 0.84 (0.74-0.95) 0.87 (0.78-0.97) 0.87 (0.82-0.93) 0.84 (0.77-0.92) 0.80 (0.7 1-0.90) 0.84 (0.75-0.93) 0.64 (0.77-0.91) O 79 (O 71-0 88) O 74 (0.64-0.86) 0.79 (0.69-0.91) 0.82 (0.74-0.91) O 77 (0.67-0.89) 0.72 (0.60-0.86) 0.77 (0.66-0.90) O 90 (0.84-0 97) 0.87 (O 79-0.96) 0.84 (O 74-0.95) 0.87 (O. 78-0.97) 0.87 (0.82-0.94) 0.84 (O 77-0 91) O 80 (0.71-0.89) O 84 (0.75-0.93) O 04 (0.77-0.91) 0.79 (0.72-0 88) O 74 (0.65-0.85) 0.79 (0.69-0 90) O 82 (O 73-0.92) O 77 (O 68-0 88) O 72 (O 60-0 86) O 77 (O 66-0.90)
(95W CI)
0.81 (0.71-0.93) 0.76 (0.63-0.92) 0.70 (0.55-0.90) 0.76 (0.61-0.94) 0.77 (0.68-0.87) 0.71 (0.60-0.84) 0.64 (0.51-0 81) 0.70 (0.57-0.87) 0.71 (O 60-0.83) 0.64 (0.52-0.78) 0.56 (0.42-0.74) 0.63 (0.48-0.82) 0.68 (0.55-0.83) 0.60 (0.46-0.79) 0.52 (0.37-0.74) 0.60 (0.44-0.81) 0.81 (0.71-0.93) 0.76 (0.64-0.91) 0.71 (0.56-0.89) 0.76 (0.62-0.93) 0.77 (0.67-0.88) 0.71 (0.60-0.84) 0.64 (0.52-0.80) 0.71 (O 58-0 86) 0.71 (0.60-0.83) O 64 (O 53-0.77) 0.56 (0.44-0.72) O 63 (0.49-0.81) 0.68 (O 55-0.84) 0.61 (0.47-0.78) O 53 (0.37-0.74) O 60 (0.45-0.80)
- . - -
Predicted Survival Probability at 1 year
(95% Cl)
0.67 (0.52-0.86) 0.59 (0.42-0.84) 0.51 (0.32-0.81 ) 0.59 (0.39-0.88) 0.60 (0.47-0.77) 0.52 (0.38-0.72) 0.43 (0.28-0.66) 0.51 (0.34-0.76) 0.51 (0.38-0.70) 0.42 (0.28-0.62) 0.33 (O. 19-0.56) 0.41 (0.25-0.69) 0.48 (0.32-0.71) 0.38 (0.23-0.63) 0.29 (O. 15-0.57) 0.37 (0.21 -0.66) 0.67 (0.52-0.87) 0.59 (0.42-0.84) 0.51 (0.33-0.80) 0.59 (0.40-0.87) 0.60 (0.47-0.78) 0.52 (0.38-0.70) 0.43 (0.29-0.65) 0.51 (0.35-0.75) 0.52 (0.38-0.70) 0.42 (0.30-0.60) 0.33 (0.20-0.54) 0.4 1 (0.26-0.66) 0.48 (0.32-0.72) 0.38 (0.24-0.62) 0.29 (0.15-0.55) 0.37 (0.22-0.65)
Median Survival in
weeks (95% Cl)
70 (20- ) 53 (1 5- ) 70 (1 5- ) 75 (35- )
55 (26-88) 4 0 ( 1 9-66) 53 (20-93) 54 (27-84) 39 (20-62) 30 (1549) 38 (16-63) 49 (20-80) 35 (16-60) 27 (13-41) 35 (1440)
71 (21- ) 54 (16- ) 70 (16- ) 75 (35- )
58 (28-88) 40 (20-63) 54 (21 -93) 55 (27-84) 39 (23-6 1 ) 30 (1 747) 38 (18-62) 49 (1 9-83) 35 (1 7-59) 27 (13-41) 35 (15-61)

Appendix 4 Prognostic lndexl Nomogram: Predicted Survival Probability
Scenario
289 290 29 1 292 293 294 295 296 297 298 299 300 301 302 303 304 305 306 307 308 309 310 31 1 312 313 314 315 316 317 318 31 9 320
Primary Cancer Site
Lung Lung Lung Lung Lung Lung Lung Lung Lung Lung Lung Lung Lung Lung Lung Lung Lung Lung Lung Lung Lung Lung Lung Lung Lung Lung Lung Lung Lung Lung Lung Lung
Site of Metastases
Bone Only Bone Only Bone Only Bone Only Bone Only Bone Only Bone Only Bone Only Bone Only Bone Only Bone Only Bone Only Bone Only Bone Only Bone Only Bone Only Bone Only Bone Only Bone Only Bone Only Bone Only Bone Only Bone Only Bone Only Bone Only Bone Only Bone Only Bone Only Bone Only Bone Only Bone Only Bone Only
Appetite Score
4-7 4-7 4-7 4-7 4-7 4-7 4-7 4-7 4-7 4-7 4-7 4-7 4-7 4-7 4-7 4-7 8-10 8- 10 8-10 8-10 8-10 8-10 8-10 8-10 8-10 8-10 8-10 8-10 8-10 8-10 8-10 8-10
Fatigue Score
O O O O
1-3 1-3 1-3 1-3 4-7 4-7 4-7 4-7 8-10 8-10 8-10 8-10
O O O O
1-3 1-3 1-3 1-3 4-7 4-7 4-7 4-7 8-10 8- 10 8- 1 O
8-10
Shortness of Breath Score
O 1-3 4-7 8-10
O 1-3 4-7 8-10
O
1-3 4-7 8-10
O 1-3 4-7 8- 1 O
O
1-3 4-7 8-10
O
1-3 4 -7 8- 10
O 1-3 4-7 8-10
O
1-3 4-7 8- 10
Predicted Survival Predicted Survival Probability at 3 months Probability al 6 months
O 90 (0.83-0.97) 0.87 (O 79-0.96) 0.64 (O. 73-0.95) O 87 (0.77-0.97) 0.87 (0.81-0.94) 0.84 (0.77-0.91) 0.80 (0.71-0.89) 0.84 (0.75-0.93) 0.84 (0.77-0.91) 0.79 (0.72-0.87) 0.74 (0.65-0.85) 0.79 (0.69-0.90) 0.82 (0.73-0.91) 0.77 (O 68-0.88) 0.72 (0.60-0.85) 0.77 (0.66-0.89) O 83 (0.73-0.94) 0.78 (0.66-0.93) O 73 (O 58-0.91) O 78 (O 64-0.94) 0.79 (O 69-0.90) 0.73 (O 62-0 87) O 67 (0.55-0.83) 0.73 (O 60-0.88) 0.73 (O 62-0.86) 0.67 (0.55-0 80) 0.59 (0.47-0.76) O 66 (0.52-0 83) 0.71 (0.59-0.85) 0.64 (0.51-0.79) O 56 (O 42-0 74) 0.63 (0.49-0.80)
(95% CI)
Predicted Survival Probability at 1 year
(95% CI)
0.67 (0.51-0.88) 0.59 (0.41-0.85) 0.51 (0.32-0.82) 0.58 (0.39-0.88) 0.60 (0.47-0.77) 0.52 (0.38-0.7 0) 0.43 (0.28-0.65) 0.51 (0.35-0.75) 0.51 (0.38-0.70) 0.42 (0.30-0.59) 0.33 (0.20-0.53) 0.41 (0.26-0.66) 0.48 (0.32-0.71) 0.38 (0.24-0.60) 0.29 (0.15-0.54) 0.37 (0.22-0.64) 0.49 (0.30-0.80) 0.40 (0.21-0.76) 0.31 (0.13-0.70) 0.39 (0.19-0.80) 0.41 (0.26-0.66) 0.32 (0.17-0.58) 0.23 (0.1 1-0.49) 0.31 (0.1 5-0.62) 0.31 (O. 17-0.56) 0.22 (O. 1 1-0.44) 0.14 (0.06-0.35) 0.21 (0.09-0.50) 0.27 (O. 14-0.54) O. 18 (0.08-0.41) O. 1 1 (0.04-0.32) O. 18 (0.07-0.44)
Median Survival in
weeks (95% CI)
70 (20- ) 53 (15- ) 70 (15- ) 72 (35- )
55 (27-84) 40 (20-63) 53 (20-93) 5ri (27-84) 39 (23-60) 30 (16-45) 38 (18-62) 49 (20-80) 35 (18-59) 27 (14-41) 35 (1 5-59) 52 (14-93) 36 (1 1-70) 29 (9-52) 36 (9-70)
38 (1 7-63) 29 (14-48) 22 (1 1-35) 29 (12-49) 29 (14-45) 21 (13-33) 17 (10-26) 20 (10-35) 26 (13-39) 19 (1 1-30) 15 (9-22) 1 9 (1 0-30)
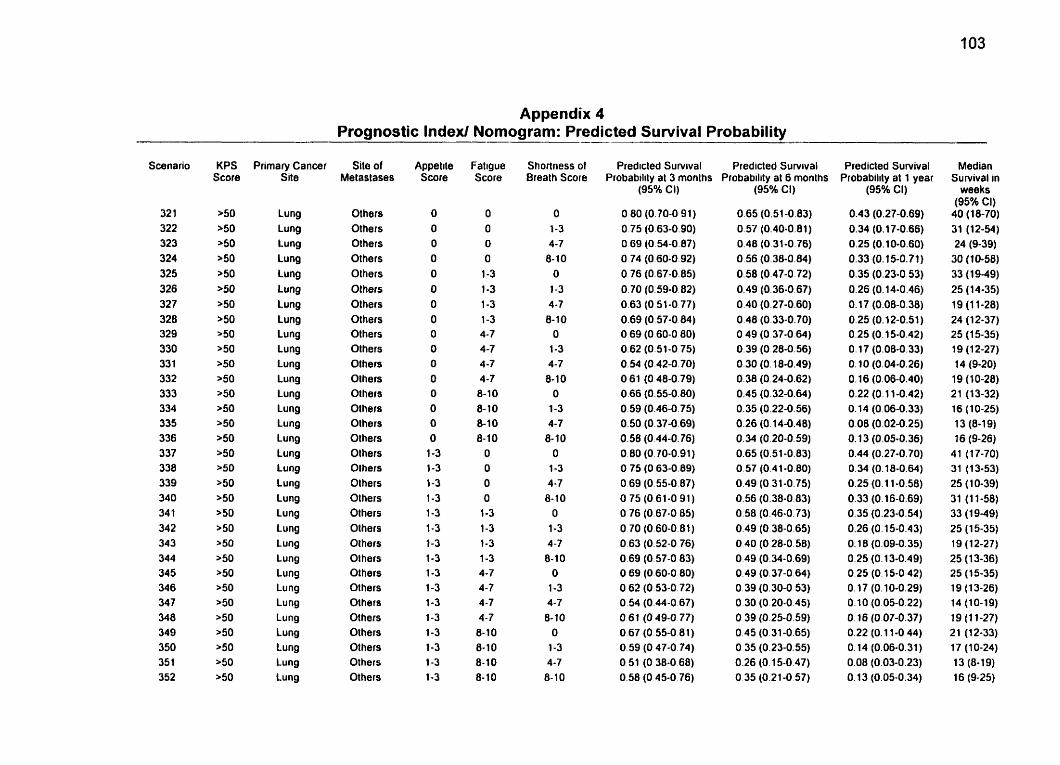
Appendix 4 Prognostic Index1 Nornogram: Predicted Survival Probability
Scenario
32 1 322 323 324 325 326 327 328 329 330 33 1 332 333 334 335 336 3 37 338 339 340 34 1 34 2 343 344 345 346 347 348 349 350 35 1 352
-
KPS score
>50 >50 >50 a50 >50 >50 >50 >50 >50 >50 r50 a50 >50 >50 >50 ,5O 150 >50 >50 >50 >50 >50 '50 >50 >50 >50 >50 >50 >50 a50 >50 >50
Primary Cancer Site
Lung Lung Lung Lung Lung Lung Lung Lung Lung Lung Lung Lung Lung Lung Lung Lung Lung Lung Lung Lung Lung Lung Lung Lung Lung Lung Lu ng Lung Lung Lung Lung Lung
Site of Melaslases
Others Others Others Others Olhers O1 hers Olhers Olhers Olhers Olhers Olhers Others Others Others Others Olhers Olhers Olhers Others Olhers Olhers Others Others OIhers Others Others Others Others Others Others Others Others
Appelite Score
O O O O O O O O O O O O O O O O
1-3 1-3 1-3 1-3 1-3 1-3 1-3 1-3 1-3 1-3 1-3 1-3 1-3 1-3 1-3 1-3
Fatigue Score
O O O
O 1-3 1-3 1-3 1-3 4-7 4-7 4-7 4-7 8-10 8- 1 O 8-10 8-10
O O O O
1-3 1-3 1-3 1-3 4-7 4-7 4-7 4-7 8- 1 O 8- 10 8- 1 O 8- 1 O
Shortness of Breath Score
O 1-3 4-7 8- 1 O
O 1-3 4-7 8-10
O 1-3 4-7 8- 10
O 1-3 4-7
8-10 O
1-3 4-7 8- 10
O 1-3 4-7 8-10
O 1-3 4-7 8-10
O 1-3 4-7 8- 10
Predicted Survival Predicted Sutvival Probabtlity al 3 months Probability at 6 months
(95% Ci)
O 80 (0.70-0 91) 0.75 (0.63-0.90) O 69 (0.54-0.87) O 74 (O 60-0 92) 0.76 (0.67-0.85) O. 70 (O. 59-0.02) 0.63 (O 51-0 77) 0.69 (0.57-0.84) O 69 (0.60-0 80) 0.62 (0.51-0 75) 0.54 (O 42-0.70) O 61 (O 48-0.79) 0.66 (0.55-0.80) 0.59 (0.46-0.75) 0.50 (0.37-0.69) 0.58 (0.44-0.76) 0.00 (0.70-0.91) O 75 (0.63-0.89) O 69 (0.55-0 87) O 75 (O 61-0 91) O 76 (0.67-0 85) O 70 (0.60-0.81) 0.63 (0.52-0 76) O 69 (0.57-0 83) O 69 (0.60-0 80) O 62 (0.53-0.72) 0.54 (0.44-0.67) O 61 (O 49-0 77) 0.67 (0.55-0 81) 0.59 (O 47-0.74) O 51 (O 38-0 68) 0.58 (O 45-0 76)
(95Oh CI)
0.65 (0.51-0.83) 0.57 (0.40-0.81) 0.46 (0.31-0.76) 0.56 (0.38-0.84) 0.58 (0.47-0.72) 0.49 (0.36-0.67) 0.40 (0.27-0.60) 0.48 (0.33-0.70) O 49 (O 37-0.64) 0.39 (O 28-0.56) 0.30 (O. 18-0.49) 0.38 (0.24-0.62) 0.45 (0.32-0.64) 0.35 (0.22-0.56) 0.26 (0.14-0.48) 0.34 (0.20-0.59) 0.65 (0.51-0.63) 0.57 (0.41-0.80) 0.49 (O 31-0.75) 0.56 (0.38-0.83) 0.58 (0.46-0.73) 0.49 (0.38-0.65) O 40 (O 28-0.58) 0.49 (0.34-0.69) 0.49 (0.37-0.64) 0.39 (0.30-0 53) 0.30 (0.20-0.45) O 39 (0.25-0.59) 0.45 (0.31-0.65) O 35 (0.23-0.55) 0.26 (O. 15-0.47) O 35 (0.21-0.57)
Predicted Survival Probability ai 1 year
(95% CI)
0.43 (0.27-0.69) 0.34 (O. 17-0.66) 0.25 (0.10-0.60) 0.33 (0.15-0.71) 0.35 (0.23-0.53) 0.26 (0.14-0.46) O. 17 (0.08-0.38) 0.25 (0.12-0.51) 0.25 (O. 15-0.42) O. 17 (0.08-0.33) O. 10 (0.04-0.26) O. 16 (0.06-0.40) 0.22 (0.1 1-0.42) 0.14 (0.06-0.33) 0.08 (0.02-0.25) O. 13 (0.05-0.36) 0.44 (0.27-0.70) 0.34 (O. 18-0.64) 0.25 (0.1 1-0.58) 0.33 (0.16-0.69) 0.35 (0.23-0.54) 0.26 (O. 15-0.43) O. 18 (0.09-0.35) 0.25 (O. 13-0.49) 0.25 (0.1 5-0 42) O. 17 (0.10-0.29) 0.10 (0.05-0.22) O. 16 (0.07-0.37) 0.22 (0.1 1-0 44) O. 14 (0.06-0.31) 0.08 (0.03-0.23) O. 13 (0.05-0.34)
Median Survival in
weeks (95% CI)
40 (18-70) 31 (12-54) 24 (9-39)
30 (10-58) 33 (1949) 25 (14-35) 19 (1 1-26) 24 (12-37) 25 (1 5-35) 19 (1 2-27) 14 (9-20)
19 (1 0-28) 2 1 (1 3-32) 16 (10-25) 1 3 (8-1 9) 16 (9-26)
41 (17-70) 31 (13-53) 25 (10-39) 31 (1 1-56) 33 (19-49) 25 (1 5-35) 19 (12-27) 25 (13-36) 25 (1 5-35) 19 (1 3-26) 14 (10-19) 19 (1 1-27} 21 (12-33) 17 (1 0-24) 13 (8-19) 16 (9-25)
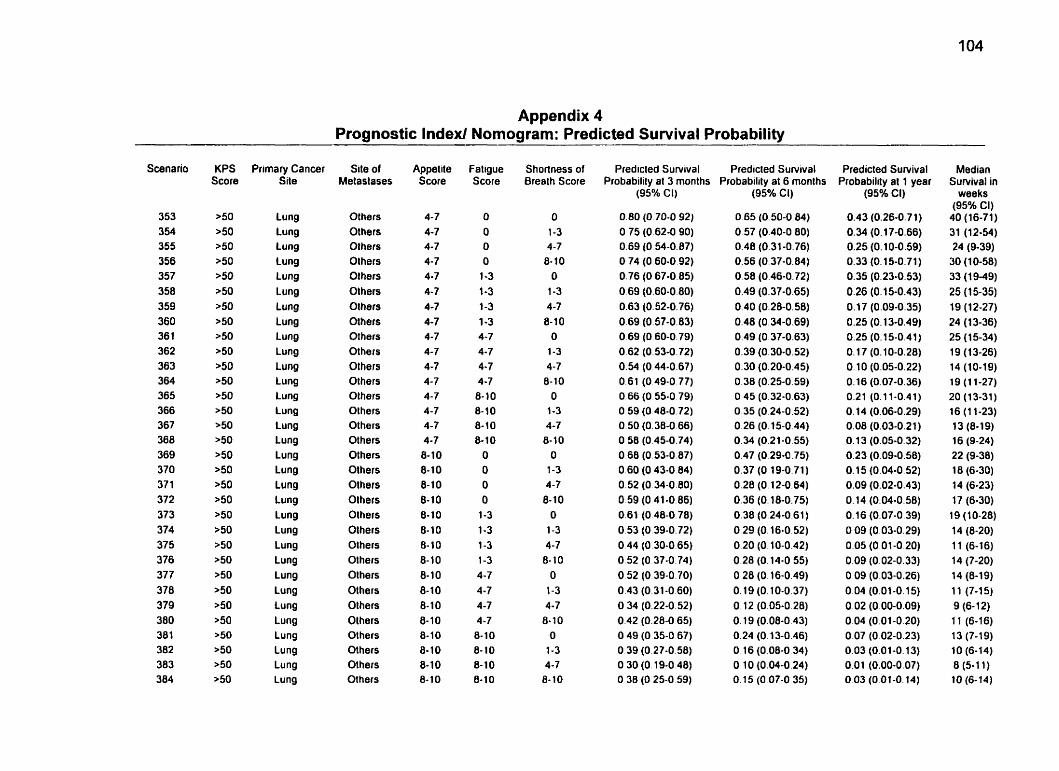
Appendix 4 Prognostic Index/ Nomogram: Predicted Survival Probability
Scenario
353 354 355 356 357 358 359 360 36 1 362 363 364 365 366 367 368 369 370 37 1 372 373 374 375 376 377 378 379 380 381 382 383 384
Primary Cancer Site
Lung Lung Lung Lung Lung Lung Lung Lung Lung Lung Lung Lung Lung Lung Lung Lung Lung Lung Lung Lung Lung Lung Lung Lung Lung Lung Lung Lung Lung Lung Lung Lung
Site of Metaslases
Others Olhers Others Olhers Olhers Olhers Olhers Olhers Others Others Others Others Others Others Others Others Others Olhers Olhers Olhers Others Others Olhers Others Others Others Others Olhers Others Others Others Others
Appelite Score
4-7 4-7 4-7 4-7 4-7 4-7 4-7 4-7 4-7 4-7 4-7 4-7 4-7 4-7 4-7 4-7 8-10 8-10 8-10 8-10 8- 10 8- 10 8- 10 8-10 8-10 8-10 8- 1 O 8- 10 8-10 8-10 8-10 8- 10
Fatigue Score
O O O O 1-3 1-3 1-3 1-3 4-7 4-7 4.7 4-7 8-10 8-10 8-10 8-10 O O O O 1-3 1-3 1-3 1-3 4-7 4-7 4-7 4-7 8-10 8- IO 8-10 8- 10
Shortness of Breath Score
O 1-3 4-7 8-10 O 1-3 4-7 8- 1 O O 1-3 4-7 8- 10 O 1-3 4-7 8-10 O 1-3 4-7 8- 1 O O 1-3 4-7 8-10 O 1-3 4-7 8-10 O 1-3 4-7 8- 1 O
Predicted Survival Predicled Survival Probability al 3 months Probability al 6 months
(95% CI)
O 80 (O 70-0 92) O 75 (O 62-0 90) O 69 (O 54-0 87) O 74 (O 60-0 92) O 76 (O 67-0 85) O 69 (O 60-0 80) O 63 (O 52-0.76) O 69 (O 57-0 83) O 69 (O 60-0 79) O 62 (O 53-0 72) O 54 (O 44-0 67) O 61 (O 49-0 77) O 66 (O 55-0 79) O 59 (O 48-0 72) O 50 (O 38-0 66) O 58 (O 45-0 74) O 68 (O 53-0 87) O 60 (O 43-0 84) O 52 (O 34-0 80) O 59 (O 41-0 86) O 61 (O 48-0 78) O 53 (O 39-0 72) O 44 (O 30-0 65) O 52 (O 37.0 74) O 52 (O 39-0 70) O 43 (O 31-0 60) O 34 (O 22-0 52) O 42 (O 28-0 65) O 49 (O 35-0 67) O 39 (O 27-0 58) O 30 (O 19-0 48) O 38 (O 25-0 59)
(95% Ci)
O 65 (0.50-0.84) 0.57 (0.40-0.80) 0.48 (0.31-0.76) 0.56 (0.37-0.84) 0.58 (0.46-0.72) 0.49 (0.37-0.65) 0.40 (0.28-0.50) 0.48 (0.34-0.69) 0.49 (0.37-0.63) 0.39 (0.30-0.52) 0.30 (0.20-0.45) 0.38 (0.25-0.59) 0.45 (0.32-0.63) 0.35 (0.24-0.52) 0.26 (O. 15-0.44) 0.34 (0.21-0.55) 0.47 (0.29-0.75) 0.37 (0.19-0.71) 0.28 (O. 12-0.64) 0.36 (0.18-0.75) 0.38 (0.24-0.61) 0.29 (O. 16-0.52) 0.20 (0.10-0.42) 0.28 (0.14-0 55) O 28 (O. 16-0.49) O. 19 (O. 10-0.37) O. 12 (0.05-0.28) O. 19 (0.08-0.43) 0.24 (O. 13-0.46) O 16 (0.08-0.34) 0 10 (0.04-0.24) O. 15 (O 07-0 35)
Predicted Survival Probability al 1 year
(95% CI)
0.43 (0.26-0.7 1) 0.34 (O. 17-0.66) 0.25 (O. 10-0.59) 0.33 (0.15-0.71) 0.35 (0.23-0.53) 0.26 (0.15-0.43) 0.17 (0.09-0.35) 0.25 (0. 13-0.49) 0.25 (O. 15-0.41) O. 17 (0.10-0.28) O. 10 (0.05-0.22) 0.16 (0.07-0.36) 0.21 (0.1 1-0.41) 0.14 (0.06-0.29) 0.08 (0.03-0.21) 0.1 3 (0.05-0.32) 0.23 (0.09-0.58) 0.1 5 (0.04-0.52) 0.09 (0.02-0.43) O. 14 (0.04-0.58) 0.16 (0.07-0.39) O O9 (0.03-0.29) 0.05 (0.01-0 20) 0.09 (0.02-0.33) 0.09 (0.03-0.26) 0.04 (0.01-0.15) 0.02 (0.00-0.09) 0.04 (0.01-0.20) 0.07 (0.02-0.23) 0.03 (0.01-0.13) 0.01 (0.00-0.07) 0.03 (0.01-0.14)
Median Sunrival in
weeks (95% CI) 40 (16-71) 31 (12-54) 24 (9-39) 30 (1 0-58) 33 (1 9-49) 25 (1 5-35) 19 (12-27) 24 (1 3-36) 25 (15-34) 1 9 (1 3-26) 14 (10-19) 19 (1 1-27) 20 (13-31) 16 (1 1-23) 13 (8-19) 16 (9-24) 22 (9-30) 18 (6-30) 14 (6-23) 17 (6-30) 19 (1 0-28) 14 (8-20) 1 1 (6-16) 14 (7-20) 14 (8-19) 1 1 (7-1 5) 9 (6- 1 2) 1 1 (6-16) 13 (7-19) 10 (6-14) 8 (5-1 1) 10 (6-74)
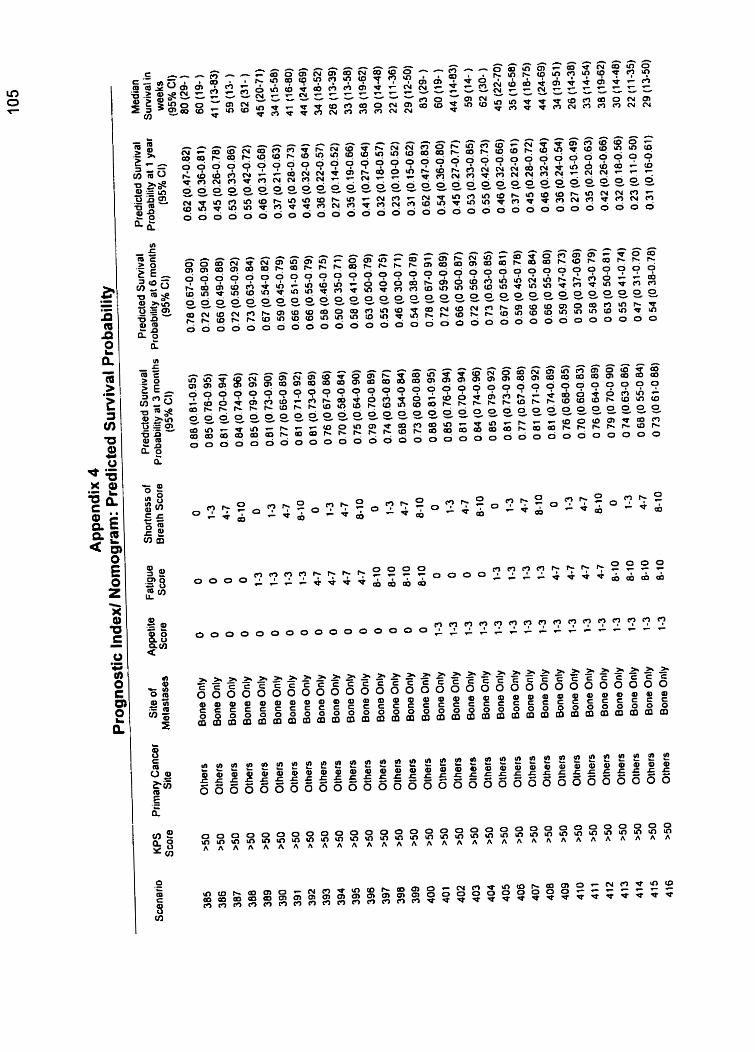
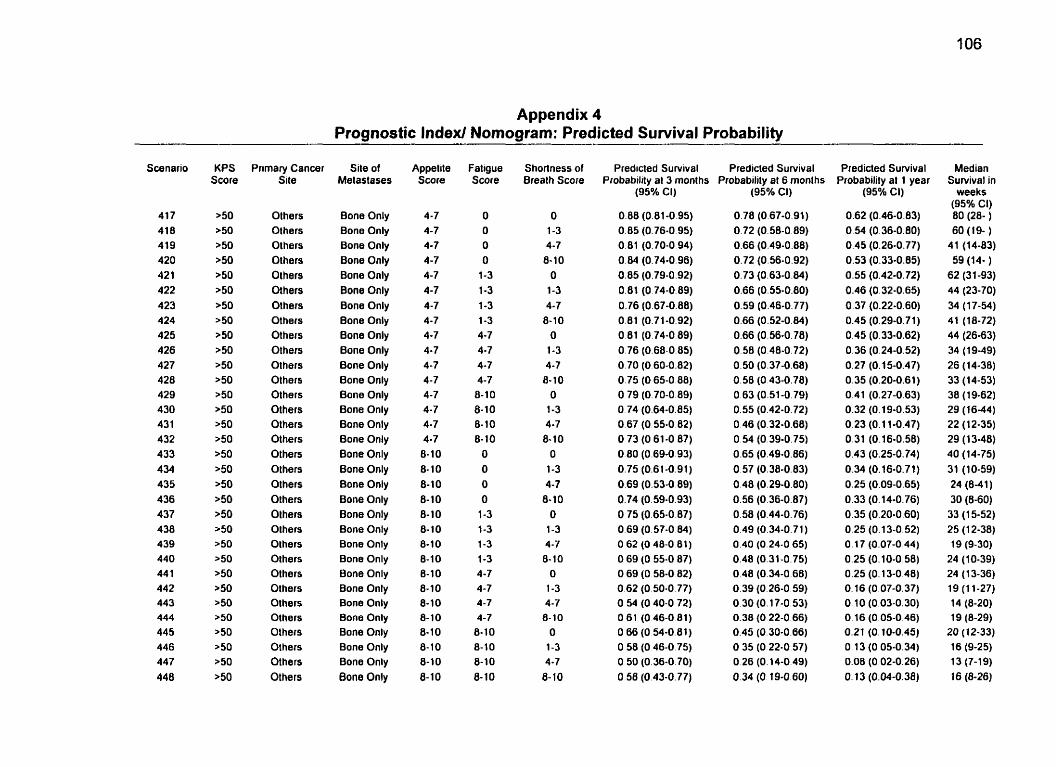
Appendix 4 Prognostic Indexl Nomogram: Predicted Survival Probability
Scenario
417 418 419 420 42 1 422 423 424 425 426 427 428 429 430 431 432 433 434 435 436 437 4 38 439 440 44 1 442 443 444 445 446 447 448
Primary Cancei Site
Others Olhers Others Others Others Others Others Others Others Others Others Others Others Others Others Others Others Others Othen Olhers Olhers Olhers Olhers Olhers Others Olhers Olhers Others Olhers Others Others Others
Site of Melastases
Bone Only Bone Only Bone Only Bone Only Bone Only Bone Only Bone Only Bone Only Bone Only Bone Only Bone Only Bone Only Bone Only Bone Only Bone Only Bone Only Bone Only Bone Only 8one Only Bone Only Bone Only Bone Only Bone Only Bone Only Bone Only Bone Only Bone Only Bone Only Bone Only Bone Only Bone Only Bone Only
Appelite Score
4-7 4-7 4-7 4-7 4-7 4-7 4-7 4-7 4-7 4-7 4-7 4-7 4-7 4-7 4-7 4-7 8-10 8-10 8-10 6-10 8-10 8-10 8-10 8-10 8-10 8-10 8-10 8-10 8-10 8- 1 O 8-10 8-10
Fatigue Score
O O O O
1-3 1-3 1-3 1-3 4-7 4-7 4-7 4-7 8-10 8-10 8- 1 O 8- 10
O O O O
1-3 1-3 1-3 1-3 4-7 4-7 4-7 4-7 8-10 8- 10 8-10 8-10
Shortness of Breath Score
O 1-3 4-7 8-10
O 1-3 4-7
8-10 O
1-3 4-7 8-10
O 1-3 4-7 8-10
O 1-3 4-7
6-10 O
1-3 4-7 8- 10
O 1-3 4-7 8-10
O 1-3 4-7
43-10
Predicted Suniival Predicted Survival Probability al 3 monlhs Probability al 6 months
(95% CI)
0.88 (0.81-0 95) 0.85 (0.76-0.95) 0.81 (0.70-0 94) 0.84 (0.74-0.96) 0.85 (0.79-0.92) 0.81 (O 74-0.89) 0+76 (0.67-0.88) 0.81 (0.71-0.92) 0.81 (0.74-0.89) 0.76 (0.68-0.85) 0.70 (O 60-0.82) 0.75 (0 65-0 88) O 79 (0.70-0 89) O 74 (0.64-0.85) 0.67 (O 55-0.82) O 73 (O 61-0 87) 0.80 (0.69-0.93) 0.75 (0.61-0.91) 0.69 (0.53-0.89) 0.74 (0.59-0.93) O 75 (0.65-0.87) 0.69 (0.57-0 84) O 62 (O 48-0 81) O 69 (O 55-0 87) O 69 (O 58-0 82) 0.62 (O 50-0.77) O 54 (O 40-0.72) O 6 1 (046-081) O 66 (O 54-0.81) O 58 (O 46-0 75) O 50 (0.36-0.70) O 50 (0.43-0.77)
(95% CI)
0.78 (0.67-0.91) 0.72 (0.58-0.89) 0.66 (0.49-0.88) 0.72 (0.56-0.92) 0.73 (0.63-0.84) 0.66 (0.55-0.80) 0.59 (0.46-0.77) 0.66 (0.52-0.84) 0.66 (0.56-0.78) 0.58 (0.48-0.72) 0.50 (0.37-0.68) 0.58 (O 43-0.78) 0.63 (0.51-0.79) 0.55 (0.42-0.72) 0.46 (0.32-0.68) 0.54 (0.39-0.75) 0.65 (0.49-0.86) 0.57 (0.38-0.83) 0.48 (0.29-0.80) 0.56 (0.36-0.87) 0.58 (0.44-0.76) 0.49 (0.34-0.71) 0.40 (0.24-0 65) 0.48 (0.31-0.75) 0.48 (0.34-0.68) 0.39 (0.26-0.59) 0.30 (0.17-0.53) 0.38 (O 22-0.66) 0.45 (0.30-0.66) O 35 (O 22-0.57) O 26 (0.14-0 49) 0.34 (O 19-0.60)
Predicted Survival Probability al 1 year
(95% CI)
0.62 (0.46-0.83) 0.54 (0.36-0.80) 0.45 (0.26-0.77) 0.53 (0.33-0.85) 0.55 (0.42-0.72) 0.46 (0.32-0.65) 0.37 (0.22-0.60) 0.45 (0.29-0.71) 0.45 (0.33-0.62) 0.36 (0,24-0.52) 0.27 (O. 15-0.47) 0.35 (0.20-0.61) 0.41 (0.27-0.63) 0.32 (0.19-0.53) 0.23 (0.1 1-0.47) 0.31 (0.16-0.58) 0.43 (0.25-0.74) 0.34 (0.16-0.71) 0.25 (0.09-0.65) 0.33 (O. 14-0.76) 0.35 (0.20-0.60) 0.25 (0.13-0.52) 0.17 (0.07-0.44) 0.25 (0.10-0.58) 0.25 (O. 13-0.48) O. 16 (0.07-0.37) 0.10 (0.03-0.30) O. 16 (0.05-0.46) 0.21 (O. 10-0.45) 0.1 3 (0.05-0.34) 0.08 (0.02-0.26) O. 13 (0.04-0.38)
Median Survival in
weeks (95% Cl) 80 (28- ) 60 (19- )
41 (14-83) 59 (14- )
62 (3 1-93) 44 (23-70) 34 (17-54) 41 (18-72) 44 (26-63) 34 ( 1 9-49) 26 (14-38) 33 (14-53) 38 (1 9-62) 29 (16-44) 22 (12-35) 29 (13-48) 40 (14-75) 31 (10-59) 24 (8-41) 30 (8-60) 33 (1 5-52) 25 (1 2-38) 19 (9-30)
24 (10-39) 24 (1 3-36) 19 (1 1-27} 14 (8-20) 19 (8-29)
20 (12-33) 16 (9-25) 13 (7-19) 16 (8-26)
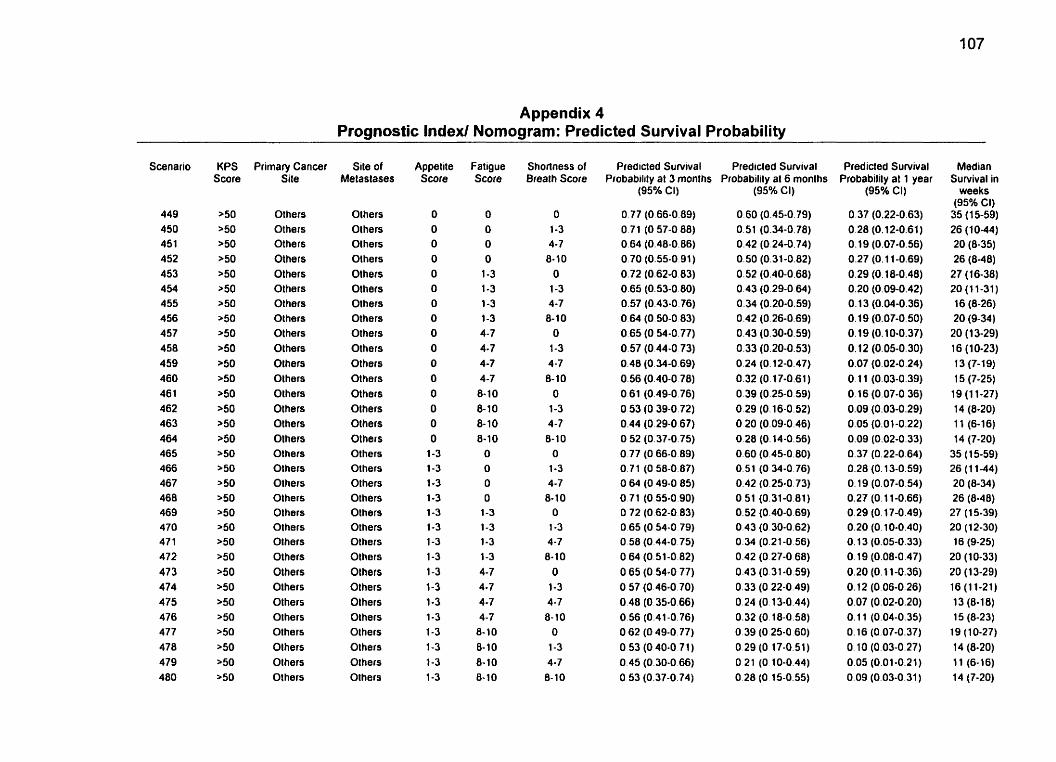
Appendix 4 Prognostic Index/ Nomogram: Predicted Sunrival Probability
Scenario
449 450 451 452 453 454 455 456 457 458 459 460 46 1 462 463 464 465 466 467 468 469 470 47 1 472 473 474 475 476 477 478 479 480
Primary Cancer Site
Others Others Others Others Others Others Others Others Others Others Olhers Others Others Olhers Olhers Olhers Others Others Olhers Others Others Olhers Olhers Others Others Others Olhers Others Others Others Olhers Olhers
Site of Metaslases
Others Others Olhers Others Olhers Others Others Others Others Others Others Others Others Others Others Others Others Others Others Others Others Others Olhers Others Others Others Olhers Olhers Olhers Others Olhers Olhers
Appetite Score
O O O O O O O O
O O O O O O O O
1-3 1-3 1-3 1-3 1-3 1-3 1-3 1-3 1-3 1-3 1-3 1-3 1-3 1-3 1-3 1-3
Fatigue Score
O O O O
1-3 1-3 1-3 1-3 4-7 4-7 4-7 4-7 8.10 8- 10 8-10 8-10
O O
O O
1-3 1-3 1-3
1-3 4-7 4-7 4-7 4-7
8- 1 O
8- 10 8- 10 8- 1 O
Shorlness of Breath Score
O 1-3 4-7 8- 1 O
O 1-3 4-7 8- 1 O
O 1-3 4 -7 8- 1 O
O 1-3 4-7 8-10
O 1-3 4-7 8-10
O 1-3 4-7 8-10
O 1-3 4-7 8-10
O 1-3 4-7 8- 10
Predicted Suniival Predicled Survival Probability at 3 monlhs Probability al 6 monlhs
(95% Cl)
O 77 (O 66-0.89) O 71 (O 57-0 88) 0.64 (0.48-0.86) 0.70 (0.55-0.91) 0.72 (0.62-0.83) 0.65 (0.53-0.80) 0.57 (0.43-0.76) O 64 (0.50-0 83) O 65 (O 54-0.77) 0.57 (0.44-0 73) 0.48 (0.34-0.69) 0.56 (0.40-0 78) O 61 (0.49-0.76) O 53 (O 39-0.72) 0.44 (0.29-0 67) O 52 (0.37-0.75) O 77 (O 66-0.89) O 71 (O 58-0.87) O 64 (O 49-0 85) O 71 (0.55-0.90) O 72 (O 62-0 83) 0.65 (O 54-0 79) O 58 (0.44-0.75) O 64 (O 51-0.82) 0.65 (0.54-0 77) O 57 (0.46-0.70) O 48 (O 35-0.66) 0.56 (0.41-0.76) O 62 (O 49-0.77) O 53 (O 40-0 7 1 ) 0.45 (0.30-0 66) O 53 (0.37-0.74)
(95% CI)
O 60 (0.45-0.79) 0.51 (0.34-0.78) 0.42 (0.24-0.74) 0.50 (0.31-0.82) 0.52 (0.40-0.68) 0.43 (0.29-0.64) 0.34 (0.20-0.59) 0.42 (O 26-0.69) 0.43 (0.30-0.59) 0.33 (0.20-0.53) 0.24 (0.12-0.17) 0.32 (0.17-0.61) 0.39 (0.25-0.59) 0.29 (0.16-0.52) O 20 (0.09-0.46) 0.28 (O. 14-0.56) 0.60 (0.45-0.80) 0.51 (O 34-0 76) 0.42 (0.25-0.73) O 51 (0.31-0.81) 0.52 (0.40-0.69) 0.43 (O 30-0.62) 0.34 (0.21-0.56) 0.42 (O 27-0 68) 0.43 (0.31 -0.59) 0.33 (0.22-0.49) 0.24 (O. 13-0.44) 0.32 (O. 18-0.58) O 39 (O 25-0.60) 0.29 (O 17-0.51) O 21 (O 10-0.44) 0.28 (O 15-0.55)
Predicted Survival Probabilily al 1 year
(95% CI)
0.37 (0.22-0.63) 0.28 (0.12-0.61) 0.19 (0.07-0.56) 0.27 (O. 1 1-0.69) 0.29 (O. 18-0.48) 0.20 (0.09-0.42) O. 13 (0.04-0.36) 0.19 (0.07-0.50) 0.19 (O. 10-0.37) 0.12 (0.05-0.30) 0.07 (0.02-0.24) 0.1 1 (0.03-0.39) 0.16 (0.07-0.36) 0.09 (0.03-0.29) 0.05 (0.01-0.22) 0.09 (0.02-0.33) 0.37 (0.22-0.64) 0.28 (O. 13-0.59) O. 19 (0.07-0.54) 0.27 (O. 1 1-0.66) 0.29 (O. 17-0.49) 0.20 (O. 10-0.40) O. 13 (0,OS-0.33) O. 19 (0.08-0.47) 0.20 (0.1 1-0.36) 0.12 (0.06-0.26) 0.07 (0.02-0.20) O. 11 (0.04-0.35) O. 16 (0.07-0.37) O 10 (0.03-0.27) 0.05 (0.01-0.21) 0.09 (0.03-0.31)
Median Survival in
weeks (95Oh CI) 35 (15-59) 26 (1 0-44) 20 (8-35) 26 (0-40)
27 (16-38) 20 (11-31) 16 (8-26) 20 (9-34) 20 (1 3-29) 16 (10-23) 13 (7-1 9) 15 (7-25)
19 (1 1-27) 14 (8-20) 11 (6-16) 14 (7-20)
35 (1 5-59) 26 (1 1-44) 20 (8-34) 26 (8-48) 27 (1 5-39) 20 (12-30) 16 (9-25)
20 (10-33) 20 (1 3-29) 16 (1 1-21) 1 3 (8-1 8) 15 (8-23)
19 (1 0-27) 14 (8-20) 11 (6-16) 14 (7-20)
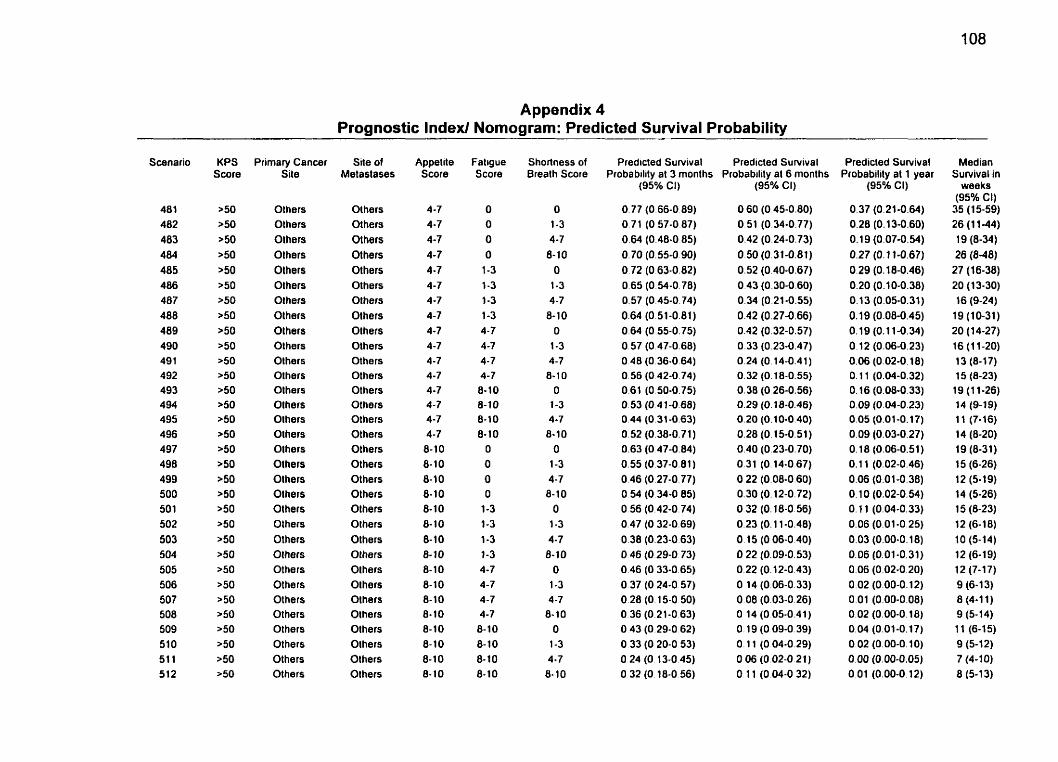
Appendix 4 Prognostic lndexl Nomogram: Predicted Survival Probability
Scenario
481 482 483 484 485 486 487 488 489 490 49 1 492 493 494 495 496 497 498 499 500 50 1 502 503 504 505 506 507 508 509 510 51 1 512
Primary Cancer Site
Others Others Olhers Others Olhers Olhers Others Others Others Olhers Others Olhers Others Olhers Olhers Others Olhers Olhers Olhers Olhers Others Others Others Olhers Others Others Others Others Others Others Others Others
Site of Metaslases
Others Others Others Others Others Others Others Others Others Others Others Others Others Others Others Others Others Others Others Others Olhers Olhers Others Olhers Others Olhers Olhers Others Others Olhers Others Olhers
Appetite Score
4-7 4-7 4-7 4-7 4-7 4-7 4-7 4-7 4-7 4-7 4-7 4-7 4-7 4-7 4-7 4-7 8-10 8-10 8-10 8-10 8- 10 8- 10 8- 10 8-10 8-10 8- 1 O 8-10 6-10 8-10 6-10 6-10 8-10
Fatigue Score
O O
O O
1-3 1-3 1-3 1-3 4-7 4 -7 4-7 4-7 6-10 8-10 8-10 8-10
O O O O
1-3 1-3 1-3 1-3 4-7 4-7 4-7 4-7 8-10 8-10 8-10 8- 10
Shortness of Breath Score
O 1-3 4-7 8-10
O 1-3 4-7
8- 10 O
1-3 4-7 8-10
O 1-3 4-7 8-10
O 1-3 4-7 8-10
O 1-3 4-7 8- 1 O
O 1-3 4-7
8-10 O 1-3 4-7 8- 10
Predicted Survival Predicted S u ~ i v a l Probability at 3 months Probability al 6 months
(95% Ci) (95% CI)
0.60 (O 45-0.80) 0.51 (0.34-0.77) 0.42 (0.24-0.73) 0.50 (0.31-0.81) 0.52 (0.40-0.67) 0.43 (0.30-0.60) 0.34 (0.21-0.55) 0.42 (0.27-0.66) 0.42 (0.32-0.57) 0.33 (0.23-0.47) 0.24 (0.14-0.41 ) 0.32 (0.18-0.55) 0.38 (O 26-0.56) 0.29 (o. la-0.46) 0.20 (0.10-0.40) 0.28 (0.15-0.51) 0.40 (0.23-0,70) 0.31 (0.14-0.67) 0.22 (0.08-0.60) 0.30 (0.12-0.72) 0.32 (0.18-0.56) 0.23 (0.1 1-0.48) O. 15 (O 06-0.40) O 22 (0.09-0.53) 0.22 (0.12-0.43) O 14 (0.06-0.33) O 08 (0.03-0.26) O 14 (O 05-0.41) O 19 (O 09-0.39) O . 11 (O 04-0.29) 0.06 (O 02-0.21) O. 1 1 (O 04-0 32)
Predicted Survival Probability at 1 year
(95% CI)
0.37 (0.21-0.64) 0.28 (0.13-0.60) 0.19 (0.07-0.54) 0.27 (0.1 1-0.67) 0.29 (O. 18-0.46) 0.20 (0.10-0.38) 0.13 (0.05-0.31) 0.19 (0.08-0.45) 0.19 (0.1 1-0.34) 0.12 (0.06-0.23) 0.06 (0.02-0.18) O. 1 1 (0.04-0.32) O. 16 (0.08-0.33) 0.09 (0.04-0.23) 0.05 (0.01-0.17) 0.09 (0.03-0.27) O. 18 (0.06-0.51) O. 1 1 (0.02-0.46) 0.06 (0.01-0.38) 0.10 (0.02-0.9) O. i l (0.04-0.33) 0.06 (0.01-0.25) 0.03 (0.00-0.18) 0.06 (0.01 -0.31) 0.06 (0.02-0 20) 0.02 (0.00-0.12) 0.01 (0.00-0.08) 0.02 (0.00-0.18) 0.04 (0.01-0.17) 0.02 (0.00-0.10) 0.00 (0.00-0.05) 0.01 (0.00-0.12)
Median Survival in
weeks (95% Cl)
35 (15-59) 26 (1 1-44) 19 (8-34) 26 (8-48)
27 (16-38) 20 (1 3-30) 16 (9-24)
19 (10-31) 20 (14-27) 16 (1 1-20) 13 (8-17) 15 (8-23) 19 (1 1-26] 14 (9-19) 1 1 (7- 16) 14 (8-20) 19 (8-31) 15 (6-26) 12 (5-19) 14 (5-26) 15 (8-23) 12 (6-18) 10 (5-14) 12 (6-19) 12 (7-17) 9 (6- 13) 8 (4-1 1) 9 (5-14) 11 (6-15) 9 (5-12) 7 (4-10) 8 (5-13)
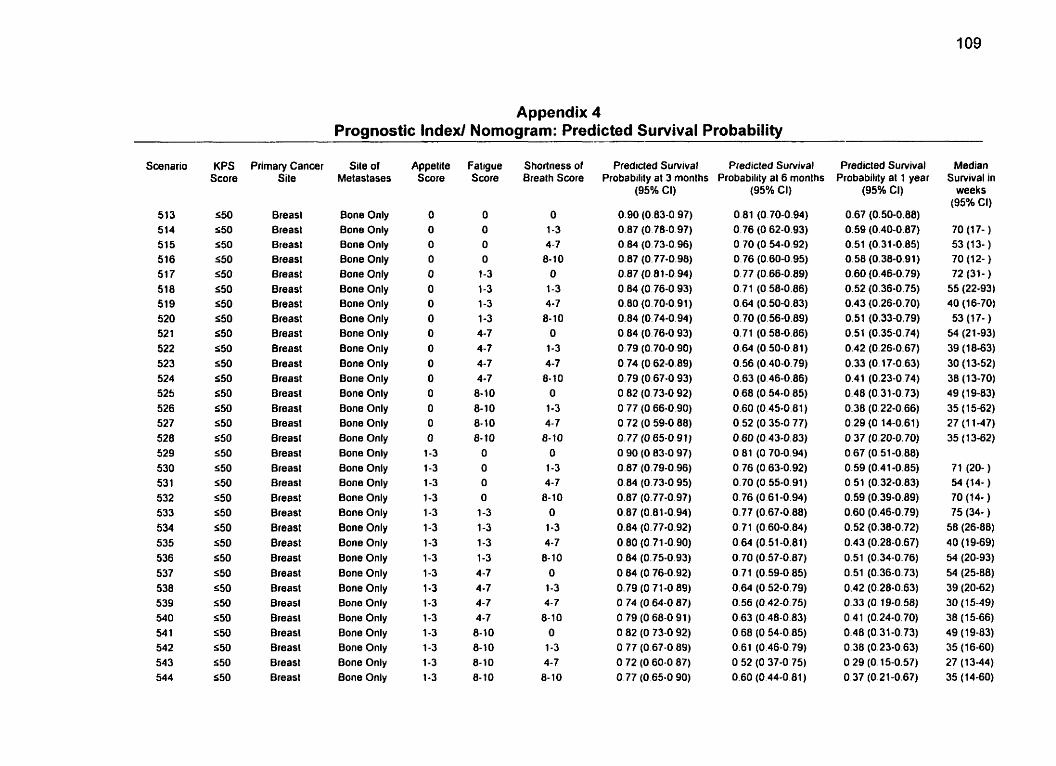
Appendix 4 Prognostic Index/ Nomogram: Predicted Survival Probability
Swnario
513 514 515 516 517 518 519 520 52 1 522 523 524 525 526 527 528 529 530 53 1 532 533 534 535 536 537 538 539 540 54 1 542 543 544
KPS Score
550 S50 S50 550 S50 550 S50 550 550 550 450 550 550 550 550 550 550 550 550 550 550 550 550 550 550 550 550 550 550 S50 550 550
Primary Cancer Site
Breasl Breast Breast Breast Breast Breast Breast Breast Breast Breast Breast Breast Breast Breast Breast Breast Breast Breast Breast Breast Breast Breast Breast Breast Breast Breast Breast Breast Breast Breast Breast Breast
Site of Metastases
Bone Only Bone Only Bone Only Bone Only Bone Only Bone Only Bone Only Bone Only Bone Only Bone Only Bone Only Bone Only Bone Only Bone Only Bone Only Bone Only Bone Only Bone Only Bone Only Bone Only Bone Only Bone Only Bone Only Bone Only Bone Only Bone Only Bone Only Bone Only Bone Only Bone Only Bone Only Bone Only
Appelite Score
O O O O O O O O O O O O O O O O 1-3 1-3 1-3 1-3 1-3 1-3 1-3 1-3 1-3 1-3 1-3 1-3 1-3 1-3 1-3 1-3
Fatigue Score
O O O O 1-3 1-3 1-3 1-3 4-7 4-7 4-7 4-7 8-10 8- 1 O 8-10 8-10 O O O O 1-3 1-3 1-3 1-3 4-7 4-7 4-7 4-7 8- 1 O 8-10 8-10 8-10
Shortness of Brealh Score
O 1-3 4-7 8-10 O 1-3 4-7 8-1 0 O 1-3 4-7 8- 10 O 1-3 4-7 8-10 O 1-3 4-7 8-10 O 1-3 4-7 8- 10 O 1-3 4-7
8-10 O 1-3 4-7 8-10
Predicted Survival Predicted Survival Probability al 3 months Probability al 6 months
(95% Ci) (95% Ci)
Predicted Survival Probability at 1 year
(95% CI)
0.67 (0.50-0.88) 0.59 (0.40-0.87) 0.51 (0.31-0.85) 0.58 (0.36-0.91) 0.60 (0.46-0.79) 0.52 (0.36-0.75) 0.43 (0.26-0.70) 0.51 (0.33-0.79) 0.51 (0.35-0.74) 0.42 (0.26-0.67) 0.33 (O. 17-0.63) 0.41 (0.23-0.74) 0.48 (0.31-0.73) 0.38 (0.22-0.66) 0.29 (O. 14-0.61) 0.37 (0.20-0.70) 0.67 (0.51-0.88) 0.59 (0.41-0.85) 0.51 (0.32-0.83) 0.59 (0.39-0.89) 0.60 (0.46-0.79) 0.52 (0.38-0.72) 0.43 (0.28-0.67) 0.51 (0.34-0.76) 0.51 (0.36-0.73) 0.42 (0.28-0.63) 0.33 (0 19-0.58) 0.41 (0.24-0.70) 0.48 (0.31-0.73) 0.38 (0.23-0.63) O 29 (O. 15-0.57) 0.37 (0,21-0.67)
Median Sunrival in
weeks (95% CI)
70 (1 7- ) 53 (1 3- ) 70 (12- ) 72 (31- ) 55 (22-93) 40 (16-70) 53 (1 7- ) 54 (21-93) 39 (18-63) 30 (1 3-52) 38 (13-70)
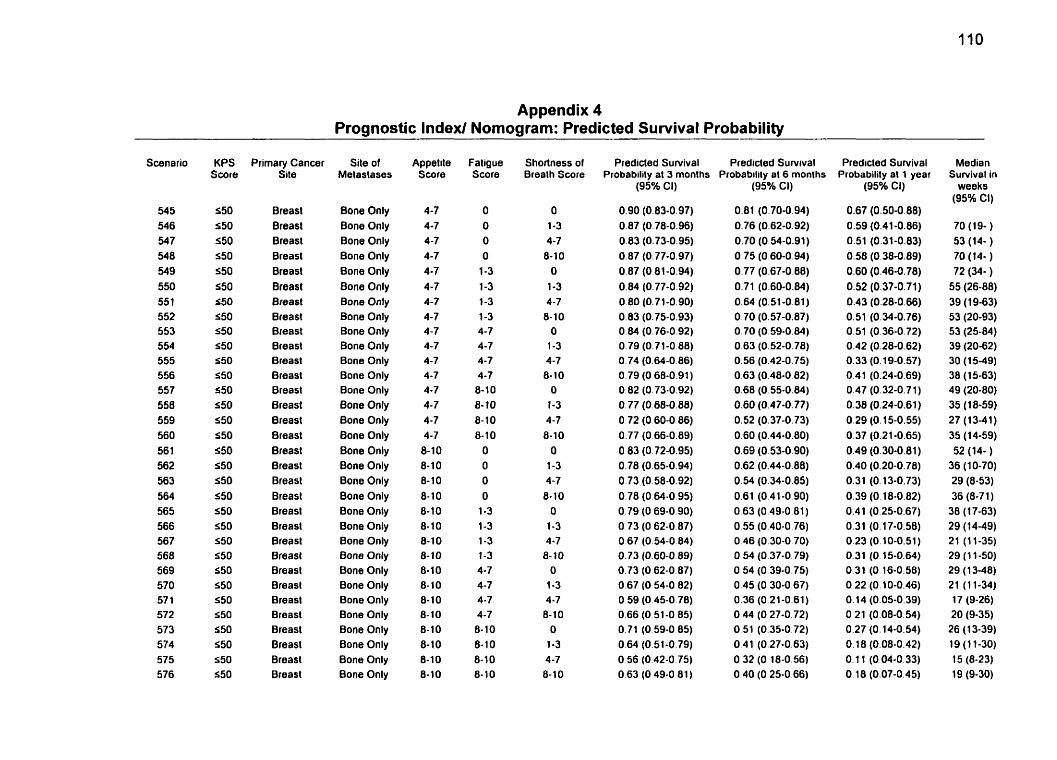
Appendix 4 Prognosüc Index/ Nomogram: Predicted Survival Probability
Scenario
545 546 547 54 8 549 550 55 1 552 553 554 555 556 557 558 559 560 56 1 562 563 564 565 566 567 568 569 570 57 1 572 573 574 575 576
KPS Score
S50 S50 S50 550 550 550 550 550 550 550 550 550 550 550 550 S50 S50 550 550 550 550 S50 550 550 S50 550 550 550 550 S50 550 550
Primary Cancer Site
Breast Breasl Breasl Breasl Breast Breast Breast Breast Breast Breast Breast Breast Breast Breast Breast Breast Breast Breast Breast Breasl Breast Breasl Breast Breast Breast Breast Breast Breasl Breast Breast Breast Breast
Site of Metastases
Bone Only Bone Only Bone Only Bone Only Bone Only Bone Only Bone Only Bone Only Bone Only Bone Only Bone Only Bone Only Bone Only Bone Only Bone Only Bone Only Bone Only Bone Only Bone Only Bone Only Bone Only Bone Only Bone Only Bone Only Bone Only Bone Only Bone Only Bone Only Bone Only Bone Only Bone Only Bone Only
Appettte Score
4-7 4-7 4-7 4-7 4-7 4-7 4-7 4-7 4-7 4-7 4-7 4-7 4-7 4-7 4-7 4-7 8-10 8-10 8- 10 8- 1 O 8-10 8-10 8-10 8-10 8-10 8- 10 8-10 8-10 8-10 8-10 8-1 O 8-10
Faligue Score
O O O
O 1-3 1-3 1-3 1-3 4-7 4-7 4-7 4-7 8-10 8-10 8-10 8-10
O O O O
1-3 1-3 1-3 1-3 4-7 4-7 4-7 4-7 8- 1 O 8-10 8-10 8-10
Shortness of Brealh Score
O 1-3 4-7 8-10
O
1-3 4-7 8-10
O 1-3 4-7 8- 10
O
1-3 4-7 8-10
O 1-3 4-7 8- 1 O
O 1-3 4-7
8-10 O
1-3 4-7 8- 10
O 1-3 4-7 8-10
Predicled Survival Predicled Survival Probability at 3 months Probabilily at 6 rnonths
(95% Ci) (95% Cl)
Predicted Survival Probability at 1 year
(95% CI)
0.67 (0.50-0.88) 0.59 (0.41-0.86) 0.51 (0.31-0.83) 0.58 (0.38-0.89) 0.60 (0.46-0.78) 0.52 (0.37-0.71) 0.43 (0.28-0.66) 0.51 (0.34-0,76) 0.51 (0.36-0.72) 0.42 (0.28-0.62) 0.33 (0.19-0.57) 0.41 (0.24-0.69) 0.47 (0.32-0.71) 0.38 (0.24-0.61) 0.29 (O. 15-0.55) 0.37 (0.21-0.65) 0.49 (0.30-0.81) 0.40 (0.20-0.78) 0.31 (O. 13-0.73) 0.39 (0.18-0.82) 0.41 (0.25-0.67) 0.31 (0.17-0.58) O 23 (0.10-0.51) O. 3 1 (O. 15-0.64) 0.31 (O 16-0.58) 0.22 (0.10-0.46) 0.14 (0.05-0.39) O 21 (0.08-0.54) 0.27 (0.14-0.54) O. 18 (0.08-0.42) O. 1 1 (0.04-0.33) O. 18 (0.07-0.45)
Median Survival in
weeks (95% Ci)
70 (19- ) 53 (14- ) 70 (14- ) 72 (34- )
55 (26-88) 39 (19-63) 53 (20-93) 53 (25-84) 39 (20-62) 30 (1 5-49) 38 (1 5-63) 49 (20-80) 35 (18-59) 27 (13-41) 35 (14-59) 52 (14- )
36 (10-70) 29 (8-53) 36 (8-71 ) 30 (1 7-63) 29 (14-49) 21 (11-35) 29 (1 1-50) 29 (1 348) 21 (11-34) 17 (9-26) 20 (9-35) 26 (1 3-39) 19 (1 1-30) 15 (8-23) 19 (9-30)
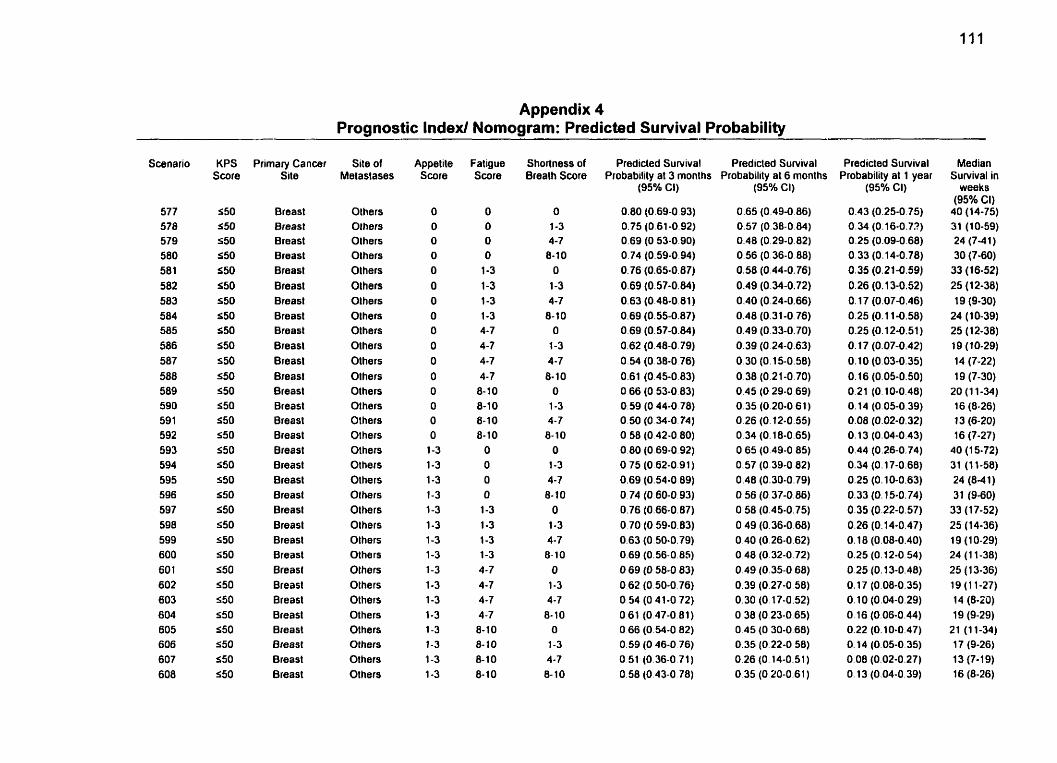
Appendix 4 Prognostic Index/ Nomogram: Predicted Survival Probability
Scenario
577 578 579 500 581 582 583 584 585 586 587 588 589 590 59 1 592 593 594 595 596 597 598 599 600 60 1 602 603 6û4 605 606 607 608
KPS Score
S50 S50 550 S50 550 550 550 550 S50 550 550 S50 550 550 S50 550 550 550 550 550 550 S50 S50 S50 550 S50 550 550 $50 550 fa50 550
Primary Cancer Site
Breast Breast Breast Breast Breast Breast Breast Breast Breast Breasl Breasl Breasl Breasl Breast Breast Breast Breast Breast Breasl Breast Breast Breast Breast Breasl Breast Breast Breast Breasl Breast Breast Breast Breast
Site of Metastases
Olhers OIhers Others Olhers Olhers Olhers Olhers Olhers Olhers Olhers Others Olhers Others Others Others Others Others Others Others Others Others Others Olhers Others Others Olhers Others Others Others Others OLhers Olhers
Appetile Score
O O O
O O O O O O O O O O O O O
1-3 1-3 1-3 1-3 1-3 1-3 1-3 1-3 1-3 1-3 1-3 1-3 1-3 1-3 1-3 1-3
Fatigue Score
O O O O
1-3 1-3 1-3 1-3 4-7 4-7 4 -7 4-7 8- 10 8-10 8-10 8-10
O O O O
1-3 1-3 1-3 1-3 4-7 4-7 4-7 4-7 8-10 8-10 8-10 8-10
Shortness of Breath Score
O 1-3 4-7 8-1 0
O 1-3 4-7 8-10
O 1-3 4-7 8-10
O 1-3 4-7 8-10
O 1-3 4-7 8-10
O 1-3 4-7 8- 10
O 1-3 4-7
8- 10 O
1-3 4-7 8- 10
Predicted Survival Predicted Sunrival Probability at 3 months Probability al 6 months
(95% CI)
0.80 (0.69-0.93) 0.75 (0.61-0.92) 0.69 (O 53-0.90) 0.74 (0.59-0.94) 0.76 (0.65-0.87) 0.69 (0.57-0.84) 0.63 (0.48-0.81) 0.69 (0.55-0.87) O 69 (0.57-0.84) 0.62 (0.48-0.79) 0.54 (O 38-0.76) 0.61 (0.45-0.83) O 66 (O 53-0.83) 0.59 (O 44-0.78) 0.50 (O 34-0.74) O 58 (0.42-0.80) 0.80 (0.69-0.92) 0.75 (0.62-0.91) 0.69 (O.%-O 89) O. 74 (O 60-0.93) 0.76 (0.66-0.87) 0.70 (O 59-0.83) 0.63 (0.50-0.79) 0.69 (0.56-0.8s) O 69 (O 58-0 83) 0.62 (0.50-0.76) O 54 (O 41-0 72) O 61 (0.47-0.81) O 66 (O 54-0 82) 0.59 (O 46-0 76) O 51 (0.36-0 71) 0.58 (0.43-0.78)
(9S0r6 CI)
0.65 (0.49-0 86) 0.57 (0.38-0.84) 0.48 (0.29-0.82) 0.56 (0.36-0.88) 0.58 (0.44-0.76) 0.49 (0.34-0.72) 0.40 (0.24-0.66) 0.48 (0.31-0.76) 0.49 (0.33-0.70) 0.39 (O 24-0.63) 0.30 (0.15-0.58) 0.38 (0.21-0.70) 0.45 (O 29-0.69) 0.35 (0.20-0 61) 0.26 (0.12-0.55) 0.34 (0.18-0.65) O 65 (0.49-0.85) 0.57 (0.39-0.82) 0.48 (0.30-0.79) 0.56 (0.37-0.86) 0.50 (0.45-0.75) 0.49 (0.36-0.68) 0.40 (0.26-0.62) O 48 (0.32-0.72) 0.49 (0.35-0.68) 0.39 (0.27-0 58) 0.30 (O 17-0.52) O 38 (O 23-0.65) O 45 (O 30-0 68) 0.35 (0.22-0 58) 0.26 (O. 14-0.51) 0.35 (O 20-0.61 )
Predicted Survival Probability al 1 year
(95% CI)
0.43 (0.25-0.75) 0.34 (0.16-0.73) 0.25 (0.09-0.68) 0.33 (0.14-0.78) 0.35 (0.21-0.59) 0.26 (0.13-0.52) O. 17 (0.07-0.46) 0.25 (0.1 1-0.58) 0.25 (O. 12-0.51) 0.17 (0.07-0.42) 0.10 (0.03-0.35) 0.16 (0.05-0.50) 0.2 1 (0.10-0.48) O. 14 (0.05-0.39) 0.08 (0.02-0.32) O. 13 (0.04-0.43) 0.44 (0.26-0.74) 0.34 (O. 17-0.68) 0.25 (0.10-0.63) O. 33 (O. 15-0.74) 0.35 (0.22-0.57) 0.26 (0.14-0.47) O. 18 (0.08-0.40) 0.25 (0.12-0.54) 0.25 (O. 13-0.48) O. 17 (0.08-0.35) 0.10 (0.04-0.29) 0.16 (0.06-0.44) 0.22 (0.10-0.47) O. 14 (0.05-0.35) 0.08 (0.02-0.27) O. 13 (0.04-0.39)
Median Survival in
weeks (95% CI)
40 (14-75) 31 (10-59) 24 (7-41) 30 (7-60)
33 (16-52) 25 (1 2-38) 19 (9-30)
24 (10-39) 25 (12-38) 19 (10-29) 14 (7-22) 19 (7-30)
20 (1 1-34) 16 (8-26) 13 (6-20) 16 (7-27)
40 (1 5-72) 31 (1 1-58) 24 (8-4 1 ) 31 (9-60)
33 (1 7-52) 25 (14-36) 19 (1 0-29) 24 (1 1-38) 25 (1 3-36) 19 (1 1-27) 14 (8-20) 19 (9-29)
21 (1 1-34) 17 (9-26) 13 (7-1 9) 16 (8-26)
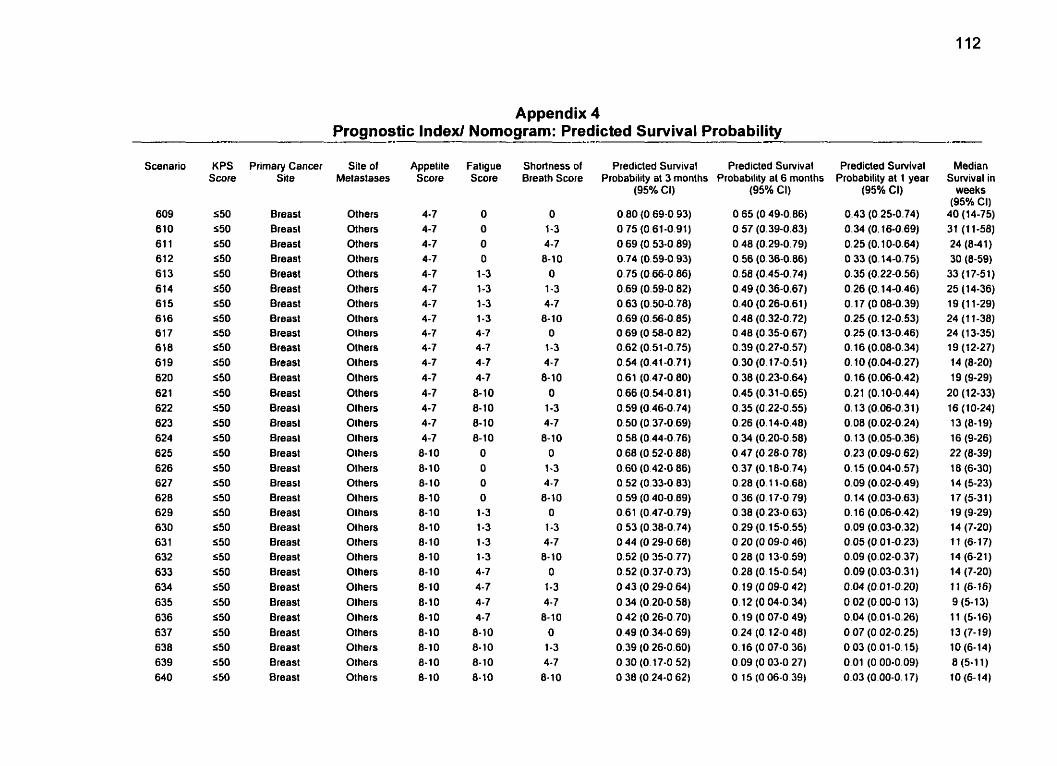
Appendix 4 Prognostic Index/ Nomogram: Predicted Survival Probability
Scenario
609 610 61 1 61 2 61 3 614 61 5 616 61 7 618 619 620 62 1 622 623 624 625 626 62 7 628 629 630 63 1 632 633 634 635 636 637 638 639 640
KPS Score
550 550 550 550 550 550 550 S50 a50 S50 550 550 S50 550 550 S50 550 550 550 550 550 550 550 550 550 550 550 S50 550 S50 S 50 5 50
Primary Cancer Site
Breast Breast Breast Breast Breast Breast Breast Breast Breast Breast Breast Breast Breast Breasl Breasl Breasl Breast Breast Breasl Breast Breast Breast Breast Breasl Breast Breast Breast Breast Breast Breast Breast Breasl
Site of Metasfases
Others Others Others Olhers Others Olhers Olhers Others Others Others Olhers Olhers Others Others Others Olhers Others Others Others Others Others Olhers Olhers Olhers Others Olhers Others Olhers Others Others Olhers Olhers
Appelite Score
4-7 4-7 4-7 4-7 4-7 4-7 4-7 4-7 4-7 4-7 4-7 4-7 4-7 4-7 4-7 4-7
8-10 8-10 8-10 8-10 8-10 8-10 8-10 8-10 8-10 8-10 8- 10 8-1 0 8-10 8-10 8-10 8-10
Fatigue Score
O O O O
1-3 1-3 1-3 1-3 4-7 4-7 4-7 4-7 8-10 8-10 8-1 0 8-10
O O O O
1-3 1-3 1-3 1-3 4-7 4-7 4-7 4-7
8-10 8- 10 8- 10 8-10
Shortness of Breath Score
O 1-3 4-7 8-10
O 1-3 4-7
8-10 O 1-3 4-7 8-10
O 1-3 4-7 8-10
O 1-3 4-7 8-10
O 1-3 4-7 8-10
O 1-3 4-7 8-10
O 1-3 4-7 8-10
Predicled Su~ival Predicted Survival Probabilily al 3 months Probability at 6 months
(95% Ci)
0.80 (0.69-0.93) O 75 (0.61-0.91) 0.69 (0.53-0 89) 0.74 (0.59-0 93) 0.75 (0.66-0 86) 0.69 (0.59-0 82) 0.63 (0.50-0.78) 0.69 (0.56-0.8s) O 69 (0.58-0 82) 0.62 (0.51-0.75) 0 .M (0.41-0.71) 0.61 (0.47-0 80) 0.66 (0.54-0.81) 0.59 (0.46-0.74) 0.50 (O. 37-0.69) O 58 (0.44-0.76) O 68 (0.52-0.88) 0.60 (0.42-0 86) 0.52 (0.33-0.83) O 59 (O 40-0 89) 0.61 (0.47-0.79) O 53 (0.38-0.74) O 44 (O 29-0 68) 0.52 (O 35-0.77) 0.52 (0.37-0.73) O 43 (O 29-0.64) O 34 (O 20-0.58) O 42 (0.26-0.70) 0.49 (O 34-0 69) 0.39 (O 26-0.60) O 30 (0.17-0 52) O 38 (0.24-0 62)
(95% Cl)
0.65 (O 49-0.86) O 57 (0.39-0.83) 0.48 (0.29-0.79) 0.56 (0.36-0.06) 0.58 (0.45-0.74) 0.49 (0.36-0.67) 0.40 (0.26-0.61) 0.48 (0.32-0.72) 0.48 (0.35-0.67) 0.39 (0.27-0.57) 0.30 (O. 17-0.51) 0.38 (0.23-0.64) 0.45 (0.31-0.65) 0.35 (0.22-0.55) 0.26 (O. 14-0.48) 0.34 (0.20-0.58) 0.47 (0.28-0.78) 0.37 (0.1 8.0.74) 0.28 (O. 11-0.68) O 36 (O. 17-0.79) O 38 (0.23-0.63) 0.29 (0.15-0.55) O 20 (O 09-0.46) O 28 (0,13-0.59) 0.28 (O. 15-0.54) O. 19 (0 09-0.42) 0.12 (0.04-0.34) 0.19 (0.07-0.49) 0.24 (O. 12-0 48) 0.16 (0.07-0.36) 0.09 (O 03-0 27) O 15 (O 06-0 39)
Predicted Survival Probability at 1 year
(95% CI)
0.43 (0.25-0.74) 0.34 (O. 16-0.69) 0.25 (O. 10-0.64) 0.33 (0.14-0.75) 0.35 (0.22-0.56) 0.26 (O. 14-0.46) 0.17 (O 08-0.39) 0.25 (O. 12-0.53) 0.25 (O. 13-0.46) 0.16 (0.08-0.34) O. 10 (0.04-0.27) 0.16 (0.06-0.42) 0.21 (0.10-0.44) 0.13 (0.06-0.31) 0.08 (0.02-0.24) O. 13 (0.05-0.36) 0.23 (0.09-0.62) 0.15 (0.04-0.57) 0.09 (0.02-0.49) 0.14 (0.03-0.63) O. 16 (0.06-0.42) 0.09 (0.03-0.32) 0.05 (0.01-0.23) 0.09 (0.02-0.37) 0.09 (0.03-0.31) 0.04 (0.01-0.20) 0.02 (0.00-0.13) 0.04 (0.01-0.26) 0.07 (0.02-0.25) 0.03 (0.01-0.15) 0.01 (0.00-0.09) 0.03 (0.00-0.17)
Median Suwival in
weeks (95% CI)
40 (14-75) 31 (1 1-58) 24 (8-41) 30 (8-59)
33 (17-51) 25 (14-36) 19 (1 1-29) 24 (1 1-38) 24 (1 3-35) 19 (12-27) 14 (8-20) 19 (9-29)
20 (12-33) 16 (10-24) 13 (8-19) 16 (9-26) 22 (8-39) 18 (6-30) 14 (5-23) 17 (5-31) 19 (9-29) 14 (7-20) 11 (6-17) 14 (6-21) 14 (7-20) i l (6-16) 9 (5-13) 11 (5-16) 13 (7-19) 10 (6-14) 8 (5-1 1) 10 (6-14)
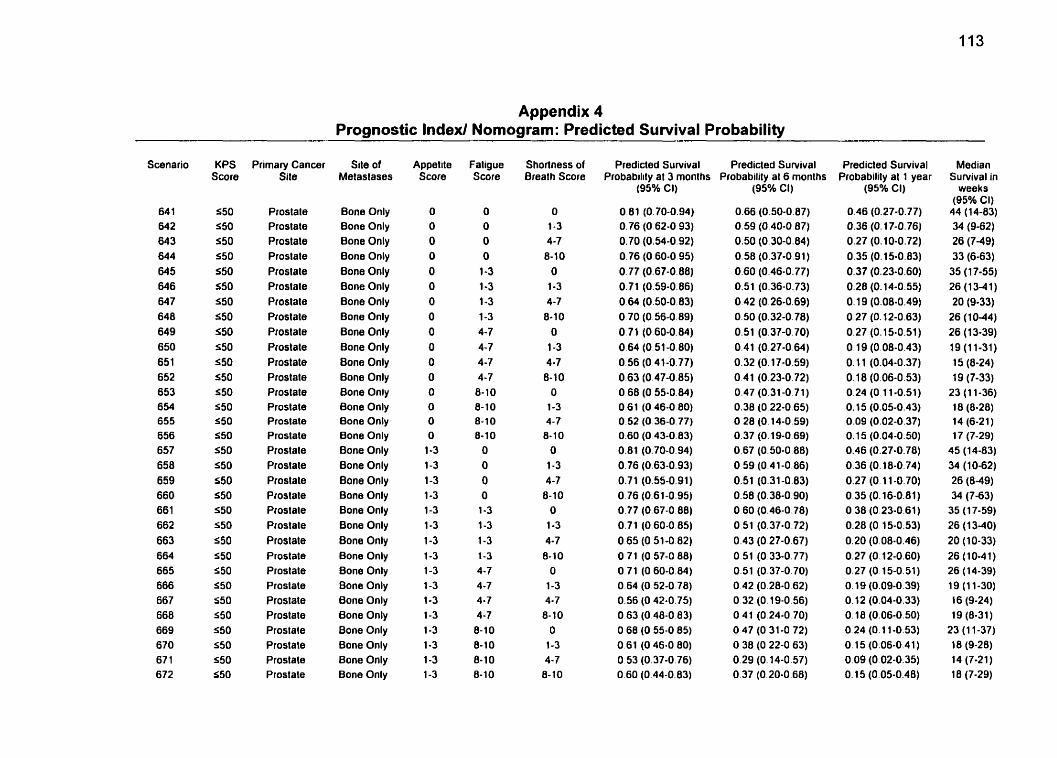
Appendix 4 Prognostic Index1 Nomogram: Predicted Survival Probability
Scenario
64 1 642 w3 644 645 646 647 648 649 650 651 652 653 654 655 656 657 658 659 660 66 1 662 663 664 665 666 667 668 669 670 67 1 672
KPS Score
550 550 550 550 550 S50 S50 S50 550 550 S50 S50 550 550 S50 550 550 S50 550 550 S50 S50 S50 550 S50 550 550 S50 S50 s50 S50 550
Primary Cancer Site
Prostale Prostate Prostate Prostale Prostate Prostate Prostate Pfostale Prostate Ptostate Prostate Prostale Prostate Prostate Pfostate Prostate Prostate Prostate Prostate Ptostale Ptostale Prostate Prostate Prostate Prostate Prostate Prostale Prostale Prostate Prostate Prostate Prostate
Site of Metastases
Bone Only Bone Only Bone Only Bone Only Bone Only Bone Only Bone Only Bone Only Bone Only Bone Only Bone Only Bone Only Bone Oniy Bone Only Bone Only Bone Only Bone Only Bone Only Bone Only Bone Only Bone Only Bone Only 8one Only Bone Only Bone Only Bone Only Bone Only Bone Only Bone Only Bone Only Bone Only Bone Only
Appetite Score
O O O O O O O O O O O O O O O O
1-3 1-3 1-3 1-3 1-3 1-3 1-3 1-3 1-3 1-3 1-3 1-3 1-3 1-3 1-3 1-3
Faligue Score
O O O O
1-3 1-3 1-3 1-3 4-7 4-7 4-7 4-7 8- 10 8-10 8-10 8-10
O O O O
1-3 1-3 1-3 1-3 4-7 4-7 4-7 4-7
6-10 8-10 8-10 8-10
Shorlness of Breath Score
O 1-3 4-7 6-10
O 1-3 4-7
8-10 O
1-3 4-7 6-10
O 1-3 4-7 8-10
O 1-3 4-7
8-10 O
1-3 4-7 8-10
O 1-3 4-7 8- 1 O
O 1-3 4-7
8- 1 O
Predicted Survival Predicted Survival Probabilitv at 3 monlhs Probabilitv al 6 months
(95% CI)
O 81 (0.70-0.94) 0.76 (O 62-0 93) 0.70 (0.54-0.92) 0.76 (O 60-0.95) 0.77 (0.67-0.88) 0.71 (0.59-0.86) O 64 (0.50-0.83) O 70 (0.56-0.89) 0.71 (0.60-0.84) 0.64 (0.51 -0.80) O 56 (O 41-0.77) 0.63 (0.47-0.85) O 68 (0.55-0.84) 0.61 (O 46-0 80) 0.52 (O 36-0.77) 0.60 (O 43-0.83) 0.81 (0.70-0.94) 0.76 (0.63-0.93) 0.71 (0.55-0.91) 0.76 (0.61-0.95) 0.77 (0.67-0.88) 0.71 (O 60-0 85) O 65 (0.51-0 82) 0.71 (O 57-0 88) 0.71 (O 60-0.84) 0.64 (O 52-0 78) 0.56 (O 42-0.75) 0.63 (O 48-0 83) O 68 (O 55-0 85) 0.61 (O 46-0 80) O 53 (0.37-0.76) 0.60 (0.44-0.83)
(95% Cl)
0.66 (0.50-0.87) 0.59 (0.40-0 87) 0.50 (0.30-0.84) 0.58 (0.37-0.91) 0.60 (0.46-0.77) 0.51 (0.36-0.73) 0.42 (0.26-0.69) 0.50 (0.32-0.78) 0.51 (0.37-0.70) 0.41 (0.27-0.64) 0.32 (0.17-0.59) 0 41 (0.23-0.72) 0.47 (0.31-0.71) 0.38 (0.22-0.65) O 28 (0.14-0.59) 0.37 (0.19-0.69) 0.67 (0.50-0.88) O 59 (0.41-0.86) 0.51 (0.31-0.83) 0.58 (0.38-0.90) 0.60 (0.46-0.78) O 51 (0.37-0.72) 0.43 (O 27-0.67) 0.51 (0.33-0.77) 0.51 (0.37-0.70) 0.42 (O 28-0 62) O 32 (O 19-0.56) O 41 (O 24-0 70) O 47 (O 31-0 72) O 38 (O 22-0 63) 0.29 (O. 14-0.57) 0.37 (0.20-0.68)
Predicted Survival Probability al 1 year
(95% CI)
0.46 (0.27-0.77) 0.36 (O. 17-0.76) 0.27 (0.10-0.72) 0.35 (0.15-0.83) 0.37 (0.23-0.60) 0.28 (0.14-0.55) 0.19 (0.08-0.49) 0.27 (O. 12-0.63) 0.27 (0.15-0.51) 0.19 (0.08-0.43) O. 1 1 (0.04-0.37) 0.1 8 (0.06-0.53) 0.24 (O 11-0.51) O. 15 (0.05-0.43) 0.09 (0.02-0.37) O. 15 (0.04-0.50) 0.46 (0.27-0.78) 0.36 (0.18-0.74) 0.27 (O. 11 -0.70) 0.35 (0.16-0.81) 0.38 (0.23-0.61) 0.28 (O 15-0.53) 0.20 (0.08-0.46) 0.27 (0.12-0.60) 0.27 (O, 15-0.51) O. 19 (0.09-0.39) O. 12 (0.04-0.33) O. 18 (0,06-0.50) O 24 (O. 1 1-0.53) 0.15 (0.06-0.41) 0.09 (O 02-0.35) O. 15 (0.05-0.48)
Median Survival in
weeks (95% CI)
44 (14-83) 34 (9-62) 26 (749) 33 (6-63)
35 (1 7-55) 26 (13-41) 20 (9-33)
26 (1 0-44) 26 (13-39) 19 (11-31) 15 (8-24) 19 (7-33)
23 (1 1-36) 18 (8-28) 14 (6-21) 17 (7-29)
45 (14-83) 34 (10-62) 26 (8-49) 34 (7-63)
35 (1 7-59) 26 (1 3-40) 20 (10-33) 26 (10-41) 26 (14-39) 19 (11-30) 16 (9-24) 19 (8-31)
23 (1 1-37) 18 (9-28) 14 (7-21) 18 (7-29)
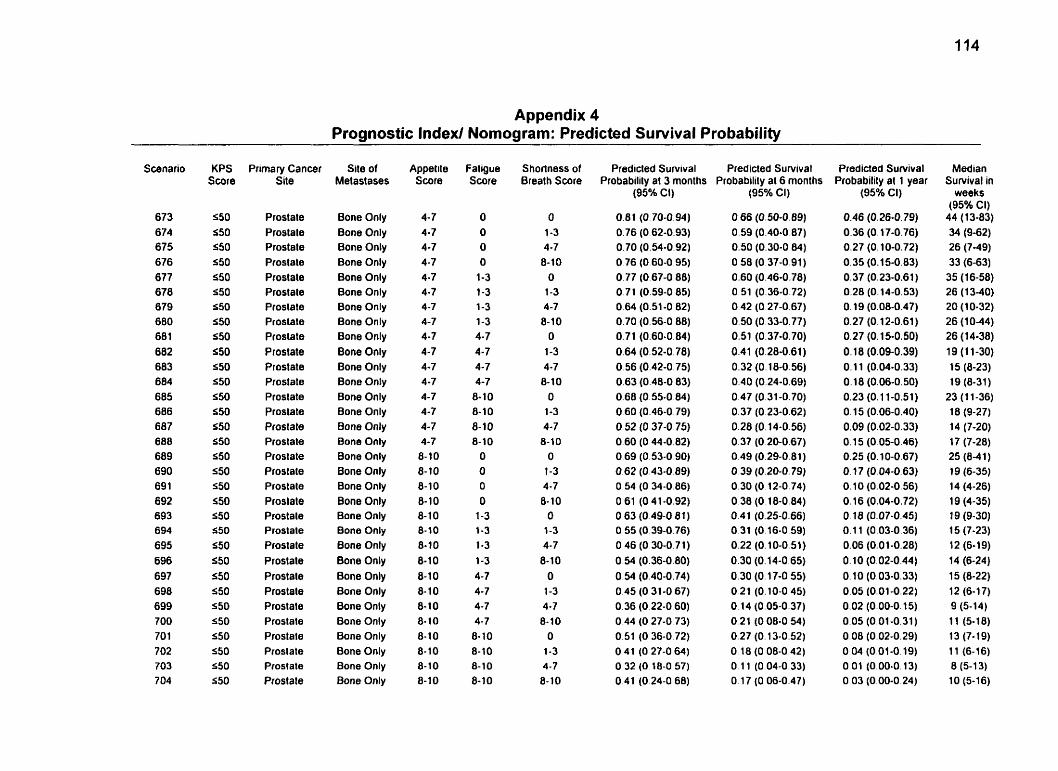
Appendix 4 Prognostic lndexl Nomogram: Predicted Survival Probability
Scenario
673 674 675 676 677 678 679 680 68 1 682 683 684 685 686 687 688 689 690 69 1 692 693 694 695 696 697 698 699 700 70 1 702 703 7 O4
KPS Score
S50 550 550 S50 550 S50 S50 550 S50 550 550 S50 550 S50 S50 550 550 S50 550 550 550 S50 550 S50 550 550 S 50 550 S50 550 550 550
Prirnary Cancer Site
Prostate Prostate Prostate Prostate Prostate Prostate Prostate Prostate Prostate Prostate Prostate Prostate Prostate Prostate Prostate Prostate Prostate Prostate Prostate Prostate Prostate Prostate Prostate Prostate Prostate Prostate Prostate Prostate Prostate Proslate Prostate P~ostate
Site of Metastases
Bone Only Bone Only Bone Only Bone Only Bone Only Bone Only Bone Only Bone Only Bone Only Bone Only Bone Only Bone Only Bone Only Bone Only Bone Only Bone Only Bone Only Bone Only Bone Only Bone Only Bone Only Bone Only Bone Only Bone Only Bone Only Bone Only Bone Only Bone Only Bone Only Bone Only Bone Only Bone Only
Appetite Score
4-7 4-7 4-7 4-7 4-7 4-7 4-7 4-7 4-7 4-7 4-7 4-7 4-7 4-7 4-7 4-7 8-10 8-10 8-10 8- 1 O 8-10 8-10 8-10 8-10 8-10 8- 10 8-10 8- 10 8- 1 O 8-10 8-10 8-10
f aligue Score
O O O O
1-3 1-3 1-3 1-3 4-7 4-7 4-7 4-7 8-10 8-10 8-10 8-10
O O O O
1-3 1-3 1-3 1-3 4-7 4-7 4-7 4-7 8- 10 8-10 8-10 8-10
Shorlness of Breath Score
O
1-3 4-7 8-10
O
1-3 4-7 8-10
O 1-3 4-7 8-10
O 1-3 4-7 8-10
O 1-3 4-7 8- 1 O
O 1-3 4-7 0-10
O 1-3
4-7 8-10
O 1-3 4-7 8- 1 O
Predicted Survival Predicted Survival Probability at 3 months Probabilily at 6 months
(95% Ci) (95% CI)
0.66 (0.50-0.89) 0.59 (0.40-0.87) 0.50 (0.30-0.84) O 58 (O 37-0.91) 0.60 (0.46-0.78) 0.51 (0.36-0.72) 0.42 (O 27-0.67) 0.50 (0.33-0.77) 0.51 (0.37-0.70) 0.41 (0.28-0.61) 0.32 (0.18-0.56) 0.40 (0.24-0.69) 0.47 (0.31-0.70) 0.37 (0.23-0.62) 0.28 (O. 14-0.56) 0.37 (O 20-0.67) 0.49 (0.29-0.81) O 39 (0.20-0.79) 0.30 (0.12-0.74) O 38 (0.18-0.84) 0.4 1 (0.25-0.66) O 31 (0.16-0.59) 0.22 (0.10-0.51) 0.30 (0.14-0.65) 0.30 (O. 17-0 55) O 21 (0.10-0.45) O. 14 (0.05-0.37) 0.21 (O 08-0.54) 0.27 (O. 13-0.52) O 18 (O 08-0 42) O 1 1 (0.04-0.33) O 17 (O 06-0.47)
Predicted Survival Probability al 1 year
(95% CI)
0.46 (0.26-0.79) 0.36 (0.17-0.7 6) 0.27 (O, 10-0.72) 0.35 (0.15-0.83) 0.37 (0.23-0.61) 0.28 (0.14-0.53) O. 19 (0.08-0.47) 0.27 (O. 12-0.61) 0.27 (O. 15-0.50) O. 18 (0.09-0.39) O. 1 1 (0.04-0.33) 0.18 (0.06-0.50) 0.23 (0.1 1-0.51) O. 15 (0.06-0.40) 0.09 (0.02-0.33) O. 15 (0.05-0.46) 0.25 (O. 10-0.67) O. 17 (0.04-0.63) 0.10 (0.02-0.56) 0.16 (0.04-0.72) O. 18 (0.07-0.45) 0.1 1 (0.03-0.36) 0.06 (0.01-0.28) O. 10 (0.02-0.44) O. 10 (0.03-0.33) 0.05 (0.01-0.22) 0.02 (0.00-0.15) 0.05 (0.01-0.31) 0.08 (0.02-0.29) O O4 (0.01-0.19) 0.01 (0.00-0.13) 0.03 (0.00-0.24)
Median Survival in
weeks (95% CI)
44 (13-83) 34 (9-62) 26 (7-49) 33 (6-63) 35 (16-58) 26 (13-40) 20 (1 0-32) 26 (1 0-44) 26 (1 4-38) 19 (1 1-30) 15 (8-23) 19 (8-31)
23 (1 1-36) 18 (9-27) 14 (7-20) 17 (7-28) 25 (8-4 1) 19 (6-35) 14 (4-26) 19 (4-35) 19 (9-30) 15 (7-23) 12 (6-19) 14 15 (6-24) (8-22)
12 (6-17) 9 (5-14) 11 (5-18) 13 (7-19) 11 (6-16) 8 (5-13) 10 (5-16)
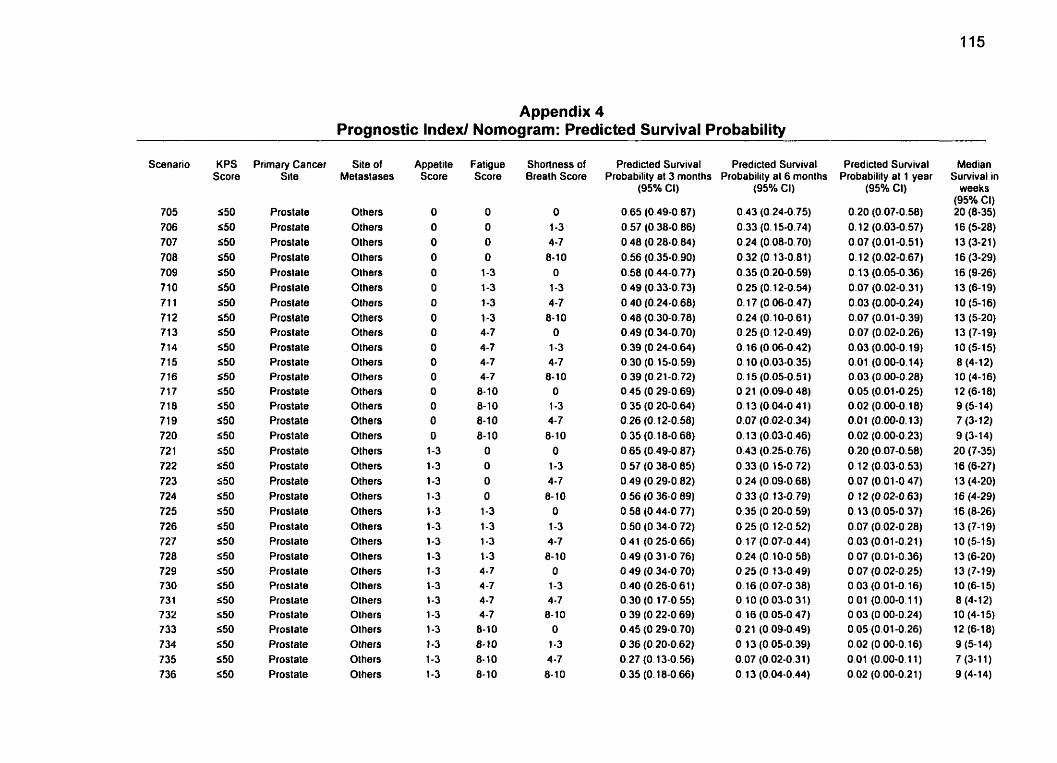
Appendix 4 Prognostic lndexl Nomogram: Predicted Survival Probability
Scenario
705 706 707 708 709 710 71 1 71 2 71 3 7 14 715 7 16 7 17 7 18 7 19 720 72 1 722 723 724 725 726 727 728 729 7 30 731 732 733 734 735 736
KPS Score
550 550 550 $50 550 550 550 S50 550 550 S50 550 550 550 550 550 550 a50 550 550 550 S50 550 550 S50 S50 550 550 550 550 550 550
Primary Cancer Site
Prostate Prostate Proslate Prostate Proslate Proslale Proslate Prostate Prostate Prostate Prostate Prostate Prostate Prostate Prostate Prostate Prostate Prostate Prostate Proslate Proslale Prostate Proslale Proslate Prostate Prostate Prostate Prostate Proslate Prostate Prostate Proslale
Site of Melastases
Others Others Olhers Olhers Olhers Olhers Others Olhers Others Others Others Others Others Others Others Others Others Others Others Others Others Others Others Others Others Others Others Others Olhers Others Others Others
Appetile Score
O O O O O O O O O O O O O O O O
1-3 1-3 1-3 1-3 1-3 1-3 1-3 1-3 1-3 1-3 1-3 1-3 1-3 1-3 1-3 1-3
Fatigue Score
O
O O O
1-3 1-3 1 -3 1-3 4-7 4-7 4-7 4-7
8-10 8-10 8-10 8- 1 O
O O
O O
1-3 1-3 1-3 1-3 4-7 4 -7 4-7 4-7 8-10 8-10 8- 10 8-10
Shoflness of Breath Score
O 1-3 4-7 8-1 0
O
1-3 4-7 8-10
O 1-3 4-7 8-10
O 1-3 4-7 8- 10
O 1-3 4-7 8-10
O 1-3 4-7 8-10
O 1-3 4-7 8-10
O 1-3 4-7 8-10
Predicted Survival Predicted Survival Probability at 3 months Probability al 6 months
(95% Cl)
0.65 (0.49-0.87) 0.57 (0.38-0.86) O 48 (0.28-0.84) 0.56 (0.35-0.90) 0.58 (0.44-0.77) O 49 (0.33-0.73) 0.40 (0.24-0.68) 0.48 (0.30-0.78) 0.49 (O 34-0.70) 0.39 (0.24-0.64) 0.30 (0.15-0.59) 0.39 (O 21-0.72) 0.45 (O 29-0.69) 0.35 (O 20-0.64) 0.26 (O. 12-0.58) O. 35 (0.18-0 68) 0.65 (0.49-0.87) O 57 (O 38-0 85) 0.49 (0.29-0.82) 0.56 (0.36-0 89) 0.58 (0.44-0.77) 0.50 (O 34-0 72) O 4 1 (O 25-0.66) O 49 (0.31-0 76) 0.49 (0.34-0.70) 0.40 (0.26-0 61) 0.30 (0.17-0.55) O 39 (0.22-0 69) 0.45 (0.29-0.70) O 36 (0.20-0.62) 0.27 (0.13-0.56) 0.35 (O. 18-0.66)
(95% CI)
0.43 (0.24-0.75) 0.33 (O. 15-0.74) 0.24 (0.08-0.70) 0.32 (O. 13-0.81) 0.35 (0.20-0.59) 0.25 (O. 12-0.54) 0.17 (0.06-0.47) 0.24 (0.10-0.61) 0.25 (0.12-0.49) O. 16 (O 06-0.42) O. 10 (0.03-0.35) O. 15 (0.05-0.51 ) 0.21 (0.09-0 48) O. 13 (0.04-0 41 ) 0.07 (0.02-0.34) O. 13 (0.03-0.46) 0.43 (0.25-0.76) 0.33 (O. 15-0.72) O 24 (0.09-0.68) O 33 (O. 13-0.79) 0.35 (0.20-0.59) O 25 (O. 12-0.52) O. 17 (0.07-0.44) 0.24 (0.10-0 58) 0.25 (0.13-0.49) O. 16 (0.07-0.38) O 10 (0.03-0 31) 0.16 (0.05-0.47) 0.21 (0.09-0.49) O 13 (O. 05-0.39) 0.07 (0.02-0.31) O. 13 (0.04-0.44)
Predicted Survival Probabilily al 1 year
(95% CI)
Median Survival in
weeks (95% Ci) 20 (8-35) 16 13 (5-28) (3-21)
16 (3-29) 16 (9-26) 13 (6-19) 10 (5-16) 13 (5-20) 13 (7-19) 10 (5-15) 8 (4-1 2) 10 (4-16) 12 (6-18) 9 (5- 14) 7 (3- 1 2) 9 (3-14) 20 (7-35) 16 (6-27) 13 (4-20) 16 (4-29) 16 (0-26) 13 (7-1 9) 10 (5-15) 13 (6-20) 13 (7-19) 10 (6-15) 8 (4-12) 10 (4-15) 12 (6-18) 9 (5- 14) 7 (3-1 1) 9 (4-1 4)
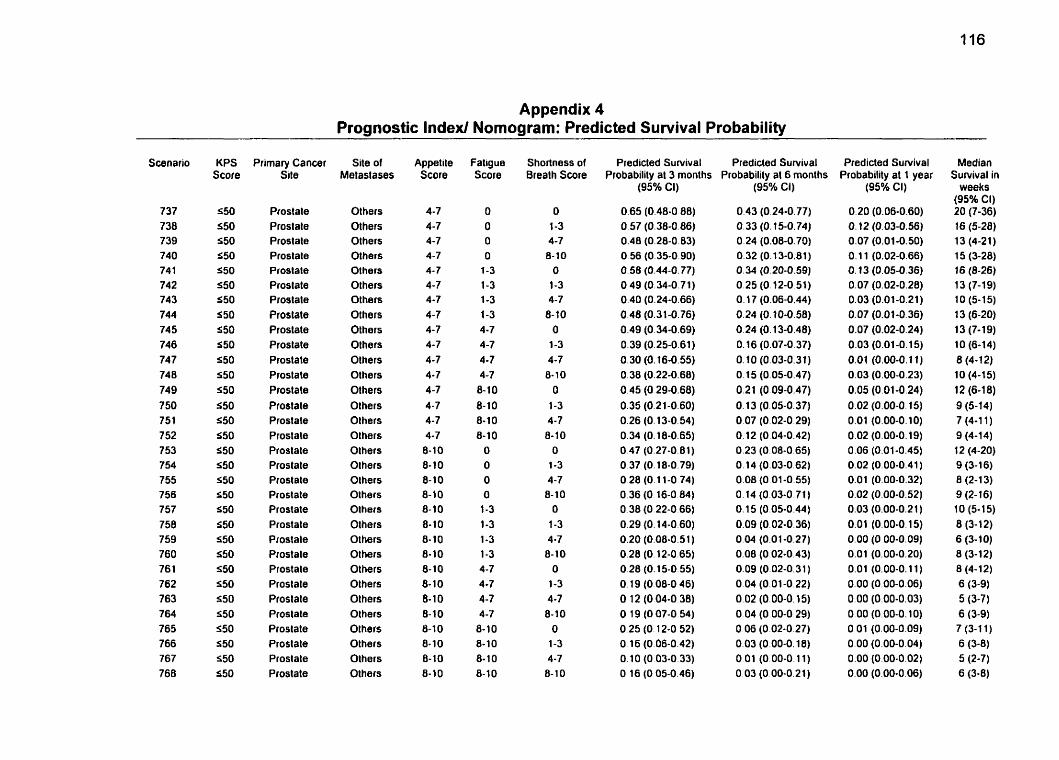
Appendix 4 Prognostic Index1 Nomogram: Predicted Survival Probability
Scenario
737 738 739 740 74 1 742 743 744 74 5 746 747 74 8 749 750 751 752 753 754 755 756 757 758 759 760 761 762 763 764 765 766 767 768
KPS Score
550 S50 550 S50 550 550 550 550 S50 S50 550 550 550 S50 550 550 S50 550 S50 S50 S50 550 S50 S50 S50 550 S50 S50 550 S50 550 550
Prirnary Cancer Site
Proslate Prostate Prostate Prostate Prostate Prostate Prostate Prostate Prostate Prostate Prostate Prostate Prostate Prostate Prostate Prostate Prostate Prostate Prostate Prostate Prostate Prostate Prostate Prostate Prostale Prostate Prostate Prostale Prostate Proslale Prostate Prostate
Site of Metaslases
Others Others Olhers Others Others Others Others Olhers Others Others Others Olhers Others Others Olhers Others Others Others Others Others Others Others Others Others Others Others Others Others Others Others Others Others
Appeti te Score
4-7 4-7 4-7 4-7 4- 7 4-7 4-7 4-7 4-7 4-7 4-7 4-7 4-7 4-7 4-7 4-7
8- 10 8-10 8-10 8-10 8- 1 O 8- 10 8-10 8-10 8- 1 O 8- 10 8-10 8- 1 O 8-10 8- 1 O 8-10 8-10
Fatigue Score
O O O O
1-3 1-3 1-3 1-3 4-7 4-7 4-7 4-7 8-10 8- 1 O 8-10 8-10
O
O O O
1-3 1-3 1-3 1-3 4-7 4-7 4-7 4-7
8- 10 8-10 8- 10 8-10
Shortness of Breath Score
Predicted Survival Probability al 3 rnonths
(95% CI)
0.65 (0.48-0 88) 0.57 (0.38-0.86) 0.48 (0.28-0.83) 0.56 (O 35-0.90) 0.58 (0.44-0.77) O 49 (0.34-0.71) 0.40 (0.24-0.66) 0.48 (0.3 1-0.76) 0.49 (0.34-0.69) 0.39 (0.25-0.61) 0.30 (0.16-0.55) 0.38 (0.22-0.68) 0.45 (O 29-0.68) 0.35 (0.21-0.60) 0.26 (0.13-0.54) 0.34 (O. 18-0.65) O 47 (0.27-0.81) 0.37 (O. 18-0.79) O 28 (O. 1 1-0 74) 0.36 (O 16-0 84) O 38 (O 22-0 66) 0.29 (O. 14-0.60) 0.20 (0.08-0.51) 0.28 (O. 12-0.65) 0.28 (0.1 5-0.55) O. 19 (0.08-0.46) O 12 (O 04-0 38) O 19 (O 07-0 54)
0.25 (O 12-0 52) O 16 (0.06-0.42) O 10 (O 03-0 33) O 16 (O 05-0.46)
Predicted Survival Probability al 6 months
(95% Ci)
0.43 (O 24-0.77) 0.33 (0.15-0.74) 0.24 (0.08-0.70) 0.32 (0.13-0.81) 0.34 (0.20-0.59) 0.25 (0.12-0.51) O. 17 (0.06-0.44) 0.24 (0.10-0.58) 0.24 (0.13-0.48) O. 16 (0.07-0.37) O. 10 (0.03-0.31) 0.15 (0.05-0.47) 0.21 (0.09-0.47) O. 13 (0.05-0.37) 0.07 (0.02-0.29) O. 12 (0.04-0.42) 0.23 (0.08-0.65) 0.14 (0.03-0.62) 0.08 (O 01-0.55) 0.14 (0.03-0.71) O. 15 (0.05-0.44) 0.09 (0.02-0.36) 0.04 (0.01-0.27) 0.08 (0.02-0.43) 0.09 (0.02-0.31 ) 0.04 (0.01-0.22) 0.02 (0.00-0.15) 0.04 (0.00-0.29) O O6 (0.02-0.27) 0.03 (0.00-0.18) O O1 (0.00-0.11) 0.03 (O 00-0.21)
Predicted Survival Probability at 1 year
(95% CI)
Median Survival in
weeks (95% CI) 20 (7-36) 16 (5-28) 13 (4-21) 15 (3-28) 16 (8-26) 13 (7-19) 10 (5-15) 13 (6-20) 13 (7-19) 10 (6-14) 8 (4-12) 10 (4-15) 12 (6-1 8) 9 (5-14) 7 (4-1 1 ) 9 (4-14) 12 (4-20) 9 (3-1 6) 8 (2-13) 9 (2- 16) 10 (5-15) 8 (3- 12) 6 (3- 1 O) 8 (3- 1 2) 8 (4-12) 6 (3-9) 5 (3-7) 6 (3-9) 7 (3-1 1) 6 (3-8) 5 (2-7) 6 (3-8)
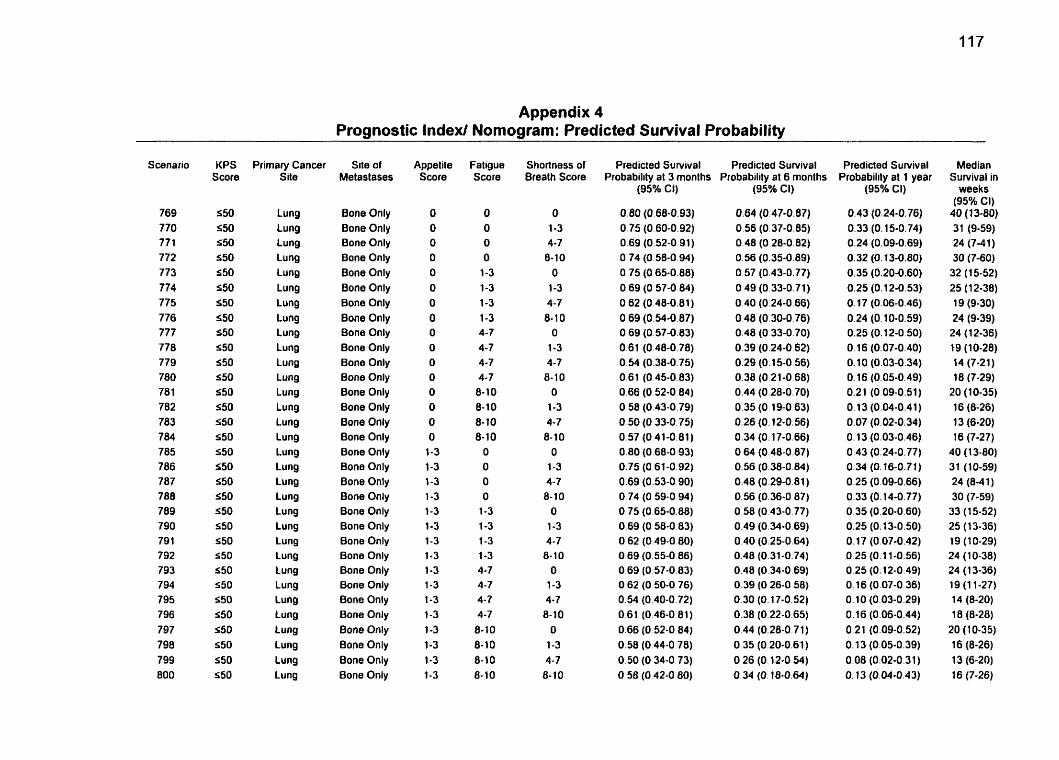
Appendix 4 Prognostic Index1 Nomograrn: Predicted Survival Probability
Scenario
769 770 77 1 772 773 774 775 776 777 778 779 780 78 1 782 783 784 785 786 787 788 789 790 791 792 793 794 795 796 797 798 799 800
KPS Score
550 550 550 550 550 550 550 550 S50 550 S50 550 S50 S50 550 550 550 550 550 550 550 S50 S50 550 S50 550 550 S50 550 550 S50 S50
Primary Cancer Site
Lung Lung Lung Lung Lung Lung Lung Lung Lung Lung Lung Lung Lung Lung Lung Lung Lung Lung Lung Lung Lung Lung Lung Lung Lung Lung Lung Lung Lung Lung Lung Lung
Site of Metastases
Bone Only Bone Only Bone Only Bone Only Bone Only Bone Only Bone Only Bone Only Bone Only Bone Only Bone Only Bone Only Bone Only Bone Only Bone Only Bone Only Bone Only Bone Only Bone Only Bone Only Bone Only Bone Only Bone Only Bone Only Bone Only Bone Only Bone Only Bone Only Bone Only Bone Only Bone Only Bone Only
Appetile Score
O O O O O O
O O O
O O O O O O
O 1-3 1-3 1-3 1-3 1-3 1-3 1-3 1-3 1-3 1-3 1-3 1-3 1-3 1-3 1-3 1-3
Faligue Score
O O O O
1-3 1-3 1-3 1-3 4-7 4-7 4-7 4-7 8-10 8-10 8-10 6-10
O O O O
1-3 1-3 1-3 1-3 4-7 4-7 4-7 4-7 8-10 8-10 8-10 8- 10
Shortness of Srealh Score
O 1-3 4-7 8-10
O 1-3 4-7 8-10
O
1-3 4-7
8- 10 O
1-3 4-7 8-10
O 1-3 4-7 8-10
O
1-3 4-7 8- 10
O 1-3 4-7 8- 10
O 1-3 4-7
8-10
Predicted Sunrival Predicted Survival Probability at 3 monlhs Probability at 6 months
(95Oh CI)
0.64 (0.47-0.87) 0.56 (0.37-0.85) 0.48 (0.28-0.82) 0.56 (0.35-0.89) 0.57 (0.43-0.77) 0.49 (0.33-0.71) 0.40 (0.24-0.66) 0.48 (0.30-0.76) 0.48 (0.33-0.70) 0.39 (0.24-0 62) 0.29 (0.15-0.56) 0.38 (O 21-0 68) 0.44 (0.28-0.70) 0.35 (0.19-0 63) 0.26 (O. 12-0.56) 0.34 (O. 17-0.66) O 64 (0.48-0.87) 0.56 (0.38-0 84) 0.48 (0.29-0.81) 0.56 (0.36-0 87) 0.58 (0.43-0.77) 0.49 (0.34-0.69) 0.40 (0.25-0.64) 0.48 (0.31-0,74) 0.48 (0.34-0.69) 0.39 (O 26-0 58) 0.30 (O. 17-0.52) 0.38 (0.22-0.65) 0.44 (0.28-0.71) 0.35 (0.20-0.61) 0.26 (O. 12-0.54) O. 34 (O. 18-0.64)
Predicted Survival Probabilily at 1 year
(95% CI)
0.43 (0.24-0.76) 0.33 (O. 15-0.74) 0.24 (0.09-0.69) 0.32 (0.13-0.80) 0.35 (0.20-0.60) 0.25 (O. 12-0.53) O. 17 (0.06-0.46) 0.24 (0.10-0.59) 0.25 (0.12-0.50) O. 16 (0.07-0.40) 0.10 (0.03-0.34) O. 16 (0.05-0.49) 0.2 1 (0.09-0.51) 0.13 (0.04-0.41) 0.07 (0.02-0.34) O. 13 (0.03-0.46) 0.43 (0.24-0.77) 0.34 (0.16-0.71) 0.25 (0.09-0.66) 0.33 (O. 14-0.77) O 35 (0.20-0.60) 0.25 (0.13-0.50) 0.17 (0.07-0.42) O 25 (0.1 1-0.56) 0.25 (O. 12-0.49) 0.16 (0.07-0.36) 0.10 (0.03-0.29) 0.16 (0.06-0.44) 0.21 (0.09-0.52) O. 13 (0.05-0.39) 0.08 (0.02-0.31) O. 13 (0.04-0.43)
Median Sunrival in
weeks (95% CI)
40 (1 3-60) 31 (9-59) 24 (7-4 1) 30 (7-60) 32 (15-52) 25 (1 2-38) 19 (9-30) 24 (9-39) 24 (1 2-36} 19 (10-28) 14 (7-21) 18 (7-29)
20 (10-35) 16 (8-26) 13 (6-20) 1 6 (7-2 7)
40 (1 3-80) 31 (10-59) 24 (8-41) 30 (7-59)
33 (15-52) 25 (1 3-36) 19 (10-29) 24 (1 0-38) 24 (1 3-36) 19 (11-27) 14 (8-20) 18 (8-28)
20 (1 0-35) 16 (8-26) 13 (6-20) 16 (7-26)
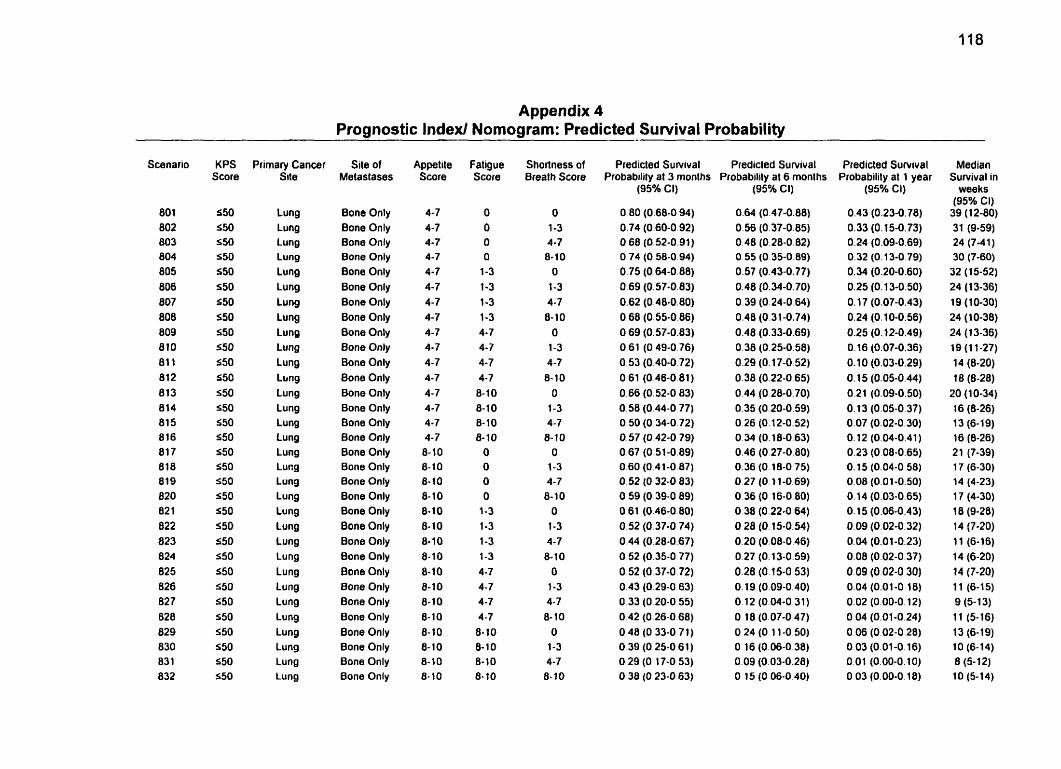
Appendix 4 Prognostic lndexl Nomograrn: Predicted Survival Probability
Scenario
80 1 802 803 804 805 806 807 808 809 810 81 1 812 813 814 81 5 816 817 818 819 820 82 1 822 823 824 825 826 827 028 829 830 831 832
KPS Score
550 550 550 S50 550 S50 550 550 550 550 550 550
550 550 550 550 S50 S50 550 550 5 50 5 50 550 550 550 550 550 550 550 550 550 S50
Primary Cancer Site
Lung Lung Lung Lung Lung Lung Lung Lung Lung Lung Lung Llrng Lung Lung Lung Lung Lung Lung Lung Lung Lung Lung Lung Lung Lung Lung Lung Lu ng Lung Lung Lung Lung
Site of Melastases
Bone Only Bone Only Bone Only Bone Only Bone Only Bone Only Bane Only Bone Only Bone Only 8one Only Bone Only Bone Only Bone Only Bone Only Bone Only Bone Only Bone Only Bone Only Bone Only Bone Only Bone Only Bone Only Bone Only Bone Only Bone Only Bone Only Bone Only Bone Only Bone Only Bone Only Bone Only Bone Only
Appet ile Score
4-7 4-7 4-7 4-7 4-7 4-7 4-7 4-7 4-7 4-7 4-7 4-7 4-7 4-7 4-7 4-7 8- 10 8-10 8-10 8- 1 O 8-10 8-10 8-10 8-10 8-10 8-10 8-10 8- 10 8- 1 O 8-10 8- 1 O 8-10
Fatigue Score
O O O O 1-3 1-3 1-3 1-3 4-7 4-7 4-7 4-7 8-10 8-10 8-10 8-10 O O O O 1-3 1-3 1-3 1-3 4 -7 4-7 4 -7 4-7 8- 1 O 8-10 8-10 8-10
Shortness of Breath Score
O 1-3 4-7 8-10 O 1-3 4-7 8-10 O 1-3 4-7 8-10 O 1-3 4-7 8-10 O 1-3 4-7 8-10 O 1-3 4-7 8- 10 O 1-3 4-7 8- 10 O 1-3 4-7 8-10
Predicted Suwival Predicled Survival Predicted Suwival Probabilily at 3 months Probabilily al 6 monlhs Probability at 1 year
(95016 CI) (95% Cl)
0.64 (0.47-0.88) 0.56 (0.37-0.85) 0.48 (0.28-0.82) O 55 (O 35-0.89) 0.57 (0.43-0.77) 0.48 (0.34-0.70) 0.39 (0.24-0.64) 0.48 (0.31-0.74) 0.48 (0.33-0.69) 0.38 (0.25-0.58) 0.29 (O. 17-0.52) 0.38 (0.22-0.65) 0.44 (0.26-0,70) 0.35 (0.20-0.59) 0.26 (0.12-0.52) O 34 (O. 18-0.63) 0.46 (0.27-0.80) 0.36 (O. 18-0 75) 0.27 (O. 11-0.69) 0.36 (0.16-0.80) 0.38 (0.22-0.64) O 28 (O. l5-0.!54) 0.20 (0.08-0.46) 0.27 (O. 13-0.59) 0.28 (O. 15-0.53) O. 19 (0.09-0.40) 0.12 (0.04-0.31) O. 18 (0.07-0 47) O 24 (O. 1 1-0 50) O 16 (0.06-0.38) O O9 (0.03-0 28) O 15 (O 06-0 40)
(95% Cl) '
0.43 (0.23-0.78) 0.33 (0.15-0.73) 0.24 (0.09-0.69) 0.32 (0.13-0.79) 0.34 (0.20-0.60) 0.25 (O. 13-0.50) O. 17 (0.07-0.43) 0.24 (0.10-0.56) 0.25 (O. 12-0.49) O. 16 (0.07-0.36) 0.10 (0.03-0.29) 0.15 (0.05-0.44) 0.21 (0.09-0.50) 0.13 (0.05-0.37) 0.07 (0.02-0.30) 0.12 (0.04-0.41) 0.23 (0.08-0.65) 0.15 (0.04-0.58) 0.08 (0.01-0.SO) 0.14 (0.03-0.65) O. 15 (0.06-0.43) 0.09 (0.02-0.32) 0.04 (0.01-0.23) 0.08 (0.02-0.37) 0.09 (0.02-0 30) 0.04 (0.01-0.18) 0.02 (0.00-0.12) 0.04 (0.01-0.24) 0.06 (0.02-0.28) O 03 (0.01-0.16) 0.01 (0.00-0.10) O 03 (0.00-0.18)
Median Sunrival in
weeks (95% CI) 39 (1 2-60) 31 (9-59) 24 (7-41) 30 (7-60) 32 (15-52) 24 (13-36) 19 (10-30) 24 (10-38) 24 (1 3-36) 19 (11-27) 14 (8-20) 18 (8-28) 20 (1 0-34) 16 (8-26) 13 (6-19) 16 (8-26) 21 (7-39) 17 (6-30) 14 (4-23) 17 (4-30) 18 (9-28) 14 (7-20) 1 1 (6-16) 14 (6-20) 14 (7-20) 1 1 (6-15) 9 (5- 1 3) 1 1 (5-16) 13 (6-19) 10 (6-14) 8 (5- 12) 10 (5-14)
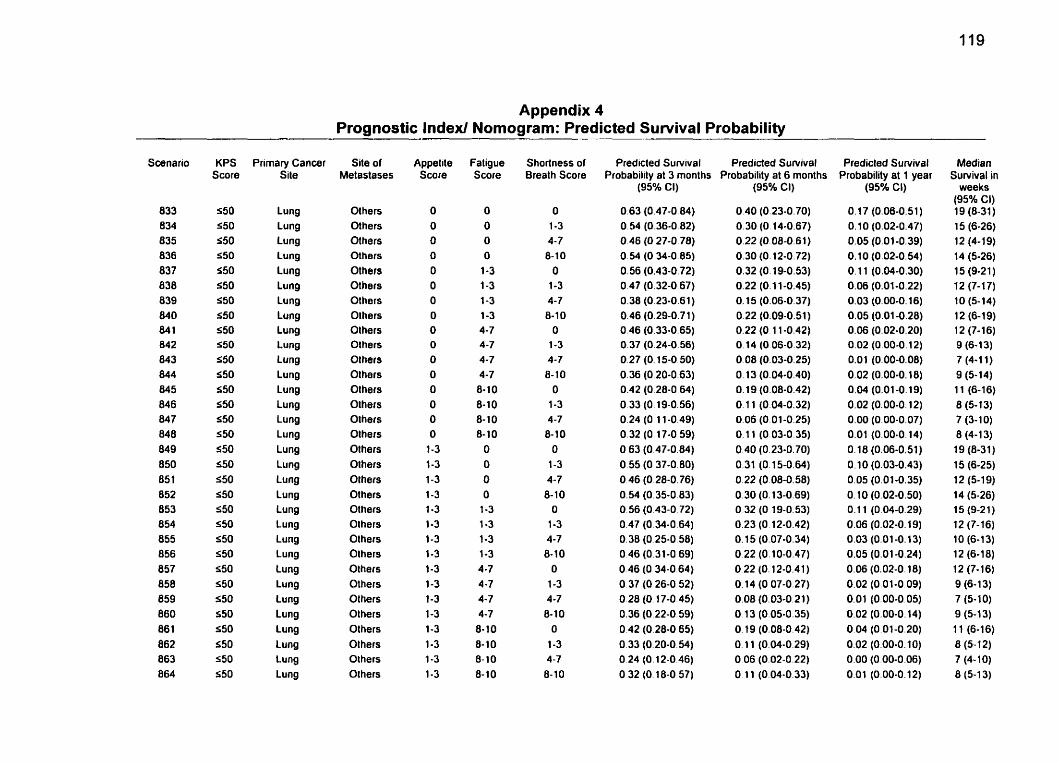
Appendix 4 Prognostic Index/ Nomograrn: Predicted Survival Probability
Scenario
833 834 835 836 837 838 839 840 841 842 843 844 845 846 847 848 849 850 85 1 852 853 854 855 856 857 858 859 860 86 1 862 863 864
KPS Score
550 550 550 550 S50 550 550 550 S50 S50 550 550 550 550 s50 550 550 550 550 S50 550 550 550 550 550 550 550 550 S50 S50 550 S50
Primary Cancer Site
Lung Lung Lung Lung Lung Lung Lung Lung Lung Lung Lung Lung Lung Lung Lung Lung Lung Lung Lung Lung Lung Lung Lung Lung Lung Lung Lung Lung Lung Lung Lung Lung
Site of Metastases
Others Others Others Others Others Others Others Olhers Olhers Olhers Olhers Olhers Olhers Others Others Olhers Olhers Olhers Olhers Olhers Olhers Olhers Others Others Others Others Others Others Others Others Others Olhers
Appetite Score
O O O O
O O O
O O O
O O O O O O
1-3 1-3 1-3 1-3 1-3 1-3 1-3 1-3 1-3 1-3 1-3 1-3 1-3 1-3 1-3 1-3
Fatigue Score
O O O O
1-3 1-3 1-3 1-3 4-7 4-7 4-7 4-7 8-10 8-10 8- 10 8- 10
O O O O
1-3 1-3 1-3 1-3 4-7 4-7 4-7 4-7 8-10 8-10 8-10 8-10
Shortness of Breath Score
O 1-3 4-7 8-10
O 1-3 4-7 8-1 O
O 1-3 4-7 8- 1 O
O 1-3 4-7 8-10
O 1-3 4-7 8-10
O 1-3 4-7 8-10
O 1-3 4-7 8-10
O
1-3 4-7 8-10
Predicted Survival Predicted Survival Probability at 3 months Probability at 6 months
(95Or6 CI)
0.63 (0.47-0.84) 0.54 (0.36-0.82) O 46 (O 27-0.78) 0.54 (O 34-0.85) 0.56 (0.43-0.72) O 47 (0.32-0.67) 0.38 (0.23-0.61) 0.46 (0.29-0.71) 0.46 (0.33-0.65) 0.37 (0.24-0.56) 0.27 (O. 15-0.50) 0.36 (O 20-0.63) 0.42 (0.28-0 64)
O 33 (0.19-0.56) 0.24 (O. 1 1-0.49) 0.32 (O. 17-0.59) O 63 (0.47-0.84) O 55 (O 37-0.80) O 46 (O 28-0.76) 0.54 (0.35-0.83) O 56 (O 43-0 72) O 47 (O 34-0.64) 0.38 (O 25-0.58) O 46 (0.31-0 69) 0.46 (O 34-0.64) O 37 (O 26-0.52) 0.28 (O. 17-0.45) 0.36 (0.22-0.59) 0.42 (0.28-0 65) 0.33 (0.20-0 54) O 24 (0.12-0.46) O 32 (O. 18-0 57)
(9S0r6 CI)
0.40 (0.23-0.70) 0.30 (0 14-0.67) 0.22 (0.08-0.61) 0.30 (0.12-0.72) 0.32 (0.19-0.53) 0.22 (0.1 1-0.45) O. 15 (0.06-0.37) 0.22 (0.09-0.51) 0.22 (O. 1 1-0.42) O 14 (O 06-0.32) 0.08 (0.03-0.25) O. 13 (0.04-0.40) O. 19 (0.08-0.42) O. 11 (0.04-0.32) 0.06 (0.01-0.25) 0.1 1 (0.03-0.35) O 40 (0.23-0.70) 0.31 (0.15-0.64) 0.22 (0.08-0.58) 0.30 (O. 13-0.69) O 32 (O 19-0.53) 0.23 (O 12-0.42) 0.15 (0.07-0.34) 0.22 (O. 10-0.47) 0.22 (O. 12-0.41) 0.14 (0.07-0.27) 0.08 (0.03-0.21) O 13 (0.05-0.35) O 19 (0.08-0.42) O. 11 (0.04-0.29) O O6 (0.02-0.22) O 11 (0.04-0.33)
Predicted Suwival Probability at 1 year
(95% CL)
0.17 (0.06-0.51) 0.10 (0.02-0.47) 0.05 (0.01-0.39) 0.10 (0.02-0.54) O. 1 1 (0.04-0.30) 0.06 (0.01-0.22) 0.03 (0.00.0.16) 0.05 (0.01 -0.28) 0.06 (0.02-0.20) 0.02 (0.00-0.12) 0.01 (0.00-0.0s) 0.02 (0.00-0.18) 0.04 (0.01-0.19) 0.02 (0.00-0.12) 0.00 (0.00-0.07) 0.01 (0.00-0.14) 0.18 (0.06-0.51) 0.10 (0.03-0.43) 0.05 (0.01-0.35) 0.10 (0.02-0.50) O. 1 1 (0.04-0.29) 0.06 (0.02-0.19) 0.03 (0.01 -0.13) 0.05 (0.01-0.24) 0.06 (0.02-0.18) 0.02 (0.01-0.09) 0.01 (0.00-0 05) 0.02 (0.00-0.14) 0.04 (0.01-0.20) 0.02 (0.00-0.10) 0.00 (0.00-0.06) 0.01 (0.00-0.12)
Median Survival in
weeks (95% Cl) 19 (8-31) 15 (6-26) 12 (4-19) 14 (5-26) 15 (9-21) 1 2 (7-1 7) 10 (5-14) 12 (6-19) 12 (7-16) 9 (6-13) 7 (4-1 1) 9 (5- 1 4) 11 (6-16) 8 (5-13) 7 (3-10) 8 (4-13) 19 (8-31) 15 (6-25) 12 (5-1 9) 14 (5-26) 15 (9-21) 12 (7-16) 10 (6-1 3) 12 (6-18) 12 (7-16) 9 (6-13) 7 (5-10) 9 (5-13) 11 (6-16) 8 (5-1 2) 7 (4-10) 8 (5-13)
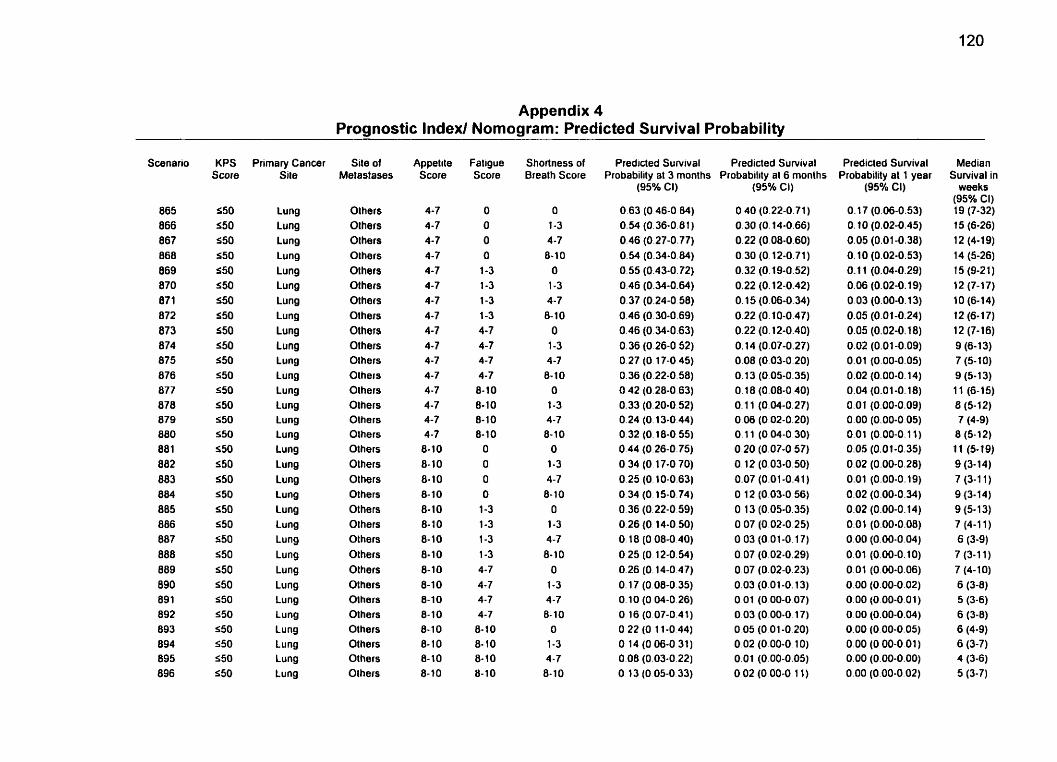
Appendix 4 Prognostic Index1 Nomogram: Predicted Survival Probability
-
KPS Score
550 S50 550 S50 550 550 550 S50 550 S50 550 550 550 550 550 550 S50 550 S50 550 550 550 550 550 550 S50 550 550 S50 550 550 550
Primary Cancer Site
Lung Lung Lung Lung Lung Lung Lung Lung Lung Lung Lung Lung Lung Lung Lung Lung Lung Lung Lung Lung Lung Lung Lung Lung Lung Lung Lu ng Lung Lung Lung Lung Lung
Site of Metastases
Olhers Olhers Olhers Olhers Olhers Others Olhers Olhers Olhers Olhers Others Olhers Olhers Olhers Others Olhers Others Others Others Others Others Olhers Others Olhers Olhers Others Olhers Olhers Olhers Olhers Olhers Others
Appelite Score
4-7 4-7 4-7 4-7 4-7 4-7 4-7 4-7 4-7 4-7 4-7 4-7 4-7 4-7 4-7 4 -7 8-10 8-10 8-10 8-10 8- 10 8- 1 O 8-10 8-10 8-10 8-10 8-10 8-10 8-10 8- 10 8-10 8- 10
Fatigue Score
O O O O 1-3 1-3 1-3 1-3 4-7 4-7 4-7 4-7 8- 10 8- 10 8-10 8- 1 O O O O O 1-3 1-3 1-3 1-3 4-7 4-7 4-7 4 -7 8- 10 8-10 8-10 8-1 O
Shortness of Breath Score
O 1-3 4 -7 8-10 O 1-3 4-7 8-10 O 1-3 4 -7 8- 10 O 1-3 4-7 8-10 O 1-3 4-7 8- 1 O O 1-3 4-7 8-10 O 1-3 4-7 8-10 O 1-3 4-7 8-10
Predicled Survival Predicted Survival Probability at 3 months Probability at 6 monlhs
(95% Cl)
O 63 (O 46-0 84) 0.H (0.36-0.61 )
0.46 (0.27-0.77) 0.54 (0.34-0 84) 0.55 (0.43-0.72) 0.46 (0.34-0.64) 0.37 (0.24-0 58) 0.46 (0.30-0.69) 0.46 (0.34-0.63) 0.36 (0.26-0 52) O. 27 (O 1 7-0 45) 0.36 (0.22-0.58) O 42 (0.28-0.63) 0.33 (0.20-0.52) 0.24 (O. 13-0.44) 0.32 (O. 18-0 55) 0.44 (0.26-0.75) O 34 (O 17-0 70) 0.25 (O. 10-0.63) 0.34 (0.15-0.74) O 36 (O 22-0.59) O 26 (O 14-0.50) O 18 (O 08-0 40) O 25 (O 12-0.54) 0.26 (0.14-0.47) O. 17 (0.08-0.35) O. 10 (O 04-0.26) O 16 (O 07-0.41) O 22 (O 1 1-0.44) O 14 (O 06-0 31) 0.08 (0.03-0.22) O 13 (O 05-0 33)
(95% Cl)
O 40 (0.22-0.71 )
0.30 (O. 14-0.66) 0.22 (0.08-0.60) 0.30 (O. 12-0.71) 0.32 (0.19-0.52) 0.22 (0.12-0.42) O. 15 (0.06-0.34) 0.22 (0.10-0.47) 0.22 (0.12-0.40) O. 14 (0.07-0.27) 0.08 (0.03-0.20) O. 13 (0.05-0.35) O. 18 (0.08-0 40) O. 1 1 (0.04-0.27) 0.06 (0.02-0.20) 0.1 1 (0.04-0.30) 0.20 (0.07-0 57) 0.12 (0.03-0.50) 0.07 (0.01 -0.41 ) 0 12 (0.03-0 56) O 13 (0.05-0.35) O 07 (0.02-0 25) 0 03 (0.01-0.17) O 07 (0.02-0.29) 0.07 (0.02-0.23) 0.03 (0.01 -0.13) O 01 (O 00-0 07) O 03 (O 00-0.1 7) O 05 (O O1 -0.20) O 02 (0.00-0 1 O) 0.01 (0.00-0.05) O 02 (O 00-0 11)
Predicted Survival Probability al 1 year
(95% CI)
O. 17 (0.06-0.53) O. 10 (0.02-0.45) 0.05 (0.01-0.38) O. 10 (0.02-0.53) O. 1 1 (0.04-0.29) 0.06 (0.02-0.19) 0.03 (0.00-0.13) 0.05 (0.01-0.24) 0.05 (0.02-0.18) 0.02 (0.01-0.09) 0.01 (0.00-0.05) 0.02 (0.00-0.14) 0.04 (0.01-0.18) 0.01 (0.00-0.09) 0.00 (0.00-0 05) 0.01 (0.00-0,ll) 0.05 (0.01-0.35) 0.02 (0.00-0.28) 0.01 (0.00-0.19) 0.02 (0.00-0.34) 0.02 (0.00-0.14) 0.01 (0.00-0.08) 0.00 (0.00-0.04) 0.01 (0.00-0.10) 0.01 (0.00-0.06) 0.00 (0.00-0.02) 0.00 (0.00-0.01) 0.00 (0.00-0.04) 0.00 (0.00-0.05) 0.00 (0.00-0.01 )
0.00 (0.00-0.00) 0.00 (0.00-0.02)
Median Survival in
weeks (95% CI) 19 (7-32) 15 (6-26) 12 (4-1 9) 14 (5-26) 15 (9-21) 12 (7-17) 10 (6-14) 12 (6-17) 12 (7-16) 9 (6-13) 7 (5- 10) 9 (5- 1 3) 1 1 (6-15) 8 (5-1 2) 7 (4-9) 8 (5-1 2) 1 1 (5-19) 9 (3- 14) 7 (3-1 1) 9 (3-14) 9 (5-1 3) 7 (4-1 1) 6 (3-9) 7 (3-1 1) 7 (4-10) 6 (3-8) 5 (3-6) 6 (3-8) 6 (4-9) 6 (3-7) 4 (3-6) 5 (3-7)
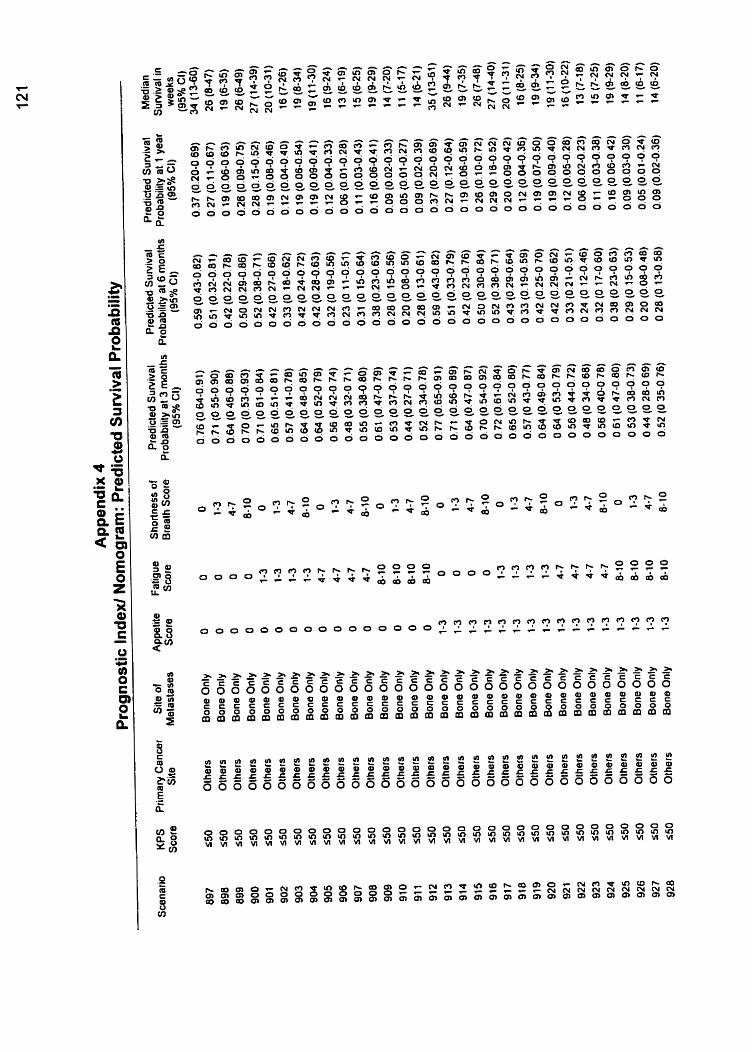

Appendix 4 Prognostic Index/ Nomogram: Predicted Suwival Probability
KPS Score
550 550 550 550 550 550 S50 550 550 S50 550 550 550 550 550 S50 550 S50 550 550 550 S50 S50 S50 550 550 S50 550 550 550 S50 550
Primary Cancer Site
Others Others Others Others Olhers Others Olhers Olhers Others Olhers Olhers Olhers Others Others Others Others Others Others Others Others Olhers Others Olhers Others Olhers Olhers Others Others Others Others Others Olhers
Site of Met aslases
Bone Only Bone Only Bone Only Bone Only Bone Only Bone Only Bone Only Bone Only Bone Only Bone Only Bone Only Bone Only Bone Only Bone Only Bone Only Bone Only Bone Only Bone Only Bone Only Bone Only Bone Only Bone Only Bone Only Bone Only Bone Only Bone Only Bone Only Bone Only Bone Only Bone Only Bone Only Bone Only
Appetile Score
4-7 4-7 4-7 4-7 4-7 4-7 4-7 4-7 4-7 4-7 4-7 4-7 4-7 4-7 4-7 4-7 8- 1 O 8-10 8-10 8-10 8-1 O 8-10 8- 1 O 8-10 8-10 8-10 8-10 8- 10 8-10 8-10 8- 10 8-10
Fatigue Score
O O O O
1-3 1-3 1-3 1-3 4-7 4-7 4-7 4-7 8-10 8-10 8-10 8-10
O O O O
1-3 1-3 1-3 1-3 4-7 4-7 4-7 4-7 8-10 8-10 8-10 8-10
ShoRness of Breath Score
O 1-3 4-7 8-10
O 1-3 4 -7 8-10
O
1-3 4-7 8-10
O 1-3 4-7 8- 10
O 1-3 4-7 8-10
O 1-3 4-7 8-10
O 1-3 4-7 8-10
O 1-3 4-7 8- 10
Predicted Survival Predicted Survival Probability al 3 monlhs Probability at 6 monlhs
(95% CI)
O 76 (O 64-0 9 1 ) O 7 O (O 56-0 89) O 64 (O 46-0 88) O 70 (O 53-0 92) O 71 (O 61-0 84) O 64 (O 52-0 79) O 57 (O 43.0 76) O 64 (O 49-0 83) O 64 (O 53-0 77) O 56 (O 45-0 70) O 47 (O 34-0 67) O 55 (O 40-0 77) O 61 (O 48-0 78) O 52 (O 39-0 7 1 ) O 44 (O 29-0 66) O 52 (O 36-0 74) O 62 (O 46-0 85) O 54 (O 36-0 82) O 46 (O 26-0 79) O 53 (O 33-0 86) O 55 (O 4 1 -0 74) O 46 (O 31 -0 68) O 37 (O 22-0 62) O 46 (O 28-0 73) O 46 (O 32-0 65) O 36 (O 24-0 56) O 27 (O 15-0 49) O 35 (O 20-0 63) O 42 (O 28-0 63) O 32 (O 20-0 53) O 23 (O 12-0 46) O 32 (O 17-0 57)
(95% Ci)
0.59 (0.42-0.83) 0.50 (0.32-0.80) 0.42 (0.22-0.77) 0.50 (0.29-0.85) 0.52 (0.38-0.70) O 42 (O 29-0.63) 0.33 (0.19-0.58) 0.42 (0.25-0.69) 0.42 (0.29-0.60) 0.32 (0.21-0.50) 0.23 (0.12-0.45) 0.31 (0.17-0.59) 0.38 (0.24-0.60) 0.28 (O 16-0 50) 0.20 (O 09-0.44) 0.28 (O. 14-0.55) 0.40 (0.22-0 72) 0.30 (O. 13-0.68) 0.21 (0.07-0.62) O 29 (O. 12-0.74) 0.31 (0.18-0.56) 0.22 (O. 10-0.47) 0.14 (0.05-0.39) 0.21 (O 09-0.54) O 22 (O. 1 1-0.43) 0.14 (0.06-0.32) 0.08 (0.02-0.25) 0.13 (0.04-0.41) O 18 (0 08-0.40) O. 1 1 (0.04-0.29) 0.06 (0.02-0.22) O. 10 (O 03-0 33)
Predicted Survival Probability al 1 year
(95% CI)
0.36 (O. 19-0.69) 0.27 (O. 1 1-0.64) 0. 19 (0.06-0.60) 0.26 (0.09-0.73) 0.28 (O. 16-0.50) O. 19 (0.09-0.41) O. 12 (0.04-0.35) O. 19 (0.07-0.49) O. 19 (0.09-0.38) O. 1 1 (0.05-0.26) o. os (O. 02-0.22) O. 1 1 (0.03-0.37) O. 16 (0.06-0.38) 0.09 (0.03-0.27) 0.05 (0.01-0.21) 0.08 (0.02-0.33) 0.17 (0.05-0.54) O. 10 (0.02-0.48) 0.05 (0.01-0.4 1) O. 10 (0.02-0.58) O. 1 1 (0.04-0.33) 0.06 (0.01-0.24) 0.02 (0.00-0.18) 0.05 (0.01-0.31) 0.05 (0.01-0.21) 0.02 (0.00-0.12) O 01 (0.00-0.08) 0.02 (0.00-0.19) O 04 (0.01-0.18) 0.01 (0.00-0.10) 0.00 (0.00-0.06) 0.01 (0.00-0.13)
Median Suwival in
weeks (95% Cl)
34 (13-61) 26 (9-45) 19 (6-35) 26 (6-48) 27 (14-39) 20 (1 1-30) 16 (8-25) 19 (9-33)
19 (1 2-29) 1 5 (1 0-20) 13 (7-18) 15 (7-23) 18 (10-27) 14 (8-20) 1 1 (6-16) 14 (7-20) 19 (7-32) 14 (6-25) 12 (4-1 9) 14 (4-26) 15 (8-22) 12 (6-18) 9 (5-14) 12 (5-19) 12 (7-17) 9 (6- 1 3) 7 (4-1 1) 9 (5-14) 11 (6-15) 8 (5-12) 7 (4-10) 8 (4- 13)
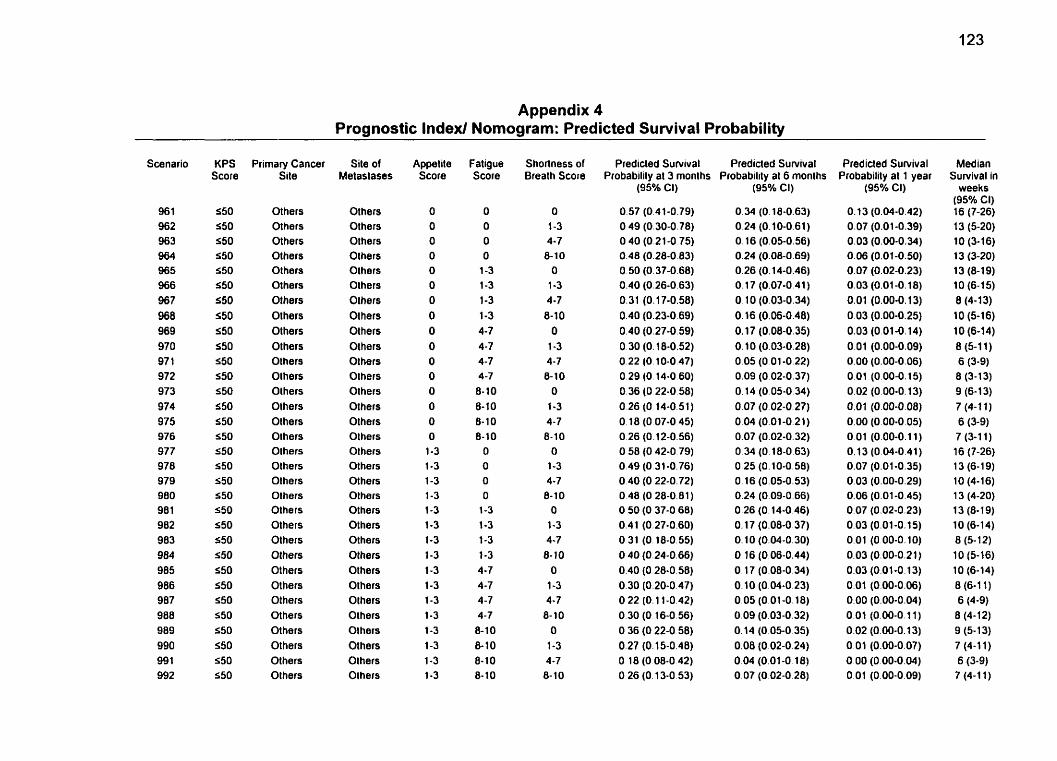
Appendix 4 Prognostic Index1 Nomogram: Predicted Survival Probability
Scenario
96 1 962 963 964 965 966 967 968 969 970 97 1 972 973 974 975 976 977 978 979 980 98 1 982 983 984 985 986 987 988 989 990 99 1 992
KPS Score
550 S50 S50 550 550 S50 550 550 550 550 550 550 550 550 550 550 S50 550 550 550 S50 550 550 550 550 550 550 550 550 550 550 550
Primary Cancer Site
Others Others Others Others Others Others Others Others Others Others Olhers Olhers Olhers Others Others Olhers Others Olhers Olhers Olhers Olhers Others Others Others Others Others Others Others Others Others Others Olhers
Site of Melaslases
Olhers Olhers Olhers Others Others Others Olhers Olhers Others Others Others Others Others Others Others Others Olhers Others Others Others Others Others Others OIhers Olhers Olhers Olhers Olhers Olhers Others Olhers Olhers
Appetite Score
O O O O O O O O O O O O O O
O O
1-3 1-3 1-3 1-3 1-3 1-3 1-3 1-3 1-3 1-3 1-3 1-3 1-3 1-3 1-3 1-3
Fatigue Score
O O O O
1-3 1-3 1-3 1-3 4-7 4-7 4-7 4-7 8- 10 8-10 8-10 8-10
O O
O O
1-3 1-3 1-3 1-3 4-7 4-7 4-7 4-7 8-10 8- 10 8- 1 O 8-10
Shortness of Breath Score
O 1-3 4-7 8-10
O 1-3 4-7 8-10
O 1-3 4-7 8-10
O 1-3 4-7 8-10
O 1-3 4-7 8-10
O 1-3 4-7 8-10
O 1-3 4-7
8- 10 O
1-3 4-7 8- 10
Predicled Survival Predicted Survival Probabilily al 3 monlhs Probability at 6 monlhs
(95% CI)
0.57 (0.41-0.79) O 49 (0.30-0.78) O 40 (0.21-0.75) 0.48 (0.28-0.83) O 50 (0.37-0.68) 0.40 (0.26-0.63) 0.31 (0.1 7-0.58) 0.40 (0.23-0.69) 0.40 (0.27-0.59) 0.30 (0.18-0.52) 0.22 (O. 10-0.47) 0.29 (O. 14-0.60) 0.36 (O 22-0.58) O 26 (O 14-0.51) O. 1 8 (O 07-0 45) O 26 (0.12-0.56) O 58 (O 42-0 79) 0.49 (0.31-0.76) O 40 (O 22-0.72) O 48 (O 28-0.81) O 50 (O 37-0.68) 0.41 (0.27-0.60) O 31 (O. 18-0.55) O 40 (0.24-0.66) 0.40 (O 28-0.58) 0.30 (0.20-0.47) O 22 (O. 1 1-0.42) 0.30 (O. 16-0.56) O 36 (O 22-0 58) 0.27 (O. 15-0.48) O 18 (O 08-0 42) O 26 (O. 13-0 53)
(95% Ci)
0.34 (O. 18-0.63) 0.24 (0.10-0.61) 0.16 (0.05-0.56) 0.24 (0.08-0.69) 0.26 (O. 14-0.46) 0.17 (0.07-0.41 ) O. 1 O (0.03-0.34) O. 16 (0.06-0.48) O. 17 (0.08-0.35) O. 10 (0.03-0.28) 0.05 (O 01 -0.22) 0.09 (0.02-0.37) O. 14 (O 05-0.34) 0.07 (0.02-0.27) 0.04 (0.01-0.21) 0.07 (0.02-0.32) 0.34 (O 18-0.63) O 25 (0.10-0.58) 0.16 (0.05-0.53) 0.24 (0.09-0.66) 0.26 (0.14-0.46) O. 17 (0.08-0.37) O. 1 O (0.04-0.30) O 16 (0.06-0.44) O. 17 (0.08-0.34) 0.10 (0.04-0.23) 0.05 (0.01-0.18) 0.09 (0.03-0.32) O. 14 (O 05-0 35) 0.08 (0.02-0.24) O 04 (0.01-0.18) O 07 (0.02-0.28)
Predicted Survival Probability al 1 year
(95% CI)
Median Survival in
weeks (95% CI) 16 (7-26) 13 (5-20) 10 (3-16) 13 (3-20) 13 (8-19) 10 (6-1 5) 8 (4-13) 10 (5-16) 10 (6-14) 8 (5-1 1) 6 (3-9) 8 (3-13) 9 (6- 1 3) 7 (4-1 1) 6 (3-9) 7 (3-1 1) 16 (7-26) 13 (6-1 9) 10 (4-16) 13 (4-20) 13 (8-19) 10 (6-14) 8 (5- 12) 1 O (5-16) 10 (6-14) 0 (6-1 1) 6 (4-9) 8 (4-1 2) 9 (5-1 3) 7 (4-1 1) 6 (3-9) 7 (4-1 1)
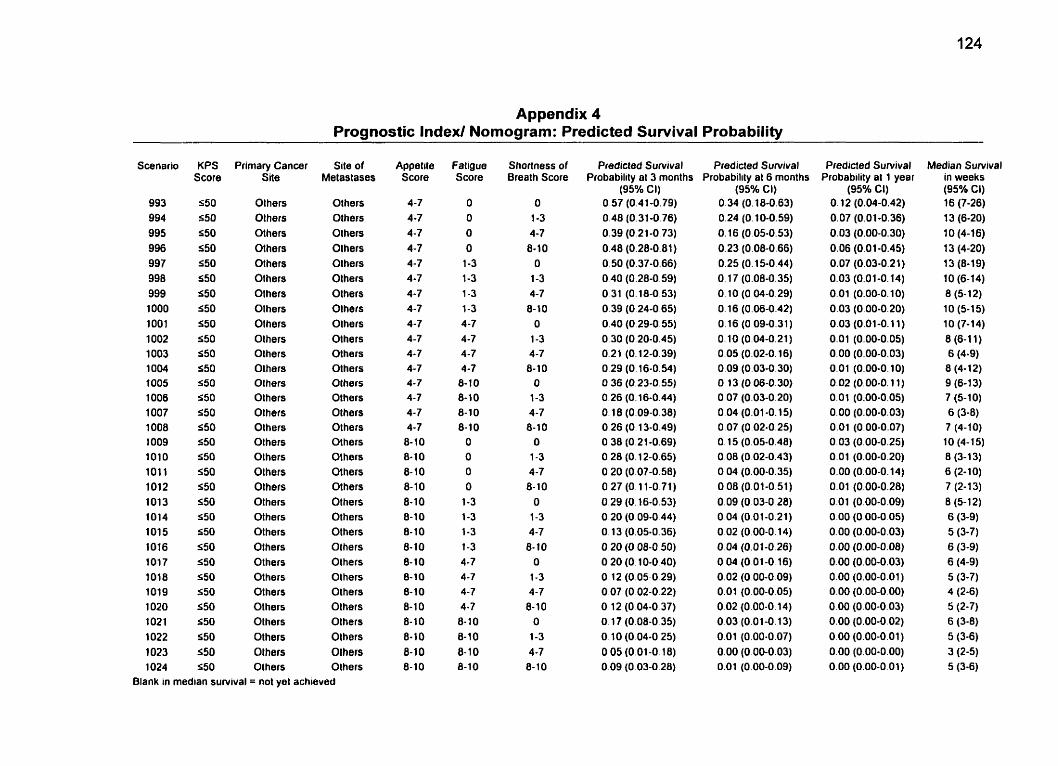
Appendix 4 Prognostic Index/ Nomogram: Predicted Survival Probability
KPS Score
550 550 S50 550 550 550 S50 550 550 550 S50 550 550 550 550 $50 550 550 550 $50 550 550 $50 550 550 550 550 550 S50 550 S50 S50
Primary Cancer Site
Olhers Olhers Others Others Others Others Others Others Others Others Others Others Others Others Olhers Others Others Olhers Others Others Others Others Others Others Others Others Others Others Others Olhers Olhers Olhers
Site of Metaslases
Olhers Others Olhers Olhers Olhers Olhers Olhers Olhers Olhers Olhers Others Olhers Others Olhers Others Others Others Others Others Others Others Others Others Others Others Others Others Others Others Others Olhers Olhers
Blank in median survival = no1 yet achieved
Appetite Score
4-7 4-7 4-7 4-7 4-7 4 -7 4-7 4-7 4-7 4-7 4-7 4-7 4-7 4-7 4-7 4-7 8-10 8-10 8-10 8-10 8-10 8-10 8- 10 8-10 8- 10 8-10 8- 10 8-10 8- 1 O 8-10 8- 10 8- 1 O
Fatigue Score
O O O O
1-3 1-3 1-3 1-3 4-7 4-7 4-7 4-7 8- 1 O 8-10 8-10 8-10
O O O O
1-3 1-3 1-3 1-3 4-7 4 -7 4-7 4-7 8- 1 O 8- 1 O 8- 1 O 8-10
Shortness of Breath Score
O
1-3 4-7 8-10
O 1-3 4-7 8- 1 O
O 1-3 4-7 8-10
O
1-3 4-7 8-10
O 1-3 4-7 8- 1 O
O 1-3 4-7 8-10
O
1-3 4-7
8- 1 O O 1-3 4-7 8- 1 O
Predicted Survival Predicted Survival Probability al 3 months Probability al 6 months
(95% Ci) 0.57 (0.41-0.79) 0.48 (0.31-0.76) 0.39 (0.21-0.73) 0.48 (0.28-0.81) O 50 (0.37-0.66) O 40 (0.28-0.59) O 31 (0.18-0.53) 0.39 (O 24-0.65) 0.40 (0.29-0.55) O 30 (0.20-0.45) 0.21 (0.12-0.39) 0.29 (O. 16-0.54) O 36 (0.23-0 55) 0.26 (0.16-0.44) O. 18 (0.09-0.38) O 26 (0.1 3-0.49) O 38 (0.21-0.69) 0.28 (0.1 2-0.65) O 20 (0.07-0.58) O 27 (0.11-0.71) O 29 (O. 16-0.53) O 20 (O 09-0 44) O. 13 (0.05-0.36) O 20 (O 08-0.50) O 20 (O. 10-0.40) O. 12 (0.05-0.29) 0.07 (0.02-0.22) O 12 (O 04-0.37) o. 17 (0.08-0.35) O 10 (O 04-0 25) O O5 (O O1 -0.18) O 09 (O 03-0.28)
(95% Ci) 0.34 (O. 18-0.63) 0.24 (0.10-0.59) 0.16 (O 05-0.53) 0.23 (0.08-0.66) 0.25 (0.15-0.44) O. 17 (0.08-0.35) O. 10 (O 04-0.29) 0.16 (0.06-0.42) 0.16 (0 09-0.31) 0.10 (0.04-0.21) 0.05 (0.02-0.16) 0.09 (0.03-0.30) O 13 (0.06-0.30) O 07 (0.03-0.20) 0.04 (0.01 -0.15) 0.07 (0.02-0.25) O. 15 (0.05-0.48) 0.08 (0.02-0.43) O 04 (0.00-0.35) 0.08 (0.01-0.51) 0.09 (0.03-0 28) O 04 (0.01-0.21) O 02 (0.00-0.14) O 04 (0.01-0.26) O O4 (O 01-0.16) 0.02 (O 00-0.09) 0.01 (0.00-0.05) 0.02 (0.00-0.14) 0.03 (0.01-0.13) 0.01 (0.00-0.07) 0.00 (0.00-0.03) 0.01 (0.00-0.09)
Predicted Survival Probability at 1 year
(95% CI) O. 12 (0.04-0.42) 0.07 (0.01-0.36) 0.03 (0.00-0.30) 0.06 (0.01-0.45) 0.07 (0.03-0.21) 0.03 (0.01-0.14) 0.01 (0.00-0.1 O) 0.03 (0.00-0.20) 0.03 (0.01-0.1 1) 0.01 (0.00-0.05) 0.00 (0.00-0.03) 0.01 (0.00-0.10) 0.02 (0.00-0.1 1) 0.01 (0.00-0.05) 0.00 (0.00-0.03) 0.01 (0.00-0.07) 0.03 (0.00-0.25) 0.01 (0.00-0.20) 0.00 (0.00-0.14) 0.01 (0.00-0.28) 0.01 (0.00-0.09) 0.00 (O 00-0.05) 0.00 (0.00-0.03) 0.00 (0.00-0.08) 0.00 (0.00-0.03) 0.00 (0.00-0.01 ) 0.00 (0.00-0.00) 0.00 (0.00-0.03) 0.00 (0.00-0.02) 0.00 (0.00-0.01) 0.00 (0.00-0.00) 0.00 (0.00-0.01)
Median Survival in weeks (95% Cl) 16 (7-26) 13 (6-20) 10 (4-16) 13 (4-20) 13 (8-19) 10 (6-14) 8 (5- 12) 10 (5-15) 10 (7-14) 8 (6-1 1) 6 (4-9) 8 (4- 1 2) 9 (6-13) 7 (5-1 0) 6 (3-8) 7 (4-10) 10 (4-15) 8 (3-1 3) 6 (2-10) 7 (2-1 3) 8 (5-12) 6 (3-9) 5 (3-7) 6 (3-9) 6 (4-9) 5 (3-7) 4 (2-6) 5 (2-7) 6 (3-8)
5 (3-6) 3 (2-5) 5 (3-6)

Ethics Amroval
R a r u d i E M M
Sunnyûrwk Campus
m Rucarch BuIIdlng
2075 ùavvkw Avenue
R o m 51 33
Toronto. ~w
Car~cla M4U 3M5
Tel 41648W276
F u $16.4603814
iKl3MORANDUM
Dr. E. Chow To: Radiation Oacology TSRCC
From: Philip Hébert MD
Date: December 20,2000
Subject: A Predictive Mode1 for Survival in Metastatic Cancer Patients Attendiag an Out Patient Palliative Radiotberapy Clin ic
Praject Identr@cation Number: 41 8-2000 Appruval Date: Deceder 20.2000
The Research Ethics Board o f Sunnybrook & Wornen's Collegt Health Sciences Centre has conducted a review of the research protocol referenced above on the above captioned date and approved the involvement of human subjccts as specificd in the protocol.
The quonun for approval did not involve any member associateci with this projcct.
The Research Ethics Board has procedures and responsibiiities that are in accordancc with the ICH Guidelines for Good Clinical Practicc.
ShouId your study continue for more than one year you must request a mewai on or beforc one ycar ftom the approval date. Pleasc advise the Board of the progress of your rcsearch annually and/or any adverse =actions or deviations which may occur in the hm.
t identification number has been assignecl to your study. s number on a11 htum correspondence.
/bhil&R6bcrt, MD., PhD., CCFP (C ) r Research Ethics Board w
@ Sunqbrook and Wamen's College Heiîth SCienCtS Centre ~hiprr ~ulty OffrIImH wj#h u ~ l w r n y ~ f Tommm
References
1. Maher EJ. How long have l got doctor? Eur J Cancer 1994; 3:283-284
2. Lamont E, Christakis NA. Some elements of prognosis in terminal cancer. Oncology 1999; 1 3: 1 165-1 170
3. Parkes CM. Accuracy of predictions of survival in later stages of cancer. BMJ 197 2; 2:29-31
4. Heyse-Moore LH, Johnson-Bell VE. Can doctors accurately predict the life expectancy of patients with terminal cancer? Palliative Medicine 1987; 1 :165- i 66
5. National Hospice Organization (NHO) Newsline. 1992 Stats show continued growth in programs and patients. NHO Newsline 1993;3: 1-2
6. Demer Cl Johnston-Anderson AV, Tobin R, et al. Cost of hospice care: late versus early entry (abstract). Proc Am Soc Clin Oncol l992;ll:392
7. Addington-Hall JM, MacDonald LD. Anderson HR. Can the Spitzer quality of life index help to reduce prognostic uncertainty in terminal care? Br J Cancer 1990; 621695-699
8. Klastersky JI Daneau D, Verhest A. Causes of death in patients with cancer. Eur J Cancer 1972; 8:l49-l54
9. Weeks JC, Cook EF. O'Day SJ, et al. Relationship between cancer patients' predictions of prognosis and their treatment preferences. JAMA 1998; 279: 1709- 1714
10. Reuben DB, Mor V, Hins J. Clinical symptoms and length of survival in patients with terrninal cancer. Arch lntern Med 1988; 148: 1586-1 591
11 Jamburini M. BruneIli C, Rosso S, et ai. Prognostic value of quality of life scores in terminal cancer patients. J Pain Symptom Manage 1996; 1 :3241
l2.Maltoni Ml Pirovano M, Nanni 0, et al. Biological indices predictive of survival in 519 îtalian terminally il1 cancer patients. J Pain Symptom Manage 1997; 13:l-9
13. den Daas. N. Estimating length of survival in end-stage cancer: A review of the literature. J Pain Symptom Manage 1995; 1 O:548-555
14.Chow E, Harth T, Hruby G, et al. How accurate are physicians' clinical prediction of survival and the available prognostic tools in estimating survival times in terminally il1 cancer patients? Clinical Oncology (In Press)
15.Vigano A, Dorgan M, Buckingham J, et al. Survival prediction in terminal cancer patients: a systematic review of the medical literature. Palliative Medicine 2000; 14: 363-374
16. Evans C, McCarthy M. Prognostic uncertainty in terminal care: Can the Karnofsky index help? Lancet 1985; 1204-1 206
17. Forster LE, Lynn J. Predicting life span for applicants to inpatient hospice. Arch l ntern Med 1 988; l48:2540-2%3
18. Bruera E, Miller MJ, Kuehn N, et al. Estimate of survival of patients admitted to a palliative care unit: a prospective study. J Pain Symptom Manage 1992; 7:82-86
19. Maltoni M. Nanni O, Derni S, et al. Clinical prediction of survival is more accurate than the Karnofsky Performance Status in estimating life span of terminally il1 cancer patients. Eur J Cancer 1994; 6:761-766
20. Maltoni Mi Pirovano M, Scarpi E, et al. Prediction of survival of patients terminally il1 with cancer. Cancer 1995; 75:2613-2622
21. Mackillop WJ, Quirt CF. Measuring the accuracy of prognostic judgements in Oncology. J Clin Epidemiol 1997; 50:21-29
22. Oxenham D, Cornbleet MA. Accuracy of prediction of survival by different professional groups in a hospice. Palliative Medicine 1998; 121 17-1 18
23.Vigano A, Dorgan M. Bruera E, et al. The relative accuracy of the clinical estimation of the duration of life for patients with end of life cancer. Cancer 1999; 86: 170-1 76
24.Christakis NA, Larnont EB. Extent and determinants of error in doctors' prognoses in terminally il1 patients: prospective cohort study. BMJ 2000 1 W69- 473
25.Yates JW, Chalmer B, McKegney FP. Evaluation of patients with advanced cancer using the Karnofsky Performance Status. Cancer 1980; 452220-2224
26. Mor V, Laliberte L, Morris JN, et al. The Karnofsky Performance Status Scale: an examination of its reliabiliity and validity in a research setting. Cancer 1984; 5312002-2007
27.Schonwetter RS, Teasdale TA, Storey P, et al. Estimation of survival time in terminal cancer patients: an impedance to hospice admissions? Hosp J 1990; 6:65-79
28. Ventafridda V, Ripamonti C, Tamburini M, et al. Unendurable symptoms as prognostic indicators of impending death in terminal cancer patients. Eur J Cancer 1990; 26: 1000-1 001
29.Grabowski CM, Unger JA, Potish RA. Factors predictive of completion of treatment and survival after palliative radiation therapy. Radiology 1992; 184:329-332
30,Tsamandouraki K, Tountas Y, Trichopoulos D. Relative suwival of terminal cancer patients in home versus hospital care. Scan J Soc Med 1992; 2051-54
31. Rosenthal MA, Gebski VJ, Kefford RF, et al. Prediction of life-expectancy in hospice patients: identification of novel prognostic factor. Palliative Medicine 1993; 7: 199-204
32. Hardy JR, Turner R, Saunders Ml et al. Prediction of suwival in a hospital-based continuing care unit. Eur J Cancer 1994; 3:284-288
33.AIlard P. Dionne A, Potvin D. Factors associated with length of survival among 1081 terminally il1 cancer patients. J Palliative Care 1995; 1 1 :20-24
34. Morita Tl Tsunoda J, houe S, et al. The palliative prognostic index: a scoring system for survival prediction of terminally il1 cancer patients. Support Care Cancer 1999; 7:128-133
35. Pirovano M, Maltoni MI Nanni O, et al. A New Palliative Prognostic Score: A first step for the staging of terminally il1 cancer patients . J Pain Symptom Manage 1999, l7:231-239
36. Harrell FE Jr, Lee KL, Matchar DB, et al. Regression models for prognostic prediction: advantages, problems, and suggested solutions. Cancer Treat Rep. 1985; 69:1071-IO77
37. Harrell F. The PHGLM procedure . In: SUGl Supplemental Library User's Guide. Cary , North Carolina: SAS lnstitute lnc.;I 983; 267-294
38.Concato JI Feinstein A, Holford 1. The risk of determining risk with multivariable models. Ann Int Med 1993; 11 8:2Of -21 0
39. Efron B, Gong G. An leisurely look at the bootstrap, the jackknife, and cross- validation. American Statistician. 1 983;37:36-48.
40.Maltoni M, Nanni O, Pirovano Ml et al: Successful validation of the patients prognostic score in terminally il1 cancer patients. ltalian multicentre study group on palliative care. J Pain Symptom Manage 1999; l7:240-247
41. Karnofsky DA, Abelmann WH, Craver LF, et al. The use of nitrogen mustards in the palliative treatment of cancer. Cancer 1948; 1 :634-656
42. Karnofsky DA, Burchenal JH. The clinical evaluation of chernotherapeutic agents in cancer. In: Macleod CM, ed. Evaluation of Chemotherapeutic Agents. New York: Columbia University Press 1949; 191 -205
43. Madsen EL. Painful bone metastasis: efficacy of radiotherapy assessed by the patients; a randomized trial comparing 4 Gy x 6 versus 10 Gy x 2. Int J Radiat Oncol Biol Phys 1983;g: 1775-1 779
44. Barak F, Werner A, Walach NI Horn Y. The palliative efficacy of a single high dose of radiation in treatment of symptomatic osseous metastases. Int J Radiat Oncol Bi01 Phys l987;13:I 233-1 235
45. Hoskin PJ, Price P. Easton Dl et al. A prospective randomized trial of 4 Gy or 8 Gy single doses in treatment of metastatic bone pain. Radiother Oncol 1992;23:74-78
46. Rasmusson 6, Vejborg Il Jensen AB, et al. Irradiation of bone metastases in breast cancer patients: A randomized study with 1 year follow-up. Radiother Oncol 199334: 179-1 84
47.Gaze MN, Kelly CG, Ken GR, et al. Pain relief and quality of life following radiotherapy for bone metastases: a randomized trial of two fractionation schedules. Radiother Oncol l997;45:lO9-ll6
48. Jeremic B, Shibomoto Y, Acimovic L, et al. A randomized trial of three single- dose radiation therapy regimens in the treatment of metastatic bone pain. Int J Radiat Oncol Biol Phys l998;42:l6l-l67
49. Nielsen OS, Bentzen SM, Sand berg E, et al. Randomized trial of single dose versus fractionated palliative radiotherapy of bone metastases. Radiother Oncol 1998;47:233-240
50. On behalf of the Bone Pain Trial Working Party. 8 Gy single fraction radiotherapy for the treatment of metastatic skeletal pain: randomised cornparison with a multifraction schedule over 12 months of patient follow-up. Radiother Oncol 1 999;52: 1 1 1 -1 21
51. Steenland El Leer JI van Houwelingen Hl et al. The effect of single fraction compared to multiple fractions on painful bone metastases: a global analysis of the Dutch Bone Metastasis Study. Radiother Oncol 1 999;52:lOI-l09
52.Price P. Hoskin PJ, Easton Dl et al. Prospective randomized trial of single and multifraction radiotherapy schedules in the treatment of painful bony metastases. Radiother Oncol 1986;6:247-255
53. Okawa Tl Kita M, Goto M. et al. Randomized prospective clinical trial of small, large and twice-a-day fraction radiotherapy for painful bone metastases. Radiother Oncol 1 988; 1 3:99-1 O4
54.Kagei K. Suyuki K, Sherato Hl et al. Prospective randomized trial of single high dose versus multiple fraction radiation therapy for the treatment of bone metastasis. Gan No Rinsho l990;36:2553-2558
55. Niewald M, Tkocz Hl Abel U et al. Rapid course radiation therapy vs. more standard treatment: a randomized trial for bone metastases. Int J Radiat Oncol Bi01 Phys 1996;36:1085-1089
56. George S. Identification and Assessrnent of Prognostic Factors. Semin Oncol 1988; 15: 462 - 471
57. Cox DR. Regression models and life tables. J Statist Soc B. 1972; 34: 187-220
58. Kaplan EL, Meier P. Non parametric estimation from incomplete observations. J Am Stat Assoc 1958; 53: 457481
59. Mantel N. Evaluation of survival data and two new rank order statistics arising in its considerations. Cancer Chemother Rep 1 966; 50: 163-1 70
GO. Collett D. Modelling Survival Data In Medical Research. Chapman and Hall. London. First Edition 1994
61 .The International Non-Hodgkin's Lymphoma Prognostic Factors Project. A predictive mode1 for aggressive Non-Hodgkin's Lymphoma. N Engl J Med 1993; 329: 987-994
62. Christensen E. Multivariate Su~ i va l Analysis Using Cox's Regression Model. Hepatology 1987; 7: 1346-1 358
63. Massacesi Cl Norman A, Pnce Tl et al. A clinical nomogram for predicting long- term survival in advanced colorectal cancer. Eur J Cancer 2000; 36: 2044-2052
64.Schuchter LI Schultz DJ, Synnestvedt M. et al. A prognostic model for predicting 10-year survival in patients with primary melanoma. Ann lntern Med 1996; 125: 369-375
65. Harrell F, Lee K, Mark D. Multivariable prognostic models: issues in developing models. evaluating assumptions and adequacy, and measuring and reducing errors. Statistics in Medicine 1996; 15: 361 -387.
66. Marubini El Valsecchi MG. Analyzing survival data for clinical trials and observational studies. John Wtley & Son Ltd. 1996 England
67.SAS lnstitute Inc. SASISTAT User's Guide, version 8. Cary. NC: SAS Institute.
68.Christakis NA, Escarce JJ. Survival of Medicare patients after enrollment in hospice programs. N Eng J Med 1996; 335: 172-1 78
69. Christakis NA. Predicting survival before and after hospice enrollment. Hospice J 1998; 13: 71-78
70. Schonwetter RI Jani CR. Survival estimation in non-cancer patients with advanced disease. Topics in Palliative Care, volume 4. Edited by Portenoy RK and Bruera E. Oxford University Press 2000
71 .Speer OC. Robinson BE. Reed MP. The relationship between hospice length of stay and caregiver adjustment. Hospice J 1995; 10: 45-58
72.Apgar V. Proposal for new method of evaluation of newborn infant. Anesth Analg 1953; 32: 260-267
73.Apgar VI Holaday DA, James LS. Evaluation of the newborn infant - second report. JAMA 1958; 168: 1985-1 988
74.Teasdale G. Jennett B. Assessment of coma and impaired consciousness. A practical scale. Lancet 1974; 2: 81-84
75.Jennett B. Teasdale G. Aspects of coma after several head injuries. Lancet 1 977; 1 : 878-881
76.Bruet-a E, Kuehn NI Miller M. et al. The Edmonton Symptom Assessment System (ESAS): A simple method for the assessment of palliative care patients. J Palliat Care 1991 ;7:6-9
77. Philip JI Smith WB, Craft P, et al. Concurrent validity of the rnodified Edmonton Symptom Assessment System with the Rotterdam Symptom Checklist and the Brief Pain Inventory. Support Care Cancer l998;6:539-541
78.Chang VT, Hwang SS, Feueman M. Validation of the Edmonton Symptom Assessrnent Scale. Cancer 2000; 88:2164-21 il.
79.Paice JA, Cohen FL. Validity of a verbally administered numeric rating scale to measure cancer pain intensity. &ncer Nursing l997;20:88-93
80.Llobera J, Esteva M, Rifa J, et al. Terminal cancer: duration and prediction of survival time. Eur J Cancer 2000; 36: 2036-2043.
81. Steensma DP, Loprinzi CL. The art and science of prognosis in patients with advanced cancer. Eur J Cancer 2000; 36: 2025-2027.
82.Vigano A, Bruera E, Suarez-Almanzor ME. Terminal cancer syndrome: myth or reality? J Palliat Care 1999; 15: 32-29.
83. Coates A , Porzsolt F and Osoba D. Quality of life in oncology practice: Prognostic value of EORTC QLQ-C3O scores in patients with advanced malignancy. Eur J Cancer 1997;33: 1 025-1 030
84. Loprinzi CL, Laurie JA, Wieand HS, et al. Prospective evaluation of prognostic variables from patient-completed questionnaires. J Clin Oncol 1994; 12: 601 -607
85. Ganz PA, Haskell CM, Figlin RA, et al. Estirnating the quality of life in a clinical trial of patients with metastatic lung cancer using the Karnofsky Performace Status and the functional living index cancer. Cancer 1988; 61: 849-856
86.Coates A, Gebski V, Signorini D, et al. Prognostic value of quality of life scores during chemotherapy for advanced breast cancer. J Clin Oncol 1992; 10: 1833- 1838
87.Ganz PA, Lee JJ, Siau J. Quality of life assessment. An independent prognostic variable for survival in lung cancer. Cancer 1991; 67: 3131-3135
88. Jarvis GK, Northcott HC. Religion and differences in morbidity and rnortality. Social Science and Medicine 1987;25:813-824
89. Phillips DP, Smith DG. Postponement of death until symbolically rneaningful occasions. JAMA 1 990; 263: 1947-1 95 1
90.Schoenbach VJ, Kaplan BH, Fredman L, et al. Social ties and rnortality in Evans County, Georgia. American J of Epidemiology 1986; 123:577-591
91. Spiegel D. Essentials of psychotherapeutic intervention for cancer patients. Support Care Cancer 1995; 3: 252-256
92. Blake-Mortimer J, Gore-Felton C, Kimerling R, et al. lmproving the quality and quantity of life among patients with cancer: a review of the effectiveness of group psychotherapy. Eur J Cancer 1999; 35: 1581 -1 586
93. Spiegel D. Psychosocial aspects of breast cancer treatment. Seminars in Oncology 1997; 24 (Suppl 1): 1-47
94. Phillips DP, King EW. Death takes a holiday: mortality surrounding major social occasions. Lancet 1988; 2: 728-732.
95.Christakis NA. Timing of Referral of Terminally III Patients to an Outpatient Hospice. J of Gen Int Med 1994; 9:314-320
96.Verweij J. The prognosis of prognostic factors in phase I clinical trials (Editorial). Ann Oncol 2000; 1 1 ; 131-1 32
97. Bachelot T, Ray-Coquard 1, Catimel G, et al. Multivariable analysis of prognostic factors for toxicity and survival for patients enrolled in phase I clinical trials. Ann Oncol 2000; 11: 151-156
98. Bentzen SM, Hoskin PI Roos D, et al. Fractionated radiotherapy for metastatic bone pain: evidence-based medicine or . ..? Int J Radiat Oncol Bio Phys 2000; 46: 681-682
99. Ratanatharathorn J, Powers WE, Moss WT, et al. Bone metastasis: Review and critical analysis of random allocation trials of local field treatrnent. Int J Radiat Oncol Biol Phys 1999; 44: 1-1 8
100. Maltoni M, Nanni O, Scarpi E, et al. Model for estimation of sumival in patients with far-advanced cancer. Topics in Palliative Care, volume 4. Edited by Portenoy RK and Bruera E. Oxford University Press 2000
101. Laupacis A, Wells G, Scott Richardson W, et al. Users' guides to the medical literature. V. How to use an article about prognosis. JAMA 1994; 272: 234-237
102. McCusker J. The terminal period of cancer: definition and descriptive epidemiology. J Chron Dis 1984; 37: 377-385
103. Forster LE, Lynn J. The use of physiologic measures and demographic variables to predict longevity among inpatient hospice applicants. Am J Hospice Care 1989; 6: 31-34
104. Shekelle PG, Woolf SH, Eccles M, et al. Clinical guidelines - Developing guidelines. BMJ l999;38;593-596
Copyright © 2022 FDOKUMEN