
A prediction model for telecom customer lifecycle based-on CART tree
12
Our reference: ESWA 6948 P-authorquery-v8 AUTHOR QUERY FORM Journal: ESWA Article Number: 6948 Please e-mail or fax your responses and any corrections to: E-mail: [email protected] Fax: +31 2048 52799 Dear Author, Please check your proof carefully and mark all corrections at the appropriate place in the proof (e.g., by using on-screen annotation in the PDF file) or compile them in a separate list. To ensure fast publication of your paper please return your corrections within 48 hours. For correction or revision of any artwork, please consult http://www.elsevier.com/artworkinstructions. Any queries or remarks that have arisen during the processing of your manuscript are listed below and highlighted by flags in the proof. Click on the ‘Q ’ link to go to the location in the proof. Location in article Query / Remark: click on the Q link to go Please insert your reply or correction at the corresponding line in the proof Q1 Please confirm that given names and surnames have been identified correctly. Q2 Please check if Heading 1 ‘‘Customer value’’ can be altered to ‘‘Introduction’’. Q3 One parenthesis has been deleted to balance the delimiters. Please check that this was done correctly, and amend if necessary. Q4 Please note that Table 3(a) and 3(b) were not cited in the text. Please check that the citations suggested by the copyeditor are in the appropriate place, and correct if necessary. Q5 This section comprises references that occur in the reference list but not in the body of the text. Please position each reference in the text or, alternatively, delete it. Any reference not dealt with will be retained in this section. Q6 Please check the author names in the Ref. ‘‘Walter et al.’’ (2001). Thank you for your assistance.
-
Upload
independent -
Category
Documents
-
view
1 -
download
0
Transcript of A prediction model for telecom customer lifecycle based-on CART tree
Our reference: ESWA 6948 P-authorquery-v8
AUTHOR QUERY FORM
Journal: ESWA Please e-mail or fax your responses and any corrections to:
Article Number: 6948
E-mail: [email protected]
Fax: +31 2048 52799
Dear Author,
Please check your proof carefully and mark all corrections at the appropriate place in the proof (e.g., by using on-screen annotation in the PDF
file) or compile them in a separate list. To ensure fast publication of your paper please return your corrections within 48 hours.For correction or revision of any artwork, please consult http://www.elsevier.com/artworkinstructions.
Any queries or remarks that have arisen during the processing of your manuscript are listed below and highlighted by flags in the proof. Clickon the ‘Q’ link to go to the location in the proof.
Location inarticle
Query / Remark: click on the Q link to goPlease insert your reply or correction at the corresponding line in the proof
Q1 Please confirm that given names and surnames have been identified correctly.
Q2 Please check if Heading 1 ‘‘Customer value’’ can be altered to ‘‘Introduction’’.
Q3 One parenthesis has been deleted to balance the delimiters. Please check that this was done correctly,and amend if necessary.
Q4 Please note that Table 3(a) and 3(b) were not cited in the text. Please check that the citations suggestedby the copyeditor are in the appropriate place, and correct if necessary.
Q5 This section comprises references that occur in the reference list but not in the body of the text. Pleaseposition each reference in the text or, alternatively, delete it. Any reference not dealt with will be retainedin this section.
Q6 Please check the author names in the Ref. ‘‘Walter et al.’’ (2001).
Thank you for your assistance.

Highlights
ESWA 6948 No. of Pages 1, Model 5G
6 October 2011
" A novel customer segmentation method based on customer lifecycle is proposed. " A decision tree method is developed to extractimportant parameters of customer value. " The determinants of customer lifecycle, credit and loyalty are considered. " The hit ratio ofcustomer value based on current value is higher than ARPU.
1

1
2 Segmentation of telecom customers based on customer value by decision3 tree model
4 Shui Hua Han a, Shui Xiu Lu a, Stephen C.H. Leung b,⇑5 a Department of Management Science, Xiamen University, 361005 Xiamen, China6 b Department of Management Sciences, City University of Hong Kong, Hong Kong
78
1 0a r t i c l e i n f o
1112 Keywords:131415161718
1 9a b s t r a c t
20The more the telecom services marketing paradigm evolves, the more important it becomes to retain high21ion e22der f-23it is e
3334
35
36
37
38
39
40
41
42
43
44
45
46
47
48
49
50
51
52
53
54
55
56
57
Q1
Q
Expert Systems with Applications xxx (2011) xxx–xxx
Contents lists available at SciVerse ScienceDirect
Expert Systems with Applications
journal homepage: www.elsevier .com/locate /eswa
ESWA 6948 No. of Pages 11, Model 5G
7 October 2011
Customer valueCustomer lifecycleLoyalty
value customers. TraditRevenue per User) consiferent types. Therefore,
Credit 24propose a novel customer s i-25t va o26ativ d27tan ts28e b -29an d30a p31d.
32
ne
-
-;--e
rnispt-et
y,),’s
58A59y60t61B62
63e.64-65o66r67d68t69n70d71-72e73-74-75o76s77i-78s79s80data and business experts’ experience, a judgment matrix is pre-81i-82a83
84-85s
Decision tree modelsion models, i.e. currenthe difficulty of quantitis used to extract impormatrix formulated on thsented. Finally a simpleto telecom operators in
1. Customer value
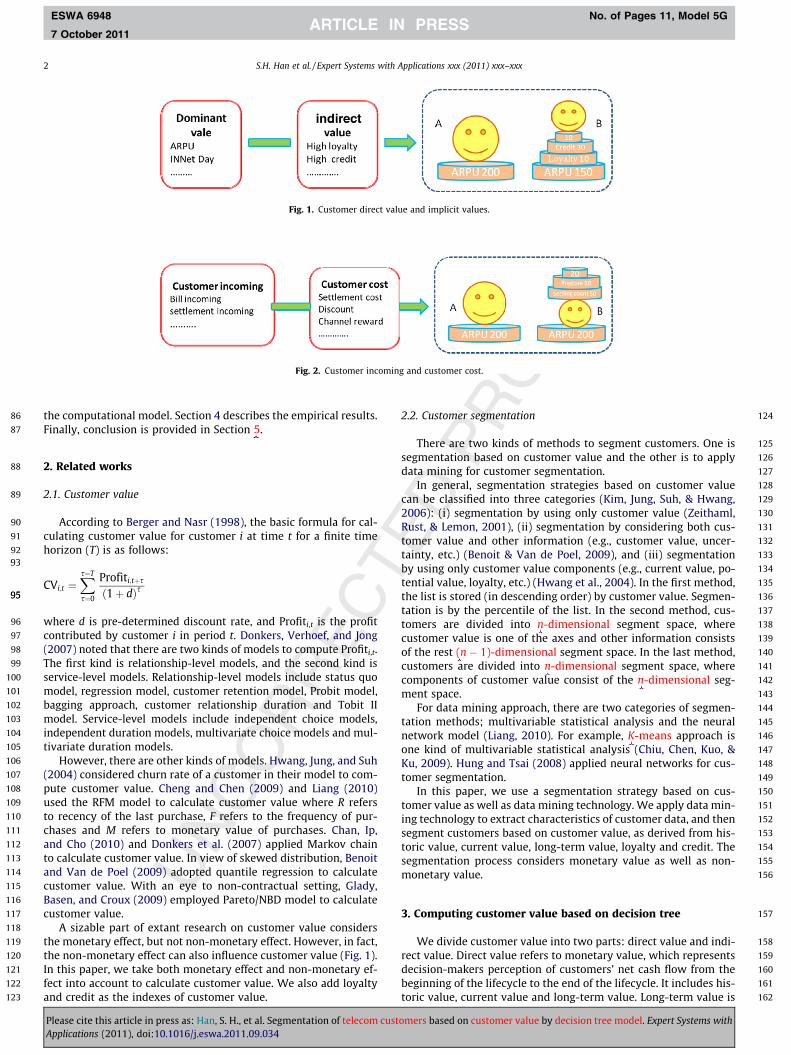
The telecom industry in China was restructured in 2008 whe3G licenses were finally granted to three mobile operators. Sincthen, competition has been intensified further. As a result, telecomoperators are paying much more attention to high-value customers. The 80/20 rule points out that 80% of the profits come fromthe top 20% of profitable customers and 80% of the costs are incurred on the top 20% of unprofitable customers (Duboff, 1992Gloy, Akridge, & Preckel, 1997). However, finding the top 20% customers is the crucial issue for the operators. It is believed that companies who can capture the top 20% customers will win the battlfor the market.
Traditionally, experience-based or ARPU (Average Revenue peUser) method is widely-used to find the top 20% customers iChina’s telecom industry. In general, customers whose ARPUranked in top 20% are customers whose usage value is in the to20% bracket. However, such a method considers only the currenand the historic profit, but not future revenue and customer lifecycle. So this method cannot effectively discover the real high-valucustomers. For instance, customer A and customer B have differenARPUs (A is 200, B is 150), and their indirect values (e.g., loyaltcredit, etc.) may also be significantly different (A is 0, B is 50however they may have the same contribution to the company
0957-4174/$ - see front matter � 2011 Elsevier Ltd. All rights reserved.doi:10.1016/j.eswa.2011.09.034
⇑ Corresponding author. Tel.: +852 3442 8650; fax: +852 3442 0189.E-mail address: [email protected] (S.C.H. Leung).
2
Please cite this article in press as: Han, S. H., et al. Segmentation of telecom cApplications (2011), doi:10.1016/j.eswa.2011.09.034
al customer segmentation methods based on experience or ARPU (Averagneither customers’ future revenue nor the cost of servicing customers of divery difficult to effectively identify high-value customers. In this paper, w
egmentation method based on customer lifecycle, which includes five declue, historic value, prediction of long-term value, credit and loyalty. Due te computation of long-term value, credit and loyalty, a decision tree methot parameters related to long-term value, credit and loyalty. Then a judgmenasis of characteristics of data and the experience of business experts is pred practical customer value evaluation system is built. This model is applierovince in China and good accuracy is achieved.
� 2011 Elsevier Ltd. All rights reserve
profit, i.e., 200 (Fig. 1). On the other hand, a pair of customerand B may have the same ARPUs, but their costs to the companmay be significantly different. Nevertheless, it can be noted thathey may have different contribution to the company (A is 200,is 80) (Fig. 2).
Therefore, it is crucial to establish indexes for customer valuFrom a business point of view, customer value should be the potential profit from a customer along the customer’s lifecycle. Tthe best of our knowledge, a practical and well designed customeevaluation system based on customer value has not been proposeso far; evaluation of customer value is still an unsolved, if nounaddressed, problem. According to Walter, Ritter, and Gemunde(2001), customer value is defined as customers’ net cash flow anprospective profit perceived by the decision-maker. We divide customer value into two parts: direct value, which is used to scale thmonetary effect, and indirect value, which is used to scale the nonmonetary effect. Direct value includes earnings not only from customer’s current value but also from the long-term value. We try tpredict the lifecycle of in-net customers based on characteristicdata, and then obtain the long-term value. For indirect value, postive and negative samples are used to extract the characteristicdata which may affect loyalty, and then based on characteristic
sented. The purpose of this paper is to evaluate customers’ contrbution for facilitating enterprise decision-making by buildingsimple and practical customer value computation system.
The rest of this paper is organized as follows. Section 2 describes an overview of the related work, while Section 3 present
ustomers based on customer value by decision tree model. Expert Systems with
Original text:
Inserted Text
TelecomCustomers
Original text:
Inserted Text
Customer Value
Original text:
Inserted Text
Decision Tree Model
Original text:
Inserted Text
givenname
Original text:
Inserted Text
surname
Original text:
Inserted Text
givenname
Original text:
Inserted Text
surname
Original text:
Inserted Text
givenname
Original text:
Inserted Text
surname
Original text:
Inserted Text
361005,
Original text:
Inserted Text
Per
Original text:
Inserted Text
company,
86 th87 Fin
88 2.
89 2.1
90
91 cu92 ho93
CV9595
96 wh97 co98 (299 Th
100 se101 m102 ba103 m104 in105 tiv106
107 (2108 pu109 us110 to111 ch112 an113 to114 an115 cu116 Ba117 cu118
119 th120 th121 In122 fec123 an
1242.2
125
126se127da128
129ca13020131Ru132to133ta134by135te136th137ta138to139cu140of141cu
lue a
ng a
2 S.H. Han et al. / Expert Systems with Applications xxx (2011) xxx–xxx
ESWA 6948 No. of Pages 11, Model 5G
7 October 2011
PlAp
e computational model. Section 4 describes the empirical results.ally, conclusion is provided in Section 5.
Related works
. Customer value
According to Berger and Nasr (1998), the basic formula for cal-lating customer value for customer i at time t for a finite timerizon (T) is as follows:
i;t ¼Xs¼T
s¼0
Profiti;tþs
ð1þ dÞs
ere d is pre-determined discount rate, and Profiti,t is the profitntributed by customer i in period t. Donkers, Verhoef, and Jong007) noted that there are two kinds of models to compute Profiti,t.e first kind is relationship-level models, and the second kind is
Fig. 1. Customer direct va
Fig. 2. Customer incomi
rvice-level models. Relationship-level models include status quoodel, regression model, customer retention model, Probit model,gging approach, customer relationship duration and Tobit IIodel. Service-level models include independent choice models,dependent duration models, multivariate choice models and mul-ariate duration models.However, there are other kinds of models. Hwang, Jung, and Suh
004) considered churn rate of a customer in their model to com-te customer value. Cheng and Chen (2009) and Liang (2010)ed the RFM model to calculate customer value where R refersrecency of the last purchase, F refers to the frequency of pur-ases and M refers to monetary value of purchases. Chan, Ip,d Cho (2010) and Donkers et al. (2007) applied Markov chaincalculate customer value. In view of skewed distribution, Benoitd Van de Poel (2009) adopted quantile regression to calculatestomer value. With an eye to non-contractual setting, Glady,sen, and Croux (2009) employed Pareto/NBD model to calculatestomer value.A sizable part of extant research on customer value considers
e monetary effect, but not non-monetary effect. However, in fact,e non-monetary effect can also influence customer value (Fig. 1).this paper, we take both monetary effect and non-monetary ef-t into account to calculate customer value. We also add loyaltyd credit as the indexes of customer value.
com
taneonKuto
toinsetosem
3.
redebeto
ease cite this article in press as: Han, S. H., et al. Segmentation of telecom customplications (2011), doi:10.1016/j.eswa.2011.09.034
. Customer segmentation
There are two kinds of methods to segment customers. One isgmentation based on customer value and the other is to applyta mining for customer segmentation.In general, segmentation strategies based on customer value
n be classified into three categories (Kim, Jung, Suh, & Hwang,06): (i) segmentation by using only customer value (Zeithaml,st, & Lemon, 2001), (ii) segmentation by considering both cus-
mer value and other information (e.g., customer value, uncer-inty, etc.) (Benoit & Van de Poel, 2009), and (iii) segmentation
using only customer value components (e.g., current value, po-ntial value, loyalty, etc.) (Hwang et al., 2004). In the first method,e list is stored (in descending order) by customer value. Segmen-tion is by the percentile of the list. In the second method, cus-mers are divided into n-dimensional segment space, wherestomer value is one of the axes and other information consiststhe rest (n � 1)-dimensional segment space. In the last method,stomers are divided into n-dimensional segment space, where
nd implicit values.
nd customer cost.
142mponents of customer value consist of the n-dimensional seg-143ent space.144For data mining approach, there are two categories of segmen-145tion methods; multivariable statistical analysis and the neural146twork model (Liang, 2010). For example, K-means approach is147e kind of multivariable statistical analysis (Chiu, Chen, Kuo, &148, 2009). Hung and Tsai (2008) applied neural networks for cus-149mer segmentation.150In this paper, we use a segmentation strategy based on cus-151mer value as well as data mining technology. We apply data min-152g technology to extract characteristics of customer data, and then153gment customers based on customer value, as derived from his-154ric value, current value, long-term value, loyalty and credit. The155gmentation process considers monetary value as well as non-156onetary value.
157Computing customer value based on decision tree
158We divide customer value into two parts: direct value and indi-159ct value. Direct value refers to monetary value, which represents160cision-makers perception of customers’ net cash flow from the161ginning of the lifecycle to the end of the lifecycle. It includes his-162ric value, current value and long-term value. Long-term value is
ers based on customer value by decision tree model. Expert Systems with
Original text:
Inserted Text
5.
Original text:
Inserted Text
n-dimensional
Original text:
Inserted Text
(n-1)-dimensional
Original text:
Inserted Text
n-dimensional
Original text:
Inserted Text
n-dimensional
Original text:
Inserted Text
K-means
163 the prospective profit from customers, where predicting a cus-164 tomer’s lifecycle is the critical issue. Indirect value refers to non-165 monetary value, which cannot be quantitatively computed in gen-166 eral. We focus on crucial determinants of indirect value which is167 computed indirectly based on loyalty and credit. Since computa-168 tion of loyalty and credit is quite difficult and cannot be quantita-169 tively calculated, it is necessary to structure the influence index.
170 3.1. The general framework for customer value computation
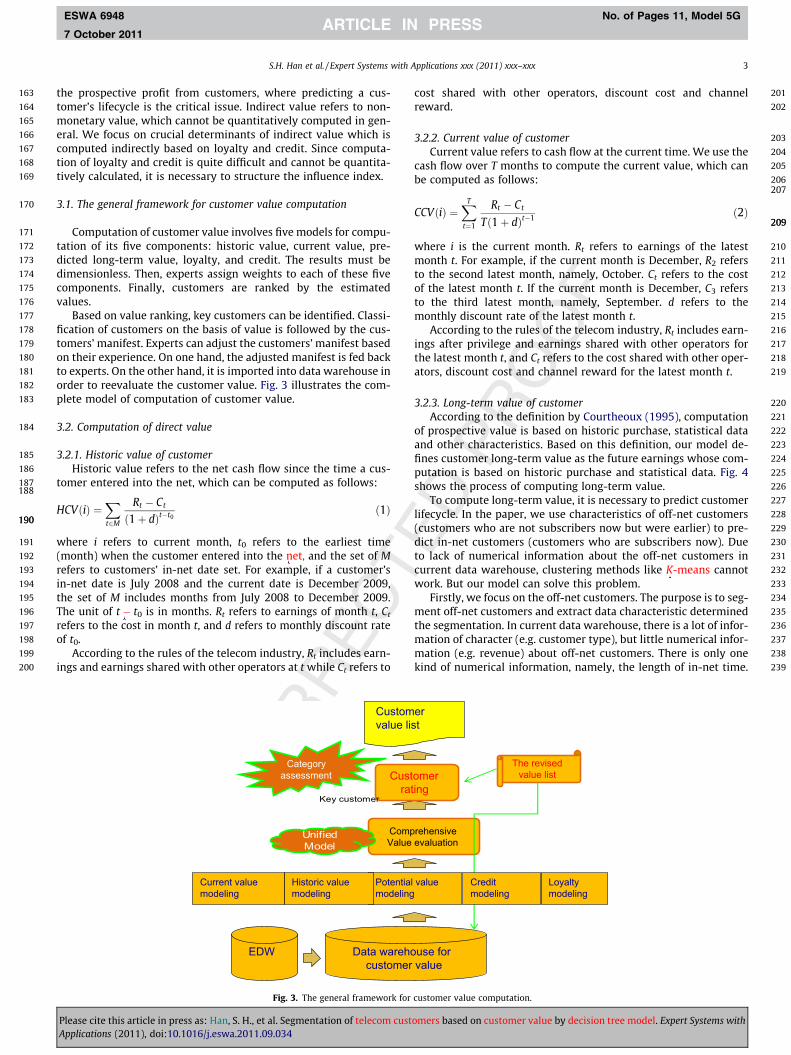
171 Computation of customer value involves five models for compu-172 tation of its five components: historic value, current value, pre-173 dicted long-term value, loyalty, and credit. The results must be174 dimensionless. Then, experts assign weights to each of these five175 components. Finally, customers are ranked by the estimated176 values.177 Based on value ranking, key customers can be identified. Classi-178 fication of customers on the basis of value is followed by the cus-179 tomers’ manifest. Experts can adjust the customers’ manifest based180 on their experience. On one hand, the adjusted manifest is fed back181 to experts. On the other hand, it is imported into data warehouse in182 order to reevaluate the customer value. Fig. 3 illustrates the com-183 plete model of computation of customer value.
184 3.2. Computation of direct value
185 3.2.1. Historic value of customer186 -187188
Þ190190
191 e192
193 ’s194 9,195 .196 t
197 e198
199 -200 o
201cost shared with other operators, discount cost and channel202reward.
2033.2.2. Current value of customer204Current value refers to cash flow at the current time. We use the205cash flow over T months to compute the current value, which can206be computed as follows:207
CCVðiÞ ¼XT
t¼1
Rt � Ct
Tð1þ dÞt�1 ð2Þ209209
210where i is the current month. Rt refers to earnings of the latest211month t. For example, if the current month is December, R2 refers212to the second latest month, namely, October. Ct refers to the cost213of the latest month t. If the current month is December, C3 refers214to the third latest month, namely, September. d refers to the215monthly discount rate of the latest month t.216According to the rules of the telecom industry, Rt includes earn-217ings after privilege and earnings shared with other operators for218the latest month t, and Ct refers to the cost shared with other oper-219ators, discount cost and channel reward for the latest month t.
2203.2.3. Long-term value of customer221According to the definition by Courtheoux (1995), computation222of prospective value is based on historic purchase, statistical data223and other characteristics. Based on this definition, our model de-224fines customer long-term value as the future earnings whose com-2254226
227r228s229-230e231n232t233
234-235d236-237-238e239e.
aretom
otenode
ustomer lue list
CoVa
C
ork
S.H. Han et al. / Expert Systems with Applications xxx (2011) xxx–xxx 3
ESWA 6948 No. of Pages 11, Model 5G
7 October 2011
Historic value refers to the net cash flow since the time a customer entered into the net, which can be computed as follows:
HCVðiÞ ¼Xt2M
Rt � Ct
ð1þ dÞt�t0ð1
where i refers to current month, t0 refers to the earliest tim(month) when the customer entered into the net, and the set of Mrefers to customers’ in-net date set. For example, if a customerin-net date is July 2008 and the current date is December 200the set of M includes months from July 2008 to December 2009The unit of t � t0 is in months. Rt refers to earnings of month t, Crefers to the cost in month t, and d refers to monthly discount ratof t0.
According to the rules of the telecom industry, Rt includes earnings and earnings shared with other operators at t while Ct refers t
EDW Data wcus
Pm
Cva
Historic value modeling
Current value modeling
Category assessment
Unified Model
Key customer
Fig. 3. The general framew
Please cite this article in press as: Han, S. H., et al. Segmentation of telecom cApplications (2011), doi:10.1016/j.eswa.2011.09.034
putation is based on historic purchase and statistical data. Fig.shows the process of computing long-term value.
To compute long-term value, it is necessary to predict customelifecycle. In the paper, we use characteristics of off-net customer(customers who are not subscribers now but were earlier) to predict in-net customers (customers who are subscribers now). Duto lack of numerical information about the off-net customers icurrent data warehouse, clustering methods like K-means cannowork. But our model can solve this problem.
Firstly, we focus on the off-net customers. The purpose is to segment off-net customers and extract data characteristic determinethe segmentation. In current data warehouse, there is a lot of information of character (e.g. customer type), but little numerical information (e.g. revenue) about off-net customers. There is only onkind of numerical information, namely, the length of in-net tim
ustome
The revised
house for er value
tial value ling
mprehensive lue evaluation
ustomer rating
value list
Loyalty modeling
Credit modeling
for customer value computation.
rs based on customer value by decision tree model. Expert Systems with
Original text:
Inserted Text
net,,
Original text:
Inserted Text
-
Original text:
Inserted Text
K-means

240 Ho241 Fr242 in243 to244 (se245 th246 th247 na248 th249 du
250 (1251
252
253
254
255
256
257
258
259
260
261
262 (2263
264
265
266
267
268
269
270
271
272
273
274
275
276
277
278
279
280(3281
282
283
284
285
286
287
288
289
290(4
ting
4 S.H. Han et al. / Expert Systems with Applications xxx (2011) xxx–xxx
ESWA 6948 No. of Pages 11, Model 5G
7 October 2011
PlAp
wever, Classification and Regression tree (CART) (Breiman,iedman, Olshen, & Stone, 1984) can solve the input of numericalformation as well as information of character. So we utilize CARTextract the data characteristic. According to the result of CARTe Section 4), we analyze the determination of segmentation,
at is, the data characteristic is extracted. Secondly, based one data characteristic, we predict in-net customers’ lifecycle. Fi-lly, we compute the long-term value of customer in terms ofe remaining in-net time and monthly average value. The proce-re is listed in the following.
) Data and segmentation of off-net customers. We select thesuitable data of off-net customers from the data warehouseand count the off-net customers by their length of in-net time
Segmentation
Predication
computation
The prediction of lifecycleThe prediction of lifecycle
Fig. 4. Process of compu
(LIT) and draw the bar graph where abscissa is the LIT andordinate is the number of customers who have the sameLIT. Based on the bar graph, we search for the high pointand low point according to the ordinate. Then group 1 isthe customers whose LIT is between the first high (low) pointto the first low (high) point and so on. So the customers canbe segmentation into m groups. The groups are ordered byLIT, that is, the LIT of group i is less than group j, such that iis smaller than j.
) Characteristics extraction. As mentioned before, we utilizeCART to extract data characteristics of segmentation. TheCART can present the result of split and the reason of split.We use accuracy to decide which group the bottom nodebelongs to. The accuracy is defined as A1/A2 � 100%, whereA2 is the number of the customers who belong to the node,A1 is the number of the customers who belong to the groupin the node. For example, in Fig. 7, the node 1 is the bottomnode, and there is 3792 customers in the node and 30205 cus-tomers belong to group 1, so the accuracy of group 1 in thenode 1 is 79.671% (the CART can directly give it). The highestaccuracy of the group determines the group the node belongsto. So for node 1, it belongs to group 1. Once we fix the groupthat the bottom node it belongs to, we can extract the datacharacteristics of the group according to the reason of split.
whlimen(w
utTh
M
Rj
whtomCCwh
ease cite this article in press as: Han, S. H., et al. Segmentation of telecom customplications (2011), doi:10.1016/j.eswa.2011.09.034
Certainly, the direct reason of split is the field in the datawarehouse, so we need to translate the field into the charac-teristics of business.
) In-net customer lifecycle prediction. From the result of the2nd procedure, we get the characteristics of business charac-ter and data characteristics determined by the segmentationof group. If the data characteristics of in-net customer arethe same with the data characteristics of group j, then thein-net customer belongs to group j. For example, the datacharacteristics of group 1 are that the customer type is fre-quent customer and the town mark is city. How long is theLIT of group j is determined by the result of segmentationfrom the 1st procedure.
) The remaining in-net time computation. If the prediction of
The prediction of lifecycleThe prediction of lifecycle
long-term value.
291a customer belongs to group j, the remaining in-net time is292computed as follows: 293
294
RIT ¼Lj� IT; IT 6 Lj
minðLkþ1� IL; IL� LkÞ; Lk < IL6 Lkþ1; k¼ j; . . . ;m�1IL� Lm; IL> Lm
8<:
ð3Þ 296296297
298ere m is the total amount of the segmentation, Lj is the upper299it of the LIT of group j, and IL is the length from the customer300tering into the net to current time and IL is accurate to month301hen IL is 4 months and 15 days, the IL is equal to 4 months).302From the perspective of the rate of revenue from customer, we303ilize the link-relative to predict monthly average value (MAV).304e formula is listed in the following.305
AV ¼ ½1þ ðR1 þ R2 þ � � � þ RnÞ=n� � CCVðiÞ
¼ Bi�ðj�1Þ � Bi�j
Bi�j
ð4Þ307307
308ere i refers to current month, Bi�j is the revenue from the cus-309mer of j months back based on current month, that is, if current310onth is August, the B8�2 is the revenue from the customer in June.311V(i) refers to current value. In general, n is 4. For the customers312ose LIT is less than 4 months, n is determined by the actual LIT.
ers based on customer value by decision tree model. Expert Systems with
Original text:
Inserted Text
4),
Original text:
Inserted Text
customers.
Original text:
Inserted Text
extraction.
Original text:
Inserted Text
A1/A2×100%,
Original text:
Inserted Text
prediction.
Original text:
Inserted Text
2nd
Original text:
Inserted Text
1st
Original text:
Inserted Text
-
Original text:
Inserted Text
8-2

313 -314315
Þ317317
318 -319
320
321 -322 y.323 t,324 s325 P326
327
328
329
330
331
332
333
334
335
336
337
338
339
340
341
342
343
344
345
346
347
348
349
350n351
352(4) Importance analysis. After the 3rd procedure, even there is353e354e355d356e357,358g359s360ll361
362e363t364s.365e366e367
368
Q
S.H. Han et al. / Expert Systems with Applications xxx (2011) xxx–xxx 5
ESWA 6948 No. of Pages 11, Model 5G
7 October 2011
When we get the value of RIL and MAV, we can compute longterm value, LV, of customer. It can be formulated as follows:
LV ¼XRIL
k¼1
MAVð1þ dÞ�k ¼ RIL�MAV ; d ¼ 0d�1 � d�1ð1þ dÞ�RIL � AV ; d – 0
�ð5
where MAV is the monthly average value, RIL refers to the remaining in-net time, and d is the discount rate.
3.3. Computation of indirect value
Indirect value refers to the non-monetary value including loyalty and credit. Loyalty and credit cannot be computed directlWe first propose an index of determinants of loyalty and crediand then the experts score the index based on data characteristicand experience. Afterward, loyalty and credit are obtained by AH(Analytic Hierarchy Process) method.
3
3.3.1. Computation of loyaltyBowen and Chen (2001) stated that there are three ways of
measuring customer loyalty: by means of behavior, by means ofattitude, and the integration of these two methods. Our methodto measure loyalty includes both customer consumption behaviorand customer complaints, which falls into the integration of twocustomer loyalty measurements.
Fig. 5 shows the process of computing loyalty. The computationof loyalty includes the following procedure: structure the index,preparing for the data, analysis of the importance, AHP, integrationof the model, and evaluation.
(1) Structure of the index. Since the method of AHP is used tocalculate loyalty, we need to choose suitable criteria andalternatives. Based on experience, business experts definea series of criteria that can influence loyalty, and then subdi-vide every criterion into alternatives.
(2) Data preparation. Prepare two kinds of datasets. A negativesample (disloyal customers) and a positive sample (loyalcustomers).
(3) Correlations analysis. Since the correlations between thecriterion and alternative may exist, it is required to analyzethese correlations. Based on the negative and positive sam-ples, we can analyze the different relationships among these
Index Constructor
Data preparation
Correlation analysis
Business expert
Subdivision index sets
Analysis tool
Correlated index
Businessrelated
specific analysis
EDW
Original
systemO
DS
Value sets
Datarelated
Fig. 5. The process
Please cite this article in press as: Han, S. H., et al. Segmentation of telecom cApplications (2011), doi:10.1016/j.eswa.2011.09.034
indices. We use Clementine12.0 to obtain the correlatiomatrix.
no correlation between the indices, some indices may not bimportant for the loyalty. So it is needed to analyze thimportance of indices. There is only a negative sample ana positive sample. So there are two groups when the treis split. Therefore we apply C5.0 decision tree (Quinlan1996) to analyze importance. C5.0 model can give a rankinof index. According to importance analysis, if an index hano relation with others, then it will be discarded; else it wibe retained.
(5) AHP. Given the importance indexes and their rankings, th
d
experts structure hierarchical relationships and judgmenmatrix based on the indexes given by importance analysiThe results of the 4th procedure can save the experts timand minimize perturbation of indexes that can scarcely bimportant.
(6) Loyalty scoring. Make every index be dimensionless an
369add the weight from the 5th procedure to the index. Then370score loyalty.371(7) Evaluation. In order to evaluate the accuracy of the model, it372is tested by the hit ratio (Hung, Yen, & Wang, 2006). The hit373ratio of loyalty is defined as A/B, where B is the number of374customers whose in-net time is longer than 8 yr, and A is375the number of customers who are on the top of the B list376(the list is ranked by the result of our loyalty model. The cus-377tomer whose loyalty is higher is one on the top of the list)378and who have been in the net for at least 8 yr.3793803.3.2. Computation of credit381Computation of the credit is similar to computation of loyalty.382The only difference is that negative evaluation is applied to the mod-383el. The hit ratio of loyalty is from the perspective of customers who384are one on the top of the list. But the hit ratio of credit is from the per-385spective of the customers who are one at the bottom of the list.386We define the hit ratio of credit as C/D, where D is the number387of the customers who were out of credit but are still in-net at pres-388ent, C is the number of customers who fall behind the last D list389(the list is ranked by the result of our credit model. The customer390whose credit is higher is one on the top of the list) and had been391out of credit at some point of time.
Importance analysis AHP Loyalty Score
Index im
portancem
odelingD
ata analysis
Hierarchy
relationshipR
elation matrix
Weight of
index
Dim
ensionless Index com
putingLoyalty rating
of computing loyalty.
ustomers based on customer value by decision tree model. Expert Systems with
Original text:
Inserted Text
index.
Original text:
Inserted Text
preparation.
Original text:
Inserted Text
analysis.
Original text:
Inserted Text
analysis.
Original text:
Inserted Text
AHP.
Original text:
Inserted Text
scoring.
Original text:
Inserted Text
Evaluation.
Original text:
Inserted Text
years,
Original text:
Inserted Text
years.
Original text:
Inserted Text
C/D,

392 3.4
393
394 ar395 sh396 ce
397
398
399
400
401
402
403
404Cu
406406
407wh408pr
4094.
4104.1
411
412te413su414W415to
4164.2
4174.2418
419in
ff-n
6 S.H. Han et al. / Expert Systems with Applications xxx (2011) xxx–xxx
ESWA 6948 No. of Pages 11, Model 5G
7 October 2011
PlAp
. Computation of customer value
Different experts’ understandings of direct and indirect valuee different in different periods. So direct and indirect valueould be weighted to compose the total customer value. The pro-dure is listed in the following.
(1) Dimensionless. Current value, long-term value, loyalty andcredit are non-dimensional.
(2) Weighting. Experts set the weights for historic value, currentvalue, long-term value, loyalty and credit.
(3) Computing customer value. According to the weights andthe dimensionless result, customer value is weighted, calcu-lated and ranked, as follows:
stomer value ¼ E�Historic valueþ F � Currentvalue
þ P � Long� term valueþ T � Loyaltyþ K � Credit ð6Þ
Fig. 6. Bar chart of o
Fig. 7. The result of CA
ease cite this article in press as: Han, S. H., et al. Segmentation of telecom customplications (2011), doi:10.1016/j.eswa.2011.09.034
ere E, F, P, T and K are given by experts during the secondocedure.
Empirical finding
. Data source
An operator in China provided its customer related data. To pro-ct customer privacy, we only state that the data includes 220,000bscribers of whom only 3000 subscribers could not be classified.e use the models to calculate customer loyalty, credit and cus-mer value from January 2009 to April 2009.
. Application of the model
.1. Historic value and current valueIn consideration of computational complexity, we ignore the
fluence of rate, i.e. the monthly discount rate d is set to be 0. His-
et customers.
RT model.
ers based on customer value by decision tree model. Expert Systems with

420 toric value includes the cumulative charge (revenue) and the421 cumulative cost. Cumulative charge is the actual charge, including422 the charge shared with other operators. Cumulative cost is the total423 cost incurred on the customer, including that shared with other424 operators, discount cost and channel reward. We use the average425 net cash flow of the latest 3 months to compute current value.
426 4.2.2. Long-term value427 We select customers whose customer type is family, personal,428 enterprise or government, and key customer, and so on, and whose429 off-net time is later than the time when the product was used for430 the first time, as well as terminated and churn customers. We ap-431 ply Clementine12.0 and draw a bar graph of off-net customers432 based on the negative sample (Fig. 6). From Fig. 6, we can find 3433 s.434 t435 s436 p437
438
439
440
441
442
443
444
445
446
447
448
449
450group 2 (11.637%), so we predict customers in node 5 belong451to group 3.452� For node 13, the accuracy of group 2 is 62.272%, which is more453than the accuracy of group 1 (10.098%) and group 3 (27.630%),454so we predict customers in node 13 belong to group 2.455� For node 14, the accuracy of group 3 is 79.340%, which is obvi-456ously more than the accuracy of group 1 (12.370%) and group 2457(8.291%), so we predict customers in node 14 belong to group 3.458
459Based on the decision tree (Fig. 7) and the business skill accord-460ing to the fields in the data warehouse, we know the determinants461of customer lifecycle are the classification of customers, customer462type and town mark. The classification of customer consists of cor-463porate type (including insurance, government agencies, armed464t465r,466l467
468d
S.H. Han et al. / Expert Systems with Applications xxx (2011) xxx–xxx 7
ESWA 6948 No. of Pages 11, Model 5G
7 October 2011
convex points. So the customer lifecycle is divided into 3 groupGroup 1 is customers whose length of in-net time (LIT) is at leas36 months but not more than 60 months. Group 2 is customerwhose LIT is over 18 months but not more than 36 months. Grou3 is customers whose LIT is less than 18 months.
Then we build CART model in Clementine 12.0. Fig. 7 presentsthe result of CART model, where 222,829 off-net customers areclassified, the CART model could correctly predict about 149,600customers. Node1, 5, 13 and 14 are the bottom nodes. Then weneed to determine which group the bottom nodes belong to byaccuracy.
� For node 1, the accuracy of group 1 is 79.671%, the accuracy ofgroup 2 is 1.121%, and the accuracy of group 3 is 19.208%. So theaccuracy of node 1 is obviously more than group 2 and group 3.Therefore, we predict customers in node 1 belong to group 1.� For node 5, the accuracy of group 3 is 74.723%, which is
obviously more than the accuracy of group 1 (13.640%) and
469-470e471-472e473
474
475-476477
478
Fig. 8. Hierarchical relations
Please cite this article in press as: Han, S. H., et al. Segmentation of telecom cApplications (2011), doi:10.1016/j.eswa.2011.09.034
forces of the government, transport and logistics, the departmenof energy, education, tourism, hotel and restaurant, internet bahospital, bank, telecom operator and ISP, party agencies and sociaorganization, manufacturing industry, great enterprises, mediumand small sized enterprises), individual type, frequent type, anothers. Customer type includes personal customer, enterprise, frequent customer, key customer and others. But some customer typmay not be clear. Town mark includes city (customers who are living in city) and country (customers are living in the country). Thcharacteristics of every group are listed as below.
The characteristics of group 1� The classification of customer is corporate type. And the cus
tomer type is known.The characteristic of group 2
479� The classification of customer is individual type, frequent480type or others and the customer type is key customer, enter-481prises, or frequent customer. The town mark is city. 482
hips and the weight (loyalty).
ustomers based on customer value by decision tree model. Expert Systems with

483
484
485
486 ch487 ist
488�489
490�491
492
493�494
495
496
497of498ca499di500de501of502an
TabNu
o of loyalty
3 4month
tio o
8 S.H. Han et al. / Expert Systems with Applications xxx (2011) xxx–xxx
ESWA 6948 No. of Pages 11, Model 5G
7 October 2011
PlAp
The characteristic of group 3
There are three kinds of characteristics in group 3. Once thearacteristic of the customer is the same as any kind of character-ics, the customer is predicted as group 3.
le 1merical result of loyalty.
Time Customers whose in-nettime is more than 8 yr
Customers who are onthe top of the list
Hitratio(%)
2009.01 1192713 1076045 90.222009.02 1195947 1062780 88.872009.03 1165379 1017797 87.342009.04 1174831 1035261 88.12
the hit rati
85.00%
86.00%
87.00%
88.00%
89.00%
90.00%
91.00%
1 2
hit r
atio
Fig. 9. The hit ra
Fig. 10. Hierarchical relationships
ease cite this article in press as: Han, S. H., et al. Segmentation of telecom customplications (2011), doi:10.1016/j.eswa.2011.09.034
The classification of customer is corporate type, but the cus-tomer type is not clear.Or the classification of customer is individual type and cus-tomer type is key customer, enterprise, or frequent customer.The town mark is country.Or the classification of customer is individual type, frequenttype, or others and customer type is personal customer.
Based on the characteristics of group, we can predict lifecyclesin-net customers. If the characteristic of the customer is identi-l with the characteristic of group i, then the customer is pre-cted to be group i. The length of lifecycle of the customer istermined by the LIT of group i. For example, if the classificationcustomer is frequent type and customer type is key customerd the town mark is city, then we predict the customer belongs
f loyalty.
and the weight (Credit).
ers based on customer value by decision tree model. Expert Systems with
503 to group 2. Then, we predict the length of the customer lifecycle is504 not more than 36 months but more than 18 months.505 Once prediction result of customer lifecycle is obtained, we can506 compute the remaining in-net time and the monthly average value,507 and then the long-term value is available according to Eq. (5).
508 4.2.3. Loyalty509 Due to the complexity in current data warehouse, the experts510 present one criterion. The criterion is LIT or IL (it is the length from511 -512 l-513 t514 ,515 d516 -517 n518 n519 t520
521 0522 d523 is524 r525 e526
527 l528 s529 s530 s531 e532 -533
534
535 n536 -537 s.538 t539 r540 -541
542 0543 i-544 -545
546
547
548
549
550
551e552f553
554
555e,556,557
558i-559-560
561
562f563e.564d565e566),567t568e569f570e571r572e573s574f575e
94.00%
S.H. Han et al. / Expert Systems with Applications xxx (2011) xxx–xxx 9
ESWA 6948 No. of Pages 11, Model 5G
7 October 2011
the customer entering into the net to current time) (For in-net customer, the criterion is IL, for off-net customer, it is LIT). So the anaysis of correlation is unnecessary. But we can get the importanindex that can influence the LIT or IL. According to the criterionthe positive sample is customers whose IL is between 8 yr an15 yr. Total positive sample is 200,000. The data is chosen at random. The negative sample is off-net customers who have beeoff-net in the last 6 months and whose LIT was short (less tha1 yr). Total negative sample is 100,000. The data is also chosen arandom.
According to the positive and negative samples, based on C5.decision tree, we get the important index. The index is recognizeas importance if it is ranked on the top of the list. The sequencethe in-net behavior, the charge of communication, the customebehavior, the number of packages, the kind of products and thnumber of products.
According to the sequence, the experts give the hierarchicarelationships and judgment matrix. We use AHP to get the weightof the variables. Fig. 8 shows hierarchical relationships and weightfrom AHP. Simultaneously, the variables must be dimensionlesand loyalty is the weighted mean. Then we compute the hit ratof loyalty, and test the model. Fig. 9 shows the result of the verification. Table 1 shows the numerical result of loyalty.
4.2.4. CreditThe criterion given by experts is whether customers have falle
into arrears. According to the arrears, the negative sample comprises customers who have fallen into arrears in the last 6 monthThe total of the negative sample is 100,000. The data is chosen arandom. The positive sample comprises customers who have nevefallen into arrears since they entered into the net. The total of positive sample is 200,000. The data is also chosen at random.
According to the positive and negative samples, based on C5.decision tree, we get the sequence of important credit’s determnants: the frequency of delayed payment, ways of payment, prod
uct structure, current balance, and customer type (the determinantis recognized as importance if it is ranked on the top of the list).According to the sequence, the experts give the hierarchicalrelationships and judgment matrix. We use AHP to get the weightof the variables. Fig. 10 shows hierarchical relationships and theweights from AHP. Meanwhile, the variables must be dimension-
the hit ratio of credit
76.00%78.00%80.00%82.00%84.00%86.00%88.00%90.00%92.00%94.00%96.00%
1 2 3 4month
hit r
atio
Fig. 11. The hit ratio of credit.
Please cite this article in press as: Han, S. H., et al. Segmentation of telecom cApplications (2011), doi:10.1016/j.eswa.2011.09.034
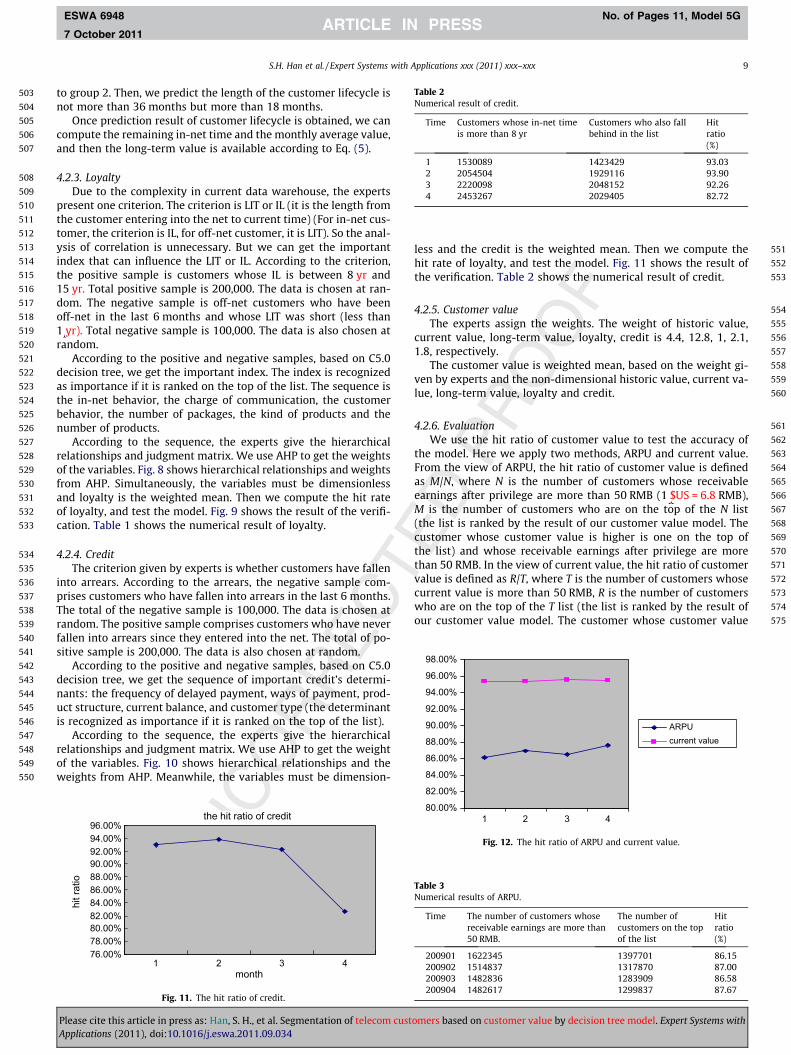
less and the credit is the weighted mean. Then we compute thhit rate of loyalty, and test the model. Fig. 11 shows the result othe verification. Table 2 shows the numerical result of credit.
4.2.5. Customer valueThe experts assign the weights. The weight of historic valu
current value, long-term value, loyalty, credit is 4.4, 12.8, 1, 2.11.8, respectively.
The customer value is weighted mean, based on the weight gven by experts and the non-dimensional historic value, current value, long-term value, loyalty and credit.
4.2.6. EvaluationWe use the hit ratio of customer value to test the accuracy o
the model. Here we apply two methods, ARPU and current valuFrom the view of ARPU, the hit ratio of customer value is defineas M/N, where N is the number of customers whose receivablearnings after privilege are more than 50 RMB (1 $US = 6.8 RMBM is the number of customers who are on the top of the N lis(the list is ranked by the result of our customer value model. Thcustomer whose customer value is higher is one on the top othe list) and whose receivable earnings after privilege are morthan 50 RMB. In the view of current value, the hit ratio of customevalue is defined as R/T, where T is the number of customers whoscurrent value is more than 50 RMB, R is the number of customerwho are on the top of the T list (the list is ranked by the result oour customer value model. The customer whose customer valu
Table 2Numerical result of credit.
Time Customers whose in-net timeis more than 8 yr
Customers who also fallbehind in the list
Hitratio(%)
1 1530089 1423429 93.032 2054504 1929116 93.903 2220098 2048152 92.264 2453267 2029405 82.72
96.00%
98.00%
80.00%
82.00%
84.00%
86.00%
88.00%
90.00%
92.00%
1 2 3 4
ARPUcurrent value
Fig. 12. The hit ratio of ARPU and current value.
Table 3Numerical results of ARPU.
Time The number of customers whosereceivable earnings are more than50 RMB.
The number ofcustomers on the topof the list
Hitratio(%)
200901 1622345 1397701 86.15200902 1514837 1317870 87.00200903 1482836 1283909 86.58200904 1482617 1299837 87.67
ustomers based on customer value by decision tree model. Expert Systems with
Original text:
Inserted Text
year).
Original text:
Inserted Text
$US=6.8

576 is higher is one on the top of the list) and whose current value is577 more than 50 RMB.578 Fig. 12 shows the result of the hit ratio of customer value based579 on ARPU and current value. Tables 3 and 4 show the numerical re-580 sults of ARPU and current value, respectively.
581 5. Conclusion
582 With the development of customer relationship management,583 customer value becomes more and more important for business584 decisions. Ways to evaluate a customer’s value are demanded by585 many enterprises. As far as we know, there is no practical customer586 value evaluation system. Therefore, it is needed to develop a cus-587 tomer value evaluation system.588 Here we develop a simple and practical customer value evalua-589 tion system for the telecom industry. The model can be used to590 predict customer lifecycle when only demographic information is591 available in the company’s data. The customer’s contribution is592 evaluated and quantified to support decision-making of the enter-593 prise. To compute loyalty and credit, we use the AHP method. Dif-594 ferent from other models, the score of weights from AHP is given595 not only by experts’ experience but also the characteristics data.596 It overcomes the subjectiveness of the experts’ scoring to some597 degree.598 Due to conditional constraints, there are still some limitations599 in our research. We do not pay much attention to the advantage600 of our model compared with others. When computing the long-601 term value, we have used a relatively simple way to compute the602 monthly average long-term value, which needs some further anal-603 ysis and discussion.
604 6. Uncited reference
605 (Kolter, 1999).
606Reference
607Benoit, D. F., & Van de Poel, D. (2009). Benefits of quantile regression for the analysis608of customer lifetime value in a contractual setting: An application in the609financial services. Expert Systems with Applications, 36, 1045–10484.610Berger, P. D., & Nasr, N. I. (1998). Customer lifetime value: Marketing models and611applications. Journal of Interactive Marketing, 12(1), 17–30.612Bowen, John. T., & Chen, S. L. (2001). The relationship between customer loyalty and613customer satisfaction. International Journal of Contemporary Hospital614Management, 13(5), 213–217.615Breiman, L., Friedman, J. H., Olshen, R. A., & Stone, C. J. (1984). Classification and616regression trees. New York: Chapman & Hall/CRC.617Chan, S. L., Ip, W. H., & Cho, V. (2010). A model for predicting customer value from618perspectives of product attractiveness and marketing strategy. Expert Systems619with Applications, 37, 1207–1215.620Cheng, C. H., & Chen, Y. S. (2009). Classifying the segmentation of customer value via621RFM model and RS theory. Expert Systems with Application, 36, 4176–4184.622Chiu, C. Y., Chen, Y. F., Kuo, I. T., & Ku, He Chun (2009). An intelligent market623segmentation system using k-means and particle swarm optimization. Expert624Systems with Application, 36, 4558–4565.625Courtheoux, R. (1995). Customer retention: How much to invest. Research and the626customer lifecycle. New York: DMA627Donkers, B., Verhoef, P., & Jong, M. G. de. (2007). Modeling CLV: A test of competing628models in the insurance industry. Quantitative Marketing and Economics, 5(2),629163–190.630Duboff, R. S. (1992). Marketing to maximize profitability. The Journal of Business631Strategy, 13(6), 10–13.632Glady, N., Basen, B., & Croux, C. (2009). A modified Pareto/NBD approach for633predicting customer lifetime value. Expert Systems with Applications, 36(2),6342062–2071.635Gloy, B. A., Akridge, J. T., & Preckel, P. V. (1997). Customer lifetime value: An636application in the rural petroleum market. Agribusiness, 13(3), 335–347.637Hung, C., & Tsai, C. F. (2008). Marketing segmentation based on hierarchical self-638organizing map for markets of multimedia on demand. Expert Systems with639Application, 34(1), 780–787.640Hung, S. Y., Yen, David C., & Wang, H. Y. (2006). Applying data mining to telecom641churn management. Expert Systems with Applications, 31, 515–524.642Hwang, H., Jung, T., & Suh, E. (2004). An LTV model and customer segmentation643based on customer value: a case study on the wireless telecommunication644industry. Expert Systems with Application, 26, 181–188.645Kim, S. Y., Jung, T. S., Suh, E. H., & Hwang, H. S. (2006). Customer segmentation and646strategy development based on customer lifetime value: A case study. Expert647Systems with Application, 31, 101–107.648Kolter, P. (1999). Marketing management: Analysis, planning, implementation, and649control (10th ed.). Englewood Cliffs, NJ: Prentice-Hall.650Liang, Y. H. (2010). Integration of data mining technologies to analyze customer651value for the automotive maintenance industry. Expert Systems with652Applications. doi:10.1016/j.eswa.2010.04.097.653Quinlan, J. R. (1996). Improved use of continuous attributes in c4.5. Journal of654Artificial Intelligence Research, 4, 77–90.655Walter, Achim, Ritter, Thomas, & Gemunden, Hans Georg (2001). Value creation in656buyer–seller relationship: theoretical considerations and empirical results from657a supplier’s perspective. Industrial Marketing Management, 30, 363–377.658Zeithaml, V., Rust, R. T., & Lemon, K. N. (2001). The customer pyramid: Creating and659serving profitable customers. California Management Review, 42(4), 118–142.
660
Table 4Numerical results of current value.
Time The number of customers whosecurrent value is more than 50 RMB
The number ofcustomers on thetop of the list
Hitratio(%)
200901 1600449 1527924 95.47200902 1701695 1624843 95.48200903 1716000 1640139 95.58200904 1654274 1580533 95.54
Q4
Q5
Q6
10 S.H. Han et al. / Expert Systems with Applications xxx (2011) xxx–xxx
ESWA 6948 No. of Pages 11, Model 5G
7 October 2011
Please cite this article in press as: Han, S. H., et al. Segmentation of telecom customers based on customer value by decision tree model. Expert Systems withApplications (2011), doi:10.1016/j.eswa.2011.09.034
Original text:
Inserted Text
3(a)
Original text:
Inserted Text
3(b)