A Pilot Research Moored Array in the Tropical Atlantic (PIRATA
13
2019 Bulletin of the American Meteorological Society 1. A scientific rationale The seasonal cycle is the largest ocean–atmosphere signal in the tropical Atlantic. The timing and charac- teristics of the seasonal evolution of the location of the intertropical convergence zone (ITCZ) and of sea sur- face temperature (SST) depend on coupled dynamics and on land–sea contrasts in ways not yet fully under- stood. Part of the interannual variability can be inter- preted as changes of the timing or of amplitude of the seasonal cycle, which imply an important coupling between interannual variability and the seasonal cycle. Understanding the mechanisms involved, and their impact on predictability, are important questions that need to be addressed. Superimposed on the mean seasonal cycle are two modes of ocean–atmosphere variability in the tropi- cal Atlantic with significant impacts on the regional climate of the Americas and Africa. A first mode of climate variability in the tropical Atlantic is similar to the El Niño–Southern Oscillation (ENSO) in the Pa- cific, with manifestations focused primarily near the equator (Zebiak 1993; Chang et al. 1997) (Fig. 1). This equatorial mode varies on seasonal and interannual timescales. During a warm phase, trade winds in the A Pilot Research Moored Array in the Tropical Atlantic (PIRATA) Jacques Servain,* Antonio J. Busalacchi, + Michael J. McPhaden, # Antonio D. Moura, @ Gilles Reverdin, & Marcio Vianna,** and Stephen E. Zebiak ++ ABSTRACT The tropical Atlantic Ocean is characterized by a large seasonal cycle around which there are climatically signifi- cant interannual and decadal timescale variations. The most pronounced of these interannual variations are equatorial warm events, somewhat similar to the El Niño events for the Pacific, and the so-called Atlantic sea surface temperature dipole. Both of these phenomena in turn may be related to El Niño–Southern Oscillation variability in the tropical Pa- cific and other modes of regional climatic variability in ways that are not yet fully understood. PIRATA (Pilot Research Moored Array in the Tropical Atlantic) will address the lack of oceanic and atmospheric data in the tropical Atlantic, which limits our ability to make progress on these important climate issues. The PIRATA array consists of 12 moored Autonomous Temperature Line Acquisition System buoy sites to be occupied during the years 1997–2000 for monitor- ing the surface variables and upper-ocean thermal structure at key locations in the tropical Atlantic. Meteorological and oceanographical measurements are transmitted via satellite in real time and are available to all interested users in the research or operational communities. The total number of moorings is a compromise between the need to put out a large enough array for a long enough period of time to gain fundamentally new insights into coupled ocean–atmosphere inter- actions in the region, while at the same time recognizing the practical constraints of resource limitations in terms of funding, ship time, and personnel. Seen as a pilot Global Ocean Observing System/Global Climate Observing System experiment, PIRATA contributes to monitoring the tropical Atlantic in real time and anticipates a comprehensive ob- serving system that could be operational in the region for the 2000s. *Centre ORSTOM, Brest, France. + Laboratory for Hydrospheric Processes, NASA/Goddard Space Flight Center, Greenbelt, Maryland. # NOAA/Pacific Marine Environmental Laboratory, Seattle, Washington. @ International Research Institute for Climate Prediction, Lamont- Doherty Earth Observatory, Palisades, New York. & LEGOS/GRGS, Toulouse, France. **INPE/Oceanografia, São José dos Campos, São Paulo, Brazil. ++ Lamont-Doherty Earth Observatory, Palisades, New York. Corresponding author address: Dr. Jacques Servain, Centre ORSTOM de Brest, B.P. 70, 29280 Plouzané, France. E-mail: [email protected] In final form 1 June 1998. ©1998 American Meteorological Society
-
Upload
independent -
Category
Documents
-
view
0 -
download
0
Transcript of A Pilot Research Moored Array in the Tropical Atlantic (PIRATA
2019Bulletin of the American Meteorological Society
1. A scientific rationale
The seasonal cycle is the largest ocean–atmospheresignal in the tropical Atlantic. The timing and charac-teristics of the seasonal evolution of the location of the
intertropical convergence zone (ITCZ) and of sea sur-face temperature (SST) depend on coupled dynamicsand on land–sea contrasts in ways not yet fully under-stood. Part of the interannual variability can be inter-preted as changes of the timing or of amplitude of theseasonal cycle, which imply an important couplingbetween interannual variability and the seasonal cycle.Understanding the mechanisms involved, and theirimpact on predictability, are important questions thatneed to be addressed.
Superimposed on the mean seasonal cycle are twomodes of ocean–atmosphere variability in the tropi-cal Atlantic with significant impacts on the regionalclimate of the Americas and Africa. A first mode ofclimate variability in the tropical Atlantic is similar tothe El Niño–Southern Oscillation (ENSO) in the Pa-cific, with manifestations focused primarily near theequator (Zebiak 1993; Chang et al. 1997) (Fig. 1). Thisequatorial mode varies on seasonal and interannualtimescales. During a warm phase, trade winds in the
A Pilot Research Moored Array inthe Tropical Atlantic (PIRATA)
Jacques Servain,* Antonio J. Busalacchi,+ Michael J. McPhaden,# Antonio D. Moura,@
Gilles Reverdin,& Marcio Vianna,** and Stephen E. Zebiak++
ABSTRACT
The tropical Atlantic Ocean is characterized by a large seasonal cycle around which there are climatically signifi-cant interannual and decadal timescale variations. The most pronounced of these interannual variations are equatorialwarm events, somewhat similar to the El Niño events for the Pacific, and the so-called Atlantic sea surface temperaturedipole. Both of these phenomena in turn may be related to El Niño–Southern Oscillation variability in the tropical Pa-cific and other modes of regional climatic variability in ways that are not yet fully understood. PIRATA (Pilot ResearchMoored Array in the Tropical Atlantic) will address the lack of oceanic and atmospheric data in the tropical Atlantic,which limits our ability to make progress on these important climate issues. The PIRATA array consists of 12 mooredAutonomous Temperature Line Acquisition System buoy sites to be occupied during the years 1997–2000 for monitor-ing the surface variables and upper-ocean thermal structure at key locations in the tropical Atlantic. Meteorological andoceanographical measurements are transmitted via satellite in real time and are available to all interested users in theresearch or operational communities. The total number of moorings is a compromise between the need to put out a largeenough array for a long enough period of time to gain fundamentally new insights into coupled ocean–atmosphere inter-actions in the region, while at the same time recognizing the practical constraints of resource limitations in terms offunding, ship time, and personnel. Seen as a pilot Global Ocean Observing System/Global Climate Observing Systemexperiment, PIRATA contributes to monitoring the tropical Atlantic in real time and anticipates a comprehensive ob-serving system that could be operational in the region for the 2000s.
*Centre ORSTOM, Brest, France.+Laboratory for Hydrospheric Processes, NASA/Goddard SpaceFlight Center, Greenbelt, Maryland.#NOAA/Pacific Marine Environmental Laboratory, Seattle,Washington.@International Research Institute for Climate Prediction, Lamont-Doherty Earth Observatory, Palisades, New York.&LEGOS/GRGS, Toulouse, France.**INPE/Oceanografia, São José dos Campos, São Paulo, Brazil.++Lamont-Doherty Earth Observatory, Palisades, New York.Corresponding author address: Dr. Jacques Servain, CentreORSTOM de Brest, B.P. 70, 29280 Plouzané, France.E-mail: [email protected] final form 1 June 1998.©1998 American Meteorological Society

2020 Vol. 79, No. 10, October 1998
western equatorial Atlantic are weak and SSTs nearthe equator are unusually high, especially in the east-ern basin. During a cold phase, trade winds in thewestern equatorial Atlantic are strong and SSTs nearthe equator are unusually low. Onset of an equatorialcold or warm event can occur rapidly on timescalesof weeks to months, mediated by the excitation andpropagation of wind-forced equatorial Kelvin andRossby waves. Climatic impacts of equatorial warmevents include increased rainfall in and around the Gulfof Guinea and disruption of the marine ecosystem inthe Benguela current region (Wagner and da Silva1994; Crawford et al. 1990).
Another mode of interannual climatic variability,which has no counterpart in the Pacific, is character-ized by a north–south interhemispheric gradient in seasurface temperature, the so-called Atlantic dipole (e.g.,Moura and Shukla 1981; Servain 1991; Huang andShukla 1997). This mode involves spatially coherentSST variations in either hemisphere between about 5°–25°N and 5°N–20°S, with seasonal, interannual, anddecadal timescales (Fig. 2). One hypothesis is that theSST dipole structure may be affected by the signalsfrom upwellings off the African coast, where the SST
anomalies are the largest. If the anomalies usuallyappear with opposite sign in each hemisphere, suchdevelopment is not always simultaneous, and there isa debate over whether the northern and southern com-ponents of this dipole are dynamically related or not.Although some data analysis studies using rotatedempirical orthogonal functions (EOFs) exhibit inde-pendent variability at high frequency of the two sidesof the dipole (Houghton and Tourre 1992; Mehta andDelworth 1995; Enfield and Mayer 1995), use of othertechniques (i.e., frequency domain EOFs that separatethe timescales of variability) do exhibit a true tropicaldipole mode at the decadal timescale (Nobre andShukla 1996; Tourre et al. 1998, manuscript submit-ted to J. Climate). An SST dipole index (Servain1991), characterized by low-frequency (decadal) os-cillations during the last three decades, showed re-
FIG. 1. (upper panel) Correlation between the SST anomalyindex ATL3 (the area-averaged SSTA in the outlined region) andSST anomalies at all points in the tropical Atlantic basin, basedon the Servain et al. (1996) analyses for the period 1964–88 ac-cording to Zebiak (1993). (lower panel) Correlation betweenATL3 and the zonal and meridional pseudostress anomalies(plotted in vector format) based on the same analyses and ob-servation period. FIG. 2. The first joint EOF of SST, τx, and τy monthly anoma-
lies over the tropical Atlantic from September 1963 to August1987 according to Nobre and Shukla (1996). (a) The spatial pat-tern and (b) the associated coefficient time series. The contoursrepresent the SST loadings; contour interval is 0.1; negative con-tours are dashed; values greater than 0.4 or lower than –0.5 areshaded; the zero contour is not drawn. The arrows represent thevectorial sum of τx and τy loadings; the vectors are scaled accord-ingly to the arrow plotted at the lower-right side of the upper panel.

2021Bulletin of the American Meteorological Society
cently (from the beginning of the 1990s)large and rapid fluctuations marked bya succession of positive and negativepatterns close to annual–biennial time-scales (see Climate Diagnostics Bulletin,Vol. 98, No. 1, p. 47). InterhemisphericSST anomalies are intimately related tothe position and intensity of the ITCZand thus exert a considerable influenceon the rainfall over Nordeste and theSahel (Moura and Shukla 1981; Follandet al. 1986; Servain 1991; Enfield andMayer 1995). In particular, a dipole situ-ation such as a warm north and a coldsouth is associated with an intensifiedITCZ displaced north of its normal po-sition, leading to extreme severe droughtconditions in Nordeste and unusuallyhigh rainfall totals in the Sahel.Conversely, SST anomalies of oppositesign are associated with a southwarddisplacement of the ITCZ, favoringmore abundant rainfall in Nordeste(Fig. 3) and drought in the Sahel. Stud-ies suggest that seasonal rainfall vari-ability in Nordeste is predictable a fewseasons in advance using a combinationof tropical Pacific ENSO SST anomaliesand tropical Atlantic SST anomalies(e.g., Ropelewski and Halpert 1987;Hastenrath and Greishar 1993; Graham1994). However, the skill of these fore-casts appears to be more strongly af-fected by tropical Atlantic anomalies (asin the case of Sahelian rainfall) than bythose originating in the Pacific. A bet-ter documentation and understanding ofthe dominant modes of SST variabilityin the tropical Atlantic will likely leadto improvements in forecast skill andlead time for significant climate fluctuations over theAmericas and Africa. SST variability in the northerntropical Atlantic also potentially influences rainfallover the West Indies and North America by modulat-ing the frequency and intensity of storm activity dur-ing the hurricane season (Gray 1990; Gray et al. 1993;Shaeffer 1996; Krishnamurti et al. 1998).
Although some recent modeling studies do suggestthat the thermodynamic feedback between SST, sur-face winds, and latent heat fluxes is important in thephysical processes responsible for interhemispheric
SST variations in the Atlantic (Carton et al. 1996;Chang et al. 1997), other processes may still play arole. There has been an oceanic general circulationmodel simulation establishing that fluctuations of theupper-ocean heat content also occur on decadaltimescales and may play the role of connecting thetwo hemispheres (Huang and Shukla 1997). In otherrespects, very new results based on surface and sub-surface observed and simulated oceanic temperature(Servain et al. 1998; Servain et al. 1998, manuscriptsubmitted to Geophys. Res. Lett.) evidenced that
FIG. 3. (a) Correlation between average February through May precipitation inthe Nordeste region of Brazil and SST. Red (blue) shading indicates regions inwhich above-normal SSTs tend to be observed in conjunction with above (below)normal rainfall in Nordeste (Figure previously published in the PACS ScientificProspectus; courtesy of T. Mitchell). (b) The blue line is the SST dipole index av-eraged during November–December (year 0) of each year (1951–97) using north-ern and southern SST indices from the Climate Diagnostic Data Base, ClimatePrediction Center; the dashed red line, shifted from 1 yr to the left vs the x labels,corresponds to a Nordeste rainy season (February to May; year 1) anomaly index(C. A. Repelli 1998, personal communication).
(a)
(b)

2022 Vol. 79, No. 10, October 1998
the dipole mode and the equatorial mode appear tobe dynamically linked at interannual timescales.Furthermore, the dominant pattern of variability inboth modes involves north–south displacements of theITCZ, as in the annual response. However, the precisephysical processes that would link them are not fullyunderstood and must continue to be addressed.
Low-frequency variations in winds and SST do notappear to be self-sustaining through coupled ocean–atmosphere interactions in the tropical Atlantic alone,and some external stimulus is required to initiate theseoscillations (Zebiak 1993). ENSO provides one pos-sible source of external forcing (Delécluse et al. 1994),given that a low Southern Oscillation index (SOI)—characteristic of warm conditions in the Pacific—isassociated with strong western Atlantic easterlies, andvice versa (Fig. 4). That was particularly the case inmid-1997 during the rapid growth of the exceptional1997–98 El Niño. Thus, another mode of climate vari-ability that affects the Atlantic basin, albeit remotely,is the ENSO cycle. There is a significant correlationat lags of a few months between the ENSO and thedevelopment of SST anomalies in the north tropicalAtlantic (Enfield and Mayer 1997; Penland andMatrasova 1998), though the ENSO could also be as-sociated with the development of the dipole mode inboth hemispheres of the tropical Atlantic (Servain1991). The remote influences of ENSO on Atlanticclimate variability is complicated since both the At-lantic dipole and equatorial modes also interact with
the ENSO cycle (Enfield and Mayer 1997; Harzallahet al. 1996). So ENSO may be a factor that weakensthe antisymmetric pattern of the tropical Atlantic oninterannual timescales.
2. A need for a new monitoring systemin the tropical Atlantic
Unresolved issues concerning the genesis and evo-lution of ocean–atmosphere interactions in the tropi-cal Atlantic require further investigation in order toadvance our understanding of climate variability in theregion. For example, what role does the mean seasonalcycle play in the development of interannual andlonger timescale anomalies? What is the dynamicalrelationship (if any) between the northern and south-ern poles of the dipole mode? Besides the recentlyproposed processes outlined above, are there othercoupled ocean–atmosphere processes that give rise tothe observed SST and upper temperature anomaliesin both the dipole mode and the equatorial mode?What sets the timescale for their development? Whatis the relative importance of the Pacific ENSO versusregional-scale ocean–atmosphere interactions in de-termining the evolution of climate variability in theAtlantic? In a general sense we expect that away fromthe equator air–sea heat exchanges will be importantin generating SST anomalies, whereas near the equa-tor, ocean dynamics are likely to take on greater sig-
FIG. 4. (a) Complex correlation coefficient of the 1964–95 SOI anomaly time series, 5-month average centered on January, withobserved wind stress anomaly in May in the total tropical Atlantic. Coefficients are multiplied by 100; only values greater than orequal to 50 (95% confidence level) are represented. (b) The full line is the time series of 1945–95 SOI anomaly, 3-month averagecentered on February; the dashed line is the time series of 1945–93 zonal wind stress anomaly in May at 0°, 35°W. All anomalies [(a), (b)]are standardized. SOI data are from Climate Diagnostic Data Base, Climate Prediction Center; wind data in (a) are from Servain et al.(1996), wind data in (b) are from University of Wisconsin—Milwaukee/Comprehensive Ocean–Atmosphere Data Set (da Silva et al. 1994).
(b)(a)
50
50
50
50
60
60
70
80
CC ** SOI(11-03) X PWS(05) ** 1964-1995
60W 50W 40W 30W 20W 10W 0 10E20S
10S
EQ
10N
20N
30N
100

2023Bulletin of the American Meteorological Society
nificance. In the atmosphere, we expect that the chang-ing pattern of SST anomalies will affect surface con-vergence, atmospheric deep convection, and thecirculation of the troposphere (e.g., Lindzen andNigam 1987; Zebiak and Cane 1987), and that in turnthese changes in atmospheric circulation will driveocean currents and surface heat fluxes that influencethe heat balance of the upper ocean. However, therehave been few quantitative evaluations of these pro-cesses in the Atlantic because of the lack of appropri-ate datasets, particularly in the ocean. Oceanic andatmospheric numerical models, of course, can providevaluable insights into the working of the climate sys-tem in the tropical Atlantic (e.g., Carton and Huang1994; Zebiak 1993). Unfortunately, models in general,and tropical ocean models in particular, are very sen-sitive to inaccuracies in surface forcing and parameter-ized model physics (Blanke and Delécluse 1993;Bryan et al. 1995; Mehta and Delworth 1995). Hence,high quality climate datasets are needed to improvethe specification of surface forcing and physical pa-rameterizations and to facilitate model validation. Inother words, the use of models as a diagnostic tool re-inforces, rather than obviates, the need for critical highquality datasets.
The oceanic in situ data base in the Atlantic atpresent derives primarily from volunteer observingship (VOS) programs, coastal and island tide gaugestations, and a small number of drifting buoys. However,VOS measurements of surface meteorology and sub-surface temperatures are concentrated mainly alongwell-traveled shipping routes, in between which thereare large data gaps. Moreover, time series measure-ments of winds, upper-ocean temperatures, and otherdatasets collected during the 1982–84 Français–Océan–Climat Atlantique Equatorial/The SeasonalResponse of the Equatorial Atlantic (FOCAL/SEQUAL) experiment (Weisberg and Weingartner1986; Houghton and Colin 1986; Katz 1987) indicatea broad spectrum of high-frequency variability thatwould be aliased into infrequent quasi-monthly ship-board surveys. Tide gauge stations provide highly re-solved time series of sea level data but are relativelyfew in number and not optimally located for climatestudies. Drifting buoys, which provide estimates ofSST and mixed layer velocity, are at present concen-trated mainly north of 20°N and therefore supply littledata in critical regions near and south of the equator.Satellite estimates of some key variables (surfacewinds, SST, and sea level) are available over the wholeAtlantic basin with more uniform spatial and tempo-
ral resolution. Indeed, the satellites are valuable toolsin providing spatial coherence and cover of surfaceproperties. However, satellites do not deliver directmeasurements of subsurface thermal structure in theocean, which is essential for understanding processesaffecting the evolution of SST. Moreover, satellitemeasurements are subject to potentially significantbias errors because they rely on complicated algo-rithms to convert electromagnetic signals emanatingfrom the sea surface into geophysically meaningfulvariables.
Therefore, in view of present limitations in theexisting database for tropical Atlantic climate studies,we have developed in the Atlantic a program ofmoored measurements similar to the Tropical Atmo-sphere–Ocean (TAO) array used to study ENSO vari-ability in the equatorial Pacific. This program isdesigned to improve our understanding of the pro-cesses by which the ocean and atmosphere couple inkey regions of the tropical Atlantic. The program,called PIRATA (Pilot Research Moored Array in theTropical Atlantic), will provide finely resolved timeseries measurements of surface heat and moisturefluxes, sea surface temperature and salinity, and sub-surface temperature and salinity in the upper 500 m.
Specifically, the scientific goals of PIRATA are1) to provide an improved description of the seasonal-to-interannual variability in the upper ocean and at theair–sea interface in the tropical Atlantic, 2) to improveour understanding of the relative contributions of thedifferent components of the surface heat flux andocean dynamics to the seasonal and interannual vari-ability of SST within the tropical Atlantic basin, and3) to provide a dataset that can be used to develop andimprove predictive models of the coupled Atlanticclimate system. PIRATA also has important techni-cal goals: to design, deploy, and maintain a pilot ar-ray of moored oceanic buoys, similar to the TAO arrayused during the Tropical Ocean Global Atmosphere(TOGA) program in the tropical Pacific, and to col-lect and transmit via satellite in real time a set of oce-anic and atmospheric data to monitor and study theupper ocean and atmosphere of the tropical Atlantic.
3. The PIRATA program
The field phase of the PIRATA program began inlate 1997 and is scheduled to last for three years.Indeed, PIRATA came at a very opportune time whenthe Atlantic was experiencing the largest and most

2024 Vol. 79, No. 10, October 1998
widespread SST anomalies since 1984 (Fig. 5).PIRATA is envisioned as part of a multinational
effort involving Brazil, France, and the United States.The moorings used in the PIRATA array are primarilyATLAS (Autonomous Temperature Line AcquisitionSystem) moorings like those used in the equatorialPacific as part of the TAO Array (Hayes et al. 1991;McPhaden et al. 1998). ATLAS mooring design hasbeen upgraded, with several new-generation systemsalready deployed in the Pacific since the beginning of1996. In general, the new-generation ATLAS retainsmany of the characteristics of the original ATLASdesign (multivariate measurements, relatively lowcost, real-time data stream), but with improved accu-racy, temporal resolution, flexibility in vertical sensorarray design, and increased number of variables mea-sured (Milburn et al. 1996). Measurements below thesurface are transmitted to a processor on the surfacebuoy from sensors inductively coupled to the moor-ing line. All the data is relayed to shore via the Ser-vice Argos satellite system. The design lifetime of themooring is 1 yr.
The variables measured are surface winds, SST, seasurface conductivity (salinity), air temperature, rela-tive humidity, incoming shortwave radiation, rainfall,subsurface temperature (10 depths in the upper 500 m),subsurface conductivity (three depths in the upper
500 m), and subsurface pressure (at 300 and 500 m).The latter measurements are made to determine moor-ing line shape, which can be used to correct for anysignificant vertical movement in the subsurface sen-sor arrays. Placement of the subsurface temperatureand conductivity sensors on the mooring line are 20,40, 60, 80, 100, 120, 150, 200, 300, and 500 m. Winds,air temperature, and relative humidity are measuredusing R.M. Young wind assemblies and Rotronic air/humidity sensors. Rainfall is measured with an R.M.Young Siphon gauge similar in design to that deployedduring TOGA Coupled Ocean–Atmosphere ResponseExperiment (TOGA COARE) on the Woods HoleOceanographic Institution Improved MeteorologicalSensor (IMET) mooring (Weller and Anderson 1996).Incoming shortwave radiation is measured with anEppley Precision Spectral Pyranometer (PSP). Allocean temperature measurements are made with thePacific Marine Environmental Laboratory (PMEL)minitemperature recorders. Salinity is determinedfrom SeaBird SeaCat-type electromechanical sensors.Based on laboratory calibrations and field tests, weexpect accuracies of about 0.2–0.5 m s−1 for windspeed, 0.2°C for air temperature, 2%–4% for relativehumidity, 0.03°C for ocean temperatures, 0.02–0.05‰for salinity, and 3% relative accuracy for shortwaveradiation (McCarty and McPhaden 1993; Mangumet al. 1994; Freitag et al. 1995; Cronin and McPhaden1997). Measurements of rainfall in the open ocean areproblematical regardless of what type of sensor or plat-form is used; we expect that siphon gauges mountedon the ATLAS moorings provide measurements ofrain rate accurate to within 0.010%, which would bebetter than the 0.030% accuracies obtained from opti-cal rain gauges on TAO buoys during COARE (Croninand McPhaden 1997). All data are collected and in-ternally recorded at 10-min intervals. Daily averagesand some spot 10-min samples are telemetered toshore via Service Argos. A subset of the data is retrans-mitted via the Global Transit System (GTS) for dis-tribution to support operational weather and climateforecasting at national meteorological and oceano-graphic centers around the world.
The PIRATA moored array consists of 12 ATLASmoorings spanning 15°N–10°S, 38°W–0° (Fig. 6). Theschedule for development of the moored array isshown in Table 1.
The dates in Table 1 are approximate and shouldbe viewed as indicative of the preferred phasing of theimplementation plan. The first phase of five buoys(shown by solid red circles in Fig. 6) has been deployed
FIG. 5. SST and pseudo–wind stress anomaly in December1997, during one of the warmest episodes that occurred in thetropical Atlantic in many decades [courtesy of J. Stricherz(COAPS/FSU)].

2025Bulletin of the American Meteorological Society
FIG. 6. The PIRATA array deployment, 1997–2000. Five buoys (shown by solidred circles) were already deployed during the first phase between September 1997and February 1998. The second and third phases of deployment are representedby solid blue and green circles, respectively. Other observational sites (wind, sealevel, . . .) are also schematized.
during the period September 1997–Feb-ruary 1998. These buoys will be recov-ered 1 yr later and a second set of fivebuoys will be deployed at the beginningof 1999. The array will be at full strengthby July 1999. This array of 12 mooringswill then be maintained for a full year (atleast) until July 2000. Thus, we will haveaccumulated 3 yr of data at the originalfive sites in the array and a full year ofhigher spatial-resolution data at all 12 sites.
The total number of new mooringsrequired to implement the PIRATA planis 20, which accounts for the 1-yr designlifetime of the ATLAS mooring systemand the staggering of cruises in 1999–2000 at 6-month intervals to turn aroundrecovered systems for later redeploy-ment. It also takes into account losses ofmooring systems due to catastrophicmechanical failure or, more commonly,due to vandalism associated with tunafisheries. These losses have historically been about10% in the Pacific, and they are factored into our planfor the Atlantic at that level. By prior agreement theresponsibility for purchasing ATLAS mooring sys-tems is shared by Brazil (five systems), France (fivesystems), and the United States (10 systems). Allmoorings during the pilot study are built by PMEL,which is also responsible for shipping, calibration,laboratory check outs, and instrument refurbishment.Logistic support in terms of ship time for developingand maintaining the PIRATA moored array is mainlythe responsibility of Brazil and France. A Brazilian re-search vessel (RV) is servicing the western half of thearray and a French RV is servicing the eastern half ofthe array. Servicing the entire 12 mooring arrays oncea year requires about a total of 80 days of ship time.During PIRATA cruises conductivity–temperature–depth probe (CTD) stations are occupied every 1°along latitude transects and every 4° along longitudetransects.
The specific configuration ofthe PIRATA array has been cho-sen to provide coverage alongthe equator of regions of strongwind forcing in the western ba-sin and significant seasonal-to-interannual variability in SST inthe central and eastern basin.Hackert et al. (1998) performed
a series of observing system simulation experimentsto help determine the optimal location of a limitednumber of PIRATA moorings when considering ver-tically integrated and related quantities such as upper-ocean heat content, dynamic topography, andthermocline fluctuations. The spacing of mooringsnear the equator (10°–15° zonally and 2° meridionally)has been chosen to resolve the rapid equatorial Kelvinwave responses to abrupt wind changes in the west-ern Atlantic (the ENSO-like mode). Meridional moor-ing sections extend northward along 38°W from 4° to15°N, and southward along 10°W from 2°N to 10°S.This array covers the regions of high SST variabilityassociated with the SST dipole mode. The meridionalspacing of moorings (2°–5°) is chosen to provide aminimal definition of coherent structures in the sur-face boundary layers of the ocean and the atmosphereon seasonal timescales across the range of latitudes on
Date (month/year) Sep 1997– Mar 1999 July 1999 July 2000–Feb 1998 Mar 2001
Total moorings at sea 5 10 12 12
TABLE 1. PIRATA implementation schedule.
First Second Third End ofphase phase phase PIRATA
2026 Vol. 79, No. 10, October 1998
each of the two lines (38° and 10°W). The zonal off-set of the lines is dictated by the zonal offset of maxi-mum SST variability in the Northern and SouthernHemispheres.
This ATLAS array cuts across a wide range of cli-matic regimes in terms of air–sea interaction. Alongthe equator, it extends from the cold tongue in the eastwhere the oceanic thermocline is shallow, where equa-torial upwelling is strong, and where oceanic heat gainis large to the western Atlantic warm pool where theoceanic thermocline is deep and net oceanic heat gainis small. Meridionally, the array traverses the ITCZ, aregion of high SST, weak winds, high cloudiness andprecipitation, low solar irradiance, and low evapora-tion. In contrast, in the northeast tradewind regionnorth of the ITCZ along 38°W, conditions are drier andless cloudy, the winds are stronger, and the SSTs arelower. The region south of the equator along 10°W isin the southeast trade wind regime. The relatively lowSSTs off the equator in this region may be related inpart to offshore influence of coastal upwelling in theBenguela Current region and to the presence of thelow-level marine stratus decks. Direct estimates ofcurrents along the equator are important because of therole of ocean dynamics in creating SST anomaliesthere. An acoustic Doppler current profiler mooringwill be deployed at 0°, 20°W to monitor current varia-tions in the central Atlantic. This location is one ofhigh zonal current variability in a region whereinterannual SST anomalies are also of significant am-plitude, indicating a potentially significant role forzonal advection in creating thermal anomalies. Also,fluctuations in zonal mass transport in the EquatorialUndercurrent, which can be monitored at this moor-ing site, may be related to variations in upwelling in-tensity in the equatorial cold tongue.
In addition to direct measurements of velocity atthe equator, the array will provide indices of zonalgeostrophic mass transport along 38° and 10°W.Temperature and salinity time series data can be usedto compute dynamic heights relative to 500 m, fromwhich geostrophic flow between mooring locationscan be estimated. Thus, for example, we will be ableto examine both seasonal and interannual velocitytransport variations in the South Equatorial Current,the North Equatorial Current, and the North Equato-rial Countercurrent. Furthermore, we can examine therelationship of these current variations to wind forc-ing and SST variability.
The importance of wind forcing and its responsein terms of ocean wave dynamical processes argue
strongly for the incorporation into the array of windand sea level measurements at a few strategically lo-cated islands (Fig. 6). St. Peter and St. Paul’s Rocks(0.7°N, 29.2°W), previously instrumented during FO-CAL/SEQUAL, is a small island with little topo-graphic relief, so that winds measured there arerepresentative of those over the open ocean. The is-land lies in a key region of strong wind forcing whereinterannual variations in the zonal wind component arehighly correlated with the SOI. Wind measurementsfrom St. Peter and St. Paul’s Rocks will provide valu-able information on the small-scale structure of thewind field in the western Atlantic. Wind and sea levelmeasurements at Atol das Rocas (3.9°S, 33.5°W)would extend the measurement array along thewesternmost mooring line into the Southern Hemi-sphere. This extension is particularly important fortracking seasonal migrations of the ITCZ and for de-fining the meridional structure of surface height varia-tions between 4°S and 15°N. Continued maintenanceof the tide gauge station at São Tomé (0.5°N, 6.5°E)allows detection of thermally and dynamically forcedsea level variations in the eastern equatorial Atlantic.Existing sea level and wind measurements from As-cension Island (7.9°S, 14.4°W) will provide valuablein situ data in the central basin south of the equator.This is a region of strong southeast trade wind forc-ing poorly sampled by VOS measurements. Finally,Brazil plans to implement a network of meteorologi-cal buoys on its continental shelf as a contribution toGOOS. High priority will be given to implementingone of these buoys during PIRATA to extend the defi-nition of wind forcing along the equator to the westof the 35°W meridian. It is anticipated that some ofthese coastal buoys will measure subsurface tempera-ture as well. Such measurements, to be initiated at 0°,44°W during PIRATA, would provide a descriptionof wind and temperature variability along the equatorwith 5°–10° zonal resolution over nearly 5000 km (be-tween 0° and 44°W).
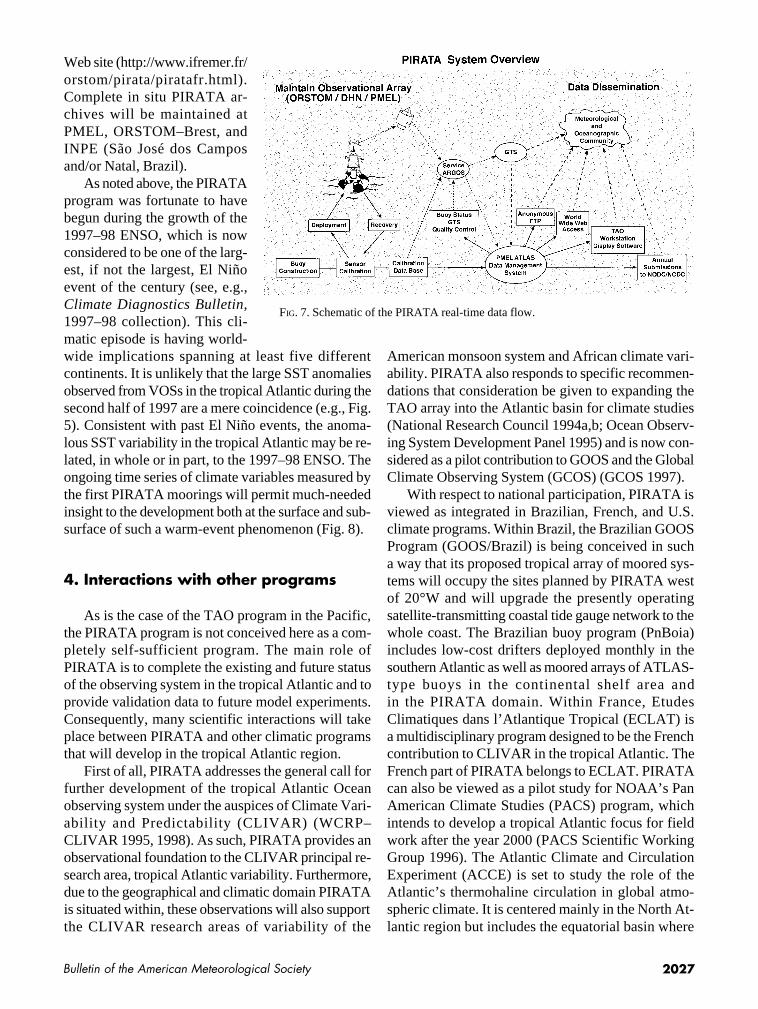
In addition to the real-time GTS data stream,PMEL maintains data processing, error checking, ar-chiving, and dissemination based on well-establishedprocedures developed over the past 20 years of Pacific-based mooring research. All data are available viaanonymous FTP and via the World Wide Web (http://www.pmel.noaa.gov/pirata) (Fig. 7). Thanks to anelectronic link between PMEL (Seattle, Washington)and Centre ORSTOM (Brest, France), the real-timedata (and news updates about the PIRATA progress)are also directly available on the ORSTOM–Brest
2027Bulletin of the American Meteorological Society
Web site (http://www.ifremer.fr/orstom/pirata/piratafr.html).Complete in situ PIRATA ar-chives will be maintained atPMEL, ORSTOM–Brest, andINPE (São José dos Camposand/or Natal, Brazil).
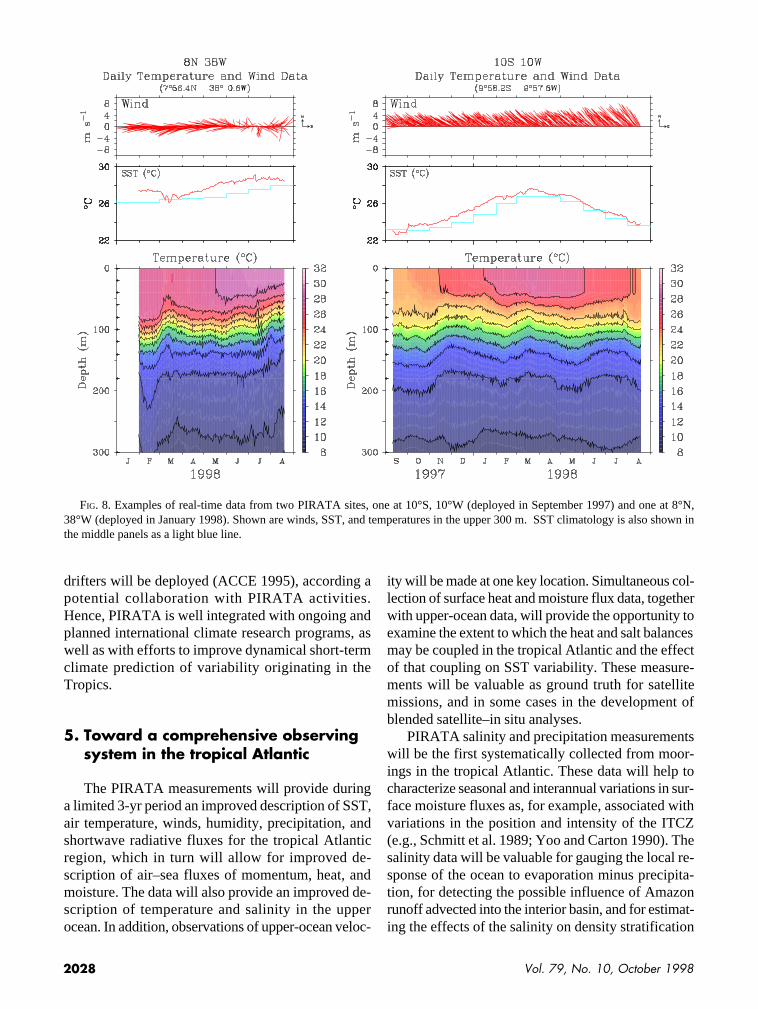
As noted above, the PIRATAprogram was fortunate to havebegun during the growth of the1997–98 ENSO, which is nowconsidered to be one of the larg-est, if not the largest, El Niñoevent of the century (see, e.g.,Climate Diagnostics Bulletin,1997–98 collection). This cli-matic episode is having world-wide implications spanning at least five differentcontinents. It is unlikely that the large SST anomaliesobserved from VOSs in the tropical Atlantic during thesecond half of 1997 are a mere coincidence (e.g., Fig.5). Consistent with past El Niño events, the anoma-lous SST variability in the tropical Atlantic may be re-lated, in whole or in part, to the 1997–98 ENSO. Theongoing time series of climate variables measured bythe first PIRATA moorings will permit much-neededinsight to the development both at the surface and sub-surface of such a warm-event phenomenon (Fig. 8).
4. Interactions with other programs
As is the case of the TAO program in the Pacific,the PIRATA program is not conceived here as a com-pletely self-sufficient program. The main role ofPIRATA is to complete the existing and future statusof the observing system in the tropical Atlantic and toprovide validation data to future model experiments.Consequently, many scientific interactions will takeplace between PIRATA and other climatic programsthat will develop in the tropical Atlantic region.
First of all, PIRATA addresses the general call forfurther development of the tropical Atlantic Oceanobserving system under the auspices of Climate Vari-ability and Predictability (CLIVAR) (WCRP–CLIVAR 1995, 1998). As such, PIRATA provides anobservational foundation to the CLIVAR principal re-search area, tropical Atlantic variability. Furthermore,due to the geographical and climatic domain PIRATAis situated within, these observations will also supportthe CLIVAR research areas of variability of the
American monsoon system and African climate vari-ability. PIRATA also responds to specific recommen-dations that consideration be given to expanding theTAO array into the Atlantic basin for climate studies(National Research Council 1994a,b; Ocean Observ-ing System Development Panel 1995) and is now con-sidered as a pilot contribution to GOOS and the GlobalClimate Observing System (GCOS) (GCOS 1997).
With respect to national participation, PIRATA isviewed as integrated in Brazilian, French, and U.S.climate programs. Within Brazil, the Brazilian GOOSProgram (GOOS/Brazil) is being conceived in sucha way that its proposed tropical array of moored sys-tems will occupy the sites planned by PIRATA westof 20°W and will upgrade the presently operatingsatellite-transmitting coastal tide gauge network to thewhole coast. The Brazilian buoy program (PnBoia)includes low-cost drifters deployed monthly in thesouthern Atlantic as well as moored arrays of ATLAS-type buoys in the continental shelf area andin the PIRATA domain. Within France, EtudesClimatiques dans l’Atlantique Tropical (ECLAT) isa multidisciplinary program designed to be the Frenchcontribution to CLIVAR in the tropical Atlantic. TheFrench part of PIRATA belongs to ECLAT. PIRATAcan also be viewed as a pilot study for NOAA’s PanAmerican Climate Studies (PACS) program, whichintends to develop a tropical Atlantic focus for fieldwork after the year 2000 (PACS Scientific WorkingGroup 1996). The Atlantic Climate and CirculationExperiment (ACCE) is set to study the role of theAtlantic’s thermohaline circulation in global atmo-spheric climate. It is centered mainly in the North At-lantic region but includes the equatorial basin where
FIG. 7. Schematic of the PIRATA real-time data flow.
2028 Vol. 79, No. 10, October 1998
drifters will be deployed (ACCE 1995), according apotential collaboration with PIRATA activities.Hence, PIRATA is well integrated with ongoing andplanned international climate research programs, aswell as with efforts to improve dynamical short-termclimate prediction of variability originating in theTropics.
5. Toward a comprehensive observingsystem in the tropical Atlantic
The PIRATA measurements will provide duringa limited 3-yr period an improved description of SST,air temperature, winds, humidity, precipitation, andshortwave radiative fluxes for the tropical Atlanticregion, which in turn will allow for improved de-scription of air–sea fluxes of momentum, heat, andmoisture. The data will also provide an improved de-scription of temperature and salinity in the upperocean. In addition, observations of upper-ocean veloc-
ity will be made at one key location. Simultaneous col-lection of surface heat and moisture flux data, togetherwith upper-ocean data, will provide the opportunity toexamine the extent to which the heat and salt balancesmay be coupled in the tropical Atlantic and the effectof that coupling on SST variability. These measure-ments will be valuable as ground truth for satellitemissions, and in some cases in the development ofblended satellite–in situ analyses.
PIRATA salinity and precipitation measurementswill be the first systematically collected from moor-ings in the tropical Atlantic. These data will help tocharacterize seasonal and interannual variations in sur-face moisture fluxes as, for example, associated withvariations in the position and intensity of the ITCZ(e.g., Schmitt et al. 1989; Yoo and Carton 1990). Thesalinity data will be valuable for gauging the local re-sponse of the ocean to evaporation minus precipita-tion, for detecting the possible influence of Amazonrunoff advected into the interior basin, and for estimat-ing the effects of the salinity on density stratification
FIG. 8. Examples of real-time data from two PIRATA sites, one at 10°S, 10°W (deployed in September 1997) and one at 8°N,38°W (deployed in January 1998). Shown are winds, SST, and temperatures in the upper 300 m. SST climatology is also shown inthe middle panels as a light blue line.
2029Bulletin of the American Meteorological Society
in the surface layer. The potential for rain-induced salt-stratified barrier layers to inhibit vertical turbulentmixing to shallow depths in regions of high precipi-tation in the equatorial Atlantic may be of possibleclimatic significance (Murtugudde and Busalacchi1998) as has been hypothesized for the equatorialPacific (Lukas and Lindstrom 1991; Ando andMcPhaden 1997).
PIRATA measurements will allow a better under-standing of the relative contributions of the differentcomponents of surface heat flux to observed SST vari-ability on seasonal-to-interannual timescales in thetropical Atlantic. PIRATA will also contribute to theidentification of ocean dynamical processes (e.g.,equatorial Kelvin wave excitation and propagation) inthe development of climatic variability and help fur-ther stimulate advances in our conceptual understand-ing of the climate dynamics in the region. Althoughdecadal or longer-term variability cannot be addressedover the time period of PIRATA, the foundation forlong time series measurements that could be used tostudy such variability will be set in place. Satellite and/or operational atmospheric analyses that will be aug-mented by PIRATA observations will be helpful inbetter understanding the variations in atmosphericheating and its relation to SST.
PIRATA will be extremely useful for validationof regional ocean, atmosphere, and coupled models.It will also provide high quality data to allow for quan-titative assessment of model physical parameteriza-tions. The PIRATA data, in conjunction with otherobservations and observational products, will provideimproved forcing fields for uncoupled model sim-ulation studies of both oceanic and atmospheric vari-ability. PIRATA data are already on the GTStelecommunication network data stream and makingtheir way into the operational analyses at the majornational weather prediction centers. PIRATA data willserve as important input to model assimilation sys-tems applicable both to diagnostic analyses and forinitialization of regional climate predictions. Such pre-dictions may help to mitigate the impacts of severedroughts over the adjoining continental regions influ-enced by the Atlantic. Finally, the PIRATA data willhelp in determining the relationships between regionalimpacts of climate variations used in agriculture andfisheries in South America and West Africa.
The idea of PIRATA as a pilot project is to estab-lish the extent to which the ATLAS moored technol-ogy is a meaningful and cost-effective observationalsystem in the Atlantic. During the 3-yr period of the
PIRATA program we will adapt the technology to thescience problems and solve maintenance and logisti-cal problems that might arise. It is expected that at theend of the pilot phase of PIRATA and after demon-stration of the success of the observational system andthe science performed, other nations will join in themaintenance and desirable expansion of the array inorder to make PIRATA a routine basic observationalsystem in the tropical Atlantic as part of GOOS andGCOS.
We hope that this paper, along with another sucharticle containing initial results when available, cango a long way toward convincing the scientific com-munity and funding agencies to support such anobserving program. Thus the PIRATA array will beput in place permanently in the tropical Atlantic toquantitatively study seasonal to longer-term climaticvariability.
Acknowledgments. We would like to thank Jim Carton, JeanCiteau, Silvia Garzoli, Nick Graham, Ed Harrison, CharlesMcClain, Christophe Menkes, Bob Molinari, Paulo Nobre, MichelOllitraut, Jean-Paul Rebert, Kevin Trenberth, Fritz Schott, Jean-Marc Verstraete, Bob Weisberg, and Bill Woodward for theireditorial contributions to the early PIRATA Scientific Prospec-tus [available online at http://www.ifremer.fr/orstom/pirata/piratafr.html]. Useful comments were also provided by severalparticipants attending the first four PIRATA meetings, as well bythree reviewers of the final draft. The PIRATA logo was designedby Pierre Campana.
References
ACCE, 1995: A program design for an Atlantic circulation andclimate experiment. U.S. Contribution to WOCE and ACCP,112 pp. [Available from U.S. WOCE Office, Dept. of Oceanog-raphy, Texas A&M Univ., College Station, TX 77843-3146.]
Ando, K., and M. J. McPhaden, 1997: Variability of surface layerhydrography in the tropical Pacific Ocean. J. Geophys. Res.,102, 23 063–23 078.
Blanke, B., and P. Delécluse, 1993: Variability of the tropicalAtlantic Ocean simulated by a general circulation model withtwo different mixed layer physics. J. Phys. Oceanogr., 23,1363–1388.
Bryan, F. O., I. Wainer, and W. R. Holland, 1995: Sensitivity ofthe tropical Atlantic circulation to specification of wind stressclimatology. J. Geophys. Res., 100, 24 729–24 744.
Carton, J. A., and B. Huang, 1994: Warm events in the tropicalAtlantic. J. Phys. Oceanogr., 24, 888–903.
——, X. Cao, B. S. Giese, and A. M. da Silva, 1996: Decadal andinterannual SST variability in the tropical Atlantic. J. Phys.Oceanogr., 26, 1165–1175.
Chang, P., L. Ji, and H. Li, 1997: A decadal climate variation inthe tropical Atlantic Ocean from thermodynamic air–sea in-teractions. Nature, 385, 516–518.

2030 Vol. 79, No. 10, October 1998
Crawford, R. J. M., W. R. Siegfried, L. V. Shannon, C. A.Villacastin–Herroro, and L. G. Underhill, 1990: Environmen-tal influences on marine biota off southern Africa. S. Afr. J.Sci., 86, 330–339.
Cronin, M., and M. J. McPhaden, 1997: The upper ocean heatbalance in the western equatorial Pacific warm pool duringSeptember–December 1992. J. Geophys. Res., 102, 8533–8553.
da Silva, A. M., C. C. Young, and S. Levitus, 1994: Anomalies ofDirectly Observed Quantities. Vol. 2, Atlas of Surface MarineData. U.S. Department of Commerce, 416 pp.
Delécluse, P., J. Servain, C. Levy, K. Arpe, and L. Bengsston,1994: On the connection between the 1984 Atlantic warmevent and the 1982–83 ENSO. Tellus, 46A, 448–464.
Enfield, D. B., and D. A. Mayer, 1995: Tropical Atlantic SSTvariability and its relation to Pacific SST and western hemi-sphere rainfall. ACCP Notes, 2, 4–8.
——, and ——, 1997: Tropical Atlantic SST variability and itsrelation to El Niño–Southern Oscillation. J. Geophys. Res.,102, 929–945.
Folland, C., T. Palmer, and D. Parker, 1986: Sahel rainfall andworldwide sea temperatures: 1901–85. Nature, 320, 602–606.
Freitag, H. P., Y. Feng, L. J. Mangum, M. P. McPhaden,J. Neander, and L. D. Stratton, 1995: Calibration proceduresand instrumental accuracy estimates of TAO temperature, rela-tive humidity and radiation measurements. NOAA Tech.Memo. ERL PMEL-104, 32 pp. [Available from Pacific Ma-rine Environmental Laboratory, 7600 Sand Point Way, Seattle,WA 98115.]
GCOS, 1997: In situ observations for the Global Observing Sys-tems. GCOS-28, WMO/TD 793, and UNEP/DEIA/MR.97-3.[Available from World Meteorological Organization, CasePostale 2300, CH-1211, Geneva 2, Switzerland.]
Graham, N., 1994: Experimental predictions of wet season pre-cipitation in Northeastern Brazil. Proc. 18th Annual ClimateDiagnostics Workshop, Boulder, Colorado, NOAA. [Availablefrom Pacific Marine Environmental Laboratory, 7600 SandPoint Way, Seattle, WA 98115.]
Gray, W. M., 1990: Strong association between west African rain-fall and U.S. landfall of intense hurricanes. Sciences, 249,1251–1256.
——, C. W. Landsea, P. W. Mielke, and K. J. Berry, 1993: Pre-dicting Atlantic basin seasonal tropical cyclone activity by 1August. Wea. Forecasting, 8, 73–86.
Hackert, E. C., R. N. Miller, and A. J. Busalacchi, 1998: An opti-mized design for a moored instrument array in the tropicalAtlantic Ocean. J. Geophys. Res., 103, 7491–7509.
Harzallah, A., J. O. Rocha de Aragao, and R. Sadourny, 1996:Interannual rainfall variability in north-east Brazil: Observa-tion and model simulation. Int. J. Climatol., 16, 861–878.
Hastenrath, S., and L. Greishar, 1993: Further work on the pre-diction of northeast Brazil rainfall anomalies. J. Climate, 6,743–758.
Hayes, S. P., L. J. Mangum, J. Picaut, A. Sumi, and K. Takeuchi,1991: TOGA–TAO: A moored array for real-time measure-ments in the tropical Pacific Ocean. Bull. Amer. Meteor. Soc.,72, 339–347.
Houghton, R. W., and C. Colin, 1986: Thermal structure along4°W in the Gulf of Guinea during 1983–1984. J. Geophys.Res., 91, 11 727–11 739.
——, and Y. Tourre, 1992: Characteristics of low-frequency seasurface temperature fluctuations in the tropical Atlantic. J.Climate, 5, 765–771.
Huang, B., and J. Shukla, 1997: Characteristics of the interan-nual and decadal variability in a general circulation model ofthe tropical Atlantic Ocean. J. Phys. Oceanogr., 27, 1693–1712.
Katz, E. J., 1987: Seasonal response of the sea surface to the windin the equatorial Atlantic. J. Geophys. Res., 92, 1885–1893.
Krishnamurti, T. N., R. Correa–Torres, M. Latif, andG. Daughenbaugh, 1998: The impact of current and possiblefuture sea surface temperature anomalies on the frequency ofAtlantic hurricanes. Tellus, 50A, 186–210.
Lindzen, R. S., and S. Nigam, 1987: On the role of sea surfacetemperature gradients in forcing low-level winds and conver-gence in the tropics. J. Atmos. Sci., 44, 2418–2436.
Lukas, R. L., and E. Lindstrom, 1991: The mixed layer in the west-ern equatorial Pacific. J. Geophys. Res., 96 (Suppl.), 3343–3357.
Mangum, L. J., H. P. Freitag, and M. J. McPhaden, 1994: TOGA–TAO array sampling schemes and sensor evaluations. Proc.OCEANS 94 OSATES, Brest, France, Communité Urbaine deBrest, II-402–II-406.
McCarty, M. E., and M. J. McPhaden, 1993: Mean seasonal cyclesand interannual variations at 0°N, 165°E during 1986–1992.NOAA Tech. Memo. ERL PMEL-98, 64 pp. [Available fromPacific Marine Environmental Laboratory, 7600 Sand PointWay, Seattle, WA 98115.]
McPhaden, M. J., and coauthors, 1998: The Tropical Ocean Glo-bal Atmosphere (TOGA) observing system: A decade ofprogress. J. Geophys. Res., 130 (C7), 14 169–14 240.
Mehta, V. M., and T. Delworth, 1995: Decadal variability of thetropical Atlantic Ocean surface temperature in shipboard mea-surements and in a global ocean–atmosphere model. J. Cli-mate, 8, 172–190.
Milburn, H. B., P. D. McLain, and C. Meinig, 1996: ATLASbuoy—Reengineering for the next decade. Proc. IEEE/MTSOcean’96, Fort Lauderdale, FL, Institute of Electrical and Elec-tronics Engineers, 698–702.
Moura, A., and J. Shukla, 1981: On the dynamics of droughts innortheast Brazil: Observations, theory, and numerical experi-ments with a general circulation model. J. Atmos. Sci., 38,2653–2675.
Murtugudde, R., and A. J. Busalacchi, 1998: Salinity effects in atropical ocean model. J. Geophys. Res., 103 (C2), 3283–3300.
National Research Council, 1994a: Ocean-atmosphere observa-tions supporting short-term climate predictions. National Acad-emy Press, Washington, DC, 51 pp.
——, 1994b: GOALS: Global Ocean–Atmosphere–Land Systemfor Predicting Seasonal-to-Interannual Climate. NationalAcademy Press, Washington, DC, 103 pp.
Nobre, P., and J. Shukla, 1996: Variations of sea surface tempera-ture, wind stress, and rainfall over the tropical Atlantic andSouth America. J. Climate, 9, 2464–2479.
Ocean Observing System Development Panel, 1995: Scientific de-sign for the common module of the Global Ocean ObservingSystem (GOOS) and the Global Climate Observing System(GCOS): An ocean observing system for climate. Departmentof Oceanography, Texas A&M University, College Station,TX, 265 pp.
2031Bulletin of the American Meteorological Society
PACS Scientific Working Group, cited 1996: Pan American cli-mate studies: A scientific prospectus. [Available online athttp://tao.atmos.washington.edu/pacs.]
Penland, C., and L. Matrasova, 1998: Prediction of tropical At-lantic sea surface temperatures using linear inverse modeling.J. Climate, 11, 483–496.
Ropelewski, C. F., and M. Halpert, 1987: Global and regional scaleprecipitation patterns associated with the El Niño/SouthernOscillation. Mon. Wea. Rev., 115, 1606–1626.
Schmitt, R. W., P. S. Bogden, and C. Dorman, 1989: Evaporationminus precipitation and density fluxes in the North Atlantic.J. Phys. Oceanogr., 19, 1208–1221.
Servain, J., 1991: Simple climatic indices for the tropical Atlan-tic Ocean and some applications. J. Geophys. Res., 96, 15 137–15 146.
——, J. N. Stricherz, and D. L. Legler, 1996: TOGA AtlanticPseudo-Stress Atlas 1985–1994. Centre ORSTOM de Brest,162 pp.
——, I. Wainer, and A. Dessier, 1998a: Evidence d’une liaisonentre les deux principaux modes de variabilité climatiqueinterannuelle de l’Atlantique tropical. Compte-Rendus del’Académie des Sciences de Paris, 327, 1–8.
Shaeffer, J. D., 1995: Tropical cyclone activity as a diagnosticclimate indicator. Proc. 20th Annual Climate DiagnosticsWorkshop, Seattle, WA, NOAA Climate Prediction Center andJoint Institute for the Study of Atmosphere and Ocean, 113–116.
Wagner, R. G., and A. da Silva, 1994: Surface conditions associ-ated with anomalous rainfall in the Guinea coastal region. Int.J. Climatol., 14, 179–199.
WCRP–CLIVAR, 1998: CLIVAR–A study of climate variabil-ity and predictability, science plan. WCRP 89, WMO/TD 690,157 pp. [Available from World Meteorological Organization,Case Postale 2300, CH-1211, Geneva 2, Switzerland.]
——, 1998: CLIVAR initial implementation plan, World ClimateResearch Programme. WCRP 103, WMO/TD 869, 340 pp.[Available from World Meteorological Organization, CasePostale 2300, CH-1211, Geneva 2, Switzerland.]
Weisberg, R. H., and T. J. Weingartner, 1986: On the baroclinicresponse of the zonal pressure gradient in the equatorial At-lantic Ocean. J. Geophys. Res., 91, 11 717–11 725.
Weller, R. A., and S. P. Anderson, 1996: Surface meteorology andair–sea fluxes in the western equatorial Pacific warm poolduring the TOGA Coupled Ocean–Atmosphere Response Ex-periment. J. Climate, 9, 1959–1990.
Yoo, J. M., and J. A. Carton, 1990: Annual and interannual varia-tions of the freshwater budget in the tropical Atlantic Oceanand the Caribbean Sea. J. Phys. Oceanogr., 20, 831–845.
Zebiak, S. E., 1993: Air–sea interaction in the equatorial Atlanticregion. J. Climate, 6, 1567–1586.
——, and M. A. Cane, 1987: A model El Niño–Southern Oscilla-tion. Mon. Wea. Rev., 115, 2262–2278.