Waste Isolation Pilot Plant Compliance Certification ...
314
Waste Isolation Pilot Plant Compliance Certification Application Reference 253 Foster, R.W., 1974. Oil and Gas Potential of a Proposed Site for the Disposal of High-Level Radioactive Waste, ORNLJSUB-442311, New Mexico Bureau of Mines and Mineral resources, Socorro, NM, New Mexico Institute of Mining and Technology. Open-File Report, Contract No. AF(40-1)-4423. Oak Ridge National Laboratory, Oak Ridge, TN.
-
Upload
khangminh22 -
Category
Documents
-
view
0 -
download
0
Transcript of Waste Isolation Pilot Plant Compliance Certification ...

Waste Isolation Pilot Plant
Compliance Certification Application
Reference 253
Foster, R.W., 1974. Oil and Gas Potential of a Proposed Site for the Disposal of High-Level Radioactive Waste, ORNLJSUB-442311, New Mexico Bureau of Mines and Mineral resources, Socorro, NM, New Mexico Institute of Mining and Technology.
Open-File Report, Contract No. AF(40-1)-4423. Oak Ridge National Laboratory, Oak Ridge, TN.

OAK RlffiE W'TIONAL U 8 O ~ ~ Oak Rldgl. T r n ~ -
UNION CARBIDE CORPORATIOF( tor me
DEPARTMENT OF ENERGY . DISZHl1:l l ; ( a 4 #i! 'IF';: IZi CiNI.rBb

ORNL /SUB-4423/1
-
OIL AND GAS POTENTIAL OF A PROPOSED
SfiE FOR THE DISPOSAL OF MGH-LEVEL
RADIOACTIVE WASTE
Roy W. Foster
New Mexico Bureau of Mines a.ad Mineral Resources
New M m c o Institute of Mining and Technology
Student Assistants
New M m c o Institute of Mining and T ethnology
James G. Jensen
Roy E. J o h o n
Walter C. Riese
Randolph C. Smith
Sue E. UmnhIer
Comract No. AF(40 - 1)-4423 Oak Ridge National Laboratories
U. S. Atomic Energy Commiesion
Open- file r eport 1974

CO NT ENTS Page
. . . . . . . . . . . . . . . . . . . . . STR4TIGAXPHY 5
. . . . . . . . . . . . . . . . . Precambrian Rocks 7
Ordovician System . . . . . . . . . . . . . . . . . . 10
Silurian/Devonian Systems . . . . . . . . . . . . . . 18
Pennsylvanain System . . . . . . . . . . . . . . . . 28
a Permian System . . . . . . . . . . . . . . . . . . . 35
Wolfcamp Formati.on . . . . . . . . . . . . . 35
. . . . . . . . . . . . Bone Springs Formation 39
. . . . . . . . . . . Delaware Mountain Group 41
STRUCTURE . . . . . . . . . . . . . . . . . . . . . . 50
. . . GE0LOGICA.L EVALUATION: OIL AND GAS POTENTLAL 63
Ordovician System . . . . . . . . . . . . . . . . . . 63
. . . . . . . . . . . . . . SilurianjDevonian Systems 68
Mississippian System . . . . . . . . . . . . . . . . 72
Pennsylvanian System . . . . . . . . . . . ' . . . . . 72
Permian System . . . . . . . . . . . . . . . . . . 87
Wolfcamp Formation . . . . . . . . . . . . . 88
Bone Springs Formation . . . . . . . . . . . . 93
Delaware Mourtain Group (pre-Ramsey) . . . . . 95
Delaware Mountain Group (Ramsey 2or.e) . . . 98


P a g e
. . . . . E~YP'LORATION STATUS AND ESTIMATED RESERVES 103
. . . . . . . . . . . . . . . . . 0 rdovician System 106
. . . . . . . . . . . . . Silurian/ Devonian Sys tems 106
. . . . . . . . . . . . . . . . Mississ ippian Sys tem 110
. . . . . . . . . . . . . . . . Pennsylvanian Sys tem 112
. . . . . . . . . . . . . . . Wolfcamp Formation 117
. . . . . . . . . . . . . . Bone Springs Formation 119
. . . . . . . Delaware M o u t a i n G m u p (pre-Ramsey) 122
. . . . . . . Delaware Mountain Group (Ramey P a y ) 125
. . . . . . . . . . STATISTICAL OIL AND GlS POTE.NTIAL 129
. . . . . . . . . . . . . . . . . Ordovician Sys tem 135
. . . . . . . . . . . . . Silur ian/ Devonian Systems 142
. . . . . . . . . . . . . . . . Miasissippian Sys tem 153.
. . . . . . . . . . . . . . . PennsylvanianSystem 160
. . . . . . . . . . . . . . . . Wolfcamp i?ormation 187
. . . . . . . . . . . . . . Bone Springs Formation 199
. . . . . . . DelawareMountainGroup(Pro~Iiamsey) 213
Delaware Mountain Group (Ramaey .Pay) . . . . . . . 222
. . . . . . . . . . SE COIVDARY RECOVERY PROJECTIOArS 265
FZTROLEUM EXPLORATION IN PILOT AREA . . . . . . . 271
IVAS'ER IXJECTION AND DISPOSAL W E LLS . . . . . . . . . 276
. . . . . . . . . . . . . . . . . . . . . . COi\7CLUSiOPIS 279
. . . . . . . . . . . . . . . . . . REFERENCES CITED 289
ii

ILLUST RAT IONS Page
FIGURES
1 . Index map . . . . . . . . . . . . . . . . . . . . . 4
2 . Projected section: Center of Pilot area . . . . . . . 6
. . . . . . 3 . Contour map on Precambrian surface Pocket
. . . . . . . . . . . . 4 . Ordovician reference section 12 I . . . . . . . . . . . . . . 5 Isopach map: Ordovician 17
. . . . . . . . 6 . Silurian/Devonian reference section 21
. . . . . '1 . Iaopachmap: Silurian/De~nian carbonates 22
. . . . . . . . . . . 8 . Isopach map: Wooaford Shale 23
I . . . . . . . . . . . 9 . Mirraisa5ppian ~eference section 26
. . . . . . . . 10 Isopachmap: Mississippian carbonates 27
. . . . . . . . . . . . . 11 . Isopach map: Barnett Shale 29
12 . Pennsylvanian reference section acdtype well for Area 2
. . . . . . . . . . . . . . . . . oil and gas fields 30
. . . . . . . . . . . . . . 13 . Isopach map: Pennsylvanian 34
. . . . . . . . . . . . 14 . WoLfc?mp reference section 37
. . . . . . . . . . . . . . 15 . Ieopach map: Wolfcamp 38
16 . Bone Springs Formation reference section showing
stratigraphic position of Study area fields . . . . . . 40
17 . Isopach map: B01.m Springs Formation . . . . . . . . 42
18 . Delaware Mountain Group reference section s howiag
stratigraphic position of Study area fields . . . . . . 45
19 . Isopach map: Delaware Mountain Group . . . . . . 47
20 . Structur . 5. Top of Silurian/3evonian carbonate . . . . 56
iii

Structure: Top of Mississippian carbonate . . . . . Structure: Top of Pennsylvanian System . . . . . Structure: Top of Wolfcamp Formation . . . . . Structure: Top of Bone 5p:ings Formation . . . . Structure: Top of Bell Canyon Formation . . . . . Ordovician ail and gaa f:slds . . . . . . . . . . . Silurian/Devonian oil and gas fields . . . . . . . . Pennsylvanian oil and gas fields: Southern Eddy Sonnty
Pennsylv~nian oil and gas fields: Southern Lea County
Distribution of chert and upper Strawn oil and gas fields
Sandatone facies and lower Srawn gas fields . . . . Distribution of sandstone, oolitic limestone, and Atoka
gar fields . . . . . . . . . . . . . . . . . . . s'andrtone facies and Morrow oil akd gas fields . . . Type well for Area 1 Pennsylvanian oil and gas fields
Page
5 7
58
5 9
6 0
6 1
64
70
7 3
74
76
77
35. Type well for Area 3 Pennsylvanian gas fields . . . 8 3
36. Type well for Area 4 Pennsylvanian gas fields . . . 84
37. Type well for Area 5 Pennsylvanian gas fields . . . 86
38. Wolfcamp oil and gas fields: Southern Eddy County . 90
39. Wolfcamp oil and gas fields: Southern Lea County. . . 9 1
40. Bone Springs oil fields . . . . . . , . . . . . . . 94
41. Delaware Mountain Group oil fields . . . . . . . . 96
42. Representative sections of pay zones ia the Delaware
Mountain Group . . . . . . . . . . . . . . . . . 9 7
!v

Page
43. Stratigraphic sections of upper part of Bell Canyon
Formation. . . . . . . . . . . . . . . . . . . . 9Q
44. Ramsey oil fields . . . . . . . . . . . . . . . . 101
45. Exploration s?atus: Ordovician System . . . . . . . 107
46. Exploraticn status: Silurian/Devonian Systems . . . 108
47. Exploratirlrn status: Mississippian System. . ; . . . 111
48. Explora .ic n status: Pennsylvanian System . . . . . 1 14
49. Exp1ora:~an status: Wolfcamp Formation . . . . . . 118
SO. E a q b ~ . ~ t i o n status: Bone Springs Formation . . . . 120
51. Erplorationstatua: DelawareMountainGroup. . . . 123
52. Exploration status: Ramaey pay zone. . . . . . . . 127
53. Oil and gas tests drilled in Pilot a rea . . . . . . . 274
54. Study a rea salt water disposal and injection wells a s
of January 1, 1374 . . . . . . . . . . . . . . . . 277
TABLES
l. Production summary: Ordovician System . . . . . .. 136
2. Fieldr: Ordovician - Oil Production . . . . . . 137
3. Fields: Ordovician - Gaa Production . . . . . . . . 140
4. Production summary: Silurian/Devonian Systems . . 145
5. Fields: Silurian/r)evonian - Oil Production . . . . . 146
6. Wells: Silurian/Dwonian (Study Area) - Oil Production 148
7. Fields: Silurian/Devonian - Gas Proluction. . . . . 149
8. Wells* Silurian/Devonian [Study Area) - Gas Prodxction 15 1
9. Discovery well data: Silurian/Devonian (Study Area) . 152
v

Page
Production summary: Mississippian System. . . . . 155
Fields: Mississippian - Oil Production . . . . . . . 156
Wells: Mississippian - Oil Production . . . . . . . 157
Fields: Mississippian - .iaa Prcduction . . . . . . IS8
Wells: Mississippian - Gas nroduction. . . . . . . 159
Production summary: Pennsylvanian System . . . . 164
Fields: Pennsylvanian - Oil Production . . . . . . . 165
Wells: Pennsylvanian (Study Area) Oil Production . . 172
Fields: Pennsylvanian - Gas Production . . . . . . . 174
Wells: Pennsylvanian (Study Area) Gaa Production. . 181
Discovery weli data: Pennsylvanian (Study Area) . . 1 83
Production summary: Wolfcamp Formation. . . . . 191
Fields: 'Wolfcamp - Oil Production . . , . . . . . . 192
Wells: Wolfcamp (Study Area ) Oil Production. . . . 194
nelds : Wolfcamp - Gas Production. . . . . . . . . . 195
Wells: Wf.lfcamp (Study Area) Gas Production . . . . 197
Discovery wcU data: Wolf camp (Study Area) . . . . 198
Production rrum~nary: Bone Springs Formation . . . 201
Fields: Bone 5pr:ngs - Oil Production . . . . . . . 202
Wells: Bone Springs (Study Area) Oil Production . . 204
Fields: Bone L'rrings - Gas Production. . . . . . . 206
Wells: Bone Spri.lgs (Study Area) Gas Production . . 205
Discovery well Jata: Bone Springt . . . . . . . . 210

Page
Production summary: Delaware Mountain Group;
P-e-Ramsey . . . . . . . . . . . . . . . . . . . . 2 16
Fields: Delaware Mountain Group (Pr e-Ramsey) Oil
Production . . . . . . . . . . . . . . . . . . . . 2 1 7
Wells : Delaware Mountain Group (Pre-Ramaey) Oil
ProducEon . . . . . . . , . . . . . . . . . . . . 2 18
Fields: Delaware Mountain Group (Pre- Rams ey) Gas
Production . . . . . . . . . . . . . . . . . . . . 219
Wells: Delaware Mountain Group (Pre-Ramsey) Gas
Production . . . . . . . . . . . . . 1 . . . . . . 220
Die covery well data: Delawar a Mountain Group (Pr e-
Ramsey/Study area). . . . . . . . . . . . . . . . . 221
Production summary: Delamare Mountain Group (Rarnsey '
pay) . . . . . . . . . . . . . . . . . . . . 227
Fields: Delaware Mountain Group (Ramsey) Oil
Production . . . . . . . . . . . . . . . . . . . . 228
Wells: Delaware Mountain Group (Rams ey) Oil
Production . . . . . . . . . . . . . . . . . . . . 230
Fields: Dela-re Mountain Group (Rams ey) Gas
Production . . . . . . . . . . . . . . . . . . . . 246
Wells: Delaware Mountain Group (Ramsey) Gas
Broductijn . . . . . . . . . . . . . . . . . . . . 248 I
Discovery well data - Ramaey (Study Area) . . . . . . 263
Oil and gas tests drilled in Pilat area. . . , . . . . . 272
Calculated reserves for untested Pilot area section. . . 282
vii

INTRODPCTION
This study was in part fundea by the Atomic Energy Commission
under Contra=t No. AT-(40-1)-4423. Terms of this contract as they
irvolve this particular study, a r e restated here so that reviewers may
be aware of the basic aims of the project.
Project I - Evaluate the Petroleum Potential of the Proposed
Radioactive Waste Disposal Site: Initial studies to be completed
by February 15, 1973, will involve the development of pertinent
information related to the location of a favorable site for coring
of the Salado Fonnation and xnderlying rocks somewhere within
Ts. 22-23 S., E s . 21-32 SJ , Rs. 31-32 E.
Evaluation of petroleum potential of the above-mentioned
townships will include all rocks from the surface to the Pre-
Cambrian grecambria] basement with emphasis on the
deeper horizons. This study will include all wells in the area,
and pertinext stnictural, lithologic and isopach data for the
propoded disposal site. Necessary regional interpretation of
these strata w i l l be conducted and will include existing fields,
,wells, secondary recovery operations, areas of salt water
disposal, production data, and pressures. In adzition, the
196 1 report by Foster and Stipp showing basement configuration
in southeastern New M e x i c ~ will be revised.


On o r I~efore February 15, 1973, the Contractor shall
furnish a prelirrtinary report addressed to Mr. Joseph A.
Lenhard, Direct0 r, Research and Technical Support Divibion,
U. S. Atomic Energy Conunission, Oak Ridge, Tennessee
37830, which includes, bct not restricted to, the following:
(i) information related to the location of a site f,,r the
coring of the Sdado and overlying formations; and
(ii) a prc hinary evaluation of the petroleum potential of
the p r o p s e d waste d i s p a a l sice. h f i ~ a l report regarding
the petroieum potential of the a r ea shall be furnished to the
abovementioned addressee on o r b e f o ~ e June 15, 1973.
Such f ind report shall include necessary isopach, structural
and facie8 maps of i m ~ o r t a n t formations from Permian to
P r e - Cambrian k reca r rb r i ad . Project I shall be conducted under the direction of Mr.
Ray E03 Foater o r such other member of the Contractor's
staff an may be mutually satisfactory to the parties.
The s5ctions of the fallowing report that a r e involved with the
Atoxnic Energy Commiesion contract a r e stratigraphy, structure,
geological evaluat; jn of the oil and gas potential, petroleum exploration
i n the Pilot area, water injection and disposal -ells, and that part of
the section cn conclusions involving geologic factors. Production data
is given in thc sect', ns on exploration status, statistical oil ~ n d gas
potential, and the tables in Appendix 1. The remainder of these

sections involve reserve projections and potentials for each part of
the geologic section and were generated primarily for the interests
of the State of New Mexico. They were included here to give all
interested parties some background information on the oil and gas
producing potential of this part of New Meldco.
Because of limited oil and gas exploration in the four township
contract area, named the Pilot a rea in this report, it was necessary
to expand the investigation to include a sufficient number of well:, for
adequate evaluation of the oil and gas potential. The basic areas
studied a r e shown in Figure 1. The Pilot area consists of T's. 2 1
and 22 S., R1s, 31 and 32 E. The Study area covers T. 20 S., R1a.
30 to 35 E,, and T'e. 21 to 26 S., R1s. 29 to 34 E. and represents the
area used in preparation of isopach and structural contour maps and
stratigraphic scctiana used in evaluating the oil and gas potential from
a geologic atandpoint. Beyond this a much larger area m s examined
in lees detail to support geologic conclusione, and Co e ~ l u a t e the
producizg potential of various parts of the geologic section. Naturally
each part of this section requires somewhat different treatment and
thus the area studied varies f-om one formation to the n&. Finally,
in keeping with terms of the contract, the contour mkp of the
Precambrian surface as published by Foster and Stipp (1961) was 1
completely revised for a large part of southeastern New Mexico.
~

Fia. I I ndex mao of reoart nveclc

STRATIGRAPHY
The stratigraphic section studied fo i this report includes rocks
ranging in age from ~recarnbr ian to Permian (fig. 2). The sedimentary
?art of the sequence consists of, in simplest terms, doloxnite, li-mestane,
sandatone, and shale. Within this general classification are the
1 complex ~ r i a t i o n a in aaour.ts of clay, silt, sand, dolomite, calcite,
and organic remains that result in lateral and vertical variations typical I
of sedimentary rocks and that with tectonic wents are of prime
importance in exploration for oil and gas.
I I
Near the center of the Pilot area of this report the thickness of
rodimentary mcks present below the Permian Castile Formation, is
approximately 13,500 feet. Of thia sl:jM.ly over 60 percent or 8,200
feet ia attributable to strata of Permian age. Within this four township
area rocks of Ordovician age range from 1,000 to 1,400 feet in thickness;
I Silwkn and Devonian rock8 from 1,200 to 1,700 feet; Mississippian
from 600 to 800 feet; Pennsylvanian, 1,800 to 2,200 feet, and Permian,
6,730 to 8,800 feet. I
I To stratigraphers an important problem in the Delaware basin,
aa far aa the subsurface rocks a r e concerned, ia the lack of a formal
rock- stratigraphic nomenclature for several parts of the stratigraphic
section. For this report it was thought more advisable to utilize,
where possible, the terminology developed by petroleum geologists and
othera engaged in the exploration for oil o r gas in the basin. In part

hlav. Depth 3,000
Ochoon Triosric 8
4,000 Younger
Fig.2 Projected section: Center o f Pi121 area ) Potential pay zones

this follows formally accepted rock- stratigraphic names such as
Ellenburger Group, P7oodford Shale, and Bone Springs Formation.
In other cases sufficient paleontological and/or lithological studies have
not been made so that a formal classification can be used, or names
have been applied to certain intervals of rocks that constitute pay zones
in oil and gas wells. Thus we have Si?zrru/Devonian, Mis~issippian
lime or Rarnsey sand, These designate intervals that in areas of outcrop
have either been subdivided into groups, formations, or members, or
were not considered to be of significant stratigraphic variation to be*
given formal stratigraphic names. Rocks of Pennsylvanian age present
a particular problem in that there is little consensus as to what
constitutes a particular rock-stratigraphic interval. In addition, lack
of formal names plus changes in stratigraphic designations have resulted
in a rnther loose application of tirne-stratigraphic and rock- stratigraphic
names. The stratigraphic terms used for this as well as other parts of
the section, along with their lithologic description, were designed to be
I
generally recogriizable by those familiar with the stratigraphy of the ll
Delaware basin, and to relate these units to oil and/or gas-bearing
zone 6,
Precambrian Rocks
I Numerous wells have penetrated the upper part of the
Precambrian on the Central Basin platform, but only a few have been ~ ~ drilled to rocks of tMs age elsewherc :n southeastern New Mexico (fig. 3).

F l a w (1954, 1956) subdivided the Precambrian of Texas and southeast
New Mexico by rock type and established various terranes. The regional
area of this report i s underlain for the most part by the Texas craton.
This terrane i s distinguished by granite and granodiorite, but as in most
ehiele areas a complexity of dstail i s to be expected.
On the Central Basin platform, particularly in T. 19-20 S., R.
36-37 E. and T. 21-22 S., R. 37-38 E., the granitic rocks a r e fine
grained and were considered h crogranite and microgranodiorite by
Flawn and Foster and Stipp (1961). Muehlherger (!.964) noted that the
texture of these rocks was defiritely metamorphic, and based on tracing
from tll~metamorpho eed rhyolite to slightly re constituted rhyolite to an
area of granofels, considered the rock to be prcbably metarhyolite.
Ir the northern part of the Central Basin platfozxn in New MeAco this
rock type i s associated with granite suggesting the possibility that they
a r e cataclaeticaliy metamorphosed granite. Oil exploration has disclosed
that similar rocks a r e present on the platform as fa r south a s T: 25 S.,
R. 37 E. Unmetamorphosed rhyolite uuderlies a large part of northern
Lea Cot-nty and was named the Panhandle Volcanic terrane by Flawn
(1956). Baeed on petrographic studies these rocks consist chiefly of
rhyolite porphyry flows and associated tuffs. In addition to these rock
types, wells drilled on the Central. Basin platform have encounuered
diorite and olivine gabbro intrusives, and quartz-biotite schist. Cuttings
irom ~ 5 e well that penetrated the schist also included chips of rock of
the microgranite type.

Three wells have been drilled to the Precarr~brian i r i the
southeastern part of the Delaware basin in New Mexico, The rock
type was reported to be granite, but i n oil-field ternlinoloey this i s
commonly used to describe any igneous o r n?tarnor~lhic r s =k and thus
i s a synonym for basement o r Precambrian. In T. 2.0 S. , R' s. 31 and
32 E. W wells encountered granite in the Precambrian. To the west,
outside the Precambrian map area basement rocks consist of granite
inT t s . 18 and 19 S., R. 23 E, . m d i n T . 23 S., R, 2 3 E. l??tween
these two areas Flawn has shown a belt of metamorphic rocks ,extending
east and north to Chaves County. Further to the west in eastern Otero
County and southamstern Chaves County the Precambrian sequence
includes umnetamorphosed shale, eiltstone, sandstone, and dolomite,
metasediments, andesite porphyry, and rhyolite porphyry (Foster, 1959).
1 The sedirnent:rry and metasedimentary rocks may extend into the 1
1 no r tbes ten r part of the Precambrian map area and perhaps even
further to t i e east. The aeromagnetic map of the Carlsbad area
(U. S. Geological Sumey, 1973) has a low magnetic intensity east of
Carlsbad that may indicate an extension of this tezrane. Elsewhere in
the Delaware basin there is no magnetic indication of significant lithologic
change in the Precambrian rocks and it is assumed that most of the
basin 5n New Mexico i s underlain by rocks of granitic composition.
Based on isotopic dating, Muehlberger (1964) consictered the
grouping of the Tearas craton too broad and abandoned the use of this
t e r n . He introduced Central Basin platform terrane for ar, area

including but not reutr icted to the structural C ent ral Basin plaifonn.
Ages of Precambrian rocks in southeastern New Mexico vary
considerably (Wasscrburg, et. al. , 1962, and Muehlberger, et. al.,
1964. 1966, zsd 1967). The Panhandle Volcanic terrane has an age of
approamately 1. 14 by, and the Central Basin platform terrane, ttno
distinct ages of 1.17 and 1.35 by. The older rocks a r e located primarily
on the northwestern shelf and are similar in age to the intrusive events of
central and northeastern New Mexico. The younger rocks dated from
granite and a gneiss suggest an as sociation with the Panhandle Volcanic
terrane. The rhyolite to the west of the map area, although not dated,
i a similar to rhyolite of the Franklin Mountains and po s eibly Pump
Station Hills. The Franklin Mountain rhyolite has a maximum age of
about 0.97 by (Demson and Hetherington, 1959) somewhat younger thai Q
the Panhandle Volcanic terrane.
Ordovician System
Rocks of Cambrian age a re not believed to be present in this
area. The west-east transgressive overlap of Cambrian/Ordovician
sediments orto the Precambrian surface has been wen documented for
many years. The Bliee Sandstone in the Franklin Mountains of west
Texas, ie in part of Cambrian age, but is thought to be entirely Early
Ordovician in the Sacramento Mountains of New Mexico. Conglomerate
and sandstone at the base of the Ordovician section in the subsurface of
snu+heastern New Mexico a r e sometimes called Bliss Sandstone,

particularly in the wes;;.ern part of the Delaware ballin. These rocks
probably comelate with the Crdovician part of the Eliss.
Barnes, et. al. (19!;9) have shown that the Gorman Formation of
&he Ellenburger Group overlies the Precambriln in the area of the Central
Basin platform, and locally is as thin as 100 feet i n parts of Lea County.
Elsewhere in southeastern New Mexico the older Tanyard forma:ion I
overlie6 Precambrian. This indicates a greater relief on the Precambrian
surface on parts of the Central Basin platform. Areas suggestive of
island chains consisting of Precambrian rocks, in the Early Ordovician
I clean have been noted in oAAer parts of southern New M d c o -. nd west
Texas (Kofflowski, et. al. , 1973). *
1 The generalized section of Ordovician rocks in the vicinity of the
Pilot area (fig. 4) is based on ramples and a radioactivity log of the
Texas 1 Richards will in aec. 25, T. 20 S., R. 32 E. In ascending
order the a ection includes the Ellenburger Group, 5impson Group, and
Montoya Group. The original reference to the Fllenburgcr was by Paige
(1911; for Lower Ordovician rocks in the Llano region of central Texas.
Cloud and Barnes (1948) noting inclusion of rocks of Late Cambrian age
restricted the Ellenburger to the Lower Ordovician and published
detailed type and standard sections including that of the Franklin
Mouztains . In the reference well, above a basal sandstone-conglomerate
interpal, the Ellenburger Group consists of dolomite with some chert.
Eleewhere in the Study area the sequence is quite similar, consisting

Texas I Richards Sec. 25, T. 20 S., R. 32 E.
Fig.4 Ordovician reference section

of dolomite with appreciable chert in some beds and locally sandy
dolomite in the lower part of the section. From the 300 feet present
in the reference well the Ellenburger thickens to almost 600 feet in
1 I T. 25 S., R. 31 E., and to slightly over 1000 feet in T. 25 S.,
The Simpson Group was named by Taff (1902) for exposures in
~ the Arbuckle Mountains of Oklahoma. Decker' (1933) and Harris (1957)
established several formations that a re from oldest to youngest: Joins, I I I Oil Creek, McLish, Tulip Creek, Bromide, and Corbin Ranch. Fossils
indicate a Chazyan-Black RIver age for the Simpson. The Cable Can-yon
Sandstone of central New M m c o occupies a similar stratigraphic
podtion to the Simpson in that 5+ mconformably overlies the El Paso-
Ellenburger Group. However, Flower (1961, 1967) and LeMone (1969)
consider the Cable Canpn to be of Coburg-Eden age which would be
younger than the Simpsoa Flower (1961) has described a discontinuons
sandstone sequence below the Cable Canyon i n parts of sauthern New
Mexico and suggested a Harding-Winnipeg age. In part this would be
coeval with the Simpson. Another possibility would be that he
Simpson-Cable C-nyon rocks represent a transgressive clastic facies
that overlaps to the west onto the El Paso-Ellenburger groups.
In the subsurface of west Texas the Simpson has been subdivided
into A, B, C, a ~ d D zones. Ireland (1965) suggested correlation of
Zone A with the Joins, B - Oil Creek, C - McLish, and Zone D with
Tulip Creek and Bromide. In the Ordovician reference section the

lower 65 feet of limestone and green shale i s similar to the Joins,
the next 55 feet of green shale, lirrlestone, and sandstone may be P-L
Oil Creek equivalent; the following 100 feet of limestone and green
and gray shale suggesting the McIdsh; and the remaining 105 feet of
sandstone and green shale, the Tulip Creek. Sandstone merr.bers of
these formations contain oil on the Central Basin platform. If the i subdivisions of the reference section do in fact correlate with
Ireland's subdivisions, the ConneU Member of'the Oil Creek is not
well developed in this area. but the Waddell Member at the base of
the McLish Fo-ation, a.zd the hIcKee Member at the bzse of the
Tulip Creel Formation would be present. Rocks similar to those of
the 13romide Formation a r e present in the southern part of the Study
area but do not appear to be present in the reference well. This
could be the result of northward pre-Montoya erosional truncation.
As noted by Wright (196 5) the Simpeon is less than 1,000 feet
tbick on the Central Basin platfonn and thins to the north and west
with less than 500 feet present in the vicinity of the Pilot area. In
the reference well, the Simpson section is 325 feet thick. To the south
in T. 25 S., R. 31 E. sedimentary rocks of this unit are almost 600
feet thick.
The Montoya Group, originally Montoya Limestone, was named 1 ,
by Richardson (1908) for exposures in the Franklin Moun2ains north I
* I
I of El Paao, Texas. Subsequent to this, geologists, notably Entwistle - I
(1944). Kelley and Silver (1952), and Pray (1 953, 196 1) recognized .-ii

various r e rnbe r s and formations. From oldest to youngest the
fonnational nanes most ccmmo~lly -1sed a r e Cable Canyon Sandsto~.e,
Upharn Dolomite, and klernar and Cutcer formatisns. Eoire (1 959)
con;ridered the Upham to be Trenton, bct c!id qot rcle out a Cinzinnati~;;
age: the Aleman to be Eden-Maysville-lower Richmond; and the Cut te i as
late Richmond. Flower (1969; refers the Upham to Cobetg-Eden and .
possible late Trenton, and the Aleman-Cutter to be Richmond and
possibly, in part late Maysvflle, T4us we h ~ v e a general agreement
aa to a Late Ordovician age.
'rome established the presence 01 t h e aka-re formztions, except
for the Cutter, in the Baylo r and Beach Mountains north of Van Eorn,
Texas. Nonnally the formational names have not been used in subsurface
rock classificatiolls of southeastern New Mexico, although a routine
examination of the section penetrates in wells in this area suggests
possibilities of suitable correlations with outcrops of the Montoya
Group to the west. b~ the reference section the upper part of the
Montoya consists of dolomite, and the lower of limestone. Chert i s
fairly common, particularly in the middle part of the section and may
indicate the Alernan. South of the Pilot area in T. 25 S., R, 31 E.
the rock type is a h a t entirely limestone with some sandy limestone
near the base possibly rcpresenting the Cable Canyon. The cht.nge
south to limestone i s similar to that observed in south-central New
Mexico and west Texas. The Montoya thickens from 345 feet in the
reference well to 450 feet in the well in T. 25 S. , R. 31 E.

The isopach niap of Ordovician rocks (fig. 5) i s restricted to
the four township Pilot area. There a r e :lo control points within this
area, but two weils were drilled to the Precambrian i n T. 20 S. ,
and two points were available in T. 24 S., R. 34 E., and T. 25 S.,
R. 31 E. A gradual southeastern thickening is evident with about
1,000 feet in the north par t oL the Pilot area to slightly over 1,400
feet in the southeast corner of this area. The northward thinning of
Ordovician strata has beer1 discussed by Kelley and Sil-per (1952),
Kottlowski, et al. (1956) and othero. I<ottlowski, et al., in particular
d k o n s t r a t e d that the northward thipning was the result of a major
period of erosion b e h e e n Lower Qrdovician rocks of Canadian age and
Upper Ordovician, Cincinnatiaa-age roclcs. In turn the upper part of
the Ordovician i s separated from Silurian rocks by an erosional
unconformity and to the north Devonian aad younger Paleozoic rocks
r e s t on the Ordcvician above an unconformity of a long a3d comp1~-
history. lt is important to s t ress that northward thinning as far a s
can be determined is primarily sns result of these erosioral periods,
and tSat depositional thinninv o r an approach to a shoreline facies
cannot be demonstrated. Obviously there is depositional thicl-ening
to the south into the Ordovician Toboso ba:*in, but the northward
extent of this basin i n New Mexico would appear to be much greater
than p reviourly indicated.

Fig. 5 Isopoch map : 0rdovicia.n Contour interval: 100 feet 0 2 4 miles -

Silurian/Devonian Systems
Rocks of Silurian and Devonian ages in southeastern New
Mexico have been rather poorly defined. The standard usage includes
the Woodford Shale and an underlying carbonate a equance referred
to as Silurian, Devonian, o r Siluro / Levonian. Locally rocks presumed 1 !
to be of Silurian age have been separated into the Fusselman Dolomite I I
and Upper Silurian, The difficdty in separating the carbonate sequence I
1 has been discussed by numerous geologists. Gibson (1965) used the 1
i term Hunton terrane for the carbonate sequence because of the varied I
I terminology in the Permian basin. McGlaason (1967) suggested that
the carbonate rocks in the Delaware basin of New Mexico a re restricted - I I
to Fusselman and Upper Silurian with rocks of Devonian age found only I
at the southern end of the Central Basin platform in Lea Ccunty.
Lacking any ju~tiiication from the present work for specific formational i I 1.
designations for the carbonate sequence, the common oil-field usage of i ' I
Siluro /Devonian is followed although modified to the more acceptable !
Silurian/Devonian. Included, however, is a brief description of the
derivation of the Fusselman Formation.
The F'useehnan Limestone was named by Richardaon {1908) for i
exposures in the FraPklin Mountains, Texas. Flower (1969) reviewed
the available faunal data and concluded that the Fusselman was of I
Alexandrian and Niagaran ages, thus Early to Middle Silurian.
Overlying the Fusselrnan Dolomite i n the Sacramento Mounta4ns a re

- shale and siltstone of late Middle Devonian to early Late Cevonian
age (Flower, 1969). A suggested correlation of these beds with the
Canutillo For.rlation of the Franklin Mountains was made by LeMone
(1969). Of i n t e r ~ s t here ie that the shaly beds overlying the Fusselman
Dolomite a r e in part correlative in age with the Woodford Shale.
The type locality of the Woodford "Chert" i u i n Oklahoma and
was originally referred to by Taff (1902). The age of the Woodford
ha6 baen studied at soma length and at Vmes has been considered
Demdan, Mississippian, o r to include beds of both ages. ~ c ~ l a s s o i
(1967) on the basis of fossils, suggested a Late Devonian age, except
for the upper part which i s probably Early Mississippian, He noted
correlation with the Canlrtillo and overlying Percha fa rmations i n the
. Franklin Mountains. Wright (1963) divided t'n* Woodford into lower,
middle, and upper members and suggested correlation of the middle
member with the Contadero Formation and Ready Pay Memher of the
Percha. The upper member was correlated with the Box Member of
the Percha. Flower (1969) and others consider the Percha to be of
Late Devonian age. LeMone (1969) observed a discouforrnable contact
with the overlying Mississippian Las Csuces Limestone in the Franklin
Mountains, and Pray (1 961 ) a sharp dieconformity beheen the P t r c h a
and Mississippian Caballero Formation in the Sacramento Mountains.
In parts of the San Andres Mountains and i n some wells in southeastzrn
New Mexico, the contact appears grzdational.

20
In the Silurian/Cevonian reference section (fig. 6 ) the carbonate
sequence consists of light- colo red lirnestone, dolomite, and chert. 1 I
There are two prominant intervals of limestone, the first, at the top I
I I
of the section, i s about 200 feet thick, and the s%ond, near the middle, 1
just under 100 feet thick. The remainder i s dolomite. In the reference !
I
well carbonates a r e 1,260 feet in thicknese, whereas in T. 25 S., R. 31 E.
the thickness is 1,390 feet; in T. 25 S., R. 33 E., it is 1,680 feet; and
in T. 26 S., R. 35 E., 1,675 feet. Closer to the Pilot area in T. 22 S., ! I
R. 30 E. this interval i s 1,080 feet t x c k reflecting the regional I
westward thinning. I~opach lines in the Pilot area (fig. 7) show a rather
d o r m thinning from 1,SOO'feet in the east to 1,100 feet on the west.
With al l control points located outside the Pilot area no detail of local
thinning o r thickening is revealed.
The Woodford is typically dark gray to black and bzown, pyritic
shale. At the reference section it is 150 feet thick, and within the Study
area has a minimum thickness of 80 feet in the northwest corner (fig. 8).
The maximum tkickqess is about 250 feet in T. 24 S. , R's. 33-34 E.
and an estimated 260 feet in the southeast corner of the Study area.
At the 10-foot contour interval used for the isopach map smaller
features modify the regional sc utheastward thickariing of the formation.
These features a re discussed further in the following section on structure. i Lack of control results in considerable spreading of the contours
in the Pilot area. Available information w ulrl seem to indicate a
thickness of from 170 to 180 feet in the centor of the area. Slightly

Texas I Richards Sec. 25, T. 20 S., R. 32 E.
t .
1QO r t
LOO
1 0 0
10
0
15,600 1-1 Montoyo Group
Fig.6 Silurian/ Devonian reference section

F i g . 7 lsopoch map: S i lur ian / Devonian carbonates Contour ihterval: 50 feet 0 2 4m1les -

Fiq.8 lsopach map: Wood ford Shale Contour inlcrval . 10 feet
0 5 I0 miles I

thicker Woodford Shale i s present to the north and aouth with some
thinning to the east and west.
Mississippian System
Rocks assigned to the Mississippian in this report include a
series of limestone referred to simply a s Mississippian limestone,
and an overlying shaly interval called the Barnett Shale. This follows
the general oil-field usage iri southeastern New Mexico. The top and
base of the Mineissippian limestone can be easily recognized, i n
most cases, in well samples and from mechanical logs. Where some
doubt might exist a s to the top and base it becomes only a question of
a few tens of feet. Becauae of this, reported scout tops usually a r e
quite reliable. The contact between the Barnett Shale and overlying
Pennsylvanian rocks ia lees reliable. For this report a distinctive
ttkick18 on mechanical logs that could be traced throughout the Study
area, was used as the base of the Pennsylvanian. From sample
studies this Mck seems to represent a thin sandstone. For most wells
this top for the Barnett coincides with the consensus of data reported
for southeastern New Meeco. Chaster is sometimes used for the
Barnett and aa overlying section of shale and sandetone here included
with the Pennsylvanian. Lower Mississippian also is used occasionally
for the Mississippian limestone of this report.
One of the f i rs t references to ne Barnett Shale was by Moore
and Plurnmer (1922). The intcrral was named for shale exposures

near San Saba, Texas and originally i~c luded in the Bend Group of
Pennsylvanian age, but with noted possible Mississippian affinities
based on the faunal assemblage. Later work indicated a Meramec
and possibly partly Chester age for an upper zone, and a s a g e for a
lower zone. Therefore, at least in part the shales overlying the
Baa lett may be equivalent to the "Chester" shale of the Delaware-
Val Verde basins.
No attempt has been made to project into the Delaware basin
the formations established by Laudon a ~ d Bowsher (1941, 1949) o r
Pray (1961) in the Sacramento Mountains to the west. It would
appear that the Barnett is equivalent to some degree with the Rancheria
and Helms formations of Meramec and Chester age, and the underlying
l m l ~ s t o n e with the Lake Valley Formation of Osage age.
At the reference section locality (fig. 9) the Mississippian
includes 540 feet of light-yellowish brown ?imestone, locally containing
fairly abundant chert, and minor gray shale. The barnett consiats of
80 feet of brown, in part silty shale.
The thickest section of the limestone interval is in the northeast
part of the Study area (fig. 10) where 680 feet were drilled. The
limestone thins to less than 300 feet in southwestern Lea County and
in parts of southeastern Eddy County. In the southern part of the Study
area thinning appears to continue to the west but there is a J ight
thickening east towards the Central Basin platform. In the Pilot area
thicknesses range from 420 feet in the southeast to 560 feet in the

Tenas I Richards 1 . 2 0 S., R. 32 E.
1 Woodtord
I
C 0 - 0 4 52 - 0 m m -
- , Sh.
Fig. 9 Mississippian reference section

Fig.10 lsopach mop: Mississippian carbonates Contour ~ntrrvol: 200 feet
0 5 IG m l l n

northeast. No general depositional trend can be established for the
Mississippian limestone in the Study area. Thicknesses vary
considerably and do not follow patterns established for other parts
of the stratigraphic section examined for this report.
The Barnett Shale maintains a fairly uniform thickness
throughout much of the Study a r ea of f rom 150 to 200 feet (fig. 11).
It thickens locally to slightly over 300 feet in the eastern part of the
a r e a and there is a well defined trend toward a thicker Barnett interval
to the southwest. Just outside the Study area in T. 25 S., R. 28 E.
a well penetrated 540 feet of shale considered to be Barnett. In the
Pilot a r ea the unit is normally less than 200 feet thick and a t the center
of this a rea should measure about 175 feet. The thin in terva l in the
reference section is unusual for this part of the Delaware basin.
Perms ylvanian System
In attempting to unravel the complex stratigraphy of the
Pennsylvaniaa and a r r ive a t a terminology suitable for u r e is this
report it was necessary to establish correlative lithologic units within
the Study area, and to relate these units to known producing zones.
Three 1itholog;c onits were determined to fulfill t5eee requirements
and these a r e indicated in the reference section (fig. 12). Al l of the
oil o r gas discovered thus f a r in ricks of Pennsylvanian age in the
Study area, with the possible exception of the Cabin Lake-Strawn Field
z i cu r s i n these three zones.

Fig.11 lsopach map: Barnet t Shale Contour ~n tc rva l ; 5 0 fur l
0 5 10 m11es

Teros I R ichards Szc. 2 5 i T. 20 S., R. 3 2 E.
Sotr Lake, S.-Atoko (gas)
k, SOOtV
ZOO
IS0
100
0
Teas-Pennsylvanian (gas) Salt La k t , S.-Ato ko (gas) Sa l t LP k t , S.-Morrow (gas) Undesignoted-Morrow (gas) T.21 S.,R. 32 E. Undesignated -Morrow (oi l Hat Mesa-Marrow (gas)
Fig. 12 Perlnsylvanian reference section and type wel l f o r A ~ e a 2 oi l and gas f i e lds

- Meyer (1966) used time-stratigra2hic units for the Pennsylvanian .
System in southeastern New Me-xico. From oldest to youngest the
stages used were: Morrowan, Derryan, Desmoinesian, Missourian,
and Virgilian. These names with the exception of Derryan represent
the provincial se r ies classification accepted fo r use by the U. S.
Geological Survey. Although stratigraphic sections were not included
in hlcyer'a paper it appears that the top of his Desrnoinesian Stage is
the same a s the top of the Strawn of this report. The overlying rocks
of Missourian, and Virgilian age a r e present throughout most of the
Study a r ea of this report, but following the common oil-field usage a r e
included in the Wolfcarnp sequence. The top of Meyer's Derryan
(Atokan) interval would be a t the base of the upper limestone of t he
Strawn and the top of the Morrowan at the top of the Atoka of this
report.
Meyerla claasification was not used in this report because most
of these t e rms a r e not cornmouly used in the Literature of southeastern
New Mexico o r in conlpletion reports for specific wells. Above the
Morrow oil-field usage is Atoka o r sometimes Bend, Strawn, Canyon,
and Cisco. Only in a few cases a r e attempts made to differentiate the - Ciaco and Canyon intervals; these, a s in this report, being included i n
the W~lfcarnp. Hills (1 963). i n contrast to the interprriation of Meyer,
indicates Strawn underlying Wolf camp in the Delaware basin of New
Mexico. In well completion reports the top of the Strawn is picked
fairly consistently. The Atoka may be picked a t the top of the sandstone < .

included here with the Strawn, at the top of the first sandstone in the
Atoka of this report, o r coinciding with the usage of this report. The
Morrow top may be the same as used here o r be as high as the
uppermost sandstone in the Strawn interval.
In the reference well the Strawn consists of cherty limostonc
underlain by light -gray to white, medium-to coarse- grained sandstone.
Thin beds of dark-gray and btown shale a r e present throughout the
section. Elsewhere in the Study area chert is abundant except in the
west where it i s abseat o r of minor h;:ortance a s indicated on the
map of upper Strawn oiI and gas fields (fig. 30). The lower sandstone
interval is present except in the south where it grades into interbedded
shale and thin limestone (fig. 31). Grain size of the sandstones ranges
from very fine to coarse to conglomeratic, with coarser clastic material
prominant in a west-east belt across the central part of the area. Thin
beds of limestone, sometimes oolitic, occur in this part of the Strawn
except in the north and locally in the south where they grade into shale.
Sufficient data was not available to indicate the distribution of algal
biostromes reported to be present i n the upper limestone beds of the
Strawn.
The upper part of the Atoka in the reference well also i s mostly
limestone but includes smaller amourits of chert. The limestone is
underlain by alternating beds of medium-to dark-gray shale,
medium- to coars e-grained sandstone, and limestone. This sequence
i s fairly uniform throughout the Study area with some fine-to medium-

grained and locally conglomeratic sandstone in the upper part ia. the
south, and oolitic limestone beds present in a large area south of the
reference well (fig. 32).
Morrow rocks consist mostly of fine-to coarse-grained sandstone,
commonly conglomeratic, and varying amounts of dark-gray shale.
In some areas there is a thick shale section immediately a3ove the
Barnett. In addition, as indicated in the reference well, this zone also
contains some, generally oolitic, limestone Conglomerate occurs
mostly in the northefn part of the Study are;. and in a relstively
narrow band to the southeast (fig. 33). Somc 2oloinite and dolomitic
limestone is pres cut locally within the Study . rea.
The isopach m+p of the Pennsylvanian ~hows the thickest
sectiohs in the southwest part of the area where over 2,700 feet of
sedimentary rocks a r e assigned to this interval (fig, 13). Rather
abrupt thinning occurs in T. 23 S., R. 31 E. ; T. 24 S., R, 34 E. :
and T. 21 S, , R. 34 E, Thinning in the last two areas can be parttr
related to erosion preceding Wolfcamp deposition i n the area of the
Bell Lake and Central Basin platform fault systems. This eastward
thinning also reflects depositional thinning in the Atoka and Morrow
suggesting a pre-fault high to the east. The relatively thin area in
T. 23 S., R. 31 E. is of considerable interest in that it may reflect
the presence of a buried fault. This feature is not evident from the
isopach map of the Wolfcamp nor from the Precambrian contour map.
In the Pilot area Pennsylvanian strata range from 1,800 to 2,200 feet

Fig.13 lsopach mop: Pennsylvanian .. - . Contour i n t e y o l : 100 feel 10 milas .. .
1

3 5
in tbiclcness arid the lithology should be similar to that discussed above.
Permian System
The Permian section i n the Delaware basin, below the Castile
Formation, includes rocks of Wolfcamp and Leonard age. Eocks of
Wolfcamp age a r e referred to here, informally ar! 'vVolfcamp formation.
Leonard rocks include the Bone Springs formation and overlying
Delaware Mountain Group.
The Wolfcamp formation was first dcs cribed by Cdden (13 17)
far exposures in the Glasa Mountains of west Texas, and i s now
accepted aa a provincial ser ies t e r m for rocks of the lower part of the
Early Permian. West of the Delaware basin in New Mexico equivalent
forxxations include from oldest to youngest the Powwow Conglomerate,
Hueco Limestone, and Abo Formation. Abo i s used on the Central
Baain platform and Northweat shelf for rocks of lower Leonard age.
The equivalent in the Delaware basin would be in the lower part of the
Bone Springs Formation. Because of this Meyer (1966) suggested use
of Wichita Fomnation for the Abo in the subsurface of southeastern
New "cZe.dco.
Silver and Todd (1969) have reported that the upper part of the,
Wolfcamp in the northern part of the Delavmre basin is characterized
by shale and micritic limestone. In general this lithologic description
is adequate for the upper part of the Wolfcamp in the Study area of this

report. In the reference section (fig. 14) the Wolfcamp consists of
interbedded carbonate and shale including considerable dolomite and
minor sandstone. To the south, where a much thicker section i s
present, the lower part consists mostly of shale. The increese in
limestone to the north suggests approach to a shelf margin facies.
Limestone and dolomite distribution and areas where carbonate
thicknesses exceed that of shale o r at least approach a 1:1 ratio can
be defined approxim-ately by the 1,400-foot contour line on the isopach
map (fig. 15). North of this line the amount of carbonate increases;
to tLt- south clastic ratio, (ahalellimestone) a re 2:l to 5:l. Local
variations occur particularly between the 800- and 1,200-foot contour
lines in the northeast part of the area where most of the thickening
to the west involves increase in shale content. This area i s in line
e t h the north-trending pre-Wolfcamp Bell Lake fault and indicates
possible extension of this fault to the north. The thinnest sections a r e
to the east on the upthrown side of this feature and its possible
extension. In this area Wolfcamp strata locally a re l e s s than 400 feet
thick. Sandstone deposits of any significance a r e restricted to this
a rea and i n particular in the northeast corner adjacent to the
west-bounding fault system of the Central Basin platfoim. In this
a r s a some coarse to conglomeratic sandstone is present whereas
elsewhere in the Study area the minor amounts of sandstone a r e vary
.fine to fine-grained.


Fig. 15 lsopach mop: Wol fcam p Contour interval:200 feet
L a d . - . 5 IOm~lrs

The thickest sections of the 'Nolfcamp a r e in the southern
part of the area where locally over 2,400 feet a r e present. In the
Pilot area these beds range from 1,000 to 1,400 feet i n thickness.
Sedimcntation during Wo!fza.mp time almost ent5rely smoothed over
the considerable relief of the pre-Wolfcamp faulting along the eastern
margin of the Delaware basin, The result of this in-filling is
particularly evident on the isopach m a p of the overlying Bone
Springs Formation,
Bone Springs Formation
The Bone Springs was originally referred to by Blanchard
and Davis (19t9) and later defined by King (1942;- At the type locality
in the Delaware Mountains, West Texas, the unit consists mostly of
limestone with a few members of shaly limestone and shale. Two
members have been named; Victor io Peak Lime stone and overlying
Cutoff Shale, Theee intervals underlie the Brushy Canyon Formation
of the Delaware Mountain Croup, The Victorio Peak and Cutoff
members crop out in the Guadalupe Mountains of New Mexico (Boyd,
1958).
As noted by King (1942) and Silver and Todd i1969) the Bone
Spring facies of the Eelaware basin is markedly different than in
the outcrop sections to the west. A typical basinal section of the Bone
Springs was drilled in the reference well (fig. 16). The internal
consists of a thick, partly cherty, linestone at the top, underlain by
alternating units of sandstone and limestone. The three very

Texas I Richards T. 20S.,R. 32 E.
North
Mln. Gp. + Wolfcomp
Fig. 16 Bone Springs Formation reference sect ion showing strat igraphic posi t ion of Study area fields.

fine-to-fine-grained sandstone intervals a r e referred to simply as
the first, necond, and third Bone Springs sands. The lower most
"third sandf1 is also called the Dean sand. Shale is a minor
constituent o i the Eone Springs but limestone beds are commonly
argillaceous. The lithologic sequence as shown in the reference well
is quite uniform throughout the Study area with minor variations in
thicknesees of members. The shelf-margin carbonates, consisting
of reefs or bznks that limit the areal extent of the Bone Springs
basinal facies to the west, north, and east a re not present in this
area.
The thickest sections of the Bone Springs occur in the wegtern
part of the Study area (fig. 1'7). The interval, Zn the area of thickest
accumulation of sediments ranges from 3,300 to 3,500 feet. At an
angle to tbis north-south depositional axis there is a northeast
trending area where 3,000 to 3,300 feet of kedirnents were deposited.
This is an area where a comparatively thin section of Wolfcamp rocks
is present although it follows the structural a d s of the Delaware
basin. The Bell Lake structure remains evident in rather abrupt
thinning of the Bone Springs interval onto this pre-Wolfcamp formation
high. In the Pilot area the Bone Springs Formation ranges from 2,900
feet to over 3,400 feet in thickness.
Delaware Mountain Group
The Delaware Mountaia Group includes al l rocks of Guadalupian
(Early to Late Permian) age in the Delaware basin. Shelf correlatives

Fig.17 lsopoch mop: Bone Springs Formation . . . . . . L
- - . . . . . . - . . . ... . Cont~ur interra I. 110 ieet - . . . .. .*
0 - - 5 I0 miles

to the north are the San h d r e s FormaSon and overlying Artesia
Group. The predominantly sandstone facies of the Delaware Mauntain
terminates abruptly against various shelf-margin carbonates such as
the Cap'tan and Goat Seep reefs, G e t ~ v a y bade and other unnarned
carbonate buildups. Successively older formatians of the Celaware
Mountain Group have greater areal extent beyond the Delaware basin
as defined by the urnennost part of thc Capitan reef.
The Delaware mountain was named by Richardson ( 1F04) io r
exposures at the south end of the Guadalupe Mountains. S a g (:942,
1948) raised the interval to group s t a b s and recognized in : I& cending
order the Brushy Canyon, Cherry Cznyon, and Eel1 Caayon formations.
At the type locality in the Delaware Mouatains the Brushy Canyon
consists of about 1,000 feet of fine- to coarse-grained, in part shaly
sandstone. The Cherry Canyon, also on the order of 1,000 feet in
thicknese contains interbedded very fine-grained sandstone and
lenticular beds of limestone. Two limestone members in the lower
part of the formation were named the Getaway and South Wells, and
one in the upper part the Manzanita. 110 attem?t has been made here
to correlate the carbonate members in the basin with the outcrop
sections. As with the Zimestonea in the ove*:ying Bell Canyon
Formation these members a re much more prominent in the margins
of the basin where they a r e in proximity to botm&ng reefs. Silver and
Todd (1969) feel that cnly the Manzanita Member of the Cherry Cazyon
Formation and the Lamar Member of the Bell Canyon Formaxion can be

traced across the basin. In the area of the type locality in the
bounding reefs. Silver and Todd (1969) feel that only the Manzanita
Member of the Cherry Canyon Formation and the Lamar Member of
the Bell Canyon Formation can be traced across the basin. In the
area of the type locality in the Guadalupe hlountains the Bell Canyon
Formation consists of 700 to 1,000 feet of very fine-grained sandstone
interbedded with persistent limestone members. King (1948) named
three of these in the lower foirrth of the formation the Hegler, Pinery,
and Rader. An upper limestone near o r a t the top of the Bell Canyon
war named the Lamar, A fifth interval of flaggy limestone recognized
by King between the Rader, and Lamar was later named the McCombs '
by King and Newdl (1956). King (1948) observed that in the Delaware
Mountains the limestone members were each 10 to 25 feet thick, but
that near the Capitan reef each member thickned to 50 to 100 feet.
Exposures of the Delaware Mountain Group in New Mrdco a r e
restricted to a sandstone tongue of the Chezry Canyon Formation i n
the Guadalupe Mountains (Boyd, 1958).
Because of the absence of the upper part of the Bell Canyod
Fo nnation in the northern part of the Study area, the Shell I James
Ranch test in T. 22 S., R. 30 E. was used for a reference section of
the Delaware Mountah Gmup (fig. 18). Rarely is an attempt made to
subdivide the Delaware Mountain Group in wells drilled in the Delamre
basin; most oil fields being designated simp1;- as Delaware. The
formational contacts used in the reference well approximate oil-field

Shell I Jo~nes Ranrh T.22 S.,R.30 E.
. . . . . . I.. . ...I I ,
Fm.
Fig. 18 Dalawore Mountain Group reference section showing stratigraphic position o f study a re0 fields

usage where available, and some continuity was established for the^ e
contacts in the basin by use of mechanical logs.' The primary purpose,
of course, being to establish the stratigraphic position of oil wells
completed in this interval.
In the reference well the Brushy Canyon Formation consists of
1,540 feet of mostly fine-grained, gray to brown sandstone with minor
browr: shale and dolomite. Shale is more abundant than indicated in
the reference section but occurs in beds too thin tc, show at this scale.
Better lithologic detail is given for portions of this interval and the
overlying Cherry Canyon Formation in the section on oil and gas
potential. The Cherry Canyon Formation consists of 1,070 feet of
sandstone similar to that in the Brushy Canyon, interbedded with shale,
dolomite, and some limestone. The 1, 180 feet of the Bell Canyon
Formation has a greater percentage of limestone, no doubt the result
of closet proximity to the ~helf-margin carbomtes, but also consists
mostly of fine- grained sandstone.
Because of the importance of the upper most part of the
Delaware M.oun&n Group to the petroleum potential of the area some
additional description of this part of the section is necessary. In the
Study a rea the upper part of the Bell Canyon Formation includes the
Lamar Limestone Member and an underlying sequence of rocks
informally called the Ramsey sand, Ford Shale, and Olds sand. Marginal
to the reef (fig. 19;, limestone of the Lamar Member thickens rapidly.
In T. 21 S. the Lamar i s at least 75 to 80 feet thick and nearer to the

Fig.19 lsopoch rnop:Delawore Mountoin Group Contour interval: 200 feet
0 . 5 I0 miles - ,

_ --- -----. - . .- ---
48
reef may be as much as 200 to 700 feet thick. In T. 22 S. thicknesses I I
of 40 to over 100 feet a re present with the thinner sections located i n I
, the central portion of the basin. The Lamar continues to thin to the I
south in the Study area but eastward and westward thickening remains 0
I
evident even where the reei front i s beyond the limits of the area t
investigated. Near the New Mexico-Texas border maximum thicknesses I
I a r e less than 40 feet and average less than 30 feet. i
The Lamar, except in the vicinity of the Capitan reei, consists
of interbedded gray to brown calcareous shale, white, gray, and brown, I - I -.
very fine- to Ene-grained, silty to shaly sandstone, and brown limestone. I
Throughout much of the basin Lamar carbonates a i e shaly, silty, and ! 1 .
sandy and in large areas grade into calcareous shale. Bordering the I . _ Capitan reef limestone is more prominent. Detailed sections of this
interval a re given in the se'ction on oil and gas potential (fig. 43). The
t section nearest to the reef front ia in T. 22 S., R. 32 E. I. -
The baae and top of the Ramaey sand a re poorly defined. For
convenience the top was selected at the base of the lowest limestone. !
Oil-field usage varies coneiderably from this definition. Some
geologists choose the top of the first sandstone below the u ~ ~ e m n o s t
limestone in the Lamar and refer to this as top of Delaware sand.
Others put the top of the Ramsey at the top of the pay zone in producing
wells. This varies from field to field and within fields. In some areas
the base of the Ramsey is c h o ~ e n at a silty o r shaly sil rstone reierred to J
a s the Ford Shale. Lateral continuity has been inferred for the Ford I

Shale throughout the Delaware basin.
The Ramsey and underlying beds in the upper part of the Bell
Canyon consist of light-gray to white very fine- to fine-grained,
silty sandstone, shaly sandstone, and silty shale. The clay-free
sandstones are friable and appear to be well sorted, but may contain
varying amounts of silt that could affect permeability. Locally near
the reef front some medium-grained quarts is pres ert.
The isopach map of the Delaumre Mountain Group reflects a
remarkable uniformity of thickness (fig. 19). The thinning to the
nor thes t , north, and northeast is the result of the abrupt faciea
change to carbonate3 of the Capitan reef. Elsewhere the thickness
is from 3,600 to 4,000 feet with the thickeat sec.tions in the southera
part of the area. The aection thins rapidly from south to north acrose
the Pilot area and if more control ware available the contour lines
would probably be more closely spaced in the northern part of the

STRUCTURE
The larger structural features of the Permian basin have
been reported on by numerous geologists. The area covered in this
report is too limited to develop meaningfui additions to the general
knowledge of this area. Instead a ser ies of contour maps on various
surfaces have been prepared to show the major structural elements of
the northern part of the Delaware basin. and in particular the structuraL
features of the Study area of this report.
The development of a depositional basin in this a r e a began
following Canadian time when a broad sag formed in the west Texas,
southeast New Mexico area. This sag was named the Tobosa basin by
Galley (1 9 58) and is supposedly bounded on the east by the T exas arch
and on the west by the Diablo arch. Sedimentation in this basin uxtil
Late Mississippian time consisted mostly of shelf carbonates. in New
Mexico. Several periods of minor folding and perhaps faulting occurred
inthe Tobosa basin prior to Penneylvaniur time and there was some
erosion of parts of the section. The most important event as fa r as
oil and gas exploration i s concerned is pre-Woodford uplift and erosion.
The subsiding Tobosa basin covered a much larger area i n Late
Mississippian- Early Pennsylvanian time and the sag was split into two
basins by a median ridge (Adarns, 1965). The name Permian basin has
been applied to this expanded basin; Central Basin platform to the
median ridge; and Delaware and PJTidland basins to the segmented parts
of the Tobasa basin. The Central Basin platform o r Central Basin


range as it has been called on pre-Permian tectorric maps appears to,
have been a high durins Early Ordovician time, and may represent a
zone of structural weakness along which movements took place
perio21c=.!.ly at least into Late Paleozoic time. T h ~ a rnajsr period of
structural adjustment as far as can be determined from map8 prepared
for this report, took place in Late Pennsylvanian-Early Permian time.
Displacement appears to have been along high angle normal o r reverse
faults that according to Hills (1970) may have involved considerable
lateral as well a s vertical movement. The structural elements of
this period of time dominate the contour map8 for each datum preceding
that of the Wolfcamp and a r e still evident in contour maps of the Permian.
Contour lines drawn on top of the Precambrian surface (fig. 3)
show the major structural features of this part of southeastern New
ldexico The Central Basin platform and Delaware basin, previously
were contoured by Flawn (1954, 1956), Foster and Stipp (196 1) and
HlUs (1970). Because 02 the few wella that reach the Precambrian
surface, other than on the Centrai Basin platform, an iaopach map of
the interval from the top of the Missis sippian carbonate section to the
top of the Precambrian was prepared, and depths to the Precambrian
project<-! for wells that penetrated to the top of the Miasissippian I h e .
By this method considerable control i s added, particylarly in the
Delaware basin, and accuracy i s considered quite high because of the
uniformity of t h i c b e s s trends for this combined part of the Pal~?ozoic
section. This sequence of rocks thickens gradually at the rate of about

30 feet per mile from about 1, 800 feet i n the northwestern part of the
Precambrian map area to between 4,400 and 4. 590 feat j *st west of .
the southern end of the Central 3asin ~Latfonn in New Mexico. The
resulting contour map on the Precambrian gives s o x n i ldication as to
the complex fault systems tbat form the boundary bervrsen the Dekware
basin and Central Basin platform. For discussion purpose? name3
have been applied to some of these features.
On the structurally higher parts oi the platform, the Hobbs and
Eunice blocks, the Precambrian surface is at a depth of from 4,000 to
7,500 feet below sea level. In the Monument- Jal block depths are from
6, 500 to 11,500 feet below sea level, and the Precanibriaa surface
slopes toward the Delaware basin. Displacement along the fault system
separating tho Hobbs and Eunice blocks and the Monument-Jal block i s
about 1,000 ,feet in the north part of the area to possibly as much as
4,000 feet wecrt of Eunice. The fault on the west side of the Moncment-
Jal block can be extended fairly reliably for a distance of approximately
50 miles and continues south into Texas. Inferred displacement is 1,500
feat at the north end to over 6,000 feet west of Jal. he south end of
the East Delawsre basin block appears to be only about three miles wide
with displacement to the west on the order of 2,000 feet. The west
bounding fault of this block is probably continuous with the fault to the
north and this fault would appear to be a suitable boundary between the
Central Basin platform and the Delaware basin. Hills (1970) indicated
a fault in approximately this location and termed i t the West Platform fault.

Faults and associated anticlinal closures are of considerable
importance in exploration for oil and gas in rocks of pre-Permian age
and in particular 0 rdovician and Silurian/Devonian strata. It thus
becomes critical in determining the potential of this part of the section
t c establish the po s sibiiiw of the presence of similar structural features
i-, the Delaware basin. The aeromagnetic map of tne Carlsbad area
(U. S. Geological Survey, 1973) gives fairly good definition of the trend
of the major features of the Central Basin platform. This is quite
evident in the Eunice, Hobbs, and Monument-Jal blocks incliding a
sduth-projc&g nose of Egher magnetic intensity in the Jal area.
The locations of highest magnetic intensities roug?dy coincide with those
shown on the Precanbrian map ae having the greatest dieplacemente
along suggested fault systems. The close spacing of the contour lines
on the aeromagentic map and the northwest trend of these contour lines,
although not sharply defining fault systems, do give adequate indication of
the relief from the Eunice-Hobbs blocks west to the east edge of the
Delamre basin, Along east-west sections perpendicular to the structural
trend the m u m relief between the Central Basin platform a ~ d the
Delaware baein is surprisingly uniform at about 9, 000 feet, Ae noted
previously rocks of the Central Basin platform and probably the interior
part at least of the Delaware basin, a re fairly uniform in composition.
This and tke nature of the contour line spacing of the aeromagnetic map
suggest that considerable sharp relief on the Precambrian surface i s
required before marked changes i n line spacing can be expected from

aeromagnetic surveys. Examination of the two maps s e ~ m s to indicate
that a minimum of 4,000 feet of relief is necessary for close definition
of structural features of interest in oil and gas exploraf.ion of pre-
Permian rocks, Except for *he Bell Lake block proje:ted control points
cannot be used for location 01 intrabasin fault systems, and including
Bell Lake, displacements obviously a re not of equal magnitude to that
03 the Central Basin platform. The Bell Lake fault a a s recognized by
Haigler (1962, 1972) and as shown on the Precambrian map has a
displacement of about 500 feet. This is indicated :ss the Bell Lake block
and there i s evidence from projected control point.8 'of an east-bounding
fault as shown by the dashed line. The graben to the east is substantiated
by a north-trending area of lower magnetic intensity on the aerornagnetic
map.
The possible presence of faults and/or anticlinal structures
elsewhere in the Delawaze basin can only be inferred by indirect methods.
*The isopach map of the Woodford Shale indicates several areas where
the Woodford is slightly thinner and in part these areas coincide with
knowm occurrences of petroleum in the underlying Silurian/Devonian
sequence. This is true of the relatively thinner Woodford in rhe area
of the Paduca and Antelope Ridge fields. This may reflect compaction
in association with later structural events o r pre-Woodford highs. In
either case these areas could be favorable locations for exploration.
A similar thinner Woodford seqtion occurs just west of the Pilot area
and it is of interest that contour lines on the aerornagnetic map trend
nof ibes t in thia a r e a This, however, is not indicated on any of thC

structural contour maps and may simply reflect a change in basement
rock type to the west.
The western margin of the Delaware basin cannot be defined
from the area studied for this report. Based on projected well data a
north-northwest trending fault i s indicated i n the southwest cornsr
of the Precambrian map. Most published and service company maps
show this feature a s part of the Huapache fault but this cannot be
demonstrated from well control on the Precambrian o r from the
surface expression of the Huapache structure a s shown by Kelley (1971).
On the aerornagnetic map a north-trending area of higher magnetic
intensity is present in this general location. On this map as well, a
possible continuation with the Huapache fault is not indicated.
The ser ies of structural contour r n a ~ s ' ~ r e p a r e d for this report
(figs, 20 to 25) a r e limited to the Study area. On the pre-Wolfcamp
maps (figs. 20 to 22) the weet-bounding fault of the Bell Lake block,
and the north end of the proposed West Platform fault a r e shown. Also
on these maps the structural axis of the Delaware basin i s shown
curving from northeast to southeast nea: the east edge of the Study
area, The Pilot area is located on the west flhnk of the basin and is
near the deepest part of the basin for this area.
Structural maps on top 9f the Wolfcamp and Bcne Springs
formations (figs. 23 and 24) differ considerably from the sharply defined
structures on maps contoured on older formations. Much of this change
i s obviously the result of sedimentation during Wolfcamp time. The d

Fi9.20 Structure: Tap of Si lurion /Dev?nian carbonate Contour ~ntervol 200 f n l
0 5 I0 milas

Fia.21 Structure: TOD of Mississippion corbonots ~ontou; in ta rvo l : 200 1-1.
0 5 10 mil ts

Fiq.22 Structure: Top of Pennsylvonion System - - . -. A . .- . Confour ~ r ~ r e r v o l 200 f n v
0 5 J
IOm~las d

.. a -
C DL slot I P L
- . .. Fig.23 Structure. Top of Wol fcomp Formation Contour tntervol 200 feet
0 5

Fig.24 Structure : Top of Bone Springs Formation . . - Contour Iniervol: 100 feet
0 . - - . 5

Fig.25 Structure: Top of Bell Canyon F~:mation . -.. . .----.. . -..-- - - . . --. . Contour inlcrvol: 100 for1
0 . 5 10 miles -

general outline of the Late Pennsylvanian-Early Perrnian deveLopment
of the baein is stilt fairly well defined p+lticularly i n the position of the
structurd axis of the basin. The Bell Lake structure appears on the
Wolfcamp map as a north-south high with closure at the south end.
Closure also is indicated on ihc bone Springs map. Whether structural
preservation of this feature is the result of continued movement of the
Bell Lake fault system o r a compacting effect is not known.
The structural contour map on top of the Bell Canyon Formation
(fig. 25) is restricted on the north by the Ca.pitali reef. The super
position of tbe reef at an angle to the structural o r depositional extent
of the Uelaware baein shows that the upper part of the Capitan reef
neither defines the structural or depositional extent of the Delaqare
b a s h mcept from the standpoint of latest Guaddupian time.

GEOLOGICIQt EVALUATION
OIL AND GAS POTENTIAL
In making a geologic :valuation of the oii and gas potential of an
untested area the most logical approach is t o search for factors that
would have a negative affect on oil and/or gas accumulation. This can
be best accomplished by a study of nearby a reas that have proven
petroleum reserves and occur in' a geologically similar environment.
Factors considered a r e reservoir and source rocks, t rap types, number
of potential pay zones, depth, and structure.
Ordovician System
In southeastern New Mexico oil and g a s ha$ been found in rocks
of Ordovician age only on the Central Basin platform. However, exploration
of these rocks is limited in the Delaware basin to only six wells that have
penetrated the entire rock secMon; Not inclr-.ding fields that have been
combined a s development drilling ind:cated lateral continuity, there
have been twenty-five fields discovered on the New Mexico portion of
the Central Basin platform; six of these a r e now abandoned (fig. 26).
Based on classification by the New Mexico Oil and Gas Conservation
Commission twelve fields have been completed in the Elenburger, eight
in the Simpson, four in the Montoya, and one, the Monument gas field.
is dually completed in the Sirnpson and Ellenburger. Most of these fields
do, however, have stacked pay zones and share a common field name.
As of January 1, 1973 oil produced from the Ellenburger amounted to


I
TEXAS
Fig. 26 Ordovician o i l and gas f i e lds
011 ticld
a Gas t io ld
M Montoya S Eimpson E Ellrnburqor

57, 147, 110 barrels; f rom the Simpson, 37,858,725; and from the
Montoya, 3, 833, 153 barrels.
Data published by the Roswell Geological Society (1956, 1960)
on seven Ellenburger fields indicates that oil is trapped in dolomite
in anticline8 or eroeioaally truncated anticlines. Suitable porosity i s
primarily controlled by fractures, with wgs ar.d intragranular porosity
contributing to the overall pay zone.
Gibson (1965) believes that there i s a common paleoaquifer in
the upper pa r t of the Ellenburger that w a s developed by ground-water
solution during the long period of subaerial erosion *.zit preceded the
deposition of the Simpson. He further suggests that the oil and gas in
Ellenburger reservoirs entered after formation of the reservoir and
deposition of the overlying sediments; any indigenous oil havjng escaped
during the period of erosion. If such fields as Justis, Dunlin, Fowler,
Mon$ament, and Teague a r e associated with a post-~l lenburger /pre-
Simpeon unconformity and structures a r e in part of Middle Ordovician L
age the potential for suitable reservoir conditions and t raps not associated
with the Central Basin platform would seem to be much better. A.ccording
to Jones and Smith (1965) it appears that 3ome Ellenburger and Simpson
oils have a common origin, and that the source oi' these oils is from
shales in the Simpson. Other oils appear to be similar to DSVOA~II,
Pennsylvanian, and Wolfcamp oils and on the higher parts of the Central
Basin p l a t fom oil in the Ellenburger i s Simpeon oil diluted primarily
with oil from the Pennsylvanian and Wolfcamp. From the foregoing,

any oil or gas present in the Ellenburger in the Pilot a r e a would either
have to be indigenous o r derived f rom the overlying Simpson. Further,
the trapping mechanism would seem to require an anticliaal fold o r
possibly faulting. Although the tightly folded, high - clo sure structtrr 2s
of the Central Basin platform may not be necessary some structural
displacement may be required to develop suitable f rac ture porosity.
Other possi3le t raps include favorable mound or reef structures surrounding
Precambrian highs, selective dolomitization, and local unconformity
t raps beneath the Simp son.
Oil in the Simpson i s in par t thought to be indigenous and in pa r t
derived f rom shales of Woodford through Wolfcamp age (Jones and Smith,
1965). Simpson reservoirs are , according to Gibson (1965) of two types:
sandstones confined by shales and truncated sand bodies unconformably
overlain by a suitable caprock. In both cases t r aps a r e the result of
anticlinal folding . Most of the oil fouud in the Sirnpson Group in New Mexico occurs
in the McKee Sandstont Member of the Tulip Creek Formation. Some
oil has been prczuced f rom the Waddell Member of the McLish Formation
;c the abandoned North Justis-Waddell field, and f rom the Connell
Sandstone of the Oil Creek Formation at Warren, Hare, and the abandoned
Fowler field. -4ll currently kaown fields a r e anticlinal, commonly faulted
o r tru?-;ted, and in the la t ter case unconformably overlain by rocks of
Permian age. *
The blanket-type sandstones of tfie Simpson would seem to require
i

prominent structures to provide adequate traps. However, west of the
Central Basin platform the Sirnpson thins beneath the pre-Montoya un-
conformity and where unfractured, Montoya limestone could be an
effective caprock. Reservoir characteristics of Sirnpson sandstones
should be favorable in the Pilot area although WrighL (1365) feels they
a r e not a s favorable and become less so with distance f rom the Central
Basin platform. A trapping mechanism is, as wi th the res t of the
Ordovician, the vag-1s parameter in evaluating the potential oi this
interval in the Delaware basin.
Based on past exploration the Montoya would seem to have the
most limited potential of the Ordovician system. The Cary and Justis . fields a r e truncated anticlines and suitable permeability appears to be
closely rch ted to fracturir-g. Wri2ht (1963) stated that most seals
consist of Permian rocks overlying truncated Montoya beds, but feels
that there is a potential for stratigraphic traps where dolomite interfingers
with limestone.
Very little information is available on the origin of oil in the
Montoya. Jones and Smith (1965) suggest that it probably originated
in shales of Woodford to Wolfcamp age.
According to Holmquest (1965) petroleum accumulations in
Ordovician rocks in the deeper parts of the Delaware and Val Verde
basins occur in anticlinal features associated wi th faulting. Holmquest
also noted that oil derived from the Sirnpson disassociates into gas-condensate
and gas below burial depths of 14,000 feet. There are, of course.

exceptions to this theory, but whether on this basis or Gussowls (1954)
I concept of updip spilling of oil as it is displaced by gas, it would appear
that the Ordovician potential in the Pilot a r e a can b- considered to be
Iirl&ed to gas and possibLy condensate. Possibilities for suitable reservoir
rocks and poteniial source beds a r e good for the Ellenburger and Sirnpson
intervals. Presence of fauits and associated anticlines such a s on the
Central Basin platform or the intraba6ina.l Bell Lake structure cannot be
inferred f rom pr i;4?t d ~ i l l i n g density.
Shows of gas and distillate in five or' LL: ?LY wells that penetrated
the Ordovician section indicate a widespread distribution of gas in t he
Delaware basin. The Texas 1 Richards well in T. 20 S., R. 32 E.
recovered on a dri l l -stem test f rom 16,200 to 16,280 feet (Simpson-
Ellenburger) an estimated 179 MCF of gas plus distillate; f rom a second
t e s t at 16,280 to 16,330 feet ( Ellenburger) 340 MCF of gas plus distillate;
and in a third tes t of the Eilenburger f rom 16,330 to 16,409 feet, 344
MCF of gas. Southwest of the Pilot a r ea in the Shell 1 James Ranch in
T. 22 S., R 30 E. a t e s t cf the Ellenburger and lower pa r t of the Simpson
f rom 17,378 to 17,'555 feet yielded slightly gas-cut mud.
Silurian/Devonian Systems
An evaluation was made of fifty-nine SilurianlDevonian fields based I
on data published by the Roswell Geological Society (1956, 1960, and
e I 1967). From this i t can be determined that the typical field :%s a n i
9 anticlinal o r faulted anticlinal trap, the reservoir rock i~ doiomite wi th
I 1 porosity and permeability controlled by fracturing and vugs, and the pay I '

zone is immediately below the pre-Woodford unconformity o r a thin
limestone caprock.. Exceptions to this a r e one field consideind a fault
trap; two stratigraphic in that Silurian /Devonian rocks a r e truncated
updip beneath a sea l of Permian rocks; the reservoir rock of one field,
Reeves on the northwest shelf, is lirncstone; and the pay zone may be
as much as 100 fee t below the Woodford Shale, or a seccnd pay zone nay
be present in the lower par t of the interval. The necessity of a n anticl inal
trap h a s been noted by Salisbury (1968), Gibson (1965), Holmquest (1965),
and Wright (1963), although Wright suggested the possibility of s trat igraphic
t r aps where there is a facies change f r o m dolomite to limestone. Ivlost
of the productive anticiizal s t ructures in New Mexico dip steeply away
f r o m the axis and have considerable closure.
A s with the Ordovician the basic problem is in determining the
potential of there being anticiin?' t r aps associated wi th faulting in the
Pilot area. The intrabasinal Bell Lake structure has been discussed
previously; other fields within the Study a r e a although not adequately
dri l led to e tablish size and trend appear to be structurally controlled.
Hil l s (5968) ,;as reparted that the Red Hills field ia an anticline and that
the s t ructure was located and drilled on the basis of seismic infonna-ion.
This field was completed in Pennsylvanian and Urolfcamp rocks, but a
dri l l -s tem t e s t of the Silurian/Devonian yielded 478 MCF of gas, and
following acidizing 10,400 MCF. Antelope Ridge field (fig. 27) is a n
anticline but is located on the Bell Lake block. It may, however, be
associated with the east-bounding fault of this structure. Although

Fig.27 Silurian/ Devonian oil and g a s fields
& O i l f ie lds D-Devonian 0 5 10 miles - 0 Gas fields S-Silurton F- Furrerrnon

control i s limited, the four wells is the area of the Paduca field show
the presence of an anticline (fig. 20) and the Lea field also i s a closed
structure although the contour interval is too large f o r this feature to
ehow on the structure map,
Based on the few Silurian/Devonian fields in the Study a rea the
precsence of suitable structural traps in rocks of Silurian/Devonian age
is eatabliahed, even though the frequency of such traps is not known.
Structural traps in southea:itern New Mexico commonly ha-re stacked
pay -?nee. Theref=;=, 'knowing ikt ~i;ru=tures are present in the
Delaware baain and that oil and gas i s being produced from these
at..xcturea, increoeea the potential for each part of the section known
to 4.ontain ruitable reeervoir rocks.
Jonea and Srrith (1965) concluded that mast oil in the Silurian/
Devonian was probably derived from the Woodfo rd and Pennsylvanian.
In the Delaware basin th5 primary source would have to be from the
Woodford. Holmquest (1965) noted disassccial;on of Woodford oil below
burial depths of 13,000 feet. However, the Lea oil field is a t a depth of
over 14,000 feet below the present surface. The below surface depth
in the lwrthern part of the Pilot area is approximately the s a m e as a t
the Lea field suggesting that the potential of finding oil cannot be 3verlooked.
Weighted against this is the fact that reported shows surrounding the
Pilot area a r e limited to gas. In addition Salisbury (1968) suggested
that Silurian/Devoman gas had a different source than the o i l and his
dry gas area for this interval would iuclude the Pilot area of this report.

I
Mississippian System
As noted by Gibson (1965) Mississippian lirnestcnes altllough
overlain and underlain by potential source beds do not contain adeq-ate
reservoir rocks. The pr imary reason for this would Appear to be lack
of dolomitization and important tectonic movements and prolonged periods
of erosion. The Bronco field in T. 13 S., R. 38 E. contains a doloniite
facies f rom 80 to 100 feet below the top of the Mississippian and it is
f rom this interval that oil has been recovered. Near the. northern eroded
limit of the Mississippian dolomitization may be common but it i s doubtful
for the Filot a r e a where the limestcne sequence is overlain by the Barnett
Shale. Although there a r e some reported gas shows in and around the
Pilot a rea some of these have a questionable source in that the dri l l -stem
tes ts a lso include the upper part of the Silurian/Devonian carbonate sequence.
Pennsylvanian System
Oil and gas field data published by the Roawell Geological Society
and Meyer (1966) cannot be directly applied to this par t of southeastern I A
i !
Xew Mexico. The fields examined in these reports were mostly oil fields 1
north of the Delaware basin, whereas in the Delaware basin and immediately
adjacent a r e a s most discoveries have been gas (figs. 2 8 and 29). Field
data included thirty-five limestone reservoirs , nineteen sandstone, and
six in dolomite. Traps evaluated included forty-five stratigraphic or
combination ~tratigra~hicjstructural, and fifteen anticlinal. In the
Study a rea of this report, including singly designated fields that have

Fig 28 Pennsylvanian oil ond gos fields: Southern Eddy County
8 0i I f ields U - Upper 0 5 IOmiIas
0 ~ 0 s field L - Lower -
P- Pennsy lvanion C - Canyon S - S t rown A- Atoka M- Morrow

L I I I 1 W X
fi : Antelope Aldpe M . .. C .- .. .. I . . . . . . .
i Antrloer &into doja M Rldgo I
A (Abd) I P
t I
I 1
I t
OJA L C)
I CU
I 2 1 Arena Rojo P IN
6 -0 - 0- - -
T E X A S
Fig.29 Pennsylvanian oi l and gas fields: southern Lea County
8 Oil f ie lds U - Upper 0 10 miles
0 ~ 0 s field L - Lower P- Pennsylvanian C- Canyon S- Strown A- Atoko M- Morrow

been determined to be producing from more than one par t af the
Pennsylvanian, there a r e four oil fields and eight gas fields completed
in lirrrestone reservoirs, and two undesignated o i l wells and 29 gas fields
completed in sandstone reservoirs. Most of these fields a r e stratigraphic
o r combination traps.
For discussion purposes five areas were established covering
all of the producing fields in the Study area (fig. 48). For each of these
a r e a s a type well is used to show the stratigraphic pcsition of each pay
zone in that area. In addition the distribution of fields for the Strawn,
Atoka, and Morrcw intervals a r e shown on separate maps (figs. 30 to 33).
Area 1 in the northwest par t of the Study a r ea has five gas fields,
three oil fields, and one undeaignated oil well. The type well is the
Pan American 1 Emperor; discovery well of the Dos Hermanos-Morrow
gas field (fig. 34). Ikcept fo r the Golden Lane-Morrow field, Morrow
wells have multiple pay zones as follows: Dos Hermanos six sandstone
pays, Tower Hill, four, and Maroon Cliffs at leas t three. The six
gas-bearing sandstones at Dos Hernur~os a r e distributed over a 400-foot
section of the Morrow.
The Strawn fields a r e producing f rom l!.m.~stone reser voirr that.
a r e probably algal reefs. According to Thornton and Gaston (1967), the
Lusk field in T. 19 S., Rs. 31 and 32 E. is an algal reef that grew on r
structural ridge that +ends southeast into the Delaware brrrin. A
possible extension of this ridge is indicated in the Pennrylvrnfrn rtructtire
map (fig. 22) in T. 20 S., R. 32 E. If this i r t rue thir rtructural noro

T E X A S
W . L U S ~
* Fig. 30 Distribution of chert and upper Strawn o i l a n d gas f ieids
0 k - - -
5 10 miles O i l f i e ld a ~ a s field
# as. ~ o c k b e r r y I
b 8 i g Eddy I I
A I?. 3 1 E. I 32 - 33 3 4 35 Undes. R. 3 0 E. 3 I
Golden ' I 3 2 3 3 3 4
Lane
. - N
'U N
rr) (Y
No chert
e el
a N
uj w N &
NEW I MEXICO - -

Fig. 31 Sandstone facies and lower Strawn gas fields
O G a s f ield 0 5 10 miles n u

T E X A S
Fig. 32 Distribution of sandstone. oolitic limestone, and Atoko gas fields
0 G O S f ie ld I r J ool i t ic limestone Sandstcns

I I
I Dor Teas Hermonos Maroon 0 :3 Cl i t t r C
tu I
30 R.31 E. 34 0 O ~ d w r r ~ i l ~ R.30 E. 3 4
Golden I p f f y h n a
I Hat Meso -
S. Wl lronO N
I I -
N
S. Sand Dunes
Conyon 0 (Y
r, (Y
TEXAS
Fig. 33 Sondstone facies and Morrow o i l and gas fields
O i l f ield 0 G a s field

Pon Amer ican I Emperor Sec. 8, T. 20 S., R. 30 E.
Woltcomp Fm.
I . . .... I I
I . . .... I ~ i 2-0 * N Of- I
---.- -- -.- --- .- --- . - -- - . - I 1 -- - . - - - - . Barnett Sh.
12,800 - - - -
Hock berry,S.-Strawn ( o i l ) Lusk, W.-Strawn ( o i , ) aiq Eddy-Strown (o i ! ] Golden Lone-Strown ( g a s ) Tower H i l l - Undesiqnated (oil)
Moroon Cliffs-Morrow (gas) 00s Hermonos- Morrow (gas) Tower H i l 1 - Morrow (gas) Golden Lone-Morrow (gas)
Fin 34 Tvno w a l l +-. I o-..--..,..--:-- - : t -- - - -
. .

- was formed prior to Late Pennsylvanian-Early Permian time. Big Eddy,
South Hackberry, and West Lusk m a y be related to this structure and
corresponding control of reef growth but it wouid appear that reef
development i s much more widespread in Arca 1 and not totally associated
with structural ridges. Typical of platy or phylloidal algae reefs porosity
developinent varies considerably. At Big Eddy the tc~p of the pay zone
differs in each of the four wells completed in this field, ranging f rom
sever, to 173 feet below the top of the S t r am. At South Hackberry and
West Lusk the pay zoae appears t o be in the same seratigraphic position
but ex, ',oration indicates that they do not represent a connected reservoir.
To the south at Tower Hill and Golden Lane (Strawn) respectively the pay
zone is 1@4 feet and 6 to 38 feet below the top of the Strawn.
The type well for Area 2 was the discovery well for the South
Salt Lake-lUoka field (fig. 12). The pay zone in this well i s the sandstone
a t the top of the Morrow while the pay zone of the well in sec. 36, attributed
to the samtj field, is in sandstone in the lower part of the Strawn. The
South Salt Lake-Morrow field was completed in sandstone near the top
of the Morrow or approximately a t the same stratigraphic positio? a s
the deeper pay zone in the South Salt hke-Atoka field. The undesignafed
Morrow gas well in sec. 4, T. 21 YC., X. 32 E. was completed in the
Morrow but considerably below the pay zone of the Sou"% Salt Lake
Morrow wells. It appears to be about at the same stratigraphic position
as the wel l in the Teas field and both wells encou~~tered four separate
gas-bearing sandstones in this interval. The Hat Idesa fieid has two

gas sands in the upper par t of the Morrow, Although obviously producirrg
from Morrow sufficient data was not available to evaluirte the stratigraphic
position of the pay zones in the two undesignated Morrow oil wells.
AU of the wells in Area 3 ue re compieted in the Morrow (fig. 3 5 )
but apparently from different sandstones, m o ~ tly in the upper one half
of the interval. The number of gas-bearing sandstones ixi wells in the
Lea field vary from one to six, and there a r e three at Wilson, six a t
West Osudo, three at Berry, sit at South Wilson, and one to three at
Grama Ridge. Gas production in the lower part ,f the Morrow is
obtained from three sandstone beds a t Lynch and from a single sandstone
in one well in the Lea field. The upper half of the Morrow is on the order
of 430 feet in thickness. I t would appear that there is little continuity
between gas-beafing sands from one well to the next, or that some may
be continuous with nearby wells ar,d others have graded inta shales or
shaly sandstones.
Area 4 takes in all of the south-central gas fields plus +the Cedar
Canyon field. The type wel l is the Pan American 36 Poker Lake-Morrow
field (fig. 36). Gas production at Re&; Hills is from lower Strawn limestone
in T. 25 S., and f rom limestones in the Atoka and upper part of the Strawn
in T. 26 S. As aoted previously sandstone is absent in the Strawn in this
area. The Los Medanos field to the north i s a sandstone reservoir in the
lower par t of the Strawn. Although data is limited for Atoka fields all
appear to have limestone reservoirs perhaps of similar origin to the
Strawn fields to the north.

Pure I Wilson Sec. 13, T. 21 S.,R. 3 4 E
I . . ... . . I
I . . ... I I
I::: :::I
Lea-Pennsyivonion (gas) Osudo, WrMorrow (gas) Berry-Morrow (gas) ~ i l s c n - ~ e o n s ~ l u a n i a i (gas) WiIson,S.-Pennsylvanian (gas) Gramo Ridge -Morrow (gas) Lyrrch- Pennsylvanian (gas)
4 I Bornrtt Sh.
Fiq.35 Type wel l for Areo 3 P~nnsyivanian g a s f i e l d s

Pan American 36 Poker L.ake Sec. 28, 1.24 S.,R.31 E.
131500~~-j -- WoltcompFm.
tEzz7-7 Red Hi l ls -Pennsylvanian (gas)
Los Medonos- Atoka (gas)
Red H i l l s - Pennsylvanian !gas)
I Sand Dunes, W.-Atoko (gas) Sond Dunes-Lower Pennsy!vanion as) Sond Dunes-Atoka (gas) Red Hills-Pennsylvanian (gas)
Sand Dunes,S.-Lower Pennsylvanian (gas)
- . I Undeignated -Morrow (gas) ,C Sond Dunes, W.-Morrow (gas) - C g-, Sand Dunes-Morrow (gas)
- 2: n Sand Dunes,S-Lower Pennsy lvanian (gas) 2 Poke: Lake-Morrow (gas) Y a Paduca - Morrow (gas!
I Cedar Canyon-Morrow (pas)
Fig. 36 Type well for Area 4 Pennsylvonion gas fields

Gas has been discovered in sir fields and one undesignated well
in the Morrow of Area 1. Adequate data was, not available to determine
the number of pay zones discovered for all the wells in this area. Reservoir
rocks appear to be sandstones or conglomer~tes in the upper part of the
Morrow. There are four thin gas sands occupying approximately the
same stratigraphic position at the two Cedar Canyon wells and the Paduca
wells in sects. 2 and 12, T. 2 4 S., R. 31 E. There appears to be only
one gas sand in the northernmost Paduca well. There are at least three
gaa sands a t Poker l a k e and in the undesignated Morrow well just south
of the Los Medanoa field. Sandstones in tk.e lower part of the Morrow
have not been productive in Area 4.
The type well for Area 5 is the Conoco 1A Bell Lake in sec. 31, T.
23 S., R. 34 E. (fig. 37). .This well was completed in sandstone in the
upper part of the Morrow. The well in sec. 30 of the same township
dircovered gas in cavcrnoeri lime ;tone in the upper part of the Atoka and
the well in sac. 1, T. 24 S., R. 33 E. on the downthrown side of the Bell
Lake fault, from a sandstone near the middle of the Morrow, considerably
below the pay zone in the sec. 3 1 well. The two wells in the h te lope
Ridge-Atoka field appear to have a common reservoir in Lznestone in the
lower part of the Strawn. The w e l l in sec. 4 is recovering g.1~ from four
sandstone beds in the upper part of the Morrow and is included in the
Antelope Ridge-Morrow field. The other well in this field in sac. t?,
T. 23 S., R. 34 E. also has four gas sands but one or two of the sands
is stratigraphically lower than in the well to the south.

Conoco IA a e l l L a k e Sec. 31. T.23 S.,R. 3 4 E.
W - l f c rn Fm. "'"-Ezzl P f f
Antelope R idge - Atoka (gas)
B e l l Lake-Pennsylwaniil n (gas)
Be l l Lake-Pennsylvanian (gas) Antelope R idge- Morrow (90s)
. . . . . B a r n e t t Sh.
Fig. 37 Type we1 l for Area 5 Pennsylvanian gas f ie Id

The Pennsylvanian rocks within the Study area have a t least one
limestone and one sandstone reservoir in the Strawn; possibly three
limestone intervals in the Atoka; and at least six sandstones in the
upper haU and four in the lower half of the Morrow. Thus there is a
minimum potential of 15 separate zeser-coirs. Coapled w i t h the high
ra te of auccess of wildcat exploration the chances of one of these
r e s ervoir rocks being developed and containing oil or gas would seem
quits high for any part of the Pilot area.
The source of Pennsylvanian oils is thought to be indigenous,
derived fronr the dark shales present throughout the sequence (Jones
and Smith, .1965). R would seem possible, however, that some of
thc Strawn oils might have their source in the overl-yhg Wolfcamp.
Hoknquest (1965) has suggested that oils f rom P e r m i a n / P e ~ s y 1 v a d a n
shales diassociate at burial depths of 8,000 to 9,000 feet, and therefore
future deep discoveries in the Delaware basin will be almost exclusively
of this type. O i l fields within the Study a rea are all at depths exceeding
10,000 feet aad the two recent Morrow oil discoveries occur a t depths of
over 14,000 feet. Phase segregation such a s suggested by Silverman
(1965) o r Gusrawl s (1954) updip spilling may account for the Morrow
occurrence, but this implies reservoir continuity; highly questionable in
the Morrow. ha any event the potential presence of oil in any part of
the Pennsylvanian in the Pilot a rea cannot be discounted,
Permian System
The source of oil and gas in the Permian of the Delaware basin

. 8 8
is in general thought to be indigenous to the various formations. Jn
particular tl,e thick bs ninal Wolfcsmp shales appear to be a prime source i i g
(Jones & Smith, 1965). The potential for intrabasinal migration in the i I
I Bone Springs and Delaware Mountain would appear to be good based on
the apparent discontinuity of suitablc caprocks and may in part explain i
I
the concentration of o i l a t the top of t l e Bell Canyon beneath the anhydrites i !
of the Castile. Fields in the Delaware Mountain Group below the Ramsey I
"sand" in particular appear to have very limited areal extent. The moat
Likely source of oil in the Leonardian and Guadaluplan rocks would appear
to be f rom +he Bone Springs although shales and lime muds in the Delaware
Mountain also may have contributed to the Glradalupian oils. As pointed
out by Adams (1936) most oil in the upper part of the Delaware Mountain
Group occurs on the west flank of the basin, but it also should be pointed i . I
! out that baain asymmetry and the position of: t i e Gapitin reef favor west- i flank accumulation.. What contribution shelf oil might have made to the
1 4
i basin is questionable, particularly in view of the problems of migration. ! a
i Holmquest (1 965) has noted disassociation of Wolfcamp oil at depths of
i burial of f rom 8 ,000 to 9,000 feet and Meyer (1966) the shelfward
i migration of Wolfcamp oil.
Wolf camp Formation , I
Bas ?d on an evaluation of field data from the symposiums of
the Roswell Ge~logical Saciety (1956, 1960, 1967) the majority of
Wolfcamp fields a r e structural or combination traps with very iew strictly I
stratigraphic traps. Fields anaiyzed more recently invariably indicate
a combination trap consisting of osity/permeability barr iers 1

associated with an anticlinal structure. Although reef conditions i.a the
Wolfcamp were not generally recognized until quite recently some of the
,fields in the Study area mar occur in porosity traps associated with
biostromal deposits. All reported Wolfcamp reservoir rocks are
Limestone or in a few cases dolomite. These have intercrystalline, vuggy.
and pinpoint porosity, and limited coring has indicated some fracture
porosity in a few wells. Oil produced on the Central Basin platform
occurs in carbonates of the Abo Formation of lower Leomrd age and thus
i s not correlative with the Wolf camp of the Delaware basin area even
though Abo sediments to the west a r e in part coeval.
.There a r e five fields known to be of Wolfcamp age in the Study
area and one field designated as Pennsylvanian that is being produced
from sediments included in this report with the Woifcamp (figs. 14, 38, and
39). Gas at Big Eddy is being recovered from a massive fossiliferous
limestone, the top of which is about 120 feet below the top of the Wolfcamp.
This appears to be a reef complex that could b-ve considerable extent
in the northern part of the Study are?. This limestone appears to be
present but mud thinner in T. 2 1 S., R. 32 E. Limestones at different
*.rc eit.tf one within the Wolfcamp section are present in T. 22 $. . R 30 E. ,
and T. LZ S., R 32 E. The conclusion would seem to be that one or more
limestone beds that :odd be potential reservoirs are present in the Pilot
Area.
The Southeast Lea field in T. 1.0 S., R. 35 E. was a dual completion
in Wolfcarnp and Morrow. The top of the Wolfcam? pay zone is at 1 1,4 10

Fig. 38 Wolfcomp oil ond gas fields: Southern Eddy County
8 Oil f f ~ i d 0 S IOmiier - 0 Gar f ield

Fig. 39 Wolfcomp oil and gas fields: Southern Lea Count)
8 O i l f l r ld 0 5 I0 milam - 0 Gas flald

92
feet in a limestone occupying a similar position t c the pay zone at Big
Eddy. G a s is being produced from the same interval in the cther well
in thls field in the SE~, sec. 26, T. 20 S., R. 35 E. The producing
interval of the Cabin Lake -Strawn field may he Pennsylvanian but appear s
to be in limestone or dolomite just above the top of the Strawn. It therefo :e
could be in the Canyor~ but this part of the section is included in the
Wolfcamp in this report. The Remuda- Wolfcamp field to the southwest
in T. 23 S., X, 29 E. has a limestcne pe y zone about 1,000 ieet above
f i e tcp of the ~e&w~lvanian . In this well as in the Cabh Lake well the
Wolfcamp corrtai~s considerable linzestone in +he upper part of the section.
Of interest of courca is that Remuda and Cabin Lake a re oil fields being
produced a t depths of from 11,000 to 12,000 feet. This certainly
strengthens the oil potential of the Pilot Area wheze depths are approximately
the same in the western part of the area and only slightly deeper in the 1
east.
At Paduca gas i6 being produced from a limestone-dolomite
sequence near the middle of the Wolfcamp. The carbonate section is
overlain and underlain by thick shales. At Red Hills gas occurs in
limestone stratigraphically iower than at Paduca but over 600 feet above
the top of the Pennsylvanian.
It is obvious from the foregoing that limestone sections are the
prime explorztion target in the Wolfcamp. Suitable limestone reservoirs
similar to those discovered in the Study area very likely underlie the
Pilot area. Potential Wolfcamp reservoirs probably have not been

carefully evaluated in many of the wells drilled in this par t of the
Delaware basin where the prirne targets are i n the underlying
Pennsylvanian. The potential for discovery of +and gas in this interval
is considered good and in view of the prolific product;on of gas at
Hills it is surprising that more tests of this inter ,al are not being drilled.
Bone Springs Forznation
Reservoir rocks in the Bone Springs Formation include Limestone.
dolomite, and sandstone. At Big Eddy and Teas oil is produced from the
top of the first Bone Springs sand (fig. 16). Bcne Slrings oil occurs in
limestone below the second sand a t Grarna Ridge and near the top of the
upper limestone at Bell t k e and North Bell Lake, There a r e two pay
zones in the Lea Field. The upper i s iu dolomite near the top of the
f i rs t sand and the lowqr, also dolomite, near the middle of the second
sand, There art, based on current knowlelge, four pay zones in the
Bone Springs a d if it is considered that the dolomite in the f i r s t nand
repreeents a separate ~ o s s i b l e reservair thzre would be five pay zones,
Traps in the Bone Springs a r e normally thought to be stratigraphic
or in part combination traps, Bell Lake obviously is primarily an.
anticlinal trap but apparently contains porosity/permeability barriers..
Both tke sandstones and carbonates in the Bone Springs have the
characteristics to form permeability barr iers and caprocks in that both
contain varying amounts of argillaceous material. The potential for
suitable traps including minor structural nosing would appear to be good
on the west £lank of the Delaware basin in the Pilot area. Rather


limited shows and the fact that all oil thus far produced from this interval
lies to the north and east (fig. 40) a r e negative potentla1 factors.
Delaware Mountain Group (Pre- Ramsey)
There a r e seven fields in the Study area that hove been completed
in the Delaware MoWain Group exclurive of the Upper Bell Canyon pay
zone (fig. 411. The relative stratigraphic positions of these fields a r e
shown on the reference section (fig. 18). As can be seen two reservoirs
have been found in the Cherry Canyon Formation,- Big Eddy and Sand
Dunes; four in the Brushy Canyon Formation, w a d = Ridge, Cotton
Draw, Maroon Cliffs, and U. S. ; and the Parallel field consists of one
well completed in the Cherry Canyon and one in the Brushy Canyon.
All the reservoir rocks a r e very fine-to rn-rlium-grained sandstone,
with the oil confined by stratigraphic traps, Details of some of the pay
zones a r e given in figure 42. Similar to the overlying Ramsey zone and
underlying Bone Spcinqs the traps may be difficult to distinguish, consisting
of minor updip variations in grain size and sand "buildups" creating a
depositional structural trap. Also similar to the Ramsey there is a good
possibility of hydrodynamic traps in the Cherry Canyon and Brgshy
Canyon formations. The fields discovered thus far have a pronounced
north-northwest trend and dl are on the west flank of the Delaware basin.
The only field outside t h i s area, in this part of the Delaware Mountain
Group is the Querecho Plains-Delaware (Brushy Canyon) in T. 18 S.,
R. 32 E, This also is in a sandstone reservoir but its position relative

Fig.41 Delaware Mountain Group oil f ie lds
. 0 Gas f ie ld 0 I- 5 IOm~lts
2 5
5. - 0 -J
-
2 4
1-
-- ---Zn!2+ ---,- ---- M a Eddy County C- a a 0 z= r 2 2 1 -: r Oa - :I-
- 1 ; - 4 C c ,OGS -
0 :z - - - - ----,,,z- 0
t
C-
t
s
t t t t
i
B E
60 0 a = VI
= n a - 0 C .- Z 0 - C 0 Y)
0-a e 5-- - C 0 0 c m
= v w ? 2 ; : m - a
i5' c-
i: 0
, "Z - 0 0
C 0 - C
LL
I
- w 0
. a CI
ui s s : -
0:
:m o C 0 a 0
-.
I
I I
1
--
a a
a 0 m
ma - 0 0
IC N
j Co (Y
a .I
UD (Y
ln hl
C- 0 -- - 0 - C w


to the Delaware basin is not known. It may be very close to the shelf
margin for the Brushy Canyon Formation.
Delaware Mountain Group (Ramsey Zone)
The upper part of the Bell Canyon Formation includes several
idormally named members. Units below the Lamar Limestone are in
descending order; Trap member, Ramsey sandstone, Furd shale, Olds
sandstone, and Hays sandstone. As pointed out by Grauten (1965) the
Lamar Limestone in much of the interior of the Delaware basin consists
of shale, shaly sandstone, and shaly Limestone. Locally limestone is
absent but highly calcareous shales give similar response on mechanical
logs. An examination of sections of the upper part of the Bell Canyon
Formation (fig. 43) gives some indication of the stratigraphic complexity
in this sequence of rocks. The fact the oil i s so widely distributed in
this interval throughout the Delaware basin (petroleum distribution
factor of 62 percent) suggests an interconnected hydrodynamic system,
through which water, oil, and gas migrated 'rather freely. Where
permeability barriers a re present such a s minor changes in clay and/or
silt content, coupled with splitting of the permeable sands, traps occur
to contain the oil and gas. This type of trap mechanism seems to be the
dominant feature of the New MFico fields although hydrodynamic trapping f
plays an important role in locaiization of oil in many of the fields. The
Ford shale is considered by many geologists to be an effective, basin-wide
permeability barrier. This requires that oil in the Ramsey be indigenous
to the upper part of the Bell Canyon or derived from some unknown source
0 #


outside of the Delaware basin. In addirlon it woul2 Reem that if the For4
were such an effective permeability ba r r i e r , that i t a lso would be a n
excellent caprock and considerable oil would be trapped below the Ford
in the Olcls sand. *
Grauten shows a n eas tern anticlinal province that extends into
I Lea County. In this a r e a the normal gas, oil, water relations exist whereas
i n the homoclinal province to the west these relaticnships a r e considerably
mixed even between closely spaced wells. None of the New Mexico fields
appear t o be related to the anticlinal province, Fields such a s Paduca,
I Cruz, and Salado Draw (fig. 44) have some s t ruc tura l nosing but this 6
I appea.rs t o be relatively unimportant in the entrapment of oil and gas.
The variable s t rat igraphic positions of oil occurrences in the
upper Bell Canyon a r e shown in the examples in F igure 43. Depths below
the L a m a r interval a r e 56 feet at Double X; 47, 62, and 74 feet at Paduca;
17, 38 and 45 feet a t E l Mar; and 37 feet a t Salado Draw. The important
factor i s that the differing depths of pay zones for these one-well field
examples, a r e just a s variable within each field. The noncommercial
weU in T. 22 S. , R. 32 E. a l so contains fluids, presumably water with
minor content of oil. If updip f rom this well the permeable sand a t a
depth of 4725 feet is split by a thin nonpermeable mater ia l oil may be
concent rated in c o m e r c i a 1 amounts.
When i t i s considered that the depositional fea tures of the cpper
p a r t of the Bell Canyon sxggest a n almost infinite possibili ty fo r t raps ,
of the tvpe discussed above, occuring in any given lsntested a rea , it m a s t

Fig. 44 Ramsey oil fields
0 5 10 rnll.. -
- (V
N aI
CARLSBAD 0
'~sprronra
~ W Y ( A M )
m cY
d (Y
n (Y
vi cO (Y
c:
- I I
%I - -1; 24 3 0' 0 u10 I I
kl 0
~ , f

be assumed that the petroleum potential for that a rea i s good. Again, 1 I
the important factor3 to consider a r e widespread distribution of petroleum, I
interconnecting fluid conduits, and rapid, small-scale variations in sand, I
silt. and clay content.
The Pilot Area is adjacent to the Capitan reef a s shown in i'igure
25. This proxirnit.y would appear to have no bearing on potential foz the I
rand-shale facie8 of the Bell Canyon Formation. An added possibility for . I
stratigraphic t raps also exists in the reef detritus of the Lamar Limestone
member. Although no discoveries have been made in the Lamar., reef-detritus
fields a r e present in the back-reef Yates Formation and occur in other
parts of the Permian section adjacent to reef fronts. The Midway and
Double A-Abo fields occur in Abo reef detritus in the Bone Springe
Formation.

EXPLORATION STATUS AND ESTDAATED RESERVES
An evaluation was made for each well drilled to the Delaware
Mountain Group or older rocks in the 42 township Study area. This
involved cataloging 738 tests as to whether they were completed as
producing oil or gas wells, had a "show" of oil, gas, or both, or had no
reported occurrence of petroleum. Symbols indicating the appropriate
status were used in plotting the maps showing the stage of exploratory
development for each stratigraphic interval described t.7 this report.
Data was tabulated for all wells for which completion rt-forrnation was
available a s of November 1, 1973.
The reliability of some of the information used in compiling this
data is questionable. Drill s tem tests and core analyses provide good
information for the interval examined. Reported shows of oil o r gas,
although positive in natur a, a r e commonly difficult to evaluate in that
they depend to some degree on the experience of the observer. At the
other end of the spectrum is the test for which there i s no reported
presence of petroleum for a specific stratigraphic interval. If the
exploration target is a deep pay zone, shallower, potentially productive
intervals cccmmonly a r e not tested or may not even be carefully examined
through uae of logs o r samples. Wells shown a s having no oil or gas for
a pa;ticular interval, have the tendency, in the view of someone making a
cursory evaluction of potential, to condemn that par t of the section at
that location. This is t rue even though in numerous cases the potential
pay interval may not have been penetrated or adequately evalcated. To

this i s added the problem of historical sequence where many wells have
been drilled prior to a n awareness of various geologic parameters
controlling accumulation, or engineering advances in drilling, testing,
and completion of wells.
Success percentages for each interval were calculated using both
the standard method of wildcat success versus failure, and from total
productive acreage versus nanproductive tested acreage. In the lat ter
case 40 a c r e s i s used for oil wells and 160 a c r e s fo r gas wells with
certain departures explained in the following discussions of each interval.
Calc-dations based on productive acreage a r e considered more vaiid
particularly where the occurrence of petroleum has a random distribution
pattern indicative of widespread presence and stratigraphic control of
accumulation with structural control of secondary importance. Validity
' of calculated yields of oil and gas is in pa r t substantiated, although not
used directly in calculations, by the incidence of petroleum for a part icular
interval. This is based on the percentage of wells producing o r with
recorded presence of oil or gas and the total number of wells drilled.
There is a high incidence of petroleum in the upper pa r t of the Delaware
Mountain Group, Pennsylvanian, Silurian/Devonian, and Bone Springs
Formation. Although petroleum incidence is high for the Ordovician the
sample i s coli'sidered to be too small to be significant and there i s no
petroleum being produced f r o m this interval in the study area. Petroleum
, presence is low fo r the remainder of tSe Delaware Mountain Group,
I WoLfcamp Formation, and Mississippian rocks.
J

The total area used in arriving at the ca1cu:ations of potential
yield for an untested section, is approximately 979, 200 acres for all
intervals except the upper part of the Delaware Mountain Group (Ramsey
pay cone) which underlies about 7;3,000 acres. ~edirnentar:, rocks
containing oil and/or gas within the Study area, but representing back- reef
facie 8, a r e not included in this r :port.
Aside from geological factors the statistical analysis breaks down
in part in that the probability of gas or oil acclunulation is not taken into
cot rideration. The depth of SilurianlDevonian o i l in the narth part of
the area and recent oil discoveries in. the Pexisylvanian at depths and in
an area heretofor considered a natural gas province, negate to some - attent any attempt to categorize production potential from this standpoint.
Another factor that might be considered ia statistical evaluation
of potential productive acreage is the density pattern of nonproductive wells.
Evea though only three percent of the total land area ~nder la in by the
Ramaey pay zone has been tested there is a relatively dense well
distribution for much of the area such a s in T. 22 S., R's. 32 to 33 E.,
and T. 23 S., R's. 31-33 E. (fig. 52). However, even w!+hin this a rea
there a r e at least three untested blocks that could accommodate a field
the size of Paduca.
The potential yields per section presented here and in the summary
can be modified either up or down by application of the above factors,
geologic conditions, or validity of projected per acre yields.

Ordovician System
Although there is no production of oil o r gas f r o m the Ordovician
in the Study a rea , the incidence of occurrence of petroleum i s a high 6 3
percent of the wells drilled. As with the Pennsylvanian and Silurian/Devonian
this may in pa r t reflect m o r e careful attention to examiiiation of a section
requiring the drilling depths needed to reach the Ordovician. Some of the
reported shows are of some interest in evaluating the potential f r o m this
interval (fig. 45). The well in sec. 32, T. 25 S., R 3 3 E. had bleeding
gas f rom a co re taken between 2C, 890 and 20, 936 feet. At the -%ell in
sec. 25, T. 20 S., R 32 E., 340 AMCF of gas and some oil were recovered
during a dr i l l s t e m tes t f r o m 16,280 to 16, 330 feet. The best resul t s
were obtained in the well drilled In sec. 4, T, 24 S., R. 34 E. where 950
MCF of gas was recovered f rom 17,432 to 17,843 feet.
The presence of petroleum in Ordovician rocks h a s been established
for the Study a r e a by tht few tests drilled to date, involving only 0. 0 3
percent of the land area. Whether o r not there a r e commercial accumulations
and if s o under what type of geologic control can only be inferred by
inadequate geologic data.
Silurian/Devonian Systems
There a r e s ix designated Devonian fields in the Study a rea . five
gas and one oil (figs. 27 and 46). Gas fields a r e Paduca, Bell Lake,
Middle Bell Lake, North Bell Lake, and Antelope Ridge; o i l i s produced
a t the Lea field. In addition there is one undesignated oil well and one
-! undesignated gas well. Antelope Ridge, Bell Lake, and Lea contain m o r e

Fig. 45 Exploration stotus: Ordovician System 3 5 10 miles
E011 EGOS O Show ofoi l E S how of qor aShaw of oil and gas QDry holm

Fig. 46 Exploration status Silurion/Devonian Systems 0 5 lOrnllt%
8011 BGos OShowoCoil BShow of gOS I[0Show of oil on0 gor OOty hole

plus three tests drilled to the Devonian in the immediate area. Two of
the dry holes had shows of o i l and gas in the Devonian and three of the
wells not producing from this intervzl are Morrow gas wells including
I one well from which oil is produced from the Eone Springs Format i~n.
t- Field limits a r e therefore quite poorly defined. At Bell Lake one
I development well has been completed and one offset to tl-5 west i s producing '
from the Pennsylvanian with no reported shows of oil o r gas in the I
4 Devonian. The northwest offset to the Paduca. field also is producing
from the Pennsylvanian but had good shows of gas from the Devonian,
including 340 MCF for a drill stern test from 16,456 to 16,660 feet. To
the northwest the undesignated gas well was completed in the Devonian
in 1967 but later recompleted to the Pennsylvanian and is the discovery
wel l for the Poker Lake-Morrow field. The undesignated oil well in
see. 26, T. 20 S, , R, 35 E. is a dual completion in the Osudo-Morrow
gas field. The off set to the easi: produces from Wolfcamp &.ad Pennsylvanian
and there were no reported shows in the Devonian. These a r e the only
two wells that have been drilled to the Devonian in the immediate area,
The gas well in sec. 4, T. 2 4 S., R. 34 E. in the Antelope Ridge field
is of interest in that 56 barrels of oil were recovered on a drill stem
test from 15,017 to 15,074 feet, and 52 barrels from 16, 140 to 16.220
feet, both intervals within the Silurian/ Devonian sequence.
Drilling density to the Devoqian is one well for every 24 square
miles, and one well for every 46 square miles south of T. 20 S. Seventeen

townships have no tests and 11 have only one. The po t e~ t i a l for this
interval would appear to be high based on current production distribution.
A possible racdom distribution is also indicated by the high incidence of
petroleum occurrence compared with.the cumber of wells dyilled. For
the Devonian thic i s 72 percent and i s exceeded only by the i?ennsylvanian.
Based on productive acreage there ie a 16 percent su t cess for
011 and 14 percent for gas. Wildcat auccese ie four percent for o i l and
14 percent for gas. Statistically, using a productive a r ea bas i sand data
from the following part of this report, an unteated section can be considered
to be underlain by 1,368,330 barre ls of oil; 3 5 , 720 barrels of distillate;
4,244,310 MCF of gas; and 656,676 MCF of associated gas. Using wildcat
success ratios, averagr. production per well, and number of potential well
locations, the statistical potential would be: oil - 343,422 barre ls ;
distillate - 36,562 barrels; gas - 4,225,491 MCF; and associated
gas - 164,804 MCF. From re$orted shows and production the chance
of finding gas instead of oil is seven to one in this area.
Mississippian System
There is no oil o r gas production f rom Miseiaeippian rocks in
the Study area. 4 total of 69 wells have penetrated this part of the section
primarily a s tests of underlying Devonian sediments (fig. 47). Ten of
the =ells have encountered petrolevm but some of the drill s tem tes t s
span the section into the Devonian and the shows may therefore be from

Fig. 47 Exploration status: Mississippian System
0 5 M m ~ l e r 1
.Oil E G O S B S h o v o t o i l EShow o t 90s Shcw of oil ond gos ODfy holm

this interval. The dri l l s tem test of the well in sec. 36, T. 22 S., R. '
. 30 E. with a recovery of 2,850 MCF of gas was of this type. The
producing interval given for the discovery well of the Paduca - Devonian
field in sec. 12, T. 25 S., R. 32 E. includes the carbonate section of the *
missi is sip pi an. An examination of logs f rom this well, indicates that the
gas is being produced f rom the Silurian/Devonian. The only significant
occurrence that can fairly reliably be attributed to the Mississippian is
the well in sec. 4, T. 20 S., R. 34 E. where 35 MCF of gas was recovered
on a dri l l stem test of this interval.
The total a r ea tested for the Mississippian, on a 40 ac re per well
basis is 2,760 a c r e s o r 0.3 percent of the study area. h a - m i c h as there
is no production, potential projected reserves per section a r e not given
here. Projected yields per ac re based on regional evaluations a r e given
elsewhere in this report but no attempt has been znade to calculate succe 9s
ratios. These figures would be very low for southeastern New Mexico.
Pennsylvanian System
Exploration of Pennsylvanian age rocks has been quite recent in
this a rea but results warrant extensive additional drilling. The incidence
of petroleum occurrence in 88 percent of the wells drilled reflects the
widespread distribution of oil and gas, the numerous potential pay zones, I I
and in par t the greater ca re in testing of Pennsylvanian rocks.
w Based on 40-acre spacing for oil tests, 4,800 acres (0.5 percent
of the iota1 area) has been tested and eight percent has proveu productive.

Because of reduction in the number of wells used in calculating wildcat
success, nine percent of theee tests resulted in discovery of new fields.
Gas exploration figures show 19,040 acres or two percent of the land
a r ea tested and 10,400 acres productive for 55 percent success. Wildcat
exploration for gas has resulted in 5 1 percent of this category being
successfully completed. Using data based on productive acreage to
determine the potential of each untested section statistical yields are:
265, 455 barrels of oil; 105,952 barre ls of distillate, 7,085,760 MCF of
gar; and 1,580,286 MCF of associated gas. From wlldcat success ra t ios
predicted yields per section would be: 299, 788 barrels oi oil; 94, 596
bar re l s of distillate; 6,441,672 MCF of gas; and 1,784,799 MCF 0:' a s s c ~ i a t e d
With the exception of the Big Eddy-Strawn oil field there have been
only minor attempts to develop' oil reserves i n the Pennsylvanian (fig.
, 48). TWO wells have been drilled in the vicinity of West Lusk-Stramr oi l
field and tested the pay zone in the upper par t of the Pennsylvanian. The
well t o the south had a slight show of oil in core taken f rom 11,525 t;
11,576 feet. At the South Hackberry-Strawn oil field, gas was reccvered
in dri l l s tem tes ts of the upper Pennsylvanian pay zone a s well as f rom
other de.zper intervale in the Pennsylvanian. The well t o the east of
South Hackberry was drilled pr ior to the discover) well and recovered
some gas-cut mud from the South Hackberry pay zone. The u?designated
oil field a t Tower Hill in T. 21 S., R. 29 E. was recom.pleted as an oil
well in the upper Pennsylvanian. Previously gas was produced from this . - well in the lower part of the Pennsylvanian. T11e test drilled in the next
- - 1
a

Fig. 48 Expl orotion stotus: Pennsylvanian System
0 5 13 m*lrr
H01l EGOS B Y l a o t o ~ l EShowotgos ~ S h o w o t o i l o n d g a r O D t y h o ~ a

section west of Tower Xi11 recovered oil and gas in tests of the upper -
Pennsylvanian pay zone. f i e two undesignated oil wells in T. 2 1 S.,
R. 32 E. were c o ~ p l e t e d in 1973. These wells a r e producing from the
lower part of the Pennsylvanian and in addition to being the f i r s t oil w e l l s
completed in this zone, have the d e e ~ e s t Pennsylvanian oil prod-lction
in the Study area. The well in sec. 1 h+.d an ini t ia l potential of 288 . .
barrels of oil pe r day from I f , 791 to 14, G75 feet. In sec. 2 the initial
potential w a s 80 barrels of oil per day from 13, 968 to 14, 026 feet.
Offset wells have been drilled to 11 of the Pennsylvanian gas
discoveries. Fields with a t least one development well include Dos
Hermanos, Golden Jane, South Salt Lake, Lea, G r a m a Ridge, Hat Mesa,
Bell Lake, Antelope Ridge, Cedar Canyon, Paduca, and Red Hills.
Although there a r e a number of wells drilled near the Maroon C l i f f s field
only one beside Ole discovery w e l l has penetrated to this pay z o ~ e .
Within the Lea field there a r e four wells shown as not producing from
the Pexosylvaniaa. The wells in see. 12 currentiy are producing oil
from the Devonian a rd Bone Springs Formation. Two of these wells may
be recompleted in the Pennsylvanian. The well in see. 1, 'T. 20 S.,
R. 34 E. was completed as an oil well in the Bone Springs after negative
t e s t i ~ g in the Pennsylvanian. The wel l in sec. 4 northwest of Lea had
shows of gas in the Pennsylvanian and gauged 1,250 MCF from the upper
part of this sequence. The tes t near the discovery well of West Osudo
produces f rom Wolfcamp and Devonian, and the t e s t further to the west
recovered 48 and 80 MCF from two zones in the Pennsylvanian. The

well eas t of South Wilson was dri l led p r i o r t o the discovery of the
Wilson and South Wilson fields; severa l good shows of gas were tested
in the pennsYlvania& At Antelope Ridge the well in sec. 34, T. 23 S.,
R. 34 E. is current ly producing f r o m the Devonian. Drill s tem t e s t s
of various pa r t s of the Pennsylvariia~. recovered 40, 7 0, and 3,600 AMCF
of gas. The two wells just north of Antelope Ridge a l s o had shows i n the
Pennsylvanian and one was not a complete tes t of this interval. The
well near Bell Lake field in sec. 6, T. 24 S., R. 34 E. produces f r o m
t1:c l2cvorian; t h e r e were co reported shows f rom the Pennsylvanian.
'i,~t. "dry hole" nea r t!!e Paduca field also produces f r o m the Devonian
but encountered shows of gas in the Pennsylvanian.
It can be s e e n that many wells dril led in h s a r e a may be
recompleted in the Pennsylvanian even though they a r e not cur:a:ntly
' producing f r o m th is p a r t of the section. Even without additional discoveries
this would mignificantly change the success ra t io of Pennsylvanian
exploration ixl t he Study area. Production t rends without Intervening
dry holes and the mult iple producing zones support a conclusion that
prqduction f roni the Pennsylvanian m a y eventua!ly cover a considerable
part o i this a rea . Signifisant a s far c s the Pi lot a r e a is concerned i s
tilt i>: %l:lca -Poker Lake-Sand Dunes -Lo8 Medanos t rend and potential
f o r ~ : i ! . : i l s : o ~ toward Hat mesa. Drilling to date h a s not defined the
. . r l s r ,;: . : :a: -, r .tc-tical l imi ts of petroleum accumulations for any pr r t
of this a rza . 'A;?~.Z i t i s considered that t he re i s only one tezt for
every 1 3 square miles , sixteen of the 42 townships completely unexplored,

and a high ruccess ratio regardless of method used it would appear to
be impossible to rule out a high potential for any specific untested
location. Perhaps more than any other part of the stratigraphic section,
statistical projection of reserveo would appear to be quite valid for the
Pennsylvlnian sequence.
Wolfcamp Formation
Six gas wells and two oil wells have been completed out cf the
125 tests that have penetrated all o r part of the Wolfcamp Formation
(fig. 49). Because both oil a d gas wells occur in the Wolfcamp. 1.60
acres were assigned each well in calculating sllccess ratios for gas, and
40 acrer for each well for oil. This results in 19, 680 acres having been
tested for gas and 5,000 acrer for oil. Of this 80 acres o r tan, percent
of the total acreage tested is oil productive and 940 acre8 o r five percent
has gar production. From a wildcat exploration standpoint two percent
of the oil tests and three percent of the gas tests have been successful.
Using atatistical data based on percent of productive acres there is a
potential for each untested section of 20,800 barrels of oil: 32.544
barrel8 of distillate; 633,984 MCF of gas; and 228,462 MCF of associated
gas. From wildcat s u c c e ~ s ratios, the oil potential is 20,475 barrels;
associated gas, 224,953 MCF; distillate, 19,530 barrels; and gas,
383,969 MCF.
The land area tested for oil amounts to 0.5 percent and for gas
2.0 percent. There a r e 15 townships without tests and five with one
test. Dz illing density is one well for every 12 square miles for the
total area and one for every 20 square miles aouth of T. 20 S.

Fig.49 Exploration status: Wolfcomp Formation
0 5 10 rnele*
6011 EGos EShowoto i l 8 Show of % S h a of oil ondgos 0 0 r y hole

Areas of more concentrated drilling a r e primarily where petroleum has
been discovered in underlying rocks of Pennsylvanian age. With the
exception of the second wells drilled at Red Hills and Southeast Lea there
have been no development wells drilled in an attempt to extend Wolfcamp
discoveries. T?ae two wells near the Paduca field produce from the
Pennsylvanian; no shows or tests were reported for the WoUcarnp interval.
Big Eddy was discovered in 1962; the two wells drilled to the southwest
were later Pennsylvanian tests apparently without testing the Wolfcamp
pay zone. The well drilled about one mile southwest of the Southeast Lea
field was drilled to the Mississippian. Tests of the Wblfcamp recovered
heavily gas ~ u t mud and a trace of oil.
Reported occurrencea of noncommercial amounts of petroleum
include two wells with oil, seven with gas, and 10 wi th gas and oil.
Overall 23 percent of the wells that have tested the Wolfcamp hare either
been completed as oil or gas wells or have had shows. This is low
compared with other parts of the stratigraphic sequence, but the wide
spacing of ail and gas production in the Delaware basin, and recent
discoveries to the west of the Study area indicate a regional occurrence
of oil and gas.
Bone Springs Formation
Seven Bone Springs fields have been designated in the Study area:
Big Eddy, Teas, Lea, South Lea, Grama Ridge, North Eell L a ~ e , and
Bell Lake (figs. 40 and 50). The Lea field which extends north into
T. 19 S. consists of eight wells in the Study area, Bell Lake three and

Fig. 5 0 Explomtion sta ?us: Bone Springs Formation
0 5 10 milm - - - d
moll OGos BShorot oil BSkow of poS eShow of oil and gos ODry holm

the remainder of the fields, one well each. Many of the wells shown
within the area of the Lea field a s nonproductive in the Bone Springs a r e
currently producing f rom the Pe.xnsylvanian. The limits of the Bone
Springs reservoir have not been defined and based on the significant
ehows of oil and/or gaa it appears likely that several wells currently not
producing from this interval will be recompleted t o the Bone Springs
when the deeper reservoir has been depleted, A number of wells have
bo-en drilled through the Bone Springs in the Bell Lake a rea t o t e s t
Peaneylvsnian and Devonian pay zones. Gas and some oil ha s been
recovered during tests of various parts oi che Bone Springs in this area.
T h e nearest well drilled to the Big Eddy field, discovered in 1969, is t o
the southwest and was drilled in 1954. Although drilled to the Bone
Springs this well did no* reach the pay zone at Big Eddy. Grarna Ridge
was discovered in a test of the Morrow and after one year of production
from the Bone Springe was recompleted in the Pennsylvanian, Other
nearby wells also produce from Pennsy1vania.n age sedirneats, The offset
well south of the North Bell Lake field apparently had no shows in the
Bune Springs and only a srnall amount of oil was produced at North Bell
h k e , There has been no attempt to develop the Teas field; somewhat
surprising inaamuch as this has been a fairly good well.
Numerous wells drilled in the Study area have recovered some
petroleum; included a r e eight ior which oil uas observed o r recovered
by testing, 15 with gas, and 20 with both oil and gas. Added to tests
completed as oil wells, 39 percent of the wells drilled have encountered

oil and/or gas. Drilling density is one well for every 10 squart miles
for the total area and with 46 percent of the wells drilled in T. 20 S.,
only one test every 17 squa.re miles to the south. Fourteen townships
have not had a test drilled to the Bone Springs Forrn~t ion and five have
had only one test. Based on 40 acres per well; 6,040 acres or 0.6
percent of the land area has been t3sted. Of this a rea 640 acres 3r 11
percent has been productive and wildcat success is five percent. From
the calculated yield per acre for the Bone Springs in the Study area there
is a statistical potential for each untested section of 193, 952 barrels of
oil and 379,738 MCF of. a s soc i a t~d gas. Based on the -mildest success
ratio the estimate is 88, 170 barrels of oil and 172,6 10 MCF of gas per
section.
Delaware Mountain Group (Pre-Ramsey)
Fields producing from the Delaware Mountain Group within the
Study a rea a r e shown in Figures 41 and 51. The fields a r e Big Eddy,
Parallel, Maroon Clrffs, U. S. , Quahada Ridge, Sand Dunes, and Cotton
Draw. Only Sand Dunes and Parallel consist of more than one well , and
Big Eddy, Sand Dunes, and Parallel a r e the only fields still under
production. Attempts to develop the fields producing from this interval
have been very limited a s has exploration of this part of the geologic
section. The fairly dense drilling in the rortheast part of T. 20 S.,
R. 34 E. reflects exploration and development drilling to the Bone Springs
and Wolfcamp formations and various parts of the Pennsylvanian section.

Fig. 51 Exploration status: Delaware Mountain Group 0 5 I0 miles
1
.Oil SGa8 BShovoto i l EShow of go$ bPShowof oil ond qor ODry hole

The wells drilled northeast of Big Eddy field in T. 20 S., R. 3 1 E. a r e
Pennsylvanian and JVolfcamp tests . Big Eddy was discovered in dril l ing
a deeper pr imary objective; t he re have been no direct attempts a t
deve!opment, ~Marocn CliEfs was discovered bjr n t es t dril led into the
upper pa r t of the Bone Springs Formation. No attempts a t deve1opmer.t
o r , based an available records , even testing of this pay zone have been
made in the wells dril led to the north. ~ a r a l l e l has two wells producing
f r o m different intervals senarated by over 1,000 feet of section. Since
discovery of the field two wells have been drilled into the Bone Springs
presumably a s t e s t s of these pays, without any reported indications of
petroleum. No development wells have been dri l led in the immediate
vicinity of U. S. , Quahada Ridge, o r Cotton Draw. Three extsnsion wells
have been drilled a t Sand Dunes; the west offset was d ry while two wells
dr i l led to the ncrtl-. h t v e been successful. Further development of this
. f ield i s in progress .
Pe t ro leum in amounts too small for 'commer cia1 development
have been reported for 26 wells. Most of t3ese occurrences were minor
consisting of oil a n d / o r gas cut mud, but were based on d r i l l s t e m tests.
Two wells recovered measurable amounts of 10 and 22 MCF of gas, These
wells a r e iocated in sec. 12, T. 20 S., R 3 4 E., and sec. 36, T. 22 S.,
R. 32 E.
Through October 1973. 173 wells had been dri l led into o r through
tke Delaware Mountain Group below the Ramsey pay zone. Of these t e s t s
ten have been completed a s oi l wells resulting in 400 producing a c r e s

out of a total of 6, 920 acres tested. l 3 i s is a six percent success based
on productivs acreage and four percent success for wildcat exploration.
Only 0. 7 percent of the land area has been tested for a drilling density of
one well for every nine square miles fa: the entire area and one w e l l for
every 13 square miles south of T. 20 S. An exaini-nation of Figure 5 1 shows
six townships where no testa have besn drilled and seven townships with
only one test. The Delaware Mountain Croup has a low incidence of
petroleum occurrence of 21 p e r c ~ n t of the tests drilled, and a per well
yield for the study a rea of only 53,847 barrels.
Based on current statistical data potential yields for an untested
section amount to 51,686 barrels of oil and 19,546 MCF of associated
gas from acreage evaluations, and 34,462 barrels of oil and 13,029 MCF
af associated gas from wildcat success ratios.
Delaware Mountain Group (Rarnsey Pay)
A total of 637 wells have penetrated the Ramsey pay zone in the
Study area. Approximately 358 of these tests have been development
wells in the twenty fields discovered thus far. The Ramsey unlike other
par ts of the stratigraphic section included in this report does not underlie
the entire area. The interval is absent in T. 20 S., in several townships
in the northeastern part of the area , and in the extreme northwest part
of T. 21 S., R 29 E. The horizontal limits of this part of the Delaware
Mountain Group a r e defined by the presence of the buried Capitan reef
and the rapid facies change to carbonates toward the reef in the upper

p a r t of the Bell Cariyon Formation.
The density cf Ramsey exploration drilling is greatest in the
southeastern part of the a r e a along the El Mar, North Mason, Paduca,
Double X, and Tr is te Draw producing trend. The a r e a underlaia by tne
upper pa r t of the EeU Canyon i s approximateiy 1, lo0 square miles for a
drilling density of one well every two square miles. Drilling density in
t!e northwestern part of the a r e a is much less,droppicg t o one well every
nine square miles in the four township Pilot a r e a exclusive of that par t
not underlain by the Ramsey pay zone. The lack of drilling in this a r e a
is m part due to the restr icted potash district. Even with the apparent
dznsity of wells a s shown in Figure 52, only three percent of the a r e a
has been tested on the basis of 40 a c r e s p e r well. The few gas wells
involved a r e included in the 40 -acre designation because most occur
within established oil fields and a r e subject to the standard oil field
spacing pattern.
The northernmost production of oil f r o m the Ramsey in the Study
a r e a i s a t the Cruz field in T. 23 S., R's 32 and 33 E. In the four
township Pilot a r e a there have been seven wells drilled that have had
reported occurrences of petroleum; an incidence of 44 percent compared
with 62 p e r c e ~ t for the Study area. None of these "shows" appears to be
I I
significant.
For the Study a rea 44 percent of the a r e a tested has proven
production and seven percent of the wildcats drilled have resulted in
new field discoveries. Based on statistical evaluations, expectable


recovery from an untested section using productive acreage would be:
472, 350 barrels of oil and 756 ,324 MCF of associated gas. From
wildcat success ratios potential petroleum reserves are: 7 5 , 052 ~ a r r e l s
of oil and 120, 141 MCF of as.sociated gas. %

STATISTICAL OIL AND GAS POTENTIAL
In evaluating the producing potential of the proposed high-level
radioactive waste repository site, past and projected production from
current and abandoned wells and fields was exam-ined in a regional a rea
encompassing approximately 115 townships from T. 20 S., south to the
Texas line, and from R. 22 E., east to the Texas line. Included in this
a rea a r e all of the Delaware basin a s defi:ied by the Capitan reef occurring
in New Mexico, and parts of the Central Basin platform and northwe stern
shelf oi the Permian basin. Site location is within the Delaware basin,
thus oil and gas production from Permizn back-reef sediments a r e not
included in this report. Because of the stratigraphic and structural
variations within the subsurface across the area, petroleum productiou
within a 42 township block primarily within the Delaware basin was
examined separately and is referred to as the Study area. Studies were
made for each well and because of proximity to the site i t is felt that
evaluation figures for this a rea a re more meaningful in projecting the
site potential. It remains necessary, however, to present a broader
spectrum of production analysis because of the limited exploration of
deeper potential pay zones that underlie the Delaware basin.
Petro'eum is produced from rocks of Permian. Pennsylvanian,
Mississippian, Devonian, Silurian. and Ordovician ages in southeastern
New Mexico. Various par ts of this thick sequence of sediments worrants
further subdi-ision and these have been studied separately for production
purposes. Permian rocks a r e subdivided into the Delaware Mountain

Group, Bone Springs Formation and the WoUcamp Formation. Most of
the production from the Delaware Mountain Grou;, is fcund in the upper I
part of this interval in the Ramsey pay zone of thc Bell Canyon Formation. I
The remainder of the Bell Canyon and the Cherry Canyon and Brush Canyon I I I
formations a r e combined for analysis purposes. All fields producing
from the Delaware Mountain Group were examined even thoagh some I I
occur as far north as T. 17 S. Production from the Bone Springs and I
1
WoLfcamp formations, although involving several different stratigraphic i I
! intervals within each unit a re treated aimply as Bone Springs or Wolfcamp
I
I without further subdivision. An analysis of all fields producing from
the Bone Springs is included.
In view of i ts obvious importance in determining potential for I
, i
th is part of the Delaware basin, the Pennsylvanian sequence i s treated I I i
in i ts entirety and also divided into three intervals that a r e readily
traceable within the Study area and reasonably so elsewhere. The
nomenclatural problems of the Pennsylvanian system are discussed
in another part of this report, but i t should be emphasized that the
intervals used have not been examined to the extent necessary to
establish equivalency with the Strawa, Atoka, o r Morrow inteyvals
commonly referred to in the literature, field nomenclature, o r scout
data for southeastern New Mexico. These sources of information indicate
marked divergence in opinion art to what constitutes the formalized
nomenclature for the Pennsylvanian.

Mississippian rocks are subdivided in the subsurface into the
Barnett ,Sale and an underlying unnamed carbonate interval commonly
referred to a s Mississippian lime. There is no production from
Mississippian rocks in the area covered by this report, and the potential
yield per acre has been determined by examination of the few fields
that produce from this interval in southeastern New Mexico. Sediments
of Devonian and Silurian age are combined, Very few wells penetrate
the entire i n t a r ~ l aad separation of the two i s not practical with
available information, Production within the Stcdy area is entirely from
the upper part of the carbonate sequence just beneath the Woodford Shale.
Ordovician rocks underlie all of the Delaware basin and that
part of the narUwestern shelf included in this report, These rocks
like the rest of the Paleozoic section beneath the Wolfcamp interval
a re abrent over part of the Central Basin platform, Ordovician oil
aad gas production ir restricted to the platform and occurs in several
parts of the Montoya, Simpson, and Ellenburger groups, The production
is combined in projecting the petroleum potential for the Ordovician
strata,
The production data used for this section is considered to be
quite accurate, Iaformation was obtained from yearly reports, dating
back to 1946, of the New Mexico Oil and Gas Consl;,gation Grnmiesion.
Reserve projections were made with a computer program furnished by
Thomas Plod, a research metallurgist for the Bureau, The program
involves a least squares, linear regression of data to predict ultimate

recovery. Essentially if; i s similar to a straight-line fit, decline curve.
This i s not as satisfactory a method as volumetric procedures, but thne
was not a ~ i l a b l e to compile all the data needed for this method of reserve I
cs!~rlLations. In rnany cases, however, results should be fairly good
because of increases in allowables since 1965, and in particular in 1969,
followed by removal of allowables in 1972. This has presented an
opror tunity to evaluate production capacities of numerous wells. Data
presented in the tables showing production summaries are conservative,
but by using a large sample should approximate average yields per acre
for each interval. Obviously there are many variables in production
data for oil and gas wells. Allowable3 that were in effect until quite
recently resulted in rather uniform production figures particularly for
some wells., This i s best seen in the well production data for the
Paduca-Delaware field up to the period when secondary recovery operations
began. Often gas wells were shut-in for extended periods of time and
many wells undergo workaver programs in any given year resulting in
a decrease in productioa. Following increase in allowables in the middle
of 1969 there was a s h a q increase in production for one o r tmo years
followed by, in most caaea an abzupt decline. Using the available program,
declines of this type ge~lerally result in low estknates, whereas significant
increases in production within the last two or three years gives an
unreasonably high projecticrn for recoverable reserves. The erratic
nature of production from many *ells i s in general smoothed out in the
field analysis if there are numerous prc2acing wel;s. Fortunately in

most carer declines appear to have developed a reliable pattern over
the past few years and close examination of the producing history of
individual wells and fields aid: in evaluating the reliabi2i;y of projected
reserve8 recoverable under primary production methods. Where
projections were deemed to high for a particular well or field based
oa exsminotton of production data for that well or field, and comparison
with other wells o r f i ~ l d s producing from the same interval, the projected
total primary production was not used in calculating the yield per acre.
hetead production up to Jan. 1, I973 wa.9 used and the result is a
minimum yield figure. Rejections that appeared to be low were
utilized but again result. in a coneervative e.stknate of ultimate primary
yield. An example of what would be considered to be a low estimate of
recoverable oil i s well ELMA29 in ehe El Mar-Delaware field (Table 41).
Production up to the time secondary recovery operations began in th is
field amounted to 90,796 barrels of oil, Production for the three years
preceding secondary recovery was 4,287, 4,901, and 4,115 barrels.
Projecting only an additional 5,959 barrels under primary recovery
does not seem justified after fairly stabIe production under the allowable
program at that time. Where projections are considered high or low
for reasons similar to those explained above a note to this effect is
given in the tables.
Some seeming ipconsistencie s appear in the tables. For the
Bone Springs-Lea field the projected production of 1,008,972 barrels
is less than the actual production 2,080,111 barrels up to January 1,

prior
In this case projected production i s based on wells completed
to 197 0 and involves only eight wells. Nine additional wells
have been completed in that LCield and production from t%ese wells is
not considered in the projection of yield per acre. Assuming that the
per acre yield figures arrived at by averaging all production data for
a specific pay interval a re reliable, additional wells will not change
the potential estimate for a given tract of land or the production from
a particular stratigraphic interval, Reliability naturally is better for
those parts of the geolcgic section fiat have prodlaced the moa t oil -r
gas. Where these figures a re large appreciable changes in production
a r e necessary & order to effect the average yield per acre or per well.
Another problem encountered involved wells that were abandoned after I
secondary recovery begap, The projected production for these wells 1 I
may be higher than the actual production However, these wells may I I
have been converted to injection wells o r have been shut-in a s part of
the secondary recovery program. The potential primary recovery may I
thus in fact have been greater. I
I
In the tables covering projected yields per acre for fields and wells
the second column gives cumulative production up to January 1, 1973 except I .
where secondary recovery operations are involved. In these cases
production i s given up to the year these operations began. The projected
production given in the third column is bassd only on those fields or wells
where i t was possible to establish a fairly reasonable decline o r if the - projection was low. Jn calculating yields per acre, 40 acres was used
-i

for oil wells and 160 acres for gas wells. With the exception of
secondary recovery fields the number of wells given reflects the total
3u.nber of producing wells compltted in the field and the acreage involved
reflects only the wens used in determining Gle projected yields.
Ordovician System
All of the Ordovician fields are locsted on o r adjacent to the
Central Basin platform. Production projections for producing fields
and calculations for abandoned fields were made for 24 oil fields and
t?aree gas fields. Data pertaining to Ordovician fields is given in Tables
2 and 3 and is summarized in Table 1. As for the rest of the geologic *
section, projections of oil and gas yields for the Ordovician a r e considered
low. For oil fields the projections a re considered reasonable for five
fields, high for one field, and low for 11 fields. Gas yields appear
satisfactory for seven projections and low for nine.
The per acre recovery ,of oil ranges from 40 barrels for aa
abandoned one well field to 23,641 barrels a t Fowler-Ellenburger.
The average projected yield for all fields is 5,740 barrels per acre
and production b January 1, 1973 was 5,415 barrels per acre.
Ea&nated distillate recovery is from 123 to 651 barrels per acre and
projected average is 406 barrels. AP adequate projection of gas
yield could not be made for the Custer-Ellenburger gas field but
production from the single well up to January 1, 1973 had already been
81,618 MCF per acre with over 13, 000,000 MCF of gas produced. The

TABLE 1 - Pr~~duction summary: Ordovician System
Does nct Include production under secondary recovery for Teaque and Warren McKee Simpson fields.
L
Ordovician
Gas (MCF)
Associated Gas (MCF)
Study Area Average Yield Projccted
Producing Production Per Acre to Projected Ylcld Acrcs to 1/1\73 1/1/73 Production Per Acre
Rcpio~laI Area Avcragc Y~cld Projcctcd
Producing Production Pcr Acre to Projected Yicld Acres to 1/1/73 1/1/73 Production Pcr Acrc
1,920 49,730.61 1 25,901 62,859,008 32,739
17.800 244,914,313 13,759 258,640,479 14,530
Total Gas (L:'"' I
1 O.I(.,.>
L 'illate (bbls)
Total Oil (bbls)
19,720 294644.924 14,941 32 1.499.487 16,303
17,800 96,388,026 5,415 102,164,913 5,740
1.920 680.10 1 354 779,92 1 406
19,720 97,068,127 4,922 102,944,834 5,220

. ,
TABLE 2 - Fielde: Ordovician-0i 1 Production
- Cum. Prod. Proj. Prod. Prod. Proj. Prod.
~ i e l d / W e l l 1/1/73 t Total Welle Acree per acre Statue- Rerr.arks
Brunson- 24,986,904 25,317,205 148 5920 4,277 P Frojection low Ellenburger
Brunson, Eaet- 18,566 23,695 2 80 296 P Ellenburger
Brimson, East- 128,457 133,162 4 160 8 32 P Projection low McKee
Brunson, South- 412,473 423,877 4 160 2,649 P Projection low Ellenburger
Custer- 61,526 104,211 1 160 651 P Projection high Ellenburger(Caa)
Dollarhide- 4,138,154 4,330,595 Ellenburger
P Projection low
Dublin- 39,460 39,400 2 320 123 A Ellenburger(Gae1
Dublin- - - - - - - No production data Ell enburger
Fowler- 13,625,550 16,075,011 17 680 23,641 P Ellenburger
Fowler- 1,617 1,617 1 40 4 0 A Connell
IIare- 15,023,914 15,225,113 90 3600 4,229 P Projection low Simpson
Hare, South- 192,373 192,373 3 120 1,603 A Simpson


Cum. Prod. Proj . Prod. Prod. Proj . Prod. ~ i e l d / W e l l 1/1/73 t Total Wells Acreo p e r a c r e Status Remarks
Bruneon- 106,775,517 109,018,247 148 5920 18,415 P Ellenburger
Brunson, Eaet - 96,735 '1 10,445 2 80 l,38! ' P X l l e ~ ~ b u r g e r
Brunson, Eaet- . 599,357 759,187 4 160 4,745 P McKee
Bruneon, South- 1,533,382 1,783,092 4 160 11,144 P Projection low Ellenburger
Cary- 1,690,748 1,690,748 3 120 14,090 A Montoya
Custer- 13,058,879 - 1 160 - P Data inadequate Ellenbnrger(Gae)
Dollarhide- 1,918,121 1,931,276 8 320 6,035 P Projection slightly low Ellenburger
Dublin- 162,680 162,680 2 320 508 A ~ l l e n b u r ~ e r ( ~ a e )
Dub1i.n- - .. - - - - No production data
Ellanburger
Fowler - 11,401,049 15,441,899 17 680 22,709 .
Ellenburger
Fowler - 518 5 18 1 40 13 A Connell
Hare- 67,428,358 67,698,098 90 3C d3 18,805 P Projection low Simpson
Hare, South- 96 1,452 Simpson

TABLE 3 - Fields: Ordovician - Gae Production (Cont'd)
Cum. Prod. Proj. Prod. Prod. Proj . Prod. FieldIWell 1/1/73 t Total Wella Acrea pe r a c r e Status Remarks
Juatis- 9,067,517 9,964,357 23 920 10,831 P Ellenburger
Justie-Montoya 4,596,100 5,000,700 14 . 560 8,930 P Projection low
Juetis, North- 767,057 .: 819,867 8 320 2,562 P Projection low Ellenburger
Juatis, North- 1,650,422 1,736,032 11 440 3,950 P Projection low McKee
Justis, North- 481,494 506,584 6 240 - 2,.111 P Projectiotl low Monto ya
Juatie, North- 208,193 208,193 3 120 1,735 A '.'.*addell
Loop 18- 4,709 - Montoya
40 - P Data inadequate
Monument-McKee 36,509.052 49,637,449 9 1440 34,470 P Includes Monument- Ellenburger(Gam) Ellenburger / I
Stat eline- 1,035,454 1,075,584 11 440 2,445 Ellenburger
Teague- 2,533,879 2,533,879 .10 400 6,335 Ellenburger'
Teague- 5,046,855 5,098,695 15 boo 8,498 Silnpeon*
Warren-Connell 107,6'11 107,671 1 40 2,692
P Projection low
P Primary projection low Secondary recovery, 1905
A ' I C i ai
warren-McKee/22,599,761 27,781,981 47 I880 14,778 P Includes Warren, North- Simpeon* M c K e t
- Secondary recovery, 1966 1 8:: Secondary recovery t Except rccondary recovery production P: Producing A: Abandoned I

other two gas fields have yields of 508 MCF at the abandoned Dublin
area and 34,470 1vlCF at Monumect. The range in yield per acre for i i
associated gas is from 13 MCF for an abandoned well to 22,709 MCF a
I
1 for wells in the Fowler-Ellenburger field. 1 --
Average projected per well recovery for the Ordovician is as !
follows: Oi l wells--229,584 barrels of oil and 581,214 MCF of . . 1
associated gas; gas wells--5,238,250 MCF of gas and 64,993 barrels I I
of distillate. Average gravity of crude oil produced from the Ordovician 1
J
i s 43'~. P. L and that of distillate, 5s0k P. L
Silurian/ Devonian Systems
Within the Study area there have been five deaignated Devonian
gar fields, one undesignated gas well, one designated oil field, and one
undesignated oil well. In evaluating the producing potential for the
combined Siluriaa/Devonlan interval, production from 24 fields
(including five single-well fields) and 16 wells were examined. .Including
abandoned fields and wells i t was possible to determiae an average
yield per acre of gas production for 18 fields and 14 wells, and for
oil production, 19 fields and 13 wells. Most of the oil production occurs
on the Central Basin plat€orm while most gas has been discovered in the
Delawars basin area w h e t SiluriadDevoaia rocks are deeply buried.
'fie yield per acre estimate for oil and gas in both the study and
reg i3u l areas, appears to be slightly low (Table 4). The only fields
where estimated per acre yields might appear high are for oil production

in the Fowler-Devonian and South McCormack-Silurian pools (Table 5).
In the case of the Soutb McCormack field this is brought about by
increased production following completion of two wells in 1971. An
analysis of individual wells might, at least in part, help to resolve this
problem. The oely fields with co.nparable oil yields a r e Lea-Devonian
in the Study area, and Dollarhide-Fusselman. Many wells in the Lea
field (Table 6) have yields per acre considerably higher than the field
analysis of 14,943 barrels of the South McCormack field. If the projected
production a t South McCorrnack i s eliminated from consideration the . average projected yield per acre of oil. would be 5,870 barrels compared
with the 6,530 barrels given in Table 4. However, the higher yield figure
must st i l l be considered conservative because no projection8 were made
for two fields where data war inadequate, and projections a r e obviously
low for five other fields.
Within the Study area it was porrible to deterxino distillate yield
for the three wells in the Antelope Ridge-Devonian gas field and oi l for
the nine wells in the ha-Devonian field. Indicated is a range i n distillate
yields of from 710 barrels F*r acre for an abandoned well to 1,594
barrelr for the most productive well in the field. The average production
bared on decline curves for each well is the same a s that for the field
analysis. Oil yields from the L.ea field range from a low of 230 barrels
for an abandoned well to 21,978 barrels per acre. Average pe r acre
yield from well decline curve& suggests 15,833 barrela compared with
the field decline curve of 14,850 barrels. Both estimates appear to be low.

Well analyses were made of gas wells in the Antelope Ridge-
and Bell Lake-Devbnia gas fields and Lea-Devcnian a i l field (Table 8).
The average per ac re yield for Antelope Ridge ranged from 31,714 MCF
for h e abandLned well to 81,283 MCF, The average expected yield
based on field analysis of 56,626 MCF i s essentially the same (Table 7)
a s for the well data average. Average yield for the Bell Lake ficld i s
expected to be 56,127 MCF almost the same as that based on weil
analyses. The estirmted recovery per ac re by well projections for
the Lea field gives an average recovery of 6,468 LMCF of associated
gas compared wi th 7,087 MCF from the field decline curve, The
range in yield per acre for this field is from 300 MCF for the single
abandoned well to 8, 916 MCF for well LEAD08. Can parison of
projected total gas yield per ac r e is higher for the Study a r ea than
for &he region. Although projected yields per ac re for oil and distillate
a r e higher in the Study a rea the average per ac re recovery for all oi l
is lower because of the ratio of gas we111 to oil wells and calculations
based on 40 and 160 ac re spacings.
The average per well production in the Study a rea to January 1,
1973 has been: 6,814,271 MCF of gas and 63,807 barre ls of distillate
for gas wells; and 513,850 barre ls of crude oil and 223,669 MCF of
associated gars for oil wells, Projected, the average recovery per gas
and oil well w i l l amount tD a t leas t 7,545,519 MCF of gas, 65,289
barre ls of distillate, 536,596 bar re l s of oil, and 257,507 MCF of
associated gas. Regionally the projected production per well is:

TABLE 4 - Production summary: Silurian/Dcvonkn Systems
Docs not Include product lo^^ undcr secondary recovery for Dollarhlde-Devo~~bn field
C
Studv Area Average Yield Prolcct td
Roducing Production Per Acm to Projected Yield Acres to 1/1/73 1/1/73 Roducrlon Per Acre
1,440 61,328,439 42,589 67,909,669 47.159
400 2,236,686 5,592 2,575,072 6,438
1,840 63,565,) 25 34,545 70,448,741 38,307
400 5,138,498 12,846 5,365,968 13,415
1,440 574,260 399 587,598 408
1,840 5,112,758 3.105 5,953,366 3,236
1
a Average Yield Projected
Producing Production Per Acre to Projcctcd Yield Acm to 1/1/73 1/1/73 Production* Per Acre
4.000 150,239,388 37,560 161,523,868 41,881
5 ,20 39,551,174 7,606 47,641,070 9,162
9,200 189,790,562 20,629 215,164,938 23,387
5,200 26,685,278 5,132 33,954,975 6,530
4,000 1,194,140 299 1,347,793
9,200 27,879,;. . 3,030 35,302,768 3,837
Silu&n/Dcvonian
C3s (hiCF)
Aaocirted Ga (AICF)
Total Car
(MCF)
Oil (bbls)
Didillate (bbf~)
Total Oil (bbls)

TADLE 5 - Fiolde: Silurian/Dcvonian - Oil Production
Cum. Prod. Proj. Prod. Prod. Proj. Prod. Field/ Well 1/1/73 1 Total Welle Acree per ac re Statue Remarks
Antelope Ridge- 535,581 543,841 3 480 1,133 P Projection low Devonian (Gas)*
Bell Lake- - Devonian (Gas)*
- 2 320 - P No distillate production
Bell Lake, Mid- - Devonian (Cam)*
- 1 160 - A No distillate production
Bell Lake, North- 38,180 43,757 1 160 273 P Devonian (Gae)*
Cline - Devonian 4,577 4,577
Croeby-Devonian 579,273 719,089 (Gag
Cro eby- 16,129 - Fus uelman
P Data inadrquate
P Secondary recovery, 1962
Dollarhide- 4,487,356 4,929,532 Fueselman
P Projection does not include 197 1 - 7 2 production
Dublin- 47,145 47,145 Devonian
P Projection may be high Fowler- . 990,332 1,832,570 Devonian
Fowler- 586,935 586,935 Fues elman

TABLE 5 - Fields: Silurian/Devonian - Oil Production (con't)
Cum. Prod. Proj. Prod. Prod. Proj. Prod. Field/ Well 1/1/73 Total Wells Acres per acre Status Remarks
Fowler - 48,481 48,481 2 8 0 6 06 A - Upper Silurain
Justie- 8,020,822 10,003,922 3 1 1240 8,086 P Fusaelman
Justie, North- 400,47 1 365,246 11 440 830 P Projection does not include Devonian 1471-72 production.
Prc~jection low
Justie, North- 2,247,554. 2,394,809 15 6 00 3,991 P Projection low Fue e elman
Lea-Devonian* 5,118,494 5,345,964 9 360 14,850 P Projection low
Mc Cormack- 778,694 910,660 3 120 7,589 P Silurain "
M c Cormack, 749,490 4,183,913 7 280 14,943 P Projection m a y be high South- Silurain
Monument Draw- 8,393 8,393 1 4 0 210 A Devonian
Oaudo - 49,607 - 2 320 - P Data inadequate Devonian (Cae )
499 499 1 160 3 P Paduca- Devonian (Gas)*
Teague - Devonian 499,153 51 1,647 5 ' 200 2,558 P
Warren-Devonian 79,940 - 2 80 - P Data inadequate
UNDES 1 (Gas) - - - 1 '160 - A No distillate production g 1 5 00
4 UNDES 2 20,004 20,004 40 . A
*Stitdy area fields **Secondary recovery +Except Dollarhide production under secondary recovery P: Producing A: Abandoned

. . - -. A: - , . . 2 . *.
TAULE 6 - Wclle: Silurian/Devonian (Study Area) - Oil Production
Cum. Prod. Proj. Prod. Proj. Prod. ~ i e l d / well 1 / 1/73 Total Acree per acre Status Remarlce
ANRI 01 (Gas)
ANRI 02 (Gas)
ANRI 03 (Gae)
LEAD 0 1
LEAD 02
LEAD 0 3
LEAD 04
LEAD 05
A
P Projection low
P Projection probably low
P
P
P
P Projection low
P
LEAD 06 628,522 875,102 40 2 1,878 P Projection niay be elightly high
LEAD 07 582,2 12 6 19,058 40 15,476 P
LEAD 08 761,567 783,438 40 :9,586 P
P: Producing
A: Abandoned

. . TABLE 7 - Fields: Silurian/Devonian - Gas P I Juction
Cum. Prod. Proj. Prod. Prod. Proj. Prod. ~ i e l d / W e l l 1/1/73 1. Total Wells Acres per acre Status Remarks
Antelope Ridge-24,433,274 27, 180,704 3 480 ' 56,626 P Devonian(Gas)*
Bell Lake- 17,519,183 17,960,553 2 320 56,127 P Projection low Devonian(Ca s):b
Bell Lake, Mid- 745,986 Devonian(Gas)+
Bell Lake, North-17,724,380 20,726,100 1 160 129,538 P Devonian(Ga8 )* I
Cline - - - Devonian
1 40 ,. - A No gas production I Crosby- 88,181,084 99, 275,044 14 2240 44,319 P
Devonian(Gae1
Croeby- 229,350 - 1 40 Fus aelman
P Data inadequate i Dollarhide- 10,919,764 11,419,844 18 720 15.86 P Secondary recovery, 1962
Devonian ** Primary projection low I Dollarhide- 3,491,324 3,549,174 11 440 8,066 P Project ion low Fus a elman I
Dublin- 73,276 73,276 2 80 9 16 A Devonian
Fowler- 5,167,910 6,973,530 5 200 34,868 P ilevonian
Fowler- 393,709 393,709 5 200 1,969 A Fuss elrnan
Fowler - 21 1,900 211,900 2 8 0 2,649 P Upper Silurian

.. .-. - 4 'I'ABLE 7 - E'iclde: Silurian/Devonian - Gas Produclion (CorlL1d)
Cum. Prod. Pro j . Prod. Prod. Pro j . Prod. Field /W el l 1 / 1 / 7 3 t ' Total Welltt A c r e s pe r a c r e Statue Remarks
Jua t i s - 8,764,949 12, 871,119 3 1 1240 10.380 P Fua selman
Juetis, North- 1,716,502 - 11 440 - P Data inadequate Devonian
Juati8n Narth- 2,240,410 3,019,370 Fue se lman
Lea- Devonian*
2,213,104 2,551,490
McCormack- 2,545,295 3,040,005 3 120 25,333 P Silurian
P Project ion low
McCorlnack. 851,484 - South- Silurian
Monument Draw- 1, 046 1,046 1 40 26 Devonian
P Data inadequate
0 eudo - 729,865 - 2 320 - P Data inadequate Devonian(Ga8)
Paduca- 900.618 1,291,328 1 160 8,671 P Project ion probably low Devonian(Gae)*
Teague- 601,673 609,733 5 200 3,049 P Devonian
I
Warren- 105,896 - 2 80 - P Data inadequate Devonian
UNDES l(Gaa) 4,998 4,998 1 160 3 1 A . . . C
UNDES 2 23,582 23,582 1 40 590 A cn ! * Study a r e a fields ** Secondary recovery t Except Dollarhide production under eeconda ry recoverv ! P: Producing A: Abandoned I

TABLE 8 - Wells: . Silurian/Devonian (Study Area) - Gas Production
- Cum. Prod. Proj. Prod. Proj. Prod.
Field/ Well 1/1/73 Total Acre8 per acre Status Remarks
ANRI 01 (Gas)
ANRI 02 (Gas)
ANRI 03 (Gas)
RLLK 01 (Gae!
BLLK 03 (Gas)
LEAD 0 1
LEAD 02
LEAD 03
LEAD 04
LEAD 05
LEAD 06
LEAD 07
LEAD 08
LEAD 09
Prcjection low
Projection high; not used
1 rejection low i !
P: Produciqg A: Abandoned

------ 8 -- YLY.-- I em "a* ---. Y--CLL --.a# Y c . ~ Y a . A U I I ILIbUU)( 4 - L I C ; C . I ! I I
Producing Initial Field Discovery Well Location I~ . tc rva l PotentialIDay Gravity Prcssure -
I I
Antelope Ridge- Shell 1 . Devonian (Gas) H a r f i s
Dcll Lake Conoco , lA Devonian (Gas) Bell Lako
Bcll Lake, Mid- Conoco 10 Devonian (Gas) Bell Lake
Bcll Lake, North- Conoco 6 Devonian (Cae) Bell Lake
41,000 MCF GOR:43,041:1 56O T:4503
15,500 MCF COR: 14,820: 1 - T:5 113
3200 MCF - -
30,500 MCF GOR: 197,250: 1 53O T:5015
516 bbls Lea- De vonian Ohio 1 Lea L12-20s-34E 14,337- 14,489 GOR:32 1: 1 5 ~ “ T: 1570
Paduca-Devonian Texaco 64 (Ga 8 1 Cotton Draw G18-25s-32E 16,218-16,537 90,000 MCF - -
American Trading 210 bbla Undesignated 1 State ' 526- 20s-35E 14,560- 14,644 GOR: 1570: 1 53O -
P a n Am 36 Undeeignated Poker Lake P28-24s-31E 16,526-16,660 42,701 MCF - FSLP:7293

oil - 261,192 ba r re l s ; distil late--53,912 barre ls ; natural gas--6,700, 956
MCF; and associated gas--366,470 MCF.
Producing depths, initial potential, oil gravity, and p r e s s u r e
are given in Table 9 for discovery wells of Sflurian/Devonian fields in
the Study area. Producing depths range f rom 14, 337 to 16,660 feet with
average net pay thickness of 160 feet. The reported initial potential of
g a s wells ranges f r o m 15,500 to 99, 000 MCF fo r an average I. P. of
36,472 MCF. Production up to January 1, 1973 for gas wells in the
Study area shows a low yield of 4,998 MCF for an abandoned undesignated
weU to a h o s t 18,000,000 MCF for the single well producing i n the Nor th
Bell Lake field. Initial potential for o i l wells ranges f rom 71 to 1, 165
b a r r e l s of oil p e r day and an average I. P. of 541 barrels . Production
range has been f r o m 9,207 to 842,637. b a r r e l s f o r wells in the Lea field.
Based on data f r o m 12 wells the average gravity of oil and dist i l la te i s
56O A. P. L with a range f r o m 48 to 59O. The only shut-in s r e s s u r e
data available was 7 : 293 ps i fo r the Poker Lake well. Average tubing
p r e s s u r e fo r 'wells is 4,877 psi.
Mississippian System
Rocks of Mississippian age include an upper shaley interval cal led
the Barnett Shale, and a lower carbonate sequence refer red to simply
as Mississippian o r Mlssissrppian lime. Pe t ro leum occur's in the lower
carbonate sequence, but the re i s no oi l o r gas being produced within t h e
a r e a studied for th is report. Only six designated fields ex i s t in southeastern
New Mexico (Tables 11 and 13) and four of these have been abandoned.

The nearest production is a t the Austin-Mississippian gas field located
in sec. 17, T. 14 S., R. 36 E. Production data for the Mississippian
i s presented in Table 10 for completeness, although it cannot be
considered relevant to the area examined in this report.
Of the nine wells completed seven have been abandoned leaving
one well in the Austin gas field and one a t the Bronco field. An analysis
of the four wells that have produced at Bronco i s given in Tables 12 and
14. This indicates a per a c r e oil recovery of f rom 4 to 9, 844 barrels. I
: Up to January 1, 1973 the remaining producing well had recovered 5,804
1
I bar re l s per a c r e and the projected recovery of 9,844 barre ls would ' i appear to be high. Overall the projected recovery based. on well interpretation,
including the abandoned wells, is 3,6 13 barrels per a c r e for the Bronco I
I
I
field. The field analysis indicates a recovery of 2,669 barrels per acrr. 1 - I
I
and appears t o be a more reasonable estimate of total primary recovery.
Associated gas production a t the Bronco field based on well analysis
indicate# a recovery of 2,221 MCF per acre; approximately the same as
that for the field analysis. Up to January 1, 1973 production had already
amounted to 2,188 MCF. It might appear therefore that the projection
is low except for the marked decline in gas production s i n c ~ 1969. Gas
production at the Austin field has been erratic since 1969 and the estimate
of future potential from the single wel; in this field, a s far a s distillate
production is concerned, appears to be low. The estimated gas yield is
3,838,565 MCF for a recovery of 23,991 MCF per acre.
P e r well recovery averages a r e 62,013 barrels of crude oil and

TABLE 10 - Production summary: Mirriuipplm System
Southeastern Ncw Irlcxico Average Yicld Projcctcd
Producing Production Per Acre to Projectcd Yield Acres to 1/1/73 1/1/73 Production Per Acre
320 3,057,297 9,554 3.844.957 12,015
280 354,037 1,264 357,801 1.278
600 3,411,334 5.686 4,202.758 7.005
280 423,582 1,513 431,019 1,550
320 50,403 158 50,611
600 473,985 790 484,640 808
L
lntcwnl
Mississippian
Gas (AlCF)
Associ;fcd Gas (hlCF)
Told Gar (LICF)
Oil (bbb)
Distillate (bbls)
Total OU (bbls)
Study Arca Average Yield Projected
Producing Production Per Acre to Projected Yield Acrcr 10 1/1/73 1/1/73 Production Per Acre

Cum. Frod. Proj . Prod. Prod. Pro j . Prod. F ie ld / W e l l 1/1/73 Total Wells Acres p e r a c r e Statue Rcmarko
Austin (Gae) 49,579 49,797 1 160 3 11 P
Bronco 416,524 426,961 4 160 2,669 P
Croseroade 1,631 1,631 1 4 0 4 1 A
Denton 5,371 5,371 1 40 134 A
Lone 56 56 1 40 1 A
White Ranch (Gas) 824 824 1 160 5 A
P: Producing A: Abandoned

N W I *
U U U

TADLE 13 - Ficlds: Miueieeippian - Gae Production
Cum. Prod. Pro j. Prod. Prod. Proj. Prod. - Field/Well 1/1/73 Total Welle Acres per acre Status Remarks
Austin (Gas) 3,050,905 3,838,565 1 160 23,991 P
Bronco 350,024 J53,788 4 160 2,211 P
Crossroads 9 84 984 1 4 0 2 5 A
Lone 1,632 1,632 1 4 0 4 1 A
White Ranch (Gae) 6,392 6,392 1 160 40 A
P: Producing A: Abandoned

TABLE 14 - Welle: Mieeieeippian - Gae Production
Cum. Prod. Proj. Prod. Proj. Prod. Field/ Well 1 / 1 /73 To ta 1 Acree per acre Statue Remarke
BRONC 1 86,388 86,388 40 2,160 A
BRONC 4 173 173 40 4 .
P: Producing A: Abandoned

', 922,479 MCF of gas and 25, 3 11 bar re l s of distillate. Average gravity I of crude oil i s 43O A. P. I.
I Penns ylvznian System
i I
Data giving oil and gas yields per acre for the Pennsylvanian a r e I ,
given in Table 15. Because production f rom Pennsylvanian-age rocks is . I I
! primarily gas, production has been quite errat ic, and there a r e many j recent discoveries, some additional evaluations a r e presented. 1
I I
In determining the production potential of the Pennsylvanian, j I i
studie
wells,
s were made cf 79 fields, 32 of them in the. Study area, and 36
from multi-well fields all in the Study area. A breakdown of
the fields shows that 22, involving 62 wells,have been akandoned, no
production data was available for five recently discovered fields, i t
was impossible to project gas yields for 24 fields and oil for 14 fields,
and there were 15 fields without reported distillate production. In
Table 25 all fields a r e considered in arriving at the average yield per
acre. Thus even though there is no distillate production from a particular
field the productive acreage involved in that field is used in calculating
the overall yield of distillate for the Pennsylvanian, Based on tke
catezories listed above it is possible to show a range in potential recovery I
per acre. For natural gas the range for the region is from 4,747 MCF
per ac r e for abandoned fields to 56,690 MCF for fields where yitlds I
could be projected. For distillate the range i s from 27 barrels for recent

discoveries to 460 barre ls for projected yields. By combining data for
abandoned fields, fields where it was not possible to project yields,
and projected yields, most Pennsylvanian fields a r e considered and a
more realistic figure for average yield can be determined, although still
considered to be a conservative estimate. The combined data gives a
recovery figcre of 44,997 MCF per ac re for gas and 375 bar re l s fo r
distillate. The potential yield is therefore increased substantially f rom
that given in Table 15 where recent discoveries and dry gas fields a r e
included in the calculations.
Production average for a Pennsylvanian well i s 3,387,486 MCF
of gas recovered up to January 1, 1973. On a projected basis the per
well recovery amounts to 5,689,028 MCF. 9y eliminating the 54 recently
completed wells with an average production of 793,965 MCF the projected
recovery p e r well is 7, 199,503 MCF. Projected distillate recovery,
based on 160 wells, is 60,009 bar re l s per well when recently completed
wells and the 18 wells without distillate production a r e not considered.
Projected yields per ac r e for fields and wells a r e given in Tables
16 to 19. The range in gas yields j.8 f rom 52 MCF per ac re for the
abandoned Dark Canyon-Pennsylvanian field to 1C2,610 MCF for the
projected yield in the Indian Basin-Upper Pennsylvanian field. Six fields
exceed the average per ac re yield of 35,556 MCF. These a r e Antelope
Ridge-Atoka, Antelope Ridge-Morrow, Los Medanos -Atoka, Paduca-Morrow,
Sand Dune-Atoka, and Indian Basin-Upper Pennsylvanian. Five of these
high yield gas fields a r e in the Study a r ea and have an average projected

yield per ac re of 67,150 MCF and per well of 10,743,955 MCF.
In evaluating gas and dis t i lk te production f rom the Pennsylvanian I
similar analyses were made for the Study area. The projected yield
per ac re for al l gas fields is 20, 130 MCF, considerably lower than for
the regional area, Recovery range is f rom 1,336 MCF per ac re for
seven recently completed wells to 51, 750 MCF for fields where yields
were projected, Distillate yields a r e slightly higher than for the region ! !
and excluding recent discoveries and wells with no distillate production I
i averages 359 barre ls per acre. 1
I
Oil production from the Pennsylvanian for the regional a rea is
fo r the most par t insignificant (Table 16). Only two fields have yields
in excess of 1,000 bar re l s per acre. These a r e the Big Eddy-Strawn
field with estimated recovery of 7,599 barre ls and the Case-Pennsylvanian
field with 11,488 barrels. The Big Eddy field is in the Study area. The
only appreciable gas produced with oil is at Big Eddy with a projected
yield of 44,764 MCF t,er acre. Associated gas recovered with oil is l ess
than 10,000 MCF per ac r e for most fields, but the average is 15, 411
sMCF for the region-and 30,986 MCF for the Study area.
Analyses were made of oil and gas production in the Study area
of wells in the Bell Lake-Pennsylvanian, Lea-Pennsylvanian, Paduca-
sMorrow, South Salt Lake-Atoka, and South Salt LakerMorrow gas fields,
and the Big Eddy-Strawn field (Tables 17 and 29). Eased on three
wells with production data in the Bell Lakt ':_" the projected yield per
a c r e i s 10,374 MCF of gas; about 2,000 MCF lower than the pr~jectced

recovery for the fields. Seven of the 15 wells in the Lea 5 e l d have been
abandoned; for the remaining eight it was possible to project potential
recovery. The estimated recovery based on wells i s 12,406 MCF
compared with 13,750 MCF for the field projection. Pe r well recovery
by well analysis i s 1,955,004 MCF and by field analysis 2, 199,956 MCF.
Projections for the three wells in the Paduca-Morrow field give an estimated
~ recovery of 64,734 MCF per acre, slightly more than the field projection
I of 61,613 MCF. One well in this field had produced 22,885,062 MCF
I
of gas up t o January 1, 1973 with initial productior? reported in 1967. It
I is estimated that recovery f rom this well will be 26,008,222 MCF. The
average yield per well for the Paduca field i s 10,357,451 MCF. Production . estimates based on well analyses for the other fields is approximately
the same a s that obtained by field projections. The average yield per
well for the four wells involved in these fields is 2,885,720 AMCF.
Distillate production based on well analyses of 21 wells with I
production data indicates an average yield per well of 56,011 bar re l s
compared with the average, based on field projection,, of 48, 174 bar re l s
I , for all wells in the Study area. The four wells with oil prodaction in the
i Big Eddy oil field includes one well recolnpleted to the Morrow, one I
apparently almost depleted well, and one for which the projectioz i s I
obviously low. Based on well analyses the recovery from current wells
and the abandoned well amounts to 8,408 barre ls per ac re compared with I
! the field projection of 7,599 barrels. P e r well recovery for this field
I averages 336,337 barre ls by well analysis, and 303,976 bar re l s from the
1 , field analysis.
I

TAULC 15 - Production sulnn:ory: PcnnsylvanIgn Systcm
+ 1371-1972 p r production from White City field not used in projected recovery calculations.
rvnl
Pcnnsylvanirn
Gas (XICF)
Associ~tcd Gas (MCF)
Told Ges ( L I C F )
Oil (bbls)
Distilhtc
Studv Arca Avcragc Yicld Projcctcd
Producing Production Per Acre to Projected Yicld Acrcs to 1/1/73 1/1/73 Production Pcr Acre
8.800 160,919,573 18,286 177,146.1 13 20,130
110 6,953,294 28,972 7,436,664 30,986
9,040 167,872,861 18,570 184,582,777 20.418
240 1 ,196,466 4,985 1,249,118 5,205
Reaional Area (includes study arca) Avcragc Yicld Projcctcd
Producing 'Production Per Acrc to Prajcctcd Yicld Acres to 1/1/73 1/1/73 Production* Pcr Acre
36.640 775,734,343 21,172 1,302,787,263 35.556
640 9,365,926 14,614 9,863,296 i 5.4 I I
37,280 785,100,263 21,060 1,312,650,559 3511 1
640 3,968,2 15 6,200 4,020,867 62P J
(b bls) 8,640 2,120,292 245 2,601,396 301
To131 Oil (bbls) 8.880 3,316,758 374 3,850,135 434
36,480 7,330,795 20 1 9,82 1,232
37,120 11,299,010 304 13,84 1,720 373

TABLE 16 - Fields: Pennsylvanian-Oil Production
Cum. Prod. Proj. Prod. Prod. Proj. Prod. Field/Well 1 /1/73 Total Welle Acree per a c r e Statue Remarke
Antelope Ridge- 177,434 177,434 1 . 160 1109 Atoka (Cae):*
Antelope Ridge- 240,260 499,861 2 320 1562 Morrow (Gas)*
Arena Roja- 4,606 4,617 1 160 2 9 Penn (Gas)
Avalon, Mid- - - - . - Morrow (Cae)
Bandana Point- - - 1 -160 Penn (Gas)
A
P
P
- No production data
A No dietillate production -
Bell Lake- 17,343 17,343 3 480 36 P NO distillate production Penn (Gas)* since 1965 1
Berry-1.4orrow 11,915 11,915 1 160 74 A (Gas)*
Big Eddy- 1,163,629 1,215,902 4 160 7594 P Frojection low Strawn*
Black River- - - - 1 . 160 - P No distillata production
Penn (Gas) I i
Carlsbad, South- - Atoka (Gas)
- 3 480 - P No distillate production
Carlsbad, South- 14,883 - 2 0 3200 - P Data inadequate Marrow (Gas)
Carlsbad, S ~ u t h 176,629 - 5 800 - P Data inadequate .
Strawn (Gae) • - 1 01 UI
I

- Cu. Prod. Proj. Prod. Prod. Proj. Prod.
FicldlW ell 1/1/73 Total W e l e Acres p e r 3 c r e Statue P.emarke Carlebad-Permol 6,999 - 1 160 - P Data lnadeauate Penn (Gas)
Case-Penn 2,757,112 2,757,112 6 243 11,488 P Projection low i I
Caaa Ranch 300 300 1 160 Morrow (Gas)
Catclaw Draw- 4,071 - 9 1440 - P Data inadequate ? Morrow (gas) ,
Catclaw Draw- 1, 407 - 1 160 - P Data inadequate Strawn (Gas)
Catclaw DrLu-- - East-Strawn
Cedar Canyon- - Morrow (Gae)*
- - - - - No production data
- 1 160 - P NO dietillate production
Cedar Hills- 19,406 19,651 1 160 123 P Projection low Upper Penn(Gas) i
Cemetary- 296 296 2 320 0.9 1' Minor production I I
Morrow(Gas)
Cinta Roja- 31,687 - 1 160 - P - Data inadequate Morrow(Ga8)
Crawfo rd- - - 2 . 320 - P No distillate production Penn (Cae)
Daggar Draw- - Atoka (Gas)
- 1 160 - A No distillate production
! Daggar Draw- 2,378 2,433 1 160 15 P Projection slightly low
Morrow (Gas) 0' QI
e
I
_-- ___ .-. . . .,_-.- ---- .-. - ----- - _ __.-- - ------ ------ ...-. j L- . - L . .

Cum. P r o d . Proj . Prod. Prod. P ro j . Prod. Field /Well 1. 1.73 - Total Welle Acre. p e r a c r e Statue Remarks
Daggar Draw- 33,715 12,113 4 80 303 P New wells completed in Upper Penn 1971. No production
f r o m 1968- 1971
Daggar Draw- 25 1 251 1 160 1.6 p No dietil late production Strawn(Gae) af te r 1971
Dark Canycn- - Penn(Gae)
Dos Hermanoe 34,136 Morrow(Gae)*
Fenton Draw- Strawn
Getty-Morrow 1,964 (Gas)
Golden Eagle- 1,582 Morrow(Gae)
Golden Lane- 6,637 Morrow(Cae)*
- 1 160 - A No distil late production
- 1 160 - P Data inadequate -
Golden Lane- 228,959 225,012 3 320 703 P Strawn(Cas)*
Grama Ridge- 82,340 84,750 5 800 106 Morrow(Ga8) *
Hackberry, South- 23,936 - 1 40 - Strawn *
a
Hackberry Hills- 62,119 80,229 1 160 50 1 Canyon(Ga8)
Hackberry Hills, 2,432 2,651 . 1 160 17 Eas t Canyon(Ca8)
Data inadequate
Does nJt include 1972 production; New well
Project ion low
Data inadequate

Cum. Prod. Proj. Prod. Prod. Yroj. Prod. Field/Well - 1/1/73 Total Wella Acree pcr a c r e Status Rcmarlcs
No distillatc produclion I
Data inadequate
No distillate production
No production data
Data inadequate
Hat Meaa- 1,054 Morrow(Gaa) *
Indian Baain- - Atoka (Gas)
Indian Baain- 98,435 Morrow(Ga8)
Indian Basin- 3,716,440 Upper Penn (Goe)
Indian Hills, North- 2,205 Morrow(Gas)
Indian Hills- - Upper Penn(Ga8)
iJo production data
Projection low
Projection low
Jal. Weet-Strawn 152,072 (Ga
Lea-Penn 927,151 (Cae) *
Loe Medanos- 149,151 Atoka (Ga s )*
Projectian slightly high
Lusk, Weet- 8,901 Etrawn *
Lyach- Penn 27,925 (Gau) *

TABLE 16 - ~ i e l d s : Penneylvanian-Oil Production (Contld) I
- Cum. Prod. Proj. Prod. Prod. Proj. Prod.
Field /W ell 1/1/73 Total Welle Acree per ac re Status Remarks
Maroon Cliffo- 7,281 - 1 160 - P Data inadequate Morrow(Gas)*
M c M i l l a ~ ~ ~ 40,897 41,172 5 800 5 1 P Projection low Morrow(Gas)
Oeudo-Strawn 2,477 2,477 1 40 62 A
Oe-160, North- 155,780 161,226 5 800 202 P Projection low Morrow(Gae)
Oeudo, South- r 134,964 137,930 2 320 43 1 P Projection low Mor row(Gae)
Oeudo, West- 2,397 12,532 1 160 78 P Projection probably high Morrow(Gae)*
Paduca-Morrow 71 5 71 5 3 489 1 P (Gas)*
Pokcr Lake- - - 1 160 - A NO distillate production Morrow(Gae)*
Red Hille-Penn 146 146 1 160 0 . 9 A (Gae) *
Rock Tank- 9,297 - 5 800 - P Data inadequate Lower Morrow(Gas)
Rock Tank- 950 975 2 320 3 P Upper Morrow(Gae)
Salt Lake, South- 116,573 100,237 2 3 20 313 P Atoka (Gas)*
Salt Lake, South- 83,198 Mc,rrow(Gas)*
P Projection slightly low 9 ;I

Cum. Prod. Proj , Prod. -Prod. Proj. Prod. FieldJWell 1/1/73 Total Wells Acres pe r ac re Status Remarks
Sand Dunce - - - 1 160 - P No distillate production Atoka(Gas )* i
Sand Dunes- - Lower Penn (Gas) *
- 1 160 - P I
No distillate production I
Sand Dunce - - - - - - - No production data Morrow(Gas)* 1
Sand Dunes, South- - Lower Pen~.(Gas)*
Sand Dunes, West- - Atoka(Gas)*
P No distillate production
- 1 160 - P No distillate production
Scanlon- Strawn 3,072 3,072 1 160 19 . A (Gas)
-en Rivers Hills- 5 5 55 1 160 0.3 A Morrow(Gae)
Springs 4Upper 539,964 557,675 4 640 871 P Projection low Penn(Gas)
Teas-Penn 13,471 13,755 1 160 8 6 P Projection slightly low (Gas)*
Tower Hill- 1,455 1,455 1 160 Morrow(Gae)*
Washington Ranch- 873 Morrow (Gas)
1760 - P Data inadequate
Welc h-Peon(Gas) - - 1 160 - A No distillate production 0
4

TABLE 16 - Fields: Penneylvanian-Oil Production (Cont'd)
Cum. Prod. Proj. Prod. Prod. Proj. P-ad. Field/Well - 1/1/73 Total Wells Acres per a c r e Statue Remarks
White City- 24,439 26,29 1 3 480 5 5 P Projection may be low Penn(Ga8 )
Wilson-Penn 46,759 49,920 1 160 312 P (Gae) *
Wileon, South- 2,977 2,977 1 160 19 A Fenn(Gas) *
*Study a rea fields P: Producing A: Abandoned

r nuLL 1'1 - Wells: Pennsylvanian (Study Arca) Oil Production
Cum. Prod. Proj. Prod. Proj. Prod. Field /Well 11 1/73 Total Acres per acre Status Remarks
BELP 01 (Gas) - - 160 - P No distillate production
BELP 02 (Gas) - - 160 - - No production data
BELP 03 (Gas)
BELP 04 (Gas)
B E I S 05 (Gaa)
BEST 01
BEST 02
BEST 0 3
BEST 04
BEST 05
LEAP 01 (Gae)
LEAP 02 (Gas)
LEAP 0 3 (Gae)
LEAP 04 (Cae)
LEAP 05 (Gae)
LEAP 06 (Gas)
LEAP 07 (Gas)
LEAP 08 (Gas)
LEAP 09 (Gas) 10,288 10,288 160
LEAP 10 (Gas) 16,574 16,574 1 6 0
A
P No distillate production
- No production data
A
P Projection low
- No production data
P
P Almost depleted
Projection low
Projection low
Projection slightly low

TABLE 17 - Wells: Pennsylvanian (Study Area) Oil Production(Conttd)
Cum. Prod. Proj. Prod. Proj. Prod. ~ i e l d / W e l l 1/1/73 Total Acres pe r a c r e Statue Remarke
LEAP 11 (Gas) 22,439 22,439 160 I40 A
- L E A P 12 (Gae) 110,585 120,526 l 60 753 P Projection low
LEAP 13 (Gae) 7,076 7,192 160 4 5 P Projection slightly low
LEAP 14 (Gas) 22,062 22,064 160 138 P Projection low
LEAP 15 (Gas) 20, T36 20,587 160 129 P Projection low
PAMR 01 (Gas) - - 160 - P No dietillate production
PAMR 02 (Gae)
PAMR 03 (Gas)
SLSA 01 (Gas)
SLSA 02 iGae)
SJSM 01 (Gas)
SLShi 02 (Gas)
UNDG 01 (Gae )
UNDG 02 (Gae)
UNDG 03 (Gas)
UNDG 04
No distillate production
Projection probably high
Projection low
No distillate production
NO production data
No productiorl data
P: Producing
A: Abandoned

Cunl. Prod. Proj. Prod. Prod. l'roj. Prod. Ficld/Wcll 1/1/73 Total Welle Acree pe r a c r e t Statue Rernarlcs
Antelope Ridge- 9,373,215 9,373,215 1 160 50,583 A Atoka (Gae)*
Antelope.Ridge- 24,505,325 - 2 3 20 (76,579) P Data inadequate Morrow (Gas)*
Arena Roja- 966,908 1,169,868 1 160 7,312 P Penn (Ciaa)
Avalon, Mid- - Morrcw (G*)
No production data I Bandana Point - 23,817 23,817 1 160 149 A Penn (Gas)
Bell Lake- 5,434,538 5,963, Y 18 3 480 12,425 P Project ion slightly low Pen >(Gas)*
Berry-Morrow 267,074 267,074 1 160 1,669 A (Gas)*
Big Eddy- 6,678,946 7,162,316 4 160 44,764 P Projection low Strawn*
Black River- Penn(Gas) P Data inadequate
Carlsbad, South- 2,332,651 3,232,591 3 480 6,735 P Atoka(Gae)
Carlebad, South- 19,027,302 - 20 3200 (5946) P Data inadequate Morrow (Gae)
Carlsbad, South- 6,233,809 - 5 803 (7792) P Data inadequate I Strawn (Gars) t-
4 C
Carlsbad, P e r m 0 1 109,165 - 1 160 (692) P Data inadequate Penn (Gas)

TABLE 18 - Fielde: Penneylvanian-Gae Production (Cont'd)
Cum. Prod. Proj. Prod. Prod. Proj . Prod. F.eld/Well - 1 /1/73 Total Welle Acree per a c r e +- Statue Remarks i Caee- 2,396,672 2,410,672 6 240 10,044 P Projection low
Penn
Caee Ranch- 234,087 234,087 1 160 1,463 A Morrow(Gae)
Cetclaw Draw- 5,16 1,244 - 9 1440 (3584) F' Data inadequate Morrow(Cae)
Catclaw Draw- 44,515 - 1 160 (278 ) P Data inadequate Strawn(Gae)
Catclaw Draw, - East-Strawn
- No production data i I
Cedar Canyon- 149,570 - 1 160 (935) P Data inadequate Morrow(Gan)*
Cedar Hills- 344,09 1 370,981 1 160 2,319 P Projection low Upper Penn(Gas)
Cemetary- 1,413,997 I, 537,537 2 320 4,805 P Projection slightly low Morrow(Gae)
Cinta Roja- 5,352,119 - 1 160 (33,45 1) P Data inadequate Morrow(Ca8)
Crawford- 8,881,630 10,261,370 2 3 20 32,067 P Pcnn(Gas)
Daggar Draw- 101,177 101,177 1 160 632 A Atoka (Gas)
Daggar Draw- 1, 906,128 2,015,838 1 160 12,599 P Projection probably low Morrcjw(Gae) 4
ul
Daggar Draw- 10,107 10,107 4 8 0 126 P New wells completed in Upper Penn 1971. No gas production
f rom new wells. I

.,."A! 2 . - T A U L E 18 - Ficlds: Pcnneylvanian-Gao Productio~l (Cont'd)
CUIII. Procl. l'roj. Prod. Prod. Proj, Prod. Ficld/Well 1/1/73 Total Wells Acres pcr acrc t Status R e n ~ a r k s
Daggar Draw- 85,192 85,442 1 160 534 P Probably nearly ~ e p l e t e d : Strawn(Ga6) I
Dark Canyon- 8,250 8,250 1 160 5 2 A Penn(Gaa j
Doe Hermanos- 4,666,629 - 1 160 (29,166) P Data inadequate Morrow(Gar)*
Fenton Draw- 3 50 3 50 1 40 9 A Strawn
Cetty-Morrow 536,028 536,028 1 160 3,350 A (Gael
Golden Eagle- 2,620,941 2,620,941 1 160 16,381 A Morrow(Cae)
Golden Lane- 172,482 - 1 160 (1378) P Data inadequate hdorrow(Sae)*
Golden Lane- 3,751,794 9,178,364 3 480 19,122 P Projection high Strawn(Ga8 )*
Grama Ridge- 18,464,154 18,915,754 5 800 23,645 P Project ion low Morrow(Cas)*
Hackberry, South- 235,600 - 1 40 - P Data inadequate Strawn*
Hackberry Hills- 2,305, blZ - 1 160 (14,411) P Bata inadequate Canyon(Gas )
Hackberry Hills, 312,453 342,763 1 160 2,142 P Project ion low Eas t Canyon(Gas)

TABLE 18 - Fields: Pennsylvanian-Gae Production (Cont'd)
- Cum. Prod. Proj. Prod. Prod. Pro!. Prod.
Field/Well 1 /1/73 Total Welle Acres :\..r.:-.f A - S t a t u ~ Remarks
Harkey Penn 78,544 78,544 1 160 ' 49 1 A (Can)
I I
Hat Meea- 265,485 - 1 160 (1659) P Data i ~ z d e q u a t e Morrow(Gae)+ I
Huapac he - 12,433 12,433 1 160 78 A Morrow(Gae)
Indian Basin- - - - - - - No production data 1 .Atoka(Cae) i
' I
Indian Basin- 35,318,403 - 14 2240 (1 5,767) P Data inadequate Morraw(Ga8) I 1
Indian Baein- 418,049,289 919,389,289 56 8960 102,610 P Projection may be high 1 Upper Penn(Gaa1 ! I
I!idian Hille, North 803,846 803,846 3 480 .
Morrow(Cae)
Indian %lie- - - - - - - No production data Upper Penn(Gae) i l
Jal , West Strawn 8,740,904 9,668,854 2 320 30,215 P Projection low ( c a s ) I
Lea-Penn * 28,063,287 32,999,337 15 2400 13,750 P I Projection slightly low j
(Gas) I
Los Medanoe- ! 2,155,366 - I I60 (75,97 1) P Projection high; not ueed Atoka(Gas)*
Lusk, West- 38,748 38,748 1 40 969 A St r awn*: I--
J 4
I

- Cum. Prod, Proj. P J - O ~ . Prod. Proj. Prod.
Fitld/Wcll - 1 /1/73 Total Wells Acreti per ac re + Status Remarks
Lynch-Penn 287,423 287,423 1 160 1,796 A (Gas)*
Maroon Cliffs- 570,225 - 1 160 ( 2 6 4 ) P Data inadequate Morrow(Gae)*
McMillan - 9,897,362 11,258,292 5 800 14,073 P Project ibn low Morrow(Gas)
Oeudo - St rawn 5,503 5,503 1 14 0 138 A
Oeudo, North- 17,159,241 18,031,601 5 800 22,540 P Projection low Morrow(Gae)
Osudo, South- 4,656,528 5,574,308 2 3 20 17,420 P Projection low Morrow(Gae)
Oeudo, West- 72,357 - 1 1 60 (452) P Datc ~naderiuate Mo rrow(Gae)Q
Poker Lake- 251,999 251,999 1 150 1,575 A Morrow(Gae)*
Red 1Iille- 219,874 219,874 1 160 1,3 74 A Penn(Gae)*
Reek Tank- Lower 22,953,926 Morrow(Gae)
Rock Tank- Upper 2,664,785 Morrow(6ias)
Salt Lake, South 4,126,566 Atcka(Gas)*
Data inadequate
Projection high; not used


~ l . m r ~ r o d . Proj. Prod. Prod. Proj. Prod. Field / W el l 1 / 1 I73 Totai Wells Acres per acre t Status Rclnarke
Welch-Pcnn 774,378 774,378 1 160 4,840 A (Gae
White City- 12,496,631 10,150,525 3 3 20 31,720 P Frojection i o e s not Penn(Cas) include 1971 -72 production 1
Wilson-Penn 3,661,445 3,829,975 1 160 23,937 P Projection .lightly low 1 (Gas)*
Wilson, South- 118,120 118,120 1 160 738 A Penn(CasI*
t Production per acre in parentheses based on production to January 1, 1973 :::Study area fields P: Producing A: Abandoned


,Llr l%r,a 19 - w clle: penrsylvanian (Study Area) Gae Production (Cont'd)
Cum. Prod. Proj . Prod. Proj . Prod. l?i eld /W ell 1/1/73 Total Acres p e r a c r e Status Rornarka
LEAP 12 (Gas) 2,451,100 . 2,964,550 160 18,528 P
LEAP 13 (Gas) 719,121 720,321 160 4,502 P
LEAP 14 (Gas) 435,208 436,768 160 2,730 P
LEAP 15 (Gas) 787,422 1,616,362 160 10,102 P
PAMR 01 (Gae) 4,699,115 4,731,965 160 29,575 P Projection low
PAMR 02 (Gas)22,885,062 26,008,222 160 162,551 P Project ion low
PAMR 03 (Gas) 321,916 333,166 160 2,076 P
SLSX 01 (Gas) 1,648,506 1,708,276 160 10,677 P Projection low
SLSA 02 (Gae) 2,378,770 3,017,530 - 1'60 18,860 P
SLSM 01 (Gas) 452,140 452,140 160 2,826 A
SLSM 02 (Gas) 5,266,153 6,364,933 160 39,781 P
UNDG 01 (Gas) 216,680 - 160 - P Data inadequate
UNDG 02 (Gas) - - 160 - - No production data
UNDG 33 (Gas) - - 160 - - No production data
UNDG 04 - - 40 - A No gae production . - . . .
P: Producing
A: Abandoned

TABLE 20 - Diecovery Well Data: Pelrneylvanian (Study Area)
Producing Initial Field Diecover y Well Location kterval Potontial/Day Gravity P r e s e u r e
Antelope E d g e - Shell 4 Antelope Atoka (Gas) Ridge B4-24s-34E 12,2 12- 12,341 30,000 MCF - FTP:37 17
Ante lope Ridge - 38,000 M C F Morrow (Gas) Shell 1 Federa l B4-24s-34E 12,898- 13,151 . 342 bd 48O -
Bell Lake-Penn- 13,100 MCF sylvanian (Gae) Conoco 2 Bell Lake N30-23s-34E 12,635- 12,665 140 bd
B e r r y-Morrow 1,220 MCF (Gael Texaco 1 Ber ry N7-21S-34E 13,908- 13,986 34 bd 5 7 O TP:4900 I
. 579 bti6 Big Eddy-Strawn P a n Am 1 Big Eddy 019-20s-31E 11.402-1 1,468 GOR:3139/1 5 o0 TP:3450 I Cedar Canyon- Skelly. 1 Cedar Morrow (Gae) Canyon P9-24s-29E 13,062- 13,374 32.868 MCF - FSIP:4257
Doe Hermanoe- Morrow (Gas) P a n A m 1 Emperor F28-20s-30E 12,242-12.391 13,600 MCF - FSlP:4953

TABLE 20 - Discovery Well Data: Penneylvanian (Study Arcaj Cont.
- Prodwing Initial
Field Discovery Well Location Interval PotcntialIDay Gravity P r e s s u r e
Golden Lane- Westbrook 1 Morrow (Cae) Cowden K4-21s-29E 12,614- 12,622 9,750 MCF
Golden Lane- Pennzoil 1 16,300 MCF Strawn (Gas) Hudson C4-21s-29E 11,098-11,102 GOR:33,571/1 55O
C r a m a Ridge- Shell 1 ! Morrow (Gas) Federal GR F4-22s-34E 12,886-13, l l 1 4,900 MCF - FSIP:7597
Hackberry, South- Champlin 33 80 bbls Strawn Big Eddy P4-20s-31E 11,461-11,496 COR:2535/1 49O TP:135 "--
~ a t ~ e e a - Phillips 1 Hat Morrow (Gas) Mesa G11-21s-32E 13,656-14,100 7,514 MGF - FSIP;6825
Lca-Penn U, S, Smelting 1 1,922 MCF (Gas) Federal F l l -20s -34E 13,034-13,054 GOR:10,682/1 ' 54O FSLP:6750
Loe Medanos- Atoka (Gas)
Lusk, West- Strawn
Shell 1 James Ranch 036-22s-30E 12,920-12,929
Pan Am 3 Big Eddy P6-20s-31E 11,316-11,354
Hamon 1 NE Lynch ~ 1 7 - 2 0 s - 3 5 ~ 13,659-13,774
9,000 MCF i s ? bd
47 bbls
3,850 MCF
45O TP: 120

TABLE 20 - Discovery Well Data: Penneylvanian (Shrdy Area) Cont.
Producing Initial Field Discovery Well Location Interval PotentialIDay Gravity Preeeure
- Maroon Cliffs Baes 7 pig 3,800 MCF Morrow (Gae) Eddy 019-205-315 12,656-12,948 32 bd 54O TP:243 1
Osudo, West- Amer. Trad. 2 42 MCF Morrow (Gas) SE Lea L25-20s-35E 12,856-13,033 2 bd 5 1O FSIP:602 1
Paduca-Morrow Texsco C 5
(Gas) Cotton Draw G2-25s-31E . 14,787-14.667 21,230 MCF TP:6200 - I
Poker Lake- Pan Am 36 Morrow (Gas) Poker Lake P28-24s-31E 14,950-15,010 2,200 MCF - TP:6358
Red Hille-Penn Pure 1 Red Hills (Gas) Unit 032-25s-333 14,607-14,864 26,500 MCF
- - I Salt Lake, South Texae 1 Rich- 1,794 MCF Atoka (Gas) arde P25-20s-32E 12,909- 12,916 4P bd - TP; 1681 I
Salt Lake, South Texaco 1 State Morrow (Gas) CH
Sand Dunee- Texas h ~ e r . 1 Atoka (Gae) Todd
3,526 MCF H36-20s-32E 13,242-13,307 115 bd 53O TP:500
G26-23s-31E 13,679- 13,907 - 75,000 MCF TP:7778
Texas Amer. Sand Dunes- Lower Penn (Gas) 1 - 14 Todd K14-23s-31E 14,051 - 14,076 6,700 MCF - TP:4320
Sand Duncs - Texas Arner. w
1-36 Todd F36-23s-31E 14,862-14,898 2,500 MCF - OD Morrow (Gas) FSIP:7700 UI

TABLE 20 - Discovery Well Data: Pcmsylvanian (Study Arca) Conl.
Producing Initial Ficld Discovery Well Location Interval Potential/Day Gravity P r c s s u r c
Sand Dunee, So. - EPNG 1 Lower Pcnn (Gas) Sundance F4-24s-31E 13,691- 14,379 3,376 MCF - FSIP:8640 I
I Sand Duncs,
- I
West-Atoka (Gas) EPNG 1 Arco K16-23s-31E 13,880-13,890 3,826 MCF FSIP:9 12 1 1 i I
T e a s - P ~ M 3,628 h4CF - i (Gas) Sinclair 1 Mahaffey C14-20s-33E 13,294-13,543 GOR:30, 16711 TP:4403
Tower Hill- Cities Service 17 9,000 M C F Morrow (Gas) Big Eddy B2-21s-29E 12,696- 12, 500 180 bd - -
Wilson-Penn (Gas) P u r e 1 Wileon E13-21s-34E 1 20,200 MCF - -
Wilson, South- Sinclair 1 South - 2,560 M C F Penn (Gas) Wilson L23-21s-34E 12,642- 12,895 67 bd 54O S:TP:-4567
Uncle signated Belco 3 James '
(Gas) Ranch J1-23s-30E 13,862- 14,266 6,500 MCF - -

In evaluating reserve projections from completed wells in
Pennsylvanian gas fields the estimated recovery given in this report is
considered low for 16 fields, and approximately correct for seven fields.
Fields where the projection was considered to be unreasonably high were
included with fields where data was inadequate to make a projection, and
production figures a r e therefore limited to recovery as of January 1, 197 3.
Discovei wells for Pennsylvanian fields within the Study area a r e
listed in Table 21.. Producing depths range from 11,098 feet a t the Golden
Lane-Strawn f;cr:d along the northern edge of the Delaware baain to over
15,000 feet ;it the Poker Lake-Morrow field in the central par t of the
Dehware basin in New Mexico. The average net pay thickness is 149
feet. Initial potential for discovery and developrnerst wells averages
10,036 MCF per day. The highest reported L P. was 75,000 MCF for
the discovery well of the Sand Dunes -Atoka field. This well, completed
near the end of 1969, has already produced over 9,000,000 MCF of gas
and estimated recovery is 10,343,683 MCF. The average gravity of
distillate, based on 18 discovery and development wells, is 53O A. P. I. ;
for oil wells the average gravity is 4a0 k P. I. Reported pressures a r e
difficult to evaluate; times vary for f inal shut-in pressures, and only
for recent completions a r e four -point pressure tests given. .Shut-in 1
pressures for gas discovery wells averages 6,874 psi.
Wolfcamp Formation
There a r e five designated Wolfcamp fie168 within the Study area:
Big Eddy (gas), Southeast Lea (gas), Paduca (gas), Red Hills (gas) and

Remuda. Of these only the Big Eddy field is no longer ir, production.
L The Cabin Lake-Strawn field w a s completed i n the Wolfcarnp as defined
in this report. Projections presented in Table 21 are based on per acre
L recovery of these six fields. AT additional nine fields outside the Study
area were emhated to arrive at a per acre yield for this interval.
Of the 15 fields examined six have been abandoned involving a
total of six wells. Although data from abandoned fields and wells
represents the nearest approach to an absolute yield per acre, exploration
of FVolfcamp rocks, particularly in &e Delaware basin, i s fairly recent
and most abandoned wells were of marginal productive capacity. The
production history, even of the shallow pay zones in the Delaware Mountain
Group, i s too short for most abandoned wells to be of value in analyzing
producing potential of any interval. The one abandoned oil field i2 the
Wolfcamp recovered ?9 barrels per acre. By comparison the five still
producing oil fields have averaged 1, 169 barrels per acre based on
production to January 1, 1973. Recovery from the five abandoned gas
fields averaged 426 MCF per acre and 23,842 M C F had been recovered
from .the three fields prodacing at the end of 1972. Altho~igh abandoned
wells are not representative of producing capacity for an interval, their
inclusion is still Eecessary in calculating the average producing capacity.
Reserve projections for most of the oil and gas recovery a s shown
.. in Tables 22 to 25 appears to be fairly reliable although some _.j.ojections,
a s ir.dicated, a re considered low. AS an example per acre recovery of 1
* the Southeast Lea field appears to be low at 5,688 MCF. Studies of the

two wells (Table 25) indicate a st i l l lower recovery of 4,704 ,MCF per
1 acre. Expected oil recovery for the Remuda and Cabin Lake fields may
be slightly high but projections could not be improvsd because of fairly
I : uniform production for the past several years. Peak gas production a t
~ Red Hills field occurred in 1971 and there appears to be no way to obtain
i a reliable field projection by the method used in this report. Up to January
i 1, 1973 recovery amounted to 48,798 MCF pe r acre. Evaluating production
for the two wells in this field indicates a projected recovery of 69,2 16 MCF
i p e r a c r e for well REDHIl and 41, 154 MCF up to January 1, 1973 for well
I REDHR. The two Red Hills wells a r e located on adjacent 40 a c r e t rac t s
but six sections have been dedicated to this field. Recovery estimates
are bared on 160 ac re spacing but it would appear that a much larger I
area i s being drained.
1 . Some fields where estimated reserves may appear low in the
I tables include the Dogie, Osudo, and Winchester oil fields, and the
Paduca gas field. Examination of yearly production figures, particularly
for the last few years, indicates that these reservoirs a r e approacfiing
depletion under present circumstances, and a t least insofar a s current
producing wells a r e concerned.
Average vields per ac r e of gas and associated gas to January 1,
1973 and for projected reserves a r e higher in the Study a rea than for the
I larger evaluation area. Total projected gas yields for the Study a rea
a r e 19,812 MCF per ac re compared wit3 11,676 b1CF for a l l Wolfcamp
fields. Estimated crude oil and distillate recovery for the Study a rea

190
i s 1, 062 ba r re l s p e r a c r e , somewhat higner than the regional est imate
of 723 barrels . Up t o .Ta~uary 1. 1973 the average production p e r well
for the region amouate2 to 1,877,797 MCF of gas aa,: 79, 70 1 ba r re l s
of distil late for gas wells, and 41, 925 ba r re l s ~ r ' oil and 263,379 LMCF
of associated gas for oil wells. Projected the p e r well recovery for the
region is: gas 'wells - 1, 941,464 M C F and 99, 230 barrels ; oil -.veils - 47,174 b a r r e l s and 385,678 PXCF. In the Study a r e a production p e r well
to January 1, 1973 has been: Gas wells--3,693, 633 MCF and 130,205
barre ls ; oil wells- -42,489 b a r r e l s and 492, 000 MCF. Projected well
recovery is estimated to be: natural pas - -3, 199,745 MCF; distil late--
162,754 b a r r d s ; 011--63,983 barre ls ; and associated gas--702, 979 MCF.
Data covering the. important detai ls of discovery wells within the
Study a r e a a r e given in Table 26. Offset efforts of these discovery wells
a r e l imited to the Red Hills and Southeast Lea gas fields. The second Red
Hills unnll located in sec. 5, T. 26 S., R. 33 E. had an initial potential
(L P. ) of 13,600 MCF of d r y gas per day. The offset to the Southeast Lea
discovery well had an LP . 0s' 1,090 MCF of gas p1.a~ 30 ba r re l s of 55'
A. P. I. distillate. Depth to top of pay in the Wolfcamp ranges f r o m 10,690
to 13, 440 fee t snd average net pay thickness is 77 feet based on the
discovery wells. A final shut-in p r e s s u r e of 6 ,6 16 p s i at 11,400 feet was
given for the Southeast Lea discovery well. Average L P. fo r gas wells
is 12, 842 LMCF p e r day.

TABLE 2 I - Productlon summary: Wolfcamp Fonnation
Intcrval
\Volfcr~iiy/Abo
(21s (hlCF)
Anoci~tcd Gas (AICF)
Tclal Gas (MCP)
Oil (bMs)
Distilhtc
Total Oil (bblr)
Study Ares 1 Rc~ionrl Arcn Qncluclcs study rrca) Avcrag Yield Prcjcctca Avcrap Yicld Projcctcd 1- Produci~rg Production Pcr Acre t o Projected Yield .Producing Production Per Acrc to Projcctcd Yicld
Acres LO 1/1/73 1/1/73 Production Pcr Acre
960 18,561,798 19,335 19,198,468 19,998
80 983999 12,300 1,405957 17,574 -
1.041) 19,545,797 18,794 20.604.425 19,812
80 84,977 1,062 127,966 1,600
960 78 1.228 814 976.526 1.017
1,040 866,205 833 1,104,492 1,062
Acrcs to 1/1/73 1/1/73 Production Pcr Acrc
1.600 18,777,968 1 1,736 19,4 14,638 12,134
360 2,370,413 6,584 3,471,104 9,642
1,960 21,148,381 10.790 22,685,742 1 1,676
360 377,323 1,048 424,570 1,179
1,600 797.006 498 99:',301 620
1.960 1.174.329 599 1,416,674 723 -

Cwn. Prod. Proj . Prod. Prcd. Proj . Prod. . . Field/ Well 1/1/73 Total Wclle Acres per a c r e Status Remarks
Big Eddy* 3,518 3,518 1 160 2 2 A Wolfcamp (Gae)
Cabin Lake CO, 357 89,859 1 40 2,246 P Projection tnay be high ''Straw..";%
Cedar Hille - 12,045 ' 12,045 1 160 75 A Wolf camp (Gas)
Dagger Draw - 225 W o l f ~ ~ r n p (Gas)
- C F ' Dogie Draw - 39,998 43,626 1 40 1,091 P Wolfcamp
Lea, Southeast - 236.89'1 293,395 2 320 9 17 P "urolfcamp (Gas)*
O S U ~ O - 161,921 162,092 4 160 1,013 P Wolfcamp
Osudo, South 173 17 3 1 160 1 A Wolfcamp (Gas)
Paduca 8,073 8,293 1 160 5 2 P Wolfcamp (Gas)Xc

TABLE 22 - Fields: Wolfcamp - Oil Production (contt)
Cum. Prod. Proj. Prod. Prod. Proj. Prod, Field/ Well - 1/1/73 Total Wells Acres per a c r e Status Remarks
Red Hills - 532,746 671,320 2 320 2,098 P Wolfcamp (Gafi)*
Rcmuda - 24,620 38,107 1 40 953 P Wolfcamp*
Rocky Arroyo - - Wolfcamp (Gas)
- - No production data
Wileon - 3,335 3,335 1 160 2 1 A Wolfcamp (Gas)
Winchester - 87,284 87,743 1 4 0 2,194 P Wolfcamp
*Study area fields P: Producing A: Abandoned *


TABLE 24 - Fielde: Wolfcamp - Gaa Production
Cum. Prod. Proj. Prod. Prod. Proj . Prod. F ie ld / Well 1/1/73 Total Wells Acres p e r a c r e Status Remarks
I Big Eddy - 124,605 124,605 1 160 779 A
I Wolf camp (Gas)*
Cabin Lake - 819,710 1,194,180 1 40 29,855 P 'Strawnl'*
1 Cedar Hills - 149,867 149,867 1 160 937 A
Wolfcamp (Gas)
Daggar Draw 45,452 45,452 1 160 2 84 A Wolf camp (Gas)
Dogie Draw - 364,222 422,432 1 Wolf camp
Lea, Southeast 1, 351,792 1,820,062 2 Wolfcamp (Gas)*
McMillan - Wolfcamp
40 A No gas production
Osudo - 530,808 531,321 4 160 3,321 P
I Wolf camp
Osudo, South - 1,694 1,694 1 160 11 A Wolfcamp (Gas)

Cum. Prod. Proj. Prod. Prod. Proj. Prod. Field/ Well 1/1/73 Total Wells Acres per a c r e Status R e w r k s
Paduca - 1,469,979 1,638,379 1 160 10,240 P Wolfcamp (Gas)*
Red Hills - 15,615,422 Wolfcamp (Gas)*
Rcmuda - 164,289 211,777 1 40 5,294 P Wolfcamp* -
Rocky Arroyo - - Wolfcamp (Gae)
Wilson - 19,157 19,157 W olfcamp (Gas)
Winchester - 49 1,384 1, 111,394 Wolfcamp
*Study area fields P: Producing A: Abandoned
Date inadequate
No production data

TABLE 25 - Wells: Wolfcamp (Study Area) Gasl Production
Cum. Prod. Proj. Prod. Proj. Prod. Field/ Well 1/1/73 ~ b t a l Acree per a c r e Status Remarks
LEAS 01 (Gae) 1,216,661' 1,356,48 1 160 8,478
LEI& 02 (Gae) 135,111 148,708 160 929 P
REDI-ii 1 (Gae) 9,030,763 11,074,493 160 6 9 , 2 16 P
REDHI 2 (Gae) 6 ,584,659
P: Producing
Data inadequate


Bone Springs Formation
Similar to study of the Delaware Mountain Group all Bone
Springs fields have been analyzed for this report. Involved are 23
oil fields, having 65 completed wells occurring as far north as T. 17 S.
Production records could not be found for the Black River gas field
listed in Table 28. Most of the oil and gas recovered from the Bone
Springs thus far has been discovered on the shelf north of the Delaware
badn and along the east flank of this basin. There a r e seven fields
within the Study area and with the exception of the Lea field all consist
of only one well. In addition to covering all of the Bone Springs fields
analyses were made of 37 wells from multi- well fields.
Fifteen of the Bone Springs fields, including three in the Study
area, have been abandoned (Tables 28 and 30). The average per acre
yield for these abandoned fields amounts to 410 barrels of oil and
395 MCF of associated gas, and the average per well yields a r e 16,380
barrels of oil and 15,784 MCF of gas.
Yields per acre based on field analyses indicate a productive
capacity for the Bone Springe ranging from 19 barrels of oil and
27 MCF of associated gas to 8,083 barrels of oil and 7,903 MCF of gas.
The low yields a re from abandoned ane well fields. Analyses of
individttal wells indicates a high yield per acre of 13,237 barrels of
oil from a well in the Scharb field,and 18,220 MCF of gas from an
abandoned we11 in the Lea field (Tables 29 and 31).

For all Bone Springs fields, production to January 1, 1973
averaged 3,228 b a r y ~ l a of oil and 2,845 M C F of gas per acre.
Projected the average pr imary recovery should amount to 4,338 barrels
of oil and 3,622 MCF of gas per acre (Table 27). Within the S k Z y
area , 5,129 MCF of gas and 2,503 barre ls ot' o i l were recov-red per
a c r e up to January 1, 1973 and expected recovery i s at ieast 5, 394 of
gas and 2,755 barrels of oil. Expected oil recovery is therefore
considerably lower for the Study area and gas recovery quite a bit
higher. Projected production per well averages 173,517 barre ls of oil
and 145,041 MCF of gas for all Bone Springs wells, and 1 l C , 213 Larrels
of oil and 215,762 MGF of gas per well in the Study area.
Fields for which projections a r e questionable a r e Big Eddy and
Teas that may be somewhat high, and the Lea field where the projection
is low. Eight wells were used in projecting per acre recovery for the
Lea field. Nine additional wells have been completed in this field in
the last three years but production has been too e r r ~ t i c to establish a
reliable decline curve. Of the eight wells used seven have been abandoned
after producing from four to ten years. Thus the per ac re yield based
on well analysis is essentially the same a s the field analysis. Yields
per ac re of the nine wells completed since 1970 Lave already slightly
~xceeded the per ac re yield determined for the older wells.
II TV.ell analyses for the four wells in the Quail Ridge field indicate
1
a recovery of 6,893 barre ls of oil and 5. 168 MCF of gas per acre. The mi- ,
; potential oi l yield is considerably lower than that obtained by the field t

TABLE 27 - Production summary: Bone Sprlngs Formation
I Gar (AtCF) I - - - - .- - - - I - -
Intcrvd
Bonc Springs
I Oil (bb!s) 1 560 1.401.517 2.503 1,542,971 2755 ( 2,240 7.230.977 3.228 9.7 16,954 4.338
Study Area Avcragc Yicld Projected
Producing Production Pcr Acrc to Projected Yicld Acres to 111173 1/1/73 Production Per Acrc
Associaled Gas (MCF)
Rc~ioral Area (iacludcs studv arca) Average Yicld Projcctcd
Produci~lg Production Per Acrc to Projcclcd Yield Acrcs to 1/1/73* 1/1/73 Production Per ~ c r c
560 2,872.1 15 5,129
-- - -
Doe8 not Include 1972 production for new well in Bell Lake field or 1970-1972 production for new well8 in Lu field.
(b bls)
Total Oil (bbls)
-
-

TAULE 28 -a Ficldu: Uonc S p r i n g ~ - Oil Protluction
. Cum. Prod. Proj . Prod. Prod. Proj. Prod.
F ie ld / Well 1/1/73 Total Well8 Acree p e r a c r e Sta tu e Remarks
Bell Lake* 167,320 195,687 1 40 4892 P
Bell Lake, North* 778 778 1 40 19 A
Big Eddy* 12,430 46,393 1 40 1160 P Projection may be high
Black River (Gas) - - - - - - No production data
Buffalo 7,717 7,717 1 4 0 193 A
Greenwood 12,218 1.2.218 1 4 0 305 A
Grama Ridge* 17,053 17,053 1 . 40 426 A
Lea* 2,080,111 1,088,972. 17 320 34 03 P qroject ion low: based on 8 of 17 wells to 1970
Lea, S u t h * 14,476 14,476 1 4 0 362 A
Lusk 14,069 14,069
Midway 8,194 8,194
Osudo, Lower 97 8 978
Osudo, Upper 7,282 7,282 , ..
Pa;millo 2,481 2,481
P e a r l 4,235 4,235
Quail Ridge 973,405 I , 282,938
Querecho Pla ins 40,524 40,524
Reeves 1,010 1,010

TABLE 28 - Fielde: Bone Springs - Oil Production (con't)
Cum. Prod. Proj. Prod. Prod. Proj. Prod. Field/ Well 1/1/73 Total Welle Acres per ac re Status Remarke
Scharb 4,453,599 6,466,609 20 800 8083 P
Shugar t 103,357 103,357 1 4 0 2184 .A
T e a + 101,064 179,618 1 40 4490 . P Projection may he slightly high
Vacuum, S. 178,671 199,296 5 2 00 996 P
Wilson 10,389 11,738 1 40 293 P
Young 11,331 11,331 1 40 283 A
* Study a r ea fields P: Producing A: Abandoned

TABLE 29 - Wells: Bone Springs (Study arca) Oil Production
Cum. Prod. Proj. Prod. Proj. Prod. Field/ Well 1/1/73 Total A c r o s per acre Statue Re~narke
7
LEAB 01 240,540 240,540 40 6,015 A
LEAD O? 220,905 220,905 40 5,523 A
LEAB 03
LEAB 04
LEAB 05
LEAB 06
LEAB 07
LEAB 08
QRBS 01
QRBS 02
QRBS 03
QRBS 04
SRBS 01
SRBS 02
SRBS 03
S I B S 04
SRBS 05
SRBS 06
SRBS 07
SRBS 08
A
P
P
P
P
P
A
P Projection low
P

TABLE 29 - Wells: .Bone Springe - Oil (conlt)
Cum. Prod. Proj. Prod. Proj. Prod. ~ i e l d / Well a 1/1/73 Total A c r e s per a c r e Statue Remarke
SRBS 09 71,890 80,556 40 '2,014 P Prcjection may be low
SRBS 10 153,838 158,261 40 3,957 P Projection may be low I SRBS 11 19,975 22,638 4 0 566 P Projection low I SRBS 12 703,167 769,461 40 19,237 P Projection low I SRBS 13 475,726 - 40 - P Data inadequate i
SRBS 14
SRBS 15
SRBS 16
SRBS 17
SRBS 18
SRBS 19
SRBS 20
SVBS 01
SVBS 02
SVBS 03
SVBS 04
SVBS 05
A
P Projection low I i
P
P Projection low
P Projection probably low I P Data inbaeqpiate I
P: Producing A: Abandoned

TADLE 30 - Ficlda; Bonc Springe - Gao Productiou
CUE. Prod. Proj. Prod. Prod. Proj. Prod. Field/ Well 1/1/73 Total Wclls Acrce p c r a c r e S t a b s Remarks
Bell Lake* 204,477 239,854 1 40 5996 P
Bell Lake, North* 1,712 1,712 1 40 43 A
Big Eddy* 10,672 12,493 1 40 3 12 P Projection may be low
Dlack River (Gas) - - .. - - - No production data
Buffalo 4,197 4,197 1 40 105 A
Grama Ridge* . 13,883 13,883 1 4 0 347 A
Greenwood 10,787 10,787
Lea* 4,030,569 2,528,922
Lea, South*
Luek
Midway
Oeudo, Lower
Oeudo, Upper
Palmil lo
P e z r l
Quail Xidge
Querccho Plains
P Projection based on 8 of 17 wells to 1970
A
A No gar production
n A
A
A No gas production
A
P Data inadequate


TABLE 3 1 - Wclls: Bone Springe (Study arctr) . Gas Production
Ctun. Prod, Proj. Prod. Proj. Prod. Field/ Well 1/ 1 /73 Total Acree per acre Status Remarks
LEAB 01
LEAB 02
LEAB 03
LEAD 04
LEAB 05
LEAB 06
LEAB 07
LEAB 08
QRBS 01
QRBS 02
QRBS 03
SRBS 01
SRBS 02
SRBS 03
SIBS 04
SRBS 05
SRBS 06
SRBS 07
SRBS 08
Projection low
Projection high

TABLE 31 - Welle: Bone %ring8 (Study a r ea ) Gae Production (con't)
Cum. Prod. Proj. Prod. Proj. Prod. Field/ Well 1/ 1/73 Total Acrea per acre Status Remarks
SRBS 09 70,209 125,274 40 3,132 P
SRBS 10 63,623 75,239 40 1,881 P
SRBS 11 3,850 3,850 40 95 P No gae production after 1966
SRBS 12 350,260 379,078 40 9,477 P Projection :ow
SEtBS 13 266,471 P Data inadequate
SRBS 14 39,909 39,909 40 998 A
SRBS 15 27,774 34,363
SRBS 16 5,665 5,665
SRBS 17 99,248 200,420
SRBS 18 40,717 40,717
SRBS 19 30,895 41,682
SRBS 20 19,942 22,032
SVBS 01 75,494 75,494
SVBS 02 77,033 96,417
SVBS 03 1,552 1,552
SVBS 04 1,815 1,815
SVBS 05 10,989 10,989
P: Producing A: Abandoned
Projection low
Projection probably low
Projection low
Projection elightly high


TABLE 32 - Diecovery Well Data: Bone Springe (Cont. )
Producing Initial Field Discovery Well Location Interval Potential/Day Gravity P r e s s u r e
Brit. Arncr. 1 64 bbls Osudo, Lowcr North Wilson 031-20s-36E 10,094-10,122 COR: 1255 3 3 -
Brit. Amer. 1 238 bbls Osudo, Upper North Wileon 031-20s-36E 7,888-7,901 GOR:268 26 -
Redfern 1 Palmil lo Marathon M36- 18s-28E 6,422-6,425 132 bble - TP:250
P e a r l Shell 1
Hooper 120 bbls
G27- 19s-35E 8,198-8,272 GOR:840 3 8 TP:50
E.P.N.G. 1 933 bbls Qua1 Ridge Mescalero Ridge P2 1- 19s-34E 10,118- 10,134 GOR:677 3 9 TP:563
Shell 2 Querecho 193 bbls Querecho Pla ins Plains N27-18s-32E 8,538-8,560 GOR:780 39 TP:250
Reeves
Scharb
Shugart
Superior 1 Mc Alpin
Ohio 1 State
Pan Am. 3 Greenwood
Sinclair 1 Mahaffey
F23-18s-35E 9,980-9,993 182 bbls GOR:760
238 bbls H27-18s-31E 8, 135-8,185 GOR:755 4 1 TP1500
147 bbls h)
C14-20s-33E 9,408-9,457 COR: 1225 38 TP:200 w C1

TABLE 32 - Diecovcry Wcll Data: Bonc Springs (Cont. )
Producing Initial Field Discovery Wcll Location Interval - Potential/Day Gravity Presaurc
Vacuum, Sinclair 1 478 bble South Lea D22- 18s-35E 8 ,504-8 ,s 14 GOR:967 3 4 TP:100
Wilson Lconard 1 59 bbls
East Wllaon K19-21s-35E 9,410-9,416 COR: 1000 3 7 TP: 100
Internation 1 213 bbls Young Linam I2 1 - 18s-32E 8,708-8,716 GOR: 122t 3 7 TP:350

analysis. Data was not adequate to project a field analyais for gas.
Of the 20 wells completed in the Scharb field al l but three a r e still
producing. Projections based on wells indicate an average per acre
recovery of 6,238 barrels of oil and 3,827 MCF ot gas. These
estimates a re well below the field projec5ons on which the recovery
figures a r e based in Table 29. Utilizing data obtained by well analyses
the estimated per acre recovery for all Bone Springs completions is
3,589 barrels of oil and 3,261 MCF of associated gas compared with
the field projections of 4,338 barrels of oil and 3,622 MCF of gas.
Bone Springs discovery wells a r e listed in Table 32. Data
was not available for the discovery well of the Scharb field. Based
on the other 19 wells in this field thr: average producing interval is
from 10,109 to 10,174 feet in depth and average oil gravity i s 38O
A..P. I, Producing depths for the Bone Springs ranges, from 6,422 feet
' . for top of pay in the Palmillo field to 10,804 feet for bottom of pay zone !
for a wellin the Scharb field. The Bone Springs Fo-tion is quite
thick and several pay zones have been discovered. Therefore depths
do not neceesarily reflect structural configuration. The average initial
potential i s 216 barrels of oil per day with an average gra*ty of 39O
A. P. L and an average pay inter-,.a1 of 39 feet.
Delaware Mountain Group e r e - ~ a r n . s e ~ )
There have been no successful completions in the Bell Canyon
Formation below the Ramsey interval. Oil production has been obtained
at 17 aroas (Tables 34 and 36), designated a s fields, from the Cherry

Canyon and Brushy Canyon formations; seven of these fields a r e within
the Study area. Post-discovery development is limited as evidenced by
the fact that there were a s of January 1, 1973 only 29 producing wells
completed in the 17 fields. Ucsucces sful attempts a t lateral extension
of production is discussed in the section on exploration status.
Of the 17 fields, nine have been abandoned involving a total
of 13 wells. Production from these wells amounted to 148,094 barre ls
of oil for an average yield per ac re of 285 barre ls and an average
~rield per well of 11,392 barrels. Data was not adequate to project
production for the San Dunes field discovered in 1970. Production up
to January 1, 1973 from two wells has amounted to 59,078 Sa1:rels for
a yield per ac re of 738 barre ls and per well of 29,539 barrels. For
. the remaining seven fields with 14 wells the projected potential inaicates
a yield of 2,364 barre ls per ac re and 94,543 barre ls per well. When
all wells a r e taken into consideration the expected yield for this part
of the Delaware Mountain Group is 1,320 barrels per ac re (Table 33),
and 52,785 barre ls per well. Total primary recovery estimates a r e
slightly higher lo r fields within the Study area. Four of these fields,
all having one well, have been abandoned with total pi-oduction of
107,429 barrels for a yield of 671 barrels per ac re and 26,857 barrels
per well. The turo fields for which production was projected indicate a
-, yield of 2,651 barre ls per a c r e and 106,038 barre ls per well. Projection
for the Parallel field may be slightly high. However, the two producing .. wells in this field a r e not draining the same reservoir. Log interpretation ,

indicates one i s producing from :he Cherry Canyon Formation and the
other from the Brushy Canyon Formation. For the nine wells completed
in the Study area average yields a r e estimated at 1,346 barrels per
acre and 53,847 barrels per weil.
Data concerning oil production for ind~vidual wells from multi-
well fields a r e given in Table 35. Based on production estimates a
well from t h ~ Shugart field, ?.he largest of the pre-Ramsey fields,
rhould produce 6,584 barrels per acre. This estimate appears to be
low inasmuch a s production up to January 1, 1973 has amounted to
232,221 barrels for a yield of 5,806 barrels per atre. Using projected
recoveries for individual wells the yield per acre ie only slightly lower
than that based on the field analyses.
Based on field ptojections gas production from this part of the
Delaware Mountain Gr oup, indicates a recovery of 834 MCF per acre
based on 40 acre spacing (Table 36), and 33,345 MCF per well. This
includes eight wells for which there has been no reported gas production.
If only currently producing wells a re considered tha primary recovery
estimate averages 1,674 MCF per acre and 66,949 MCF per well.
Projected recovery for the nine wells (seven fields) in the Study area
is lower at 509 MCF per ac re and 20,358 MCF per well, Eliminating
the three abandoned wells, the well without reported gas production.
and the two wells that could not be projected,recovery estimates are
800 MCF per acre and 32,005 MCF per well. Based on well analyses,
(Table 37). the kighest yield per acre 6,467 MCF is from the same well

'L'AULL! 33 - P r d u c t b ~ sua~~aary: Uclrwrrc Llountah Group; P t c - ~ ~ ~ ~ ~ u y
Regional Arc3 (inclt~dcs studv arcs) Average Yicld Projcctcd
Producing Production Pcr Acrc to l'rojcctcd Yicld Acrcs lo 1/1/73 1/1/73 Produceion Per Acrc
- - - - -
1,lbO 8 10.037 698 967,018 834
- - - - -
1,160 1,277,757 1,102 1,530,77 1 1.320
- - 2 - -
- - - - -
Dulawarc M U U I I ~ ; ~ ~ I I Croup PC- (PIC-Ks111scy)
Gas (MCF)
Assucia~cd Gas (LICF)
Total Ga (BICF)
Oil (bbls)
Distillate (bbls)
Tot sl Oil (bbls)
- Study Area
Average Yicld Projcctcd Producing Production I'cr Asrc to Yrojcctcd Yicld
~ c r c s to 1/1/73 1/1/73 Production Per Aurc
- - - - -
360 175.089 486 183,222 509
- - - - - 360 363,793 I ,Ol I 484,620 1,346
. . - - - - -
- - - - -

:. ~-- . . . . : I . . . . J i . : . : i l : l < I 1 ' I
TABLE 34 '- Fielde: Delaware Mountain Group (Pre-Ramsey) Oil Production
Cum. Prod. Proj. Prod, Prod, Proj. Prod. Field/ Well 1/1/73 Total Wells Acres per acre Status Remarks
Big Eddy* 32,411 56,625 1 40 1416 P
Burton 2,192 2,192 1 40 55 A
Carlsbad 23,682 23,682 2 80 296 A
Corbin 3 56 356 1 4 0 9 A
Cotton Draw* - 31,561 31,561 1 4 0 789 A
Jal, W e s t
L u ~ k
Maroon Cliff a*
Parallel*
Quahada Ridge*
Querecho Plains
Revela tion
Sand Dunes*
Santn Nino
Scanlon
Shugart
u, 5 *
P
P Projcction low
A
P Projection may be high
A
P
P Projection low
P Data inadequate
* Study Area Fielde P; Producing A: Abandoned

.----&-, 3
I'A13LE 35 - Wclla: Dclawarc Mountain Group (Prc-Ramscy) Oil Production
Curn. Prod. Proj. Prod. Proj. Prod. Field/ W e l l 1/1/73 Total Acrcr per a c r e Statue Remarlce
P Projection too high; not used
630 P Projection low
7 2 A
- P Projection too high; riot used
76,086 77,283 40 1932 P Projection low
48,380 137,645 40 3441 P
- - 40 - - No production data
SADU03 10,698 o 40 - P Data inadequate
SANT 0 1 7,270 7,270 40 182 A
SANT02 7 64 7 64 40 19 A
6584 P Projection probably low
3554 P Projection low
P: Producing A: Abandoned

TABLE 36 - Fields: Delaware ~ o u n t a i n Croup ( P r e - F-arnsey) Gas Production
Cum. Prod. Proj. Prod. Prod. Proj . Prod. Field / Well 1/1/73 Total Welle Acree p e r a c r e Status Remarks
Big Eddy*: 3,167 3,167 1 40 79 P No gas production in 1973
Burton - I 1 4 0 - A No gas production
Carlsbad - I 2 8 0 - A No gas production
Carbin - - 1 4 0 - A No. gas production
Comn Draw* 32,770 32,770 1 40 819 A
Jal, Weet 9,476 - 1 4 0 - P Data inadequate
Lu ek 122,741 155,737 3 120 1298 P Projection low
Maroon Cliffs* - - L 40 - A No gas production
Parallel* 84,715 92,848 2 8 0 1161 P Projection low
Quahada Ridge* 14,748 14,748 1 40 369 A
Querecho Plains 2,.106 2,106 1 40 . 53 P No gas production since 1959
Revelation 5,944 5,965 1 40 149 P Minor gas production I Sand Dunea * 23,052 . - 2 8 0 I P Data inadequate I
Santo Nino - - 3 120 I A l ! ~ gas production I Scanlon 133 133 2 8 0 2 A
Stlugart 494,681 610,512 5 2 CC! 3053 P
U. S.* 16,637 16,637 1 40 4 16 A w N !
* Study a r e a fields PI Producing A: Abandoned


TABLE 38 - Discovery Well Data: Delaware Mountain Group (Pre-Ramsey/Study A.rea)
Producing Initial Field Diecovory Well Location Interval Potential/Day C r a vity P r e s s u r e
A ~ O C O 11 61 bbls Big Eddy Big Eddy 17-20s-31E 5142-5165 GOR; 89 / 1 - -
Ttxaco 1 Cotton Draw Heflin C24-24s-31E 7184-7200 25 bbls 36O -
Shell 1 110 bbls Maroon Cliffs Dig Eddy P30-20s-3 1E 6796-6836 GOR:573/ 1 3 3O -
Richardson 1 215 bblv Pa ra l l e l Cobb M23-203-31E 7003-7035 GOR:676/ 1 4 lo TP:75
Richardson 1 67 bbls Quahada Ridge Let% B27-22s-30E 61 12-61 18 COR:639/ 1 43O -
Texas Amer. 2 . 173 bbls Sand Dunes Todd GZ6-23s-31E 6012-6036 GOR:480/ 1 3 8 -
Richardeon 1 175 bbls Fidel M27-2 1s-29E 6890-6950 GOR:2131/1 40° TP:200

in the Shugart field that had the highest expected oil recovery.
Discovery wells of fields in the Study area a r e given in Table 38.
Depth to top of pay ranges from 5,142 to 7,184 feet, and to bottom of
pay from 5,165 to 7,200 feet. The average pay interval thickness for
the seven discovery w d s is 29 feet. Other Froduction data relating
0 to this interval indicates an average gravity of 36 A. P. I.. an average
initial potential of 133 barrels of oil per day, and an average tubing
pressure of 178 pai.
Delaware Mountain G roup (Ramsey Pay)
There a re 29 oil fields involving a total of 296 weUs that a re
curzently producing o r have produced petroleum from the upper part
of the Delaware Mountain Group. Most of these fields a re located in
the Study azea. It was possible to arrive at what appears to be an
adequate projection of reserves for most of the currently producing
fields although a few projections appear to be low. The same, i n
general, i s true for associated gas. Two fields, the East Paduca and
Pecos, a re shown as having projected gas reserves equal to cumulative
production up to January 1, 1973. Reported gas production has been
negligible frcm these fields in the last several years and cumulative
production for the East Paduca field has amounted to only 73 MCF. I
Oil production and projected recovery per acre for each field
is given i n Table 40 and production is sumr;rarized in Table 39. The
average projected yield per acre for the Ramsey interval is 1,630
barrels of oil for all fields and 1.675 barrels for the Study area.

Additional studies were made of 294 wells from the 15 multi-well
fields (Table 41) producing from this ir~terval. Using projections for
these wells the recovery per acre is reduced to 1,438 barrels. Much
of this decrease is the result of projections, considered low, in the
Battleaxe, Double X, East Mason, North Mason, and Paduca fields.
The range in expected oil recovery per ac r e i s from less than one to
7,661 barrels. The low figure is from an abandoned well in the Paduca '
field that produced only 35 barre ls of oil, The high projection is for
the one well Esperanza field completed in I 969, with projection based
on production during the period f rom 197C 3 1973. This projection is
probably high particularly when compared rith the next highest yields
pe r ac r e of 2,160 barrels for the Paduca fi-nld and 3,945 bar re l s for a
well in the El Mar field. Recency of completion and changes in allowable
factors add to the question of ultimate recovery f rom this well, but
production capacity compared with other recently completed wells
verifies that i t is a high capacity well. The projected data for this
well was not eliminated from consideration because of the minor change
it would make in the projected yield per acre.
The average expected yield per well for a l l wells completed
i n the Ramsey inter-..I is 64,998 barrels. This includes production
from 18 abandoned wells that yielded an average of only 13,673 barrels.
Within the Study a rea the average yield per well is 67,011 barrels.
Production up to January 1, 1973 averaged 50,564 barre ls pe r well.

Associated gas production from the Rarnsey has not been very
significant. Fields such a s the Fenton, Dark Canyon, Loving. West
Malaga, and Tecolote Peak have had no reported gas production and
only minor amounts of gas has been produced from rnanv other fields.
The average per acre recovery of gas up to January 1, 1973 and
projected i s given in Table 42 for fields and Table 43 for wells f rom
multi-well fields, This data is summarized in Table 39, based on 40
acre spacing. The highest primary recoveries a r e from the El Mar
'field where projected yields a r e 5,195 MCF per acre. The highest
projected yield for a well, a130 from the E l Mar field amounts to
12,888 MCF per acre. In evaluating the average per acre recovery
for associated gas from al l fields the yield of 2,522 MCF includes data
f rom 13 abandoned wells with reported gas production, six wells with
no reported gas production, and 74 wells for which data -was not
adequate to project recovery and thus only includes production up to
January 1,1973. The bulk of the nonprojected wells a r e in the Paduca
field. The average projected recovery per well, based on all wells,
i s 100,866 MCF. The 13 . ~anaoned wells recovered an average of
2,487 MCF per well, and nor-2rojected wells 97,506 MCF up to.
January 1, 1973. Eliminating these wells and those for which there has
been no reported gas production, the average yield per, well of 203 wells
w is 11 1.373 MCF.
Five wells have been completed a s gas wells in the Ramsey but
production has been reported fo r only three. These wells a r e lccated 1

in the Oouble X, Paduca, and North Paduca fields. In Table 43, per acre
recovery is based on 160 acre spacing and these, one of them now
abandoned, 'nave a projected potential of 1,128 MCF ?er acre. Using
a 40 acre spacing, that in this case might be more apprcpriate, the
yield would be 3,384 MCF.
Discovery wells for Raasey completions drllled in the 5tudy
area are listed in Table 44. Based on these *wello the net pay averages
eight feet thick. From data available from producing wells in the
Study area the average iuitial potential is 122 barrels of oil per day
(average of 282 wells) with an average gravity of 40° A.P. I. (260 wells),
at an average tubing pressure of 278 psi (147 wells). The range in
initial potential ie from 4 BOPD for a well in the Paduca field to 928
BOPD for a well in the North Mason field. The low yield well produced
6 12 barrels of oil before being shut-in. It was recompleted in 1971 and
' has produced over 8,000 barrels. The Paducr field has had a secondary
recovery program since 1968. The well with the high initial potential
in the North Mason field was completed in 1955 and had produced 90,204
barrels up to I969 when secondary recovery operations were initiated.
Production from this well has conLinued to decline and a s of January 1, 1973
total production was 93,598 barrels. The gravity of oil from the Ramsey
ranges from a reported low of 31° A. P. I. for a well in the Double X
'field and two wells in the Sakdo Draw field, to a high of 44O for a well in
the Malaga field. Average gravities for these fields a re 390 at Double X,

36O at Salado Draw, and 42O at Malaga. Reported tubing pr ellsure8
indicate a law of 20 psi for wells in the Corral Canyon, Malaga,
Xorth 5iason, and Paduca fields, and a high of 1; 200 psi for a well
in the Salado' Draw field.

TABLE 39 - Production sunlmary: Delowom Mountain Croup; Ramsey Pay
- - l n & d Upper Delaware Mounhia Group
(Ranlsey)
Gas WCF)
Associated Gas (bICF)
(bSls)
Total Oil (bbl~) 1
Studv Arca Avcragc Yield Projected
P~oducing Production Pcr A:rc to Projected Yicld E.:rcs to 1/1/73 l/i/73 Production* Pcr Acts
Total Gas (MCF)
Oil (bbls)
Docs 1101 include production under rconhry recovery for El Mar, Malap, Mason (Nortl~), and Padllca fitlds or 1970-1972 gas productio~~ for projection of recovery from Corral Ca11y ~ I I licld.
- Rcsional Arca (i~~clt~dcs slt~dv arca Avengc Yicld Projcctcd
Producing Production Per Acre to Projcctcd Yield Acres to 1/1/73. 1/1/73
11,120 26,219,918 2,358 29,820,886 2,682 1 1,800 26,255,425 2.225 29,856,393 2,530
I
11,120 14,553,518 1,309 16,629,036 1,675 - 11.800 14,967,037 1,268 19,239,4 10 1,630

.A ' - 'L'-? iJLL 4 U - Fields: Dclawarc Mountain Group ( ~ m e c y ) Oil Production
CU~II. Prod. Proj. Prod. Prod. Proj. Prod. Field/ Well 1/1/73 i t Total Wells Acres p e r a c r e Statue Rcmarks
Battleaxe * 191,227 324,153 4 160 2026 P
Black River 61,045 61,045 4 160 382 A
Bradley * 11,329 11,329 1 4 0 283 A
Brushy Draw * 211,594 290,445 8 320 908 P
Case Draw 16,897 16,897 1 40 422 A
Cor ra l Canyon * 196,165 259,556 10 320 811 P
Cruz * 385,909 426,590 5 200 2133 P Projection low
Dark Canyon 69,681 70,7 10 1 40 1768 P
Double X * 601,553 1, 127,027 20 800 1409 P
E l Mar 9 t 4,243,877 4,564,594 5 9 2360 1934 P Secondary recovery, 1969 - p r i m a r y projection low
Esperanza 110,623 306,449 1 40 ,7661 P Projection high
- 1 40
-. ' Jennings * 1,575 1,575 3 9 A .
Loving 281 281 1 40 7 A {
827 Malaga * t 642,802 694,986 2 1 840 P.' Secondary recovery, 1967
Malaga, North 14,663 14,663 1 40 367 A
Malaga, West 363 363 1 40 9 A

.. . I . a . TABLE 40 - Ficlde: Dclaware Mountain Group (Rameey) Oil Production (Cont. )
- Cum. Prod. Proj. Prod. Prod. Proj. Prod. .
Field/ Well 1/1/73 It Total Welle Acres per a c r e Status Remarks
Mason, East * 235,201 503.518 7 280 1798 P
Mason, North *t 2,614,077 3,330,966 40 1600 2082 P Secondary recovery, 1969
Paduca * t 4,303,95 1 5,961,730 6 9 2760 2 160 P Secondary recovery, 1968
Paduca, East * 32,356 46,784 1 40 1170 P
Paduca, North * 36,050 39,683 4 160 248 P Projection low
Pecos * 30.843 35,9i7 2 80 449 P Projection low
Salado Draw * 414,881 592, 145 12 480 1234 P Projection low
Sulphate Draw 4,469 4,469 1 4 0 112 A
Tecolote Peak 3,293 3,293 1 40 8 2 A
Triste Draw * 400,098 418,038 14 56Q 7 46 P Projection low
Welch 129,468 129,468 4 160 809 A
- No production data
* Study a r e a fields -t- Secondary Recovery P - Producing A - Abandoned #- Except for secondary recovery fields

. . . 1 . . : Ir. ' ,
CAULE: 41 - Wells: Dclawaru Mountain Group (Ramacy) Oil Productiun
Cwn. Prod. Proj . Prod. Proj. Prod. Field/ Well 1/1/73 Total Acres per a c r e Status Remarks
BATTL 1
BATTL 2
BATTL 3
BATTL 4
BRUS 01
BRUS 02
RRUS 03
BRUS 04
BRUS 05
BRUS 06
BRUS 07
P Projection low I P
P
A
P Projection too high; noc ' used
P
P Projection probably high
P Frojection may be high
A
BRUS 08 24,864 59,822 40 1496 P Projection protably high
BRUS 09 28,321 69,913 40 1748 P Projection probably high
BRUS 10 37,603 - 4 0 - P Projecticn too high; not used
CORR 0 1 - 53,345 7 1,638 40 1791 P Projection may be high
CORR 02 50,967 57,958 4 0 1449 P' I
CORR 03 30,892 38,9 12 40 973 P
CORR 04 24,525 32,053 40 80 1 P N W 0
CORR 05 458 458 40 11 A
--- - . -- . .- - ----- - ---- - -- -- - ---. I --

. , . . . . .
Tl&BLE 41 - Wells: Delaware Mountain Group (Ramsoy) Oil Production (Cont. )
Cum. Prod. Proj. Prod. Proj. Prod. Field/ Well 1/1/73 tt Total Acree pe r a c r e Statue Rcrnarke
CORR 06
CORR 07
CORR 08
CORR 09
CORR 10
CORR 11
CRUZ 01
CRUZ 02
CRUZ 03
CRUZ 0 4
CRUZ 05
CRUZ 06
DOUX 01
DOUX 02
DOUX 03
DOUX 04
DOUX 05
DOUX 06
DOUX 07
DOUX 08
DOUX 0 9
Projection rnay be high
Data inadequate
Data inadequate
Projection low
Projection low
NO production data
Projeclicn may be high

Cum. Prod.' Proj . Prod. Pro j . Prod. ~ i e l d / W e l l 11 1/73 tJ' Total Acres pcr a c r e Statue Remarks
DOUX 10 13 1 131 40 3
DOUX 11 75, 117 80,532 40 2013
DOUX 12 40, 104 50,943 40 1274
DOUX 13 - - 4 0
P Project ion may be slight- ly high
- No production data
DOUX 14 32,089 45,730 40 1143 P I
DOUX 15 15,668 19,786 40 495 P Project ion probably high
DOUX 16 14,526 - 40 P Data anadequate
DOUX 17 39,851 65,088 40 1627 P
DOUX 18 (Gas) .. DOUX 19 19,081
DOUX ZC 22,802
DOUX 21 11,045
DOUX 22 837
DOUX 23 52,269
ELMA O l * 77,069
ELMA 02* 86,769
ELMA 03* 70,267
ELMA 04* 50,07 1
ELMA 05* 78,789
No oil production
Data inadequate
Data inadequate
Project ion low
Project ion low
Project ion low

I TABLE 41 - Wells: Delaware Mountain Group (Ramsoy) Oil Production (Cont. )
Cum. Prod. Proj , Prod. Proj. Prod, Field; Well 1/1/73 if T o b l Acree per acre S b t u e Remarks I ELMA 068 59,290 59,624 40 149 1 SA Projection low - 1 ELMA 07* 89,416 90,425 40 226 1 P Projection low
ELMA 08* 60,736 66,834 40 167 1 P I P Data inadequate
P Projection high
P Projection low
P Projection high
P Projection iow
P Projection low
P
ELMA 19* 94,537 99,589 4 0 2490 P Projection low
104, 192 113,996 40 2850 P Projection slightly low ELMA 2 l* I
E L M A 22* 9.2, 447 157,810 40 3945 P Projection slightly low I I

- Cum. Prod. Proj. Prod. Proj. Prod.
Field/ Well 1/1/73 -it Total Acrce per acre Status Remarks -- Projection low
Projection low
Prajection low
Projection low
Projection low
Projection low
Projection low
Projection low
NO production data
Projection high
Projcctioil low
Projection low

I ! TABLE 41 - Wells: Dolaware Mountain Group (Ramsey) Oil Production (Cont. )
- . Cum. Prod. Proj. Prod. Pr0.j. Prod.
Field/ Well 1/1/73 it Total Acres p e r a c r e Status Remarks ---
A
P Project ion low
P Project ion low
P Project ion low
ELMA 48* 67,336 68,252 40 1706 P Projection low
ELMA 49* 63,000 69,036 40 1726 SA
ELMA 509 63,03 1 66,240. 40 1656 P P r o j e c t i m slightly low
ELMA 51% 89, 145 91,654 40 229 1 P Project ion slightly low
ELMA 52% 42,757 42,897 4 3 1072 P Project ion low
ELMA 53* 24,992 24,992 40 625 A
ELMA 54* 58,1525 60,077 40 1502 P Projection low
ELMA 55s 35,777 35,835 40 2.96 SA
ELMA 56* 6,416 6,416 40 160 A
ELMA 57* 66,594 66,720 40 1668 P Project ion low
ELMA 58* 44, 149 50,001 40 1250 P
ELMA 59* 80,45 1 86,812 40 2 170 P
FLMA 60* 15,912 24,629 4 0 6 16 S A
MALA O l * 56,307 66,561 40 1664 SA P r o j sction high
MALA OZ* 63,596 67,702 40 lb93 SA


TABLE 41 - Wclle: Delaware Mountain Group (Ramsey) Oil Production (Cont. )
Cum. Prod. Proj. Prod. Proj . Prod. Field/ Well - 1/1/73 ff Total Acres per a c r e Status Remarks
MALA 23* 43,146 - 40 P Project ion high; not used
MALA 24* 30,625 31,717 40 793 P Project ion slightly low
MALA 25+ 1,244 2,814 40 7 0 P Project ion low
MASON 1 2,601 2,601 40 6 5 A
MASON 2 55,6 17 - 40 P Data inadequate
l U O N 3 52,025 58,954 40 * 1474 P Projection low
MASON 4 30,272 34,150 4 0 854 P Projection low
MASON 5 39,Z 19 - 40 - P Data inadequate
MASON 6 1,042 - 40 - P Data inadequate
MASON 7 45,137 - 40 - P Data inadequate
MASON 8 11,849 13,550 40 3 39 P Projection low
NMAS 0 l* 110,995 112,565 40 2914 P Projection low
NMAS 02* 112,360 - 40 P Projection high; not used
NMAS 03* 97,635 - 4 0 P Data inadequate
NMAS 04* 80,651 82,653 4 0 2066 P Projection probably slightly low
NMAS 05;: 99,389 - 4 0 P Data inadequate
NMAS 06* 101,063 107,638 4 0 269 1 P
NMAS 07* 76,476 82,819 40 2070 P Projection slightly high
NMAS 08* 68,730 68,730 4 0 1718 A

---. - - 'l'A:J!,ln; 41 - Wcllu: Dcliiwcrrc Mouolaio Group (ICira~scy) Oil 1'1-otluction (Cc~111. I
-- Cum. Prod. Proj. Prod. Proj. Prod.
Field/Wcll 1/1/73 Total Acrcs per acrc Status Rcnlarlcs
NMAS 098 108,403 - 40 P Projection high; not used
NMAS lo* 100,391 107,549 40 2669 P Projection slightly high j
NMAS l l* 114,909 117,256 40 293 1 P Projection slightly low i NMAS 12* 114,474 114,725 40 2868 P Projection low I
NMAS 13* 87,171 88,013 40 22 00 S A I
NMAS 14* 49,942 49,942 40 1249 A
NMAS 15* 110,311 141,375 40 3534 P
NMAS 16* 1,376 1,376 40 34 A
NMAS 17* 39,260 45,771 40 1144 S A
NMAS 18* 90,204 9 i , 821 40 2296 P Projection slightly low
NMAS 19* 59,367 - 40 P Projection high; not used
NMAS 20*
NMAS 2 1 * NMAS 22*
NMAS 23+
NMAS 24*
NMAS 25*
NMAS 26*
NMAS 27+
A
P Projection high; not used
P Projection low
P Data inadequate
P Pro,jection slightly high
P Data inadequate
P Projection high; not csed N
OD

TABLE 41 - Welle: Delaware Mountain Group (Rameey) Oil Production (Cont, ) I
Cum. Prod. Proj. Prod. Proj. Prod. Field/ Well 1/1/73 ft Total Acree per a c r e Statue Remarks
NMAS 28*
NMAS 29*
NMAS 30*
NMAS 31*
NMAS 32*
NMAS 33+
NMAS 348
NMAS 35*
NMAS 36*
NMAS 37*
NMAS 38*
NMAS 39*
NMAS 40*
NMAS 41*
NMAS 42+
PADU 0 l *
PADU OZ*
PADU 03*
PADU 049
Projection high; not used
Projection low
Projection low
Project ion high
Projection low
Data inadequate
Projection low
Projection sligiltly high
' P Projection high; not used
3 18 A
SA . Production following secondary recovery
1 A
3 15 A

C I I ~ I . Prod. Proj. Prod. Proj. Prod. Ficld/ Well 1/1/73 fi Total Acres per acrc Status Items rks
PADIJ 05* 85,804 94,522 40 2363 SA
PADU 06* 81,159 94,487 40 2362 SA
PADU 07* 2,195 2,195 40 5 5 A
PADU 08* 91,565 107,78 1 40 2695 SA
PADU 09* 84,265 93,320 40 2333 P Projection low
PADU lo* 84,470 98,739 40 2468
PADU 11* 87,603 104,963 40 2624
PADU 128 72,624 73,316 40 1833
PADU 13*
PADU 14*
P A D U 15*
PADU 16*
PADU 17*
PADU 18*
PADU 19*
PADU 20*
PADU 21*
PADU 22*
PADU 23*
PADU 24*
PADU 25*
P Projection high
P
P Projection low
Projection low
Projection high; not used
Projection low
Projection high; not used
Projection low
Data inadequate
Projection low
Data inadequate
Projection low

. . . . I -
TABLE 41 - WeUe: Delaware Mountain Group (Rameey) Oil Production (Cont. )
Cum. Prod. Proj. Prod. Proj . Prod. Field1 Well 111173tf Total Acree per a c r e Statue Remark8
PADU 26* 80,820 88,323 40 2208 P Projection slightly high
PADU 27* 81,294 82,446 40 206 1 P Projcction low
PADU 28% 85,060 85,973 40 2 149 S A
PADU 29* 83,728 85,362 40 2 134 P Projection slightly low
PADU 30+ 78,154 79, 002 40 1975 P Project ion low
PADU 31* 99,035 99,422 40 2486 P Projection low
PADU 328 84,311 - 40 P Data inadequate
PADU 339 82,482 84,064 40 2 102 P Project ion low
PADU 34+ 81,352 82,608 40 2065 P Projection slightly low
PADU 35* 79,449 80,819 4 0 2020 P Projection slightly low
2ADU 36*
PA3U 37*
PALU 38*
PADIJ 39*
PADU 40*
PADU 4 1'1':
PADU 42*
PADU 43*
PADU 44*
P Projection high: not used
P Data inadequate
2118 SA
P Data inadequate
2117 S A
2 132 P Projection high
887 P
258 1 P Projection may be slight- ly high

.. h .-. . -.A. ..,1 n
'I'A\LII& 41 - Wcllsi Dclawrrrc mount ail^ Group (ICainscyJ 011 Procluctioa (Lr11:l. 1
Cum. Prod. Proj. Prod. Proj. Prod. Field/ Well 1/1/73 fi Total Acres per a c r c Status Rcmarks
PADU 45*
PADU 46*
PADU 47*
P%DU 48s
PADU 4944
PADU 509
PADU 51*
PADU 52*
PADU 53*
PADU 549
PADU 55*
PADU 56*
PADU 57*
PADU 58*
PADU 59*
PADU 60*
PADU 6 1 * PADU 62*
Projection low
Projection low
Projection low
Projection low
Projection high; not used
Projection low
Projection low
Projection low
Projection slightly high
PADU 63* 7,759 7,799 40 195 SA

TABLE 41 - Wells: Delaware Mountain Group (Rameey) Oil Production (Cont. )
Cum. Prod. Proj. Prod. Proj. Prod. Field/ Well 1/1/73 f t Total Acrea per a c r e Status Remarks
, PADU 64+ 18,988 21,173 40 ' 52 9 SA
PADU 65* 14,674 19,744 40 494 S A
PADU 66* 5,114 5,114 40 128 A
PADU 67* 6,940 6 ,940 40 174 A
PADU 68* 6 12 6 12 40 15 SA
PADU 69* 4 ,664 5,428 40 136 SA
PADU 70* 45,021 60,883 40 1522 S A Projection low
41,251 - 40 PADU 71* SA Data inadequate
PADU 72* 40,755 ra, boo 4 o 12 15 s A
PADU 73*: (Gas) - - 160 - A No oil production
PADUN 1 1,471 1,471 40 37 A
PADUN 2 23,644 27,617 40 690 P Project ion low
PADUN 3 11,838 12,866 40 322 P Proj<)ction low
P PADUN 4 (Gaa) - 160 - No oii production
PECOS 1 17,180 17,180 40 430 A
PECOS 2
SALA 01
SALA 02
SALA 03

v, . ' . ..-.L: ... .i.. - . 'l'AlJI,l? 41 - Wc1l.g: Dclawaru Mortntain Group ( l b m s c y ) Oil Production (Lofit. )
- - Ctum. Prod. Proj. Prod. Proj. Prod.
Field/ Well 1/1/73 ff ' Total Acrce per acre Status l<cmarIcs
SALA 04 48,739 - SALA 05 63,754 94,446
SALA 06 89,904 100,051
SALA 07 26,542 27,970
SALA 08 5,937 5,937
Data inadequate
Projection high
SALA 09 1, 439 1,439 40 36 A
SALA 10 26,367 26,367 40 659 A
SALA 11 6,888 . 6,888 40 172 A
SALA 12 41,316 86,812 40 2 170 P Projection high
SALA 13 13,056 - 40 P Data inadequate
SALA 14 8,722 - 40 P Data inadequate
TRIS 01 - 40
TRIS 02 23,965 23,9U5 40 599
- No production data
A
TRIS 03 47,190 47,204 40 1180 P Projection slightly low
TRIS 04 8,578 8,578 40 214 A
TRIS 05 3,525 3,525 40 8 8 A
TRIS 06 67,359 80,358 40 2009 P
TRIS 07 43,883 43,883 40 1097 A
TRIS 08 5 1,086 55,566 40 1389 P

. . . . I ) . , . TABLE 41 - Wells: Delaware -Mountain Group (Ramaey) Oil Production (Cont. )
Cum. Prod. Proj , Prod, Proj , Prod. Field/ Well 1/1/73 t) Total Acree p e r a c r e Status Remarks
TRIS 09 - - 40 - No production data
TRIS 10
TRIS 11
TRIS 12
TRIS 13
TRIS 14
TRlS 15
TRIS 16
TRIS 17
WELLh 1
W E L C H 2
W E L C H 3
W E L C H 4
L3JDG 0 1
P Project ion slightly high
P Projectiorl slightly high
- No production data
P Projection slightly high
A
A
A
A
A
A
A
A
A
P: Producing A: Abandoned SA: Abandoned following secondary recovery operations
* Secondary recovery #Except for secondary recovery fields I

Cum. Prod. Proj . Prod. Prod. Proj . Prod. Ficlc' 'Well 1/1/73 tt Total Wells Acree per a c r e Status Remarlcs
Battleaxe * 274,326
Black River 8 3
Bradley * 17,579
Brushy Draw * 197,852
Case Draw 2 5
C o r r a l Canyon * 48,7 17
Cruz * 561,401
Dark Canyon - Double X * 1,635,088
E l M a r * t 10,006,594
Esperanza 26,511
Fenton - Jenning s * 5,761
Loving - Malaga * + 47,092
Data inadequate
Does not include 1970- 1972 projected production. P ro j ec - tion low
No gas production
Secondary recovery, 1969
Dirta inadequate
N3 gas production
PI3 gas production
fjecondary recovery, 1967 - pr imary projection low

TABLE 42 - Fields: Delaware Mountain Group (Rameey) Gaa Production (Cont, ) 1 Cum, Prod. Proj. Prod. Prod. Proj. Prod. !
1/1/73 * Total Status Field/ Well Wells Acres per a c r e I temarks !
i Malaga, North 4,616
Malaga, W e ~ t - Mason, E a s t * 279,745
Mason, North *t 4,900,276
N o gas production
Project ion low
Secondary recovery, 1369 - pr imary projection low
Paduca + t 6,9 14,585 Sccondary recovery, 1968 - Data inadequate
Paduca, East* 7 3 No gas productioll since 1968 ! Projection low 1 i Paduca, North * 333,774
Pecoe * 39,626 No gas production s ince 1969
1 Salado Draw * 630,147
Sulphate Draw 2,022
Tecolote Peak - - 1 40 - A No gas production
Tr i s t e Draw * 341,763 360,066 14 ' 560 043 P Project ion low
Welch 2,250 2,250 4 160 14 A I
W Y ~ - - 1 40 - - No production data ! 1
* Study area fields t Secondary recovery P: Producing A: Ab-.ndone#' IT Except for secondary recovery f i e lds

- Cum. Prod. Proj . Prod. Proj . Prod. Field/Well 1/1/73 t Total Acree pe r a c r e Statue Remarks
-
BATTL 1 45,263 54,891 40 1372 . P
BATTL 2 94,125 - 40 - P Data inadequate
BATTL 3 122,975 - 40 - P Data inadequate
BATTLE 4
BRUS 9 1
BRUS 02
BRUS 03
BRUS 04
BRUS 05
BRUS 06
BRUS 07
BRUS OL]
BRUS .09
BR"S 10
CORR 0 1
CORR 02
CORR 03
CORR 04
CORR 05
CORR 06
249 A
3 34 P
294 P Projection low
80 8 P Projection high
A No gaer productiori
5 6 A
2638 P
Data inadequate
No gas production
No gas production
No qas production
Projection high; not used
Ir
Almost depleted d
L ~ . - - i - - . - I ; L.... i - : ! I ! . . . .- . I I

I TABLE 43 - Welle: Delaware Mountain Group (Ramsey) Gas Production (Cont'd)
Cum. Prod. Proj . Prod. Proj . Prod. Field/Well 1/1/73 t Total Acres p e r a c r e Status Kemarke
CORR 07 2,370 2,511 4 0 6 3 P
CORR 08 1,690 1,690 4 0 4 2 A
CORR 09 9 5 148 40 4 P
CORR 10 3,379 40 P
CORR 11 1,785 1,941 40 4 9 P
CRUZ 01 22,032 22,032 40 551 A
CRUZ 02 122,222 - 40 P
CRUZ 03 150,308 150,541 4 0 3764
CRUZ 04 81,353 81,619 40 2040
CRUZ 05 - - 40
CRUZ 06 145,266 147,579 4 0 3689
DOUX 01 53,736 54,937 40 1371
DOUX 02 93,264 93,264 40 2332
DOUX 03
DOUX 04
DOUX 05
~ o u x 06
DOUX 07
DOUX 08
DOUX 09
DOUX 10
Data inadequate
Project ion high; not ua+d
P r o j e ~ t i o n low
Prbjcct ion low
No productio;l data
Projection low
Project ion low
Project ion low
Data inadequate

- Cunr. l'rod. Proj . Prod. P rp j , Prod. - F'iclcl/Wc.ll 1 /1 /73 Total A c r ee p e r acrc Status Rcmarlce
D@UX 11 89,420 89,420 4.3 2236 P
DOUX 12 55,114 57,792 40 1445 P
W U X 13 - - 4 0 No production data
DOUX 14 87,231 87,399 4 0 2185 P Projection low-
DOUX 15 50,217 50,475 40 1262 P Projection low
B ~ U X 16 166,460 167,225 4 0 4181 P Projection low
DOUX 17 144,253 - 40 P Projection high; not ueed
DOUX 18 (Cae) 378,560 379,274 160 2370 P Projection low
DOUX 19 27,743 - 4 0 P Data inadequate
DOUX 20 137, 514 - 40 P Data inadequate
DOUX 21 21,779 21,779 40 544 A
DOUX 22 I68 168 40 4 A
DOUX 23 92,759 - 40
ELMA O l * 120,755 129,457 40 3236
ELMA 02* -350,830 3 50,86 1 40 . 8772
ELMA 03+ 330,662 337,765 4 0 8444
P Data inadequate
P P r ~ j e c t i o n low
P Projection low
P
Projection low
Project ion low
Data inadequate
Data inadequate

TABLE 43 - Wells: Dclawarc ~ o u n t a i n Group (Ramsty) Gas Production (ContCd)
Cum. Prod. Proj. Prod. Proj . Prod. Field/Well 1/1!73 t Total Acree per acre Statue Remarks
ELMA lo* 3 16,499 364,537 40 911s P Projection low i
ELMA 14* 365,553 - 40 P Projection high; not used I ELMA 159 136,406 - 40 P Projeciion high; not used I
I
40 3369 ELMA 17* 132,062 134, 7'49 P Projection, low
E L M A 18* 260,404 294,754 4 0 7369 P Projection low I I
ELMA 20* 173,697 204,789 40 5 120 P Projection slightly high I E L M A 21* 176,390 181,298 40 4532 P Projection low I
4 0 P Data inadequate
40' 6686 P Prnjec:ian m a y be high
E L M A 25- 248,926 - 4 0 P Data inadequate I
E L M A 28* 225,335 - 40 - P Projection high, not urnad 1 E L M A 29+4 158,517 172,868 4 0 4322 P Projection low I

* , 2 9 2 3 . " : d E % E O O Q O ;" 's td 'Z
E u ; .C Q .c, .? a - 0 , E Z 0
a n d

TABLE 43 - Welle: Delaware Mountain Group (aameey) Gas Production (Contld)
Gum. Prod. Proj. Prod. Proj . Prod. - Field/Well 1/1/73) Tot a1 Acres p e r a c r e Statue Remar* s
ELMA 52* 100,233 100, 597 40 2515 P
E L M A 54* 90,049 90,065 4 0 2252 P Projection low
Data inadequate
Data inadequate
Projection low
No gas production
NO gas production
No gas production
No gas production
No kas production
No gas production
No gas production
No gae production
No gae production

--, -.. * i'Al3LE 43- W clle: Velaware mouncaan uruup \ ~ ~ . r t i ~ ~ ~ ~ I -*, ...-.-- -.- .. \ - - - - - ' - -
Cum. Prod. Proj. Prod. Proj. Prod. Field/Well 1/1/73 t Total Acree per a c r e Statue Remarks - MALA 13* 478 478 40 12 SA
MALA 14* - - - 40 No production data
MALA 15* 801 1,126 4 0 2 8 SA
MALA 16* e , 867 - 4 0 P Data inadequate
No gas production
No gae production
Not run
No gas production
No gas production
No gas production
M A W 23* - - 4 0 P No gas production
MALA 24* 3,102 - 40 No run
MASON 1 - - 4 0 A
MASON 2 30,764 32,219 40 80 5 P
MASON 3 30,203 30,232 40 756 P
No gas production prior to secondary recovery
- No gas production
P r o j e c t i ~ n low
Projection low
MASON 4 11,796 12,185 40 305 P Projection low
MASON 5 15,617 - 40 P Data inadequate i 151,733 177,106 4 0 442 8 P MASON 6 I
MASON 7 34,184 70,050 4 0 175 1 P
MASON 8 5,453 10,632 40 266 P

TABLE 43 - Wells: Delaware Mountain Group (Ramsey) Gaa Production ( ~ o n t ' d ) I I I
Cum. Prod. Proj. Prod. Proj. Prod. Field/Well 1/1/73 Total Acrea per acre Statue Remarke
NMAS 011: 206,409 209,121 40 ' 5,228 P Projection low
NMAS 02* 382,754 385,443 40 9,636 P Projection low
NMAS 03* 197,430 - 40 P . Data inadequate
rMAS 04:k 88,564 88,748 4 0 2,219 P Projection low
NMAS 05* 141,094 146,155 40 3,654 P Projection low - NMAS 06* 212,529 215,838 4 0 5,396 P Projectionlow
NMAS 079 128,028 141,796 4 0 3,545 P
NMAS 08% 87,711 87,711 40 2,193 A
M A S 09* 306,629 322,859 40 8,071 P
NMAS 10;: 233,390 234,862 40 5,872 P Projection low
NM AS 1 1 ::: 84, 529 103,887 40 2,597 P
NMAS 12* 208,342 209,884 40 5,247 P Projection low
W A S 13* 161,449 161,713 40 4,043 SA Projection low
N I ~ A S 14* 39,783 39,783 40 995 A
NMAS 15* 250,652 - 40 - P Data inadequste
W A S 16* - - 4 0 A No gae production
NMAS 17* 51,626 51,991 40 1,300 SA
i
N h A S 18x: 171,045 171,084 40 4,277 P Projection low I
Nh4AS 19* 56,732 - 40 - - p Data inadequate
NMAS 20% 81,466 81,466 4 0 2,037 A N rn
NMAS 21* 23,929 - 40 P Data inadequate VI
NMAS 221:g 9,737 - 40 P Data inadequate
I " . -,,. --

.- . .. .-. . . ' l'
' ,J ' . . 1 A,. r. .
L'ALILE: 43 - Wclls: Dclawnre Maulitaiii Group [Ilarriocy) Lias Prorluctton ( \ . O I I L * U ~
Cum. Prod. Proj. Prod. Proj . Prod. - ~:ic?ld/Wcll 1/1/73 t . Total Acres pcr acre Statue Remiirks
NMAS 239 17,250 21,349 40 534 P Projection low
NMAS 24* 13,673 - 4 0 T Data inadequate
NMAS 25* 44,136 - 40 P Data inadequate
NMAS 27* 26,102 28,390 40 710 P Projection low
W A S 28* 191,699 - 40 P Data inadequate
NMAS 298 21,107 21,375 4 0 534 SA Pro j t ction low
W A S 30* 64,298 79,913 4 0 1,998 P Projection low
W A S 31*
NMAS 32*
NMAS 33s
NMAS 34*
NMAS 35*
NMAS 36s
NMAS 37*
NMAS 38*
W A S 39*
NMAS 40*
NMAS 41*
NMAS 42*
Projection high
Projection low
Projection high: not uaed
Projection low
Data inadequate
Data inadequate
Projection low
Data inadequate
Data inadequate
No gas production I Production after N
secondary recovery UI o\


TABLE 43 - Wells; Delaware Mountain Group (Rameey) Gas Productlon (Cont'd)
Cum. Prod. Proj. Prod. Pro j . Prod . ~ i e l d / W e l l 1/1/73 1. Total Acres per a c r e Statue Remarks
PADU 44* 59,242 63,288 40 1582 P Project ion low
PADU 45*
PADU 46*
PADU 47*
PADU 48*
2ADU 49*
PADU SO*
PADU 519
PADU 528
PADU 53:'
PADU 54*
PADU 55*
PADU 56*
PADU 574'
PADU 58*
PADU 594'
PADU 60*
PADU 61*
PADU 62*
PAUU 63::
PADU 64*
PADU 65*
Project ion low
Projec t ion low
Projec t ion low
Projec t ion low
Data inadequate
Data inadequate
Project ion low
Project ion low
Project ion low
Data inadequate
No gae production
SA Data inadequate
P Data inadequate
SA Data inadequate
SA
173 P Project ion low
194 A
141 SA
575 SA
366 SA Project ion low

I 3: , +,. . TAULlC 43 - Wclle: Dclawarc Mountatn Group (Rnrrloey) Gae Production (Cor.L1dj
Cum. Prod. Proj. Prod. Proj, Prod, F'icld / Well 1 /1/73 t Total Acres per acre Status Remarks
PADIJ 6623 138 138 40 3 A
PADU 67* 402 402 40 10 A
PADU 68* 105 - 40 SA Small production before secondary recovery
PADU 693; 3,690 40 SA Data inadequate
PADU 70'; 135,954 - 40
PADU 71* 138, ldl - 40
SA Data inadequate
SA Data inadequate
PADU 72* 126,018 - 40 SA Data inadequate
PADU 73* (Gas) 6,097 6,097 160 38 A
PADUN 1 23,788 23,788 40 59 5 A
PADUN 2 52,673 62,090 40 1552 P Projection low - PADUN 3 105,410 107,491 . 40 2687 P rrojection low
PADUN 4 150,440 (Gas)
PECOS 1 11,536
PECOS 2 20,090
SALA 01 22,416
SALA 02 4,246
SALA 03 - SALA 04 19,384
SALA 05 24,071
P Projection low
A
P
P Pro-iection low
A
A MG gas production
P Data inadsquate
P P~ojectior, may be high N OI a
j h

N O O Q l b U'Z"9" a' m o o

Cum. Prod. Proj. Prod. Proj. Prod. Ficld/Well 1/1/73 f Total Acres pe r ac re Status Remarka
TRIS 13 19,653 - 40 P Data inadequate
T N S 14 9,021 9,021 40 226 A
TRIS 15 40
TRIS 16 4,177 4,177 40 104
TRIS 17 40,220 40,220 40 1006
WELCH 1 - - WELCH 2 - - WELCH 3 - -
P No gas production
A
A
A No gas production
A No gas production
A No gae production
W E L C H 4 - - 40 A No gas production
UNDG 01 - - 40 A No gas production
* Secondary recovery P: Producing A: Abandoned SA: Abandoned following secondary recovery I- - t Except secondary recovery fields


SECONDARY RECOVERY PROJECTIONS
Limited to that part of the geologic section considered in this
repcrt there are seven fields where secondary recox-ery operations have
been initiated. These fields a re El Mar, Malaga, North Mason, and
Paduca producing from the Ramsey interval of the Delaware Mountain
Group; Dollarhide from the Dewnian; and Tcague-Simpson and
Warren-McKee/Simpeon from the Ordovician. The four Delaware
Mountain Group fields are in the Study area. I n determining the effect
of secondary recovery on yield per acre, field projections were made on
six of these pools. Production at North Mason increased markedly in
1972 and it war impossible to obtain an adequate projection from the
time recondary recovery operations began in 1969. Production up to
1969 had been 2,614,077 barrels for an average yield per acre of 1,634
barrels m d per well of 65,352 barrels. Projected yield based on wells
that had produced up to i 569 indicated an additional 71 6,889 barrels
could be produced under primary recovery. This would give a yield of
2,082 barrels per acre and 83,274 barrels per well. Froduction
declined during the f i rs t three years of secondary recovery opcrationa
with total production amounting to 264,365 barrels frkm a maximum
of 35 wells, for an average per acre yield of 189 barrels and a per well
yield of 7,553 barrels. Total production up to January 1, 1973 has
been 2,878,442 barrels for an average yield for all wells of 71,96 1
barrels and a per acre yield of 1,799 barrels. This is considerablf
below the projected primary recovery but additional data is needed to

determiae the effect on ultimate recovery in this field.
Projection of pr imary recovery a t the El Mar field was
4,564,594 barrels for an average yield per acre of 1,934 barrels,
and per well o i 77,366 barrels. The projection is considered low
based on the rate of production q to 1969 when secondary recovery
ope1 ations began. Production from 1969 to 1973 amounted to 535,420
barrels, well above the additional 320,717 barrels projected -1nder ,
primary recovery. Added production projected under secondary
recovery i s 239,580 barre ls resdting in a total increase over primary
I recovery of 454,283 barrels. Under currelit conditions net recovery
i would be 5,018,877 barre ls fo r a yield of 2,127 barrels per acre, and
85,066 bar re l s per well. The increase over primary production for
the field is therefore only nine percent.
Based on pro jectionr of primary and secondary recovery the
net indicated increase in production a t Malaga is only seven percent.
Projected primary production t ~ a s estimated to be 694.986 barrels
for a yield of 827 barre ls per acre and 33,095 barrels per well.
Analyses of the production data indicate that net .yield8 for this field
will be 894 bar re l s per ac r e and 3 5,748 barre ls per well. The ~ r i o u s
aspects of the project at Malaga a r e not known, but based on recent
prod-action figures the estimates given here would appear to be fairly
reliable.
Paduca i s the largest of the Delaware Mountain Group fields.
Secondary recovery operations began in 1968 and from recovery

estimates determined here the program would seem to be quite
successful. Prociuction up to 1968 amounted to 4,30 3,951 barrels of
oil, and a projected recovery of an additional 1,657,779 barrels. The
estimated primary pzoduction of 5,961,730 barrels for a n average
yield per acre of 2,160 barrels and per well of 86,402 barrels
appeared to be reasonable. Production to January 1, 1973 amounted
to 7,372,208 barrels for a net increase over estimated primary
production of 1.41 0,478 barrels. Projected recovery cnder the present
program is estimated to be. an additional !,840,750 barrels for a net
recovery of 9,212,958 barrels. This would be a yield of 3,338 barrels
pe r acze and 133,521 barrels per well, for an increase in production of
25 percent. Evaluation of recent production data suggests that the
recovery will be higher than this estimate.
A secondary recovery program was initiated at the Dollarhide-
Devolian field in 1962. Up to this time production Fad amounted to
2,581,308 barrels of oil. Projected from 1962 the primary recovery
was estinated at 2,665, 108 barrels for a per acre yield of 3,702
barrels a td a per well yield of 148,062 barrels. Examination of the
production tistory suggests this estimate i s low. It was not possible to
project the po. ential secondary recovery yield at Dollarhide because of
the steady yearl). incr eas e in production plus a considerable increase
in 1972. Produc+iorr to January 1, 1973 was 4,178,920 barrels, an
increase of 1,513,812 barrels ov& the projected primary recovery.
Yield up to 1973 was 5,224 barrels per acre and 208,946 barrels per

well, The net gain over projected primary recovery i s 36 percent up to i I
January 1, 1973. I
The Teagae-Simpson field has had a secondary recovery program I
since 196 5. The projected increase in pro6uction over that of the i
primary recovery projection is 19 percent. This i s based on a primary
production estimated a t 2,134,396 barrels and a projected total recovery I
of 2,638,955 barrels. Pr imary yield was projected at 3,557 barrels ,
pe r acl-e and 142,293 barrels per well, Total recovery i s indicated to
be 4,398 barrels per acre and 175,930 barrels per well,
Warren-McKee/Simpson i s one of the larger fields producing
from the 0 rdodcian, Production up to the time secondary recovery
operations began in 1966 amounted to 15,984,157 barrels of oil.
Projected pr imary yield studies suggested a recovery of 16,994,317
barreIs for a per ac re yield of 9,040 barrels and a per well yield I
of 36 1,581 barrels, Production since secondary recovery operations
began has been 1,827,143 barrels, an increase of 816,983 barrels
over the projected prix&ry recovery for this period. Projected I
ultimate recovery at the current stage of development is 18,175,870
barrels for a yield of 9,668 barrels per acre, 386,721 barrels per
well, and am increase in production over tiq%rimar). projection of ' - seven p rcen r .
In evaluating the effect of these secondary recovery programs
on the ultimate yield for a given field many other factors a re no doubt *
involved. Time for full development of the program would vary just aa

would presaure and injection rates. Each formation would have to be
treated in a different \.ray, and of course the overall economics of
the program would have to be considered. From the d a ~ a presented
here it is not poasitle to determine just what the ultimate increase
in production might be, For the six fields examined the average
increase is estimated to be 19 per zent.
At f?ollar?lidc there was a substantial decrease in production
for the first several years after secondary recovery injections began,
Yearly production then increased f rom 38,953 barrels in 1965 to
467,246 barrels in 1972. The recency of recovery programs in the
Delawrzre Mountain Group might explain the projected low additional
recoveries if there were a lag between initiation of o ~ t r a t i o n s and
substantial increase in production, However, at Paduca production
decreased for only one year and reached a peak in the third year of the
program. Production at Malaga was greatest <uri~,p the first year of
operation and has had a fairly uniform decline since, As noted.
production at North Mason.declined for the first three years and then
increased sharply in 1972. A t El Mar produttlon has declined steadily
for the four years the program has been in operation, Tha Teague field
has been in operation slightly longer than the Delaware Mountain Group
fields. Here production increased with the exception of one year, for
the firat six years but declined rapidly in 1971 and 1972. Production at
Warren averaged 888,009 barrels per year p~eceding the secondary i 4
. recovery program of 1966 and has averaged 26 1,020 barrels since. E.

1965 production was 448,199 barrels, declining to 391,049 bzrrels in I ! 1
1966 and 189,242 barrels in 1972.

PETROLEUM EXPLORATION IN PILOT AREA
From records of the New Mexico Bureau of Mines and Mineral
Resources there have been 37 wells drilled in exploring for oi l o r gas
i n the four township Pilot area (Table 45and fig. 53). As of January 1,
1974 four additional tests were being drilled ir. this area. Exploration
began in 1935 and ?;lp to 1954, 15 shallow wells had been drilled to the
upper part of the Delaware Mountain Group and the Yates and Seven
Rivers formations on the shelf. None of these wells found commercial
amounts of oil o r gas. The f i rs t relatively deep well was drilled in 1954
to the Bone Springs Formation, and this test was followed in 1956 with
the deepest well drilled in the Pilot area; a 16,396 foot test of Silurian/
Devonian. Both of these wells although having fairly good shows of oil
and gas were plugged and abandoned. Through 1963 another 10 wells
were drilled, mostly to the Yates/Seven Rivers zr;;! upper par t of the
Delaware Mountain Group. One test of the Bone Springs and one of the
lower part of the Delaware Mountain Group were drilled in 1962. Results
for a l l these tests were negative other than shows of oil o r gas. In 1964,
in addition to a shallow tes t of the Delaware Mountatn, the second
pre-Permian test was drilled. This well also was drilled to the e
Silurian/Devonian and also had significant shows of oil and gas. No
tests were drilled in the area from 1965 to 1968 when the third well to
the ~ i l u r i a n / ~ e v o n i a n was completed. This test, drilled by Phillips
resulted in the discovery of gas in the Morrow internal. Initial p rod~ct ion

C~~l l r r lsor I Sl~cpllcrd C'trlbcrlsos I Slq~bcrd K i~~~ba l l I l~cdcrill ll~illii~~ I litz Sosll~cn~ Cd. I I:edcril A111il1i I I'ubco Culbcrlgo~r I Dorscl~c klli~li I New Mexico Turllcr I Fedcriil Culbcrlsoa 1 Richards Supcriur I Coverl~ll~cnt Cackle I Federal Phlllips 1 lbl Mcsa Gctty I Elz Jefferr 1 Etz Brlrnson 1 tiat ?.leu Todd I Le~aon Culbcdwn I Brown Gulf 1 San Simon
W~lliom, I Radger Texas Crude 1 \Vright Zonne I Fcdernl A Zonne 1 Federal B Cracc 1 Cotton Baby
6- 1 1-42 8--20-47 6-9-73 7-3-56
1--18-54 6- 16-73 8-10-37 4-27-73 6-6-51
10-1-35 Drilling
12-10-61 6-28-68 2-23-37 7-19-35 7-25-73 5-5-36
2-24735 3-2-62
K IS-22s-31E 9-17-73 P 23-22s-31E 4-25-62 J 24-22s-3 1 E Drilling C 25-22s-3 l E Drilling K34-22s-3 1E Dri!linp
Y& A I >& A
7 0 I Morrow 1' & A PErA .
13,968 Morrow Y & A
13,640 Mor~ow P & A P & A
P & A 13,656 Morrow P & A P & A
13,838 Morrow P & A P & A P & A
Gas Oil Wilcr M y l l l ~ / t i ~ : I I : i c I ~ - - -
80 urdcsig~~rrcd
16,200 S. Sdt b k e
7,514 I i a l Mcsa
3,40 1 Ilat Mcsa
Yales-Sevcn Rivcrs SilurianlDevoniaa Yetus-Scvc~l Rivers Yalzs-SCVCII IUvcrs t81ississippi~n Delaware Yo~es-Seven Rivers
t Bone Springs
hfississippian Delaware 1

Localion Told Top Producing Gor Oil Waler hwcsl WWI S-T-R Complclcd Dcplh Pay For~lwtlon MCFIday Bblddry Bbl Jday Field For~~~rtl ion Tested I
Culbertson 1 Murray J 9-22s-32E 2-24-48 5,035 P& A Delawarc Smilh I Tcxrcu Y 13-22s-J2E 12-3-61 5,070 P & A Delaware Cirpcr 2 Red Tank N 14-22s -32E 12- 12-62 5,030 P & A Delaware Trigg I Jeenings P 18-22S-32E 5-3-61 4,896 P & A Dcl;~ware b w c 1 Bass P 19-22S-32E 6-9-64 4,802 P & A Dclawnrc &IIIIC I Fcdcml G 20-22S-328 1 14-73 14,855 14,556 Morrow 4,945 Morrow Culbcrtwn I Giltnore E21-21s-326 8-1-50 4.R46 P & A . Delswarc Uniou Cnl. 1 Cilmore 1 21-22S-32E 7-16-54 8,770 P & A Uo~le Springs TI is 1 Red Tank E22-22S-32E 5-10-62 7,313 P & A Delaware Culberihw 1 Fee G26-22s-328 4-17-45 4,977 P & A
I : Uelawxc Bass i Perry B 31-22s-32E 3-7-63 4,777 P & A Dclawarc W i l s o ~ ~ 1 Stecher L3 1 -22s-32E 3-7-63 266 P&A Sanlr Rosa Shell I Boutleg Ridge C 36-22S-32E 8-24-64 16,300 P & A Silurian/Dcvoniaq Tidewater 1 Kichardson A36-22S-32E 8-6-62 5.068 P & A Dcldware I
i

- -IT; E. 0 Am~n l
--- R. 32 E. 1 9.
' 0 I Pu~o.
6.. 2 - 4 ( Turnrr t State 3 . 0 I Fad
I
Stondoll nd I Williomson
+Cul bmrtson
Shmll
Grocm I Cotton 0 l Rlchordson I Strckmr
Numbered W e l I s I. Southmrn Col. 1 h d e r o l 6. Culbmrtson I Borsch* IL Zonnm I Federal 2. Phillips I Etz 7. Phil l lps I Hot Ma80 12 Cu lbe r t~on I a i l more 3. Culbrrtson I Shmphmrd 8. Gocblr 1 Fqdrrol I 1 Union Cal. I Gilmorm
I 4 KlmDrl l I Fmdrrol 9. Gmtty I Etz 14. Trigg I Rod Tank
3. Culbrrtson I Shmphmrd 10 Jmffmrs I E tz
. . Fig. 53 Oi l and gas tests dr i l led i n Pi lot areo
9 Show of oi l P11oqgrd and obondonrd 9 Show of ol! ond gos 0 Drl l t lng wmll

f rom this well was 7.5 million cubic feet per day. No further tes t s
ware drilled in the a rea until 1973 when *ix wells were completed.
Three were ririll;d to the Missi~sippian and three to the Morrow.
resulting in two oil well completions and three gas well completions,
all from the Morrow interval.
Exploration of pre-Permian rocks i n the Pilot a rea involves
nine wells with two eonlpleted a s oil wells and four as gas wells for
a wildcat success of 63 percent (excluding the South Salt Lake extension
well). Oil ard/or gas has been o b s e r ~ e d in 49 percent of the tes ts
drilled, exclusive of the YateelSeven Rivers wells in the nortneast
part of the area. Very little of this area has bzen tested thu8 f a r with
117 of the 144 sections involved having had no waUs drilled to explore
for oil o r gas.

WATER LKJECTION AND DISPOSAL WELLS
Based on data obtained from the New hlexico Oil and Gas
Co-ission there werc 30 water injection wells and 32 salt water
disposal wells activein the Study area as of January 1, 1974 (fig. 54).
The only injection wells near the Pilot a:-ea a r e iz the Teas-Yates/
Seven Rivers field in T. 20 S., R. 33 E. Water inthese wells is
injected at relatively shallow depths in back reef deposits. The total
amount of-water injected up to 1974 a~nounted to 965,551 barrels at an
average injection pressure of 1,835 1. s.i. The other secondary recovery
operations in the Study area a r e all in the upper part of the Deraware
Mountain Group at Malaga, Paduca, North Mason, and El Mar. The
largest of these operations is the Paduca pressure maintenanze program
with 13,463,943 barrels of fluid injected at 985 p. s. i.
A l l disposal wells in the Delaware basin a r e injecting water into
the Delaware Mountain Sroap, in most cases into the upper part of this
interval. Water produced with oi l 9' the Brushy Draw, North Mason,
Salado Draw, Triple X, Peco s, T riste Draw, and Bradley fi,elds is
being disposed of either in the Ramsey pay zone o r the underlying Olds
sand. Over 460,000 barrels of salt water at an injection pressure of
650 p. s. i. has been disposed of in the northern Triste Draw well. The
only other wells with appreciable amounts of injected water a r e irz the
Bradley field and one of the North Mason disposal wells.


Fig.54 Study area salt wotw disposal und injection wells as of January I , 1974
0 5 10 miles
.:njec!ion wel l A S c I t w a t e r d i s p o s a l well (SR) O;sooral ir.tnrvol R Rcmsey 8s Bone Sorings
Y Yet- CC Cherry Conyon P Fannsylronion SR Srb -Rivers 0'86 DeI.~*aorc Moontoin &o*ro 0 ~ v o n i o n

Water at Sand Dunes i s produced from the Cherry Caayon
and '8 disposed of in the Delaware Mountain Group in the interval
from 4,390 to 6,048 feet o r possibly, limited to the interval from
5,700 to 5,800 feet. Water at Bell Lake i s produced from the Bone
Springs, Pennsyllrdan, and Devonian and is disposed of in the
Delaware ~ o m - t a i n Group. Disposal depths are from 5,018 to 7,530
feet. Total water injected as of January 1, 1974 was a, 666,567
barrels at an average pressure of 1,080 pal,
, Dispoul wells in the northeist part of the are:. are utilizing
randatones o r reef lixr.estones of the Yates /Seven Rivers intervals
to diapose of water produced primarily from the same intervals. The
exception is the diapoaal well in the Lea field where water i s produced
from the Bone Spr'.ngs and Devonian intervals, Over 17 million barrels
have been disposed of in the Lea well. No data could be found regarding
disposal i n t e n d for the well in T. 20 S,, R. 33 E. and there i s no
record of a well having been drilled at this location.

CONCLUSIONS
The potential oil and gas reservcs for an untested section in
the Pilot area a r e based on geologic.al azd statistical evaluations of
each part of the geologic secticn known tc contain commercial
accumulations of petroleum (Table B). Geological evaluations in
particular a r e subject to vazying hterpretations. In this repcrt
consideration was given to sucE, Tararnetcrs as the occurrence and
number of suitable reservoir and source rocks; the type of trap most
commonly as so ciated with accumulations in a specific part of the
section; the potential for this type of trap being present in the Pilot
area and distribution of known occurrences of oil and/or gas
primarily within the Study ares. Potential far suitable traps, and
particularly structural traps, was the most difficult parameter to
e-.-alua tt . S.=isrnic data would be invaluable in making a lno r e exact
determination fcr petroleum potential in the pre-Permian rocks,
especially the Ordovician and Silurian/Devonian intervals.
Statistfcal evaluations were based primarily on productive
acreage compared with total acreage tested, and wildcat success
ratios. Other factors considered were the occurrence of petroleum,
whether commercial o r not, the number of oil wells versus the
n-mber of gas wells completed for each interval, average production
per well, and oil/associated gas and gas/distillate ratios for each
interval.


The projected stratigraphic section underlying thc center of
the Pilot area (fig. 2) i s iimited tc that part of the section considered
t:, have snme petroleum potential. Thicknesses ar-d depths a re based
on the isopach and structural contour maps presented elsewhere in
this report. At the center of the Pilot area an eqlora tory test of the
.er?tire sedimentary rock section having a potential fur oil and/or gas
a c c m d a t i o n s would require drilling to a dept!~ of rha t e ly
18,000 feet. The shallowest possible occurrence of oil wculd be in
the upper part of the Bell Canyon Formation at a depth oi gvar 4,000
feet, and to penetrate rocks with the highest potential for gas i n the
Pennsylvanian and Silurian/ Devonian would require drilling from
13,000 to 16,000 feet. As shown in Figure 2 the potential oil and/or
gas zones, based on oil and gas wells in the Delaware basin, includes
all of the sedimentary rock section except for those of Ordovician or
Mississippian ages. In addition, within each of these intervals there
is more t h a ~ one potential pay zone.
Although nonproductive in t-he Study area, petrolc*m- bas been
found 'apparently in noncommercial amounts in 63 percent of the few
tests driued into Ordovician rocks. In addition, these a r e suitable
appearing source and reservoir rocks, a posaibili2y of stratigraphic
traps, and oecause of the known presenze of faulted anticliccl structures
in the deeper parts of the Delaware basin, a potential for similar
features being present in the Pilot area. The potential for oil i s
~ o r ~ s i d e r e d very low, in part because of the depth of these rocks, but

also the fact that shows a re limited to gas, z.ad gas and d-htillate.
The gas potential was considered moderate from a statistical
standpoint (Table 46) and given the same adjusted rating although no
attempt was made to give possible reserves per section for the Pilot
area. For comparative purposes the average production of an
Ordovician gas well on the Central Baaia platfotra i 3 5.2 billion cubic
feet.
The atatistical potential for the discovery of oil i n rocks 09
Silurian/Devonian age is very good in the Stcdy area based on aictce,or
ratioo. Average well yields a r e at least twice as great for this interval
compared with any other part of the sedimentary rock section.
Crtologically, potexiidl source and ; .esemir rocks a r e present, depth
does oot appear to be a limiting factor, and there is a possibility of
suitable structural conditions, The apparent restriction on petroleum
accu~puliztion in struc-a1 traps doe- limit both the oil and gas
potential for this interval. The adjusted rating for oil is low because
of the concentration of oil wells iu the northeast p a d of the area,
absence of oil *howe in the rest of the Study area, and the rather low
distillate yield for gas wells of 9.4 barrels per million cubic feet.
The latter point suggests almost complete disasaociatiou of the oil
asd probab;e migration s helfward by updip spilling frcrn gas - filled
.I-Lructures.
Gealogically the gas potential of the Silurian/Devonian i s
favorable from the standpoint of source and reservoir rocks, bu:


limited by lack of data supporting presence of suitable structures
within the Pilot area. Gas occurs on both the east and west flanks
of the Delaware basin indicat2.g good distribution i n the basin.
Statistically, the gas potential is not 2s high a s for Peausylvenian
rocks, but with a 14 percent succe3s ratio from both acreage and
wildcat wells i t is considered high. Although distillate production is
low per million cubic feet the average production of a Silurivn/Devonian
gar well in the Study area i s over 7.5 billion cubic feet resulting in
considerable production of distil'l?te.
There is no oil or gas being produced rocks of Mississippian
age in +he area of t M e report,, and very few fields in other parts of
southeastern New Mexico. From a geological standpoint the possitility
of suitable reservoir *cks is cotlsidered remote and there is a low
occurrence of reported oil or gas shows. The potential i s .therefoi-e
given a very low rating and no adjusted rating ie given for the Pilot
area. It can be argued that some porcntia1 production should be given.
Certainly there are elzitable source rocks both above and below this
interval, and a possibility for porosity and permeability development
through fracturing. Wwever, similar to the Ordovician, distance
from producing fields preclude using projected reserve figures i n this
area.
Based on a n r a g e production per well, and acreage and wildcat
success ratios, Pennsylvanian rocks have a high statistical potential
for oil in the Study area. However, this i s not verified from a regional

standpoint o r completion data which shows only one oil well completed
for every seven gas wells. Geologically the oil potei~tial is considered
moderate because of suitable reservoir rocks, particularly in the
Strawn i n t e n d , and possible presence of both stratigraphic and
structural traps. The recent Morrow oil discoveries within the Pilot
area add considerably to the potential, and a re the reason for the
higher adjusted rating.
The gas potential for the Pennsylvanian i s rated very high from
both a geological an:! statistical evaluakion. 'The multip;lcity of possible
reservoir rocks, the occurrence of gas in both stratigraphic and
structural traps, the numerous potential source rocks, and the widespread
geographic distribution, combined with a high petroleum occurrence in
88 percent of the wells clrilled, 55 percent of the tested acreage having
proven production, and 51 percent of a l l wildcat tests euccessfully
completed, all support the very high rating given this intezval.
Distillate production averages 13.2 barrels per million cxbic feet of gas
adding to the value of a gas well and increasing the possibility of
exploration and discovery in the P i l o t area. Although the projected
potential reserves per section for the Pilot area a r e based on 125 percent
of the projected average recovery, the estimate i s considered
conservative. Much of the development in the Smdy area is so recent
that reserve projections were not possible by methods employed here
and average projected yields in many instances were based on pro8uction
to January 1, 1973. Because of this,average recovery per well for the

Study area was only 3.2 billion cubic feet ,compared with 5.8 billion
cubic feet for al l wells e=luated.
Statistically Wolfcamp rocks rank last in both oil and gas
potential for productive intervals in the Study area. T h e occurrence
of petroleum is a low 23 percent of the wells tested, and average oil
and gas yields per succesofd completion a re below the average for
the area. Adequate testing of the interval however, is considered
questionable even for wells that have penetrated to the potential
Wolfcamp pay zones. Geologically the section ie eomewhzt limited, as
far as possible r e s e r w i r rocks a re concern+d, to a few carbonate beds.
Hawaver, these favorable reservoir rocks a r e fairly widespread
geographically, and the known fields have a good distn3ution pattern
with xnaay occurring on the we st flank of the baain. There would
appear to be no -lid geological reason for rating the gas potential of
these rock3 higher than the oil potenrial.
In adjusting the ratio for Wolfcsmp potential another factor that
was considered was potential value of a Wolfcamp wen. Within the
Study area the average distillate producti~n at 42 barrels per million
cubic feet is more t h a ~ three times that for gas wells producing from
other parts of the section, and associated gas amounts to 11.6 MCF
per barrel of oil, also the highest for the Study area.
Although trap condiiions a re not fully understood for the Bone
Springs Formation they would appear to be in part structurally controlled.
Suitable cap, source, and reservoir rocks occur throughout the interval,

' Z
v 5 i d vertical .listribution of oil increases the overall potential.
)atistically the wildcat and acreage success ratios a r e fairly good
jr the Study area, but current field dis t r ibut i~n indicates commercial
lcumulations of oil concentrated on the east and northeast flank of the
! eiaware basin. The occurrence of oil is below average f o r the il a fdy area, at 39 percent of the wells drilled into this interval. but
j r ve i i production averages a r e exceeded only by those completed 5 6 ! Pcnnr ylvaaian and Silurizn/Devonian racks. Gas +tezttial i s not
f :ted but would have to be considered low inasmuch a s there a r e no gas &
:fiflls completed in thir interval and associated gas amounts to only 1: ' $0 MCF per barrel of oil. The adjusted rating gives a moderate
&- I .. '
' 'kentidl for the discove.ry of oil, and projected reserves for the Pilot i :
are bared on 75 percent of the projected average recoveyy of
.. b for an untested section.
Of oil m a gas bearing stratigraphic units in the E. l r ea the
'$laware Mountain Group. statistically ranks just ahead .P . :* :-?.!Ifcamp and has the lowest per well oil yield. Geologically 2
-hob. i s
, :gerval i s not considered very favorable because of the appa: C . , . +
,$sence of large traps and possibly a v;rtically interconnected . .a ~&rodynamic sygtem that favors oil accumulation in the upper part
the Bell Canyon Formnatiotl. The Delaware Mountain C r o u ~ has a
ratio of associated gas with yields of 0.5 MCF per barrel of oil,
*, possibly suggesting lack of suitable traps. The occurrence of
roleurn is 21 percent compared with the average for the Study a rea
percent.

Geologically the Pilot area is considered favorable for oil
accumulation in the: Ramsey pay zone. Primarily this is because of
the type of stratigraphic t r a r controlling acc~unulation of oil in this
interval, and the potential for similar trap de-relopment an-jwhere in
the depositional area of the u p p r part of the Bell Canyon Formation. *
The occurrence of petrcleum i s a high 62 percent and the Ramsey
has the highest amount of successful acreage versus acres tested,
and ia aecond in wildcat success ratios. The average oil production
per well, b w w e r , is lower than that of the Bone Springs, Pennsylvanian,
and Silurian/Devonian intervals.. The adjusted oil rating is high and
reserve projections for the Pilot area a re based on 100 percent of the
projected yielri per section.
Gae produced with oil averages 1.8 MCF per barrel based on
production data to January 1, 1973. The adjusted reserves for the
Pilot area a r e based on the average of all wells producing from the
Raxnsey interval. Although there a r e a few gas wells in the Study
area only one gas well i s completed for every 40 oil wells. No estimate
VAS attempted for gas and distillate reserves.
The total projected reserves given in Table B indicate a
range of from 559,411 to 1,266,795 barrels of oil: 2,250,829 to
2,967,243 MCF of associated gas; 169,455 to 193,568 barrels of
distillate; and 12,565,558 to 13,576,988 MCF of gas. At first these
calculations might appear high, but it must be considered that an
entire section is being included with a potential of 16 . 1 well locations

- and two to four gas we l l locations. The highest f igure used in
determining r e s e r v e s based o n wildcat success rat ios was 1.44 o i l
% wel ls and'2.O gas wells p e r section. F o r comparison 16 o i l wells
completed i n the Ramsey would, based on average well production,
recover ove r 1,000,000 b a r r e l s of oil, and two Silurian/Devonian I
gas wells ove r 15,000,000 MCF of gas. Where only p a r t of a sect ion
might be withdrawn potential r e s e r v e s m i g h t be prorated, but it is
impor tan t to be aware that mos t fields i n the Study a.rea have stacked I
pay zones and no par t icu lar s t rat igraphic unit could b e eliminated f r o m
consideration. f
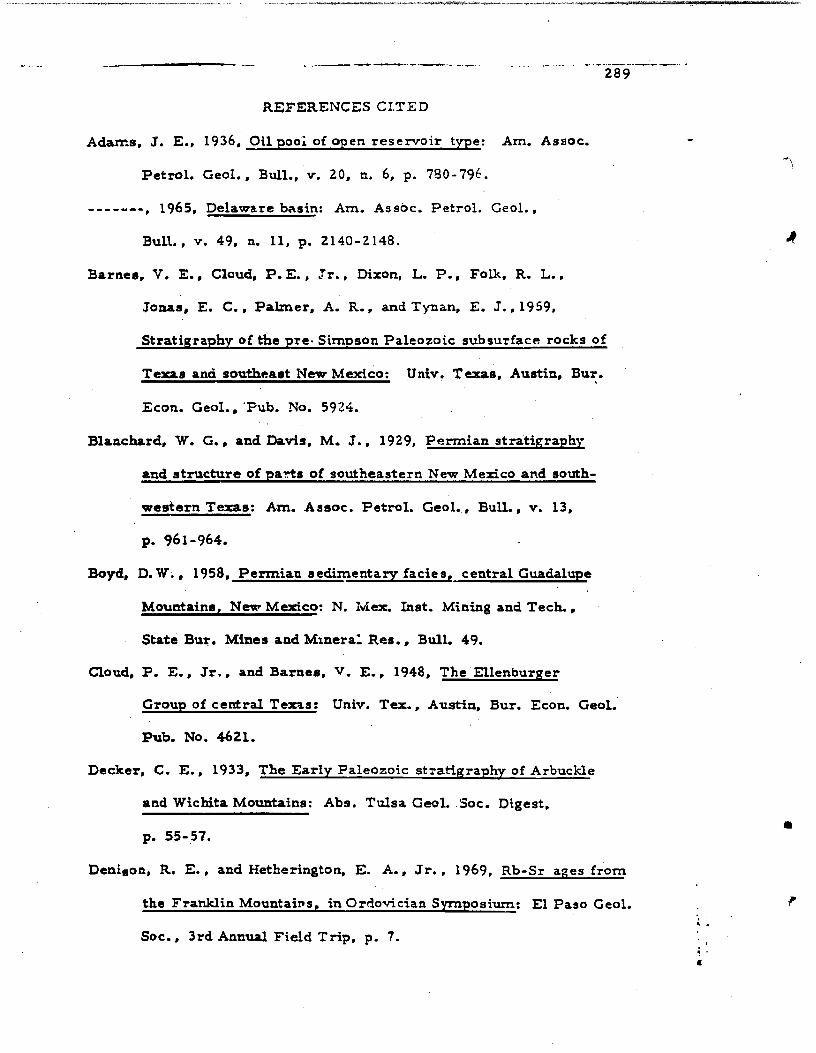
REFERENCES CLTED
Adams, J. E., 1936. O i l pool of open r e s e r v o i r type: Am. Assoc.
Pe t ro l . Geol., Bull., v. 20, n. 6, p. 730-796.
-------, 1965, Delaware basin: Am. Assoc. Petrol . Geol.,
Bull., v. 49. n. 11, p. 2140-2148.
Barnes, V. E., Cloud, P.E., Jr., Dixon, L. P., Folk, R. L..
Jonas, E. C., Pa lmer , A. R., and Tynan, E. J.. 1959,
Strat igraphy of t he pre . Simpson Paleozoic subsurface rocks of
Texas ana southeast New Mexico: Univ. Texas, Austin. Bur.
Econ. Geol., 'Fub. Xo. 5924.
Blanchard, W. G., and Davis, M. J., 1929, P e r m i a n s t rat igraphy
and s t r u c t u r e of p a e s of southeastern New Mexico and south-
wes t e rn Texas: Am. Assoc. Pe t ro l . Geol.,, Bull., v. 13,
Boyd, D. W. , 1958, P e r m i a n s ed imenta ly facie s, cent ra l Guadalupe
Mountains, New Mexico: N. Iviex. Inst. Mining and Tech.,
State Bur. Mines and Minera l Res. , Bull. 49.
Cloud, P. E., Jr., and Barnecl, V. E., 1948, T h e El lenburger
Group of cen t r a l Texas: Univ. Tex., Austin, Bur. Econ. Geol.
Pub. No. 4621.
Decker, C. E., 1933, T h e Ea r ly Paleozoic s t ~ a t i g r a p h y of Arbuckle
and Wichita Mountains: Abs. Tu l sa Ceol. .Sot. Digest,
Denimon, R. E., and Hetherington, E. A., Jr., 1969, Rb-Sr ages f r o m
the Frankl in Mountairs, i n Ordovician Symposium: El Paso Geol.
Soc., 3 r d Annual F ie ld Trip, p. 7.

Entwistle, L. P,, 1944, Manqaniferous i ron ore deposits near Silver I
I
City, New Mexico: N. Mex, Inst. h4ining and Tech. , State Bur.
I
hiines and M i ~ e r a l Resources, Bull. 19.
Flawn, P. T., 1954, Summary of southeast New Me-xico basement
rocks, in Guide:,aok of sodtheastern New Mexico: N. Mex.
Geol. Soc. , Guidebook, 5th Field C o d . , p. 1 14- 1 16.
- - - - - - - , P. T. , 1956, Basement rocks of Texas and southc . ia t S e w
Murico: Umv. Texas, Austin, Bur. Econ. Geol., Rub. NO. 5605.
Flower, R. H. , 1961, Montoya and .related colonial corals: N. Mex.
Inst. Mining and Tech. , State Bur. Mines and Mineral
Resources, Mem. 7.
-------, 1969, E a r l y Paleozoic of New Mexico and the El Paso region,
i n Ordovician Syrnpoeium: El P a s o Geol. Soc. 3rd Annual
Field Tr ip , p. 31-101.
Fos t e r , P.. W., 1959, Precambr ian rocks of the Sacramento Mountains
and vicimty, i n Guidebook i n the Sacramento Mountains of Ote ro
County, New Mexico: Pe rmiaa Basin Sec., Sac. Econ.
Paleontologists and Mineralogists and Roswell Geol. Soc. ,
Guidebook, p. 137- 153. I
Fos te r , R. W., and Stipp, T. F., 1961, - Pre l iminary geologic and
rel ief map of the Precambr ian rocks of New Mexico: N. Mex.
Inst. Minins and Tech., State Bur. Mines and Mineral Resour: ea,
Circ. 57.

Galley, J. E., 1958, Oil and geology in the Permian basin of Texas
and New Mexico, i n Habitat of Oil: Amer. AYSOC. Petrol.
Gcol., p. 395-446.
Gibson, G. R., 1965, Oil and gas ir? southwestern reqio2 - geolsgic
framework, in Fluids in subsurface emrironments: Am. Assoc.
Petrol, Geol., Mem, 4, p. 66-100,
Gusrow, W. C., 1954, Differential entrapment of oil and gas: a
fundamental principle: Amer. Aa soc. Petxsl. Geol. Bull. ,
Haigler, Leon, 1962, Geologic notes on the Delaware basin: N. Mex.
Inst. Mining and Tech, State Bur. Mines and Mineral
Reroutces, Circ. 63.
Haigler, L. B., and Cunningham, R. R., 1972, Structure contour
map on top of the undifferentiated Silurian and Devonian rocks
in southeastern New Mmco: U. S. Geol. Survey, Oil and
Gar Invest. Map OM 2 18.
Harris, R. W., 1957, Ostracada of the Sirnpson Group of Oklahoma:
Okla. Geol. Survey, Bull. 75.
Hillr, J. M. , 1963, Late Paleozoic tectonics and mountain ranges,
wertern Texas to southern Colorado: Am. Asaoc. Petrol.
Geol., v. 47, n. 9, p, 1709-1725.
-------, J. M., 1968, Gas in Delaware and Val Verde Sasins, west
Texas and routhwestern New Mexico, in natural gases of
North America: Am. Assoc. Petrol. Geol., Mem. 9, v. 2,

E l l s , J. M., 1370, Late Paleozoic structural directions in southern
Permian basiri, west Texas ar,d southeastern New Mesico:
Am. A s s c ~ c . Petrol. Ceol., v. 54, a. 10, p. 1807-1827.
Hoimquest, H. J. , 1965, Deep pay3 in Delaware and Val V'rrde basinu,
i n Fluids in subsurface environments: -Am. . A s SOC. Petrol.
Geol., Mem, 4, p. 297-279.
H o ~ e , I?. J., 1959, -- Montoya Group s t r z C ' g ~ a y h y :Or?o+-'l:ian) o f
Trans-Pecos, Texas: Am. Assoc. Petrol. Geol., Bull.,
v. 43, p. 2204-2332.
Ireland, H. A. , 1965, Regional depositional basin and correlations
of the Simpson Group, in Symposium on the Simpson: Tulsa
Geol. Soc. Digest, v. 33, p. 74-89.
Jonee, T. S. , and Smith, H. M. , 1965, Relationshipa of oil cornposition
and s t r a t i g r ~ o h y in the Permiar, bas i s of west Texas and r k w I
Mexico, in Fluids in subsurface environme~ts : Am. P.ssoc. I
Petrol . Geol. , Mem. 4, p. 10:-224.
Krlley, V. C., and Silver, C., 1952, Geology of the Caballo Mow-tains:
N. Mex. Univ., Pub. Geol. Ser. n. 4.
------- , 1971, Geology of the Pecoa country, sorttheasteizi New Mucico: i
N. Mex. hst. ,Mining and Tech. , State Bur. Mines and M i ~ e r d l
Res., Mem. 24.
King, P. B. , 1942, Permian of west Texas and southeast Yew Merico: - A m Assoc. Petrol. Geol., Bull., v. 2 6 , n. 4, p. 535-763.
---- ---, 1948, Geoloqy of the southern Guadalupe Mountaias. Texas:
U. S. Ceol. Survey, Prof. Paper 215. I

King, P. B., and Newell, N. D., 1956 , McComba Limestone Member
of Bell Canyon Formation, GuadaLllpe Mcuntains, Texas:
Amer. Assac. Petrol. Geol., BuLi., v. 40, 3. 2, p. 386-38?.
Kottlowski, F. E., Flower, B. H., Thompson, M. L., a ~ d Foster , R. W . ,
1956, Stratigraphic studies of the Sax, Andrea Mountains. New
Mexico: N. Mex. Inst. Mining and Tech. , State Bur. Mines
a.nd Minezal Resources, Mem. 1.
Kottlowaki, F. E., LeMone, D. V., and Foster , R. W., 1973,
Remnant moudains in Early Ordovician seas of the El P a s o
region, Texas and New M e ~ c o : Geology, v. 1, n. 3, p. 137-140.
Laudon, L. R. , and Bowrher, A. L. , 1941, Mis s is sippian formations
of the Sacramento Mountains New Mexico: Am. Assoc. Petrol.
Geol., Bull., v. 25, p. 2107-2160.
Laudon, L. R. , and Bowsher, A. L., 1949, Mississippian formations
of aouthwesten New Mexico: Geol. Scc. Am, Bull., v. 60,
p. 1-88.
LeMone, D. V., 1969, Lower Paleozoic rocks in the El Paso area,
i n Guidebook of Border Region, Chihuahua and United States:
N. Mer. Geol. Soc. 20th Field Conf.. p. 68-79.
McGlasson, E. H., 1967, The Siluro-De-ranian of west Texas and '
southeast New Madco , in Silurian-Devouian rocks of
Oklahoma and environs: Tulsa Geol. Soc. Digest, v. 35,
p. 148-164.

Meyer, R. F, , 1966, Geology of Pennsylvanian and Wolfcampian rocks 1 i n sou+.heast New Mexico: N. hiex, Inst. M i n i ~ ~ g and Tech.,
State Bur. Miner and Mineral P.es., ~Mem. 17.
Moore, P.. C., and Flrmuner, F. B., 1922, Per.nsyl1ranian s t ~ a t i g r a p h y I
of north-ct?.lrrS Texas: Jaiir.. Geo i , , v. 30, u. 1, p. 18-42. I
Muehlberger, W. R., Denison, R. E., and Lididc, E. G., 1964,
Butied besmnent rocks of the United States anti Canada: .- -,
Advanced Research P ro jec t s Agency, Order No. 180-62.
;vluahlberger, W. R., Hedge, C. E., LSe?lis~n, X . E. , and Marvin, I
I !
R, F. , 1966, Geochronology of the midconcinent region, United ! States, Part 3. Southern area: Jour. Geophys. ~esearch , v. 71, ;
I
no. 22, p. 5409-5426. i .
MueEitberger, W. R., Denison, R. E., and Lidiak, E. C., 1967,
Basement rocks in continental in ter ior of United States:
Amer. Ansoc. Petroleum Geologists, Bull., v. 51, no. 12,
p. 2351-2380.
Paige, S. , 191 1, Mineral resources of the Llano-Burnet region, Texas,
with aF account of the Precambria3 geology: U. S. Geol. Survey,
Bull. 450. I
P r ay , L. C. , 1953, Upper Ordovician and Silurian str2t igraphy of the
Sacramento Mountains: Am. Aaaoc. Petrol . G r o l . , Bull., v. 37,

Pray, L. C., 1361, - G e o l o g of the Sitc:emento Mour.tai~_s escarpment,
Otero County, New Mexico: N. Mex. Imt. Min'ng an2 Tech.,
State Bur. Mir!es and M;rleral Resources, Eull. !5.
Richardson, C. B., 1904, i l zpsr ; of a recon?-.;-::re in trscs-Pceos
Texas, north of the Texas and 2ac;f ic Railway: Texas TJniv.
Mineral Survey Bull. 9.
-------, 1908, Paleozoic formations in T r a n s -Pecos Texas:
Am. Jour. Sd . , 4th ser. , v. 25, p. 475-479.
Roewell Geological Society, 1956, A symposium of o i l and gas fields
of southeastern New Mexico: Roswell Cecl. Soc. - Rorwell Geological Society, 1960, A symposium of o i l a3d gas fields
of eoutheastern New Mexico: Roswell Geol. Soc. , 1960
Supplement.
RosweU Geological Society, 1967, A syrnpr~ai~un of oi l and gas fields
of aoutheastsrn N e v Mexico: Roswell Geal. Soc., 1966
Supplement.
Salisbury, G. P., 1968, Natcra l z a s i n Devonian an2 Silurian rocks
of P e r m i a n basin, west Texas and southeas': New Mexico, in
Natural Gases of North Amcrlca: Am. Assoc. Pe t ro l . Geol.,
Mem. 9, v. 2, p. 1433-1445.
Silver, B. A., and Todd, R. G., 1963, P e r m i a n cycl ic s t r a t a ,
northern Midland and Delaware basi-nnl , West Texas and - southeastern New Mexico: Am. -1ssoc. Pe t ro l . Geol.,
Bull., v. 53, n. 11, p. 2223-2251.

Silverman, S. R., 1965, Migration and segreqation of oi l and gas,
in Fluids in subsurface environments: Am. Aseoc. Petrol.
Geot., Mem. 4, p. 53-65.
Taff, J. A. , 1902, Geology of the Atoka quadrangle, indlan Terri torv:
U. S. G2ol. Survey, Atoka Folio 79.
Thornton, D. E., end Gaston, 13.. H., Jr., 1967, Lusk Strawn field,
i n 3il and gas fields of southeastern New Mexico: Roswell
Geol. Soc., 1967 Supplement, p. 15-20.
Udden, J. A., 1917, Notes on the zeoLom (,i ?-E GZ+=. s hlountainu:
Univ. Texas, Austin, Bull. 1753, p. 38-43.
Wasserburg, G. J., Wetherill, G. W., Silver, L. T. and Flawn,
P. T. , 1962, A study of the ages of the Precambrian of Texas:
Jour. Geophys. Research, v. 67, no. 10, p. 4021-4047.
Wright, JV, F., 1963, Montoya prospects may be better than we
th.isvink: Oi l and Gas Jour. , v. 61, n. 19, p. 142-145. - Ia7lrright, W. F., 1963, Siluro-Devonian rocks offer widespread
prospects: Oil and Gas Jour., v. 61, n. 36', p. 156-159.
--- --- -, 1963, Woodford: source 10% of Fermian basin oil reserves:
Oi lond Gae Jour., v. 61, n. 40, p. 138-190.
Wright, IV. F., 1965, P e t r a l e w . geology of the Simgaon Ciroup, west
Texas and southeast New Mexico, in Symposium of the Simpson:
Tulsa Geol. Sac. Digest, v. 33, p. 62-73.


Reproduced by NTlS National Technical In forma tion Service U.S. Deparfment of Commerce Springfield, VA 221 61
This report was printed specifically for your order from our collection of more than 2 million technical reports.
For economy and efficiency, M IS does not maintain stock of its vast collection of technical reports. Rather, most documents are printed for each order. Your copy is the best possible reproduction available from our master archive. If you have any questions concerning this document or any order you placed with NTIS, please call our Customer Services Department at (703)487-4660.
Always think of NTlS when you want: Access to the technical, scientific, and engineering results generated
.by the ongoing multibillion dollar R&D program of the U.S. Government. R&D results from Japan, West Germany, Great Britain, and some 20
other countries, most of it reported in English.
NTlS also operates two centers that'can provide you with valuable information:
The Federal Computer Products Center - offers software and datafiles produced by Federal agencies.
The Center for the Utilization of Federal Technology - gives you access t o the best of Federal technologies and laboratory resources.
For more information about M I S , send for our FREE NTlS Products and Services Catalog which describes how you can access this U.S. and foreign Government technology. Call (703)487-4650 or send this sheet t o NTIS, U.S. Department of Commerce, Springfield, VA 22 1 6 1. Ask for catalog, PR-827.
Name Address
Telephone
- Your Source to U.S. and Foreign Government Research and Technology.