Phylogenomic study of spiral-horned antelope by cross-species chromosome painting

Research ArticleA Phylogenomic Census of Molecular FunctionsIdentifies Modern Thermophilic Archaea as the MostAncient Form of Cellular Life
Arshan Nasir,1 Kyung Mo Kim,2 and Gustavo Caetano-Anollés1
1 Evolutionary Bioinformatics Laboratory, Department of Crop Sciences, and Illinois Informatics Institute,University of Illinois at Urbana-Champaign, Urbana, IL 61801, USA
2Microbial Resource Center, Korea Research Institute of Bioscience and Biotechnology, Daejeon 305-806, Republic of Korea
Correspondence should be addressed to Gustavo Caetano-Anolles; [email protected]
Received 6 July 2013; Revised 20 November 2013; Accepted 17 January 2014; Published 31 August 2014
Academic Editor: Celine Brochier-Armanet
Copyright © 2014 Arshan Nasir et al. This is an open access article distributed under the Creative Commons Attribution License,which permits unrestricted use, distribution, and reproduction in any medium, provided the original work is properly cited.
The origins of diversified life remain mysterious despite considerable efforts devoted to untangling the roots of the universal treeof life. Here we reconstructed phylogenies that described the evolution of molecular functions and the evolution of species directlyfrom a genomic census of gene ontology (GO) definitions. We sampled 249 free-living genomes spanning organisms in the threesuperkingdoms of life, Archaea, Bacteria, and Eukarya, and used the abundance of GO terms as molecular characters to producerooted phylogenetic trees. Results revealed an early thermophilic origin of Archaea that was followed by genome reduction eventsin microbial superkingdoms. Eukaryal genomes displayed extraordinary functional diversity and were enriched with hundreds ofnovel molecular activities not detected in the akaryotic microbial cells. Remarkably, the majority of these novel functions appearedquite late in evolution, synchronized with the diversification of the eukaryal superkingdom. The distribution of GO terms insuperkingdoms confirms that Archaea appears to be the simplest and most ancient form of cellular life, while Eukarya is the mostdiverse and recent.
1. Introduction
The tripartite nature of the cellular world is well established,with living organisms divided into three distinct life forms:Archaea, Bacteria, and Eukarya. Collectively, these groups arealso referred to as the three “domains” or “superkingdoms” oflife [1, 2]. Both Archaea and Bacteria are unicellular akaryoticmicrobes that generally lack a nucleus, mitochondria, andsome membrane-bound organelles commonly found in theeukaryotic cells. Despite considerable morphological simi-larities between Archaea and Bacteria, they are recognizedas distinct superkingdoms due to the presence of uniqueribosomal proteins [3], differences in the composition andstereochemistry of cell wall lipids (glycerol-ether in Archaeaversus glycerol-ester in Bacteria) [4, 5], and dissimilar DNAreplication apparatus [6], habitats, and interactions withother cells [7]. Members of the archaeal superkingdomare generally found in extreme environments such as high
temperatures and/or saline conditions (e.g., Methanopyruskandleri i.e., capable of surviving at 122∘C [8]). In contrast,bacterial species are more widespread and are commonpathogens. The superkingdom Eukarya includes a diversegroup of both unicellular and multicellular organisms thatcontainmanymembrane-bound organelles (e.g., the nucleus)and complex cytoplasmic structures (e.g., cytoskeleton). Inaddition to the three generally accepted superkingdoms,recent studies also point to the existence of a fourth “super-group” comprised of viruses with medium-to-large genomes(e.g., mimiviruses and megaviruses [9]). Thus giant virusescould be representatives of an ancient cellular mode of lifethat is distinct from extant cellular life forms [10].
Despite the fact that the three-domain classification ofcellular life is widely accepted, the evolutionary relationshipsbetween the three superkingdoms remain largely unresolved.Initial phylogenetic studies based on ancient paralogousgenes proposed a sister relationship between Archaea and
Hindawi Publishing CorporationArchaeaVolume 2014, Article ID 706468, 15 pageshttp://dx.doi.org/10.1155/2014/706468

2 Archaea
Eukarya, both derived from a basal bacterial group. In factthis “canonical” rooting of the tree of life (ToL) has beenrecovered in a number of phylogenetic studies based on genesequences (e.g., ATPases [11] and elongation factors [12]).Theuse of gene sequences in global phylogenetic analysis, how-ever, has been challenged due to their inability to fully resolvethe very deep basal relationships in the ToL (e.g., see [13]and references therein). In comparison, molecular structuresare more conserved and robust than gene sequences [14].For example, phylogenetic studies involving more conservedevolutionary characters such as structures of protein domains[15–19], tRNA [20, 21], 5S rRNA [22], RNase P [23], tRNAparalogs [24–27], and more recently molecular functions[28, 29] consistently identified Archaea as the most ancientsuperkingdom, while Bacteria and Eukarya formed derivedsister groups.
Here, we revisit the evolutionary relationships betweenthe three superkingdoms by reconstructing phylogeniesusing a novel and relatively understudied set of phylogeneticcharacters. We utilized the functional information of geneproducts defined by the gene ontology (GO) database [30,31] as molecular characters to distinguish cellular speciesthat have been fully sequenced. The GO is structured intothree main hierarchies: (i) molecular function, (ii) biologicalprocess, and (iii) cellular component. Each of these hierarchiesdescends into multiple levels in the form of directed acyclicgraphs (DAGs), where child GO terms can be associatedwith multiple parent terms and vice versa. The GO termsat higher hierarchical levels generally represent more broadfunctions (e.g., “catalytic activity [GO: 0003824]”), whileterms at lower and terminal levels represent more special-ized activities (“ferredoxin-NADP+ reductase activity [GO:0004324]”). Thus, GO hierarchies are consistent with thegenerally accepted assumptions that ancient molecules weremultifunctional with broad specificity (i.e., comparable tohigher level GO terms), while modern molecules representhighly specialized functions (terminal GO terms) [32–34].Therefore, the structure of GO hierarchies and their intimateassociation with organism physiology makes them strongcandidates for use in phylogenetic studies [35]. GO termsare however structured as DAGs and are therefore prone toconvergent evolution as one child GO term can havemultipleparents.This factor could complicate phylogenetic inferenceswhen GO terms are used as phylogenetic characters. Tominimize the effects of such non-vertical evolutionary pro-cesses structured by the DAGs, we sampled only the terminalGO terms of the molecular function hierarchy (hereinafterGOTMF terms) (Figure 1), as they represent the most special-ized molecular activities of the cell and provide integrativeviews about organism physiology. To further protect fromhorizontal gene transfer (HGT) that is believed to occurin microbial species with high frequency [36], we excludedGOTMF terms from the analysis that were identified as prob-able subjects for HGT. The analysis yielded phylogenies anddistributions that described novel patterns in the evolutionof cells and were compatible with traditional classifications,thereby supporting the choice of GOTMF terms as molecularcharacters in evolutionary studies. Results revealed an earlythermophilic origin of the archaeal superkingdom, global
trends of genome reduction inmicrobial superkingdoms, andsignificant expansion of eukaryal diversity late in evolution.
2. Materials and Methods
2.1. Data Retrieval and Manipulation. Recently, we usedGO terms in an ahistorical (i.e., non-evolutionary) andphylogenomic exercise to report the evolution of moderncells [28, 29]. Here, we reused the dataset to confirmthe inferences drawn in [28, 29] by conducting specificanalyses on the origin and spread of GO terms in mod-ern cells. Details about data extraction and manipulationcan be found in [28, 29]. Specifically, we downloadedthe Gene Ontology Association (GOA) files for a total of1,595 organisms from the European Bioinformatics Institutewebsite (http://www.ebi.ac.uk/GOA/proteomes, November2009). We filtered organisms that were redundantly present,excluded multiple strains of the same bacterial species keep-ing only the type strains, and used a threshold of 50% cover-age (i.e., number of proteins assigned toGOTMF terms dividedby the total number of proteins) to exclude low qualitygenomes from the analysis. We also excluded GOA files fororganisms exhibiting either facultative parasitic or parasiticlifestyles as they coevolve with their hosts and introducebiases into the global phylogenomic analyses [17, 18]. Organ-ism lifestyles were studied using various online resourcessuch as the genomes online database (GOLD) [37, 38] andpreviously published data [39]. This reduced the dataset to249 free-living organisms including 45 Archaea, 183 Bacteria,and 21 Eukarya (See Table S1 in Supplementary Material isavailable online at http://dx.doi.org/10.1155/2014/706468). Atotal of 2,039 nonredundant GOTMF terms were detected inthe genomes of these organisms.
2.2. Exclusion of HGT-Acquired GO𝑇𝑀𝐹
Terms. We identified72 archaeal and bacterial genomes from our dataset thatwere cross-listed in the horizontal gene transfer database(HGT-DB) [40]. Protein sequences from these genomeswere retrieved from the HGT-DB and compared with thecorresponding GOA files. Specifically, we extracted the GOannotations for horizontally transferred proteins (HTPs) forgenomes common in our GOA files and in HGT-DB.This setof GOTMF terms was likely acquired by HGT.
For confirmation purposes, we performed a statisticalhypergeometric distribution test to determine what HGT-acquired GOTMF terms were significantly enriched in ourdataset (see [35, 41] for details). This resulted in the identi-fication of 115 GOTMF terms that were potential candidatesfor HGT. The exclusion of HGT-acquired GOTMF termsresulted in the final dataset of 249 free-living genomes anda repertoire of 1,924 GOTMF terms. We note that resultingdataset was likelyminimally affected byHGT (and other non-vertical evolutionary processes) because both the parasiticorganisms and the GOTMF terms most likely acquired viaHGT were excluded from the analysis. Moreover, phyloge-netic and network studies confirmed that once the HGT-derived characters were excluded, the resulting phylogeniesperformed in a way superior to traditional sequence-based

Archaea 3
(2) Normalized abundance values
Root GO
Network at multiple levels
Terminal GO terms
Gene products
.
.
.
.
9 31071. . . . .. . . . .
. . . . .
. . . . .
.
.
.
.
A 1 7 0 V. . . . .. . . . .
. . . . .
. . . . .
(3) Character coding in alpha-numeric format (e.g., 0 to 9 and A to V)
Trees of life
Molecular function
9 1 7 0 31 . . . . . . . . . .
. . . . . . . . . .
A 1 7 0 V . . . . . . . . . .
. . . . . . . . . .
Trees of functions
(4) Specification of ancestral character state (e.g., 0 to V)
(5) Maximum parsimony
(1) Matrices representing the genomic
f1 f2 f3 f4 f5
f1f2f3f4f5
f1 f2 f3 f4 f5
f1 f2 f3 f4 f5f1f2f3f4f5
p1 p2 p3 p4 p5
Association between p and f
ith genome
ith genome
ith genome
ith genome
census of GOTMF terms in genomes
Figure 1: Overview of the phylogenomic methodology. A matrix of raw census of GOTMF terms was normalized, standardized, and rescaledfor phylogenetic reconstruction. Trees of functions (ToFs)were polarized bymaximumcharacter state (i.e., V)while trees of lifewere polarized(ToLs) by the minimum value (0) in the matrix.
trees and had minimal conflict [29]. The dataset howeverretains the evolutionarily deep proteome-shaping effects ofendosymbiotic events that likely tailored the eukaryotic cell.
2.3. Phylogenomic Analysis. We used previously describedmethodology to reconstruct trees of functions (ToFs) andToLs portraying, respectively, the evolution of GOTMF termsand species [19, 29, 35, 42]. We first counted the number oftimes each GOTMF term was present in every genome andgenerated amatrix representing the census ofmolecular func-tions in genomes (Figure 1). The raw counts of the genomicabundance of each GOTMF term in every genome (𝑔ab) werelog-transformed to account for unequal genome sizes andheterogeneous variances and then divided by the maximumabundance value (𝑔max) in the matrix. The standardizedcounts were then rescaled from 0 to 31 using an alphanumericformat (0–9 and A–V) to allow compatibility with PAUPphylogenetic reconstruction software (ver. 4.0b10) (Figure 1)[43]. The equation below describes the data manipulationprocedure [16, 19]:
𝑔ab norm = Round[ln (𝑔ab + 1)ln (𝑔max + 1)
] ∗ 31. (1)
Maximum parsimony (MP) was used to search for themost parsimonious tree describing the evolution of ToFs andToLs with minimum possible character changes. We notethat MP performs superior to maximum likelihood whendealing with multistate phylogenetic characters evolvingunder different evolutionary rates [44] (e.g., GOTMF termsthat are accumulated in genomes at different evolution-ary rates). Moreover, normalization and rescaling of rawabundance values into 32 possible character states ensurecompatibility with PAUP∗ and reduce the likelihood ofconvergent evolution. Phylogenetic trees were intrinsicallyrooted using the Lundberg method that places the root atthe most parsimonious location without any outgroup taxaspecification [45].
For the ToFs, we assumed that the most abundantmolecular function appeared first in evolution (i.e., we rootedtrees by maximum value in the matrix by specifying V as theancestral character state) [35]. In contrast, ToLs were rootedby the smallest value in the matrix (i.e., character state 0)under the assumption that the ancestral genome had verylimited functional capabilities and it progressively enhancedits repertoire ofmolecular functions [17, 18, 29].The reliabilityof phylogenetic trees was evaluated by 1,000 bootstraps. Treeswere visualized using Dendroscope ver. 3.2.7 [46].
4 Archaea
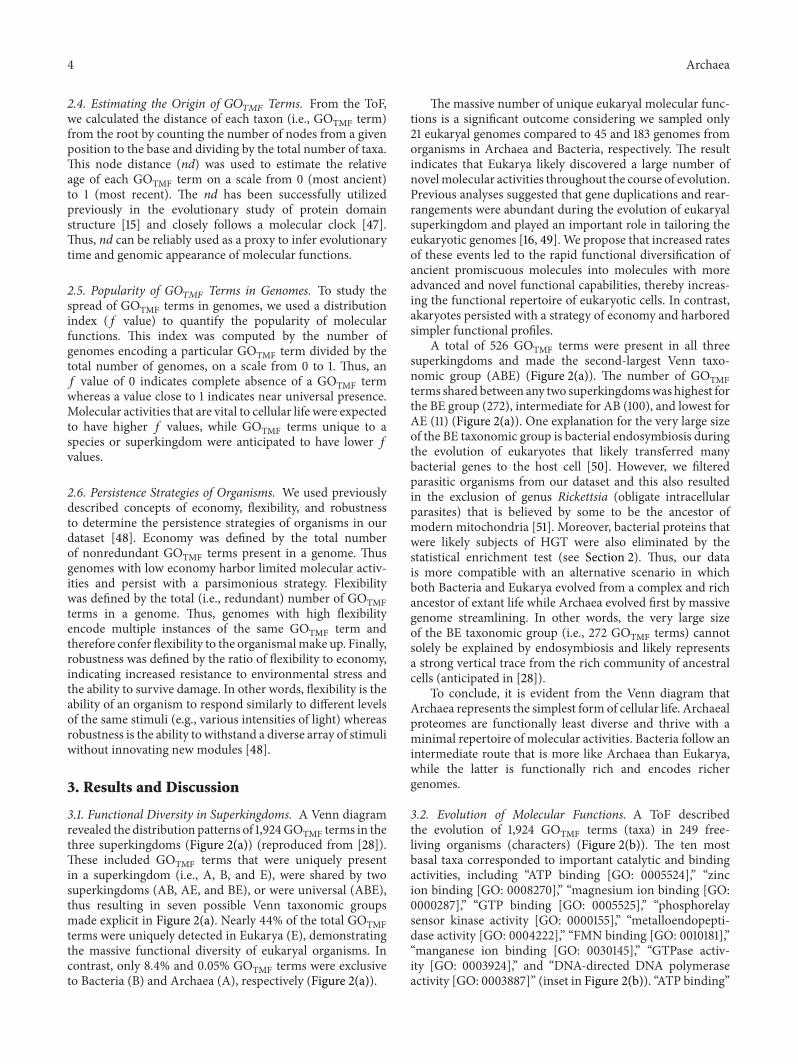
2.4. Estimating the Origin of 𝐺𝑂𝑇𝑀𝐹
Terms. From the ToF,we calculated the distance of each taxon (i.e., GOTMF term)from the root by counting the number of nodes from a givenposition to the base and dividing by the total number of taxa.This node distance (nd) was used to estimate the relativeage of each GOTMF term on a scale from 0 (most ancient)to 1 (most recent). The nd has been successfully utilizedpreviously in the evolutionary study of protein domainstructure [15] and closely follows a molecular clock [47].Thus, nd can be reliably used as a proxy to infer evolutionarytime and genomic appearance of molecular functions.
2.5. Popularity of GO𝑇𝑀𝐹
Terms in Genomes. To study thespread of GOTMF terms in genomes, we used a distributionindex (𝑓 value) to quantify the popularity of molecularfunctions. This index was computed by the number ofgenomes encoding a particular GOTMF term divided by thetotal number of genomes, on a scale from 0 to 1. Thus, an𝑓 value of 0 indicates complete absence of a GOTMF termwhereas a value close to 1 indicates near universal presence.Molecular activities that are vital to cellular life were expectedto have higher 𝑓 values, while GOTMF terms unique to aspecies or superkingdom were anticipated to have lower 𝑓values.
2.6. Persistence Strategies of Organisms. We used previouslydescribed concepts of economy, flexibility, and robustnessto determine the persistence strategies of organisms in ourdataset [48]. Economy was defined by the total numberof nonredundant GOTMF terms present in a genome. Thusgenomes with low economy harbor limited molecular activ-ities and persist with a parsimonious strategy. Flexibilitywas defined by the total (i.e., redundant) number of GOTMFterms in a genome. Thus, genomes with high flexibilityencode multiple instances of the same GOTMF term andtherefore confer flexibility to the organismalmake up. Finally,robustness was defined by the ratio of flexibility to economy,indicating increased resistance to environmental stress andthe ability to survive damage. In other words, flexibility is theability of an organism to respond similarly to different levelsof the same stimuli (e.g., various intensities of light) whereasrobustness is the ability to withstand a diverse array of stimuliwithout innovating new modules [48].
3. Results and Discussion
3.1. Functional Diversity in Superkingdoms. A Venn diagramrevealed the distribution patterns of 1,924GOTMF terms in thethree superkingdoms (Figure 2(a)) (reproduced from [28]).These included GOTMF terms that were uniquely presentin a superkingdom (i.e., A, B, and E), were shared by twosuperkingdoms (AB, AE, and BE), or were universal (ABE),thus resulting in seven possible Venn taxonomic groupsmade explicit in Figure 2(a). Nearly 44% of the total GOTMFterms were uniquely detected in Eukarya (E), demonstratingthe massive functional diversity of eukaryal organisms. Incontrast, only 8.4% and 0.05% GOTMF terms were exclusiveto Bacteria (B) and Archaea (A), respectively (Figure 2(a)).
The massive number of unique eukaryal molecular func-tions is a significant outcome considering we sampled only21 eukaryal genomes compared to 45 and 183 genomes fromorganisms in Archaea and Bacteria, respectively. The resultindicates that Eukarya likely discovered a large number ofnovelmolecular activities throughout the course of evolution.Previous analyses suggested that gene duplications and rear-rangements were abundant during the evolution of eukaryalsuperkingdom and played an important role in tailoring theeukaryotic genomes [16, 49]. We propose that increased ratesof these events led to the rapid functional diversification ofancient promiscuous molecules into molecules with moreadvanced and novel functional capabilities, thereby increas-ing the functional repertoire of eukaryotic cells. In contrast,akaryotes persisted with a strategy of economy and harboredsimpler functional profiles.
A total of 526 GOTMF terms were present in all threesuperkingdoms and made the second-largest Venn taxo-nomic group (ABE) (Figure 2(a)). The number of GOTMFterms shared between any two superkingdomswas highest forthe BE group (272), intermediate for AB (100), and lowest forAE (11) (Figure 2(a)). One explanation for the very large sizeof the BE taxonomic group is bacterial endosymbiosis duringthe evolution of eukaryotes that likely transferred manybacterial genes to the host cell [50]. However, we filteredparasitic organisms from our dataset and this also resultedin the exclusion of genus Rickettsia (obligate intracellularparasites) that is believed by some to be the ancestor ofmodern mitochondria [51]. Moreover, bacterial proteins thatwere likely subjects of HGT were also eliminated by thestatistical enrichment test (see Section 2). Thus, our datais more compatible with an alternative scenario in whichboth Bacteria and Eukarya evolved from a complex and richancestor of extant life while Archaea evolved first by massivegenome streamlining. In other words, the very large sizeof the BE taxonomic group (i.e., 272 GOTMF terms) cannotsolely be explained by endosymbiosis and likely representsa strong vertical trace from the rich community of ancestralcells (anticipated in [28]).
To conclude, it is evident from the Venn diagram thatArchaea represents the simplest form of cellular life. Archaealproteomes are functionally least diverse and thrive with aminimal repertoire of molecular activities. Bacteria follow anintermediate route that is more like Archaea than Eukarya,while the latter is functionally rich and encodes richergenomes.
3.2. Evolution of Molecular Functions. A ToF describedthe evolution of 1,924 GOTMF terms (taxa) in 249 free-living organisms (characters) (Figure 2(b)). The ten mostbasal taxa corresponded to important catalytic and bindingactivities, including “ATP binding [GO: 0005524],” “zincion binding [GO: 0008270],” “magnesium ion binding [GO:0000287],” “GTP binding [GO: 0005525],” “phosphorelaysensor kinase activity [GO: 0000155],” “metalloendopepti-dase activity [GO: 0004222],” “FMN binding [GO: 0010181],”“manganese ion binding [GO: 0030145],” “GTPase activ-ity [GO: 0003924],” and “DNA-directed DNA polymeraseactivity [GO: 0003887]” (inset in Figure 2(b)). “ATP binding”

Archaea 5
A (1)
B (162)
E (852)
AB (100)
AE (11)BE (272)
ABE (526)
Archaea (638)
Bacteria (1,060)
Eukarya (1,661)
Total GO terms = 1,924Archaeal genomes = 45 Bacterial genomes = 183Eukaryotic genomes = 21
(a)
Root
1000.0
Taxa: 1,924 terminal GO termsCharacters: 249 free living genomes
ABE GO terms
Non-ABE GO terms
GO: 0004715
GO: 0005524 (ATP binding)
GO: 0008270 (zinc ion binding)
GO: 0000287 (magnesium ion binding)
GO: 0005525 (GTP binding)
GO: 0000155 (phosphorelay sensor kinase activity)
GO: 0004222 (metalloendopeptidase activity)
GO: 0010181 (FMN binding)
GO: 0030145 (manganese ion binding)
GO: 0003924 (GTPase activity)
GO: 0003887 (DNA-directed DNA pol activity)
RI = 0.74, g1 = −0.25
(b)
Figure 2: The distribution and evolution of GOTMF terms. (a) A Venn diagram illustrates the sharing patterns of molecular functions in theseven taxonomic groups (reproduced from [28]). Numbers of terms inVenn taxonomic groups and in superkingdoms are given in parenthesesand are reflected by the areas of the diagram. (b) A ToF (tree length = 99,594 steps) portraying the evolution of GOTMF terms. Molecularactivities present in all three superkingdoms are colored red while those unique to a superkingdom or shared by at most two are colored blue.The inset displays the most basal taxa. GO: 0004715 is the “nonmembrane spanning protein tyrosine kinase activity.”
was the most ancient molecular function while “nonmem-brane spanning protein kinase activity [GO: 0004715]” themost derived (Figure 2(b)). The majority of the universalGOTMF terms occupied deep positions in the phylogeny (redcircles), while molecular activities unique to or shared by atmost two superkingdoms (i.e., AB, AE, and BE taxonomicgroups) appeared late (blue circles) and were derived fromthe ancient molecular functions (Figure 2(b)). The very earlyappearance of metabolic functions matches results fromprevious evolutionary studies of protein domain structureand molecular functions (e.g., [15–17, 35]).
To unfold the order of appearance of molecular functionsin evolutionary time, we calculated a node distance (nd)representing the relative age of each GOTMF term directlyfrom the ToF (see Materials and Methods). We plottedthe nd values of GOTMF terms against a distribution index(𝑓), defined by the total number of genomes encodinga GOTMF term divided by the total number of genomes,
to study the popularity and distribution of GOTMF termsin superkingdom groups (Figure 3). The nd versus 𝑓 plotrevealed remarkable and unprecedented evolutionary pat-terns (Figure 3(a)).
The majority of the most ancient molecular functions(0 ≤ 𝑛𝑑 ≤ 0.2) were universally present (red circles)with remarkably high 𝑓 values (Figure 3(a)). In fact, atotal of 26 GOTMF terms had an 𝑓 equal to 1 indicatingubiquitous presence in all the genomes that were sampled(Table 1). These universal GOTMF terms correspondedto fundamental catalytic and binding activities that arecrucial for life such as binding to ATP [GO: 0005524],DNA replication [GO: 0003887], cleavage of RNA-DNAhybrids [GO: 0004523], unwinding of DNA strand beforereplication and transcription [GO: 0003917], biosyntheticactivities of aminoacyl-tRNA synthetases [GO: 0004813,GO: 0004815, GO: 0004820, GO: 0004821, GO: 0004824,GO: 0004826, GO: 0004831], and others listed in Table 1.

6 Archaea
Age (nd)
Dist
ribut
ion
inde
x (f
)
0.0 0.2 0.4 0.6 0.8 1.0
0.0
0.2
0.4
0.6
0.8
1.0
(a)
Taxo
nom
ic g
roup
s
ABE
BE
AE
AB
A
B
E
1
3
2
7
9
8
6
4
5
Age (nd)0.0 0.2 0.4 0.6 0.8 1.0
(b)
Figure 3: Order of the evolutionary appearance of Venn taxonomic groups. (a) Scatter plot highlighting the distribution of GOTMFterms with respect to evolutionary time (nd) and distribution in genomes (𝑓). (b) Boxplots displaying the distribution of GOTMF termswith respect to evolutionary time (nd) in the seven taxonomic groups. The most ancient GOTMF term in each taxonomic group (andoutliers) is indexed with numbers 1, “ATP binding [GO: 0005524]”; 2, “DNA replication origin binding [GO: 0003688]”; 3, “penicillinbinding [GO: 0008658]”; 4, “2,3,4,5-tetrahydropyridine-2,6-dicarboxylate N-succinyltransferase activity [GO: 0008666]”; 5, “UDP-N-acetylmuramoylalanyl-D-glutamyl-2,6-diaminopimelate-D-alanyl-D-alanine ligase activity [GO: 0008766]”; 6, “chorismate lyase activity[GO: 0008813]”; 7, “CCR1 chemokine receptor binding [GO: 0031726]”; 8, “methylenetetrahydromethanopterin dehydrogenase activity [GO:0030268]”; and 9, “nicotinamine synthase activity [GO: 0030410]”.
Table 1: List of universal GOTMF terms present in all 249 sampled genomes, sorted by nd values (ascending) (modified from [28]).
GO Id GO Name Age (nd) Distribution Index (𝑓)GO:0005524 ATP binding 0 1GO:0008270 zinc ion binding 0.005 1GO:0000287 magnesium ion binding 0.009 1GO:0005525 GTP binding 0.014 1GO:0004222 metalloendopeptidase activity 0.023 1GO:0010181 FMN binding 0.028 1GO:0030145 manganese ion binding 0.033 1GO:0003924 GTPase activity 0.038 1GO:0003887 DNA-directed DNA polymerase activity 0.042 1GO:0004252 serine-type endopeptidase activity 0.047 1GO:0003746 translation elongation factor activity 0.052 1GO:0009982 pseudouridine synthase activity 0.056 1GO:0004523 ribonuclease H activity 0.103 1GO:0004826 phenylalanine-tRNA ligase activity 0.108 1GO:0004821 histidine-tRNA ligase activity 0.127 1GO:0004820 glycine-tRNA ligase activity 0.127 1GO:0004824 lysine-tRNA ligase activity 0.136 1GO:0004831 tyrosine-tRNA ligase activity 0.150 1GO:0004618 phosphoglycerate kinase activity 0.169 1GO:0004634 phosphopyruvate hydratase activity 0.174 1GO:0004749 ribose phosphate diphosphokinase activity 0.174 1GO:0003952 NAD+ synthase (glutamine-hydrolyzing) activity 0.178 1GO:0004815 aspartate-tRNA ligase activity 0.183 1GO:0004807 triose-phosphate isomerase activity 0.183 1GO:0004813 alanine-tRNA ligase activity 0.188 1GO:0003917 DNA topoisomerase type I activity 0.192 1

Archaea 7
Remarkably, all these universal GOTMF terms appearedvery early in evolution (𝑛𝑑 < 0.2) (Table 1) and beforethe appearance of superkingdom-specific GO terms (readbelow). The list indicates the last universal commonancestor had a cell-like make up with complex catalyticmachinery already present, as suggested by previous studiesof protein domains and molecular functions [17, 18, 35].
However, f started to drop with the progression of nd andapproached 0 at nd 0.45. We observed that a considerablefraction of BE (blue circles) and AB (green) GOTMF termsappeared before 𝑛𝑑 = 0.45, suggesting that reductiveevolutionary processes were at play (Figure 3(a)).We proposethat very early in evolution the probability of one lineagecompletely loosing a GOTMF term was greater than theprobability of the other two lineages acquiring the sameGOTMF term concurrently. Thus, appearances of BE andAB taxonomic groups most likely represented complete lossevents of GOTMF terms in Archaea and Eukarya (resp.,) thatstarted to occur very early in evolution (read below). Incontrast, B (black), E (grey), A (orange), and AE (antiquebronze) GOTMF terms appeared predominantly during thelate evolutionary period (𝑛𝑑 > 0.45). Eukaryotes, in partic-ular, discovered amassive number of novel GOTMF terms latein evolution, thereby compensating for the early reductiveevents.
The boxplots in Figure 3(b) confirmed the appearanceorder of taxonomic groups in evolution. The first molecularactivity to appear in evolution was “ATP binding [GO:0005524]” at 𝑛𝑑 = 0 (Figure 3). The ABE taxonomic groupranged from 𝑛𝑑 = 0 to 𝑛𝑑 = 1 and was followed bythe appearances of BE, AB, B, E, A, and AE, in that order(Figure 3(b)). Although, few members of the AB taxonomicgroup appeared earlier than BE, they were identified asoutliers and were likely candidates of HGT that occurredbetween Archaea and Bacteria later on in evolution (e.g.,“penicillin binding [GO: 0008658]”) (Table 2 for outliers, alsoread below). Thus, the BE group probably appeared beforethe AB group signaling the first complete loss event of aGOTMF term in any superkingdom. This intuition is also inline with previously published analyses that also proposedevolution of Archaea by primordial genome reduction events(e.g., [15, 52]). Our results therefore support the early splitof Archaea from an evolving world of primordial organismsby following a path to genome reduction that ultimately ledto the poor representation of GOTMF terms in the archaealtaxonomic groups (i.e., A, AE, and AB) of the Venn diagram(Figure 2(a)).
The first molecular functions unique to the BE groupwere “DNA replication origin binding [GO: 0003688],”“[acyl-carrier-protein] S-malonyltransferase activity [GO:0004314],” and “FMN adenyltransferase activity [GO:0003919].” These three GOTMF terms appeared jointly at𝑛𝑑 = 0.24 (boxplot for BE in Figure 3(b)). As stated above,this event also represents the first complete loss event of aGOTMF term in Archaea. It is interesting to note that noneof the archaeal proteins were annotated to the GO: 0003688GOTMF term in our dataset. Interestingly, archaeal genomeslack homologues of replication proteins that play important
roles in regulating the initiation of DNA replication (e.g.,Hda, YabA, Dam, or SeqA) [53]. An alternative explanation,though less likely, is the use of relatively low quality GO datafor archaeal genomes. Archaea are understudied comparedto Bacteria and Eukarya and this could reflect in missingcrucial GO annotations for archaeal organisms. However,we discovered that GO coverage did not vary significantlyamong superkingdoms. For example, mean GO coveragein Archaea was 57%, which was not so far away from 60%coverage in both Bacteria and Eukarya (Table S1). Thus,complete absence of GO: 0003688 in Archaea is biologicallysignificant and merits future work in the identification ofarchaeal homologs of bacterial and eukaryal proteins.
GOTMF terms unique to superkingdoms started to appearlate in evolution (𝑛𝑑 > 0.4), first in Bacteria at 𝑛𝑑 =0.41 (“chorismate lyase activity [GO: 0008813]”), then inEukarya at 𝑛𝑑 = 0.45 (“CCR1 chemokine receptor binding[GO: 0031726]”), and finally in Archaea at 𝑛𝑑 = 0.47(“methylenetetrahydromethanopterin dehydrogenase activ-ity [GO: 0030268]”) (Figure 3(b)). “chorismate lyase activity”is important for the removal of pyruvate from chorismate andwas first studied in Escherichia coli and other Gram-negativebacteria [54, 55]. “CCR1 chemokine receptor binding” activityis important during inflammatory responses to injuries andpathogens [56] and appeared uniquely in Eukarya at 𝑛𝑑 =0.45. Finally, the archaeal-specific GO term (“methylenete-trahydromethanopterin dehydrogenase activity”) is involvedin folic acid biosynthesis and was first studied in the hyper-thermophilic archaeal species Methanobacterium thermoau-totrophicum [57]. We also note that the AE taxonomic groupappeared soon after the appearances of the A and E groups at𝑛𝑑 = 0.48 (“nicotianamine synthase activity [GO: 0030410]”)indicating that Archaea and Eukarya were more similar toeach other with respect to “modern” molecular activities(𝑛𝑑 > 0.47) relative to the more ancient ones [58].
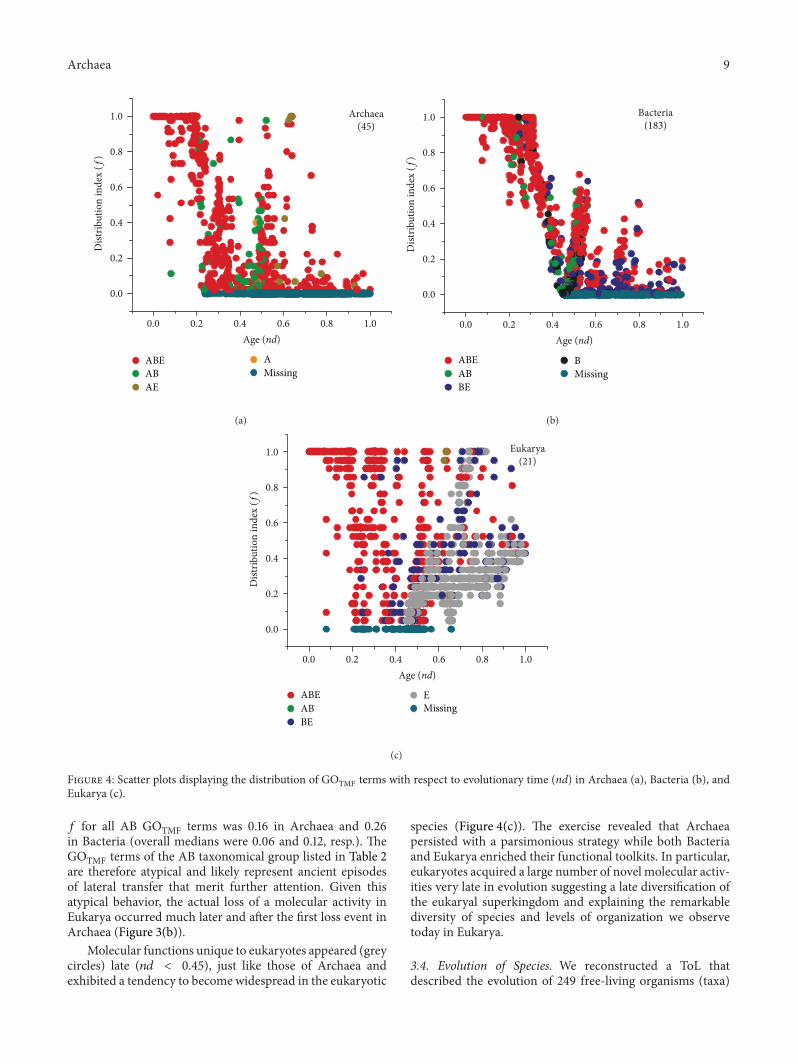
3.3. Global Tendencies in Superkingdoms. The 𝑛𝑑 versus 𝑓plots for individual superkingdoms confirmed earlier pat-terns (Figure 4). A total of 55 GOTMF terms had an 𝑓of 1 indicating their ubiquitous presence within Archaea(Figure 4(a)). However, 𝑓 started to drop rapidly with anincrease in 𝑛𝑑. The first complete loss event was recordedat 𝑛𝑑 = 0.23 for three GOTMF terms “DNA replicationorigin binding,” “[acyl-carrier-protein] S-malonyltransferaseactivity,” and “FMN adenyltransferase activity” (cyan circlesin Figure 4(a)). The GOTMF terms unique to A and AEappeared later in evolution (𝑛𝑑 > 0.45) and were distributedwith low 𝑓 values (Figure 4(a)).
In Bacteria, 56 GOTMF terms were universally presentin the bacterial genomes (𝑓 = 1) and had ancient origins(𝑛𝑑 < 0.31).The𝑓 value started to drop and reached 0 at 𝑛𝑑 =0.45 when the first complete loss event for “CCR1 chemokinereceptor binding” was recorded. Alternatively, this molecularactivity was likely never gained by the bacterial genomesand appeared uniquely in Eukarya conferring immunologicalcapabilities to eukaryotic cells. The distribution of molecularfunctions in Bacteria was remarkably similar to the globaldistribution (Figure 3(a)), where most of the ancient GOTMFterms were distributed with significantly higher 𝑓 values,

8 Archaea
Table 2: List of outlier GOTMF terms in superkingdom taxonomic groups.
Taxonomicgroup GO Id GO Name Age
(nd)DistributionIndex (𝑓)
ABE GO:0003810 protein-glutamine gamma-glutamyltransferase activity 0.97 0.06ABE GO:0004715 non-membrane spanning protein tyrosine kinase activity 1 0.18AB GO:0008658 penicillin binding 0.08 0.76AB GO:0015415 phosphate ion transmembrane-transporting atpase activity 0.21 0.85AB GO:0009030 thiamine-phosphate kinase activity 0.21 0.69AB GO:0008966 phosphoglucosamine mutase activity 0.22 0.76AB GO:0015412 molybdate transmembrane-transporting atpase activity 0.22 0.66AB GO:0019134 glucosamine-1-phosphate N-acetyltransferase activity 0.23 0.66AB GO:0008881 glutamate racemase activity 0.23 0.65AB GO:0008763 UDP-N-acetylmuramate-L-alanine ligase activity 0.24 0.73AB GO:0008784 alanine racemase activity 0.24 0.73AB GO:0008760 UDP-N-acetylglucosamine 1-carboxyvinyltransferase activity 0.25 0.61AB GO:0008965 phosphoenolpyruvate-protein phosphotransferase activity 0.25 0.57AB GO:0008984 protein-glutamate methylesterase activity 0.25 0.59AB GO:0000286 alanine dehydrogenase activity 0.27 0.48
AB GO:0016960 ribonucleoside-diphosphate reductase activity, thioredoxindisulfide as acceptor 0.28 0.53
AB GO:0008855 exodeoxyribonuclease VII activity 0.31 0.72AB GO:0009381 excinuclease ABC activity 0.31 0.80
B GO:0008766UDP-N-acetylmuramoylalanyl-D-glutamyl-2,6-diaminopimelate-D-alanyl-D-alanine ligaseactivity
0.24 0.73
B GO:0008961 phosphatidylglycerol-prolipoprotein diacylglyceryl transferaseactivity 0.25 0.64
B GO:0008832 dGTPase activity 0.26 0.55B GO:0009002 serine-type D-Ala-D-Ala carboxypeptidase activity 0.31 0.60B GO:0008882 [glutamate-ammonia-ligase] adenylyltransferase activity 0.36 0.41B GO:0008914 leucyltransferase activity 0.36 0.45B GO:0019146 arabinose-5-phosphate isomerase activity 0.38 0.31B GO:0019143 3-deoxy-manno-octulosonate-8-phosphatase activity 0.38 0.33B GO:0004456 phosphogluconate dehydratase activity 0.38 0.23B GO:0008693 3-hydroxydecanoyl-[acyl-carrier-protein] dehydratase activity 0.38 0.22B GO:0008918 lipopolysaccharide 3-alpha-galactosyltransferase activity 0.66 0.01B GO:0030733 fatty acid O-methyltransferase activity 0.66 0.00
AE GO:0004579 dolichyl-diphosphooligosaccharide-protein glycotransferaseactivity 0.77 0.10
AE GO:0004965 G-protein coupled GABA receptor activity 0.93 0.05
while the more derived ones distributed with smaller values(Figure 4(b)).
Finally, Eukarya exhibited remarkable variability in thespread of GOTMF terms. A total of 125 GOTMF terms wereuniversally present in the eukaryotic genomes spanning the𝑛𝑑 range from 0 to 0.8 (Figure 4(c)). The first complete lossevent occurred at 𝑛𝑑 = 0.08 when “penicillin binding”activity was lost from the eukaryotic genomes. However, asexplained previously, this GOTMF term was an outlier inthe AB taxonomic group (boxplot for AB in Figure 3(b))and most likely represented a lateral acquisition event that
occurred between akaryotic microbes. In fact, the term wasuniversal in Bacteria (𝑓 = 1.0) but rare in Archaea (detectedin only ∼10% archaeal species) (Figures 4(a) and 4(b)). Thissuggested a late gene transfer from Bacteria to Archaea, oncebacterial species appeared in the evolutionary scene. Similarpatterns of transfer were also evident in other GOTMF termsof ancient origin (𝑛𝑑 < 0.3) of the AB group. Remarkably, theaverage 𝑓 of these ancient GOTMF terms was 0.31 in Archaeaand 0.83 in Bacteria. This suggested that ancient GOTMFterms were laterally transferred from Bacteria to Archaea,and not vice versa. We observed that the overall average
Archaea 9
0.0 0.2 0.4 0.6 0.8 1.0
0.0
0.2
0.4
0.6
0.8
1.0
Dist
ribut
ion
inde
x (f
)
Age (nd)
Archaea(45)
ABEABAE
AMissing
(a)
Bacteria(183)
ABEABBE
BMissing
0.0 0.2 0.4 0.6 0.8 1.0
0.0
0.2
0.4
0.6
0.8
1.0
Dist
ribut
ion
inde
x (f
)
Age (nd)
(b)
Eukarya(21)
EMissing
0.0 0.2 0.4 0.6 0.8 1.0
0.0
0.2
0.4
0.6
0.8
1.0
Dist
ribut
ion
inde
x (f
)
Age (nd)
ABEABBE
(c)
Figure 4: Scatter plots displaying the distribution of GOTMF terms with respect to evolutionary time (nd) in Archaea (a), Bacteria (b), andEukarya (c).
𝑓 for all AB GOTMF terms was 0.16 in Archaea and 0.26in Bacteria (overall medians were 0.06 and 0.12, resp.). TheGOTMF terms of the AB taxonomical group listed in Table 2are therefore atypical and likely represent ancient episodesof lateral transfer that merit further attention. Given thisatypical behavior, the actual loss of a molecular activity inEukarya occurred much later and after the first loss event inArchaea (Figure 3(b)).
Molecular functions unique to eukaryotes appeared (greycircles) late (𝑛𝑑 < 0.45), just like those of Archaea andexhibited a tendency to become widespread in the eukaryotic
species (Figure 4(c)). The exercise revealed that Archaeapersisted with a parsimonious strategy while both Bacteriaand Eukarya enriched their functional toolkits. In particular,eukaryotes acquired a large number of novel molecular activ-ities very late in evolution suggesting a late diversification ofthe eukaryal superkingdom and explaining the remarkablediversity of species and levels of organization we observetoday in Eukarya.
3.4. Evolution of Species. We reconstructed a ToL thatdescribed the evolution of 249 free-living organisms (taxa)

10 Archaea
1000.0
Taxa: 249 free-living genomesCharacters: 1,924 GO terms
61100
∗
∗
RI = 0.58, g1 = −0.90
Pyrococcus furiosusPyrococcus abyssi
Pyrococcus kodakaraensisThermococcus gammatoleransThermococcus sibiricus
Thermococcus onnurineusHyperthermus butylicus
Thermofilum pendensDesulfurococcus kamchatkensis
Staphylothermus marinus
(a)
0.4
0.6
0.8
1.0
1.2
2.02.2
2.42.6
2.83.0
3.2
4.03.6
3.22.8
2.4
Robu
stnes
s
Economy Flexibilit
y
Archaea (paraphyletic)
Eukarya (monophyletic)Bacteria (monophyletic)
(b)
Figure 5:The tripartite division of the cellular world. (a) A ToL (tree length = 87,892) generated from the genomic census of GOTMF terms in249 free-living genomes resolves the three primary superkingdoms. Archaeal species (red) occupy the most basal positions in a paraphyleticmanner, whilemonophyletic Bacteria (blue) and Eukarya (green) are evolutionarily derived. Numbers on branches indicate bootstrap supportvalues. (b) A 3D-scatter plot dissects organisms into three superkingdoms: Archaea, Bacteria, and Eukarya. Genomes are labeled as in (a).
using the repertoire of 1,924 GOTMF terms as phyloge-netic characters (Figure 5(a)). In agreement with the resultsobtained from ToFs, the ToL obtained from the genomiccensus of molecular functions suggested an ancient origin ofArchaea and the late appearances of Bacteria and Eukarya(Figure 5(a)). Archaeal species occupied the most basalpositions in a paraphyletic manner while both Bacteria andEukarya formed monophyletic groups. The monophyleticeukaryal clade was highly supported (100% bootstrap).The most basal ToL taxa corresponded to thermophilic
and hyperthermophilic archaeal species (e.g., Desulfurococ-cus kamchatkensis, Thermofilum pendens, Staphylothermusmarinus, Hyperthermus butylicus, along with species belong-ing to genera Thermococcus and Pyrococcus) suggesting athermophilic origin of cellular life (inset in Figure 5(a)).However, the paraphyletic rooting of the ToL in Archaeademands an explanation. Our data showed that paraphylywas a consequence of an uneven distribution of GOTMFterms in archaeal genomes. The differential patterns ofloss of molecular functions in archaeal organisms were

Archaea 11
evident in Figure 4(a). This suggested that the last commonarchaeal ancestor was likely more complex than any of theextant archaeal genomes [59]. Perhaps, streamlining themolecular repertoire was better suited for nascent archaeallineages when adapting to harsh environments on Earth.This “divergence-by-isolation” scenario could result in aparaphyletic snapshot of archaeal history in modern treereconstructions.
We discovered thatmajor archaeal groups, Crenarchaeotaand Euryarchaeota, did not form cohesive groups. This is inconflict with a previously published phylogeny of archaealspecies based on concatenated ribosomal proteins [60]. Asexplained above, non-cohesiveness of major archaeal phylacould be explained by the patchy distribution of GOTMFterms in archaeal genomes. An alternative explanation isthe limited sampling of archaeal species in our study. Atthe time of the analysis (Nov 2009), only 45 free-livingarchaeal organisms (mostly extremophiles) with >50% GOcoverage were available for evolutionary study. Since then,our knowledge about Archaea has expanded considerablywith the discovery of many mesophilic archaeal species. Itwill be important to includemore archaeal genomes in futurestudies for verification purposes. Therefore we caution thatpatterns reported in the study are the most likely scenariosdrawn from our data but crucially present a “functional”perspective to the evolution of modern cells that is differentfrom the gene-centric sequence-based perspectives.
To further confirm the early origins of the archaealsuperkingdom and inspired by a model of persistence strate-gies for cellular diversification [48], we calculated metricsfor economy (total number of unique GOTMF terms ina genome), flexibility (total redundant number of GOTMFterms in a genome), and robustness (ratio of flexibility toeconomy) for all genomes in our dataset. These metricsdescribe strategies of deployment of molecular functionsnecessary for persistence as organisms sense and adapt tothe environment. When plotted together in a 3D-scatterplot, archaeal genomes (red circles) occupied positions inclose proximity to the origin indicating greatest economybut least flexibility and robustness (Figure 5(b)). In contrast,bacterial genomes exhibited intermediate levels of economy,flexibility, and robustness and were tightly clustered. Thisindicated that functional constraints on bacterial specieswereremarkably conserved. The eukaryal genomes displayed thelowest levels of economy but the greatest levels of flexibilityand robustness and were distributed with greatest variability(Figure 5(b)).The exercise further strengthened the hypothe-sis that eukaryotes persist by fostering functional complexitywhile akaryotic microbes foster economy.Moreover, Archaearepresent the simplest form of cellular life and appeared firstin evolution.
3.5. Comparison with Competing Hypotheses. Our experi-ments predicted a thermophilic origin of diversified life (alsoanticipated in [61–63]) and challenged theories attributingthe origin of life in colder environments (e.g., [64]). Theresults also did not support the origin of eukaryotes by fusionor interaction of two akaryotic cells [50, 65, 66]. Instead,our data show that the primordial stem line was enriched
in molecular activities and gave birth first to Archaea, thenBacteria, and finally Eukarya (Figure 3). Eukaryal genomeslikely retained many of the ancient molecular activities thatwere progressively lost from akaryotic microbes. Akaryotescompensated this loss by adapting to harsh environments andenjoying rapid growth cycles, possibly under pressure fromcellular raptors and RNA viruses [59]. The eukaryal lineagediversified much later and possibly after the endosymbiosisof already diversified bacterial species. Our data is thus alsoincompatible with the hypothesis suggesting that eukaryotesoriginated from within Archaea (based on gene sequences)([67]; see [59] for critique). In turn, the new ToL supportedpreviously published analysis of similar kind where the useof conserved protein domain and RNA structures led totopologies favoring an ancient thermophilic origin of thearchaeal superkingdom and the three-domain topology [15,17].
More generally, our phylogenies are incompatible withpreviously published phylogenies from gene sequences thatdo not take into consideration the heterogeneous historyof individual protein domains and their associated molec-ular functions. We argue that phylogenies built from genesequences do not truly reflect the evolutionary history ofentire organisms. We note that gene sequences are proneto high rates of mutations [68] and suffer from a numberof phylogenetic artifacts including problems resulting fromsequence alignments, insertions/deletions, and interactionsof sequence sites to produce domain structures thus violatingthe assumption of character independence (discussed indetail elsewhere [13]).Thus, genes and their sequences cannotbe considered conserved evolutionary units and do notmake reliablemarkers for phylogenetic studies involving deepcomparisons. In contrast, protein domain structures aremoreconserved than gene sequences and have been utilized in thepast to reliably uncover very deep evolutionary relationshipsamong superkingdoms [15–18]. Our phylogenies based on thegenomic census of molecular functions are also compatiblewith the protein domain and RNA structure phylogenies andthus should be considered equally robust. Most importantly,GO terms approximate the physiology of an organism andtruly depict a ToL (e.g., [29]). Furthermore, the use ofterminal GO terms increases the resolution not only inthe most basal branches of the ToL (a large number ofancient GOTMF terms had very high 𝑓 values thus providingan extended set of conserved characters) but also in thevery derived (terminal terms represent highly specializedmolecular functions that may not be conserved across alltaxa). In light of these considerations, our finding thatthe root of cellular life is in thermophilic Archaea is asignificant outcome that is supported by sound evolutionaryand technical considerations.
3.6. Reliability of Our Study. In this study, we used GO termsthat were both manually and electronically curated withoutreference to their evidential codes.We have shown previouslythat different evidence codes lead to similar tree topologiesand, consequently, do not compromise our conclusions (e.g.,[35]). Our study is also robust against the effects of the
12 Archaea
50% GO coverage threshold as organisms with varying GOcoverage (Table S1) were still well positioned in the ToL(Figure 3) and unequal sampling of taxa from superking-doms [18]. However, it relies heavily on the current GOannotations and information about organism lifestyles. GOdefinitions are constantly updated and new relationships areintroduced. Moreover, the fundamental assumption behindthe evolutionary groupings of organisms and GO history isthe existence of shared and derived patterns in the occurrenceand abundance of their molecular functions, which complieswith Weston’s generality criterion of character polarization[69] and is hardly unreasonable. These factors should betaken into consideration when interpreting our conclusions.We expect however that phylogenomic patterns describedin this study will remain robust with data growth and thatsignificant revisions would be unlikely.
The phylogenetic characters used in this study are GOterms that provide ontological definitions linked to proteinstructures and gene products. Compared to other availablemolecular characters (e.g., gene sequences), these definitionsbetter approximate the physiology of organisms and providethe ideal set of characters to make systemic evolutionarystatements at organism level. Molecular functions are alsorefractory to problems of evolutionary reticulation; they aretightly linked to domain organization in proteins [49], whichis minimally affected by convergent evolution [70]. We havepreviously used GO terms to study their evolutionary impacton cells (e.g., [28, 29]). The novelty here was to dissect theirorigin and spread in major superkingdoms. This exerciseprovides strong support to previously conducted comparativefunctionomic analysis [28] and a ToL reconstructed from thecensus of GO terms [29].
We note that forces that govern the evolution of genesand proteins are also applicable to the evolution of molecularfunctions. For example, gene duplication followed by neo-functionalization can create functional novelty [71]. Recently,Bacteria were shown to “rewire” metabolic networks by loss(rather than gain!) of functionswhen facedwith environmen-tal stress [72].This implies that both gain and loss of functionsmay be important in akaryotes. Another useful contributionto the functional repertoire comes from HGT [73]. Thiswas demonstrated with an example of transfer of “penicillinbinding”molecular activity fromBacteria toArchaea. Finally,de novo gene creation cannot be underappreciated. Novelgenes enhance the functional capabilities in cells, especiallyin eukaryotes. Another selective pressure that may trigger theappearance of new functions is the pressure of pathogens,especially RNA viruses. RNA viruses mutate at much higherrates and immune systems in higher-order eukaryotes arethus likely to acquire new molecular activities to combatinvading pathogens.
To our knowledge, our new methodology supports theapplication of gene ontologies in evolutionary studies and isan innovative addition to the toolkit of molecular charactersused in phylogenetic analysis. However, and on a balancednote, GO terms are prone to homoplasious events such asconvergent evolution and HGT that arise from functionalrecruitment. To protect from these effects, we carefullyexcluded 115 GO terms that were identified as probable
candidates of HGT. Furthermore, we restricted the analysisto include only terminal GO terms as they represent themost specialized functional annotations and thus may not beconserved across all taxa. We also excluded parasitic and fac-ultative parasitic organisms from the analysis as they coevolvewith their hosts and complicate phylogenetic analysis. Duringall these steps, we minimized the number of characters thatwere probable candidates suffering from homoplasy. Thefinal dataset of 249 free-living genomes and a repertoire of1,924 GOTMF terms should be considered minimally affectedby homoplasious events from HGT, parallel and convergentevolution, and biases introduced by differences in organismlifestyles. Indeed, phylogenies based on the genomic censusof molecular functions performed in a way superior tothe ToL reconstructed from rRNA gene trees in resolvingphylogenetic relationships of major taxonomic groups ofliving organisms, at a cost of slightly decreasing rescaledconsistency indices (RI) (from ∼0.7 for ToLs reconstructedfrom protein domains to ∼0.6 for ToLs reconstructed fromGO terms) [29]. In these studies, the impact of nonverticalevolution on the phylogenies built from the genomic censusof molecular functions is expected to be minimal sinceToFs were congruent with trees of domains previously builtfrom protein domain structures. ToL reconstruction is adifficult problem affected by a number of methodologicaland biological complications. However, our methodologyshould be considered equally (if notmore) robust to the otherexisting approaches, a better approximation to the problemof phylogenetic analysis of species, and a new direction to thefuture use of GO terms in phylogenetic analyses that carriesthe potential of improvement.
4. Conclusions
Our investigations revealed that the roots of cellular life liein the ancestors of thermophilic archaeal species. This is aninteresting but atypical conclusion that is supported by boththe distribution of molecular functions in the genomes ofdozens of cellular species and the phylogenomic approachof ideographic analysis. The use of GO terms as molecularcharacters provided significant insights into the functioningand evolution of superkingdoms. In particular, we uncoveredremarkable functional diversity of the eukaryotic genomes,which displayed a burst of appearance of novel molecularfunctions relatively late in evolution. In comparison, pro-teomes of akaryotic microbes persisted by favoring economyand following a minimalist path. The analysis puts forththe concept that GO definitions are useful and reliablecharacters for use in phylogenetic studies. Despite theircomplex hierarchical organization and vulnerability to theforces of recruitment, these new phylogenetic characterscarry enormous potential to resolve phylogenies depictingnatural history.
Conflict of Interests
The authors declare that there is no conflict of interestsregarding the publication of this paper.

Archaea 13
Acknowledgments
This research was supported by grants from the NationalScience Foundation (MCB-0749836 and OISE-1132791) andUnited States Department of Agriculture (CRIS ILLU-802-909) to GCA and a grant from the Next-GenerationBioGreen 21 Program, Rural Development Administration(PJ0090192013) toKMK.Anyopinions, findings, conclusions,and recommendations expressed in this material are those ofthe authors and do not necessarily reflect the views of thefunding agencies.
References
[1] C. R. Woese and G. E. Fox, “Phylogenetic structure of theprokaryotic domain: the primary kingdoms,” Proceedings of theNational Academy of Sciences of the United States of America,vol. 74, no. 11, pp. 5088–5090, 1977.
[2] C. R.Woese, “Bacterial evolution,”Microbiological Reviews, vol.51, no. 2, pp. 221–271, 1987.
[3] O. Lecompte, R. Ripp, J.Thierry, D. Moras, and O. Poch, “Com-parative analysis of ribosomal proteins in complete genomes:an example of reductive evolution at the domain scale,” NucleicAcids Research, vol. 30, no. 24, pp. 5382–5390, 2002.
[4] M. De Rosa, A. Gambacorta, and A. Gliozzi, “Structure,biosynthesis, and physicochemical properties of archaebacteriallipids,”Microbiological Reviews, vol. 50, no. 1, pp. 70–80, 1986.
[5] R. E. Valas and P. E. Bourne, “The origin of a derived superk-ingdom: how a gram-positive bacterium crossed the desert tobecome an archaeon,” Biology Direct, vol. 6, article 16, 2011.
[6] D.D. Leipe, L. Aravind, and E. V. Koonin, “DidDNA replicationevolve twice independently?”Nucleic Acids Research, vol. 27, no.17, pp. 3389–3401, 1999.
[7] R. Cavicchioli, P. M. G. Curmi, N. Saunders, and T. Thomas,“Pathogenic archaea: do they exist?” BioEssays, vol. 25, no. 11,pp. 1119–1128, 2003.
[8] K. Takai, K. Nakamura, T. Toki et al., “Cell proliferation at 122∘Cand isotopically heavy CH
4
production by a hyperthermophilicmethanogen under high-pressure cultivation,” Proceedings ofthe National Academy of Sciences of the United States of America,vol. 105, no. 31, pp. 10949–10954, 2008.
[9] A. Nasir, K. M. Kim, and G. Caetano-Anolles, “Giant virusescoexisted with the cellular ancestors and represent a distinctsupergroup along with superkingdoms Archaea, Bacteria andEukarya,” BMC Evolutionary Biology, vol. 12, no. 1, article 156,2012.
[10] A. Nasir, K. M. Kim, and G. Caetano-Anolles, “Viral evolution:primordial cellular origins and late adaptation to parasitism,”Mobile Genetic Elements, vol. 2, no. 5, pp. 247–252, 2012.
[11] J. P. Gogarten and L. Taiz, “Evolution of proton pumpingATPases: rooting the tree of life,” Photosynthesis Research, vol.33, no. 2, pp. 137–146, 1992.
[12] N. Iwabe, K. Kuma, M. Hasegawa, S. Osawa, and T. Miyata,“Evolutionary relationship of archaebacteria, eubacteria, andeukaryotes inferred from phylogenetic trees of duplicatedgenes,” Proceedings of the National Academy of Sciences of theUnited States of America, vol. 86, no. 23, pp. 9355–9359, 1989.
[13] G. Caetano-Anolles and A. Nasir, “Benefits of using molecularstructure and abundance in phylogenomic analysis,” Frontiersin Genetics, vol. 3, Article ID Article 172, 2012.
[14] G. Caetano-Anolles, M. Wang, D. Caetano-Anolles, and J. E.Mittenthal, “The origin, evolution and structure of the proteinworld,” Biochemical Journal, vol. 417, no. 3, pp. 621–637, 2009.
[15] M.Wang, L. S. Yafremava, D. Caetano-Anolles, J. E. Mittenthal,and G. Caetano-Anolles, “Reductive evolution of architecturalrepertoires in proteomes and the birth of the tripartite world,”Genome Research, vol. 17, no. 11, pp. 1572–1585, 2007.
[16] M. Wang and G. Caetano-Anolles, “Global phylogeny deter-mined by the combination of protein domains in proteomes,”Molecular Biology and Evolution, vol. 23, no. 12, pp. 2444–2454,2006.
[17] K. M. Kim and G. Caetano-Anolles, “The evolutionary historyof protein fold families and proteomes confirms that thearchaeal ancestor is more ancient than the ancestors of othersuperkingdoms,”BMCEvolutionary Biology, vol. 12, no. 1, article13, 2012.
[18] K.M. Kim andG. Caetano-Anolles, “The proteomic complexityand rise of the primordial ancestor of diversified life,” BMCEvolutionary Biology, vol. 11, no. 1, article 140, 2011.
[19] D. Caetano-Anolles, K. M. Kim, J. E. Mittenthal, and G.Caetano-Anolles, “Proteome evolution and the metabolic ori-gins of translation and cellular life,” Journal of MolecularEvolution, vol. 72, no. 1, pp. 14–33, 2011.
[20] F. Sun and G. Caetano-Anolles, “Evolutionary patterns in thesequence and structure of transfer RNA: early origins of archaeaand viruses,” PLoS Computational Biology, vol. 4, no. 3, ArticleID e1000018, 2008.
[21] F. Sun and G. Caetano-Anolles, “The origin and evolution oftRNA inferred from phylogenetic analysis of structure,” Journalof Molecular Evolution, vol. 66, no. 1, pp. 21–35, 2008.
[22] F. Sun andG. Caetano-Anolles, “The evolutionary history of thestructure of 5S ribosomal RNA,” Journal of Molecular Evolution,vol. 69, no. 5, pp. 430–443, 2009.
[23] F. Sun and G. Caetano-Anolles, “The ancient history of thestructure of ribonuclease P and the early origins of Archaea,”BMC Bioinformatics, vol. 11, article 153, 2010.
[24] H. Xue, K. Tong, C. Marck, H. Grosjean, and J. T. Wong,“Transfer RNA paralogs: evidence for genetic code-amino acidbiosynthesis coevolution and an archaeal root of life,”Gene, vol.310, no. 1-2, pp. 59–66, 2003.
[25] H.Xue, S.Ng, K. Tong, and J. T.Wong, “Congruence of evidencefor aMethanopyrus-proximal root of life based on transfer RNAand aminoacyl-tRNA synthetase genes,” Gene, vol. 360, no. 2,pp. 120–130, 2005.
[26] J. T. Wong, J. Chen, W. Mat, S. Ng, and H. Xue, “Polyphasicevidence delineating the root of life and roots of biologicaldomains,” Gene, vol. 403, no. 1-2, pp. 39–52, 2007.
[27] M. di Giulio, “The tree of life might be rooted in the branchleading to Nanoarchaeota,” Gene, vol. 401, no. 1-2, pp. 108–113,2007.
[28] A. Nasir and G. Caetano-Anolles, “Comparative analysis ofproteomes and functionomes provides insights into origins ofcellular diversification,” Archaea, vol. 2013, Article ID 648746,13 pages, 2013.
[29] K. M. Kim, A. Nasir, K. Hwang, and G. Caetano-Anolles, “Atree of cellular life inferred from a genomic census of molecularfunctions,” Journal of Molecular Evolution, 2014.
[30] M. Ashburner, C. A. Ball, J. A. Blake et al., “Gene ontology: toolfor the unification of biology,”Nature Genetics, vol. 25, no. 1, pp.25–29, 2000.

14 Archaea
[31] M. Harris, J. Clark, A. Ireland et al., “The Gene Ontology (GO)database and informatics resource,” Nucleic Acids Research, vol.32, supplement 1, pp. D258–D261, 2004.
[32] M. Ycas, “On earlier states of the biochemical system,” Journalof Theoretical Biology, vol. 44, no. 1, pp. 145–160, 1974.
[33] H. Kacser and R. Beeby, “Evolution of catalytic proteins or Onthe origin of enzyme species by means of natural selection,”Journal of Molecular Evolution, vol. 20, no. 1, pp. 38–51, 1984.
[34] L. C. James and D. S. Tawfik, “Conformational diversity andprotein evolution: a 60-year-old hypothesis revisited,” Trends inBiochemical Sciences, vol. 28, no. 7, pp. 361–368, 2003.
[35] K. M. Kim and G. Caetano-Anolles, “Emergence and evolutionof modern molecular functions inferred from phylogenomicanalysis of ontological data,” Molecular Biology and Evolution,vol. 27, no. 7, pp. 1710–1733, 2010.
[36] R. Jain, M. C. Rivera, and J. A. Lake, “Horizontal gene transferamong genomes: the complexity hypothesis,” Proceedings of theNational Academy of Sciences of the United States of America,vol. 96, no. 7, pp. 3801–3806, 1999.
[37] N. C. Kyrpides, “Genomes Online Database (GOLD 1.0): amonitor of complete and ongoing genomeprojects world-wide,”Bioinformatics, vol. 15, no. 9, pp. 773–774, 1999.
[38] K. Liolios, I. A. Chen, K. Mavromatis et al., “The GenomesOn Line Database (GOLD) in 2009: status of genomic andmetagenomic projects and their associated metadata,” NucleicAcids Research, vol. 38, no. 1, Article ID gkp848, pp. D346–D354, 2009.
[39] A. Nasir, A. Naeem, M. J. Khan, H. D. Lopez-Nicora, andG. Caetano-Anolles, “Annotation of protein domains revealsremarkable conservation in the functional make up of pro-teomes across superkingdoms,”Genes, vol. 2, no. 4, pp. 869–911,2011.
[40] S. Garcia-Vallve, E. Guzman, M. A. Montero, and A. Romeu,“HGT-DB: a database of putative horizontally transferred genesin prokaryotic complete genomes,” Nucleic Acids Research, vol.31, no. 1, pp. 187–189, 2003.
[41] K. Forslund, A. Henricson, V. Hollich, and E. L. L. Sonnham-mer, “Domain tree-based analysis of protein architecture evo-lution,”Molecular Biology and Evolution, vol. 25, no. 2, pp. 254–264, 2008.
[42] G. Caetano-Anolles andD. Caetano-Anolles, “An evolutionarilystructural universe of protein architecture,” Genome Research,vol. 13, no. 7, pp. 1563–1571, 2003.
[43] D. L. Swofford, Phylogenomic Analysis Using Parsimony andOther Programs (PAUP∗) Ver 4.0b10, Sinauer Associates, Sun-derland, Mass, USA, 2002.
[44] B. Kolaczkowski and J.W.Thomton, “Performance ofmaximumparsimony and likelihood phylogenetics when evolution isheterogenous,” Nature, vol. 431, no. 7011, pp. 980–984, 2004.
[45] J. G. Lundberg, “Wagner networks and ancestors,” SystematicBiology, vol. 21, no. 4, pp. 398–413, 1972.
[46] D. H. Huson, D. C. Richter, C. Rausch, T. Dezulian, M. Franz,and R. Rupp, “Dendroscope: an interactive viewer for largephylogenetic trees,” BMC Bioinformatics, vol. 8, article 460,2007.
[47] M.Wang, Y. Jiang, K.M.Kim et al., “A universalmolecular clockof protein folds and its power in tracing the early history ofaerobic metabolism and planet oxygenation,”Molecular Biologyand Evolution, vol. 28, no. 1, pp. 567–582, 2011.
[48] L. S. Yafremava, M. Wielgos, S. Thomas et al., “A generalframework of persistence strategies for biological systems helps
explain domains of life,” Frontiers in Genetics, vol. 4, article 16,2013.
[49] M. Wang and G. Caetano-Anolles, “The evolutionary mechan-ics of domain organization in proteomes and the rise ofmodularity in the protein world,” Structure, vol. 17, no. 1, pp. 66–78, 2009.
[50] W.Martin andM.Muller, “The hydrogen hypothesis for the firsteukaryote,” Nature, vol. 392, no. 6671, pp. 37–41, 1998.
[51] S. G. E. Andersson, A. Zomorodipour, J. O. Andersson et al.,“The genome sequence of Rickettsia prowazekii and the originof mitochondria,” Nature, vol. 396, no. 6707, pp. 133–140, 1998.
[52] M. Wang, C. G. Kurland, and G. Caetano-Anolles, “Reductiveevolution of proteomes and protein structures,” Proceedings ofthe National Academy of Sciences of the United States of America,vol. 108, no. 29, pp. 11954–11958, 2011.
[53] T. Katayama, S. Ozaki, K. Keyamura, and K. Fujimitsu, “Regu-lation of the replication cycle: conserved and diverse regulatorysystems for DnaA and oriC,” Nature Reviews Microbiology, vol.8, no. 3, pp. 163–170, 2010.
[54] M. Siebert, K. Severin, and L. Heide, “Formation of 4-hydroxybenzoate in Escherichia coli: characterization of theubiC gene and its encoded enzyme chorismate pyruvate-lyase,”Microbiology, vol. 140, no. 4, pp. 897–904, 1994.
[55] B. P. Nichols and J. M. Green, “Cloning and sequencing ofEscherichia coli ubiC and purification of chorismate lyase,”Journal of Bacteriology, vol. 174, no. 16, pp. 5309–5316, 1992.
[56] K. Neote, D. DiGregorio, J. Y. Mak, R. Horuk, and T. J.Schall, “Molecular cloning, functional expression, and signalingcharacteristics of a CC chemokine receptor,” Cell, vol. 72, no. 3,pp. 415–425, 1993.
[57] P. L. Hartzell, G. Zvilius, J. C. Escalante-Semerena, and M. I.Donnelly, “Coenzyme F420 dependence of the methylenete-trahydromethanopterin dehydrogenase of Methanobacteriumthermoautotrophicum,” Biochemical and Biophysical ResearchCommunications, vol. 133, no. 3, pp. 884–890, 1985.
[58] S. A. Bukhari and G. Caetano-Anolles, “Origin and evolutionof protein fold designs inferred from phylogenomic analysis ofCATH domain structures in proteomes,” PLoS ComputationalBiology, vol. 9, no. 3, Article ID e1003009, 15 pages, 2013.
[59] P. Forterre, “The common ancestor of Archaea and Eukarya wasnot an archaeon,”Archaea, vol. 2013, Article ID 372396, 18 pages,2013.
[60] C. Brochier-Armanet, P. Forterre, and S. Gribaldo, “Phylogenyand evolution of the Archaea: one hundred genomes later,”Current Opinion inMicrobiology, vol. 14, no. 3, pp. 274–281, 2011.
[61] K. O. Stetter, “Hyperthermophiles in the history of life,” Philo-sophical Transactions of the Royal Society B: Biological Sciences,vol. 361, no. 1474, pp. 1837–1842, 2006.
[62] E. A. Gaucher, S. Govindarajan, and O. K. Ganesh, “Palaeotem-perature trend for Precambrian life inferred from resurrectedproteins,” Nature, vol. 451, no. 7179, pp. 704–707, 2008.
[63] D. J. Brooks, J. R. Fresco, and M. Singh, “A novel method forestimating ancestral amino acid composition and its applicationto proteins of the Last Universal Ancestor,” Bioinformatics, vol.20, no. 14, pp. 2251–2257, 2004.
[64] B. Boussau, S. Blanquart, A.Necsulea,N. Lartillot, andM.Gouy,“Parallel adaptations to high temperatures in theArchaean eon,”Nature, vol. 456, no. 7224, pp. 942–945, 2008.
[65] M. C. Rivera and J. A. Lake, “The ring of life provides evidencefor a genome fusion origin of eukaryotes,” Nature, vol. 431, no.7005, pp. 152–155, 2004.
Archaea 15
[66] D. Alvarez-Ponce, P. Lopez, E. Bapteste, and J. O. McInerney,“Gene similarity networks provide tools for understandingeukaryote origins and evolution,” Proceedings of the NationalAcademy of Sciences of the United States of America, vol. 110, no.17, pp. E1594–E1603, 2013.
[67] C. J. Cox, P. G. Foster, R. P. Hirt, S. R. Harris, and T. M. Embley,“The archaebacterial origin of eukaryotes,” Proceedings of theNational Academy of Sciences of the United States of America,vol. 105, no. 51, pp. 20356–20361, 2008.
[68] E. Sober and M. Steel, “Testing the hypothesis of commonancestry,” Journal of Theoretical Biology, vol. 218, no. 4, pp. 395–408, 2002.
[69] P. H. Weston, “Indirect and direct methods in systematics,”in Ontogeny and Systematics, C. J. Humphries, Ed., pp. 27–56,Columbia University Press, New York, NY, USA, 1988.
[70] J. Gough, “Convergent evolution of domain architectures (israre),” Bioinformatics, vol. 21, no. 8, pp. 1464–1471, 2005.
[71] D. I. Andersson and D. Hughes, “Gene amplification andadaptive evolution in bacteria,” Annual Review of Genetics, vol.43, pp. 167–195, 2009.
[72] A. K. Hottes, P. L. Freddolino, A. Khare, Z. N. Donnell, J. C.Liu, and S. Tavazoie, “Bacterial Adaptation through Loss ofFunction,” PLoS Genetics, vol. 9, no. 7, Article ID e1003617, 2013.
[73] J. Wiedenbeck and F. M. Cohan, “Origins of bacterial diversitythrough horizontal genetic transfer and adaptation to newecological niches,” FEMS Microbiology Reviews, vol. 35, no. 5,pp. 957–976, 2011.

Submit your manuscripts athttp://www.hindawi.com
Hindawi Publishing Corporationhttp://www.hindawi.com Volume 2014
Anatomy Research International
PeptidesInternational Journal of
Hindawi Publishing Corporationhttp://www.hindawi.com Volume 2014
Hindawi Publishing Corporation http://www.hindawi.com
International Journal of
Volume 2014
Zoology
Hindawi Publishing Corporationhttp://www.hindawi.com Volume 2014
Molecular Biology International
GenomicsInternational Journal of
Hindawi Publishing Corporationhttp://www.hindawi.com Volume 2014
The Scientific World JournalHindawi Publishing Corporation http://www.hindawi.com Volume 2014
Hindawi Publishing Corporationhttp://www.hindawi.com Volume 2014
BioinformaticsAdvances in
Marine BiologyJournal of
Hindawi Publishing Corporationhttp://www.hindawi.com Volume 2014
Hindawi Publishing Corporationhttp://www.hindawi.com Volume 2014
Signal TransductionJournal of
Hindawi Publishing Corporationhttp://www.hindawi.com Volume 2014
BioMed Research International
Evolutionary BiologyInternational Journal of
Hindawi Publishing Corporationhttp://www.hindawi.com Volume 2014
Hindawi Publishing Corporationhttp://www.hindawi.com Volume 2014
Biochemistry Research International
ArchaeaHindawi Publishing Corporationhttp://www.hindawi.com Volume 2014
Hindawi Publishing Corporationhttp://www.hindawi.com Volume 2014
Genetics Research International
Hindawi Publishing Corporationhttp://www.hindawi.com Volume 2014
Advances in
Virolog y
Hindawi Publishing Corporationhttp://www.hindawi.com
Nucleic AcidsJournal of
Volume 2014
Stem CellsInternational
Hindawi Publishing Corporationhttp://www.hindawi.com Volume 2014
Hindawi Publishing Corporationhttp://www.hindawi.com Volume 2014
Enzyme Research
Hindawi Publishing Corporationhttp://www.hindawi.com Volume 2014
International Journal of
Microbiology
Copyright © 2022 FDOKUMEN