A Phylogenomic Approach to Resolve the Arthropod Tree of ...
14
A Phylogenomic Approach to Resolve the Arthropod Tree of Life Karen Meusemann,† ,1 Bj¨ orn M. von Reumont,† ,1 Sabrina Simon, 2 Falko Roeding, 3 Sascha Strauss, 4 Patrick K¨ uck, 1 Ingo Ebersberger, 4 Manfred Walzl, 5 G¨ unther Pass, 6 Sebastian Breuers, 7 Viktor Achter, 7 Arndt von Haeseler, 4 Thorsten Burmester, 3 Heike Hadrys, 2,8 J. Wolfgang W¨ agele, 1 and Bernhard Misof*† ,3 1 Zoologisches Forschungsmuseum Alexander Koenig, Molecular Biology Unit, Bonn, Germany 2 Stiftung Tieraerztliche Hochschule Hannover, Institute of Ecology & Evolution, Hannover, Germany 3 Biocenter Grindel & Zoological Museum, University of Hamburg, Hamburg, Germany 4 Center for Integrative Bioinformatics Vienna, Max F Perutz Laboratories, University of Vienna, Medical University of Vienna, University of Veterinary Medicine of Vienna, Vienna, Austria 5 Department of Theoretical Biology, University of Vienna, Vienna, Austria 6 Department of Evolutionary Biology, University of Vienna, Vienna, Austria 7 Regional Computing Center of Cologne (RRZK), The University of Cologne, Cologne, Germany 8 Department of Ecology and Evolutionary Biology, Yale University †These authors contributed equally to this work. *Corresponding author: E-mail: [email protected]. Associate editor: Barbara Holland Abstract Arthropods were the first animals to conquer land and air. They encompass more than three quarters of all described living species. This extraordinary evolutionary success is based on an astoundingly wide array of highly adaptive body organizations. A lack of robustly resolved phylogenetic relationships, however, currently impedes the reliable reconstruction of the underly- ing evolutionary processes. Here, we show that phylogenomic data can substantially advance our understanding of arthropod evolution and resolve several conflicts among existing hypotheses. We assembled a data set of 233 taxa and 775 genes from which an optimally informative data set of 117 taxa and 129 genes was finally selected using new heuristics and compared with the unreduced data set. We included novel expressed sequence tag (EST) data for 11 species and all published phyloge- nomic data augmented by recently published EST data on taxonomically important arthropod taxa. This thorough sampling reduces the chance of obtaining spurious results due to stochastic effects of undersampling taxa and genes. Orthology pre- diction of genes, alignment masking tools, and selection of most informative genes due to a balanced taxa–gene ratio using new heuristics were established. Our optimized data set robustly resolves major arthropod relationships. We received strong support for a sister group relationship of onychophorans and euarthropods and strong support for a close association of tardi- grades and cycloneuralia. Within pancrustaceans, our analyses yielded paraphyletic crustaceans and monophyletic hexapods and robustly resolved monophyletic endopterygote insects. However, our analyses also showed for few deep splits that were recently thought to be resolved, for example, the position of myriapods, a remarkable sensitivity to methods of analyses. Key words: arthropod phylogeny, phylogenomics, expressed sequence tags, supermatrix, matrix saturation, relative informativeness. Research article Introduction Extensive sequence data from genome and expressed se- quence tag (EST) projects were recently used to infer a deep metazoan phylogeny (Bourlat et al. 2006; Roeding et al. 2007; Delsuc et al. 2008; Dunn et al. 2008; Philippe et al. 2009; Hejnol et al. 2009). These phylogenomic studies consistently place arthropods within the superphylum Ecdysozoa. These studies are, however, sparse in their sampling of arthropods. Large groups like pancrustaceans are represented by only a few taxa, and important taxa from chelicerates, myriapods, crustaceans, or hexapods are completely missing. EST stud- ies presenting a broader arthropod taxon sampling focus on pancrustacean and hexapod relationships (Timmermans et al. 2008) or on relationships within pterygote insects (Simon et al. 2009). Other studies are essentially restricted to multigene analyses comprising larger arthropod data sets. Regier et al. (2008) analyzed 62 arthropod taxa cov- ered by mainly three genes, but only for a small subset of 13 taxa were all 68 gene regions present. This multigene matrix, however, had 71% missing data. A large proportion of missing data within a supermatrix might cause prob- lems for phylogenetic inference (Sanderson 2007; Wiens and Moen 2008). The most recent study (Regier et al. 2010) relies on selected 62 nuclear protein coding genes for 75 arthro- pod taxa. Important taxa assumed to be positioned at basal splits, like proturans (Hexapoda), are still missing and their data set at an amino acid level is relatively small (ca. 13,000 amino acids). Much attention was drawn to large arthro- pod data sets inferred from ribosomal RNA (rRNA) genes (Mallatt and Giribet 2006; von Reumont et al. 2009). Draw- backs of the rRNA-based studies include a lack of robust signal or conflicts in the data (see von Reumont et al. 2009). Published by Oxford University Press 2010. Mol. Biol. Evol. 27(11):2451–2464. 2010 doi:10.1093/molbev/msq130 Advance Access publication June 9, 2010 2451 Downloaded from https://academic.oup.com/mbe/article/27/11/2451/1113513 by guest on 10 January 2022
-
Upload
khangminh22 -
Category
Documents
-
view
0 -
download
0
Transcript of A Phylogenomic Approach to Resolve the Arthropod Tree of ...

A Phylogenomic Approach to Resolve the Arthropod Treeof LifeKaren Meusemann,†,1 Bjorn M. von Reumont,†,1 Sabrina Simon,2 Falko Roeding,3 Sascha Strauss,4
Patrick Kuck,1 Ingo Ebersberger,4 Manfred Walzl,5 Gunther Pass,6 Sebastian Breuers,7 Viktor Achter,7
Arndt von Haeseler,4 Thorsten Burmester,3 Heike Hadrys,2,8 J. Wolfgang Wagele,1 and BernhardMisof*†,31Zoologisches ForschungsmuseumAlexander Koenig, Molecular Biology Unit, Bonn, Germany2Stiftung Tieraerztliche Hochschule Hannover, Institute of Ecology & Evolution, Hannover, Germany3Biocenter Grindel & Zoological Museum, University of Hamburg, Hamburg, Germany4Center for Integrative Bioinformatics Vienna, Max F Perutz Laboratories, University of Vienna, Medical University of Vienna, Universityof Veterinary Medicine of Vienna, Vienna, Austria5Department of Theoretical Biology, University of Vienna, Vienna, Austria6Department of Evolutionary Biology, University of Vienna, Vienna, Austria7Regional Computing Center of Cologne (RRZK), The University of Cologne, Cologne, Germany8Department of Ecology and Evolutionary Biology, Yale University†These authors contributed equally to this work.
*Corresponding author: E-mail: [email protected].
Associate editor: Barbara Holland
Abstract
Arthropods were the first animals to conquer land and air. They encompass more than three quarters of all described livingspecies. This extraordinary evolutionary success is based on an astoundingly wide array of highly adaptive body organizations.A lack of robustly resolved phylogenetic relationships, however, currently impedes the reliable reconstruction of the underly-ing evolutionaryprocesses. Here, we show that phylogenomic data can substantially advance our understanding of arthropodevolution and resolve several conflicts among existing hypotheses. We assembled a data set of 233 taxa and 775 genes fromwhich an optimally informative data set of 117 taxa and 129 genes was finally selected using new heuristics and comparedwith the unreduced data set. We included novel expressed sequence tag (EST) data for 11 species and all published phyloge-nomic data augmented by recently published EST data on taxonomically important arthropod taxa. This thorough samplingreduces the chance of obtaining spurious results due to stochastic effects of undersampling taxa and genes. Orthology pre-diction of genes, alignment masking tools, and selection of most informative genes due to a balanced taxa–gene ratio usingnew heuristics were established. Our optimized data set robustly resolves major arthropod relationships.We received strongsupport for a sister group relationshipof onychophorans and euarthropods and strong support for a close associationof tardi-grades and cycloneuralia. Within pancrustaceans, our analyses yielded paraphyletic crustaceans and monophyletic hexapodsand robustly resolved monophyletic endopterygote insects. However, our analyses also showed for few deep splits that wererecently thought to be resolved, for example, the position of myriapods, a remarkable sensitivity to methods of analyses.
Key words: arthropod phylogeny, phylogenomics, expressed sequence tags, supermatrix, matrix saturation, relativeinformativeness.
Researcharticle
IntroductionExtensive sequence data from genome and expressed se-quence tag (EST) projectswere recently used to infer a deepmetazoan phylogeny (Bourlat et al. 2006; Roeding et al.2007; Delsuc et al. 2008; Dunn et al. 2008; Philippe et al. 2009;Hejnol et al. 2009). These phylogenomic studies consistentlyplace arthropods within the superphylum Ecdysozoa. Thesestudies are, however, sparse in their sampling of arthropods.Large groups like pancrustaceans are represented by only afew taxa, and important taxa from chelicerates, myriapods,crustaceans, or hexapods are completely missing. EST stud-ies presenting a broader arthropod taxon sampling focus onpancrustacean and hexapod relationships (Timmermanset al. 2008) or on relationships within pterygote insects(Simon et al. 2009). Other studies are essentially restrictedto multigene analyses comprising larger arthropod data
sets. Regier et al. (2008) analyzed 62 arthropod taxa cov-ered by mainly three genes, but only for a small subset of13 taxa were all 68 gene regions present. This multigenematrix, however, had 71% missing data. A large proportionof missing data within a supermatrix might cause prob-lems for phylogenetic inference (Sanderson 2007;Wiens andMoen 2008). Themost recent study (Regier et al. 2010) relieson selected 62 nuclear protein coding genes for 75 arthro-pod taxa. Important taxa assumed to be positioned at basalsplits, like proturans (Hexapoda), are still missing and theirdata set at an amino acid level is relatively small (ca. 13,000amino acids). Much attention was drawn to large arthro-pod data sets inferred from ribosomal RNA (rRNA) genes(Mallatt and Giribet 2006; von Reumont et al. 2009). Draw-backs of the rRNA-based studies include a lack of robustsignal or conflicts in the data (see von Reumont et al. 2009).
Published by Oxford University Press 2010.
Mol. Biol. Evol. 27(11):2451–2464. 2010 doi:10.1093/molbev/msq130 Advance Access publication June 9, 2010 2451
Dow
nloaded from https://academ
ic.oup.com/m
be/article/27/11/2451/1113513 by guest on 10 January 2022
Meusemann et al. · doi:10.1093/molbev/msq130 MBE
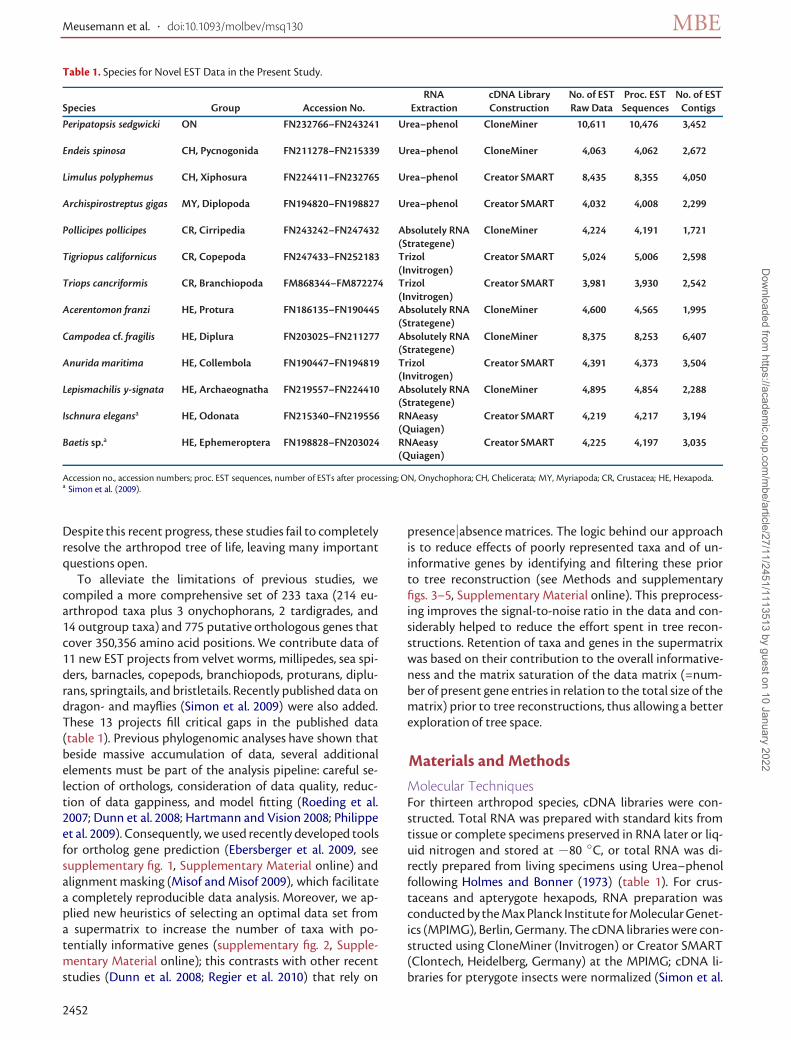
Table 1. Species for Novel EST Data in the Present Study.
RNA cDNA Library No. of EST Proc. EST No. of ESTSpecies Group Accession No. Extraction Construction Raw Data Sequences Contigs
Peripatopsis sedgwicki ON FN232766–FN243241 Urea–phenol CloneMiner 10,611 10,476 3,452
Endeis spinosa CH, Pycnogonida FN211278–FN215339 Urea–phenol CloneMiner 4,063 4,062 2,672
Limulus polyphemus CH, Xiphosura FN224411–FN232765 Urea–phenol Creator SMART 8,435 8,355 4,050
Archispirostreptus gigas MY, Diplopoda FN194820–FN198827 Urea–phenol Creator SMART 4,032 4,008 2,299
Pollicipes pollicipes CR, Cirripedia FN243242–FN247432 Absolutely RNA CloneMiner 4,224 4,191 1,721(Strategene)
Tigriopus californicus CR, Copepoda FN247433–FN252183 Trizol Creator SMART 5,024 5,006 2,598(Invitrogen)
Triops cancriformis CR, Branchiopoda FM868344–FM872274 Trizol Creator SMART 3,981 3,930 2,542(Invitrogen)
Acerentomon franzi HE, Protura FN186135–FN190445 Absolutely RNA CloneMiner 4,600 4,565 1,995(Strategene)
Campodea cf. fragilis HE, Diplura FN203025–FN211277 Absolutely RNA CloneMiner 8,375 8,253 6,407(Strategene)
Anurida maritima HE, Collembola FN190447–FN194819 Trizol Creator SMART 4,391 4,373 3,504(Invitrogen)
Lepismachilis y-signata HE, Archaeognatha FN219557–FN224410 Absolutely RNA CloneMiner 4,895 4,854 2,288(Strategene)
Ischnura elegansa HE, Odonata FN215340–FN219556 RNAeasy Creator SMART 4,219 4,217 3,194(Quiagen)
Baetis sp.a HE, Ephemeroptera FN198828–FN203024 RNAeasy Creator SMART 4,225 4,197 3,035(Quiagen)
Accession no., accession numbers; proc. EST sequences, number of ESTs after processing; ON, Onychophora; CH, Chelicerata; MY, Myriapoda; CR, Crustacea; HE, Hexapoda.a Simon et al. (2009).
Despite this recent progress, these studies fail to completelyresolve the arthropod tree of life, leaving many importantquestions open.
To alleviate the limitations of previous studies, wecompiled a more comprehensive set of 233 taxa (214 eu-arthropod taxa plus 3 onychophorans, 2 tardigrades, and14 outgroup taxa) and 775 putative orthologous genes thatcover 350,356 amino acid positions. We contribute data of11 new EST projects from velvet worms, millipedes, sea spi-ders, barnacles, copepods, branchiopods, proturans, diplu-rans, springtails, and bristletails. Recently published data ondragon- and mayflies (Simon et al. 2009) were also added.These 13 projects fill critical gaps in the published data(table 1). Previous phylogenomic analyses have shown thatbeside massive accumulation of data, several additionalelements must be part of the analysis pipeline: careful se-lection of orthologs, consideration of data quality, reduc-tion of data gappiness, and model fitting (Roeding et al.2007; Dunn et al. 2008; Hartmann and Vision 2008; Philippeet al. 2009). Consequently, we used recently developed toolsfor ortholog gene prediction (Ebersberger et al. 2009, seesupplementary fig. 1, Supplementary Material online) andalignmentmasking (Misof andMisof 2009), which facilitatea completely reproducible data analysis. Moreover, we ap-plied new heuristics of selecting an optimal data set froma supermatrix to increase the number of taxa with po-tentially informative genes (supplementary fig. 2, Supple-mentary Material online); this contrasts with other recentstudies (Dunn et al. 2008; Regier et al. 2010) that rely on
presence|absencematrices. The logic behind our approachis to reduce effects of poorly represented taxa and of un-informative genes by identifying and filtering these priorto tree reconstruction (see Methods and supplementaryfigs. 3–5, Supplementary Material online). This preprocess-ing improves the signal-to-noise ratio in the data and con-siderably helped to reduce the effort spent in tree recon-structions. Retention of taxa and genes in the supermatrixwas based on their contribution to the overall informative-ness and the matrix saturation of the data matrix (=num-ber of present gene entries in relation to the total size of thematrix) prior to tree reconstructions, thus allowing a betterexploration of tree space.
Materials and Methods
Molecular TechniquesFor thirteen arthropod species, cDNA libraries were con-structed. Total RNA was prepared with standard kits fromtissue or complete specimens preserved in RNA later or liq-uid nitrogen and stored at −80 ◦C, or total RNA was di-rectly prepared from living specimens using Urea–phenolfollowing Holmes and Bonner (1973) (table 1). For crus-taceans and apterygote hexapods, RNA preparation wasconductedby theMax Planck Institute forMolecularGenet-ics (MPIMG), Berlin, Germany. The cDNA libraries were con-structed using CloneMiner (Invitrogen) or Creator SMART(Clontech, Heidelberg, Germany) at the MPIMG; cDNA li-braries for pterygote insects were normalized (Simon et al.
2452
Dow
nloaded from https://academ
ic.oup.com/m
be/article/27/11/2451/1113513 by guest on 10 January 2022

A Phylogeny of Arthropods Based on New EST Data · doi:10.1093/molbev/msq130 MBE
2009). From cDNA libraries, ESTs were generated by se-quencing clones from the 5’ end on the automated capillarysequencer system ABI 3730XL (Applied Biosystems, Darm-stadt, Germany) using BIGDYE chemistry (Applied Biosys-tems). Between 3,930 and 10,476 sequences were processedfrom cDNA libraries (table 1). All single EST sequences weredeposited in EMBL (http://www.ebi.ac.uk/embl/) after be-ing quality checked and assembled into unique transcripts(contigs), whereby two projects on pterygote insects origi-nally sequenced for this arthropod study have recently beenpublished (Simon et al. 2009).
Sequence Processing and Orthology AssignmentWe preprocessed new EST data (table 1) with LUCY (Chouand Holmes 2001). EST data available for 190 additional eu-arthropods (myriapods, chelicerates, pancrustaceans) plus2 onychophorans, 2 tardigrades, and selected species of ne-matodes, annelids, and molluscs (in total 216 species) wereextracted from public databases, dbEST (NCBI), the GeneIndex Project or the NCBI Trace Archive (supplementarytable 1, Supplementary Material online). We screened allEST sequences for contamination and low-quality ends ofsequences. Subsequently, overlapping ESTs from the sametaxon were assembled into contigs using the TGICL pack-age (Pertea et al. 2003). For the orthology prediction withHaMStR (Ebersberger et al. 2009), all contigs were translatedinto amino acid sequences in all reading frames. In total,244 species were “hamstred” of which 28 species were “pro-teome” species. Thirteen species were used as primer taxa(supplementary fig. 1 and supplementary table 1, Supple-mentary Material online). Sequences of vertebrate specieswere additionally used to train profile Hidden MarkovModels (Ebersberger et al. 2009) but excluded in furtherphylogenetic analyses for computational reasons. EightDrosophila proteome species were also excluded for com-putational reasons. The HaMStR search identified 775 puta-tive orthologous genes for ouroriginal data set (233 species).
Alignments and Alignment MaskingInferred amino acid sequences of all 775 putative orthol-ogous genes were aligned (supplementary fig. 2, Supple-mentary Material online) with MAFFT L-INSI (Katoh andToh 2008). The data set comprised 222 euarthropods, 3onychophorans, 2 tardigrades, 3 vertebrates, 8 nematodes,3 annelids, and 3 molluscs. Excluding randomly similaraligned sections can make phylogenetic analyses more re-liable prior to tree reconstruction (Castresana 2000; Misofand Misof 2009; Kuck et al. 2010). We therefore identi-fied randomly similar sections for all gene alignments sep-arately for each of the 775 genes with ALISCORE on theamino acid level (Misof and Misof 2009; Kuck et al. 2010)usingdefault settings andmaximal numberof pairwise com-parisons. In total, 57.62% of originally 826,633 amino acidpositions were excluded to increase the signal-to-noise ra-tio. For each gene, only sequences comprising more thanone half of the sequence information were included inthe ALISCORE analyses. We masked each alignment withALICUT (http://www.utilities.zfmk.de) by excluding all ran-
domly similar alignment positions. All masked alignmentswere concatenated to amasked superalignment comprising233 taxa and 350,356 amino acid positions.
Selecting an Optimal Subset Using New ReductionHeuristicsWith the software MARE (MAtrix REduction) (http://mare.zfmk.de), the relative informativeness of each single genewithin a superalignment was calculated based on weightedgeometry quartet mapping (Nieselt-Struwe and vonHaeseler 2001), extended to amino acid data. Each genereceived a value of informativeness between 0.0 and 1.0,reflecting the relative number of resolved quartet trees(supplementary fig. 3, Supplementary Material online). Adata availability matrix indicating present (1) and absent(0) genes was then transformed into a matrix of potentialinformation content of each taxon and gene by multiplyingavailability (0|1) with scores of informativeness. Relativeinformation content of each gene was calculated as theaverage value over all taxa including missing taxa. The totalaverage information content P (relative informativeness)of a supermatrix was calculated as the sum of relativeinformation content of all genes in relation to the numberof taxa (see supplementary fig. 4, Supplementary Materialonline). To select an optimal subset of taxa and genes withhigh total average information content, we used a simplehill climbing procedure. Reduction starts with droppingeither taxon (row) or gene (column) with the lowestaverage information content, generating a new matrix. Incase of ties, genes are excluded. Consequently, taxa or geneswith lowest average information content will be discardedfrom the matrix, yielding a selected optimal subset (SOS) oftaxa and genes with increased relative information content(supplementary fig. 5, Supplementary Material online). Wedefined the copepod Tigriopus and the chilopod Scutigeraas taxon constraints; thus, they were not dropped fromthe submatrix. Copepods are discussed as a sister groupto hexapods (Mallatt and Giribet 2006; von Reumontet al. 2009), and Scutigera was the only representative ofchilopods (Myriapoda). Therefore, we constrained matrixreduction to retain both species as key taxa.
In order to reach an optimum of matrix reduction, wedefined an optimality function f (P), which takes into ac-count that size reduction of an original matrix B and lowtotal average informativeness of a reduced matrix B ′ arepenalized
f (P) = 1 − |(λ− Pα×(1−P))| if P < 1, (1)
with α as a scaling factor (default set to α = 3), λ as thesize ratio between reduced B ′ and original matrix B (matrixsize defined as #taxa × #genes). P is maximized, if P = 1,reduction stops. The optimality function favors reductionof matrices to high average information content. The con-nectivity between taxa was set to a minimum number oftwo overlapping genes and taxa. This means that two setsof taxamust share at least two taxa with both genes. Finally,the original superalignmentwas rewritten basedon the SOS.Details of the new reduction algorithm will be published
2453
Dow
nloaded from https://academ
ic.oup.com/m
be/article/27/11/2451/1113513 by guest on 10 January 2022

Meusemann et al. · doi:10.1093/molbev/msq130 MBE
2454
Dow
nloaded from https://academ
ic.oup.com/m
be/article/27/11/2451/1113513 by guest on 10 January 2022

A Phylogeny of Arthropods Based on New EST Data · doi:10.1093/molbev/msq130 MBE
elsewhere (Misof B, Meyer B, von Reumont BM, Kuck P,Meusemann K, unpublished data).
Phylogenetic AnalysesWe conducted maximum likelihood (ML) analyses usingRAxML Pthreads 7.0.0 (Stamatakis 2006b; Ott et al. 2007)for 1) the original data set (unreduced supermatrix)comprising 233 taxa, 775 genes, and 350,356 amino acidpositions and 2) the SOS comprising 117 taxa and 129genes with an alignment length of 37,476 amino acidpositions. The data matrices have been deposited at Tree-base (http://purl.org/phylo/treebase/phylows/study/TB2/S10507).
We applied ML tree search and rapid bootstrappingwithin one step (-f a, 1,000 bootstrap replicates) on the SOS.For the original concatenated supermatrix, we conductedten singleML tree searches and separate bootstrapping (100replicates). We chose the ML tree with the best likelihoodvalue to plot bootstrap values (supplementary fig. 6, Supple-mentary Material online). All ML analyses were calculatedwith the PROTMIX (Stamatakis 2006a) substitution modeland the WAG matrix (Whelan and Goldman 2001).
Bayesian analyses for the SOS were inferred using Phy-loBayes version 2.3c (Lartillot et al. 2008) running the CATmixture model (Lartillot and Philippe 2004). We ran 25Markov chain Monte Carlo for 20,000 cycles each, samplingevery cycle. All parameter values were checked for conver-gence to define the burn-in (5,000 cycles). To infer a major-ity rule consensus (mrc) tree, we checked the discrepancyobserved across all bipartitions (maxdiff value) of all chainsby pairwise comparison and comparing “triple”-chain com-binations with the bpcomp tool. Harmonic means of thelikelihood values of each chain (burn-in excluded) were cal-culated. To infer the Bayesian mrc tree, we included threechains showing the lowest maxdiff value (0.186) while fea-turing the best likelihood values (harmonic means) of all“triple-chain combinations” (table 2). All trees were rootedwith Mollusca.
To identify “unstable” taxa, we calculated leaf stabilityindices (Thorley and Wilkinson 1999) from the collectedbootstrap trees of the ML analysis using Phyutility (Smithand Dunn 2008). We defined a threshold of <95% as un-stable. All analyses ran for several months on Linux Clus-ters, HP ProLiant DL380 G5 blades (Dual quad core IntelXeon E5345, 2.33 GHz, 2x 4MB L2-cache, 1333 MHz Bus,32 GB RAM), of the ZFMK (molecular unit) and the RRZK(Regional Computing Center of Cologne) utilizing HPC re-sources (HP ProLiant, Dual quad core Intel Xeon E5345, 2.33GHz, 2x 4MB L2-cache, 1333 MHz Bus, 32 GB RAM). RRZKresources were provided by the SuGI (Sustainable Grid In-
frastructure) project (Project leader: V. Achter, UniversityofCologne funded by the BMBF).
Consensus Network of Single Bayesian TopologiesDue to differences between single topologies of the 25 Phy-loBayes (Lartillot et al. 2008) chains, we computed a consen-sus network (Holland and Moulton 2003) with SplitsTree4.8 (Huson and Bryant 2006). This is a method to identifycontradictory signal that cannot be displayed with a simplemrc tree. To visualize conflicts and contradictory signal, wechose a threshold of 0.01 and incorporated averaged edgeweights.
Results and Discussion
The SOSOur SOS includes 117 taxa with 101 euarthropods, 2 ony-chophorans, 2 tardigrades, and 12 outgroup taxa (supple-mentary table 1, Supplementary Material online). The dataset comprises 129 genes of which 32 genes coded for ri-bosomal proteins and 97 for nonribosomal proteins (sup-plementary table 2, Supplementary Material online). Therelative information content of genes ranges from 0.42 to0.92, with an average of 0.7 (supplementary tables 1 and 2,SupplementaryMaterial online). The concatenatedmaskedalignment spans 37,476 amino acid positions (supplemen-tary fig. 4, Supplementary Material online). The relative in-formativeness rises 4-fold from 0.10 (original data set) to0.43 (SOS) (supplementary figs. 3–5, Supplementary Mate-rial online).Matrix saturation (geneswith a relative informa-tion content<0.04 considered as missing) increases 3-foldfromoriginally 17.6–62.3% in the SOS. Taxa in the SOS coveron average 84 genes (minimum35 andmaximum129). Eachgene is, on average, present in 76 taxa (minimum 46 andmaximum 109 taxa per gene).
ML and Bayesian tree reconstruction of the SOS re-solved arthropod relationships with several strongly sup-ported nodes (figs. 1 and 2 and table 3). In contrast, the treebased on the original supermatrix is in many respects unre-solved or shows low support values (supplementary fig. 6,Supplementary Material online). This comparison suggeststhat the strategy to compute an SOS is successful, for ex-ample, improves tree robustness and clades that are widelyaccepted in the literature (e.g., Hexapoda, Ectognatha, En-dopterygota, Coleoptera, Lepidoptera), which was not thecase for the unreduced data set. Thus, the discussion of thephylogenetic relationships focuses on the SOS.
Incongruences in Bayesian AnalysesThe 25 Bayesian runs did not converge on a single topol-ogy (see Methods; fig. 3). Some clades, for example
←FIG. 1. Phylogram of 117-taxon ML analysis. RAxML tree (majority rule) of the SOS, PROTMIX substitutionmodel + WAG matrix. Support valuesare derived from 1,000 bootstrap replicates. Support values <70: not shown; support values = 100: represented by a dot only. Quotation marksindicate nonmonophyly. Asterisks indicate EST taxa contributed by the authors. Unstable taxa (leaf stability index<0.95) are marked by a star infront of the taxon name. Color code: molluscs, annelids, and nematodes, lighter grey; tardigrades and onychophorans, black; myriapods, brown;chelicerates, green; crustaceans, red; basal hexapods, light blue; and pterygote insects, dark blue.
2455
Dow
nloaded from https://academ
ic.oup.com/m
be/article/27/11/2451/1113513 by guest on 10 January 2022

Meusemann et al. · doi:10.1093/molbev/msq130 MBE
2456
Dow
nloaded from https://academ
ic.oup.com/m
be/article/27/11/2451/1113513 by guest on 10 January 2022

A Phylogeny of Arthropods Based on New EST Data · doi:10.1093/molbev/msq130 MBE
(Onychophora, Euarthropoda), Pancrustacea, Bran-chiopoda as a sister group to Hexapoda and Nonoculata(Protura, Diplura), emerged in all chains with maximalsupport. Other clades differed between consensus trees in-ferred from single chains. These incongruences were causedby unstable positions of few taxa (fig. 3): 1) Mandibulata(Myriapoda + Pancrustacea) were found maximally sup-ported in consensus trees of two runs. Both runs showcomparatively low harmonic means of likelihoods. In allother runs, myriapods clustered with chelicerates withnegligible to moderate support (posterior probability pP0.52–0.89). 2) The barnacle Pollicipes (Cirripedia, Crus-tacea) emerged as a sister group to copepods in only onerun (pP 0.51). However, the alternative clade (Pollicipes+ Malacostraca) (fig. 2) showed a wide range from 0.56to 0.96 pP in other runs. 3) The bristletail Lepismachilis(Archaeognatha) was inferred as a sister group to Blattaria+ Isoptera in several runs, showing moderate or low sup-port (pP 0.52–0.82). Additionally, Pediculus (Phthiraptera)emerged as a sister group to this clade (pP 1.0) in theseruns. Likelihoods (harmonic means), however, were lowercompared with runs used for our Bayesian consensus tree(fig. 2), and results of these runs were rejected after a Bayesfactor test (Kaas and Raftery 1995; Nylander et al. 2004). 4)Among butterflies (Lepidoptera), five different topologieswith distinctive clades were found. Differences occurredamong Yponomeutoidea, Papilionoidea, Pyraloidea, Tor-tricoidea, and Noctuidea. Incongruent consensus treesmight reflect different local optima despite extensivesampling.
Are the Enigmatic Tardigrades and OnychophoransArthropods sensu latu?Chelicerates, myriapods, crustaceans, and hexapods showhighly derived differentiations of segments and segmentalappendages (Edgecombe 2009). Tardigrades and ony-chophorans display a mosaic of plesiomorphic and au-tapomorphic features of segmental differentiation. Theevolution of the arthropod bauplan, as, for example, theevolution of segmentation, appendages, and the centralnervous system, can thus be understood only if the phy-logenetic positions of tardigrades and onychophorans areresolved (see reviews in Budd and Telford 2009 andEdgecombe 2009).
Tardigrades are tiny animals with morphological char-acters reminiscent of both Arthropoda and Cycloneuralia(the latter named for their circumpharyngeal nerve ringshared by Nematoda, Nematomorpha (horsehair worms,insect parasites), Priapulida (penis worms), Kinorhyncha(mud dragons), and Loricifera; see Giribet 2003; Edgecombe
2009). Arthropod-like characters include the segmentedbody, limbs, the presence of a peritrophic membrane, anda ladder-like central nervous system (Giribet 2003). Incontrast, structures of mouth, pharynx, cuticle, and sen-sory organs resemble those of Cycloneuralia (Giribet 2003).Traditionally, tardigrades have been allied with arthropods,an assumption that has been corroborated by molecularstudies based on rRNA (Mallatt et al. 2004). Such a cladeTardigrada + Onychophora + Euarthropoda (Panarthro-poda) would be compatible with the hypothesis of an evo-lution of segmentation (including differentiation of themuscular tube, etc.), segmented appendages, and a ladder-like central nervous system within this clade. Alternatively,a sister group relationship of tardigrades with Cycloneuralia(nematodes and allies) would imply either a very ancientevolution of a segmented body plan and a loss of these char-acteristics within derivedCycloneuralia (including a reversalto an undifferentiated muscular tube) or an independentevolution of segmental characters within Cycloneuralia. Arobustly resolvedposition of tardigrades has a strong impacton our interpretationof the evolution of segmentation.
In our analyses, tardigrades (Hypsibius and Richtersius)emerge as a sister group of nematodes (bootstrap sup-port 100%, pP 1.0), which is in line with recent findingsby Roeding et al. (2007), Lartillot and Philippe (2008), andBleidorn et al. (2009). These studies had been based on dif-ferent gene selections. In contrast, Dunn et al. (2008), apply-ing the CAT model (Lartillot and Philippe 2004) of aminoacid evolution, found tardigrades either as a sister groupof arthropods (including onychophorans) or applying theWAG model, as a sister group of nematodes and nemato-morphs, in both cases only weakly supported. Phylogeneticanalyses based on morphological characters are similarlyambiguous and support contradicting results. Either pa-narthropods (including tardigrades, Edgecombe 2009) arefavored, or an unresolved clade (Tardigrada +Onychophora+ Euarthropoda) is represented in Budd and Telford (2009),or tardigrades are positioned outside the (Onychophora +Euarthropoda) clade (Zantke et al. 2008). Currently, there isno conclusive hypothesis compatible with the contradict-ingmorphological andmolecular data about the positionoftardigrades within the metazoan tree. This clearly impedesour understanding of the evolution of segmentation withinEcdysozoa.
Onychophorans strongly resemble arthropod-like ani-mals with, for example, a reduction of locomotory cilia, abody cavity with a pericardial septum, a heart with ostia,segmental nephridia with sacculi, the presence of clawedventral appendages, and the absence of metameric larvae.Deviant from arthropods, onychophorans lack, for example,
←FIG. 2. Phylogram of 117-taxon Bayesian analysis. Bayesian mrc tree of the SOS, 3 chains out of 25 chains, 20,000 cycles each, burn-in: 5,000 cycles.Support values are estimated under the CAT mixture model. The mrc tree is based on the “triple” (three chains) showing lowest maxdiff value(0.186), whereas each of these chains had the best harmonic mean of the likelihood values (burn-in excluded) of all possible triple-chain combi-nations. pP values <0.7: not shown; pP values = 1.0: represented by a dot only. Quotation marks and color code as specified in figure 1; asterisksindicate EST taxa contributed by the authors.
2457
Dow
nloaded from https://academ
ic.oup.com/m
be/article/27/11/2451/1113513 by guest on 10 January 2022

Meusemann et al. · doi:10.1093/molbev/msq130 MBE
FIG. 3.Consensus network of all 25 PhyloBayes trees. Consensus network of all 25 PhyloBayes chains of the SOS was calculated with SplitsTree 4.8and visualizes incongruences between 25 topologies (treshold = 0.01, averaged weights). The color code is specified in figure 1.
a complete disintegration of the muscular tube into seg-mentally arranged muscle systems, segmentally arrangedsclerotized exoskeletal structures, and a fully ganglionatedorganization of the central nervous system. Earlier morpho-logical and molecular analyses have placed onychophoransas either a sister group to Tardigrada + Euarthropoda (BuddandTelford 2009) or sister group to Euarthropoda (Roedinget al. 2007; Dunn et al. 2008; Edgecombe 2009), thus leav-ing the position of onychophorans unresolved. ML (fig. 1)and Bayesian (fig. 2) analyses of our SOS resolve the posi-
tion of the onychophorans and show strong support for theclade Onychophora + Euarthropoda. A clade Onychophora+ Euarthropoda is compatible with the view that fully dif-ferentiated segmentation, including ganglionization of thecentral nervous system evolved in a common stem-lineageof onychophorans and euarthropods. This view implies thatonychophorans primarily lack many characteristics of theeuarthropod body organization (Hou and Bergstrom 1995;Edgecombe 2009). The interpretation of the fossil recordof “lobopodian”-grade organisms as possible stem group
2458
Dow
nloaded from https://academ
ic.oup.com/m
be/article/27/11/2451/1113513 by guest on 10 January 2022

A Phylogeny of Arthropods Based on New EST Data · doi:10.1093/molbev/msq130 MBE
Table 2. Log-Likelihood Values (harmonic means) and Chain Combinations of All PhyloBayes Runs for the SOS.
Log Likelihood Chain Combination MaxdiffChain ID (harmonicmean, burnin-in excluded) (“triple” chain) (<0.3)
18 948174.861012454 c04—c18—c20 0.18604 948217.993492174 c23—c01—c06 0.20293320 948376.710282837 c21—c23—c08 0.2078716 948469.642382507 c21—c23—c01 0.1883305 948525.74067471 c01—c23—c08 0.2078722 948678.821621205 c21—c08—c01 0.2078723 948708.71215524 c22—c05—c14 0.2364721 948752.989770425 c22—c05—c16 0.1865308 948757.764925626 c22—c14—c16 0.2364714 948779.209757328 c05—c14—c16 0.162101 948865.845517544 All 25 chains 1
Log-likelihood (harmonic means) of all log likelihood values, 20,000 cycles per chain, burn-in (5,000 cycles) excluded; chain combination consisting of three chains each percombination (triple) for which the maxdiff value<0.3; maxdiff: discrepancy value observed across all bipartitions for the given triple chain (PhyloBayes tool).
representativesof euarthropods is also compatiblewith thisconclusion (Hou and Bergstrom 1995).
Euarthropoda Including Pycnogonids Favored over the“Cormogonida”Themonophyly of euarthropods is well established, whereasrelationships within euarthropods, between myriapods, seaspiders, chelicerates, crustaceans, and hexapods are prob-lematic (compare results of Dunn et al. 2008; Regier et al.2008, 2010; von Reumont et al. 2009).
Sea spiders (Pycnogonida) represent an extremely aber-rant group of arthropods. Earliermorphological and molec-
ular studies have placed sea spiders either as a sister groupof Euchelicerata (Bourlat et al. 2008; Brenneis et al. 2008;Dunn et al. 2008) or considered them as the first branchof euarthropods (“Cormogonida” hypothesis, Zrzavy et al.1998; Maxmen et al. 2005). Although the position of sea spi-ders is not resolved in the ML tree (fig. 1), the Bayesian tree(fig. 2) shows monophyletic chelicerates including sea spi-ders with high support (pP 0.99). This result corroboratesother phylogenomic analyses (Dunn et al. 2008; Regier et al.2010, but weakly supported) as well as hox gene and neu-roanatomical studies (Jager et al. 2006; Brenneis et al. 2008),which demonstrated the homology of deuterocerebral
Table 3. Selected Clades and Support Values of ML and Bayesian Reconstructions Inferred for the SOS.
Selected Clades Bootstrap Support (%) Posterior Probability
(Tardigrada,Nematoda) 100 1(Onychophora,Euarthropoda) 97 1((Tardigrada,Nematoda),(Onychophora,Euarthropoda)) 100 1Euarthropoda 100 1Mandibulata — —Myriochelata — 0.57Chelicerata — 0.99Euchelicerata 100 1Pancrustacea 100 1(Amphipoda,Decapoda) 100 1(Copepoda,Cirripedia) 78 —((Amphipoda,Decapoda),(Copepoda,Cirripedia)) 99 —((Amphipoda,Decapoda),Cirripedia) — 0.81(((Amphipoda,Decapoda),Cirripedia),Copepoda) — 0.99(Branchiopoda,Hexapoda) 92 1Hexapoda 100 1Enthognatha 86 0.5(Collembola,(Protura,Diplura)) 86 0.5Nonoculata: (Protura,Diplura) 100 1Ectognatha: (Archaeognatha,Pterygota) 100 1Pterygota 82 1Chiastomyaria: (Odonata,(Ephemeroptera,Neoptera)) — —Paleoptera: (Odonata,Ehemeroptera) — 0.99Neoptera — 1(Ephemeroptera,Hemiptera) 74 —Endopterygota 100 1(Hymenoptera,remaining endopterygote clades) 100 1(Coleoptera,(Lepidoptera,Diptera)) 100 1(Lepidoptera,Diptera) 100 1
2459
Dow
nloaded from https://academ
ic.oup.com/m
be/article/27/11/2451/1113513 by guest on 10 January 2022
Meusemann et al. · doi:10.1093/molbev/msq130 MBE
appendages of sea spiders and euchelicerates. It suggeststhat sea spiders should be included within chelicerates. Ourresults are inconclusive regarding the positionof the pycno-gonids, comparing theML and the Bayesian reconstruction,but the latter agrees with established “nonmolecular” data(Jager et al. 2006; Brenneis et al. 2008) that support pycno-gonids as a sister group to Euchelicerata.
The Position of Myriapoda Cause Problems toAddress Mandibulata versus MyriochelataMonophyly of mandibulate arthropods (Myriapoda + Crus-tacea + Hexapoda) has received substantial support frommorphological studies (Richter 2002; Harzsch et al. 2005;Harzsch 2006; Scholtz and Edgecombe 2006; Muller et al.2007; Backer et al. 2008) and from some molecular anal-yses (Telford et al. 2008; Regier et al. 2008, 2010). Withinmandibulates, two alternative clades, either Myriapoda+ Hexapoda (Atelocerata, Heymonds 1901, or Tracheata,Pocock 1893) or Crustacea + Hexapoda (Pancrustacea,Zrzavy and Stys 1997) or Tetraconata, Dohle 2001) havebeen proposed by Grimaldi (2010). Both hypotheses uti-lize the presence of complex character systems support-ing each view (Harzsch 2006; Backer et al. 2008; Mayer andWhintington 2009). Molecular evidence, however, has re-cently accumulated for a clade Myriapoda + Chelicerata,coined Myriochelata (Pisani et al. 2004), or Paradoxopoda(Mallatt et al. 2004). This conflicts with the Mandibulataconcept (Mallatt et al. 2004; Roeding et al. 2007; Dunnet al. 2008). At the same time, recent studies have demon-strated a high sensitivity of reconstructing Paradoxopodawith respect to gene choice, taxon sampling, and outgroupselection (Bourlat et al. 2008; Philippe et al. 2009). The mostrecent study addressing this issue was published by Regieret al. (2010)basedonnuclear,mainlynonribosomal protein-coding genes, which again supports Mandibulata. Riboso-mal proteins, however, are hardly considered and this resultshould be interpreted with caution. Furthermore, there islittlemorphological data supporting a clade Paradoxopoda(Mayer andWhintington 2009) in contrast to data support-ing Mandibulata (Wagele 1993; Harzsch 2006; Backer et al.2008). A clade Paradoxopoda would imply the independentevolutionof the labium, the loss of the secondpair of anten-nae, and the independent evolution of ectodermal malphi-gian tubules in myriapods and hexapods.
In our analyses (including ribosomal and nonribosomalsingle copy genes), the position ofmyriapods is not resolved.In the Bayesian tree, myriapods emerge as a sister group tochelicerates with low support. In the ML tree, relationshipsbetween myriapods, sea spiders, euchelicerates, and pan-crustaceans remain unresolved. The results of our phyloge-nomic analyses and rRNA-based analyses (e.g., von Reumontet al. 2009) indicate that the unstable position ofmyriapodsis not caused by a single myriapod taxon but probably is re-lated to a systematic phenomenon of myriapod molecularevolution. To resolve the myriapod position in the arthro-pod tree, we therefore need to better understand hetero-geneity of substitutional processes among arthropods andto include all myriapod groups in phylogenomic analyses.
Pancrustacea with Branchiopoda as a Sister Group toHexapodaOur data support a clade Crustacea + Hexapoda (Pan-crustacea, 100% bootstrap support and 1.0 pP). Withincrustaceans, relationships are still far from being resolved.Representativesof importantcrustacean groups are still notcovered by EST data. Only few published nonmalacostracanESTprojects exist (Branchiopoda, Copepoda, andCirripedia,presented in this study) (Stillman et al. 2008). Therefore,discussing the sister group of hexapods requires caution,and further EST data for representatives ofmajor crustaceangroups (e.g., Remipedia, Leptostraca) are required.
In rRNA-based studies, copepods (Cyclopidae) werefound to be a sister group to hexapods (Mallatt and Giribet2006; Mallatt et al. 2010; von Reumont et al. 2009). In ouranalyses, Branchiopoda consistently emerge as a sister groupto Hexapoda (1.0 pP in the Bayesian approach and mod-erately supported 92% bootstrap support in ML analyses).This corroborates results of other single- and multigeneanalyses (Regier et al. 2005; Dunn et al. 2008; Mallatt et al.2010; Philippe et al. 2009). This well-supported clade Bran-chiopoda + Hexapoda conflicts with described potentialsynapomorphies of Malacostraca and Hexapoda (Harzsch2006), for example, the presence of a third neuropil andchiasmata of the lateral eyes. Ertas et al. (2009) suggest aclose relationship of Remipedia and Hexapoda based onhemocyanin. This result is underpinned by neuroanatomi-cal data (Fanenbruck et al. 2004; Fanenbruck and Harzsch2005). Regier et al. (2010) inferred a clade “Xenocarida”withRemipedia + Cephalocarida as a sister group to Hexapoda,with low support at the amino acid level and high sup-port at nucleotide level. Remipedia as the sister group toCephalocarida is contradicted by new data on Remipedialarvae (Koenemann et al. 2007, 2009). The incongruence be-tween molecular and morphological results concerning thesister group relationship ofhexapods cannot be resolvedyet.Careful analyses of signal quality in molecular andmorpho-logical data are still required, along with more moleculardata on Remipedia and Cephalocarida.
Monophyletic Hexapoda, Entognatha, andEctognathaBased on morphological analyses, hexapods are assumedto be monophyletic (Dohle 2001; Bitsch and Bitsch2004; Harzsch et al. 2005; Harzsch 2006; Ungerer andScholtz 2008). The monophyly of ectognathous hexapods(Archaeognatha + pterygote insects, see Hennig 1981;Kristensen 1991) seems well founded by single-gene anal-yses (e.g., Kjer et al. 2006; Misof et al. 2007; von Reumontet al. 2009), is supported by nuclear protein-coding genes(Regier et al. 2010), and also corroborated by our phyloge-nomic data; this clade “has likewise never been seriouslychallenged” (Grimaldi 2010).
In contrast, the monophyly of entognathous hexapods(Protura, Diplura, and Collembola) is generally ambigu-ous (see review of Grimaldi 2010). The interpretation ofcharacter states within entognathous hexapods is difficultbecause of extreme adaptations to subterranean or cryptic
2460
Dow
nloaded from https://academ
ic.oup.com/m
be/article/27/11/2451/1113513 by guest on 10 January 2022

A Phylogeny of Arthropods Based on New EST Data · doi:10.1093/molbev/msq130 MBE
habitats. The presence of many plesiomorphic charac-ter states (e.g., presence of fully musculated antennae,abdominal appendages, anameric development [Protura],unsegmented tarsi) gives them an important role in under-standing the evolution of hexapods. Our Bayesian and MLanalyses recovered Entognatha as a monophyletic group,albeit weakly supported. Within Entognatha, we obtainstrong support for a sister group relationship of Protura andDiplura, a clade coined Nonoculata (Luan et al. 2005). Thiscorroborates recent single-gene analyses (Dell’Ampio et al.2009; Mallatt et al. 2010; von Reumont et al. 2009). Morpho-logical evidence for this clade is still ambiguous (Szucsichand Pass 2008). Our results disagree with inferred relation-ships of primary wingless hexapods based onmitochondrialdata (Nardi et al. 2003; Carapelli et al. 2005, 2007). Thoseauthors proposed the polyphyly of hexapods with a place-ment of springtails (Collembola) as a sister group to otherpancrustacean taxa, implying that features of the hexapodbauplan evolved at least twice. Reanalyses of these mito-chondrial data (Delsuc et al. 2003) yielded monophyletichexapods (although weakly supported). Those analyses,however, never included proturans. Also in recent studies,both Protura and Diplura (e.g., Timmermans et al. 2008;Aleshin et al. 2009), or at least Protura, are missing (Regieret al. 2008, 2010). Including these orders is indispensableto infer deep hexapod relationships. Our analyses based onmuch more extensive phylogenomic data, including all or-ders of monocondyl, primary wingless hexapods, yieldedstrong support for monophyletic hexapods. We concludethat hexapods are monophyletic and that the distinctivebauplan evolved only once.
Relationships among pterygote insects are still disputed.A puzzling problem is the early evolution of winged in-sects (Whitfield and Kjer 2008). Mayflies, dragonflies, andneopterous winged insects appear early in the fossil record.Morphological and molecular analyses support a clade(Odonata (Ephemeroptera + Neoptera)) coined “Chias-tomyaria” (Boudreaux 1979; Kjer 2004), or “Metaptery-gota” (Ephemeroptera (Odonata + Neoptera)) (see Zhanget al. 2008; Borner 1909), or “Palaeoptera” ((Odonata +Ephemeroptera) Neoptera) (see Hennig 1981; Kukalova-Peck 1983). Most molecular analyses support either a“Chiastomyaria” or “Palaeoptera” clade (see discussion inSimon et al. 2009). A possible explanation for the difficult-to-resolve relationships is an “explosive radiation” onceflight evolved (Whitfield and Kjer 2008). Our phyloge-nomic data are inconclusive inML tree reconstructions, butstrongly support “Palaeoptera” in Bayesian analyses. Con-vincing morphological synapomorphies for Paleoptera andNeoptera are lacking.
Within neopterous insects, relationships among en-dopterygote insects are a major focus of scientific activity.For example, it is unclear whether beetles + neuropteridans(Neuropteroidea) branch off first or whether hymenopter-ans are the sister group to all other endopterygote insects(Kristensen 1999; Kukalova-Peck and Lawrence 2004; Beuteland Pohl 2006;Wiegmann et al. 2009). Our analyses stronglysupportmost orders of Endopterygota (figs. 1 and2). Several
of these clades corroborate previous results based on singlenuclear genes (von Reumont et al. 2009). Our phylogenomicapproach also unambiguously supports hymenopterans asthe sister group to all other endopterygote insects and cor-roborates previous studies (e.g., Savard et al. 2006; Simonet al. 2009; Wiegmann et al. 2009) in contrast to conclu-sions based on complete mitochondrial genomes (Castroand Dowton 2005). This result will be extremely importantin interpreting and understanding early extinct endoptery-gote insects and the evolution of this most species-richgroup of arthropods.
ConclusionsWe show that phylogenomic studies, although raising hopeto reach a resolved arthropod tree, still face challenges in in-terpreting the strength and quality of the phylogenetic sig-nal. We also illustrate unresolved incongruences betweenmorphological and molecular analyses. This, in our opin-ion, should challenge systematists of every camp to presentthe strength, quality, and deficiencies of their evidence andwork toward resolving outstanding issues.
Supplementary MaterialThe Supplementary Material containing Supplementarytables 1-2, Supplementary figures 1-6 and Supplementaryliterature are available at Molecular Biology and Evolutiononline (http://www.mbe.oxfordjorurnals.org/).
AcknowledgmentsWe acknowledge Nikola Szucsich, Daniela Bartel, JohannesDambach, Markus Pennerstorfer, Erich Eder, FranciscoJavier Cristobo, Hilke Ruhberg, and Sara Khadjeh forsampling and delivering specimens or tissues. We are alsograteful to Michael Kube and Richard Reinhardt (MPIMG,Berlin, Germany) for the construction and sequencingof cDNA libraries and for submitting assembled contigs.We thank Benjamin Meyer, Nikola Szucsich, Janus Borner,Roman Stocsits, and Stefan Grunewald for discussionand help with software applications and Alexandros Sta-matakis for RAxML support. Special thanks go to KatharinaMisof and Michael Stachowitsch for linguistic help. Wealso gratefully thank Barbara Holland and anonymousreviewers for providing constructive comments thatimproved this manuscript. The data matrices are avail-able from Treebase (www.treebase.org) or from http://www.zfmk.de/web/Forschung/Molekularlabor/Datenstze/index.en.html. This is a collaboration of the “ArthropodNetwork” within the Deutsche Forschungsgemeinschaft(DFG) Priority Program 1174 “Deep Metazoan Phylogeny”(http://www.deep-phylogeny.org). B.M. and K.M. weresupported by the DFG grant MI 649/6-2 and J.W.W., P.K.,and B.M.v.R. were supported by grants WA530/33 andWA530/34. H.H. and S.Si. were funded by the DFG grantHA 1947/5 and F.R. and T.B. by the DFG grant Bu956/8.S.St. was granted by the DFG project HA 1628/8 and A.v.H.and I.E. were supported by the WWTF. G.P. was funded by
2461
Dow
nloaded from https://academ
ic.oup.com/m
be/article/27/11/2451/1113513 by guest on 10 January 2022

Meusemann et al. · doi:10.1093/molbev/msq130 MBE
the Austrian Science Foundation (FWF) grant P 20497-B17and the SuGI-project (S.B. and V.A.) was supported by theBMBF, Germany.
Author’s ContributionsF.R. and T.B. delivered EST data for onychophorans, myri-apods, pycnogonids, and euchelicerates. B.M.v.R. and J.W.W.supplied ESTs for all new crustacean species. K.M. and B.M.provided ESTs for four hexapod species and M.W. and G.P.enabled the proturan EST project to be conducted. S.Si.and H.H. delivered EST data for two pterygote insects. Pro-cessing of EST data and orthologous gene prediction wereperformed by S.St. and I.E. Alignment masking and new re-duction heuristics were developed by B.M. K.M., B.M., andB.M.v.R. designed the study, and analyses were conductedby K.M., B.M.v.R., S.Si., and B.M. P.K. provided Perl-Scriptsand was involved in development of reduction heuristics,S.B. and V.A. enabled all Bayesian analyses with technicaland computational support. Themanuscript was written byB.M., K.M., B.M.v.R., T.B., S.Si., and S.St. with comments andrevisions from J.W.W., G.P., I.E., S.B., V.A., and A.v.H. All au-thors read and approved the final manuscript.
ReferencesAleshin VV, Mikhailov KV, Konstantinova AV, Nikitina MA, Rusinc
LY, Buinova DA, Kedrova OS, Petrov NB. 2009. On the phyloge-netic position of insects in the Pancrustacea clade.Mol Biol (Mosk).43:804–818.
Backer H, FanenbruckM,Wagele JW. 2008. A forgotten homology sup-porting the monophyly of Tracheata: the subcoxa of insects andmyriapods re-visited. Zool Anz. 247:185–207.
Beutel RG, Pohl H. 2006. Endopterygote systematics—where do westand and what is the goal (Hexapoda, Arthropoda)? Syst Entomol.31:202–219.
Bitsch J, Bitsch C. 2004. Phylogenetic relationships of basal hexapodsamong the mandibulate arthropods: a cladistic analysis based oncomparative morphological characters. Zool Scr. 33:511–550.
Bleidorn C, Podsiadlowski L, Zhong M, Eeckhaut I, Hartmann S,Halanych KM, Tiedemann R. 2009. On the phylogenetic positionof Myzostomida: can 77 genes get it wrong? BMC Evol Biol. 9:150.
Borner C. 1909. Neue Homologien zwischen Crustaceen und Hexapo-den. Die Beissmandibel der Insecten und ihre phylogenetische Be-deutung. Archi- und Metapterygota. Zool Anz. 34:100–125.
Boudreaux BH. 1979. Arthropod phylogeny: with special reference toinsects. New York: John Wiley and Sons Inc.
Bourlat SJ, Juliusdottir T, Lowe CJ, et al. (14 co-authors). 2006.Deuterostomephylogeny revealsmonophyletic chordates and thenew phylum Xenoturbellida. Nature 444:85–88.
Bourlat SJ, NielsenC, EconomouAD, TelfordMJ. 2008. Testing the newanimal phylogeny: a phylum level molecular analysis of the animalkingdom.Mol Phylogenet Evol. 49:23–31.
Brenneis G, Ungerer P, Scholtz G. 2008. The chelifores of sea spiders(Arthropoda, Pycnogonida) are the appendages of the deutocere-bral segment. Evol Dev. 10:717–724.
Budd GE, Telford MJ. 2009. The origin and evolution of arthropods.Nature 457:812–817.
Carapelli A, Lio P, Nardi F, van der Wath E, Frati F. 2007. Phylogeneticanalysis of mitochondrial protein coding genes confirms the re-ciprocal paraphyly of Hexapoda and Crustacea. BMC Evol Biol. 7(Suppl 2):S8.
Carapelli A, Nardi F, Dallai R, Boore JL, Lio P, Frati F. 2005. Relationshipsbetween hexapods and crustaceans based on four mitochondrial
genes. In: KoenemannS, JennerRA, editors. Crustaceanandarthro-pod relationships. Vol. 16, Crustacean Issues. Boca Raton (FL): CRCPress. p. 295–306.
Castresana J. 2000. Selection of conserved blocks from multiplealignments for their use in phylogenetic analysis. Mol Biol Evol.17:540–552.
Castro LR, DowtonM. 2005. The position of the Hymenoptera withinthe Holometabola as inferred from the mitochondrial genome ofPerga condei (Hymenoptera: Symphyta: Pergidae).Mol PhylogenetEvol. 34:469–479.
Chou HH, Holmes MH. 2001. DNA sequence quality trimming andvector removal. Bioinformatics 17:1093–1104.
Dell’Ampio E, Szucsich NU, Carapelli A, Frati F, Steiner G, SteinacherA, Pass G. 2009. Testing for misleading effects in the phylogeneticreconstruction of ancient lineages of hexapods: influence of char-acter dependence and character choice in analyses of 28S rRNAsequences. Zool Scr. 38:155–170.
Delsuc F, Phillips MP, Penny D. 2003. Comment on “Hexapod origins:monophyletic or paraphyletic?” Science 301:1482.
Delsuc F, Tsagkogeorga G, Lartillot N, Philippe H. 2008. Additionalmolecular support for the new chordate phylogeny. Genesis46:592–604.
Dohle W. 2001. Are the insects terrestrial crustaceans? A discus-sion of some new facts and arguments and the proposal of theproper name “Tetraconata” for the monophyletic unit Crustacea+ Hexapoda. Ann Soc Entomol Fr (New Series). 37:85–103.
Dunn CW, Hejnol A, Matus DQ, et al. (18 co-authors). 2008. Broadphylogenomic sampling improves resolution of the animal tree oflife. Nature 452:745–749.
Ebersberger I, Strauss S, von Haeseler A. 2009. HaMStR: profile hiddenMarkov model based search for orthologs in ESTs. BMC Evol Biol.9:157.
Edgecombe GD. 2009. Palaeontological and molecular evidence link-ing arthropods, onychophorans, and other Ecdysozoa. Evol EduOutreach. 2:178–190.
Ertas B, von Reumont BM, Wagele JW, Misof B, Burmester T. 2009.Hemocyanin suggests a close relationship of Remipedia andHexapoda. Mol Biol Evol. 26:2711–2718.
Fanenbruck M, Harzsch S. 2005. A brain atlas of Godzilliognomusfrondosus Yager, 1989 (Remipedia, Godzilliidae) and comparisonwith the brain of Speleonectes tulumensis Yager, 1987 (Remipedia,Speleonectidae): implications for arthropod relationships. Arthro-pod Struct Dev. 34:343–378.
Fanenbruck M, Harzsch S, Wagele JW. 2004. The brain of the Remi-pedia (Crustacea) and an alternative hypothesis on their phyloge-netic relationships. Proc Natl Acad Sci U S A. 101:3868–3873.
Giribet G. 2003. Molecules, development and fossils in the study ofmetazoan evolution; Articulata versus Ecdysozoa revisited. Zool-ogy (Jena) 106:303–326.
Grimaldi DA. 2010. 400million years on six legs: on the origin and earlyevolution of Hexapoda. Arthropod Struct Dev. 39:191–203.
Hartmann S, Vision TJ. 2008. Using ESTs for phylogenomics: can oneaccurately infer a phylogenetic tree from a gappy alignment? BMCEvol Biol. 8:95.
Harzsch S. 2006. Neurophylogeny: architecture of the nervous sys-tem and a fresh view on arthropod phyologeny. Integr Comp Biol.46:162–194.
Harzsch S, Muller CHG, Wolf H. 2005. From variable to constant cellnumbers: cellular characteristics of the arthropod nervous sys-tem argue against a sister-group relationship of Chelicerata and“Myriapoda” but favour theMandibulata concept.Dev Genes Evol.215:53–68.
Hejnol A, ObstM, Stamatakis A, et al. (17 co-authors). 2009. Assessingthe root of bilaterian animals with scalable phylogenomic meth-ods. Proc Biol Sci. 276:4261–4270.
Hennig W. 1981. Insect phylogeny. New York: John Wiley and Sons.
2462
Dow
nloaded from https://academ
ic.oup.com/m
be/article/27/11/2451/1113513 by guest on 10 January 2022

A Phylogeny of Arthropods Based on New EST Data · doi:10.1093/molbev/msq130 MBE
Heymonds R. 1901. Die Entwicklungsgeschichte der Scolopender.Zoologica 33:1–244, Taf. I–VIII.
Holland B, Moulton V. 2003. Consensus networks: a method for vi-sualising incompatibilities in collections of trees. In: Workshop onAlgorithms in Bioinformatics (WABI) 2812, Proceedings. LectureNotes in Bioinformatics Budapest, Hungary. September 15–20,2003. Berlin: Springer. p. 165–176.
Holmes DS, Bonner J. 1973. Preparation, molecular weight, base com-position, and secondary structureof giant nuclear ribonucleic acid.Biochemistry 12:2330–2338.
HouX, Bergstrom J. 1995. Cambrian lobopodians—ancestors of extantonychophorans? Zool J Linn Soc. 114:3–19.
Huson DH, Bryant D. 2006. Application of phylogenetic networks inevolutionary studies.Mol Biol Evol. 23:254–267.
Jager M, Murienne J, Clabaut C, Deutsch J, Le Guyader H, Manuel M.2006. Homology of arthropod anterior appendages revealed byhox gene expression in a sea spider. Nature 441:506–508.
Kaas RE, Raftery AE. 1995. Bayes factors. J Am Stat. Assoc . 90:773–795.
Katoh K, Toh H. 2008. Recent developments in the MAFFT multiplesequence alignment program. Brief Bioinform. 9:286–298.
Kjer KM. 2004. Aligned 18S and insect phylogeny. Syst Biol. 53:506–514.
Kjer KM, Carle FL, Litman J, Ware J. 2006. A molecular phylogeny ofHexapoda. Arthropod Syst Phylogeny. 64:35–44.
Koenemann S, Olesen J, Alwes F, Iliffe TM, Hoenemann M, UngererP, Wolff C, Scholtz G. 2009. The post-embryonic development ofRemipedia (Crustacea)—additional results and new insights. DevGenes Evol. 219:131–145.
Koenemann S, Schram FR, Bloechl A, Iliffe T. 2007. Post-embryonic de-velopment of remipede crustaceans. Evol Dev. 9:117–121.
Kristensen NP. 1991. Phylogeny of extant hexapods. In: Naumann ID,Lawrence JF, Nielsen ES, Spradberry JP, Taylor RW, Whitten MJ,Littlejohn MJ, editors. The insects of Australia: a textbook forstudents and research workers. Melbourne (Australia): CSIRO,Melbourne University Press.
Kristensen NP. 1999. Phylogeny of endopterygote insects, themost successful lineage of living organisms. Eur J Entomol. 96:237–253.
Kuck P, Meusemann K, Dambach J, Thormann B, von Reumont BM,Wagele JW, Misof B. 2010. Parametric and non-parametric mask-ing of randomness in sequence alignments can be improved andleads to better resolved trees. Front Zool . 7:10.
Kukalova-Peck J. 1983. Origin of the insect wing and wing articulationfrom the arthropodan leg. Can J Zool. 61:1618–1669.
Kukalova-Peck J, Lawrence JF. 2004. Relationships among coleopteransuborders andmajor endoneopteran lineages: evidence from hindwing characters. Eur J Entomol. 101:95–144.
Lartillot N, Blanquart S, Lepage T. 2008. PhyloBayes 2.3—a Bayesiansoftware for phylogenetic reconstruction using mixture mod-els. Available from: http://www.phylobayes.org [2.3c current ver-sions]. University of Montreal.
Lartillot N, Philippe H. 2004. A Bayesian mixture model for across-siteheterogeneities in the amino-acid replacement process. Mol BiolEvol. 21:1095–1109.
Lartillot N, Philippe H. 2008. Improvement of molecular phylogeneticinference and the phylogeny of Bilateria. Philos Trans R Soc Lond BBiol Sci. 363:1463–1472.
Luan Yx, Mallatt JM, Xie Rd, Yang Ym, Yin Wy. 2005. The phyloge-netic positions of three basal-hexapod groups (Protura, Diplura,andCollembola) based on on ribosomal RNAgene sequences.MolBiol Evol. 22:1579–1592.
Mallatt J, Craig CW, Yoder MJ. 2010. Nearly complete rRNA genes as-sembled from across themetazoan animals: effects of more taxa, astructure-based alignment, and paired-sites evolutionary modelson phylogeny reconstruction.Mol Phylogenet Evol . 55:1–17.
Mallatt J, Giribet G. 2006. Further use of nearly complete 28S and 18SrRNA genes to classify Ecdysozoa: 37 more arthropods and a ki-norhynch.Mol Phylogenet Evol. 40:772–794.
Mallatt JM, Garey JR, Shultz JW. 2004. Ecdysozoan phylogeny andBayesian inference: first use of nearly complete 28S and 18S rRNAgene sequences to classify the arthropods and their kin.Mol Phy-logenet Evol. 31:178–191.
Maxmen A, Browne WE, Martindale MQ, Giribet G. 2005. Neu-roanatomyof sea spiders implies an appendicularorigin of thepro-tocerebral segment. Nature 437:1144–1148.
Mayer G, Whintington PM. 2009. Velvet worm development linksmyriapods with chelicerates. Proc Biol Sci. 276:3571–3579.
Misof B, Misof K. 2009. A Monte Carlo approach successfully identi-fies randomness in multiple sequence alignments: a more objec-tive means of data exclusion. Syst Biol. 58:21–34.
Misof B, Niehuis O, Bischoff I, Rickert A, Erpenbeck D, StaniczekA. 2007. Towards an 18S phylogeny of hexapods: accountingfor group-specific character covariance in optimized mixed nu-cleotide/doublet models. Zoology (Jena) 110:409–429.
Muller CHG, Sombke A, Rosenberg J. 2007. The fine structure of theeyes of some bristly millipedes (Penicillata, Diplopoda): additionalsupport for the homology of mandibulate ommatidia. ArthropodStruct Dev. 36:463–476.
Nardi F, Spinsanti G, Boore JL, Carapelli A, Dallai R, Frati F. 2003.Hexapod origins: monophyletic or paraphyletic? Science 299:1887–1889.
Nieselt-Struwe K, von Haeseler A. 2001. Quartet-mapping, a gen-eralization of the likelihood-mapping procedure. Mol Biol Evol.18:1204–1219.
Nylander JAA, Ronquist F, Huelsenbeck JP, Nieves-Aldrey JL. 2004.Bayesian phylogenetic analysis of combined data. Syst Biol. 53:47–67.
Ott M, Zola J, Aluru S, Stamatakis A. 2007 Large-scale maximumlikelihood-based phylogenetic analyses on the IBM BlueGene/L.In: Proceedings of ACM/IEEE Supercomputing Conference 2007.Reno, NV. ACM, New York, NY.
Pertea G, Huang X, Liang F, et al. (12 co-authors). 2003. TIGR gene in-dices clustering tools (TGICL): a software system for fast clusteringof large EST datasets. Bioinformatics 19:651–652.
Philippe H, Derelle R, Lopez P, et al. (20 co-authors). 2009. Phyloge-nomics revives traditional views on deep animal relationships.CurrBiol. 19:706–712.
Pisani D, Poling L, Lyons-Weiler M, Hedges SB. 2004. The coloniza-tion of land by animals: molecular phylogeny and divergence timesamong arthropods. BMC Biol. 2:1.
Pocock RI. 1893. On the classification of the tracheate Arthropoda.Zool Anz. 16:271–275.
Regier JC, Shultz JW, Ganley ARD, et al. (11 co-authors). 2008. Arthro-pod relationships revealed by phylogenomic analysis of nuclearprotein-coding sequences. Syst Biol. 57:920–938.
Regier JC, Shultz JW, Kambic RE. 2005. Pancrustacean phylogeny:hexapods are terrestrial crustaceans and maxillopods are notmonophyletic. Proc Biol Sci. 272:395–401.
Regier JC, Shultz JW, Zwick A, Hussey A, Ball B, Wetzer R, Martin JW,Cunningham CW. 2010. Atzhropod relationships revealed by phy-logenomic analysis of nuclear protein coding sequences. Nature463:1079–1083.
Richter S. 2002. The Tetraconata concept: hexapod-crustacean re-lationships and the phylogeny of Crustacea. Org Divers Evol. 2:217–237.
Roeding F, Hagner-Holler S, Ruhberg H, Ebersberger I, von HaeselerArndt, Kube M, Reinhardt R, Burmester T. 2007. EST sequenc-ing of Onychophora and phylogenomic analysis of Metazoa. MolPhylogenet Evol. 45:942–951.
Sanderson MJ. 2007. Construction and annotation of large phyloge-netic trees. Aust Syst Bot. 20:287–301.
2463
Dow
nloaded from https://academ
ic.oup.com/m
be/article/27/11/2451/1113513 by guest on 10 January 2022

Meusemann et al. · doi:10.1093/molbev/msq130 MBE
Savard J, Tautz D, Richards S, Weinstock GM, Gibbs RA, WerrenJH, Tettelin H, Lercher MJ. 2006. Phylogenomic analysis revealsbees and wasps (Hymenoptera) at the base of the radiation ofholometabolous insects. Genome Res. 16:1334–1338.
Scholtz G, EdgecombeG. 2006. The evolution of arthropod heads: rec-onciling morphological, developmental and palaeontological evi-dence. Dev Genes Evol. 216:395–415.
Simon S, Strauss S, von Haeseler A, Hadrys H. 2009. A phylogenomicapproach to resolve the basal pterygote divergence.Mol Biol Evol.26:2719–2730.
Smith SA, DunnCW. 2008. Phyutility: a phyloinformatics tool for trees,alignments and molecular data. Bioinformatics 24:715–716.
Stamatakis A. 2006a. Phylogeneticmodels of rate heterogeneity: a highperformance computing perspective. In: 20th International Paral-lel and Distributed Processing Symposium (IPDPS 2006), Proceed-ings; 2006 April 25–29; Rhodes Island, Greece. ACM, New York.
Stamatakis A. 2006b. RAxML-VI-HPC: maximum likelihood-basedphylogenetic analyses with thousands of taxa and mixed models.Bioinformatics 22:2688–2690.
Stillman JH, Colbourne JK, Lee CE, et al. (12 co-authors). 2008. Re-cent advances in crustacean genomics. Integr Comp Biol. 48:852–868.
Szucsich NU, Pass G. 2008. Incongruent phylogenetic hypotheses andcharacter conflicts in morphology: the root and early branches ofthe hexapodan tree.Mitt Dtsch Ges Allg Angew. 16:415–429.
Telford MJ, Bourlat SJ, Economou A, Papillon D, Rota-Stabelli O. 2008.The evolution of the Ecdysozoa. Philos Trans R Soc Lond B Biol Sci.363:1529–1537.
Thorley JL, Wilkinson M. 1999. Testing the phylogenetic stability ofearly tetrapods. J Theor Biol. 200:343–344.
Timmermans MJ, D Roelofs D, Marien J, van Straalen NM. 2008.Revealing pancrustacean relationships: phylogenetic analysis ofribosomal protein genes places Collembola (springtails) in amonophyletic Hexapoda and reinforces the discrepancy betweenmitochondrial and nuclear DNAmarkers. BMC Evol Biol. 8:83.
Ungerer P, Scholtz G. 2008. Filling the gap between identified neu-roblasts and neurons in crustaceans adds new support for Tetra-conata. Proc Biol Sci. 275:369–376.
von Reumont BM, Meusemann K, Szucsich NU, et al. (13 co-authors).2009. Can comprehensive background knowledge be incorpo-rated into substitution models to improve phylogenetic analy-ses? A case study onmajor arthropod relationships. BMC Evol Biol.9:119.
Wagele JW. 1993. Rejection of the ‘Uniramia’ hypothesis and im-plications of the Mandibulata concept. Zoologische Jahrbucher.Abteilung fur Systematik, Okologie und Geographie der Tiere.120:253–288.
Whelan S, GoldmanN. 2001. A general empiricalmodel of protein evo-lution derived from multiple protein families using a maximum-likelihood approach.Mol Biol Evol. 18:691–699.
Whitfield JB, Kjer KM. 2008. Ancient rapid radiations of insects: chal-lenges for phylogenetic analysis. Annu Rev Entomol. 53:449–472.
Wiegmann B, Trautwein M, Kim JW, Cassel B, Bertone M, WintertonS, Yeates D. 2009. Single-copy nuclear genes resolve the phylogenyof the holometabolous insects. BMC Biol. 7:34.
Wiens JJ, Moen DS. 2008. Missing data and the accuracy of Bayesianphylogenetics. J Syst Evol. 46:307–314.
Zantke J, Wolff C, Scholtz G. 2008. Three-dimensional reconstruc-tion of the central nervous system ofMacrobiotus hufelandi (Eu-tardigrada, Parachela): implications for the phylogenetic positionof Tardigrada. Zoomorphology 127:21–36.
Zhang J, ZhouC, Gai Y, Song D, ZhouK. 2008. The completemitochon-drial genome of Parafronurus youi (Insecta: Ephemeroptera) andphylogenetic position of the Ephemeroptera. Gene 424:18–24.
Zrzavy J, Mihulka S, Kepka P, Tietz D. 1998. Phylogeny of the Meta-zoa based on morphological and 18S ribosomal DNA evidence.Cladistics 14:249–285.
Zrzavy J, Stys P. 1997. The basic body plan of arthropods: insights fromevolutionary morphology and developmental biology. J Evol Biol.10:653–367.
2464
Dow
nloaded from https://academ
ic.oup.com/m
be/article/27/11/2451/1113513 by guest on 10 January 2022