A Performance Engineering Tool for Tiered Software Systems
8
A Performance Engineering Tool for Tiered Software Systems Vibhu Saujanya Sharma and Pankaj Jalote Dept. of Computer Science and Engineering, Indian Institute of Technology Kanpur, Kanpur, India 208 016 {vsharma, jalote}@cse.iitk.ac.in Kishor S. Trivedi Dept. of Electrical and Computer Engineering, Duke University, Durham, NC 27708, USA [email protected] Abstract Performance engineering is an important activity for software architects and designers. Assessment and tuning of performance can help to make key changes in the system, especially if done early in its development. In this paper, we present a tool for the performance assessment and tuning for systems following the tiered architecture, which is a very commonly used architecture style. The web-based tool al- lows a software designer to specify the system under design and ascertain the different performance attributes as well as the variation in performance with load. If the predicted per- formance is not satisfactory, the tool helps the designer with ascertaining the changes that need to be done for achiev- ing the desired performance. Using an iterative analysis, it presents the designer with detailed steps in terms of im- provements at the software and the hardware level that are necessary to improve the system performance to the desired level. We present an overview of the analysis and tuning approach, along with an example to illustrate the use of the tool. 1 Introduction Performance engineering of software systems has gained special importance, as systems which provide services to a large number of users become common. Responsiveness, system capacity and throughput become important factors for such systems and thus the need to evaluate and tune the system for various performance attributes becomes neces- sary. Performance analysis early in the software life-cycle can facilitate in making key changes in the system design so that the final product performs better. Evaluation and tun- ing are equally important for existing software systems to predict their performance if the workload changes, and to devise ways to handle an increase in workload while main- taining the desired performance. Some of the key questions for software designers while addressing the performance of software systems are: • What is the maximum number of clients the system will be able to handle before it saturates ? • What effect does varying the workload have on the throughput and the average response time ? • What changes need to be done at the hardware or the software level to improve the system performance ? • What are the options if there are constraints on the ex- tra resources ? These questions are pertinent both while designing new systems as well as when evaluating and improving existing systems. Addressing such questions and helping software designers to evaluate system designs and produce systems with desired performance attributes, is the objective of this paper. In the recent past there have been some efforts towards assessing performance early in the software development lifecycle. SAAM (Software Architecture Analysis Method) [2] focuses on how well a software architecture corresponds to needs of various stakeholders for attributes like perfor- mance, modifybility, security, etc. ATAM (Architecture Tradeoff Analysis Method) [2] is aimed at evaluating an ar- chitecture for different attributes and ascertaining tradeoffs between them. However these are broad approaches and do not propose any specific formal methods to evaluate per- formance. Various formal approaches and tools for perfor- mance attributes have also been proposed, such as SPE.ED [10] based on the SPE approach[9], UCM2LQN and LQN solver [6] based on LQNs, CLISSPE [5] for client server systems, etc. The focus of most of the approaches and tools is to evalu- ate the performance characteristics of the specified software system for a given load. They tend to stop at performance prediction and it is left for the performance engineers to de- vise ways to improve the system. This is one area we wish Proceedings of the 30th Annual International Computer Software and Applications Conference (COMPSAC'06) 0-7695-2655-1/06 $20.00 © 2006
Transcript of A Performance Engineering Tool for Tiered Software Systems

A Performance Engineering Tool for Tiered Software Systems
Vibhu Saujanya Sharma and Pankaj JaloteDept. of Computer Science and Engineering,
Indian Institute of Technology Kanpur,Kanpur, India 208 016
{vsharma, jalote}@cse.iitk.ac.in
Kishor S. TrivediDept. of Electrical and Computer Engineering,
Duke University,Durham, NC 27708, USA
Abstract
Performance engineering is an important activity forsoftware architects and designers. Assessment and tuningof performance can help to make key changes in the system,especially if done early in its development. In this paper, wepresent a tool for the performance assessment and tuningfor systems following the tiered architecture, which is a verycommonly used architecture style. The web-based tool al-lows a software designer to specify the system under designand ascertain the different performance attributes as well asthe variation in performance with load. If the predicted per-formance is not satisfactory, the tool helps the designer withascertaining the changes that need to be done for achiev-ing the desired performance. Using an iterative analysis,it presents the designer with detailed steps in terms of im-provements at the software and the hardware level that arenecessary to improve the system performance to the desiredlevel. We present an overview of the analysis and tuningapproach, along with an example to illustrate the use of thetool.
1 Introduction
Performance engineering of software systems has gainedspecial importance, as systems which provide services to alarge number of users become common. Responsiveness,system capacity and throughput become important factorsfor such systems and thus the need to evaluate and tune thesystem for various performance attributes becomes neces-sary. Performance analysis early in the software life-cyclecan facilitate in making key changes in the system design sothat the final product performs better. Evaluation and tun-ing are equally important for existing software systems topredict their performance if the workload changes, and todevise ways to handle an increase in workload while main-taining the desired performance.
Some of the key questions for software designers whileaddressing the performance of software systems are:
• What is the maximum number of clients the systemwill be able to handle before it saturates ?
• What effect does varying the workload have on thethroughput and the average response time ?
• What changes need to be done at the hardware or thesoftware level to improve the system performance ?
• What are the options if there are constraints on the ex-tra resources ?
These questions are pertinent both while designing newsystems as well as when evaluating and improving existingsystems. Addressing such questions and helping softwaredesigners to evaluate system designs and produce systemswith desired performance attributes, is the objective of thispaper.
In the recent past there have been some efforts towardsassessing performance early in the software developmentlifecycle. SAAM (Software Architecture Analysis Method)[2] focuses on how well a software architecture correspondsto needs of various stakeholders for attributes like perfor-mance, modifybility, security, etc. ATAM (ArchitectureTradeoff Analysis Method) [2] is aimed at evaluating an ar-chitecture for different attributes and ascertaining tradeoffsbetween them. However these are broad approaches and donot propose any specific formal methods to evaluate per-formance. Various formal approaches and tools for perfor-mance attributes have also been proposed, such as SPE.ED[10] based on the SPE approach[9], UCM2LQN and LQNsolver [6] based on LQNs, CLISSPE [5] for client serversystems, etc.
The focus of most of the approaches and tools is to evalu-ate the performance characteristics of the specified softwaresystem for a given load. They tend to stop at performanceprediction and it is left for the performance engineers to de-vise ways to improve the system. This is one area we wish
Proceedings of the 30th Annual International Computer Software and Applications Conference (COMPSAC'06)0-7695-2655-1/06 $20.00 © 2006
to address in our work. Also software performance engi-neering has been largely seen as an activity which requiresspecialized skills and in-depth knowledge of both softwarearchitecture and performance modeling. Another motivat-ing factor of our effort is to provide a tool that could beused by software engineers and system administrators.
In this paper we describe a tool called PETTS[Performance Engineering Tool for Tiered Systems], thatwe have developed. We target systems following the tieredstyle [1] which is a widely used architecture style and mostweb-based systems follow this. The tool accepts the speci-fication of the tiered system under consideration through aset of forms and provides the performance evaluation of thesystem based on the approach in [8], showing the variationin performance attributes with load.
If the user finds that the predicted performance is not ad-equate, the tool provides detailed improvement steps whichshould be taken to achieve the desired performance targets.These steps include changes to be made at the hardwareand/or software level along the dimensions of CPU process-ing, I/O processing and bandwidth, and are determined bydoing a series of bottleneck improvements. The tool alsocaters to the situation where there are constraints on the ex-tra resources that are available for performance improve-ment displaying all the steps to be performed. The tool isweb-based and simple to use and does not require knowl-edge of Markov chains and queueing theory.
We discuss the performance engineering of software ar-chitectures in the next section. In section 3 we describe theperformance analysis part of PETTS in detail, elaboratingsystem specification, model generation and performanceevaluation. Section 4 deals with the performance tuningpart of PETTS with details of the bottleneck analysis andthe techniques that are used to suggest changes to improvethe performance. We take an example system throughoutthe paper to show the usage of the tool. We conclude thepaper in section 5.
2 Performance Engineering of Software Ar-chitectures
Performance of a software system is closely tied withthe software architecture [1] it follows. It will be usefulto analyze the performance of a software from its archi-tecture as such an analysis can be done early in its devel-opment. The software architecture determines the way thedifferent components that constitute the software, interactwith each other. Moreover it also defines the deploymentor the mapping of the components on the available hard-ware. Thus while engineering any software system for per-formance, taking its architecture into account becomes veryimportant.
It is useful to evaluate a software, early in its develop-ment for performance attributes such as the average time aclient would take to complete its request (response time),and the number of requests that the system could serviceper unit time (throughput), etc. This allows the designer toascertain how the system will perform once ready. More-over, the behavior of the system with regards to changes inthe workload, such as increase in the number of users onsystem performance is also useful to know while designingthe system. Such evaluation is equally helpful for existingsystems, to ascertain their performance behavior under dif-ferent workloads.
If the performance of a software architecture is not foundto be satisfactory, finding the changes needed to improve theperformance i.e. performance tuning, becomes important.The performance tuning task is to find, where the perfor-mance problem lies, what needs to be changed and by howmuch should it be changed in order to improve and reachthe desired performance level.
Ideally a complete software performance engineeringapproach should not only evaluate and predict the perfor-mance of a software, but also aid in improving its perfor-mance. Thus given the software architecture and the speci-fications regarding the hardware and workload for a system,a performance engineering approach should help in answer-ing such broad questions as:
• How does the system perform and how is the perfor-mance affected by changes in workload ?
• What changes should be made to the architecture toachieve a desired performance level ?
Both of these questions are equally important, and typi-cally the system designers have to respond to such concerns.Our approach which has been implemented in PETTS aimsto help the system designer with answering such questions.PETTS focuses on tiered software architecture, which is awidely used architectural style. As regards to the first ques-tion, we focus on the response time and throughput of thesystem and the variation in these with change in numberof clients, also finding out the performance bottlenecks andthe point of system saturation. For improving the systemperformance, we focus on identifying where and by whatextent the changes are needed both at the hardware and thesoftware level and in what dimension. If certain suggestedchanges are not possible due to constraints, then the toolisolates the useful ones from the set of possible improve-ments such that redundant changes are not done.
3 Performance Analysis in PETTS
From the users perspective, the tool is a set of dynami-cally generated html pages. However internally, the tool can
Proceedings of the 30th Annual International Computer Software and Applications Conference (COMPSAC'06)0-7695-2655-1/06 $20.00 © 2006
be subdivided into a set of collaborating modules, each per-forming a set of related functions. The web-based frontendis coupled to the model generator, the model solver, bottle-neck analysis and performance tuning modules. PETTS iscurrently hosted at: http://www.cse.iitk.ac.in/users/softarch.We first describe the performance evaluation part of PETTSwhich is based on our earlier work [8].We take an exam-ple system consisting of 5 tiers deployed on 3 different ma-chines to demonstrate the use of PETTS as we go through.
3.1 System Specification
The required specifications for the approach include in-formation about the software tiers and the hardware re-sources along with the deployment related information. Theinputs are:
• The total number of tiers in the software system andthe transition probabilities between them.
• The CPU and I/O resource demands per execution ofeach tier.
• The number and speed ratings of the CPUs and diskson each of the available machines and the capacities ofthe various connectors and thread limitations, if any.
• The deployment information i.e. the proposed map-ping between the software tiers and the machines.
• The expected message sizes sent on the network by thetiers and to the first tier by a client.
• The expected workload i.e., the range of the expectednumber of clients accessing the system and the averagethink time of each client.
• The desired response time that the designer wants thesystem to have.
The number of tiers and deployment information is avail-able from the different views in the architecture descriptionof the system [1]. For performance analysis, we need theinformation about the hardware also as above. Note that thespeed rating is the number of times a single CPU or disk onthis machine is faster than the one used to ascertain the re-source demands of the tiers deployed on this machine. Weassume that this scaling is linear. For simplicity, we alsoassume that requests go to each disk with the same proba-bility in a multiple disk machine. The information about theprobabilities of transitions between tiers can be found usingprofiling tools for existing systems [3]. For systems underdesign, data from similar previous systems could be used toestimate these values. The various resource demands can bemeasured for individual tiers by using system tools such asiostat, and top. The measurements have to be conducted
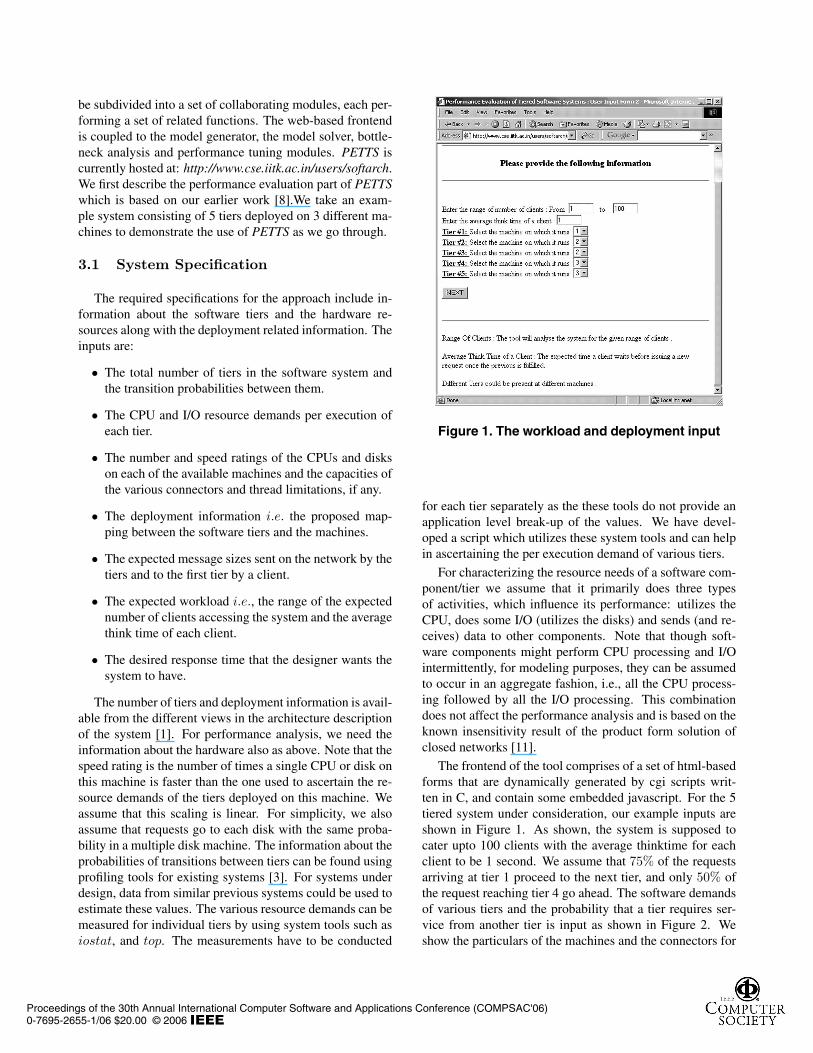
Figure 1. The workload and deployment input
for each tier separately as the these tools do not provide anapplication level break-up of the values. We have devel-oped a script which utilizes these system tools and can helpin ascertaining the per execution demand of various tiers.
For characterizing the resource needs of a software com-ponent/tier we assume that it primarily does three typesof activities, which influence its performance: utilizes theCPU, does some I/O (utilizes the disks) and sends (and re-ceives) data to other components. Note that though soft-ware components might perform CPU processing and I/Ointermittently, for modeling purposes, they can be assumedto occur in an aggregate fashion, i.e., all the CPU process-ing followed by all the I/O processing. This combinationdoes not affect the performance analysis and is based on theknown insensitivity result of the product form solution ofclosed networks [11].
The frontend of the tool comprises of a set of html-basedforms that are dynamically generated by cgi scripts writ-ten in C, and contain some embedded javascript. For the 5tiered system under consideration, our example inputs areshown in Figure 1. As shown, the system is supposed tocater upto 100 clients with the average thinktime for eachclient to be 1 second. We assume that 75% of the requestsarriving at tier 1 proceed to the next tier, and only 50% ofthe request reaching tier 4 go ahead. The software demandsof various tiers and the probability that a tier requires ser-vice from another tier is input as shown in Figure 2. Weshow the particulars of the machines and the connectors for
Proceedings of the 30th Annual International Computer Software and Applications Conference (COMPSAC'06)0-7695-2655-1/06 $20.00 © 2006

Figure 2. The resource demands and transi-tion probabilities
the system in Table 1. All the machines have speed rating asunity. The packet sizes between machines are the total datasize sent on the network between the adjacent layers on thedifferent machines for a single execution/visit.
3.2 Model Generation
Once the data is available, the model generation mod-ule takes over. The first step is modeling the software ar-chitecture as a Discrete Time Markov Chain (DTMC). TheDTMC for a tiered architecture is shown in Figure 3. Thestate of the DTMC at any point in time is determined by thetier in execution at that time. This DTMC model is inter-nally represented by its 1-step transition probability matrixwhich is constructed by using the transition probabilities be-tween the various software tiers. This is then solved to findthe average visit counts to each of the tiers which represent
Table 1. Information regarding machines andconnectors
Machine Hardware # CPUs # DisksMachine 1 2 1Machine 2 1 1Machine 3 1 4Connector Capacities between Uplink DownlinkClients - Machine 1 1MBps 10MBpsMachine 1 - Machine 2 1MBps 1MBpsMachine 2 - Machine 3 1MBps 1MBpsPacket Sizes Uplink DownlinkClients - Machine 1 0.25KB 50KBMachine 1 - Machine 2 5KB 5KBMachine 2 - Machine 3 5KB 5KB
Figure 3. The Tiered Architecture and it’sequivalent DTMC
the average number of times a tier is executed for a user re-quest/job. The average visit counts when multiplied by theaverage resource demands per execution for each tier, pro-vide the total resource demands for a tier from the time, ajob arrives for service till it departs.
Using the deployment information of the various tiers onthe available machines, the total service requirements for ajob on the hardware resources can be calculated for eachmachine. This is used to provide the parameters for variousservice nodes (or servers) in the queueing network model.Moreover the information about the traffic on the connec-tors between the machines is used to assign the parametersto the servers representing the connectors. The queueingnetwork model is then constructed taking into account theworkload information such as the range of the number ofclients, the system is supposed to cater to along with theirthinktimes. More details about this approach can be foundin [8].
Internally, the model generator is programmed in C, andis split into 2 main parts: one for generating and solvingthe DTMC model and the other for generating the queueingmodel to be fed to the model solver. As the model solverwe use is SHARPE[7, 4], the queueing model is saved in atext file with the SHARPE input format.
3.3 Performance Evaluation
The generated system model is fed to the performancemodel solver (SHARPE) which is instructed to output thequantities of interest such as throughput and the utilizationsof each of the servers, etc. The outputs are then processed toestimate other metrics such as the average overall response
Proceedings of the 30th Annual International Computer Software and Applications Conference (COMPSAC'06)0-7695-2655-1/06 $20.00 © 2006
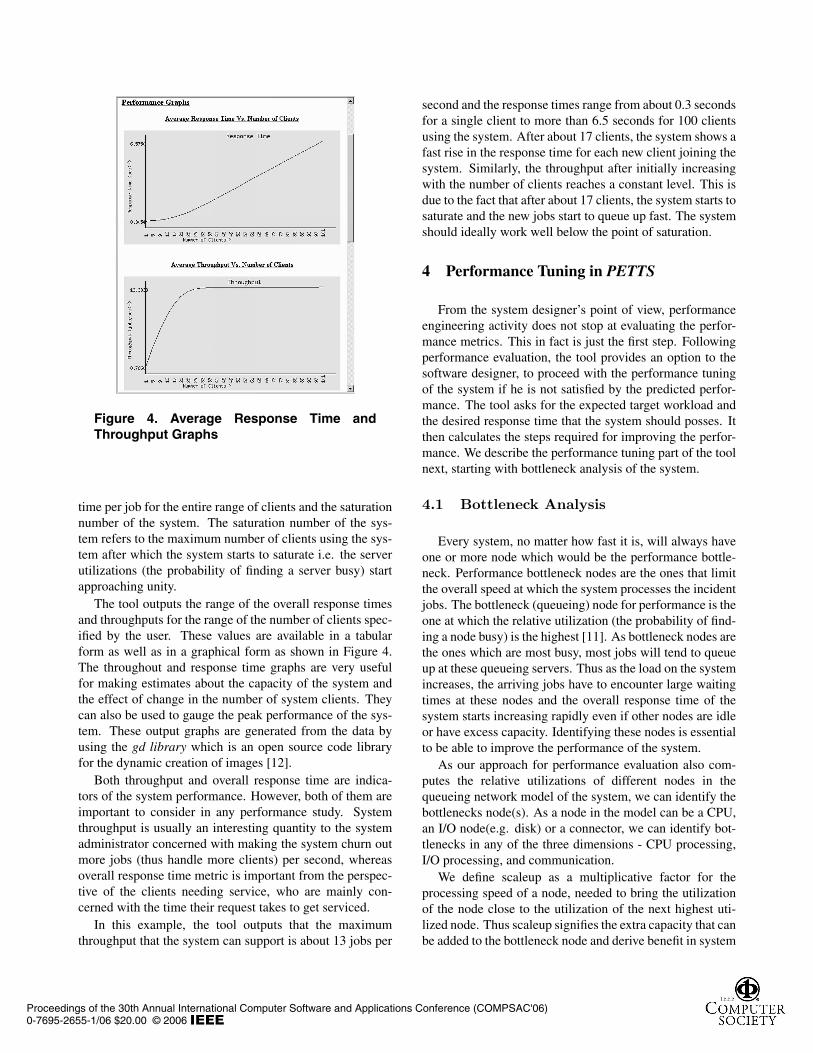
Figure 4. Average Response Time andThroughput Graphs
time per job for the entire range of clients and the saturationnumber of the system. The saturation number of the sys-tem refers to the maximum number of clients using the sys-tem after which the system starts to saturate i.e. the serverutilizations (the probability of finding a server busy) startapproaching unity.
The tool outputs the range of the overall response timesand throughputs for the range of the number of clients spec-ified by the user. These values are available in a tabularform as well as in a graphical form as shown in Figure 4.The throughout and response time graphs are very usefulfor making estimates about the capacity of the system andthe effect of change in the number of system clients. Theycan also be used to gauge the peak performance of the sys-tem. These output graphs are generated from the data byusing the gd library which is an open source code libraryfor the dynamic creation of images [12].
Both throughput and overall response time are indica-tors of the system performance. However, both of them areimportant to consider in any performance study. Systemthroughput is usually an interesting quantity to the systemadministrator concerned with making the system churn outmore jobs (thus handle more clients) per second, whereasoverall response time metric is important from the perspec-tive of the clients needing service, who are mainly con-cerned with the time their request takes to get serviced.
In this example, the tool outputs that the maximumthroughput that the system can support is about 13 jobs per
second and the response times range from about 0.3 secondsfor a single client to more than 6.5 seconds for 100 clientsusing the system. After about 17 clients, the system shows afast rise in the response time for each new client joining thesystem. Similarly, the throughput after initially increasingwith the number of clients reaches a constant level. This isdue to the fact that after about 17 clients, the system starts tosaturate and the new jobs start to queue up fast. The systemshould ideally work well below the point of saturation.
4 Performance Tuning in PETTS
From the system designer’s point of view, performanceengineering activity does not stop at evaluating the perfor-mance metrics. This in fact is just the first step. Followingperformance evaluation, the tool provides an option to thesoftware designer, to proceed with the performance tuningof the system if he is not satisfied by the predicted perfor-mance. The tool asks for the expected target workload andthe desired response time that the system should posses. Itthen calculates the steps required for improving the perfor-mance. We describe the performance tuning part of the toolnext, starting with bottleneck analysis of the system.
4.1 Bottleneck Analysis
Every system, no matter how fast it is, will always haveone or more node which would be the performance bottle-neck. Performance bottleneck nodes are the ones that limitthe overall speed at which the system processes the incidentjobs. The bottleneck (queueing) node for performance is theone at which the relative utilization (the probability of find-ing a node busy) is the highest [11]. As bottleneck nodes arethe ones which are most busy, most jobs will tend to queueup at these queueing servers. Thus as the load on the systemincreases, the arriving jobs have to encounter large waitingtimes at these nodes and the overall response time of thesystem starts increasing rapidly even if other nodes are idleor have excess capacity. Identifying these nodes is essentialto be able to improve the performance of the system.
As our approach for performance evaluation also com-putes the relative utilizations of different nodes in thequeueing network model of the system, we can identify thebottlenecks node(s). As a node in the model can be a CPU,an I/O node(e.g. disk) or a connector, we can identify bot-tlenecks in any of the three dimensions - CPU processing,I/O processing, and communication.
We define scaleup as a multiplicative factor for theprocessing speed of a node, needed to bring the utilizationof the node close to the utilization of the next highest uti-lized node. Thus scaleup signifies the extra capacity that canbe added to the bottleneck node and derive benefit in system
Proceedings of the 30th Annual International Computer Software and Applications Conference (COMPSAC'06)0-7695-2655-1/06 $20.00 © 2006

performance from this addition. Beyond this scaleup, addi-tional improvements at this node may not be of much use assome other node may become the bottleneck. The scaleupsneeded for a bottleneck can be calculated if the secondarybottlenecks are also known. The ratio of the utilizationsof the primary and the secondary bottlenecks will give thescaleup.
The tool provides the primary bottlenecks for the systemfor the specified range of clients and provides the scaleupsneeded for removing the primary bottlenecks. It then up-dates the queueing model to reflect this change and calcu-lates the performance increase if the suggested scaleups aredone. This gives the system designer an estimate of howuseful the scaleup can be. In this example system, the tooltells that the primary bottleneck for 57 clients using the sys-tem is the CPU processing at machine 2 and scaling it upby about 1.22 times would cause around 18% increase inthe system throughput. Note that this bottleneck may be re-moved either by providing a faster processor or by decreas-ing the CPU bound processing in the two software tiers thatare deployed on that machine.
Note that when the system is at a very low load, thebottleneck analysis is of limited value and even changesat a non-bottleneck node might cause a performance im-provement in the system. However the changes at a non-bottleneck node will be useless under high load conditions,which is when performance tuning is most pertinent. Hencewe focus on these high load conditions and target only bot-tleneck nodes in our performance tuning approach. Alsonote that in many systems (e.g systems having multipleprocessor machines), the bottleneck location is dependenton the workload and it may change with variation in thenumber of clients. Thus the only way to ascertain the bot-tleneck node (and proceed with tuning) in such cases is bysolving the queueing model for the relative node utiliza-tions, for the particular workload under study.
4.2 Performance Tuning Steps
The bottleneck analysis module is used by the tool tofind the primary bottlenecks and the scaleups required to re-move them. However, removing a performance bottleneckmay not take the performance to the desired level, and theexercise has to be repeated. Thus following the bottleneckanalysis, the appropriate scaleups are carried out and the im-proved system model is reconstructed and fed to the modelsolver. The model is solved for the specified workload andthe overall response time is calculated. If the response timeis more than the desired value, the scaleups and the perfor-mance gain is logged and whole cycle is repeated. This con-tinues until the response time of the system becomes lesserthan or sufficiently close to the desired value.
When this cycle ends, the tool has calculated the steps
to improve the system to a performance level, which canbe beyond the user’s expectation. However the additionalimprovements (i.e. above what the user desired) may notbe needed and can increase the cost of improvement unnec-essarily. Hence, if the last scaleup which the tool loggedwas greater than what was needed to reach the desired per-formance level, the tool backtracks and performs a binarysearch trying the scaleups from 1 to the last scaleup, check-ing if the response time falls close (say within 10%) to thedesired response time given by the designer. Once thisis achieved, the last step is updated with the newly foundscaleup.
The logged scaleup steps are then outputted along withthe predicted improvements at each step. This informationis also shown in the graphical form, wherein the user couldobserve the reduction in the response time at each step. Theoverall scaleup (i.e. across the different steps) for the differ-ent resources of the system, in terms of CPU or I/O process-ing or bandwidth, is also calculated and presented to thedesigner.
Figure 5. Performance tuning steps and theperformance gain
In the example system, we suppose that the requirementfor the system is an average response time of about 1.5 sec-onds for 100 clients using the system, each with an aver-
Proceedings of the 30th Annual International Computer Software and Applications Conference (COMPSAC'06)0-7695-2655-1/06 $20.00 © 2006
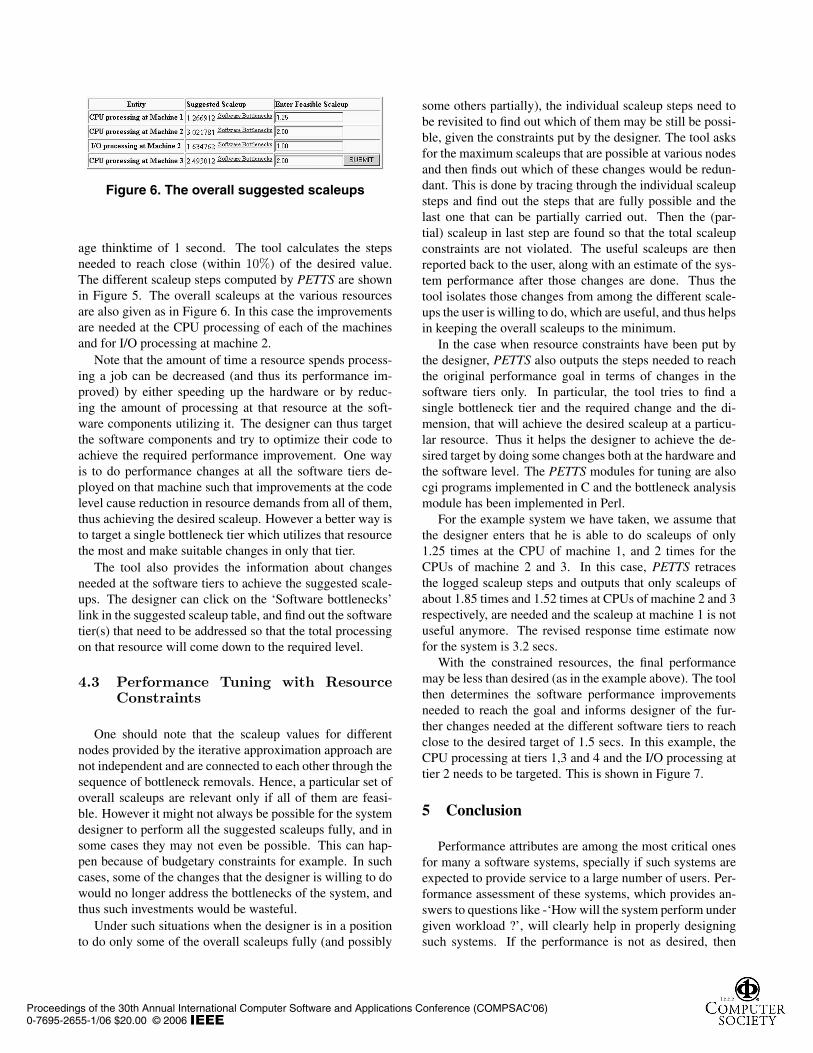
Figure 6. The overall suggested scaleups
age thinktime of 1 second. The tool calculates the stepsneeded to reach close (within 10%) of the desired value.The different scaleup steps computed by PETTS are shownin Figure 5. The overall scaleups at the various resourcesare also given as in Figure 6. In this case the improvementsare needed at the CPU processing of each of the machinesand for I/O processing at machine 2.
Note that the amount of time a resource spends process-ing a job can be decreased (and thus its performance im-proved) by either speeding up the hardware or by reduc-ing the amount of processing at that resource at the soft-ware components utilizing it. The designer can thus targetthe software components and try to optimize their code toachieve the required performance improvement. One wayis to do performance changes at all the software tiers de-ployed on that machine such that improvements at the codelevel cause reduction in resource demands from all of them,thus achieving the desired scaleup. However a better way isto target a single bottleneck tier which utilizes that resourcethe most and make suitable changes in only that tier.
The tool also provides the information about changesneeded at the software tiers to achieve the suggested scale-ups. The designer can click on the ‘Software bottlenecks’link in the suggested scaleup table, and find out the softwaretier(s) that need to be addressed so that the total processingon that resource will come down to the required level.
4.3 Performance Tuning with ResourceConstraints
One should note that the scaleup values for differentnodes provided by the iterative approximation approach arenot independent and are connected to each other through thesequence of bottleneck removals. Hence, a particular set ofoverall scaleups are relevant only if all of them are feasi-ble. However it might not always be possible for the systemdesigner to perform all the suggested scaleups fully, and insome cases they may not even be possible. This can hap-pen because of budgetary constraints for example. In suchcases, some of the changes that the designer is willing to dowould no longer address the bottlenecks of the system, andthus such investments would be wasteful.
Under such situations when the designer is in a positionto do only some of the overall scaleups fully (and possibly
some others partially), the individual scaleup steps need tobe revisited to find out which of them may be still be possi-ble, given the constraints put by the designer. The tool asksfor the maximum scaleups that are possible at various nodesand then finds out which of these changes would be redun-dant. This is done by tracing through the individual scaleupsteps and find out the steps that are fully possible and thelast one that can be partially carried out. Then the (par-tial) scaleup in last step are found so that the total scaleupconstraints are not violated. The useful scaleups are thenreported back to the user, along with an estimate of the sys-tem performance after those changes are done. Thus thetool isolates those changes from among the different scale-ups the user is willing to do, which are useful, and thus helpsin keeping the overall scaleups to the minimum.
In the case when resource constraints have been put bythe designer, PETTS also outputs the steps needed to reachthe original performance goal in terms of changes in thesoftware tiers only. In particular, the tool tries to find asingle bottleneck tier and the required change and the di-mension, that will achieve the desired scaleup at a particu-lar resource. Thus it helps the designer to achieve the de-sired target by doing some changes both at the hardware andthe software level. The PETTS modules for tuning are alsocgi programs implemented in C and the bottleneck analysismodule has been implemented in Perl.
For the example system we have taken, we assume thatthe designer enters that he is able to do scaleups of only1.25 times at the CPU of machine 1, and 2 times for theCPUs of machine 2 and 3. In this case, PETTS retracesthe logged scaleup steps and outputs that only scaleups ofabout 1.85 times and 1.52 times at CPUs of machine 2 and 3respectively, are needed and the scaleup at machine 1 is notuseful anymore. The revised response time estimate nowfor the system is 3.2 secs.
With the constrained resources, the final performancemay be less than desired (as in the example above). The toolthen determines the software performance improvementsneeded to reach the goal and informs designer of the fur-ther changes needed at the different software tiers to reachclose to the desired target of 1.5 secs. In this example, theCPU processing at tiers 1,3 and 4 and the I/O processing attier 2 needs to be targeted. This is shown in Figure 7.
5 Conclusion
Performance attributes are among the most critical onesfor many a software systems, specially if such systems areexpected to provide service to a large number of users. Per-formance assessment of these systems, which provides an-swers to questions like -‘How will the system perform undergiven workload ?’, will clearly help in properly designingsuch systems. If the performance is not as desired, then
Proceedings of the 30th Annual International Computer Software and Applications Conference (COMPSAC'06)0-7695-2655-1/06 $20.00 © 2006

Figure 7. Tuning under resource constraints
the pertinent question becomes - ‘What are the requiredchanges in the system such that the desired performancelevel is achieved?’. These questions are relevant for a sys-tem being designed as well as for an existing system.
In this paper we discussed PETTS, a tool for performanceanalysis and tuning of systems following the tiered archi-tecture, which is a widely followed software architecturalstyle. The tool is web-based and is available freely for use.The tool has two main parts - performance evaluation andperformance tuning. The tool accepts the information re-garding the software tiers and allocation on the hardwareusing html-based forms. Using this information, a perfor-mance model of the system is built [8], which is the ana-lyzed to provide system throughput and response time andhow they vary with varying number of clients and this re-sult is shown graphically as well as in tabular form. This issupplemented with information regarding the bottlenecks inthe system.
The performance tuning and improvement part allowsthe user to specify a desired performance target and PETTSprovides steps to reach that target. These steps consist ofthe changes needed at the various the hardware devices orsoftware tiers, in terms of CPU or I/O processing and band-width. The performance improvement after each scaleupstep is shown and the aggregate scaleups or improvementsneeded at different system nodes is provided.
If the designer is unable to go ahead with the proposedscaleups due to resource constraints, he/she can specify theset of possible scaleups and the tool then isolates the usefulones from this set, such that the maximum performance gaincould be achieved without any redundant scaleups. The toolalso outputs the remaining improvements which need to bedone at various software tiers to reach the original target.
We have described how the model for evaluating perfor-mance is built and how it is solved using a performancemodel solver. We have also illustrated the usage of the tooland the various outputs that it provides with the help of an
example. The tool requires no knowledge of queueing the-ory or Markov chains and the input information is such thatcan be provided by software engineers and designers.
We are currently working on extending the tools’s ca-pabilities to help a designer decide the allocation of soft-ware components on the available hardware for best perfor-mance. We are also in the process of improving the per-formance tuning part to allow for tuning in more complexsituations such as limited threads at a machine, etc. Anotherdirection which we are exploring is to consider different ar-chitecture styles and eventually general architectures. Forthese, it is a challenge to devise an approach with simplespecification methods that a system designer could use, butrich enough for analyzing and tuning performance.
References
[1] P. Clements, D. Garlan, L. Bass, J. Stafford, R. Nord,J. Ivers, and R. Little. Documenting Software Architectures:Views and Beyond. Pearson Education, 2002.
[2] P. Clements, R. Kazman, and M. Klein. Evaluating softwarearchitectures: methods and case studies. Addison-WesleyLongman Publishing Co., Inc., Boston, MA, USA, 2002.
[3] K. Goseva-Popstojanova and K. S. Trivedi. Architecture-based approach to reliability assessment of software sys-tems. Performance Evaluation, 45:179–204, 2001.
[4] C. Hirel, R. Sahner, X. Zang, and K. S. Trivedi. Reliabilityand performability modeling using sharpe 2000. In Proceed-ings 11th International Conference TOOLS 2000. Schaum-burg, USA, March 2000.
[5] D. A. Menasce and H. Gomaa. A method for design and per-formance modeling of client/server systems. IEEE Transac-tions on Software Engineering, 26(11):1066–85, 2000.
[6] D. Petriu and M. Woodside. Software performance modelsfrom system scenarios in use case maps. In ProceedingsPerformance TOOLS 2002. London, 2002.
[7] R. Sahner, K. Trivedi, and A. Puliafito. Performance and Re-liability Analysis of Computer Systems: An Example-Basedapproach Using the SHARPE Software Package. KluwerAcademic Publishers, 1996.
[8] V. S. Sharma, P. Jalote, and K. S. Trivedi. Evaluat-ing performance attributes of layered software architecture.In Proceedings of 8th International SIGSOFT Symposiumon Component-based Software Engineering (CBSE), LNCS3489, pages 66–81. St. Louis, MO, USA, May 2005.
[9] C. U. Smith. Performance Engineering of Software Systems.Addison Wesley, 1990.
[10] C. U. Smith, C. M. Llad, V. Cortellessa, A. D. Marco, andL. G. Williams. From uml models to software performanceresults: an spe process based on xml interchange formats. InProceedings of 5th international Workshop on Software andPerformance (WOSP). Palma de Mallorca, Spain, July 2005.
[11] K. S. Trivedi. Probability and Statistics with Reliability,Queuing, and Computer Science Applications. John Wileyand Sons, New York, 2001.
[12] www.boutell.com/gd/. GD Graphics Library. 2005.
Proceedings of the 30th Annual International Computer Software and Applications Conference (COMPSAC'06)0-7695-2655-1/06 $20.00 © 2006