A One-Year Prospective Follow-Up Study on the Health Profile ...
14
International Journal of Environmental Research and Public Health Article A One-Year Prospective Follow-Up Study on the Health Profile of Hikikomori Living in Hong Kong John W. M. Yuen 1, * , Victor C. W. Wong 2 , Wilson W. S. Tam 3 , Ka Wing So 4 and Wai Tong Chien 5 1 School of Nursing, The Hong Kong Polytechnic University, Hung Hom, Kowloon, Hong Kong 2 Department of Social Work, Hong Kong Baptist University, Kowloon Tong, Kowloon, Hong Kong; [email protected] 3 Alice Lee Centre for Nursing Studies, National University of Singapore, Singapore 119077, Singapore; [email protected] 4 Withdrawal Youth Service, Hong Kong Christian Service, Tsim Sha Tsui, Kowloon, Hong Kong; [email protected] 5 Nethersole School of Nursing, The Chinese University of Hong Kong, Shatin, New Territories, Hong Kong; [email protected] * Correspondence: [email protected]; Tel.: +852-2766-4130; Fax: +852-2364-9663 Received: 2 January 2019; Accepted: 12 February 2019; Published: 14 February 2019 Abstract: Background: A prospective cohort study was conducted to follow-up on 104 participants on their changes of social, psychological and physical health as exposed to the hikikomori lifestyle. Methods: Participants were interviewed at baseline, 6 months and 12 months by administering a set of questionnaires and anthropometric measurements. Results: All three health domains of hikikomori were significantly improved over the follow-up period as evidenced by: (1) increased social network scores from 2.79 ± 1.80 to 3.09 ± 1.87, (2) decreased perceived stress scores from 21.18 ± 5.87 to 20.11 ± 5.79, and (3) reduced blood pressure levels from 118/75 to 115/71 and waist-to-hip ratios. Almost half of the participants have recovered from hikikomori by returning to the workforce in society; however, the health improvements were dominant in those that remained as hikikomori and were associated with the gradual swapping of exercise practices from light to moderate level strength. Conclusions: With intended exposure to social worker engagement, physical assessments of the cohort study triggered the social workers to encourage participants to do more exercises, which in turn enhanced their awareness of health modification towards a better health. Engagement of social workers could be considered as part of the intended exposure for all participants, which suggested social work intervention was effective in helping hikikomori recovery. Keywords: hikikomori; hidden youth; health; hypertension; obesity 1. Introduction The Japanese term “Hikikomori” (translated as 隱蔽青年 in Chinese) describes both the condition and identity of a severe form of social withdrawal. The universal definition adopts any individual who without a clear or legitimate purpose confined him/herself at home for more than 6 months, avoiding face-to-face contact with others except family or a close person, and having a ‘Status Zero’—meaning not participating in education, training, or work [1,2]. By using this definition with the target population at age 14 to 30 years, a non-governmental organization has estimated 18,500 hikikomori cases (accounted for 2.1% of its youth population) were living in the city of Hong Kong [3]. This was consistent with the local prevalence of 1.9% reported in another recent local telephone-based survey conducted among the youth population aged 12 to 29 years [4]. Given that the prevalence of Int. J. Environ. Res. Public Health 2019, 16, 546; doi:10.3390/ijerph16040546 www.mdpi.com/journal/ijerph
-
Upload
khangminh22 -
Category
Documents
-
view
0 -
download
0
Transcript of A One-Year Prospective Follow-Up Study on the Health Profile ...

International Journal of
Environmental Research
and Public Health
Article
A One-Year Prospective Follow-Up Study on theHealth Profile of Hikikomori Living in Hong Kong
John W. M. Yuen 1,* , Victor C. W. Wong 2 , Wilson W. S. Tam 3, Ka Wing So 4 andWai Tong Chien 5
1 School of Nursing, The Hong Kong Polytechnic University, Hung Hom, Kowloon, Hong Kong2 Department of Social Work, Hong Kong Baptist University, Kowloon Tong, Kowloon, Hong Kong;
[email protected] Alice Lee Centre for Nursing Studies, National University of Singapore, Singapore 119077, Singapore;
[email protected] Withdrawal Youth Service, Hong Kong Christian Service, Tsim Sha Tsui, Kowloon, Hong Kong;
[email protected] Nethersole School of Nursing, The Chinese University of Hong Kong, Shatin, New Territories, Hong Kong;
[email protected]* Correspondence: [email protected]; Tel.: +852-2766-4130; Fax: +852-2364-9663
Received: 2 January 2019; Accepted: 12 February 2019; Published: 14 February 2019�����������������
Abstract: Background: A prospective cohort study was conducted to follow-up on 104 participantson their changes of social, psychological and physical health as exposed to the hikikomori lifestyle.Methods: Participants were interviewed at baseline, 6 months and 12 months by administering a setof questionnaires and anthropometric measurements. Results: All three health domains of hikikomoriwere significantly improved over the follow-up period as evidenced by: (1) increased social networkscores from 2.79 ± 1.80 to 3.09 ± 1.87, (2) decreased perceived stress scores from 21.18 ± 5.87 to20.11 ± 5.79, and (3) reduced blood pressure levels from 118/75 to 115/71 and waist-to-hip ratios.Almost half of the participants have recovered from hikikomori by returning to the workforce insociety; however, the health improvements were dominant in those that remained as hikikomoriand were associated with the gradual swapping of exercise practices from light to moderate levelstrength. Conclusions: With intended exposure to social worker engagement, physical assessments ofthe cohort study triggered the social workers to encourage participants to do more exercises, which inturn enhanced their awareness of health modification towards a better health. Engagement of socialworkers could be considered as part of the intended exposure for all participants, which suggestedsocial work intervention was effective in helping hikikomori recovery.
Keywords: hikikomori; hidden youth; health; hypertension; obesity
1. Introduction
The Japanese term “Hikikomori” (translated as 隱蔽青年 in Chinese) describes both the conditionand identity of a severe form of social withdrawal. The universal definition adopts any individualwho without a clear or legitimate purpose confined him/herself at home for more than 6 months,avoiding face-to-face contact with others except family or a close person, and having a ‘StatusZero’—meaning not participating in education, training, or work [1,2]. By using this definitionwith the target population at age 14 to 30 years, a non-governmental organization has estimated 18,500hikikomori cases (accounted for 2.1% of its youth population) were living in the city of Hong Kong [3].This was consistent with the local prevalence of 1.9% reported in another recent local telephone-basedsurvey conducted among the youth population aged 12 to 29 years [4]. Given that the prevalence of
Int. J. Environ. Res. Public Health 2019, 16, 546; doi:10.3390/ijerph16040546 www.mdpi.com/journal/ijerph

Int. J. Environ. Res. Public Health 2019, 16, 546 2 of 14
1.6% among the Japanese population aged 15 to 39 years reported in survey 2016 was underestimatedbecause approximately 24% of the surveyed population in 2010 would be older than 39 years in 2015and were excluded from the estimation, the newly emerged situation with younger population andseverity of Hong Kong’s hikikomori problem may be comparable to that reported in Japan [5]. Ourrecent study has revealed that the sedentary lifestyle living of hikikomori leads to poor physical healthoutcomes, in particular obesity and hypertension [1]. The top solitary activities pursued by thosesocially-withdrawn young individuals were sedentary in nature, such as surfing the internet, chattingon-line with strangers, and sitting in a corner [3]. The protracted confinement in a bedroom would notbe conducive to the usual domestic cycle of adequate and regular sleep, causing poor sleep quality [1,6].A recent review has discussed the similarities between hikikomori status and pervasive developmentaldisorders, which suggested the associations of physical problems such as headaches, neck, back andmuscle pains, and gastrointestinal problems with the irregular sleep-wake rhythms of hikikomori [7].Indeed, from the bio-psychosocial point of view, as supported by empirical evidences, the harmfulimpacts of social withdrawal and sedentary lifestyle on both physical and mental health have long beenestablished. A qualitative study has shown that many hikikomori were living unhappily and havinglow self-esteem in general [8]. Numerous studies [9–11] have reported that the existence of psychiatricco-morbidity was common within 1–2 years following the onset of a hikikomori life, and that theproblem often became worse during the time that the individual leads such a life. In Japan, the lifetimeprevalence of mental disorders in hikikomori was almost double of the non-hikikomori population,whereas the risk of mood disorders was six-times higher among hikikomori [7]. Although the etiologyremains largely unknown, many researchers believed that this is a personalized phenomenon andculturally driven. The famous book ‘Shutting out the Sun—How Japan created its own lost generation’authored by Zielenziger [12] described how youngsters who think and behave differently from themainstreams of the “homogeneous” Japanese society were shutting up themselves to create “freespace” at home to become hikikomori. Another book discussed more in depth the diverse set of youthcultures created in Japanese society [13]. From the sociological perspective, Norasakkuniit et al. [14]reviewed the factors at the individual level on how Japanese youths marginalized themselves in theirown society. In fact, a hikikomori lifestyle could be ideal for many young individuals as a personalchoice to withdraw from a life that they feel is stressful. However, as more and more hikikomori caseswere being identified in other Asian [3,15,16] and Western countries [17–19], the issues of “hikikomori”and its possible health consequences have drawn attention from public health experts worldwide [9,20].Recent breakthroughs in blood biomarker studies suggest a biological basis of the hikikomori etiologywhereby oxidative stress and inflammation may be involved causing the respective behavioral andpsychological traits [21]. With the first health profile of hikikomori that has recently been establishedand its unclear physiological mechanism, in the present study, a previously identified cohort wasfollowed up to understand how the social, mental and physical health states of young people who werehikikomori would change during a year. Secondarily, the incidence of young individuals recoveringfrom the hikikomori life would also be estimated.
2. Materials and Methods
2.1. Study Design and Setting
This is a prospective cohort study designed to follow-up 104 hikikomori cases at 6 months (timepoint 2) and 12 months (time point 3) regarding the changes in their social, psychological and physicalhealth while exposed to the sedentary lifestyle as reported in our previous publication [1]. In the samepublication, detailed inclusion and exclusion criteria as well as the health profile at baseline of thestudied cohort have also been described [1]. The definition of hikikomori was having withdrawalperiod for 6 months and above, but due to the tight study schedule some participants who havefulfilled all recruitment criteria but exhibited persistent withdrawal for <6 months were also recruited.However, all cases were confirmed the fulfillment of the 6-month withdrawal criterion before data

Int. J. Environ. Res. Public Health 2019, 16, 546 3 of 14
included in the cohort for data analysis [1]. Individuals of the studied cohort were sourced from thecore hidden youth social services of Hong Kong involving a total of nine youth service teams to coverall residential districts as operated by different non-profit organizations, and recruited through thecase social workers who provided regular visits (once every 1–2 months), social counseling and lifeplanning to encourage the clients to get back to the society. The engagement of social workers was anintended action exposed to all participants. Furthermore, the participants may also interact with socialworkers regarding talking about the home-based mini-medical check-up (physical measurements ofthis study) was also intended but was facilitated in an informal rather than a professional manner, associal workers are not health professionals by themselves. Ethical approval (HSEARS20151126002)was obtained from the Human Subjects Ethics Committee of the Hong Kong Polytechnic University.
2.2. Procedures of the Follow-Up Interviews
Participants were approached by their case social workers to make an appointment for interview(normally on the date of home visit) about one month before the study follow-up. On each interviewday, the data collector (a trained nursing student) followed the respective social worker on theirhome visits to the potential participants, and conducted the measurements in the absence of thesocial worker immediately after their consultation. The Psychotic Screening Module of the StructuredClinical Interview for DSM Disorders Axis I (SCID-I) was used to screen the participants at eachtime point to exclude any psychotic and associated symptoms. Participants clinically diagnosed withmood disorders at follow-ups were also excluded. Exclusion of such participants with psychosisand clinical mood disorders was because they might not be able to complete the comprehensiveset of questionnaires. However, none of the participants had psychotic ineligibility, therefore thisexclusion criterion had no impact in this study. And then, the participants were proceeded with thesame procedure of physical measurements and completing a set of self-administered questionnairesas performed at baseline. The interview lasted around 45–60 min. A cash voucher was given to eachparticipant at the end of each interview as a token of appreciation. The data collectors were welltrained, particularly a 20-h training was provided for the semi-structured SCID-I with the use of theinstrument training kit as specified by the developer. Inter-rater reliability was assessed prior to thedata collection until satisfactory agreement was achieved among all data collectors [1].
2.3. The Instrument and Anthropometric Measurements
The instrument consisted of the same set of questionnaires used in the previous publication,where the scales’ reliability scores and interpretation methods have also been described alongsidewith the baseline results [1]. In brief, the socio-demographics section captured information aboutany changes in financial condition, smoking habits, usual daily activities pursued such as surfing theInternet, reading comics, and watching animation. Mental health was measured by using the Chinese10-item Perceived Stress Scale (PSS-10), the Chinese Beck Depression Inventory-II (BDI-II), the ChineseState Anxiety Scale of State-Trait Anxiety Inventory (STAI-Y1), and the Chinese 10-item PerceivedStress Scale (PSS-10). The lifestyle section mainly evaluated the degrees of distortion on way of livingusing the Chinese Godin Leisure-Time Exercise Questionnaire (GLTEQ), the Chinese Pittsburgh sleepquality index (PSQI), the “How healthy is your diet? Questionnaire” [22]. The social health sectionincluded the SNI to measure social connectedness, and the Chinese Family Environment Scale (CFES)to assess the three key dimensions, namely cohesion, expressiveness, and conflict. Since the Dietaryquestionnaire and Berkman-Syme Social Network Index (SNI) questionnaire were not available inChinese, the English versions were translated into Chinese by two bilingual professional translatorsusing the proper ‘translation back-translation’ method. The details of translation process and qualityassurance were provided in our previous publication [1]. Whilst the physical health was assessed bythe Chinese SF-36 Physical Functioning Subscale (PF-10), in addition to a series of anthropometricand physical measurements, according to the methods described previously [1]. The systolic bloodpressure (SBP) and diastolic BP (DBP) values were measured twice each 5–10 min apart using the

Int. J. Environ. Res. Public Health 2019, 16, 546 4 of 14
automatic oscillometric blood pressure monitor (Microlife BP A200 AFIB, Espenstrasse, Switzerland),and the average value was taken. The mercury sphygmomanometer-and- stethoscope method wasused to take two BP measures (each at least 5 min apart) in case of a discrepancy over 10% betweenthe two BP readings. Blood pressure levels were interpreted according to the Seventh Report of theJoint National Committee on Prevention, Detection, Evaluation, and Treatment of High Blood Pressure(JNC7) classification, which considered SBP/DBP over 140/90 mmHg as hypertensive and individualswith SBP ranged 120–139 mmHg and DBP ranged 80–98 mmHg as prehypertensive.
After the baseline measurement (time point 1), the PSS-14 scores were compared and foundto be consistently compatible after removing the 4 items (i.e., the PSS-10 version). Concerning thelong instrument to be administered by the participants, the PSS-10 was adopted since the 6 monthfollow-up, and hence the instrument length was shortened from a total of 156 items to 152 items foreasier administration.
2.4. Statistical Analysis
Data collected in this study were analyzed using IBM SPSS Statistics 22.0 (IBM, Armonk,New York, USA). Frequency and percentage were computed for each of the binary or categoricalvariables, whereas mean and standard deviation (SD) were computed for continuous variables.Together with the anthropometric variables measured in this study, the composite scores werecomputed for all subscales of the instrument according to the subscale scoring schemes, and expressedas mean and SD. Missing data was replaced by the last observation carry forward method. Thosecontinuous variables were compared across the three time points using the Repeated Measures Analysisof Variance NOVA (RMANOVA) was used to examine the changes over the three time points, whereasthe F values and imputed p-values were reported. Additionally, Generalized Estimating Equation(GEE) was performed as an alternative method for RMANOVA to see whether the trend is significantor not.
3. Results
3.1. The Follow-Up Cohort
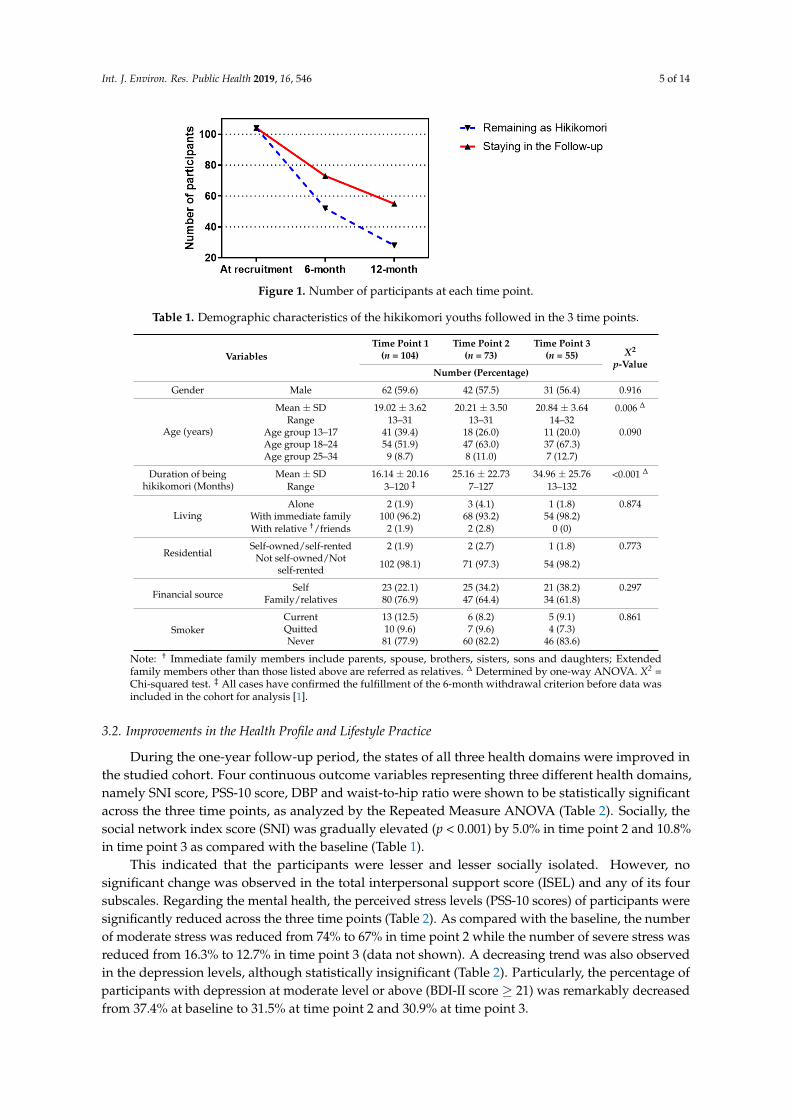
From March 2017 to June 2018, the cohort of 104 hikikomori that reported with the baseline healthprofile (time point 1) [1] was followed up. As shown in Figure 1, within the 12-month follow-up period,73 and 55 participants had stayed in the study with completion of the set of questionnaires in additionto all anthropometric and physical measurements at 6 months (time point 2) and 12 months (timepoint 3), respectively. An overall number of 53 participants (51.0%) had completed the measurementsin all three time points, whereas the attrition rates were recorded as 29.8% in time point 2 and 24.7% intime point 3. Such high attritions were due to the withdrawal for follow-up, unable to fit the interviewschedule of follow-ups, and loss of connection with the case social worker. Besides, a significant portionof the follow-up population has recovered from the hikikomori by returning to the workforce in society,minus of these recovered cases, 52 (71.2%) and 28 (50.9%) of participants were remained as hikikomoriin time points 2 and 3, respectively (Figure 1). The demographic characteristics of the studied cohortmeasured in the three time points of data collection were summarized and compared in Table 1. Asexpected, significant differences were only observed in age and hikikomori duration, since the cohortwas followed prospectively for 12 months. However, demographics were exhibited differently in theparticipants who were remained, recovered, and loss to follow-up. The male-to-female ratio was 1.7:1for both recovered and loss to follow-up as compared to the 1:1 for those remained as hikikomori. Theloss follow-up group was about 1 year (18.47 ± 3.51) younger than the other two subgroups. Whilst thedurations of being hikikomori were 22.96 ± 27.84, 17.62 ± 22.12 and 12.43 ± 12.39 for those remainedas hikikomori, recovered and loss to follow-up, respectively.
Int. J. Environ. Res. Public Health 2019, 16, 546 5 of 14
Int. J. Environ. Res. Public Health 2019, 16, x 5 of 14
social network index score (SNI) was gradually elevated (p < 0.001) by 5.0% in time point 2 and 10.8%
in time point 3 as compared with the baseline (Table 1).
Figure 1. Number of participants at each time point.
Table 1. Demographic characteristics of the hikikomori youths followed in the 3 time points.
Variables
Time Point 1
(n = 104)
Time Point 2
(n = 73)
Time Point 3
(n = 55)
Χ2
p-Value
Number (Percentage)
Gender Male 62 (59.6) 42 (57.5) 31 (56.4) 0.916
Age (years)
Mean ± SD 19.02 ± 3.62 20.21 ± 3.50 20.84 ± 3.64 0.006 ∆
Range 13–31 13–31 14–32
Age group 13–17 41 (39.4) 18 (26.0) 11 (20.0) 0.090
Age group 18–24 54 (51.9) 47 (63.0) 37 (67.3)
Age group 25–34 9 (8.7) 8 (11.0) 7 (12.7)
Duration of being
hikikomori (Months)
Mean ± SD 16.14 ± 20.16 25.16 ± 22.73 34.96 ± 25.76 <0.001 ∆
Range 3–120 ‡ 7–127 13–132
Living
Alone 2 (1.9) 3 (4.1) 1 (1.8) 0.874
With immediate family 100 (96.2) 68 (93.2) 54 (98.2)
With relative †/friends 2 (1.9) 2 (2.8) 0 (0)
Residential Self-owned/ self-rented 2 (1.9) 2 (2.7) 1 (1.8) 0.773
Not self-owned/ Not self-rented 102 (98.1) 71 (97.3) 54 (98.2)
Financial source Self 23 (22.1) 25 (34.2) 21 (38.2) 0.297
Family/relatives 80 (76.9) 47 (64.4) 34 (61.8)
Smoker
Current 13 (12.5) 6 (8.2) 5 (9.1) 0.861
Quitted 10 (9.6) 7 (9.6) 4 (7.3)
Never 81 (77.9) 60 (82.2) 46 (83.6)
Note: † Immediate family members include parents, spouse, brothers, sisters, sons and daughters;
Extended family members other than those listed above are referred as relatives. ∆ Determined by
one-way ANOVA. Χ2 = Chi-squared test. ‡ All cases have confirmed the fulfillment of the 6-month
withdrawal criterion before data was included in the cohort for analysis [1].
This indicated that the participants were lesser and lesser socially isolated. However, no
significant change was observed in the total interpersonal support score (ISEL) and any of its four
subscales. Regarding the mental health, the perceived stress levels (PSS-10 scores) of participants
were significantly reduced across the three time points (Table 2). As compared with the baseline, the
number of moderate stress was reduced from 74% to 67% in time point 2 while the number of severe
stress was reduced from 16.3% to 12.7% in time point 3 (data not shown). A decreasing trend was
also observed in the depression levels, although statistically insignificant (Table 2). Particularly, the
percentage of participants with depression at moderate level or above (BDI-II score ≥ 21) was
remarkably decreased from 37.4% at baseline to 31.5% at time point 2 and 30.9% at time point 3.
Figure 1. Number of participants at each time point.
Table 1. Demographic characteristics of the hikikomori youths followed in the 3 time points.
VariablesTime Point 1
(n = 104)Time Point 2
(n = 73)Time Point 3
(n = 55) X2
p-ValueNumber (Percentage)
Gender Male 62 (59.6) 42 (57.5) 31 (56.4) 0.916
Age (years)
Mean ± SD 19.02 ± 3.62 20.21 ± 3.50 20.84 ± 3.64 0.006 ∆
Range 13–31 13–31 14–32Age group 13–17 41 (39.4) 18 (26.0) 11 (20.0) 0.090Age group 18–24 54 (51.9) 47 (63.0) 37 (67.3)Age group 25–34 9 (8.7) 8 (11.0) 7 (12.7)
Duration of beinghikikomori (Months)
Mean ± SD 16.14 ± 20.16 25.16 ± 22.73 34.96 ± 25.76 <0.001 ∆
Range 3–120 ‡ 7–127 13–132
LivingAlone 2 (1.9) 3 (4.1) 1 (1.8) 0.874
With immediate family 100 (96.2) 68 (93.2) 54 (98.2)With relative †/friends 2 (1.9) 2 (2.8) 0 (0)
ResidentialSelf-owned/self-rented 2 (1.9) 2 (2.7) 1 (1.8) 0.773
Not self-owned/Notself-rented 102 (98.1) 71 (97.3) 54 (98.2)
Financial sourceSelf 23 (22.1) 25 (34.2) 21 (38.2) 0.297
Family/relatives 80 (76.9) 47 (64.4) 34 (61.8)
SmokerCurrent 13 (12.5) 6 (8.2) 5 (9.1) 0.861Quitted 10 (9.6) 7 (9.6) 4 (7.3)Never 81 (77.9) 60 (82.2) 46 (83.6)
Note: † Immediate family members include parents, spouse, brothers, sisters, sons and daughters; Extendedfamily members other than those listed above are referred as relatives. ∆ Determined by one-way ANOVA. X2 =Chi-squared test. ‡ All cases have confirmed the fulfillment of the 6-month withdrawal criterion before data wasincluded in the cohort for analysis [1].
3.2. Improvements in the Health Profile and Lifestyle Practice
During the one-year follow-up period, the states of all three health domains were improved inthe studied cohort. Four continuous outcome variables representing three different health domains,namely SNI score, PSS-10 score, DBP and waist-to-hip ratio were shown to be statistically significantacross the three time points, as analyzed by the Repeated Measure ANOVA (Table 2). Socially, thesocial network index score (SNI) was gradually elevated (p < 0.001) by 5.0% in time point 2 and 10.8%in time point 3 as compared with the baseline (Table 1).
This indicated that the participants were lesser and lesser socially isolated. However, nosignificant change was observed in the total interpersonal support score (ISEL) and any of its foursubscales. Regarding the mental health, the perceived stress levels (PSS-10 scores) of participants weresignificantly reduced across the three time points (Table 2). As compared with the baseline, the numberof moderate stress was reduced from 74% to 67% in time point 2 while the number of severe stress wasreduced from 16.3% to 12.7% in time point 3 (data not shown). A decreasing trend was also observedin the depression levels, although statistically insignificant (Table 2). Particularly, the percentage ofparticipants with depression at moderate level or above (BDI-II score ≥ 21) was remarkably decreasedfrom 37.4% at baseline to 31.5% at time point 2 and 30.9% at time point 3.

Int. J. Environ. Res. Public Health 2019, 16, 546 6 of 14
Table 2. The key social, psychological and physical health variables of identified in hikikomori followed up for one year.
Variables
Time Point 1 Time Point 2 Time Point 3RMANOVA
F(Imputed)p-Value
GEEBeta
p-Value(n = 104) (n = 73) (n = 55)
Mean ± SD
Social †
support
SNI score (0–7) a 2.79 ± 1.80 2.93 ± 2.06 3.09 ± 1.87 12.174 <0.001 0.275 0.009ISEL total score (0–48) b 24.60 ± 6.30 24.63 ± 5.99 24.75 ± 6.89 1.074 0.302 0.269 0.493
Appraisal (0–12) b 6.81 ± 2.16 6.90 ± 1.87 7.11 ± 2.18 2.463 0.096 0.170 0.267Tangible (0–12) b 6.20 ± 1.71 6.29 ± 1.53 6.20 ± 1.73 0.618 0.496 −0.010 0.933
Belonging (0–12) b 6.00 ± 2.45 5.89 ± 2.53 6.05 ± 2.44 2.343 0.104 0.136 0.342Self-esteem (0–12) b 5.59 ± 2.08 5.55 ± 2.14 5.38 ± 2.39 0.544 0.577 −0.052 0.685
Psychological †Perceived stress (0–40) c 21.18 ± 5.87 20.18 ± 6.25 20.11 ± 5.79 3.437 0.045 −0.709 0.028
Depression (0–63) d 17.17 ± 11.49 16.48 ± 10.87 15.76 ± 11.80 1.327 0.265 −0.658 0.241T-anxiety (20–80) e 44.22 ± 12.17 46.48 ± 12.97 42.45 ± 11.16 2.105 0.131 −0.621 0.291
Physical
SBP (mmHg) 118 ± 16 117 ± 15 115 ± 13 0.955 0.386 −1.212 0.108DBP (mmHg) 75 ± 10 73 ± 9 71 ± 9 10.223 <0.001 −2.058 <0.001BMI (kg/m2) f 22.28 ± 6.88 22.02 ± 5.75 22.71 ± 6.58 1.753 0.180 0.127 0.156
Waist circumference (cm) g 77.64 ± 16.87 76.26 ± 12.13 76.37 ± 15.44 2.043 0.138 −0.643 0.050Waist-to-hip ratio 0.82 ± 0.09 0.81 ± 0.75 0.81 ± 0.09 3.967 0.024 −0.009 0.012
† The social and psychological scales were measured with total scores for comparison between the 3 time points of measurements. a A lower SNI score indicates more social isolation riskwhile b higher ISEL total and subscale scores means more social support. c Perceived stress scored 14–26 indicates moderate stress and 27–40 indicates severe stress. d Beck depressionscored 17–20 = borderline clinically significant depression, 21–30 = moderate level, 31–40 = severe level, >40 = extremely severe. e T-anxiety score >40 = clinically significant level. f BMIClassification: <18.5 = Underweight, 18.5–22.9 = normal, 23–24.9 = overweight/pre-obese, ≥25 = obese. g Waist classification (Cut-off for Male ≥ 90; Female ≥ 80) as a measurement ofvisceral fat mass suggesting long-term health risk association with obesity. RMANOVA: Repeated Measures Analysis of Variance; GEE: Generalized Estimating Equation.

Int. J. Environ. Res. Public Health 2019, 16, 546 7 of 14
However, no significant change was shown in the trait anxiety scores and they remained at themoderate level during the entire follow-up period. Physically, the blood pressure levels of participantswere gradually diminished across the three time points, especially for the DBP that has achievedstatistical significance p < 0.001. Similar reducing trend was also observed for the SBP, making thereduction of SBP/DBP of 118/75 (SD = 16/10) at baseline to 117/73 (SD = 15/9) at time point 2 and115/71 (SD = 13/9) at time point 3 (Table 2). According to the JNC7’s classification, as comparedwith the 15.4% (141/91; SD = 10/5 mmHg) and 31.7% (126/79; SD = 9/5 mmHg) of the baseline,the percentages (and mean BP levels) of hypertension and prehypertension at the end of one-yearfollow-up were 9.0% (138/85; SD = 14/7 mmHg in five participants) and 29.1% (124/76 SD = 8/7mmHg in 16 participants), respectively. Specifically, for the single case of type 2 hypertension (171/93)reported at baseline, his blood pressure status was remarkably improved to the JNC classificationof stage 1 hypertension (151/80) at time point 2 and further to prehypertension (126/87) at timepoint 3. None of the hypertensive cases identified in this study was found to have a positive atrialfibrillation (AFIB), and hence no immediate risk of stroke. On the other hand, statistically significantreduction (p = 0.024) was shown in the waist-to-hip ratios of participants throughout the follow-ups,which was consistent with the decreasing trend of the waist circumference (Table 2). The percentageof participants with waist circumference above the cut-off that suggested health risk was reducedfrom 26.9% at baseline to 20.5% at time point 2 and 23.6% at time point 3. However, no significantchanges were identified in other measured obesity indexes including body weight, height, and BMI.Nonetheless, GEE analysis indicated that the above four significant health outcomes (namely socialnetwork, perceived stress, diastolic blood pressure, and waist-to-hip ratio) were also shown to beconsistently predictable by the everyday lifestyle of hikikomori (Table 2).The daily activity recordsindicated that the participants spent less time staying at home (19.11 ± 4.40 at baseline vs. 18.01± 5.16 in time point 2 vs. 17.47 ± 4.36 in time point 3; hours per day). When staying at home,they also spent less time in activities such as eating, using computer, and reading books and comicsover the three time points. Whilst no changes were observed in hours for sleeping, watching TV,idling, and facing the wall but increased mildly the hours for mobile phone or tablets (3.11 ± 5.03 atbaseline vs. 4.00 ± 4.52 in time point 2 vs. 3.88 ± 3.65 in time point 3). However, as summarized inTable 3, no significant differences were identified across the three time points in the three continuousvariables of lifestyle practice representing sleep quality, physical activity level and healthy eatinghabits. Particularly, when compared with that of 74.0% at baseline, fluctuations were observed thepercentage of poor sleepers in the two follow-ups with 78.1% (increased) in time point 2 and 70.9%(decreased) in time point 3. Despite the overall weekly leisure activity scores and physical activitylevels were not significantly changed among the participants, an increasing trend was observed in thefrequency of moderate-intensity exercises over the three time points (from 1.38 ± 2.32 to 1.53 ± 2.82then 1.55 ± 2.38 times per week). Particularly in time point 2, the frequency of light activity was alsonotably increased from 3.12 ± 3.27 to 3.73 ± 3.77 times per week. However, the participants remainedin their unhealthy ‘high sugar, high fat and low vegetables and low fruits’ diet across the three timepoints. These results suggested that some participants might have improved at least slightly theirlifestyle practice towards a better health outcome.
Table 3. A summary of lifestyle measurements in hikikomori followed up for one year.
VariablesTime Point 1 Time Point 2 Time Point 3 RMANOVA Imputed GEE p-Value
Mean ± SD F p-Value Beta
PSQI score 6.57 ± 2.98 7.44 ± 6.24 6.45 ± 2.97 1.622 0.208 0.009 0.953Weekly Leisure Activity 24.88 ± 31.81 25.51 ± 25.42 23.44 ± 30.31 2.731 0.081 0.826 0.638
Healthy Eating score 12.57 ± 4.85 12.21 ± 5.22 12.25 ± 4.98 0.200 0.813 −0.017 0.928
PSQI: Pittsburgh sleep quality index.
Int. J. Environ. Res. Public Health 2019, 16, 546 8 of 14
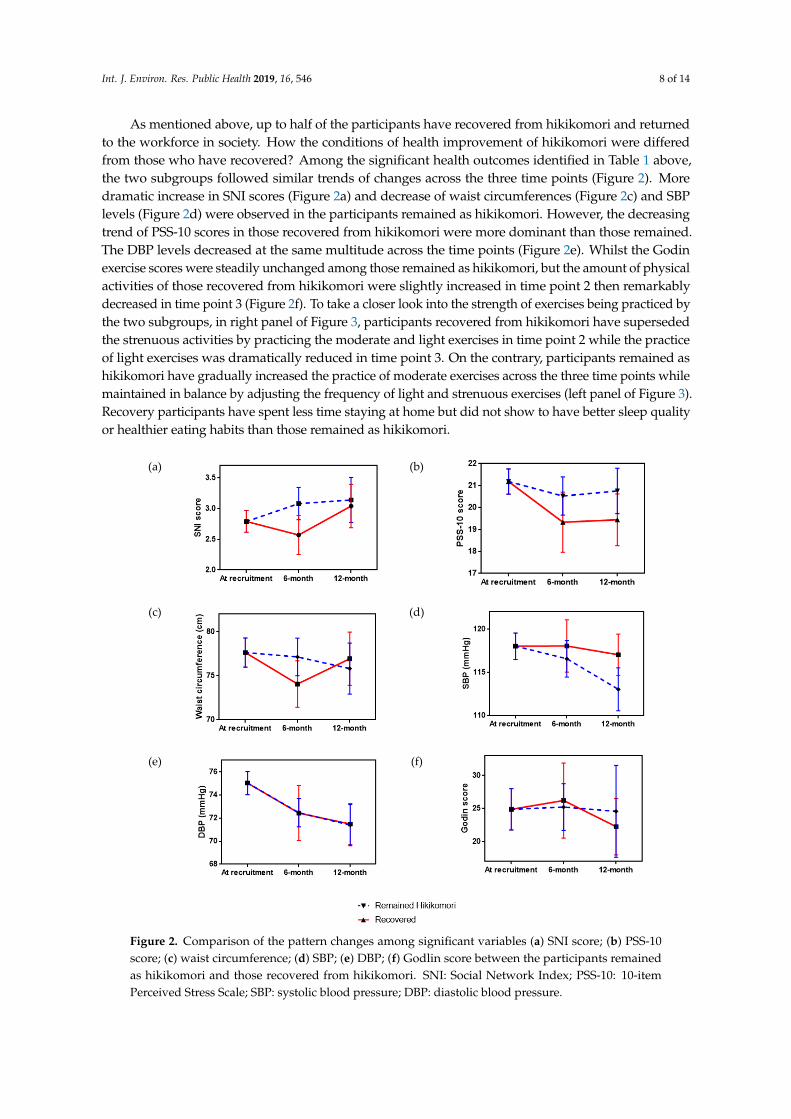
As mentioned above, up to half of the participants have recovered from hikikomori and returnedto the workforce in society. How the conditions of health improvement of hikikomori were differedfrom those who have recovered? Among the significant health outcomes identified in Table 1 above,the two subgroups followed similar trends of changes across the three time points (Figure 2). Moredramatic increase in SNI scores (Figure 2a) and decrease of waist circumferences (Figure 2c) and SBPlevels (Figure 2d) were observed in the participants remained as hikikomori. However, the decreasingtrend of PSS-10 scores in those recovered from hikikomori were more dominant than those remained.The DBP levels decreased at the same multitude across the time points (Figure 2e). Whilst the Godinexercise scores were steadily unchanged among those remained as hikikomori, but the amount of physicalactivities of those recovered from hikikomori were slightly increased in time point 2 then remarkablydecreased in time point 3 (Figure 2f). To take a closer look into the strength of exercises being practiced bythe two subgroups, in right panel of Figure 3, participants recovered from hikikomori have supersededthe strenuous activities by practicing the moderate and light exercises in time point 2 while the practiceof light exercises was dramatically reduced in time point 3. On the contrary, participants remained ashikikomori have gradually increased the practice of moderate exercises across the three time points whilemaintained in balance by adjusting the frequency of light and strenuous exercises (left panel of Figure 3).Recovery participants have spent less time staying at home but did not show to have better sleep qualityor healthier eating habits than those remained as hikikomori.
Int. J. Environ. Res. Public Health 2019, 16, x 9 of 14
dramatic increase in SNI scores (Figure 2a) and decrease of waist circumferences (Figure 2c) and SBP
levels (Figure 2d) were observed in the participants remained as hikikomori. However, the
decreasing trend of PSS-10 scores in those recovered from hikikomori were more dominant than
those remained. The DBP levels decreased at the same multitude across the time points (Figure 2e).
Whilst the Godin exercise scores were steadily unchanged among those remained as hikikomori, but
the amount of physical activities of those recovered from hikikomori were slightly increased in time
point 2 then remarkably decreased in time point 3 (Figure 2f). To take a closer look into the strength
of exercises being practiced by the two subgroups, in right panel of Figure 3, participants recovered
from hikikomori have superseded the strenuous activities by practicing the moderate and light
exercises in time point 2 while the practice of light exercises was dramatically reduced in time point
3. On the contrary, participants remained as hikikomori have gradually increased the practice of
moderate exercises across the three time points while maintained in balance by adjusting the
frequency of light and strenuous exercises (left panel of Figure 3). Recovery participants have spent
less time staying at home but did not show to have better sleep quality or healthier eating habits than
those remained as hikikomori.
(a)
(b)
(c)
(d)
(e)
(f)
Figure 2. Comparison of the pattern changes among significant variables (a) SNI score; (b) PSS-10
score; (c) waist circumference; (d) SBP; (e) DBP; (f) Godlin score between the participants remained
as hikikomori and those recovered from hikikomori. SNI: Social Network Index; PSS-10: 10-item
Perceived Stress Scale; SBP: systolic blood pressure; DBP: diastolic blood pressure.
Figure 2. Comparison of the pattern changes among significant variables (a) SNI score; (b) PSS-10score; (c) waist circumference; (d) SBP; (e) DBP; (f) Godlin score between the participants remainedas hikikomori and those recovered from hikikomori. SNI: Social Network Index; PSS-10: 10-itemPerceived Stress Scale; SBP: systolic blood pressure; DBP: diastolic blood pressure.

Int. J. Environ. Res. Public Health 2019, 16, 546 9 of 14Int. J. Environ. Res. Public Health 2019, 16, x 10 of 14
Figure 3. The frequencies of different intensity levels of exercise practiced by participants remained
as hikikomori and those recovered.
4. Discussion
This was the first study conducted to observe the longitudinal changes in health profile of the
hikikomori, particularly in a Chinese population. In the absence of direct intervention in the studied
cohort, improvements were observed in all three health domains across the three time points over
one-year period. Such favorable health changes were identified as significant outcomes that were
predictable by the exposure of the participants during the 12 months, in terms of (1) socially with
increasing social networks, both online and offline, (2) mentally with decreasing perceived stress
levels, and (3) physically with reduced blood pressure levels as well as waist-to-hip ratios.
As reported in our previous study, a number of health manifestations associated with
hikikomori, such as hypertension and obesity could be at least partially contributed by their
sedentary lifestyle [1]. This causes the postulation of worsening the hikikomori’s health conditions
by living longer with the length of such lifestyle. However, results of this longitudinal study were
seemed to be opposite to such assumption, whereas certain degrees of improvement were observed
in the health profile of hikikomori throughout their one-year living course. Regarding the social and
mental aspects, the majority of participants were still displaying the asocial and psychological
characteristics commonly observed in hikikomori after a year, although improving trends were
observed in social networks and all negative emotional states [2]. In particular, the significant
reduction of perceived stress was mainly associated with those recovery participants, which requires
further investigations. The underlying explanations could be something related but not limited to
financial burdens, family conflicts, and personal satisfaction [23–25]. On the other hand, more
surprisingly, the prevalence of hypertension was significantly reduced from 15.4% to 9.0% in 12
months, which was below the 12.6% adult prevalence of diagnosed hypertension [26] and the 12.8%
age-specific prevalence for young people aged 15–34 [27] that have been reported in local studies.
Cohesively, the prevalence of prehypertension (individuals with SBP ranged 120–139 mmHg and
DBP ranged 80–98 mmHg) was also dropped from 31.7% to 29.1%, although mild. Local age-matched
prevalence was unavailable for comparison since pre-hypertension was rarely investigated amongst
the younger populations; however, the current prevalence was below the 42.7% prevalence reported
amongst the older adults at age ≥35 [28]. The combined prevalence of hypertension and
prehypertension (i.e., 38.1%) was still alerting, where the risks of transiting prehypertension into
hypertension and other cardiovascular complications and metabolic disorders have been well
documented [5,28–30].
Figure 3. The frequencies of different intensity levels of exercise practiced by participants remained ashikikomori and those recovered.
4. Discussion
This was the first study conducted to observe the longitudinal changes in health profile of thehikikomori, particularly in a Chinese population. In the absence of direct intervention in the studiedcohort, improvements were observed in all three health domains across the three time points overone-year period. Such favorable health changes were identified as significant outcomes that werepredictable by the exposure of the participants during the 12 months, in terms of (1) socially withincreasing social networks, both online and offline, (2) mentally with decreasing perceived stress levels,and (3) physically with reduced blood pressure levels as well as waist-to-hip ratios.
As reported in our previous study, a number of health manifestations associated with hikikomori,such as hypertension and obesity could be at least partially contributed by their sedentary lifestyle [1].This causes the postulation of worsening the hikikomori’s health conditions by living longer withthe length of such lifestyle. However, results of this longitudinal study were seemed to be oppositeto such assumption, whereas certain degrees of improvement were observed in the health profile ofhikikomori throughout their one-year living course. Regarding the social and mental aspects, themajority of participants were still displaying the asocial and psychological characteristics commonlyobserved in hikikomori after a year, although improving trends were observed in social networks andall negative emotional states [2]. In particular, the significant reduction of perceived stress was mainlyassociated with those recovery participants, which requires further investigations. The underlyingexplanations could be something related but not limited to financial burdens, family conflicts, andpersonal satisfaction [23–25]. On the other hand, more surprisingly, the prevalence of hypertension wassignificantly reduced from 15.4% to 9.0% in 12 months, which was below the 12.6% adult prevalence ofdiagnosed hypertension [26] and the 12.8% age-specific prevalence for young people aged 15–34 [27]that have been reported in local studies. Cohesively, the prevalence of prehypertension (individualswith SBP ranged 120–139 mmHg and DBP ranged 80–98 mmHg) was also dropped from 31.7% to 29.1%,although mild. Local age-matched prevalence was unavailable for comparison since pre-hypertensionwas rarely investigated amongst the younger populations; however, the current prevalence was belowthe 42.7% prevalence reported amongst the older adults at age ≥35 [28]. The combined prevalenceof hypertension and prehypertension (i.e., 38.1%) was still alerting, where the risks of transitingprehypertension into hypertension and other cardiovascular complications and metabolic disordershave been well documented [5,28–30].
Int. J. Environ. Res. Public Health 2019, 16, 546 10 of 14
Could such health improvements be explained by any changes of the living lifestyle? In the currentstudy, no significant lifestyle changes were observed over the study period, except for the upward trendof practicing moderate-intensity exercises. The joint guidelines of World Health Organization andInternational Society of Hypertension [31,32] suggested the importance of lifestyle modifications formanagement of hypertension, in particular weight control by means of physical activities was regardedas the most effective. This notion has agreed with the current observed profile with both reducedblood pressure levels and waist-to-hip ratios. Endurance exercise training was known to be effective in80% of hypertensive individuals to lower both systolic and diastolic blood pressures significantly [33].Accumulating evidence suggested effective hypertensive management required exercises at least atmoderate intensity [34,35]. This supported the notion to correlation between the reduction of bloodpressure and increase of moderate-intensity exercise as observed in this study. Furthermore, thereduction in diastolic blood pressure was shown to be more significant than the reduction in systolicblood pressure in the studied cohort. Hypertension occurring at younger ages are more commonlybelonging to the isolated diastolic type, because an increase of systolic BP is often caused by changesof arterial stiffness that should be more frequently happened with aging but unexpected at youngerages [36,37]. Studies also indicated that psychological distress such as job strains were found to bea risk factor for hypertension that is dominant with the increase of diastolic blood pressure [38,39].Together with the increased practice of moderate-intensity exercises, the reduction of perceived stressin the studied cohort may provide a reasonable explanation on the decreased blood pressure andhypertensive prevalence. Nonetheless, participants recovered from hikikomori were seemed to exhibitless health improvements as compared to those remained as hikikomori, except for the perceived stresslevels. Exercise was identified as a coping response to reduce stress in any employees experienced a‘bad’ day [40]. The decreasing trend of perceived stress observed in recovered hikikomori suggestedthey might not need exercise as the coping response, and hence the health benefits in blood pressureand obesity were not observed. Employees in high-strain occupations were also shown to be lessintended to do exercise, whereas self-efficacy was identified as an important mediating factor [41].Furthermore, job instability and context were additional risk factors contributing to psychologicalmorbidity and health behaviors [42]. Since occupational details and other related information werenot available in the current study, future study is warranted to address why there were differences inthe health improvements between the two subgroups.
However, what caused the hikikomori to exercise more intensely? Current findings suggested thatparticipants remained as hikikomori were shown to have better health improvements than those whorecovered. Whereas the gradually swapping of exercise practices from light to moderate level strength(increase of exercise intensity) was only observed amongst those remained as hikikomori, which furthersuggested the participants were readily to adopt a healthier lifestyle even though without recovery. Asmentioned in a previous publication [1], empirical physical assessments included in this study werenot only beneficial in objective measurements to strengthen the evidence, but it was also found to beimportant to raise the interest and awareness of participants to be more concerned with their healthor at least to adopt a less “hikikomori-type” lifestyle. According to the “health belief model”, whichplaces an important emphasis on the awareness of the threat perception (risk) is the key to trigger aseries of consequences that lead to the appropriate action, which was effective in predicting the healthbehaviors [43,44]. The adoption of less sedentary lifestyle by staying less at home and practicing moremoderate-intensity exercises were clearly an action taken by the participants even though quite a largeproportion of the participants still led a secluded living style yet characterized by an increasing level ofactivities and exercises performed at home. And this action could be at least related to two experiences:(1) The participants were informed of the outcomes immediately after the physical assessments bythe nursing researcher, which triggered their awareness and they were looking forward to havingthe next round of follow-up assessments [45]; and (2) As described by certain social workers, theywould care about the health of their clients but they were not healthcare workers, therefore, theyplayed a role of caregiver to remind their clients to live healthier by doing more exercises. The case

Int. J. Environ. Res. Public Health 2019, 16, 546 11 of 14
social workers opined that doing health assessments at the participants’ home or in social work servicecenters had become an attraction in terms of encouraging them to step outside their comfort zoneif not safe cocoon which has de-skilled their ability and lowered their confidence to interact withothers face-to-face in the non-virtual community [46–48]. Another unintended yet positive outcomewas the action taken by the social workers to make the most of the archived health records given toeach of the assessed participant as an explicit gentle reminder for doing more exercises at home andloitering around the neighborhood community so as to make improvement in their next time pointof health assessment. This implies that there is room for promoting inter-disciplinary collaborationacross healthcare and social care sectors not only for the sake of doing empirical research studies butalso for opening up a window of opportunity for re-engaging marginalized and invisible hikikomoriat a pace they find comfortable.
Given that this study adopted a prospective cohort design, no structural intervention wasprovided to the participants. However, all participants of this prospective cohort study were recruitedthrough the case social workers who had been providing them ongoing counseling and psychosocialsocial support. Those case social workers had the primary goal to find jobs or study opportunitiesfor their clients and get them ready to return back to the society in a gradual and voluntarily manner.In this sense, the engagement of social workers was an intended exposure for all participants of thisstudy. The fact indicated that such social work intervention was effective, since almost half of theparticipants have returned to the workforce or study institutions within a year time. The role of socialworkers seemed to be crucial for both preferred outcomes of hikikomori recovery and health promotionduring the hikikomori stage. Therefore, a qualitative study is planned to understand the views ofthe social workers according to their experience in dealing with clients receiving the contemporaryhealth assessment. Furthermore, the current study and Hong Kong social workers’ approach couldalso be inspiring the practice of other places. According to the recent Japanese Cabinet survey [5],the hikikomori population of Hong Kong was seemed to be relatively younger in age (13–34 yearsvs. 15–39 years) and longer in the hikikomori duration (2.9% versus 46.9% “over 5 years”) than theJapanese population. Despite of such differences, the current methodology and questionnaires shouldalso be compatible to be used in different places, such as France, Italy, United States, and Japan foraddressing the comparative and global health concerns of this particular field of study. On the otherhand, recovered participants of current study might alike the ‘affinity group’ designated by Tajan etal. [5], in order to provide further information for exploring the triggering factors.
There are, however, several limitations in this study. Because of the hidden nature of the targetparticipants who are one of the hardest groups for engagement and rapport building following theirprotracted period of seclusion at home, subject recruitment is considered as the most difficult part ofthe study. It caused the small sample size and high attrition rate as a major limitation. Although thesample size was sufficiently enough to achieve statistical significance when certain measured variableswere compared, the high attrition rate due to loss of follow-up would contribute to selection biasthat threatening to the internal validity [49]. Particularly in this study, participants intended to lossto follow-up could be those who were more hidden and living with more hermetic and sedentarybehavior that causing inaccurate interpretations. They were shown to be younger at age and shorterin hikikomori duration, which requires more in-depth investigations. Certain stratification-basedtechniques could be used to correct for such selection bias in future analysis. Furthermore, althoughparticipants of this study were recruited from multiple centers, sampling through a single agent i.e.,social work is also considered as a major limitation because many hidden cases still could not bereached and sampled. It is suggested that in future studies, other agencies such as secondary schools,student residency of universities, family-based services, medical units, and relevant online forums canalso be approached for sampling.

Int. J. Environ. Res. Public Health 2019, 16, 546 12 of 14
5. Conclusions
The hikikomori lifestyle which is largely sedentary in nature that could be a risk behavior, but alongitudinal study has observed improvements in all three domains of the health profile, namely socialnetworks, perceived stress, and blood pressure levels (especially the diastolic blood pressure). Thereduction of blood pressure levels and prevalence were consistent with the reduction of waist-to-hipratios as well as the increase of moderate-intensity exercise over the follow-up period. Whilst thereduction of perceived stress was more specifically associated with the participants recovering fromhikikomori, physical assessments followed by encouragement from social workers to do more exercisesmight enhance awareness of hikikomori youths in health modification towards a better health. There isimplication for promoting inter-disciplinary collaboration across healthcare and social care sectors forconducting further empirical studies and delivering engagement interventions at a pace that secludedand marginalized hikikomori find comfortable.
Author Contributions: The research team designed the study and share equal contributions. J.W.M.Y. is the projectleader who has supervised the project and finalized the manuscript. V.C.W.W. and K.W.S. coordinated with allcollaborative social service teams to enable the sampling and data collection, and the former or second-author alsohelped write up the manuscript. The epidemiologist W.W.S.T. contributed in the finalization of the data analysisand presentation of the results. W.T.C. mainly responded in the constructs and validation of the instruments formeasuring different variables. All authors have read the manuscripts and agreed with the contents.
Funding: This project was financially supported by the Health and Medical Research Fund (Project No. 13144071)from the Food and Health Bureau of Hong Kong.
Conflicts of Interest: The authors declare no conflict of interest.
References
1. Yuen, J.W.M.; Yan, Y.K.Y.; Wong, V.C.W.; Tan, W.W.S.; So, K.; Chien, W.T. A physical health profile of youthsliving with a “Hikikomori” lifestyle. Int. J. Enivron. Res. Public Health 2018, 15, 315. [CrossRef] [PubMed]
2. Wong, V.C.W. Youth locked in time and space? Defining features of social withdrawal and practiceimplications. J. Soc. Work Pract. 2009, 23, 337–352. [CrossRef]
3. Wong, V.; Ying, W. Social Withdrawal of Young People in Hong Kong: A Social Exclusion Perspective. HongKong J. Soc. Work 2006, 40, 61–91. [CrossRef]
4. Wong, P.W.C.; Li, T.M.H.; Chan, M.; Law, Y.W.; Chau, M.; Cheng, C.; Fu, K.W.; Bacon-Shone, J.; Yip, P.S.F.The prevalence and correlates of severe social withdrawal (hikikomori) in Hong Kong: A cross-sectionatelephone-based survey study. Int. J. Soc. Psychiatry 2015, 61, 330–342. [CrossRef] [PubMed]
5. Tajan, N.; Yukiko, H.; Pionnié-Dax, N. Hikikomori: The Japanese Cabinet Office’s 2016 survey of acute socialwithdrawal. Asia-Pac. J. 2017, 15, 1–11.
6. Guedj-Bourdiau, M.J. Home confinement of the adolescent. Hikikomori. Annal. Med. Psychiatry 2011, 169,668–672.
7. Takasu, N.N.; Toichi, M.; Nakamura, W. Importance of regular lifestyle with daytime bright light exposureon circadian rhythm sleep-wake disorders in pervasive development disorders. Jap. Dental Sci. Rev. 2011, 47,141–149. [CrossRef]
8. Yong, R. Exploring Hikikomori—A Mixed Methods Qualitative Approach. Int. J. Behav. Med. 2010, 17, 81–82.9. Watts, J. Tokyo—Public health experts concerned about “hikikomori”. Lancet 2002, 359, 1131. [CrossRef]10. Kondo, N.; Sakai, M.; Kuroda, Y.; Kiyota, Y.; Kitabata, Y.; Kurosawa, M. General condition of hikikomori
(prolonged social withdrawal) in Japan: Psychiatric diagnosis and outcome in mental health welfare centres.Int. J. Soc. Psychiatry 2013, 59, 79–86. [CrossRef]
11. Nagata, T.; Yamada, H.; Teo, A.R.; Yoshimura, C.; Nakajima, T.; van Vliet, I. Comorbid social withdrawal(hikikomori) in outpatients with social anxiety disorder: Clinical characteristics and treatment response in acase series. Int. J. Soc. Psychiatry 2013, 59, 73–78. [CrossRef] [PubMed]
12. Zielenziger, M. Shutting Out the Sun: How Japan Created Its Own Lost Generation, 1st ed.; Talese, N.A., Ed.;Vintage: New York, NY, USA, 2006.
13. Goodman, R.; Imoto, Y.; Toivonen, T. A Sociology of Japanese Youth: From Returnees to NEETs; Routledge: NewYork, NY, USA; Abingdon, UK, 2012.

Int. J. Environ. Res. Public Health 2019, 16, 546 13 of 14
14. Norasakkunkit, V.; Uchida, Y.; Toivonen, T. Caught between culture, society, and globalization: Youthmarginalization in post-industrial Japan. Soc. Personal. Psychol. Compass 2012, 6, 361–378. [CrossRef]
15. Furuhashi, Y. Comparison between Teen-Onset Hikikomori and Adult-Onset Hikikomori in Japan. Eur.Psychiatry 2012, 27, 1. [CrossRef]
16. Sakamoto, N.; Martin, R.G.; Kumano, H.; Kuboki, T.; Al-Adawi, S. Hikikomori, is it a culture-reactive orculture-bound syndrome? Nidotherapy and a clinical vignette from Oman. Int. J. Psychiatry Med. 2005, 35,191–198. [CrossRef] [PubMed]
17. Koyama, A.; Miyake, Y.; Kawakami, N.; Tsuchiya, M.; Tachimori, H.; Takeshima, T. Lifetime prevalence,psychiatric comorbidity and demographic correlates of “hikikomori” in a community population in Japan.Psychiatry Res. 2010, 176, 69–74. [CrossRef] [PubMed]
18. Lee, Y.S.; Lee, J.Y.; Choi, T.Y.; Choi, J.T. Home visitation program for detecting, evaluating and treatingsocially withdrawn youth in Korea. Psych. Clin. Neurosci. 2013, 67, 193–202. [CrossRef] [PubMed]
19. Furuhashi, T.; Tsuda, H.; Ogawa, T.; Suzuki, K.; Shimizu, M.; Teruyama, J.; Horiguchi, S.; Shimizu, K.;Sedooka, A.; Figueiredo, C.; et al. Current situation, commonalities and differences between sociallywithdrawn young adults (Hikikomori) in France and Japan. Evol. Psychiatr. 2013, 78, 249–266. [CrossRef]
20. Kato, T.A.; Tateno, M.; Shinfuku, N.; Fujisawa, D.; Teo, A.R.; Sartorius, N.; Akiyama, T.; Ishida, T.; Choi, T.Y.;Balhara, Y.P.; et al. Does the ‘hikikomori’ syndrome of social withdrawal exist outside Japan? A preliminaryinternational investigation. Soc. Psychiatr. Psychiatr. Epidemiol. 2012, 47, 1061–1075. [CrossRef]
21. Hayakawa, K.; Kato, T.A.; Watabe, M.; Teo, A.R.; Horikawa, H.; Kuwano, N.; Shimokawa, N.; Sato-Kasai, M.;Kubo, H.; Ohgidani, M.; et al. Blood biomarkers of hikikomori, a severe social withdrawal syndrome. Sci.Rep. 2018, 8, 2884. [CrossRef]
22. British Heart Foundation. Health at Work Questionnaire—How Healthy is Your Diet? Availableonline: https://www.bhf.org.uk/informationsupport/publications/health-at-work/health-at-work-how-healthy-is-your-diet-questionnaire (accessed on 2 January 2019).
23. Vogel, S.H. Japanese society under stress. Asian Surv. 2012, 52, 687–713.24. Umeda, M.; Kawakami, N. Association of childhood family environments with the risk of social withdrawal
(‘hikikomori’) in the community population in Japan. Psychiatry Clin. Neurosci. 2012, 66, 121–129. [CrossRef][PubMed]
25. Ohashi, N. Exploring the Psychic Roots of Hikikomori in Japan; Proquest, Umi Dissertation Publishing: AnnArbor, MI, USA, 2011.
26. Chan, H.Y.; Lo, T.W. Quality of life of the hidden youth in Hong Kong. Appl. Res. Qual. Life 2014, 9, 951–969.[CrossRef]
27. Teychenne, M.; Ball, K.; Salmon, J. Sedentary Behavior and Depression among adults: A Review. Int. J. Behav.Med. 2010, 17, 246–254. [CrossRef] [PubMed]
28. Centre for Health Protection. Hypertension. Available online: http://www.chp.gov.hk/en/healthtopics/content/25/35390.html (accessed on 2 January 2019).
29. Family Council. Family Project Cohort Study. Available online: https://www.family.org.hk/wp-content/uploads/2015/07/KT25.pdf (accessed on 2 January 2019).
30. Zhou, B.; Bentham, J.; Di Cesare, M.; Bixby, H.; Danaei, G.; Cowan, M.J.; Paciorek, C.J.; Singh, G.;Hajifathalian, K.; Bennett, J.E. Worldwide trends in blood pressure from 1975 to 2015: A pooled analysisof 1479 population-based measurement studies with 19.1 million participants. Lancet 2017, 389, 37–55.[CrossRef]
31. World Health Organization. 2003 World Health Organization (WHO)/International Society of Hypertension(ISH) statement on management of hypertension. J. Hypertens. 2003, 21, 1983–1992. [CrossRef]
32. Goel, M.; Pal, P.; Agrawal, A.; Ashok, C. Relationship of body mass index and other life style factors withhypertension in adolescents. Ann. Pediatr. Cardiol. 2016, 9, 29–34. [PubMed]
33. Hagberg, J.M.; Park, J.; Brown, M.D. The role of exercise training in the treatment of hypertension. SportsMed. 2000, 30, 193–206. [CrossRef]
34. Cooper, A.R.; Moore, L.A.R.; McKenna, J.; Riddoch, C.J. What is the magnitude of blood pressure responseto a programme of moderate intensity exercise? Randomised controlled trial among sedentary adults withunmedicated hypertension. Br. J. Gen. Pract. 2000, 50, 958–962.
35. Pescatello, L.S.; Franklin, B.A.; Fagard, R.; Farquhar, W.B.; Kelley, G.A.; Ray, C.A. Exercise and hypertension.Med. Sci. Sports Exerc. 2004, 36, 533–553. [CrossRef]

Int. J. Environ. Res. Public Health 2019, 16, 546 14 of 14
36. Franklin, S.S.; Pio, J.R.; Wong, N.D.; Larson, M.G.; Leip, E.P.; Vasan, R.S.; Levy, D. Predictors of new-onsetdiastolic and systolic hypertension: The Framingham Heart Study. Circulation 2005, 111, 1121–1127.[CrossRef]
37. Grebla, R.C.; Rodriguez, C.J.; Borrell, L.N.; Pickering, T.G. Prevalence and determinants of isolated systolichypertension among young adults: The 1999–2004 US National Health and Nutrition Examination. Surv. J.Hypertens. 2010, 28, 15–23. [CrossRef] [PubMed]
38. Schnall, P.L.; Pieper, C.; Schwartz, J.E. The relationship between ‘job strain’, workplace diastolic bloodpressure, and left ventricular mass index. J. Am. Med. Assoc. 1990, 263, 1929–1935. [CrossRef]
39. Matthews, K.A.; Cottington, E.M.; Talbott, E.; Kuller, L.H.; Siegel, J.M. Stressful work conditions and diastolicblood pressure among blue collar factory workers. Am. J. Epidemiol. 1987, 126, 280–290. [CrossRef] [PubMed]
40. Payne, N.; Jones, F.; Harris, P.R. Employees’ perceptions of the impact of work on health behaviours. J. HealthPsychol. 2012, 18, 887–899. [CrossRef] [PubMed]
41. Payne, N.; Jones, F.; Harrism, P.R. The impact of working life on health behavior: The effect of job strain onthe cognitive predictors of exercise. J. Occup. Health Psychol. 2002, 7, 342–353. [CrossRef] [PubMed]
42. Virtanen, M.; Kivimäki, M.; Josensuu, M.; Virtanen, P.; Elovainio, M. Temporary employment and health:A review. Int. J. Epidemiol. 2005, 34, 610–622. [CrossRef] [PubMed]
43. Carpenter, C.J. A meta-analysis of the effectiveness of health belief model variables in predicting behavior.Health Commun. 2010, 25, 661–669. [CrossRef]
44. Abraham, C.; Sheeran, P. Chapter 2: The Health Belief Model. Predicting Health Behaviour: Research and Practicewith Social Condition Models; Open University Press: New York, NY, USA, 2005; pp. 28–80.
45. Haase, A.; Steptoe, A.; Sallis, J.F.; Wardle, J. Leisure-time physical activity in university students from 23countries: Associations with health beliefs, risk awareness, and national economic development. Prev. Med.2004, 39, 182–190. [CrossRef]
46. Wong, V. Social withdrawal as invisible youth disengagement: Government inaction and NGO responses inHong Kong. Int. J. Sociol Soc. Policy 2012, 32, 415–430. [CrossRef]
47. Wong, V. Social work with youth in social withdrawal: In-home and beyond-home intervention modalities.Chin. J. Soc. Work 2014, 7, 161–174. [CrossRef]
48. Wong, V.; Au-Yeung, T.C. Expediting youth’s entry into employment whilst overlooking precariousness:Flexi-employability and disciplinary activation in Hong Kong. Soc. Policy Admin. 2018, 1–17. [CrossRef]
49. Howe, C.J.; Cole, S.R.; Lau, B.; Napravnik, S.; Eron, J.J. Selection bias due to loss to follow up in cohortstudies. Epidemiology 2016, 27, 91–97. [CrossRef] [PubMed]
© 2019 by the authors. Licensee MDPI, Basel, Switzerland. This article is an open accessarticle distributed under the terms and conditions of the Creative Commons Attribution(CC BY) license (http://creativecommons.org/licenses/by/4.0/).