A Selected Bibliography on Oil Spill Dispersants - Fisheries ...

Indian Journal of Marine Sciences
Vol. 37(3), September 2008, pp. 233-242
A numerical model for the prediction of movement of gas condensate from spill
accidents in the Assalouyeh marine region, Persian Gulf, Iran
Habibi. S1, Torabi Azad. M
2 & Bidokhti. A.A
*3
1Islamic Azad University, Science & Research Branch, Tehran, Iran
2Physical Oceanography Dept. Islamic Azad University, North Tehran Branch, Tehran, PO Box 19735-181, Iran
3Institute of Geophysics, University of Tehran, Tehran, PO Box 14155-6466, Iran
*[E-mail: [email protected]]
Received 14 February 2007, revised.12 October 2007
This paper presents a three-dimensional numerical model of flow and movement of gas condensate spills based on
Navier-Stokes and continuity equations with Boussinesq approximation involving various surface wind forcings. The model
simulates the surface movement of gas condensate slick from spill accidents in Assalouyeh marine region. For the advection
term an upwind weighted, multidimensional positive definite advection transport algorithm (MPDATA) was used. This
algorithm uses an explicit finite difference scheme with an antidiffusive velocity for equilibrium diffusion. It also uses a
generalized-conjugate-residual (GCR) method for the solution. The model is run for gas condensate spill accidents in
Assalouyeh marine region in summer and winter of 2005. Numerical results show that gas condensate particles spread
torwards the shore in summer, while in winter it mostly spreads towards east. The spreadings follow the flow fields that are
in good agreement with flow field observations. Diffusion of gas condensate particles in the water due to more turbulence in
winter is larger, while gas condensate particles are observed on the water surface due to more stability and buoyancy force
in summer.
[Keywords: Gas condensate, concentration of particles, Assalouyeh marine region, Iran, numerical model, oil spill]
Introduction
The gas condensate spill accident is very harmful to
the marine environment as its particles can stay in the
water column for long times and pollute the deeper
water environment. In the last two to three decades
many researchers have studied the transport and the
processes of oil spills based on the trajectory method
and mass balance approachs, and various oil spill
models have been developed1-4.
In 1993, mathematical and empirical models for
surface oil spill transport in the Persian Gulf was
developed by Al-Rabeh et al
5. In these models, known as
GULFSLIK II, spreading of a surface oil spill was
simulated using the drifting buoys data of the Mt.
Mitchell Cruise, and also an empirical formula based on
the drift factor approach to estimate the surface oil spill
transport at 24-h intervals due to wind, is derived. The
empirical formula included the wind and current drift
factors approach that was based on the assumptions that
the effects of wind and current on a surface spill act
independently and can therefore be described as a vector
sum of velocities. The wind-induced oil spill speed is
also a small fraction of the wind speed. Moreover, the
direction of the oil spill motion is at a non-zero angle
(deflection angle) to the direction of the wind due to
Coriolis force. Surface currents for the specific wind
conditions were obtained from a hydrodynamic model
of the Gulf, known as HYDRO I. GULFSLIK II model
ignores tidal and density driven currents and also it is
assumed that surface oil spills move at the same velocity
as the wind driven surface currents. Results of the
drifting buoys experiments carried out in the Persian
Gulf during the Mt. Mitchell Cruise was used to estimate
wind–induced surface current speeds and the associated
directions.
A semi-analytical model of the rate of oil spill
disappearance from seawater for Kuwaiti crude and
its products has been developed by Riazi & Edalat6.
The model considers evaporation, dissolution and
sedimentation of oil components. The only adjustable
parameter in this work is a constant in the relation
between the mass transfer coefficient for evaporation
and spill size. The model estimates area, volume and
composition of oil spill versus time. It also calculates
the amount of oil vaporized, dissolved or sunk into
water with time.
Al-Rabeh et al.7 developed a the GULFSPILL
software package for the prediction of the movement
and fate of oil spills in the Persian Gulf. The package
comprises of four programs: GULFTRAK, OILPOL,
INDIAN J. MAR. SCI., VOL. 37, NO. 3, SEPTEMBER 2008
234
OILPOL-S and QUIKSLIK. In OILPOL, OILPOL-S
and QUIKSLIK the oil spill is modeled using a Monte
Carlo method. One component of the package allows
either forecasts or hindcasts of the motion of any
floating object (such as a patch of oil). The package is
based on a three-dimensional hydrodynamics model
that has been extensively tested and calibrated. The
disadvantage of this model is that the package is tied
only to one geographical location. To extend it to a
different water body would require recalibration of
the hydrodynamical model.
In the present study, a three-dimensional numerical
model is used to simulate the surface movement of
gas condensate slick from spill accident in
Assalouyeh marine region. The model is based on the
Navier-Stokes and the mass transport equations to
predict the gas condensate particles in the water
column, at the surface and also at different depths.
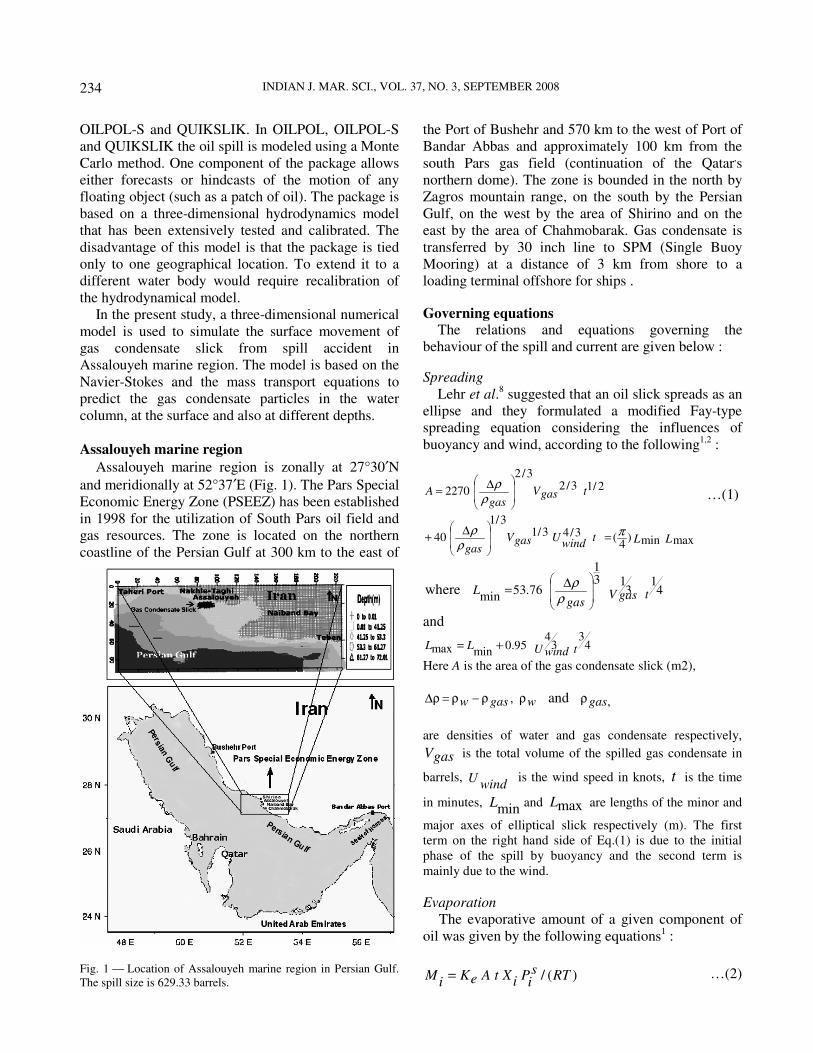
Assalouyeh marine region
Assalouyeh marine region is zonally at 27°30′N
and meridionally at 52°37′E (Fig. 1). The Pars Special
Economic Energy Zone (PSEEZ) has been established
in 1998 for the utilization of South Pars oil field and
gas resources. The zone is located on the northern
coastline of the Persian Gulf at 300 km to the east of
the Port of Bushehr and 570 km to the west of Port of
Bandar Abbas and approximately 100 km from the
south Pars gas field (continuation of the Qatar,s
northern dome). The zone is bounded in the north by
Zagros mountain range, on the south by the Persian
Gulf, on the west by the area of Shirino and on the
east by the area of Chahmobarak. Gas condensate is
transferred by 30 inch line to SPM (Single Buoy
Mooring) at a distance of 3 km from shore to a
loading terminal offshore for ships .
Governing equations The relations and equations governing the
behaviour of the spill and current are given below :
Spreading
Lehr et al.8 suggested that an oil slick spreads as an
ellipse and they formulated a modified Fay-type
spreading equation considering the influences of
buoyancy and wind, according to the following1,2
:
LLtwind
UgasVgas
tgasVgas
A
maxmin)4
(3/43/13/1
40
2/13/23/2
2270
πρ
ρ
ρρ
=∆
+
∆=
…(1)
tV gasgas
L 41
313
1
76.53min
where
∆=
ρρ
and
tU windLL 4
33
495.0
minmax +=
Here A is the area of the gas condensate slick (m2),
,, and gaswgasw ρρρ−ρ=ρ∆
are densities of water and gas condensate respectively,
gasV is the total volume of the spilled gas condensate in
barrels, wind
U is the wind speed in knots, t is the time
in minutes, min
L and maxL are lengths of the minor and
major axes of elliptical slick respectively (m). The first
term on the right hand side of Eq.(1) is due to the initial
phase of the spill by buoyancy and the second term is
mainly due to the wind.
Evaporation
The evaporative amount of a given component of
oil was given by the following equations1 :
)(/ RTsi
PiXtAeKi
M = …(2)
Fig. 1 — Location of Assalouyeh marine region in Persian Gulf.
The spill size is 629.33 barrels.

HABIBI et al.: MOVEMENT OF GAS CONDENSATE
235
∑= iMiMix /where
Here iM is the amount of component i lost by
evaporation (mole), e
K is the mass transfer
coefficient of evaporation m/s, A is the area of the
gas condensate slick (m2), t is the time (s), R is the gas
constant )10206.8(35
kmolmatm −× − , T is the air
temperature above the slick (k), siPiX is partial vapor
pressure of component i . siP is the vapor pressure of
component i, iX is the component mole fraction.
Mackay & Matsugu9 proposed the following
formulation to compute the mass transfer coefficient
of evaporation ek based on the results of laboratory
experiments1 (m/h) :
cSDUwindeK67.011.078.0
0292.0−−
= …(3)
where eK is the mass transfer coefficient (m/h),
windU is the wind speed (m/h), D is the gas
condensate slick diameter (m), cS is the Schmidt
number which represents the surface roughness. Then
the rates of evaporation can be calculated as1 :
∑ ∑== )(// RTsiPixAeKtiMeS …(4)
Dissolution
The amount of component i lost by dissolution can
be calculated by the following equation1 :
iSiXtAd
Ki
dM = …(5)
where i
dM is the amount of component i lost by
dissolution (mole), d
K is dissolution mass transfer
conefficient, iX is the component mole fraction, A is
the area of the gas condensate slick (m2), t is the time
(s), iS is the solubility of gas condensate.
In a report prepared by the U.S. Department of
Interior10
, the following relation is recommended to
compute d
K [Ref. no.6]:
L
D
D
w
w
Lwater
u
dK ν
ν
ν
ν
33.0
8.0035.0
= …(6)
where wν is the kinematic viscosity of seawater, νD
is the diffusion coefficient of gas condensate in water,
wateru is the water velocity and L is the square root
of surface area A. The rates of dissolution were then
calculated as1 :
∑ ∑== iSiXAd
Kti
dM
dS / …(7)
Vertical dispersion
The gas condensate slick on the sea is also subject
to the action of waves, especially breaking waves and
upper layer turbulence. Under their actions, the
coherent gas condensate slick will break up and
become small particles, then advect and diffuse in the
water column. Total mass of dispersed droplets
smaller than maxd is given by1,11
:
7.1maxcov
57.0)()( dSBA
DoCedtotM = …(8)
[ ] andwhere1
)()(−
≈ gasToC µ
20034.0 rmsHgwBA
D ρ=
Here )( edtotM is total mass of dispersed droplets
smaller than maxd )(2
m
kg, )(oC is a proportionality
constant dependent on the gas condensate viscosity
(µ) at gas condensate temperature gasT (k), BA
D is
the average energy dissipation per unit surface area in
an overturning wave, rmsH is the root mean square
value of the wave height, g is the acceleration due to
gravity, covS is the fraction of the sea surface
covered by gas condensate, maxd is maximum
droplet size and wρ is the density of water.
Conservation equations Momentum and continuity and gas condensate
particle transport equations are as follows :
Momentum equations in the yx , and z directions
are given by1 :
∂
∂
∂
∂+
∂
∂−=
∂
∂+
∂
∂+
∂
∂+
∂
∂
x
U
hxx
p
z
UW
y
UV
x
UU
t
Uν
ρ1
fVzx
y
U
hy+
∂
∂+
∂
∂
∂
∂+
)(1 τ
ρν …(9)

INDIAN J. MAR. SCI., VOL. 37, NO. 3, SEPTEMBER 2008
236
y
p
z
VW
y
VV
x
VU
t
V
∂
∂−=
∂
∂+
∂
∂+
∂
∂+
∂
∂
ρ1
fUz
y
y
Vhyx
Vhx
−∂
∂+
∂
∂
∂
∂+
∂
∂
∂
∂+
)(1 τ
ρνν …(10)
z
P
z
WW
y
WV
x
WU
t
W
∂
∂−=
∂
∂+
∂
∂+
∂
∂+
∂
∂
ρ1
gz
Wv
vzy
W
hyx
W
hx−
∂
∂∂∂+
∂
∂
∂
∂+
∂
∂
∂
∂+
νν …(11)
and the continuity equation :
0=∂
∂+
∂
∂+
∂
∂
z
W
y
V
x
U …(12)
Gas condensate particle transport equation is1 :
∂
∂
∂
∂=
∂
∂+
∂
∂+
∂
∂+
∂
∂
x
Cx
Dxz
CW
y
CV
x
CU
t
C )()()(
∑+∂
∂+
∂
∂
∂
∂+
∂
∂
∂
∂+
S
z
Cf
w
z
Cz
Dzy
Cy
Dy
)( …(13)
w
dg
w
gasw
fw
νρ
ρρ 2
18
1where
−=
Here U, V and W are the velocity components in the
longitudinal )(x , lateral )( y and vertical )(z
directions respectively, t is the time, ρ is the density
of gas condensate-water flow, P is the time–
averaged pressure, g is the gravitational acceleration,
hν is the coefficient of horizontal eddy viscosity, νν
is the coefficient of vertical eddy viscosity, xτ and
yτ are the horizontal shear stresses resulting from
vertical turbulent momentum transport, f is the
Coriolis parameter )sin2( φω=f , where ω is the
angular speed of the Earth's rotation and φ is the
geographical latitude), C is the concentration of gas
condensate particles, xD , yD and zD are the
diffusion coefficients in the yx, and z directions
respectively, s∑ is the effective source term, f
w is
the buoyant velocity of the gas condensate particles,
wρ and gasρ are the mass densities of water and
gas condensate respectively, d is the averaged gas
condensate particle size and wν is the kinematic
viscosity of water.
The density ( wgas,ρ ) and the viscosity ( wgas,ν )
are distinguished by the fraction of the gas condensate
in the gas condensate-water mixture flow and they are
defined as1 :
),1(,, wwgasFgaswgasFwgas
ρρρ −+= …(14)
wvwgasFgasvwgasFwgas
),1(,,−+=ν …(15)
where wgasF , is the fraction of the gas condensate in
the mixture, wgas,ν is kinematic molecular viscosity
of mixture, gasν is gas condensate viscosity, wν is
water viscosity, wgas,ρ is density of mixture, wρ is
water density, gasρ is gas condensate density.
The surface wind stress is computed using the
quadratic relationship :
windUV windUwindad
Csx2
1)
22( += ρτ (16)
windVV windU windad
Csy2
1)
22( += ρτ …(17)
where sxτ and syτ is surface wind stress, aρ is
density of air, d
C is drag coefficient, wind
U and
windV are components of wind velocity 10 m above
the sea surface.
For wind speeds below 25 m/s, d
c is given by the
expression :
310)21
)22
(066.063.0( −++= V windUwinddC …(18)
The bottom stress is computed using the quadratic
relationship with the depth-integrated current :
waterUV waterU waterKWbx
21
)22
( += ρτ …(19)
waterVV waterU waterKwby
21
)22
( += ρτ …(20)
where bx
τ and by
τ is bottom friction, K is bottom
friction coefficient ( K =0.002) and waterU and
waterV are components of the depth–integrated
current.

HABIBI et al.: MOVEMENT OF GAS CONDENSATE
237
The horizontal mixing coefficients are given as2,13
:
2/1
2
2
5.0
2
∂
∂+
∂
∂+
∂
∂+
∂
∂
∆∆==
y
V
y
U
x
V
x
U
yxsaCyDxD
…(21)
where saC is an arbitrary constant of order 0.5 and
yx ∆∆ and are the model grid lengths in the x and
y directions.
The vertical mixing coefficient zD can be
expressed in terms of turbulent eddy viscosity and the
mixing length turbulent closure1,2
:
z
t
zz
ezD
ϕσ
ν
ϕσν
ϕσ
ν+== …(22)
,2wherez
Umlt ∂
∂= ρν
5.0)1( −+= iRmgasl
ml β
,5.0)/1(7.0 Hzzmgasl −=
and2)/(
/
zU
zgiR
∂∂
∂∂−=
ρ
ρ
5.0)101(
5.1)33.31(
iR
iR
o
z
+
+=
ϕσ
ϕσ
where mgasl is the natural mixing length and it is
simply a function of the relative depth
H
Z, tν and
ν are the coefficient of kinematic turbulent viscosity
and kinematic molecular viscosity of mixture, ml is
mixing length in the gas condensate-water flow,
20=β , iR is Richardson number, zϕσ is the
turbulent Schmidt number, 1=oϕσ and eν is
kinematic effective viscosity1.
The model assumptions The salinity and heat budget equations are not used
in the model as the water column is assumed
homogeneous. The momentum equations in the
yx , and z directions without hydrostatic
approximation are used. The prevailing wind is
assumed to be northwest. In the first stage, the shape
of gas condensate slick is assumed to be elliptical and
homogeneous. The gas condensate is assumed to be a
single component and the density of the gas
condensate and water mixture is variable.
Initial conditions and the spill parameters
Elevation of the sea surface and water velocity
everywhere is zero, except along the open boundary
of the computational domain. Vertical velocity is zero
at side boundaries and bed and in the open boundaries
they are given by the tidal informations. An idealized
seawater basin consists of 67.5×27 km2 area grided
with the grid size 300=∆=∆ yx m of in horizontal
and 20 layers in vertical, and the time step for
integration is typically 5 s.
Parameters for gas condensate are:
3
750m
kggas =ρ , kinematic viscosity is 1.15 cP,
molecular weight is 150 gr/mol, interfacial tension is
20 dyne/cm, vapour pressure is 0.35 atmosphere in
winter and 0.54 atmosphere in summer, solubility is
18 mg/l and API is 57.17.
Other parameters are :
The Schmidt number is 23.33, the diffusion
coefficient of gas condensate in water is 0.0126 m2/s,
intrusion depth is 3 m, breaking wave height is 2 m,
breaking depth is 2.56 m, significant wave height is
1.62 m, root mean square wave height is 1.412 m,
wρ is 1027 3m
kg , water viscosity is 1 cP.
Boundary conditions
At coastal boundary, the normal component of
velocity is zero. At open boundaries, the sea surface
elevation is set equal to tide table data. The entire
coastal boundary consists of a shoreline with no river
inflows. There is no inflow or outflow in coastal
boundary, as it is impermeable. There is also no-slip
condition at the coastal boundaries and at the sea bed.
Grid domain , spill size and wind condition A regular rectangular mesh (67.5×27 km
2) with
grid size 300=∆=∆ yx m and with 20566 grid in
computational domain (27°21′N, 52°50′E) is used and
it is located between Taheri Port in west and Teben in
East, (Fig. 1). The model uses topographically
following σ -coordinate in vertical. For this domain
we use 20 layers of 0.05 σ each. σ is given by :

INDIAN J. MAR. SCI., VOL. 37, NO. 3, SEPTEMBER 2008
238
hH
hzH
−
−=σ …(23)
where H is the height of the model top, h is the
height of the local topography and z is the vertical
coordinate from the bed. Total volume of the spilled
gas condensate is 629.33 barrels. An accidental spill
at 10 in the morning, on 7th Feb. 2005 and 7th July
2005 near floating bouy (SPM) 3 km from shore
(shipsloading area ) was assumed to happen. Mean
temperature and maximum wind speed were 24.9°C
and 6.455 m/s respectively in winter(on 7th Feb.
2005). Mean temperature and maximum wind speed
were 38.4°C and 5.74 m/s respectively in summer
(on 7th July 2005). Figure 2 shows the seabed
topography of Assalouyeh Marine Region.The water
depth ranges from 1 m to 72 m.
The model algorithm The model uses Boussinesq approximation as Lipps
equations without the use of hydrostatic pressure
equation14
. Algorithm for advection equation is the
multidimensional positive definite advection transport
algorithm (MPDATA)15,16
. MPDATA is based on the
upstream scheme, an iterative method based on the
antidiffusive velocities is applied to correct the
excessive numerical diffusion in such scheme. First,
the advection of a quantity is solved by means of an
upstream scheme. This is the first iteration in the
MPDATA scheme. Second, the excessive numerical
diffusion produced by such scheme is corrected
reapplying the scheme, but now one substitutes the
velocity field by introducing an antidiffusive velocity
field. The antidiffusive velocity is derived analytically
based on the truncation error analysis of the upstream
scheme. A nonoscillatory option can be applied to the
MPDATA scheme to assure monotonicity. Such
procedure may be repeated by any optional number of
times. For two iterations, the MPDATA is a second-
order-accurate in time and space for any advective
velocity field. The properties of this scheme are:
stability, consistency and conservation of positive
definitives15,16
.
Model programming
Model programming has been done in fortran
language and the program is run on a personal
computer in which the processor speed is around 3
GHz with Ram capacity of 2 GB. For time step of five
second the repeated calculation is 40000 times for
every run.
Some Observations
The current speeds at depth of 5, 10 and 15 meters
from the water surface17 for 25th Jan. 2005 in Taheri
Port (27°30′, 52°35′E) is shown in Table 1. The winds
in winter are predominantly from northwest, along the
axis of the Persian Gulf basin. We did not have any
observations in summer.
Model results Figure 3A and B show the surface current vectors
after 14 and 42 hrs predictions for the 7th Feb. 2005
Fig. 2 — The seabed topography of Assalouyeh marine region.
Table 1 — Observations results of current speed (m/s) in Taheri
Port in winter (27°30'N, 52°35'E)
Observation
(15 m from the
water surface)
Observation
(10 m from the
water surface)
Observation
(5 m from the
water surface)
Time
(hour)
0.1798 0.0987 0.1076 0
0.073 0.0923 0.1082 1
0.1318 0.0712 0.0814 2
0.0924 0.0654 0.0537 3
0.1417 0.0394 0.0782 4
0.0717 0.0339 0.0602 5
0.0532 0.0399 0.0627 6
0.0228 0.0797 0.0529 7
0.0439 0.0301 0.0826 8
0.107 0.0663 0.0658 9
0.0277 0.1023 0.0506 10
0.0893 0.0616 0.078 11
0.0915 0.0475 0.0658 12
0.1014 0.0291 0.0439 13
0.1789 0.0772 0.0443 14
0.0401 0.0617 0.019 15
0.0669 0.1117 0.0279 16
0.0381 0.0839 0.0942 17
0.149 0.1796 0.2556 18
0.2331 0.2187 0.146 19
0.2392 0.1795 0.1663 20
0.1971 0.2316 0.2938 21
0.2038 0.2666 0.3066 22
0.2744 0.2655 0.1628 23

HABIBI et al.: MOVEMENT OF GAS CONDENSATE
239
with synoptic and tidal forcings for typical winter
time, as the northwesterly winds are strong. North–
westerly wind which is typical of winter time,
produces south–eastern currents, and also currents
along the coast. A region of flow divergence in east–
west direction in the middle of the region is apparent.
A cyclonic circulation also appears to develop in the
northern part of the region.
The predictions of surface concentration from the
scenario for gas condensate spill, which is released
3 km from the shore, are shown in Fig. 3C and D. The
flow field, especially the divergent region appears to
break the spill into two parts, one is moving north
towards the coast and the other is moving south–east
approaching the coast further east. In these shallow
waters towards the coast, turbulence as a result of
wave breaking can break up the gas condensate
further into smaller patches, although the model
results show an overall concentration after 14 and
42 hours in these figures. Figure 4A and B show the
corresponding flow field at a depth of about 15 m
below the surface. The flow at this depth is reverse to
that of the surface (Fig. 3A) especially in the
northwest, this maybe due to continuity and
restrictions of flow near the coastal area. The
divergent region near the middle of the region is still
marked. Also the cyclonic flow pattern in the northern
part is more dominant. Tidal forcing appears to
produce strong currents at this depth, while surface
currents are influneced by wind forcing.
Figure 4C and D show the corresponding pattern
and concentration of the gas condensate spill at a
depth of about 15 m below the surface. The size of the
spill at this depth is smaller and in one piece. At this
depth it appears to move towards east embracing the
coastal boundary. The Naiband bay appears to have
been engulfed by the gas condensate slick, and part of
the slick is observed in the north west of the spill
region. In winter time as the cold northwesterly winds
are strong more turbulent mixing and convection are
expected and the water column is almost uniform in
T , S and density (Fig. 5A , B for Leg 1 and Leg 6,
Fig. 4 — Velocity vectors of current at the depth of 15 meters
from the water surface (m/s); A) 14 hours after the accident of
spill, the value shown in the legend represents maximum speed
0.613 m/s; B) 42 hours after the accident of spill, the value shown
in the legend represents maximum speed 0.495 m/s in winter.
Concentration distribution of gas condensate particles (kg/m3) at
the depth of 15 meters from the water surface; C) 14 hours after
the accident of spill; D) 42 hours after the accident of spill in
winter.
Fig. 5 — A) Tempreature profiles for winter and summer times;
B) Salinity profiles for winter and summer ( Station 63 Mt.
Mitchell data, Reynolds, 1993. This station is near the Assalouyeh
marine region.).
Fig. 3 — Velocity vectors of current near the water surface (m/s);
A) 14 hours after the accident of spill, the value shown in the
legend represents maximum speed 0.227 m/s; B) 42 hours after
the accident of spill, the value shown in the legend represents
maximum speed 0.593 m/s in winter. Concentration distribution
of gas condensate particles (kg/m3) near the water surface; C) 14
hours after the accident of spill; D) 42 hours after the accident of
spill in winter.

INDIAN J. MAR. SCI., VOL. 37, NO. 3, SEPTEMBER 2008
240
Reynolds18). Convective condition, as flowing cold
air warms the surface water could also be expected
that may increase the spread of the spill at deeper
layers. In summer the thermocline is well developed
(Fig. 5A , B).
Mean, maximum and minimum of concentration of
hydrocarbon from model are about 17.48, 56.67 and
4.33 µg/g(ppm) respectively. Mean, maximum and
minimum of concentration of hydrocarbon, measured
by N.Ghaemi19 are 20.436, 49.309 and 3.781
µg/g(ppm) respectively.
The same spill was assumed to occur again but this
time on the 7th
July 2005 ( summer) (Fig. 1). This time
the prevailing northwesterely wind was weak and the
influence southwest monsoon in early summer leads
to surface currents moving towards the coast. Figure
6A and B show south and southeast weak currents in
the west of the region and northwesterly currents in
the east of the region and also no cyclonic circulation
was observed in the north as in the winter case. The
region of diverging flow in the surface was still
observed in a narrow band of east-westerly direction.
The flow field causes spread of gas condensate slick
near the water surface 14 and 42 hours after accident,
(Fig. 6C, D). These figures show the distribution of
particles after 14 and 42 hours due to south and
southeast currents and northwest surface current and
return current toward the northwest at the depth of
15 m from the surface, (Fig. 7A, B). Figure 6B shows
existence of south and southeast currents near the
surface.
The gas condensate slick this time appears to be
intact (in one piece) and more north. The surface area
of the slick spreads in size much less than that for the
winter case. This expected as the wind forcing is
much less in summer time. Also the thermocline
develops very markedly in summer time, so vertical
profiles of T , S and density also show strong
variations in the water column, in this area (Fig. 5A,
B). In this model we did not consider the vertical
variations of physical parameters in the water. This
may influence the vertical intrusion of the slick
towards deeper water. This may introduce some error
in predicted concentration, especially further away
offshore. Near the shore as waves are breaking,
vertical mixing is ensured, hence as the patch of the
spill reaches the near shore region it can extend to
deeper part as indicated in Fig. 7A-D which are for
the current predictions as well as the fate of the gas
condensate spill after 42 hours from the initial stage.
In fact the horizontal extent of the spill at 15 m depth
appears to be larger than that of the surface, near the
shore areas.
Figure 8A shows the thickness of the gas
condensate spill with time for summer and winter
cases. Firstly, the overall thickness for winter is less
than that for summer. Two stages of thickness
variation with time was observed, the early stage is
short and is more influenced by buoyancy which leads
to faster spreading (up to about 10 hours), then the
second stage which is mainly wind driven and slower.
Figure 8B shows the corresponding area of the spill
with time and again shows the same behaviour but in
reverse with thickness (Fig. 8A). This kind of
behaviour is also expected from Equation (1).
Fig. 6 — Velocity vectors of current near the water surface (m/s);
A) 14 hours after the accident of spill, the value shown in the
legend represents maximum speed 0.076 m/s; B) 42 hours after
the accident of spill, the value shown in the legend represents
maximum speed 0.26 m/s in summer. Concentration distribution
of gas condensate particles (kg/m3) near the water surface; C)
14 hours after the accident of spill; D) 42 hours after the accident
of spill in summer.
Fig. 7 — Velocity vectors of current at the depth of 15 meters
from the water surface (m/s); A) 14 hours after the accident of
spill, the value shown in the legend represents maximum speed
0.228 m/s; B) 42 hours after the accident of spill, the value shown
in the legend represents maximum speed 0.331 m/s in summer.
Concentration distribution of gas condensate particles (kg/m3) at
the depth of 15 meters from the water surface; C) 14 hours after
the accident of spill; D) 42 hours after the accident of spill in
winter.

HABIBI et al.: MOVEMENT OF GAS CONDENSATE
241
Figure 8C and D also show the percentage of the slick
which is respectively evaporated and dissolved. The
evaporation is much more in summer than winter
time, as the temperature is high. The same is not true,
for dissolution which may be the result of more
turbulence (stronger winds) in winter. Again two
stages of the rates of evaporation and dissolution were
observed corresponding to two stages of area growth
of the spill. Figure 9 shows effect of wind in
evaporation during summer. Evaporation is more in
windy condition as expected.
Discussion A 3-D flow and gas condensate trajectory and fate
models have been made to predict the movement of a
gas condensate slick and the concentration
distribution of gas condensate particles in the water
column and also the advection, evaporation and
dissolution on the water surface. The flow model uses
the MPDATA scheme for the advection terms and is
usually more efficient than other schemes in terms of
numerical diffusion16
. The predicted flow fields for
winter and summer period seem to follow the wind
forcing at the surface and tidal forcing in deeper parts.
A band of divergent flow was observed to be
developed in the middle of the domain in east-west
direction. This band appears to be responsible for the
split of the spill, especially in winter case. Table 2
shows comparison between current speeds at different
depth predicted by the model and observation at
Taheri port in winter. There is a good agreement
between the two.
Figure 10 also shows time variation of the currents
at two depths predicted by the model and
observations. Again good agreement between the
trends are observed. However after about 15 hours,
the current speeds show large increase in the
observation, that are not shown in predicted values.
This may be due to external effects that are not
considered by the model. This indicates that may be
Fig. 8 — Comprasion of property variations of the gas condensate
slick versus time in winter and summer; A) Thickness; B) Area;
C) Evaporation; D) Dissolution.
Fig. 9 — Comparison of evaporation gas condensate slick in
summer , wind velocities 3.5 and 5 m/s.
Fig. 10 — Comparison of numerical model results and
observations mean current speed (m/s) in Taheri Port in winter
(27°40' N, 52°20'E ).
Table 2 — Comparison of numerical model results and
observations mean current speed (m/s) in Taheri Port in winter
(27°40'N, 52°20' E)
Depth (From the
water surface, m) Numerical model Observations
5
10
15
0.0273
0.02905
0.056
0.0277
0.0291
0.069
15
(After 7 hours) 0.063 0.076
15
(After 14 hours) 0.053 0.069

INDIAN J. MAR. SCI., VOL. 37, NO. 3, SEPTEMBER 2008
242
one has to extend the area of computation that is
limited by the computing power for the present study.
It can be observed that the gas condensate slick
thickness decreases rapidly during the initial 10 hours.
This means that the first stage of spreading occurs in a
short time and mainly gravity driven. Evaporation
leads to a very significant mass loss of the gas
condensate and it has a profound effect on density and
viscosity and other properties of gas condensate. The
rate of dissolution was 0.02-0.1% of the rate of
evaporation. This is mainly due to very low solubility
of gas condensate components in water. Existence of
buoyancy force and stratification leads to
accumulation of particles near the water surface in
summer. Particles mix in the water column due to
instability of water column in winter. Fate of the gas
condensate spill for the two scenarios indicate that in
winter time more area of the coast is affected by the
slick. During winter the strong diverging flow in the
middle appears to split the slick, one part moving
north and the other moving east, affecting much larger
area of the coast than for the case in summer time.
Further study is warranted to improve the model by
inclusion of heat and salinity budgets for the water
columns. This is particularly important for summer as
thermocline is well developed in most parts of the
Persian Gulf (Fig. 5A, B and e.g. Reynolds18
).
Inclusion of surface water breaking which can lead to
entrainment of gas condensate droplet into deeper
water may also be important. Such a model can also
be incorporated into an environmental monitoring
package to give real-time forcasts, after full
evaluations.
Acknowledgement Authors would like to thank all personals of Pars
Gas and Oil Company in section of Research and
Development for their support in this study.
References: 1 Chao, X., Shankar, N.J. & Cheong, H.F., Two and three-
dimensional oil spill model for coastal waters, Ocean Eng.,
28(2001) 1557-1573.
2 Chao, X., Shankar, N.J. & Wang, S.S.Y., Development and
application of oil spill model for Singapore coastal waters, J.
Hydraul. Eng. – ASCE, 129(2003) 495-503.
3 Spaulding, M.L., A state-of-the-art review of oil spill
trajectory. Fate modeling,oil, Chemical Pollution, 4(1988)
39-55.
4 Varlamov, S.M., Yoon, J.H. & Hirose, N., Simulation of oil
spill processes in the sea of Japan with regional ocean
circulation model, J. Mar. Sci. Technol., 4(1999)94-107.
5 Al-Rabeh, A., Lardner, R., Gunay, N. & Khan, R., On
mathematical and empirical models for surface oil spill
transport in the Persian Gulf, Mar. Poll. Bull., 27(1993) 71-
77.
6 Riazi, M.R. & Edalat, M., Prediction of the rate oil removal
from seawater by evaporation and dissolution, J. Petrol. Sci.
& Eng., 16(1999) 291-300.
7 Al-Rabeh, A.H., Lardner, R.W., & Gunay, N., Gulf Spill
Version 2.0: A software package for oil spills in the Persian
Gulf, J. Env. Model. Soft., 15(2000) 425-442.
8 Lehr, W.J., Fraga, R.J., Belen, M.S. & Cekirge,H.M., A
new technique to estimate initial spill size using a modified
Fay-type spreading formula, Mar. Poll. Bull., 15(1984)
326-329.
9 Mackay, D. & Matsugu, R.S., Evaporation rates of liquid
hydrocarbon spills on land and water, Can. J. Chem. Eng., 51
(1973) 434-439.
10 Anon, U.S. Department of Interior, Measuring damages to
coastal and marine natural resources, Volume I, CERCLA
301 Project (U.S. Dep. Inter., Washington,DC.), 1987, pp.
220.
11 Korotenko, K.A., Mamedov,R.M & Mooers, C.N.K.,
Prediction of the dispersal of oil transport in the Caspian Sea
resulting from a continuous release, Spill Sci. Technol. Bull.,
6 (2000) 323-339.
12 Smith, S.D. & Banke,E.G., Variation of the sea surface drag
coefficient with wind speed, Q.J.Roy. Meteorol.Soc.,
101(1975) 665-673.
13 Davies, A.M., Jones,J.E., & Xing,J., Review of recent
developments in tidal hydrodynamic modeling. I:Spectral
models, J.Hydraul.Eng., 123 (1997) 278-292.
14 Lipps, F.B., On the anelastic approximation for deep
convection, J.Atmos. Sci, 39(1990) 2192-2211.
15 Smorlarkiewicz, P.K., A fully multidimensional positive
definite advection transport algorithm with small implicit
diffusion, J.Comp.Phy., 54(1984) 325-362.
16 Smolarkiewicz, P.K. & Margolin, L., MPDATA: A finite
difference solver for gophysical flows, J. Comp. Phy.,
140(1998) 459-480.
17 Flahi, M., Prediction of tidal currents in the Straits of
Hormoz, M.Sc. Thesis, Tarbiat Modares University, Iran,
2006.
18 Reynolds, R.Michael, Physical oceanography of the Gulf,
Strait of Hormuz, and the Gulf of Oman-results from the
Mt.Mitchell expedition, Mar. Poll. Bull., 27 (1993) 35-59.
19 Ghaemi, N., Oil pollution in sediments of the Persian Gulf,
Q. J. Sci., Ira. Dept. Env. 8 (1997) 36-43.
Copyright © 2022 FDOKUMEN