A novel semi-automatic image processing approach to determine Plasmodium falciparum parasitemia in...
12
BioMed Central Page 1 of 12 (page number not for citation purposes) BMC Cell Biology Open Access Research article A novel semi-automatic image processing approach to determine Plasmodium falciparum parasitemia in Giemsa-stained thin blood smears Minh-Tam Le †1 , Timo R Bretschneider* †1 , Claudia Kuss 2 and Peter R Preiser 2 Address: 1 School of Computer Engineering, Nanyang Technological University, N4-02a-32 Nanyang Avenue, Singapore 639798, Singapore and 2 School of Biological Sciences, Nanyang Technological University, 60 Nanyang Drive, Singapore 637551, Singapore Email: Minh-Tam Le - [email protected]; Timo R Bretschneider* - [email protected]; Claudia Kuss - [email protected]; Peter R Preiser - [email protected] * Corresponding author †Equal contributors Abstract Background: Malaria parasitemia is commonly used as a measurement of the amount of parasites in the patient's blood and a crucial indicator for the degree of infection. Manual evaluation of Giemsa-stained thin blood smears under the microscope is onerous, time consuming and subject to human error. Although automatic assessments can overcome some of these problems the available methods are currently limited by their inability to evaluate cases that deviate from a chosen "standard" model. Results: In this study reliable parasitemia counts were achieved even for sub-standard smear and image quality. The outcome was assessed through comparisons with manual evaluations of more than 200 sample smears and related to the complexity of cell overlaps. On average an estimation error of less than 1% with respect to the average of manually obtained parasitemia counts was achieved. In particular the results from the proposed approach are generally within one standard deviation of the counts provided by a comparison group of malariologists yielding a correlation of 0.97. Variations occur mainly for blurred out-of-focus imagery exhibiting larger degrees of cell overlaps in clusters of erythrocytes. The assessment was also carried out in terms of precision and recall and combined in the F- measure providing results generally in the range of 92% to 97% for a variety of smears. In this context the observed trade-off relation between precision and recall guaranteed stable results. Finally, relating the F-measure with the degree of cell overlaps, showed that up to 50% total cell overlap can be tolerated if the smear image is well-focused and the smear itself adequately stained. Conclusion: The automatic analysis has proven to be comparable with manual evaluations in terms of accuracy. Moreover, the test results have shown that the proposed comparison-based approach, by exploiting the interrelation between different images and color channels, has successfully overcome most of the inherent limitations possibly occurring during the sample preparation and image acquisition phase. Eventually, this can be seen as an opportunity for developing low-cost solutions for mass screening. Published: 28 March 2008 BMC Cell Biology 2008, 9:15 doi:10.1186/1471-2121-9-15 Received: 19 October 2007 Accepted: 28 March 2008 This article is available from: http://www.biomedcentral.com/1471-2121/9/15 © 2008 Le et al; licensee BioMed Central Ltd. This is an Open Access article distributed under the terms of the Creative Commons Attribution License (http://creativecommons.org/licenses/by/2.0 ), which permits unrestricted use, distribution, and reproduction in any medium, provided the original work is properly cited.
-
Upload
independent -
Category
Documents
-
view
1 -
download
0
Transcript of A novel semi-automatic image processing approach to determine Plasmodium falciparum parasitemia in...
BioMed CentralBMC Cell Biology
ss
Open AcceResearch articleA novel semi-automatic image processing approach to determine Plasmodium falciparum parasitemia in Giemsa-stained thin blood smearsMinh-Tam Le†1, Timo R Bretschneider*†1, Claudia Kuss2 and Peter R Preiser2Address: 1School of Computer Engineering, Nanyang Technological University, N4-02a-32 Nanyang Avenue, Singapore 639798, Singapore and 2School of Biological Sciences, Nanyang Technological University, 60 Nanyang Drive, Singapore 637551, Singapore
Email: Minh-Tam Le - [email protected]; Timo R Bretschneider* - [email protected]; Claudia Kuss - [email protected]; Peter R Preiser - [email protected]
* Corresponding author †Equal contributors
AbstractBackground: Malaria parasitemia is commonly used as a measurement of the amount of parasitesin the patient's blood and a crucial indicator for the degree of infection. Manual evaluation ofGiemsa-stained thin blood smears under the microscope is onerous, time consuming and subjectto human error. Although automatic assessments can overcome some of these problems theavailable methods are currently limited by their inability to evaluate cases that deviate from achosen "standard" model.
Results: In this study reliable parasitemia counts were achieved even for sub-standard smear andimage quality. The outcome was assessed through comparisons with manual evaluations of morethan 200 sample smears and related to the complexity of cell overlaps. On average an estimationerror of less than 1% with respect to the average of manually obtained parasitemia counts wasachieved. In particular the results from the proposed approach are generally within one standarddeviation of the counts provided by a comparison group of malariologists yielding a correlation of0.97. Variations occur mainly for blurred out-of-focus imagery exhibiting larger degrees of celloverlaps in clusters of erythrocytes.
The assessment was also carried out in terms of precision and recall and combined in the F-measure providing results generally in the range of 92% to 97% for a variety of smears. In thiscontext the observed trade-off relation between precision and recall guaranteed stable results.Finally, relating the F-measure with the degree of cell overlaps, showed that up to 50% total celloverlap can be tolerated if the smear image is well-focused and the smear itself adequately stained.
Conclusion: The automatic analysis has proven to be comparable with manual evaluations interms of accuracy. Moreover, the test results have shown that the proposed comparison-basedapproach, by exploiting the interrelation between different images and color channels, hassuccessfully overcome most of the inherent limitations possibly occurring during the samplepreparation and image acquisition phase. Eventually, this can be seen as an opportunity fordeveloping low-cost solutions for mass screening.
Published: 28 March 2008
BMC Cell Biology 2008, 9:15 doi:10.1186/1471-2121-9-15
Received: 19 October 2007Accepted: 28 March 2008
This article is available from: http://www.biomedcentral.com/1471-2121/9/15
© 2008 Le et al; licensee BioMed Central Ltd. This is an Open Access article distributed under the terms of the Creative Commons Attribution License (http://creativecommons.org/licenses/by/2.0), which permits unrestricted use, distribution, and reproduction in any medium, provided the original work is properly cited.
Page 1 of 12(page number not for citation purposes)

BMC Cell Biology 2008, 9:15 http://www.biomedcentral.com/1471-2121/9/15
BackgroundParasitemia, the quantitative relative content of parasitesin the blood, is commonly used in malaria diagnosis inpatients as well as for in vitro testing of new anti-malarialcompounds in research laboratories. This measure can beobtained using various approaches, though the preferredand most reliable is microscopic examination of Giemsa-stained thin blood films. However, manual microscopicenumeration is a time-consuming and tiring process thatcan be significantly effected by the expertise of theobserver and, thus, have variable accuracy. Therefore, anautomated image analysis system for accurate, fast andreliable determination of parasitemia is desirable.
For this purpose, images of stained blood samples are cap-tured from a microscope and then transferred to a compu-ter for analysis. This study utilized a common, relativelylow-end light microscope in combinations with a digitalcamera, trading off image quality for affordability. Conse-quently, the image analysis process has to cope withnumerous challenges, due to the various inherent limita-tions of the acquisition process, such as the presence ofblurring, over- or under-exposure, and non-uniform illu-mination [1].
Moreover, the observed image quality is significantlyinfluenced by the quality of the prepared smear in termsof uniformity of erythrocyte distribution (smearing),staining, and cleanliness. The analysis of an extensive datacollection obtained during general laboratory operationsalso showed that conventional assumptions, like theequal-sized circular shape of erythrocytes, does not alwayshold as depicted in Figure 1(a). Additionally, in dataobtained under a real-world situation, more often thannot, cells overlap each other, forming clusters and, thus,complicate the analysis. An example is given in Figure1(b). In images of older samples, cells and parasites maypossess different colors due to different incubation timeswith the staining solution. Furthermore, in a non-labora-tory environment, an analysis has to account for the pres-ence of the other blood components, such as leukocytesand platelets. However, one of the most prominent prob-lems is out-of-focus imagery, which is mainly due tospherical aberrations, and the difficulty in detecting thering state of the infection as illustrated in Figure 1(c) andFigure 1(d), respectively.
In the literature, one can observe two almost separateresearch streams in bioinformatics and microbiologyaddressing the problem of malarial blood sample analysisin particular, and blood smear analysis in general. Bloodsmear image analysis has been tackled by using conven-tional image processing techniques like morphology [2],edge detection [3], region growing [4] etc., which all have
shown certain degrees of success with respect to the useddata.
One of the most recent studies addressed the problem ofparasitemia estimation using edge detection and splittingof large clumps made up from erythrocytes [3]. The out-come of the approach was shown to be satisfactory forwell-stained samples with well-separated erythrocytes.
In further studies, granulometric estimation, morpholog-ical and thresholding techniques were employed withpromising outcomes [2,5-7]. However, these techniquesare very sensitive to the images' quality. Assuming a sce-nario where cells are touching each other only slightly, anarea-fitting technique was proposed, using a circular tem-plate [7]. Naturally, the approach fails if the aboveassumption is violated. In a recent study [8], segmenta-tion of erythrocyte clusters was performed using a correla-tion-driven optimization approach. Although theapproach considered variations in cell shapes and sizes,unstable results were reported.
Tackling the challenge from another angle, Pinzón et al.[9] suggested that the problem of erythrocyte segmenta-tion could be reduced to a peak selection problem in theHough space. The study focused on detecting erythrocytesof circular shape and uniform size, an assumption whichmust be made with caution.
Lastly, extended maxima transform [10] and watershedtransform were also employed, given that local maximaindicate the centers of convex shapes, i.e. blood compo-nents – particularly erythrocytes. This concept, however, isonly justifiable for images which exhibit a small degree ofcell overlap.
In this paper a comparison-based analysis approach wasdeveloped, which differentiates solid components inblood smears by exploiting the inter-relations betweendifferent observations and radiometric representations.The use of statistical measures in these comparisons andcross-referencing validations yields a more reliable detec-tion scheme than previous techniques. Furthermore, theconcept of matching the image content with strictlydefined model representations was relaxed in order toaccount for the variety of observed cases.
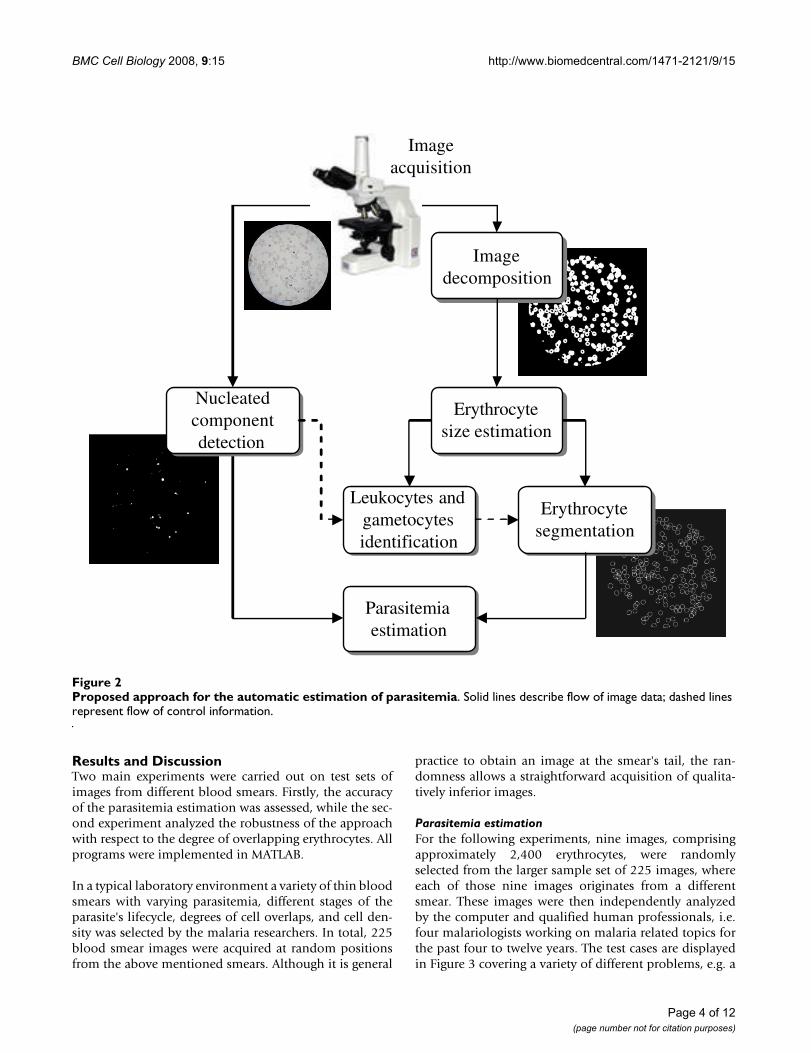
The digital analysis process is depicted schematically inFigure 2 and comprises six stages, namely the nucleatedcomponents detection, image decomposition, erythrocytesize estimation, leukocytes and malarial gametocytesidentification, erythrocytes segmentation and, finally,parasitemia estimation. Solid lines describe the flow ofimage data, while dashed lines represent the flow of con-trol information.
Page 2 of 12(page number not for citation purposes)

BMC Cell Biology 2008, 9:15 http://www.biomedcentral.com/1471-2121/9/15
Firstly, the acquired image is analyzed for the occurrenceof nucleated components. This aspect includes the actualparasite as well as other blood components with anucleus, e.g. leukocytes. Only during a later processingstep are the various components differentiated based ontheir properties and location of occurrence. Secondly, theentire smear image is decomposed in solid and non-solidmatters with the latter one characterized as background.Once this is achieved the average size of an erythrocyte forthe given case is estimated. This image-dependent processenables a large degree of flexibility with respect to themicroscope settings and used samples. Based on theresults of the size estimation, the differentiation amongleucocytes, gametocytes and erythrocytes is straightfor-ward. However, most significantly, the information sup-ports the segmentation of erythrocyte clusters intoindividual erythrocytes. Eventually, the results of the
erythrocyte and parasite mapping are combined for theactual parasitemia estimation.
The inherent shortcomings of the low-cost acquisitioninstrumentation, such as non-uniform back-side illumi-nation as well as operational obstacles, e.g. contamina-tions on the microscope's and camera's lenses, areovercome through the consideration in the actual process-ing. As a major difference to previous work, the under-taken investigation utilizes the entire microscopic viewinstead of extracting a rectangular image region. Finally,high degrees of cell overlaps within large erythrocyte clus-ters are handled, setting the qualitatively best images ofthe conducted work on the same level with the worst casesof previously conducted studies.
Examples for real-world imagery casesFigure 1Examples for real-world imagery cases. (a) variable and irregular erythrocyte shapes, (b) overlapping erythrocytes form-ing clusters, (c) stained leukocyte and out-of-focus erythrocytes, (d) touching erythrocytes with low contrast and parasites most dominantly in poorly detectable ring state.
(a) (b)
(c) (d)
Page 3 of 12(page number not for citation purposes)
BMC Cell Biology 2008, 9:15 http://www.biomedcentral.com/1471-2121/9/15
Results and DiscussionTwo main experiments were carried out on test sets ofimages from different blood smears. Firstly, the accuracyof the parasitemia estimation was assessed, while the sec-ond experiment analyzed the robustness of the approachwith respect to the degree of overlapping erythrocytes. Allprograms were implemented in MATLAB.
In a typical laboratory environment a variety of thin bloodsmears with varying parasitemia, different stages of theparasite's lifecycle, degrees of cell overlaps, and cell den-sity was selected by the malaria researchers. In total, 225blood smear images were acquired at random positionsfrom the above mentioned smears. Although it is general
practice to obtain an image at the smear's tail, the ran-domness allows a straightforward acquisition of qualita-tively inferior images.
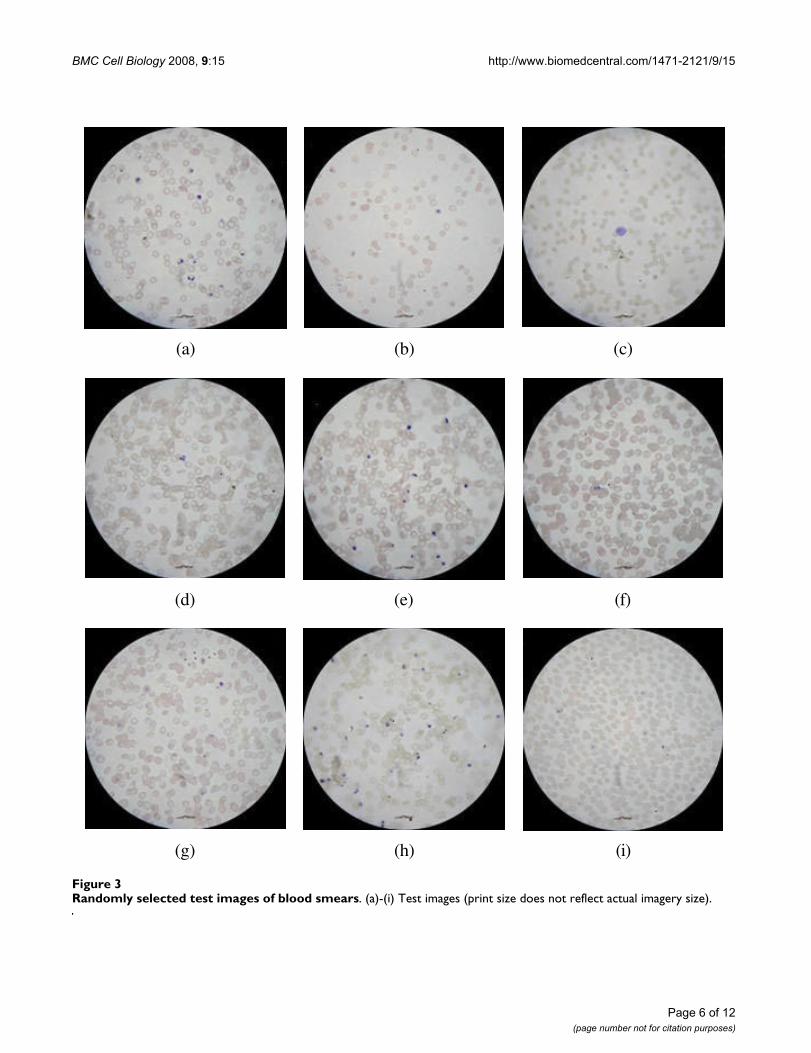
Parasitemia estimationFor the following experiments, nine images, comprisingapproximately 2,400 erythrocytes, were randomlyselected from the larger sample set of 225 images, whereeach of those nine images originates from a differentsmear. These images were then independently analyzedby the computer and qualified human professionals, i.e.four malariologists working on malaria related topics forthe past four to twelve years. The test cases are displayedin Figure 3 covering a variety of different problems, e.g. a
Proposed approach for the automatic estimation of parasitemiaFigure 2Proposed approach for the automatic estimation of parasitemia. Solid lines describe flow of image data; dashed lines represent flow of control information.
Leukocytes andgametocytesidentification
Leukocytes andgametocytesidentification
Parasitemiaestimation
Parasitemiaestimation
Erythrocytesegmentation
Erythrocytesegmentation
Erythrocytesize estimation
Erythrocytesize estimation
Imagedecomposition
Imagedecomposition
Nucleatedcomponentdetection
Nucleatedcomponentdetection
Imageacquisition
Page 4 of 12(page number not for citation purposes)
BMC Cell Biology 2008, 9:15 http://www.biomedcentral.com/1471-2121/9/15
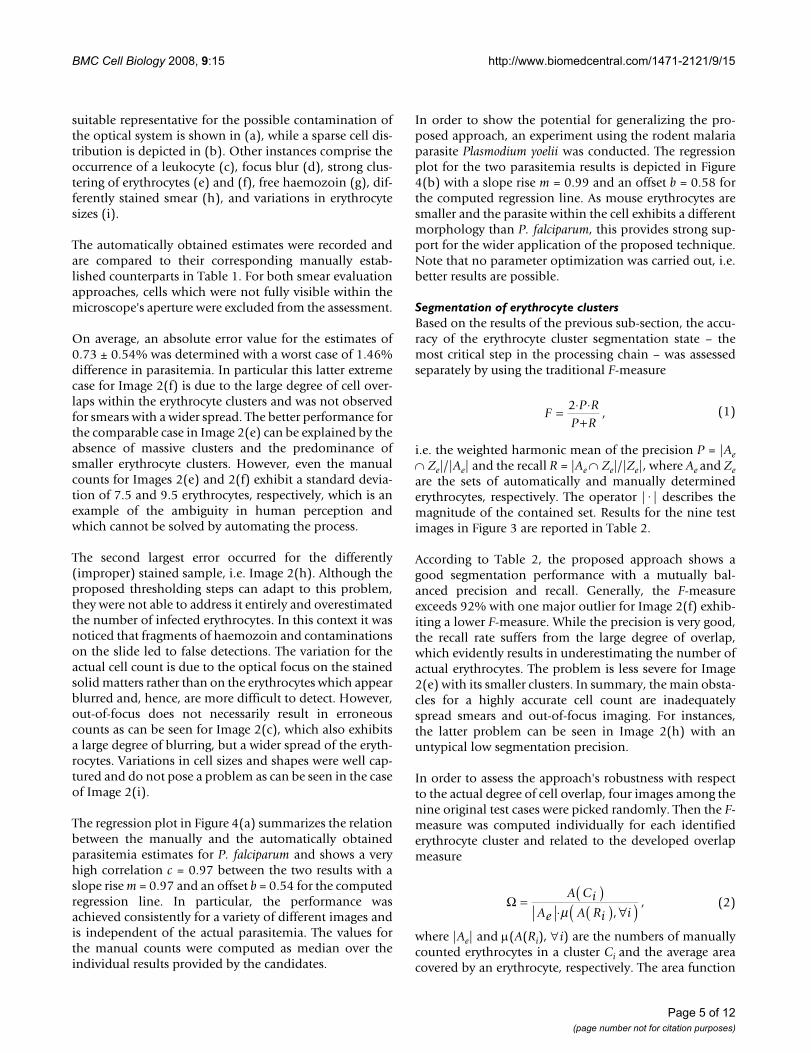
suitable representative for the possible contamination ofthe optical system is shown in (a), while a sparse cell dis-tribution is depicted in (b). Other instances comprise theoccurrence of a leukocyte (c), focus blur (d), strong clus-tering of erythrocytes (e) and (f), free haemozoin (g), dif-ferently stained smear (h), and variations in erythrocytesizes (i).
The automatically obtained estimates were recorded andare compared to their corresponding manually estab-lished counterparts in Table 1. For both smear evaluationapproaches, cells which were not fully visible within themicroscope's aperture were excluded from the assessment.
On average, an absolute error value for the estimates of0.73 ± 0.54% was determined with a worst case of 1.46%difference in parasitemia. In particular this latter extremecase for Image 2(f) is due to the large degree of cell over-laps within the erythrocyte clusters and was not observedfor smears with a wider spread. The better performance forthe comparable case in Image 2(e) can be explained by theabsence of massive clusters and the predominance ofsmaller erythrocyte clusters. However, even the manualcounts for Images 2(e) and 2(f) exhibit a standard devia-tion of 7.5 and 9.5 erythrocytes, respectively, which is anexample of the ambiguity in human perception andwhich cannot be solved by automating the process.
The second largest error occurred for the differently(improper) stained sample, i.e. Image 2(h). Although theproposed thresholding steps can adapt to this problem,they were not able to address it entirely and overestimatedthe number of infected erythrocytes. In this context it wasnoticed that fragments of haemozoin and contaminationson the slide led to false detections. The variation for theactual cell count is due to the optical focus on the stainedsolid matters rather than on the erythrocytes which appearblurred and, hence, are more difficult to detect. However,out-of-focus does not necessarily result in erroneouscounts as can be seen for Image 2(c), which also exhibitsa large degree of blurring, but a wider spread of the eryth-rocytes. Variations in cell sizes and shapes were well cap-tured and do not pose a problem as can be seen in the caseof Image 2(i).
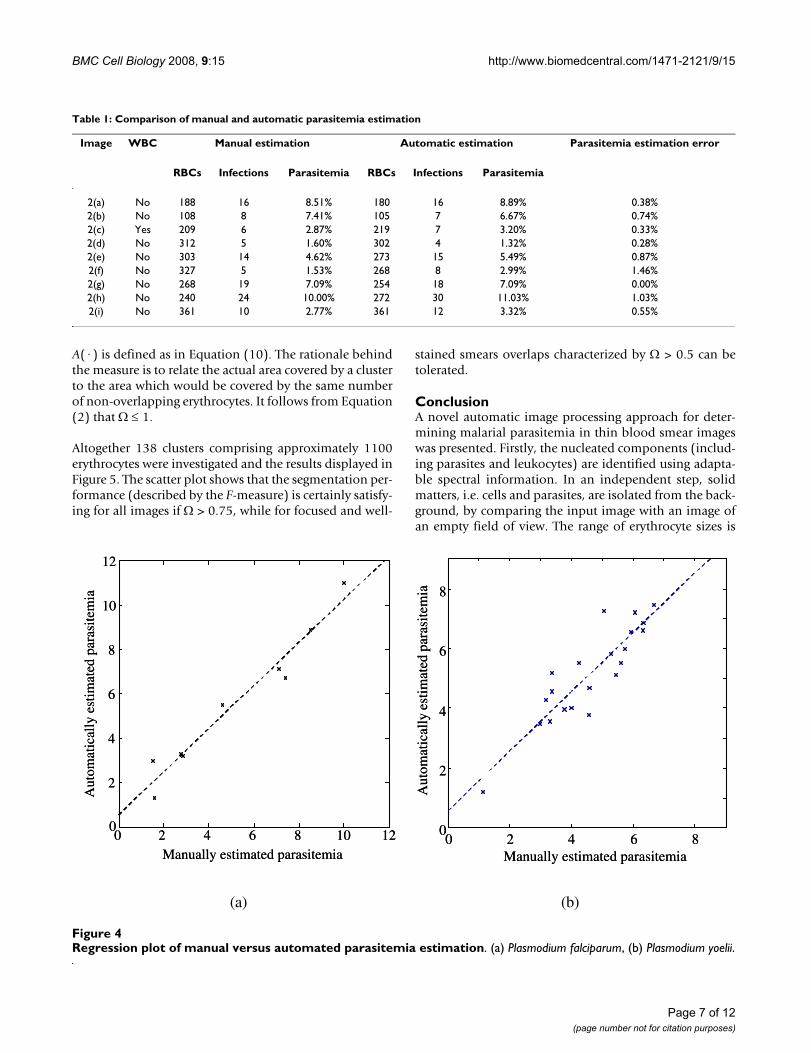
The regression plot in Figure 4(a) summarizes the relationbetween the manually and the automatically obtainedparasitemia estimates for P. falciparum and shows a veryhigh correlation c = 0.97 between the two results with aslope rise m = 0.97 and an offset b = 0.54 for the computedregression line. In particular, the performance wasachieved consistently for a variety of different images andis independent of the actual parasitemia. The values forthe manual counts were computed as median over theindividual results provided by the candidates.
In order to show the potential for generalizing the pro-posed approach, an experiment using the rodent malariaparasite Plasmodium yoelii was conducted. The regressionplot for the two parasitemia results is depicted in Figure4(b) with a slope rise m = 0.99 and an offset b = 0.58 forthe computed regression line. As mouse erythrocytes aresmaller and the parasite within the cell exhibits a differentmorphology than P. falciparum, this provides strong sup-port for the wider application of the proposed technique.Note that no parameter optimization was carried out, i.e.better results are possible.
Segmentation of erythrocyte clustersBased on the results of the previous sub-section, the accu-racy of the erythrocyte cluster segmentation state – themost critical step in the processing chain – was assessedseparately by using the traditional F-measure
i.e. the weighted harmonic mean of the precision P = |Ae∩ Ze|/|Ae| and the recall R = |Ae ∩ Ze|/|Ze|, where Ae and Zeare the sets of automatically and manually determinederythrocytes, respectively. The operator |·| describes themagnitude of the contained set. Results for the nine testimages in Figure 3 are reported in Table 2.
According to Table 2, the proposed approach shows agood segmentation performance with a mutually bal-anced precision and recall. Generally, the F-measureexceeds 92% with one major outlier for Image 2(f) exhib-iting a lower F-measure. While the precision is very good,the recall rate suffers from the large degree of overlap,which evidently results in underestimating the number ofactual erythrocytes. The problem is less severe for Image2(e) with its smaller clusters. In summary, the main obsta-cles for a highly accurate cell count are inadequatelyspread smears and out-of-focus imaging. For instances,the latter problem can be seen in Image 2(h) with anuntypical low segmentation precision.
In order to assess the approach's robustness with respectto the actual degree of cell overlap, four images among thenine original test cases were picked randomly. Then the F-measure was computed individually for each identifiederythrocyte cluster and related to the developed overlapmeasure
where |Ae| and μ(A(Ri), ∀i) are the numbers of manuallycounted erythrocytes in a cluster Ci and the average areacovered by an erythrocyte, respectively. The area function
FP R
P R= ⋅ ⋅
+2
, (1)
Ω = ( )⋅ ( ) ∀( )
A CiAe A Ri iμ ,
, (2)
Page 5 of 12(page number not for citation purposes)
BMC Cell Biology 2008, 9:15 http://www.biomedcentral.com/1471-2121/9/15
Page 6 of 12(page number not for citation purposes)
Randomly selected test images of blood smearsFigure 3Randomly selected test images of blood smears. (a)-(i) Test images (print size does not reflect actual imagery size).
(a) (b) (c)
(d) (e) (f)
(g) (h) (i)
BMC Cell Biology 2008, 9:15 http://www.biomedcentral.com/1471-2121/9/15
A(·) is defined as in Equation (10). The rationale behindthe measure is to relate the actual area covered by a clusterto the area which would be covered by the same numberof non-overlapping erythrocytes. It follows from Equation(2) that Ω ≤ 1.
Altogether 138 clusters comprising approximately 1100erythrocytes were investigated and the results displayed inFigure 5. The scatter plot shows that the segmentation per-formance (described by the F-measure) is certainly satisfy-ing for all images if Ω > 0.75, while for focused and well-
stained smears overlaps characterized by Ω > 0.5 can betolerated.
ConclusionA novel automatic image processing approach for deter-mining malarial parasitemia in thin blood smear imageswas presented. Firstly, the nucleated components (includ-ing parasites and leukocytes) are identified using adapta-ble spectral information. In an independent step, solidmatters, i.e. cells and parasites, are isolated from the back-ground, by comparing the input image with an image ofan empty field of view. The range of erythrocyte sizes is
Table 1: Comparison of manual and automatic parasitemia estimation
Image WBC Manual estimation Automatic estimation Parasitemia estimation error
RBCs Infections Parasitemia RBCs Infections Parasitemia
2(a) No 188 16 8.51% 180 16 8.89% 0.38%2(b) No 108 8 7.41% 105 7 6.67% 0.74%2(c) Yes 209 6 2.87% 219 7 3.20% 0.33%2(d) No 312 5 1.60% 302 4 1.32% 0.28%2(e) No 303 14 4.62% 273 15 5.49% 0.87%2(f) No 327 5 1.53% 268 8 2.99% 1.46%2(g) No 268 19 7.09% 254 18 7.09% 0.00%2(h) No 240 24 10.00% 272 30 11.03% 1.03%2(i) No 361 10 2.77% 361 12 3.32% 0.55%
Regression plot of manual versus automated parasitemia estimationFigure 4Regression plot of manual versus automated parasitemia estimation. (a) Plasmodium falciparum, (b) Plasmodium yoelii.
0 2 4 6 8 10 120
2
4
6
8
10
12
Manually estimated parasitemia
Aut
omat
ical
ly e
stim
ated
par
asit
emia
0 2 4 6 8 10 120
2
4
6
8
10
12
Manually estimated parasitemia
Aut
omat
ical
ly e
stim
ated
par
asit
emia
0 2 4 6 8
0
2
4
6
8
Manually estimated parasitemia
Aut
omat
ical
ly e
stim
ated
par
asit
emia
0 2 4 6 80
2
4
6
8
Manually estimated parasitemia
Aut
omat
ical
ly e
stim
ated
par
asit
emia
(a) (b)
Page 7 of 12(page number not for citation purposes)

BMC Cell Biology 2008, 9:15 http://www.biomedcentral.com/1471-2121/9/15
then determined by examining user inputs of isolatederythrocyte regions. Leukocytes and malarial gametocytes(if present) are detected by size and removed accordingly.Reducing the problem of erythrocyte segmentation to apeak selection problem in a transformed image space, thenext stage identifies the positions of individual erythro-cytes by finding regional maxima with area-suppression.Finally, the derived parasite and erythrocyte maps are
overlaid and assessed concurrently to determine the para-sitemia.
The test results have shown that the proposed compari-son-based approach, by exploiting the interrelationbetween different images and color channels, has success-fully overcome most of the inherent limitations possiblyoccurring during the sample preparation and image acqui-sition phase. In conjunction with the proposed automaticmeasure for the degree of overall cell overlap, an objectiveassessment of smear quality as well as excepted accuracyfor further sample analysis, i.e. parasitemia, was provided.
The benefits of the described study are twofold. Firstly, itwas shown that a model-based approach with relaxedparameterization can accommodate for the variety ofoccurring cases in nature while at the same time it canguarantee a level of accuracy comparable to humancounts. In particular, this study differs from previous workin terms of accepted sample variety. Secondly, the devel-opment of a robust approach based on image processing
Table 2: Analysis of the segmentation performance
Image Precision P Recall R F
2(a) 97.22% 93.58% 95.37%2(b) 99.05% 96.30% 97.66%2(c) 94.98% 99.52% 97.20%2(d) 93.71% 90.71% 92.19%2(e) 95.60% 86.14% 90.62%2(f) 97.76% 80.12% 88.07%2(g) 96.46% 91.42% 93.87%2(h) 87.50% 99.17% 92.97%2(i) 96.95% 97.22% 97.08%
Scatter plot of segmentation performance against overlapping degree sample figure titleFigure 5Scatter plot of segmentation performance against overlapping degree sample figure title.
0.6
0.7
0.8
0.9
1.0
0.4 0.5 0.6 0.7 0.8 0.9 1.0Degree of overlap
F-m
easu
re
Image 2(a)Image 2(d)Image 2(f)Image 2(i)
0.6
0.7
0.8
0.9
1.0
0.4 0.5 0.6 0.7 0.8 0.9 1.0Degree of overlap
F-m
easu
re
Image 2(a)Image 2(d)Image 2(f)Image 2(i)
Image 2(a)Image 2(d)Image 2(f)Image 2(i)
Page 8 of 12(page number not for citation purposes)
BMC Cell Biology 2008, 9:15 http://www.biomedcentral.com/1471-2121/9/15
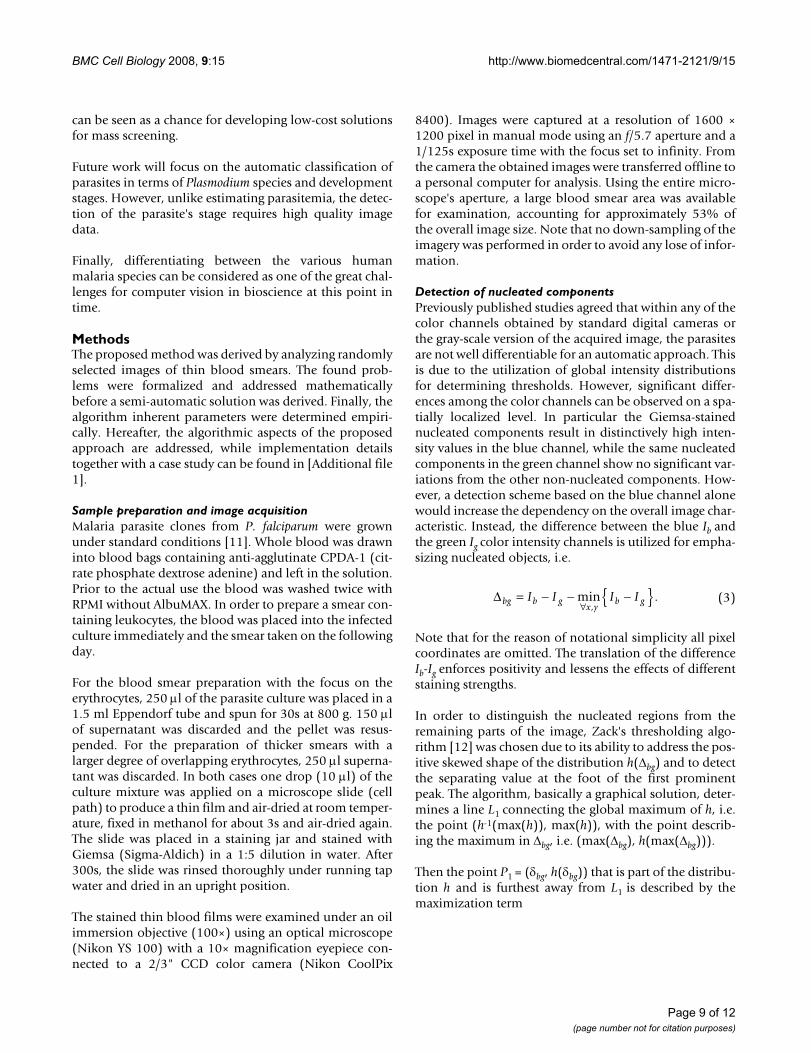
can be seen as a chance for developing low-cost solutionsfor mass screening.
Future work will focus on the automatic classification ofparasites in terms of Plasmodium species and developmentstages. However, unlike estimating parasitemia, the detec-tion of the parasite's stage requires high quality imagedata.
Finally, differentiating between the various humanmalaria species can be considered as one of the great chal-lenges for computer vision in bioscience at this point intime.
MethodsThe proposed method was derived by analyzing randomlyselected images of thin blood smears. The found prob-lems were formalized and addressed mathematicallybefore a semi-automatic solution was derived. Finally, thealgorithm inherent parameters were determined empiri-cally. Hereafter, the algorithmic aspects of the proposedapproach are addressed, while implementation detailstogether with a case study can be found in [Additional file1].
Sample preparation and image acquisitionMalaria parasite clones from P. falciparum were grownunder standard conditions [11]. Whole blood was drawninto blood bags containing anti-agglutinate CPDA-1 (cit-rate phosphate dextrose adenine) and left in the solution.Prior to the actual use the blood was washed twice withRPMI without AlbuMAX. In order to prepare a smear con-taining leukocytes, the blood was placed into the infectedculture immediately and the smear taken on the followingday.
For the blood smear preparation with the focus on theerythrocytes, 250 μl of the parasite culture was placed in a1.5 ml Eppendorf tube and spun for 30s at 800 g. 150 μlof supernatant was discarded and the pellet was resus-pended. For the preparation of thicker smears with alarger degree of overlapping erythrocytes, 250 μl superna-tant was discarded. In both cases one drop (10 μl) of theculture mixture was applied on a microscope slide (cellpath) to produce a thin film and air-dried at room temper-ature, fixed in methanol for about 3s and air-dried again.The slide was placed in a staining jar and stained withGiemsa (Sigma-Aldich) in a 1:5 dilution in water. After300s, the slide was rinsed thoroughly under running tapwater and dried in an upright position.
The stained thin blood films were examined under an oilimmersion objective (100×) using an optical microscope(Nikon YS 100) with a 10× magnification eyepiece con-nected to a 2/3" CCD color camera (Nikon CoolPix
8400). Images were captured at a resolution of 1600 ×1200 pixel in manual mode using an f/5.7 aperture and a1/125s exposure time with the focus set to infinity. Fromthe camera the obtained images were transferred offline toa personal computer for analysis. Using the entire micro-scope's aperture, a large blood smear area was availablefor examination, accounting for approximately 53% ofthe overall image size. Note that no down-sampling of theimagery was performed in order to avoid any lose of infor-mation.
Detection of nucleated componentsPreviously published studies agreed that within any of thecolor channels obtained by standard digital cameras orthe gray-scale version of the acquired image, the parasitesare not well differentiable for an automatic approach. Thisis due to the utilization of global intensity distributionsfor determining thresholds. However, significant differ-ences among the color channels can be observed on a spa-tially localized level. In particular the Giemsa-stainednucleated components result in distinctively high inten-sity values in the blue channel, while the same nucleatedcomponents in the green channel show no significant var-iations from the other non-nucleated components. How-ever, a detection scheme based on the blue channel alonewould increase the dependency on the overall image char-acteristic. Instead, the difference between the blue Ib andthe green Ig color intensity channels is utilized for empha-sizing nucleated objects, i.e.
Note that for the reason of notational simplicity all pixelcoordinates are omitted. The translation of the differenceIb-Ig enforces positivity and lessens the effects of differentstaining strengths.
In order to distinguish the nucleated regions from theremaining parts of the image, Zack's thresholding algo-rithm [12] was chosen due to its ability to address the pos-itive skewed shape of the distribution h(Δbg) and to detectthe separating value at the foot of the first prominentpeak. The algorithm, basically a graphical solution, deter-mines a line L1 connecting the global maximum of h, i.e.the point (h-1(max(h)), max(h)), with the point describ-ing the maximum in Δbg, i.e. (max(Δbg), h(max(Δbg))).
Then the point P1 = (δbg, h(δbg)) that is part of the distribu-tion h and is furthest away from L1 is described by themaximization term
Δbg b gx y
b gI I I I= − − −{ }∀min .
,(3)
Page 9 of 12(page number not for citation purposes)

BMC Cell Biology 2008, 9:15 http://www.biomedcentral.com/1471-2121/9/15
where the variables a, b and c are the coefficients of theimplicit line equation of L1 with ax + by + c = 0 using a =max(h) - h(max(Δbg)), b = max(Δbg) - h-1(max(h)), and c =h-1(max(h))·h(max(Δbg)) - max(Δbg)·max(h).
Eventually, the threshold τ1 is derived by adjusting the x-value of P1 positively by 10% of the distribution's range inorder to avoid considering regions that do not undeniablycoincide with the observation of strong differencesbetween the blue and green channel. The correspondingnucleated candidate mask MN is described by threshold-ing the difference image Δbg with τ1 and consecutive mor-phological opening
where s is a disk-shaped structuring element with radius rs= 2 (smallest possible radius that does not introduce sub-pixel position shifts). The latter operation effectivelyremoves the thresholding-typical pixel noise and imposesa minimal size constraint on the nucleated components inorder to be considered as relevant.
However, for cases where nucleated components areabsent, the above computation fails. Therefore, a valida-tion test is performed on the distribution beforehandbased on the observation that nucleated regions are asso-ciated with significant difference values in Δbg. In particu-lar, the larger the values of Δbg are, the more likely thesample contains nucleated components. Through experi-mental evaluation of the 225 blood smear images, it wasfound that nucleated regions are present in images wherethe skewness γ of Δbg, i.e. the third standardized momentof the distribution, is less than a pre-determined thresholdζ:
The variables μ3 and σ are the third moment about themean and the standard deviation of Δbg, respectively.Empirically, it was determined that ζ = 1.2 leads to stableresults. However, the case of nucleate-free samples in areal-world scenario is fairly unlikely and, hence, the exactvalue of ζ is relatively uncritical.
An actual example for the detection of nucleated compo-nents is given in [Additional file 2].
Image decompositionThis processing stage operates on the gray-level version Iof the image sample's color channels Ir, Ig and Ib, i.e.
and separates the background from objects of interest –the solid components in general and the erythrocytes inparticular. Although the choice of using only the gray-scale representation appears as disregarding availableinformation, the observation that chromatic characteris-tics of cells and parasites may change from one experi-ment to another, depending on the lifetime andpreparation of the smears, disqualifies the use of individ-ual color channels.
In this paper a straightforward but very accurate approachis used that has no disadvantage if incorporated in anautomatic image acquisition approach. In particular, animage of an empty slide is taken under the same micro-scope and camera settings as for the imaging of a bloodsmear. Afterwards, the gray-scale version I0 of the refer-ence image is smoothed by an energy-normalized averag-ing filter hμ with the support of 11 × 11 pixel in order toreduce the effects of pixel noise. With the two images cap-tured under the same conditions, their differences are freefrom any non-uniform illumination characteristicsimposed by the microscope. In addition, possible con-taminations in the optical path have less disturbing influ-ence. Hence, the compensated image Δ is expressed as
Δ = max{ - (I0 � hμ), 0}, (8)
where the operator � denotes convolution. The maxi-mum operation is used to avoid negative pixel values.
The histogram h(Δ) of the compensated image Δ possessesa bimodal distribution. The particularly high peak in thelow range represents background pixels, which are domi-nant in terms of their numbers in a typical microscopicblood sample image. The positively skewed secondarypeak of lesser height represents solid matters. Since thoseappear darker in the smear image, they yield greater differ-ences from their corresponding counterparts in the emptyreference image.
The optimal separation value between the intensity valuesof the background and solid matters lies between the twopeaks at the foot of the first peak. Although the distribu-tion is bimodal, commonly used thresholding techniqueslike Otsu's approach [13] do not provide satisfactoryresults, since a normal distribution of the two respectivepeaks cannot be ascertained. However, as mentioned ear-lier, Zack's algorithm is suitable to determine a threshold
max ,a bg bh bg c
a b
δ δ+ ( )+
+
⎧⎨⎪
⎩⎪
⎫⎬⎪
⎭⎪2 2
(4)
M sNbg=
>⎧⎨⎩
⎫⎬⎭
1
01Δ τ
otherwise, (5)
γ μσ
ζ= ≤33
. (6)
IIr I g Ib− =
+ +3
(7)
Page 10 of 12(page number not for citation purposes)
BMC Cell Biology 2008, 9:15 http://www.biomedcentral.com/1471-2121/9/15
for highly skewed distribution with extremely high peakvalues. In order to correctly determine a separation valuewhich lies in-between the two peaks, Zack's thresholdingalgorithm is applied twice – firstly to separate the twopeaks from larger difference values and, secondly, to sep-arate the two peaks. Equivalently to Equation (5) themask that described the solid matters in the smear imageis described by
Over-exposure of the smear can possibly lead to the effectthat the erythrocytes' centers appear transparent due tothe cells' droplet shape and the limited light absorption inthe corresponding regions. Hence, a final post-processingstage in the image decomposition detects the apparentholes based on the Euler number of the individual com-ponents classified as solid matters. Eventually, holes arefilled after evaluating that their size and shape conformsto the expectation of an over-exposed erythrocyte.
The image decomposition is illustrated with an examplein [Additional file 3] showing the compensation of illu-mination differences, threshold determination and mor-phological enhancement.
Erythrocyte size estimationPrior to localizing individual erythrocytes, knowledge oftheir average size is required. This can be deduced eitherfrom the known actual size of erythrocytes consideringthe magnification of the microscope, estimated throughgranulometry [2,5], or retrieved through guided userinteraction. This study favors the latter approach due to itsreliability. During the user interaction a predefinednumber of single (isolated) cells have to be marked. After-wards the size range of the selected erythrocytes is deter-mined based on a 95% confidence interval.
Identification of leukocytes and malarial gametocytesIn most real-world cases, blood samples contain further,although more infrequently occurring components otherthan erythrocytes. Hence, the presence of those compo-nents in the smear image may affect the segmentationaccuracy and has to be addressed in an intermediate stepthat isolates solid matters, before the actual erythrocytesegmentation takes place.
The most frequently observed components are leukocytesand malarial gametocytes. Both of these nucleated com-ponents are stained by the Giemsa solution during thepreparation stage, however, they are larger in size than theerythrocytes. Therefore, in order to locate these compo-nents in the image, the previously determined nucleated
region mask MN is considered and regions identified,which satisfy the condition
A(Ri) ≥ μ(A(Ei, ∀i)) + 2σ(A(Ei, ∀i)), (10)
where A(Ri) denotes the area of a region Ri. The two termsμ(A(Ei), ∀i) and σ(A(Ei), ∀i) describe the mean and stand-ard deviation over the areas of single erythrocytes in theimage, respectively.
Segmentation of erythrocytesFirstly, all single erythrocytes are located based on theobtained erythrocyte area range. Then the Euclidean dis-tance transform is applied to each pixel (x0, y0) of an iden-tified single erythrocyte Ei (including those previouslyselected manually by the user) and the cell specific maxi-mum value
is recorded with MS(x0, y0) = 1 and MS(x, y) = 0. Thisapproach provides a more flexible support of shape varia-tions than granulometry and does not require the erythro-cytes to be circular.
The further analysis is left with clusters of erythrocytes, i.e.cells clumped together, overlapping or touching eachother. Similar to Pinzón et al. [9], this study reduces theproblem of erythrocyte segmentation to a peak selectionproblem. However, instead of carrying out the segmenta-tion by locating circular objects in the Hough space, theEuclidean distance transform of each binary cluster isused. Then potential positions of individual erythrocyteswithin a cluster are detected by iteratively locating localmaxima in the transform's result.
In order to discretize the cluster into separate cells, aregional maximum suppression filter is used within theproximity of detected maxima, effectively restraining fur-ther irrelevant maxima in the vicinity. The size of the sup-pression filter is determined by the estimated cell size. Theiterative detection process is repeated as long as detectedmaxima exceed the threshold value of τ3 = μ(di) - e1/
2·σ(di), i.e. the lower end of the 90% confidence intervalof the peak values for the single erythrocytes recorded pre-viously.
A graphical summary of the described process is providedin [Additional file 4].
Parasitemia estimationThe actual parasitemia estimation for the separately occur-ring erythrocytes can be accomplished straightforwardly
M sSI=
>⎧⎨⎩
⎫⎬⎭
−1
02Δ τ
otherwise. (9)
d x x y yix y E x yi
= −( ) + −( ){ }⎧⎨⎩
⎫⎬⎭∀( )∈ ∀( )
max min, ,0 0
02
02
(11)
Page 11 of 12(page number not for citation purposes)

BMC Cell Biology 2008, 9:15 http://www.biomedcentral.com/1471-2121/9/15
by overlaying the binary masks of the identified parasitesMN and erythrocytes MS. However, this does not apply forerythrocytes that are part of a cluster due to the constraintthat a parasite can only be hosted by one erythrocyte. Anexample is given in [Additional file 5]. Hence, an algo-rithm was derived for the examination of infectionswithin erythrocyte clusters, which iterates through the listEi of erythrocytes located by the peak selection in the pre-vious section. Accordingly, a cell is deemed to be infectedif, firstly, its covered image region was not alreadyassessed and, secondly, the area of its binary conjunctionwith the parasite mask MN exceeds a predefined threshold.
Authors' contributionsTRB and PRP conceived the study. MTL and TRB designedthe approach and performed the computational analysis.MTL carried out the implementation. CK prepared thesamples and collected the data together with MTL. TRB,MTL and CK contributed analyzing experimental studies.MTL, TRB, CK and PRP wrote the manuscript.
Additional material
AcknowledgementsThis work was supported by the Academic Research Fund Grant (RG 48/06 and MLC3/03), Ministry of Education, Singapore. The authors would like to acknowledge the support and feedback from N.E. Ross, University of Cambridge, United Kingdom and J.D. García-Arteaga, Czech Technical Uni-versity, Czech Republic.
References1. Hecht B, Bielefeldt H, Inouye Y, Pohl DW, Novotny L: Facts and
artifacts in near-field optical microscopy. Journal of Applied Phys-ics 1997, 81(6):2492-2498.
2. Di Ruberto C, Dempster A, Khan S, Jarra B: Analysis of infectedblood cell images using morphological operators. Image andVision Computing 2002, 20(2):133-146.
3. Sio SWS, Sun W, Kumar S, Bin WZ, Tan SS, Ong SH, Kikuchi H,Oshima Y, Tan KSW: MalariaCount: An image analysis-basedprogram for the accurate determination of parasitemia. Jour-nal of Microbiological Methods 2007, 68(1):11-18.
4. Theerapattanakul J, Plodpai J, Pintavirooj C: An efficient methodfor segmentation step of automated white blood cell classifi-cation. Proceedings of the IEEE TENCON 2004:191-194.
5. Ross NE, Pritchard CJ, Rubin DM, Duse AG: Automated imageprocessing method for the diagnosis and classification ofmalaria on thin blood smears. Medical & Biological Engineering andComputing 2006, 44(5):427-436.
6. Wermser D, Haussmann G, Liedke CE: Segmentation of bloodsmears by hierarchical thresholding. Computer Vision, Graphics,and Image Processing 1984, 25(2):151-168.
7. Won CS, Nam JY, Choe Y: Extraction of leukocyte in a cellimage with touching red blood cells. Proceedings of the SPIE Con-ference on Image Processing 2005:399-406.
8. Halim S, Bretschneider T, Li Y, Preiser P, Kuss C: Estimatingmalaria parasitemia from blood smear images. Proceedings ofthe IEEE International Conference on Control, Automation, Robotics andVision 2006:648-653.
9. Pinzón R, Garavito G, Hata Y, Arteaga L, García JD: Developmentof an automatic counting system for blood smears (in Span-ish). Proceedings of the Congress of the Spanish Biomedical EngineeringSociety 2004:45-49.
10. Soille P: Morphological Image Analysis: Principles and Applications 2nd edi-tion. Springer-Verlag, Berlin Heidelberg New York; 2003.
11. Trager W, Jensen JB: Human malaria parasites in continuousculture. Science 1976, 193:673-675.
12. Zack GW, Rogers WE, Latt SA: Automatic measurement of sis-ter chromatid exchange frequency. Journal of Histochemistry andCytochemistry 1977, 25(7):741-753.
13. Otsu N: A threshold selection method from gray level histo-grams. IEEE Transactions on Systems, Man and Cybernetics 1979,9(1):62-66.
Additional file 1Discussion of implementation details with case study. The text illustrates the required processing steps for the semi-automatic approach and pro-vides details based on selected case studies.Click here for file[http://www.biomedcentral.com/content/supplementary/1471-2121-9-15-S1.doc]
Additional file 2Detection of nucleated components. The illustration depicts the process of detecting nucleated components which comprises the comparison of the different color channels with consecutive thresholding.Click here for file[http://www.biomedcentral.com/content/supplementary/1471-2121-9-15-S2.doc]
Additional file 3Image decomposition. The illustration addresses the image decomposition in background and solid matter based on the compensation of illumina-tion differences and repetitive thresholding.Click here for file[http://www.biomedcentral.com/content/supplementary/1471-2121-9-15-S3.doc]
Additional file 4Segmentation process. The illustration visually describes the segmentation of clusters of erythrocytes into individual erythrocytes.Click here for file[http://www.biomedcentral.com/content/supplementary/1471-2121-9-15-S4.doc]
Additional file 5Assignment of parasites to erythrocytes. The illustration provides examples for infections in detected erythrocyte clusters and addresses the association of a parasite to the correct host cell.Click here for file[http://www.biomedcentral.com/content/supplementary/1471-2121-9-15-S5.doc]
Page 12 of 12(page number not for citation purposes)