
A novel model for business process maturity assessment through combining maturity models with EFQM...
18
Int. J. Business Process Integration and Management, Vol. 6, No. 2, 2013 167 Copyright © 2013 Inderscience Enterprises Ltd. A novel model for business process maturity assessment through combining maturity models with EFQM and ISO 9004:2009 Mohsen Moradi-Moghadam* and Hossein Safari Faculty of Management, University of Tehran, Nasr Bridge, 6311-14155 Tehran, Iran E-mail: [email protected] E-mail: [email protected] *Corresponding author Meysam Maleki UNIDEMI, Mechanical and Industrial Engineering Department, Faculty of Science and Technology, Universidade Nova de Lisboa, 2829-516 Caparica, Portugal E-mail: [email protected] Abstract: The importance of business process management is pointed out in extensive literature. As its realisation is less straightforward, maturity models have been developed to gradually assess and improve business processes. However, the proliferation of maturity models confuses organisations. They have no overview of existing models and their differences, which makes an informed choice difficult. This paper presents a novel framework for assessing process maturity. This framework compares maturity models with the process audit of Michael Hammer. In order to develop the process audit, EFQM and ISO 9004:2009 are suggested; thereafter, criteria are graded by RADAR. Practitioners may benefit from the proposed framework to plan and execute process-based transformations. Keywords: process management; process implementation; business process maturity models; BPMMs. Reference to this paper should be made as follows: Moradi-Moghadam, M., Safari, H. and Maleki, M. (2013) ‘A novel model for business process maturity assessment through combining maturity models with EFQM and ISO 9004:2009’, Int. J. Business Process Integration and Management, Vol. 6, No. 2, pp.167–184. Biographical notes: Mohsen Moradi-Moghadam received his MSc in Industrial Management from the Faculty of Management, University of Tehran, Iran. His research interests are: business process maturity models, organisational processes, management systems, business process management and quality. Hossein Safari received his PhD in Industrial Management from the University of Tehran, Iran. He is an Associate Professor at the University of Tehran. He is an expert in research performance evaluation, strategic planning, implementation of EFQM and ISO standards, and research methodologies. Meysam Maleki received his MSc of Production Engineering from Chalmers University of Technology, Sweden. He is currently a PhD candidate and Researcher in UNIDEMI: R&D Unit in Mechanical and Industrial Engineering, which is a research centre at the Faculty of Science and Technology, Universidade Nova de Lisboa, Portugal.
Transcript of A novel model for business process maturity assessment through combining maturity models with EFQM...

Int. J. Business Process Integration and Management, Vol. 6, No. 2, 2013 167
Copyright © 2013 Inderscience Enterprises Ltd.
A novel model for business process maturity assessment through combining maturity models with EFQM and ISO 9004:2009
Mohsen Moradi-Moghadam* and Hossein Safari Faculty of Management, University of Tehran, Nasr Bridge, 6311-14155 Tehran, Iran E-mail: [email protected] E-mail: [email protected] *Corresponding author
Meysam Maleki UNIDEMI, Mechanical and Industrial Engineering Department, Faculty of Science and Technology, Universidade Nova de Lisboa, 2829-516 Caparica, Portugal E-mail: [email protected]
Abstract: The importance of business process management is pointed out in extensive literature. As its realisation is less straightforward, maturity models have been developed to gradually assess and improve business processes. However, the proliferation of maturity models confuses organisations. They have no overview of existing models and their differences, which makes an informed choice difficult. This paper presents a novel framework for assessing process maturity. This framework compares maturity models with the process audit of Michael Hammer. In order to develop the process audit, EFQM and ISO 9004:2009 are suggested; thereafter, criteria are graded by RADAR. Practitioners may benefit from the proposed framework to plan and execute process-based transformations.
Keywords: process management; process implementation; business process maturity models; BPMMs.
Reference to this paper should be made as follows: Moradi-Moghadam, M., Safari, H. and Maleki, M. (2013) ‘A novel model for business process maturity assessment through combining maturity models with EFQM and ISO 9004:2009’, Int. J. Business Process Integration and Management, Vol. 6, No. 2, pp.167–184.
Biographical notes: Mohsen Moradi-Moghadam received his MSc in Industrial Management from the Faculty of Management, University of Tehran, Iran. His research interests are: business process maturity models, organisational processes, management systems, business process management and quality.
Hossein Safari received his PhD in Industrial Management from the University of Tehran, Iran. He is an Associate Professor at the University of Tehran. He is an expert in research performance evaluation, strategic planning, implementation of EFQM and ISO standards, and research methodologies.
Meysam Maleki received his MSc of Production Engineering from Chalmers University of Technology, Sweden. He is currently a PhD candidate and Researcher in UNIDEMI: R&D Unit in Mechanical and Industrial Engineering, which is a research centre at the Faculty of Science and Technology, Universidade Nova de Lisboa, Portugal.
168 M. Moradi-Moghadam et al.
1 Introduction
Today’s globalised market is characterised by demanding customers and growing IT possibilities. Organisations are therefore increasingly relying on their way of working, i.e., business processes, to excel (Harrington, 2006; Vom Brocke and Rosemann, 2010). However, merely modelling and deploying a business process does not imply that your business process is also an excellent one, or at least a good one. Therefore, the notion of ‘maturity’ is introduced as a measure to indicate how excellent business processes can perform (Harrington, 2006; Maier et al., 2008). Maturity requires continuous process improvements, which are not easy to realise. Hence, business process maturity models (BPMM) have been designed from which organisations gradually benefit. In general, a maturity model (MM) is a tool to systematically assess and improve capabilities, i.e., abilities or competences, to reach a goal. Translated to BPMM, it concerns the capabilities of business processes and their organisations to reach business (process) excellence. BPMM can be represented as a combination of coverage and skills (proficiency), and therefore it can be said that it is actually a combination of effectiveness and efficiency. With the help of the BPMM, companies should be able to analyse the strengths and the weaknesses of their current business and develop ‘to-be’ models to achieve the organisation’s business objectives. Moreover, BPMM should guide companies to achieve business objectives by executing the practices of the model.
The basic concept underlying maturity is that mature organisations do things systematically while immature organisations achieve their outcomes as a result of heroic efforts of individuals using approaches that they create more or less spontaneously. Models related to quality such as ISO, total quality management (TQM), and excellence models are unknown for organisation performance assessment. ISO standard provides guidance to support the achievement of success for any organisation in a complex, demanding, and ever-changing environment, by a quality management approach. Sustained success can be achieved by the effective management of the organisation. This standard promotes self-assessment as an important tool for the review of the maturity level of the organisation, covering its strategy, management system, and processes, to identity areas of strength and weakness and opportunities for either improvements, or innovation, or both. EFQM model have eight of fundamental concepts for excellence organisations. One of these concepts is managing by processes. Excellent organisations are managed through structured and strategically aligned processes using fact-based decision making to create balanced and sustained results. In the current paper we extract indexes related to process maturity through comparing MMs, EFQM, and ISO 9004:2009. After preparing table of indexes, an auditing organisations approach is developed to determine the current status of the business process efforts. Mature organisations achieve the precise goals they commit to achieve. Immature organisations often achieve some, but not all, of their goals. Mature organisations have systematic
processes and documented ways of doing things. MMs are used the base of assessment and comparison due to improvement and they are a good approach for increasing capabilities in organisations. Process maturity models (PMMs) are tools that help to organisation for implementing business process management. We evaluate the maturity of a business process by result, approach, development, assessment and refinement (RADAR). With this ruler, we can seek embedding of refinements over time, deploy with a flexibility to manage changes in environment and re-deploy if needed, measure both ‘efficiency’ and ‘effectiveness’ and use creativity to generate new/changed approaches and evaluate, priorities and use the outcomes for enablers of EFQM, after that we apply this ruler for results of EFQM.
The PMMs are conceptual models which compare the maturity of organisation current practices against an industry standard. It helps the organisation set priorities for improving its product/service operations using a proven strategy and developing the capability required to execute its business strategy. Through a BPMM, an organisation can efficiently and effectively manage its business processes while trying to achieve and realise its business objectives and values. This paper structured as follows: Section 2 provides an overview of the related literature on BPMMs and a problem statement that outlines the intent of current and proposed research. Section 3 compares different MMs in terms of their criteria and indexes of process maturity and business process management maturity to identify the most important and most used models. After mining the factors and parameters influencing the maturity of business processes, the suitable approach to measure and assess the ruler is introduced in Section 4. Thereafter we conclude in Section 5.
2 Literature review
Key literature on the concept of business process management suggests both that organisations can enhance their overall performance by adopting a process view of business and that business-process orientation (BPO) has a positive impact on business performance (Aysar and Johnson, 2003; Davenport, 1993; Harmon, 2003).
Attention to processes has increased as thousands of organisations have already adopted process-focused programmes such as ISO 9001 and TQM (Benner and Veloso, 2008). The core idea behind ‘process management’ principle of TQM is that organisations are sets of interlinked processes, and that improvement of these processes is the foundation of performance improvement (Lam et al., 2008). Process orientation has also been embodied in the European Foundation for Quality Management (EFQM) and the Malcolm Baldrige National Quality Award (MBNQA) models for business excellence (Lee and Dale, 1998). According to Sharma and Kodali (2008) process management as an element of total quality excellence has been supported by the majority of the award-based frameworks as well as research/academic-based frameworks. Hoang et al. (2006) also stated that process

A novel model for business process maturity assessment through combining maturity models 169
management along with information and analysis and strategic planning are considered as mechanistic elements of TQM.
The EFQM was founded in 1988 and is committed to promoting quality as the fundamental process for continuous improvement within a business. It is dedicated to stimulating and assisting management in applying innovative principles of TQM suited to the European environment. Its aim is to improve the competitiveness of European private and public sector organisations. Over 10,000 firms in the private and public sector all over Europe now incorporate the EFQM Excellence Model in their overall corporate management process. In 1999, 60% of the top 25 companies in Europe (and 30% of the top 100) were members of the EFQM.
This pattern is pervasive and non-prescriptive framework that has three main components can be:
a fundamental concepts: eight items
b model criteria: five enablers and four results
c RADAR logic: the four elements.
The advocated advantages are established. The scoring process is demonstrated using the EFQM RADAR. Further original work is presented by the author on the scoring model to include the RADAR pentagonal scoring profile. This provides a simplistic, yet effective, method of communicating the self evaluation data to senior management for benchmarking purposes. The RADAR pentagonal profile has been endorsed by the EFQM. A generic implementation model for EFQM within surveying organisations is incorporated (Figure 1).
The BPMM describes an evolutionary improvement path that guides organisations as they move from immature, inconsistent business activities to mature, disciplined processes. The BPMM orders these stages so that improvements at each stage provide a foundation on which to build improvements undertaken at the next stage. Thus, an improvement strategy drawn from the BPMM provides a roadmap for continuous process improvement. It helps identify process deficiencies in the organisation and guides the improvements in logical, incremental steps.
Among the business process models that were proposed in the past, the PMM presented by Curtis and Alden (2006) is the only comprehensive model due to the fact that Curtis coined well defined and verified capability maturity model integration (CMMI) concepts and introduced them into the field of business process studies. His model was originally developed to assess the maturity of software development processes. Over the years it was extended to other domains as well. The successor to Curtis model is the CMMI which aimed to improve the usability of MMs by integrating different models into one framework (Ahern et al., 2004; Chrissis et al., 2006; Hofmann et al., 2007).
There are several researches on business process maturity (Curtis and Alden, 2006; Fisher, 2004; Harmon, 2004); however, it has not been defined and standardised
well enough to be applied to an organisation’s business process in order to improve its performance.
BPMM enable managers to describe current state of an enterprise, from the process maturity perspective with analysis of current state (as-is state) and desirable state (to-be state). According to Rosemann and Bruin (2005) the primary aims of BPMM are:
a describing current state: strengths and weaknesses
b determining describe maturity level, depending on key factors of business process management
c making business process management improvement easier, through maps, which show how desired state can be reached.
In recent years a number of BPMMs have been proposed (Fisher, 2004; Hammer, 2007; McCormack et al., 2009; Rohloff, 2010). Most models focus only on one dimension of measuring Business Process Maturity and very few applied studies are known. Rosemann and Bruin (2005) developed a model, which observes strategic business process management through holistic enterprise management. This model is known under the name of business process management MM. In the heart of this model there are five factors, critical for successful implementation of process management. A similar model, called BPMM, appeared in 2006th year, and was promoted by Curtis, Weber and Gardiner. Hammer (2007) also accepts the phase approach to process management, and emphasises that all the previous stages must be fully completed before the move to the next phase (to the higher level of maturity). Hammer’s model clearly highlights the difference between process maturity and the enterprise maturity (business process management maturity). In order to analyse process’s performance, the model takes into account the maturity of five drivers, and they are: design (purpose, context and documentation), performers – implementers (knowledge, skills, and behaviour of employees during the process realisation), owner (identity, activity and authority), infrastructure (information systems and human resources) and measures (definition and use). When it comes to enterprise’s maturity, hammer emphasises four skills, and they are: leadership (awareness, commitment, style, and behaviour), culture (team work, focus on customers, responsibility and integration). However, the models proposed by Curtis and Hammer are based on the Rosemann and Burin model, and very similar.
Translated towards business processes, BPMM are evolutionary models for measuring (AS-IS) and improving (TO-BE) maturity, or the extent to which an organisation consistently implements processes within a defined scope that contributes to the achievement of its business goals. Mature business processes acquire the necessary capabilities to reach excellence. Capabilities are competencies (e.g., skills and knowledge) to achieve the targeted results, i.e., the ability to perform, or the expected performance of a business process. Related capabilities are collected into

170 M. Moradi-Moghadam et al.
capability areas together. Sometimes, capability levels are present to indicate the growth through each capability area separately (Hammer, 2007; McCormack, 2007).
In order to provide a proposed model for Iranian organisations in the field of early MMs have been proposed
since 2004, were studied such as Hammer (2007), McCormack et al. (2009), Rohloff (2010), Andjelković (2004), Burlton (2001) and Rosemann et al. (2006). In addition, the models that are described below were also part of the process model, EFQM and ISO 9004:2009 standards.
Figure 1 The relationship between these three components
Table 1 Advantages and disadvantages of models in the first stage
Model Advantage Disadvantage
The maturation process of the separation factor matrix Factors are generally classified Appropriate stage of maturity No clearly defined procedures in every stage of
implementation in organisations
Fisher
Usable in all organisations Two-dimensional and lack the scope
Clarify on determined actions of the segregation factors Factors are generally classified Appropriate stages of maturity Actions separation factor is determined Three-dimensional nature and the scope
Rosemann, Bruin, power
Usable in all organisations Classification factors with segregation process and organisation
Stages of maturity is lower than the other models
Actions with segregation factors of maturity stage the matrix Two-dimensional and lack the scope (time and organisation)
Clarify on determined actions of the segregation factors and maturity stages
Hammer
Usable in all organisations
Clarify on determined actions of the segregation factors Factors are overall classified Usable in all organisations Actions is determined to segregation factors It have professional criteria and is covered Lack of determine maturity stages
EFQM processes
It is one-dimension and have not factor, scope Appropriate stages of maturity Factors are overall classified
Actions is determined to segregation factors Lack of clearly defined actions in every stage of implementation in organisations
Paul Harmon Usable in all organisations
It is one-dimension and have not factor ,scope
Clarify on determined actions of the segregation factors Factors are overall classified Appropriate stages of maturity Actions is determined to segregation factors Three-dimensional and have a scope It is one-dimension and have not factor, scope
Bill Curtis
Usable in all organisations

A novel model for business process maturity assessment through combining maturity models 171
3 Comparison of models
3.1 The first step comparison
Given that the basic aim of the model is discussed, some general properties of the models selected with criteria that included how the categories of business processes (separation of process maturity), how to determine the (separate invoices, process maturity), on the characteristics and actions of the maturity stage, the number of models being used in all organisations. Then the positive and negative aspects of each criterion, and determining the advantages and disadvantages of each model are summarised in Table 1.
The models of Rosemann, Bruin and Power (2006), and Michael Hammer (2007) are the two best options. Hence, the model of Michael Hammer, which has both the advantages at this point, is chosen as the base model. Other benefits can also be added to other models (Table 1).
3.2 The second step comparison
The purpose of this phase is to ensure that the choice of the base model, and the factors affecting the integrity of business processes are mature. Therefore, Table 2 shows a comparison of the models, the base model’s alignment with strategy, assessment or review, equipment and instruments, information and knowledge, as well as deployment, measurement and performance is defective (Table 2).
Table 2 Comparison of factors associated with the process parameters in various models of Hammer models
Cri
teri
a
Index EFQM ISO 9004:2009 Bruin
Rosemann, Bruin, Power
Fisher McCormack Rohloff Burlton Andjelković
Purpose 5b 2.7 Criteria 3 Criteria 3 Criteria 4 *** Criteria 2, 3,4, 5 Criteria 1 *** Content 5a 2.7 Criteria 3 Criteria 3 Criteria 4 Criteria 1 Criteria 2, 3,4, 5 Criteria 1 ***
Des
ign
Documentation 5b 2.7 Criteria 3 Criteria 3 Criteria 4 Criteria 1 Criteria 2, 3,4, 5 Criteria 1 ***
Knowledge 5c 2.7.6 Criteria 5 Criteria 5 Criteria 3 *** Criteria 6 Criteria 3 Criteria 4 Skills 5c *** Criteria 5 Criteria 5 Criteria 3 *** Criteria 6 Criteria 3 Criteria 4
Perf
orm
ers
Behaviour 5c *** Criteria 5 Criteria 5 Criteria 3 *** Criteria 6 Criteria 3 Criteria 4
Identity 5b 3.7 Criteria 5 Criteria 5 Criteria 3 Criteria 2 Criteria 6 Criteria 3 Criteria 4 Activities 5b 1.7 Criteria 5 Criteria 5 Criteria 3 Criteria 1 Criteria 6 Criteria 3 Criteria 4
Ow
ner
Authority 5b 3.7 Criteria 5 Criteria 5 Criteria 3 Criteria 2 Criteria 6 Criteria 3 Criteria 4
Information systems
*** 7.6 Criteria 4 Criteria 4 Criteria 5 Criteria 3 Criteria 8, 9 Criteria 4 Criteria 3
Infr
astru
ctur
e
Human resource systems
5c 5.6 Criteria 4 Criteria 4 Criteria 5 Criteria 3 Criteria 8, 9 Criteria 4 Criteria 3
Definition 5d 3.8 Criteria 2 Criteria 2 Criteria 2 Criteria 3 Criteria 2, 3,4, 5 *** ***
Mea
sure
men
t
Uses 5d 3.8 Criteria 2 Criteria 2 Criteria 2 Criteria 3 Criteria 2, 3,4, 5 *** ***
Table 3 Comparison of basic research (CMMI) with other models
Research model (CMMI) Paulk et al. (1993) Fisher (2004) Rosemann and Bruin (2005)
Curtis and Alden (2006) Andjelković (2007)
Initial Initial Siloed Initial Initial Initial Managed Repeatable Tactically
integrated Repeatable Managed Managed
Defined Defined Process driven Defined Standardised Defined Quantitatively managed Managed Optimised
enterprise Managed Predictable Quantitatively
managed Optimising Optimising Intelligent
operating network Optimising Optimising Optimising
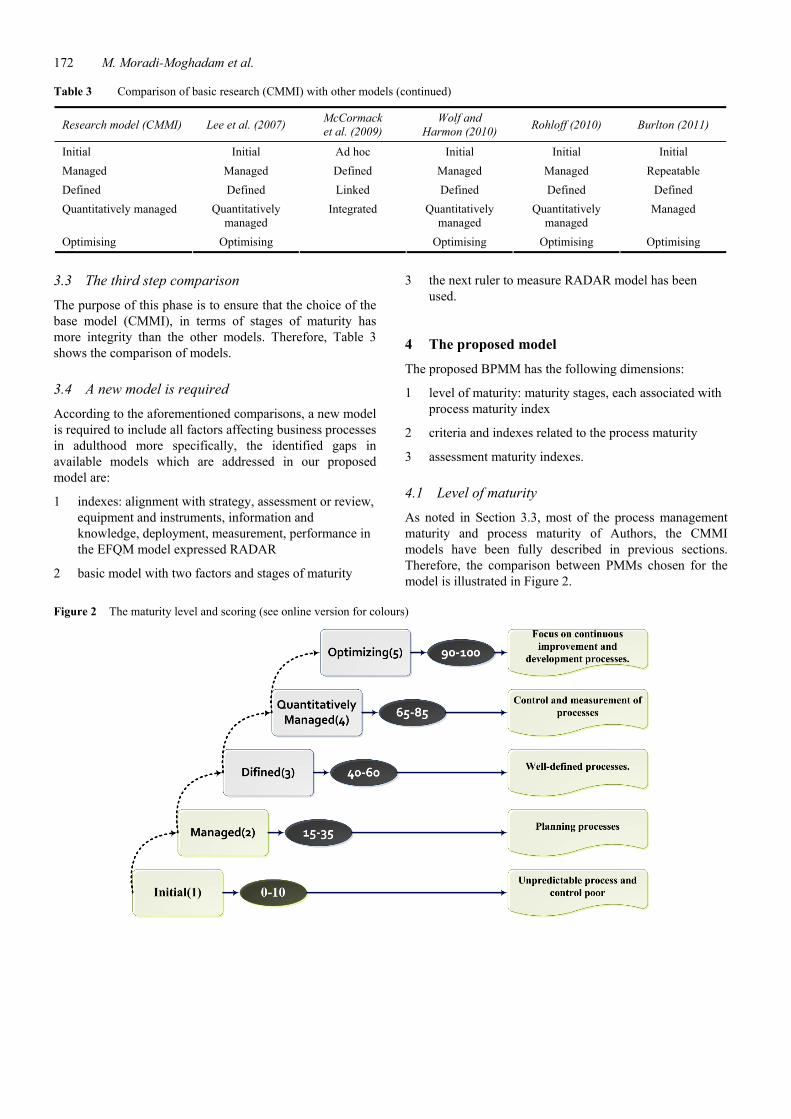
172 M. Moradi-Moghadam et al.
Table 3 Comparison of basic research (CMMI) with other models (continued)
Research model (CMMI) Lee et al. (2007) McCormack et al. (2009)
Wolf and Harmon (2010) Rohloff (2010) Burlton (2011)
Initial Initial Ad hoc Initial Initial Initial Managed Managed Defined Managed Managed Repeatable Defined Defined Linked Defined Defined Defined Quantitatively managed Quantitatively
managed Quantitatively
managed Quantitatively
managed Managed
Optimising Optimising
Integrated
Optimising Optimising Optimising
3.3 The third step comparison
The purpose of this phase is to ensure that the choice of the base model (CMMI), in terms of stages of maturity has more integrity than the other models. Therefore, Table 3 shows the comparison of models.
3.4 A new model is required
According to the aforementioned comparisons, a new model is required to include all factors affecting business processes in adulthood more specifically, the identified gaps in available models which are addressed in our proposed model are:
1 indexes: alignment with strategy, assessment or review, equipment and instruments, information and knowledge, deployment, measurement, performance in the EFQM model expressed RADAR
2 basic model with two factors and stages of maturity
3 the next ruler to measure RADAR model has been used.
4 The proposed model
The proposed BPMM has the following dimensions:
1 level of maturity: maturity stages, each associated with process maturity index
2 criteria and indexes related to the process maturity
3 assessment maturity indexes.
4.1 Level of maturity
As noted in Section 3.3, most of the process management maturity and process maturity of Authors, the CMMI models have been fully described in previous sections. Therefore, the comparison between PMMs chosen for the model is illustrated in Figure 2.
Figure 2 The maturity level and scoring (see online version for colours)
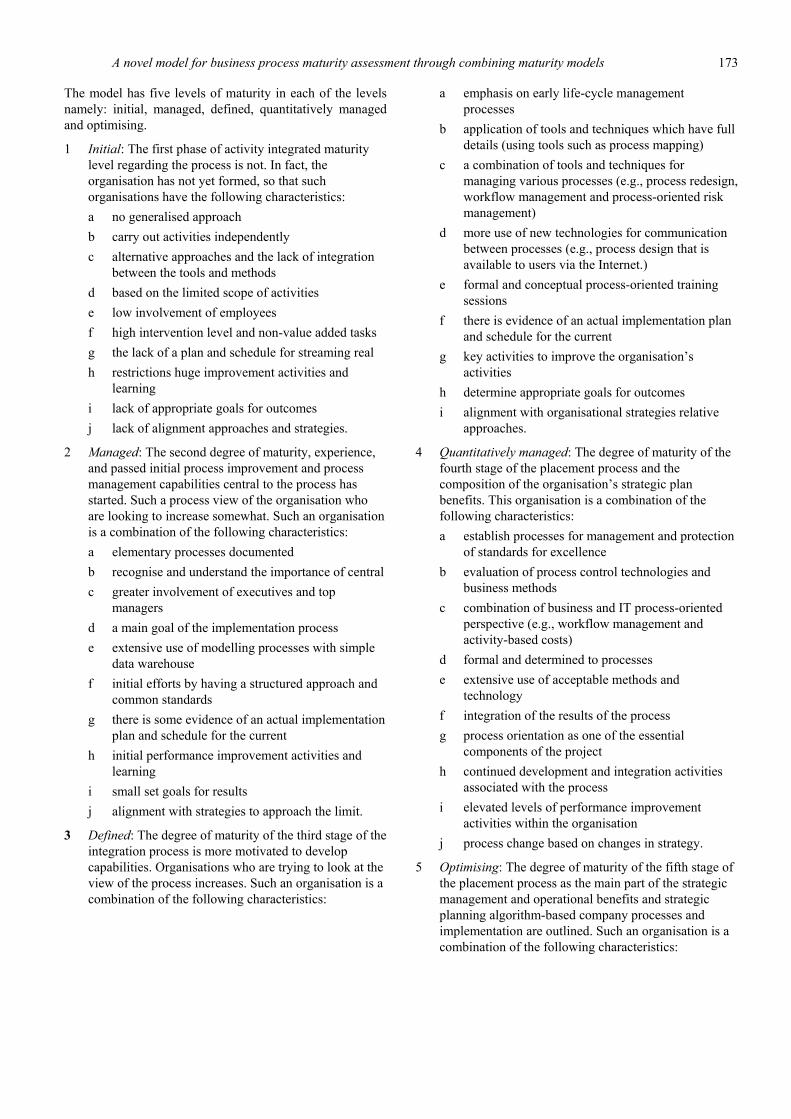
A novel model for business process maturity assessment through combining maturity models 173
The model has five levels of maturity in each of the levels namely: initial, managed, defined, quantitatively managed and optimising.
1 Initial: The first phase of activity integrated maturity level regarding the process is not. In fact, the organisation has not yet formed, so that such organisations have the following characteristics: a no generalised approach b carry out activities independently c alternative approaches and the lack of integration
between the tools and methods d based on the limited scope of activities e low involvement of employees f high intervention level and non-value added tasks g the lack of a plan and schedule for streaming real h restrictions huge improvement activities and
learning i lack of appropriate goals for outcomes j lack of alignment approaches and strategies.
2 Managed: The second degree of maturity, experience, and passed initial process improvement and process management capabilities central to the process has started. Such a process view of the organisation who are looking to increase somewhat. Such an organisation is a combination of the following characteristics: a elementary processes documented b recognise and understand the importance of central c greater involvement of executives and top
managers d a main goal of the implementation process e extensive use of modelling processes with simple
data warehouse f initial efforts by having a structured approach and
common standards g there is some evidence of an actual implementation
plan and schedule for the current h initial performance improvement activities and
learning i small set goals for results j alignment with strategies to approach the limit.
3 Defined: The degree of maturity of the third stage of the integration process is more motivated to develop capabilities. Organisations who are trying to look at the view of the process increases. Such an organisation is a combination of the following characteristics:
a emphasis on early life-cycle management processes
b application of tools and techniques which have full details (using tools such as process mapping)
c a combination of tools and techniques for managing various processes (e.g., process redesign, workflow management and process-oriented risk management)
d more use of new technologies for communication between processes (e.g., process design that is available to users via the Internet.)
e formal and conceptual process-oriented training sessions
f there is evidence of an actual implementation plan and schedule for the current
g key activities to improve the organisation’s activities
h determine appropriate goals for outcomes i alignment with organisational strategies relative
approaches.
4 Quantitatively managed: The degree of maturity of the fourth stage of the placement process and the composition of the organisation’s strategic plan benefits. This organisation is a combination of the following characteristics: a establish processes for management and protection
of standards for excellence b evaluation of process control technologies and
business methods c combination of business and IT process-oriented
perspective (e.g., workflow management and activity-based costs)
d formal and determined to processes e extensive use of acceptable methods and
technology f integration of the results of the process g process orientation as one of the essential
components of the project h continued development and integration activities
associated with the process i elevated levels of performance improvement
activities within the organisation j process change based on changes in strategy.
5 Optimising: The degree of maturity of the fifth stage of the placement process as the main part of the strategic management and operational benefits and strategic planning algorithm-based company processes and implementation are outlined. Such an organisation is a combination of the following characteristics:

174 M. Moradi-Moghadam et al.
a as part of the orientation process management activities
b acceptance and widespread use of standard technologies and methods
c process-oriented approach for the integration of the organisation, customers, suppliers, distributors and other stakeholders are
d life cycle management of business processes e management processes for excellence has been
established, the process management and business activity is part of a staff reduction is smaller
f focus on improving organisational performance g development of new processes and organisational
strategies stems h for all results, set goals and make them happen.
4.2 Criteria and indexes
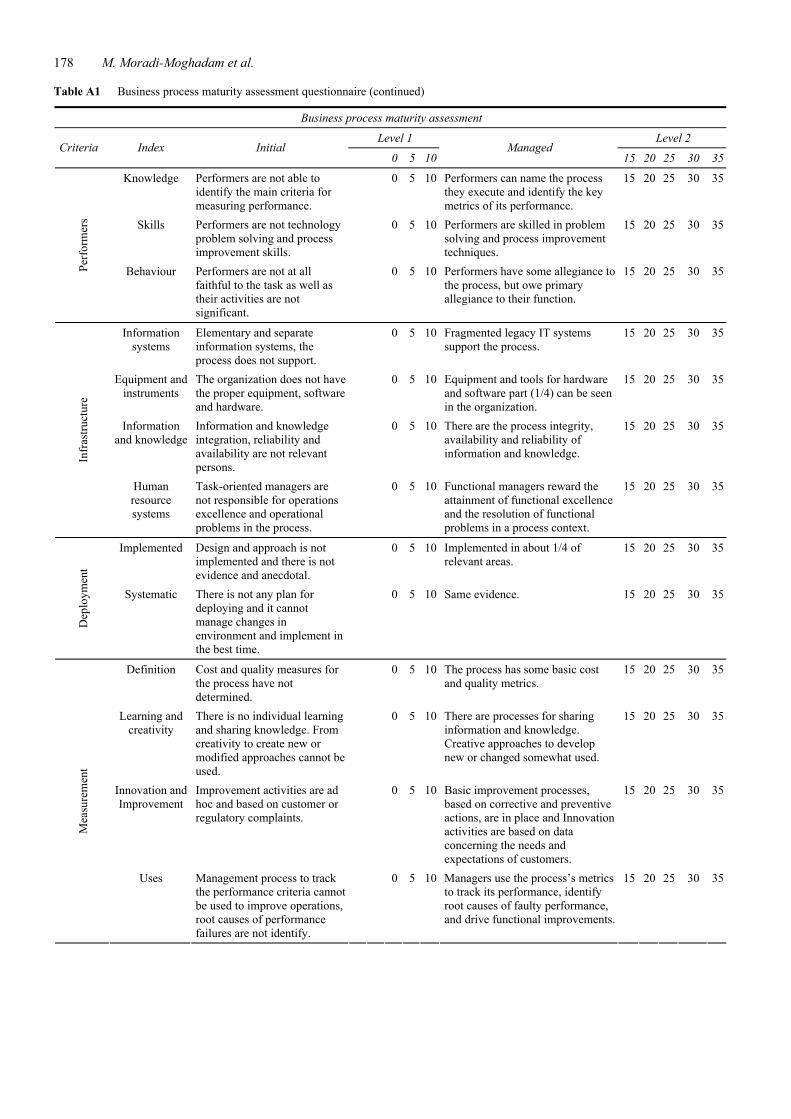
After comparing criteria and indicators to assess the maturity of processes (Table 2), the seven criteria and 25 indexes were identified and are described in the following:
1 Design: Process design should be checked. If not properly process involved does not know what to do and when to do it. The design must consider five indicators or factors: 1 purpose 2 content 3 alignment with strategy 4 assessment or review 5 documentation.
In the Hammer model to align with strategy and update or revision is not mentioned, however, that in most models and strategy papers referred to the alignment process (Rosemann and Bruin, 2005, Fisher, 2004; EFQM, 2010; ISO 9004, 2009).
2 Owner: Each process requires an ‘owner’: the senior manager’s responsibility and authority to develop and deliver the process is concluded. In the absence of such a charge, the process will take place. The factors considered are three indicators which include: 1 entity 2 activities 3 authority.
Owner must try to allocate the time and target participation of people thought to be the first member to be the highest decision-making organ identity (identify). Also, owners must work together in order to achieve integration goals, and their future together strategically to support the processes of customers and
suppliers to create (activities). In the field of authority, owner must control IT systems that support process and regulatory forces and budgets will have the choice to take control of the budget process in the future may have a direct effect on selection forces and assess their.
3 Performers: Those who are responsible for implementing the process should have the necessary skills. They should have the following three characteristics: 1 knowledge 2 skills 3 behaviour.
They have the necessary skills in teamwork; problem solving, decision-making and management have evolved.
Performers must be familiar with the concepts of traditional and new business processes and understand what impact on other processes and organisations, and also keep track of their industry developments in order to explain the impact of these changes on performance. They have the necessary skills in teamwork; problem solving, decision-making and management have evolved.
4 Infrastructure: The company should be adjusted so that the infrastructure and support for the process and not hinder its performance. In this case, they cannot implement their plans. Including infrastructure related factors can be: 1 information systems 2 equipment and instruments 3 knowledge and information 4 human resources systems.
An integrated information system taking into account the process needs to be upgraded to support the standard. However, the right tools and equipment for the proper functioning of information systems should be able to process information in order to operate properly. Also within the knowledge of information systems should be reliable, accessible, and can be integrated.
5 Deployment: After introducing the factors associated with the planning and design process, it is the turn of this building, the two parameters that must be evaluated include: 1 implemented 2 systematic.
First, we see that the design has been fully implemented in all areas. The process has been fully implemented in the sector. After the design process is well implemented, should be studied systematically and timely and structured design of the runs.

A novel model for business process maturity assessment through combining maturity models 175
6 Measurement: The sixth feature is the need to develop criteria and indicators for performance assessment process. No criteria not having been aware of the actual process output. These are processes that provide excellent performance in rough indicators will include: 1 definition 2 learning and creativity 3 improvement and innovation 4 uses.
Process metrics should be defined according to the organisation’s strategic goals and objectives of the organisation, as well as a system for the identification of positive results and the lessons learned there. To make use of creativity and design new or modified processes to improve the learning and innovation are essential. Efforts to improve the performance of key processes and innovative new processes to identify changes in the environment and the results obtained in the process of improving the performance enhancement organisation.
7 Performance: The last factor in assessing process maturity and performance. After the planning, implementation, measurement, control, and operation processes have been implemented well. Indicators associated with this element are: 1 trends 2 targets 3 comparisons 4 causes.
We are looking at whether the performance is in line with the organisation’s goals and objectives for the results and performance are set then. Sometimes it is necessary to review the current state and desired future. Finally, the relationship between performance, achieved results, and future of affirmative actions are ensured.
Seven criteria common to a close, they are complex and interrelated. Each of them was caused others to be inefficient. A ‘business owner’ using a low power process is not well designed. If untrained performers, they cannot do well to implement the plan. A poor design cannot meet the expectations that have to be included in the evaluation and performance index, and the chain continues. In the absence of one or more criteria may be a ‘work of’ some of the most
impressive and formidable dramatic results. But things are not durable and less repeats.
The important point is that the intensity varies with factors exist in all organisations. May be organised in an ‘owner’ is a good choice but the necessary authority to implement a comprehensive national plan is good, he should not be delegated.
4.3 Assessment maturity indexes
This model is then evaluated, based on a questionnaire that was introduced in the last section of the index is based on RADAR. In this model, the 5-level indicator and is measured from 0 to 100 points. So that the first level, rated from 0 to 10, the next level rating from 15 to 35, the third level points from 40 to 60, in quarter-point from 65 to 85 and the final score is 90 to 100 (Table 4). The complete questionnaire is provided in Appendix A.
5 Conclusions
In this research, we studied models such as EFQM, ISO 9004:2009 thereafter processed MMs and identified factors and indicators; then, employed RADAR ruler to score indicators. Ultimately, the decision table was presented to prioritise maturity processes.
The BPMM application provide with several additional benefits. For instance, the analysis took the approximation out of planning; the process owner’s team had not addressed certain issues simply because it had not thought of them. The framework allowed team members to decide where to focus their resources instead of forcing them to rely on intuition and flashes of imagination. Furthermore, the BPMM analysis gave leaders answers they could offer the many employees who had become enthusiastic about the company’s focus on business processes and were asking what they could be doing to help.
The BPMM framework does not make the road to process transformation easy to travel. Executives must do a lot of difficult, even painful, work to design high-performance processes and create an environment in which those processes flourish. In fact, organisations are often surprise by the results of BPMM analyses; they feel they have made more progress than the model shows. However, in process transformations, as in life, knowing where you stand and having a road map to follow beats stumbling in the dark.
Table 4 Assessment maturity indexes
Level 1 (initial) Level 2
(managed) Level 3 (defined)
Level 4 (quantitatively
managed) Level 5
(optimising)
Cri
teri
a
Inde
x
0 5 10 15 20 25 30 35 40 45 50 55 60 65 70 75 80 85 90 95 100

176 M. Moradi-Moghadam et al.
The BPMM presented in this study is distinct in the following way:
1 it grasps the organisations’ current business processes
2 it introduces appropriate KPAs which are suitable for software and systems processes with business process
3 it covers shortcomings of the existing PMM/PMMM
4 it reflects the opinions of experts
5 it clarifies the difference between maturity levels.
The proposed model can be used by companies in order to improve their efficiency, decrease costs, improve customer satisfaction, grow the top line, and achieve competitive advantage. These advantages become more visible as the company progresses. On the flip side, companies will find themselves in a disadvantageous state if they do not progress, as their competitors will likely be trying to accomplish this same feat. Ultimately, to climb the mountain and realise these benefits, companies must understand that there will be high hurdles to overcome at each step in the maturity process, and the only way to overcome these challenges is to achieve organisational alignment around all five levers of change by creating an enterprise-wide environment that supports and rewards the appropriate behaviour at each step of the way. Our research tries to fill this gap by conducting a comparative study on a popular models. This paper only focuses on a small, though important part of that research. Particularly, it presents a questionnaire with 7 criteria and 25 indexes, derived by a content analysis of the design documents from the sampled BPMMs. It can be used by practitioners to select a BPMM that best fits their organisational needs.
Indeed, organisations wishing to start improving business process maturity must first choose a BPMM out of a wide array. Since existing BPMMs vary on many design elements, this choice may impact their further progression in business process management. Frequently, such organisations are not aware of those differences. Therefore, our questionnaire supports their BPMM choice by considering the most important design differences among existing BPMMs.
Acknowledgements
The authors would like to thank all colleagues at Qods-Niroo company, especially Mr. Kamali-Zadeh, Mr. Naseri, Mr. Fallahnezhad, Mr. Bakhshandeh. Special thank to Mr. Drafshan, CEO of Integrated Systems in Management, for his cooperation in providing input information. In addition, in developing this research we significantly benefited from thoughts and idea of Professor Asghar-Zadeh. Meysam Maleki also acknowledges Fundação para a Ciência e Tecnologia da Faculdade de Ciências e Tecnologia Project MIT-Pt/EDAM-IASC/0022/2008, he is supported by a PhD fellowship from this foundation.
References Ahern, D., Clouse, A. and Turner, R. (2004) CMMI Distilled:
A Practical Introduction to Integrated Process Improvement, Addison-Wesley, Boston.
Andjelković, M. (2004) ‘Six Sigma project implementation’, YUPMA – VIII International Symposium in Project Management, Belgrade, pp.191–197.
Andjelković, M. (2007) ‘Business process management maturity model and Six Sigma: an integrated approach for easier networking’, International Conference on Economics and Management of Networks, Vienna.
Aysar, P.S. and Johnson, W.C. (2003) ‘Strategic capabilities of business process: looking for competitive advantage’, Competitiveness Review, Vol. 13, No. 2, pp.46–52.
Benner, M.J. and Veloso, F.M. (2008) ‘ISO9000 practices and financial performance: a technology coherence perspective’, Journal of Operations Management, Vol. 26, No. 5, pp.611–629.
Burlton, R. (2011) ‘BPM critical success factors lessons learned from successful BPM organizations’, Business Process Trends, October, pp.1–6.
Burlton, R.T. (2001) Business Process Management: Profiting from Process, Sams, Indianapolis, IN.
Chrissis, M., Konrad, M. and Shrum, S. (2006) CMMI Guidelines for Process Integration and Product Improvement, Addison-Wesley, Boston.
Curtis, B. and Alden, J. (2006) ‘The BPM & organizational maturity’, Business Process Trends, November, pp.1–5.
Davenport, T.H. (1993) Process Innovation: Reengineering Work through Information Technology, Harvard Business School Press, Boston, MA.
Fisher, D.M. (2004) ‘The business process maturity model: a practical approach for identifying opportunities for optimization’, Business Process Trends, September, pp.1–7.
Hammer, M. (2007) ‘The process audit’, Harvard Business Review, Vol. 82, No. 4, pp.111–123.
Harmon, P. (2003) Business Process Change: A Manager’s Guide to Improving, Redesigning, and Automating Processes, Morgan Kaufmann Publishers, San Francisco, CA.
Harmon, P. (2004) ‘Evaluating an organization’s business process maturity’, Business Process Trends, Vol. 2, No. 3, pp.1–11.
Harrington, H.J. (2006) Process Management Excellence, Paton Press, California.
Hoang, D.T., Igel, B. and Laosirihongthong, T. (2006) ‘The impact of total quality management on innovation: findings from a developing country’, International Journal of Quality and Reliability Management, Vol. 23, No. 9, pp.1092–1117.
Hofmann, H., Yedlin, D., Mishler, J. and Kushner, S. (2007) CMMI for Outsourcing: guidelines for Software, Systems, and IT Acquisition, Addison-Wesley, Boston.
Lam, K.C., Wang, D. and Lam, M.C.K. (2008) ‘The TQM journey of Hong Kong building contractors: from a self-assessment perspective’, The TQM Magazine, Vol. 20, No. 6, pp.556–569.
Lee, J., Lee, D. and Kang, S. (2007) ‘An overview of the business process maturity model (BPMM)’, in Chang, K.C. et al. (Eds.): Advances in Web and Network Technologies, and Information Management, pp.384–395, Springer Berlin Heidelberg.

A novel model for business process maturity assessment through combining maturity models 177
Lee, R.G. and Dale, B.G. (1998) ‘Business process management: a review and evaluation’, Journal of Business Process Management, Vol. 4, No. 3, pp.214–225.
Maier, A.M., Moultrie, J. and Clarkson, P.J. (2008) ‘Developing maturity grids for assessing organizational capabilities: practitioner guidance’, 4th International Conference on Management Consulting, pp.1–29, Vienna.
McCormack, K. (2007) ‘Supply chain management maturity’, Business Process Maturity. Theory and Application, Booksurge Publishing, South Carolina, pp.73–103.
McCormack, K., Willems, J., van den Bergh, J., Deschoolmeester, D., Willaert, P., Stemberger, M.I., Skrinjar, R., Trkman, P., Ladeira, M.B., de Oliveira, M.P.V., Vuksic, V.B. and Vlahovic, N. (2009) ‘A global investigation of key turning points in business process maturity’, Journal of Business Process Management, Vol. 15, No. 5, pp.792–815.
Paulk, M.C., Curtis, B., Chrissis, M.B. and Weber, C.V. (1993) ‘Capability maturity model’, Software IEEE, Vol. 10, No. 4, pp.18–27.
Rohloff, M. (2010) ‘Advances in business process management implementation based on a maturity assessment and best practice exchange’, Information Systems and E-Business Management, Vol. 9, No. 3, pp.383–403.
Rosemann, M. and Bruin, T. (2005) ‘Application of a holistic model for determining BPM maturity’, Business Process Trends, February, pp.1–20.
Rosemann, M., Bruin, T. and Power, B. (2006) ‘A model to measure BPM maturity and improve performance’, Business Process Management: Practical Guidelines for Successful Implementation, Elsevier, Oxford.
Sharma, M. and Kodali, R. (2008) ‘TQM implementation elements for manufacturing excellence’, The TQM Magazine, Vol. 20, No. 6, pp.599–621.
Vom Brocke, J. and Rosemann, M. (2010) Handbook on Business Process Management, Vol. 2, pp.vii–ix, Springer, Berlin.
Wolf, C. and Harmon, P. (2010) ‘The state of business process management’, Business Process Trends, February, pp.1–52.
Appendix A
Table A1 Business process maturity assessment questionnaire
Business process maturity assessment Level 1 Level 2
Criteria Index Initial 0 5 10
Managed 15 20 25 30 35
Purpose The process is not yet fully developed. Areas of project managers to improve their performance in the field are not used.
0 5 10 The process has not been designed on an end-to-end basis. Functional managers use the legacy design primarily as a context for functional performance improvement.
15 20 25 30 35
Content Inputs, outputs, supplier and customer processes have not been identified.
0 5 10 The process’s inputs, outputs, suppliers, and customers have been identified.
15 20 25 30 35
Alignment with strategy
All new design with the aim of improving the process is not operational.
0 5 10 The new process is designed to improve the operation is performed.
15 20 25 30 35
Assessment or review
There is no approach to review and update process.
0 5 10 Periodic review and update is done to improve the process.
15 20 25 30 35
Des
ign
Documentation Process documentation and communication between the enterprise and Mlyany are not specified in the implementation process.
0 5 10 The documentation of the process is primarily functional, but it identifies the interconnections among the organizations involved in executing the process.
15 20 25 30 35
Identity Owner is not responsible for improving process performance.
0 5 10 The process owner is an individual or a group informally charged with improving the process’s performance.
15 20 25 30 35
Activities Owner does not recognize the process, it does not account for all the users and does not support any changes.
0 5 10 The process owner identifies and documents the process, communicates it to all the performers, and sponsors small scale change projects.
15 20 25 30 35
Ow
ner
Authority Owner does not promote a business process-driven, task-oriented managers do not invite to accept the transformation.
0 5 10 The process owner lobbies for the process but can only encourage functional managers to make changes.
15 20 25 30 35
178 M. Moradi-Moghadam et al.
Table A1 Business process maturity assessment questionnaire (continued)
Business process maturity assessment
Level 1 Level 2 Criteria Index Initial
0 5 10Managed
15 20 25 30 35
Knowledge Performers are not able to identify the main criteria for measuring performance.
0 5 10 Performers can name the process they execute and identify the key metrics of its performance.
15 20 25 30 35
Skills Performers are not technology problem solving and process improvement skills.
0 5 10 Performers are skilled in problem solving and process improvement techniques.
15 20 25 30 35
Perf
orm
ers
Behaviour Performers are not at all faithful to the task as well as their activities are not significant.
0 5 10 Performers have some allegiance to the process, but owe primary allegiance to their function.
15 20 25 30 35
Information systems
Elementary and separate information systems, the process does not support.
0 5 10 Fragmented legacy IT systems support the process.
15 20 25 30 35
Equipment and instruments
The organization does not have the proper equipment, software and hardware.
0 5 10 Equipment and tools for hardware and software part (1/4) can be seen in the organization.
15 20 25 30 35
Information and knowledge
Information and knowledge integration, reliability and availability are not relevant persons.
0 5 10 There are the process integrity, availability and reliability of information and knowledge.
15 20 25 30 35
Infr
astru
ctur
e
Human resource systems
Task-oriented managers are not responsible for operations excellence and operational problems in the process.
0 5 10 Functional managers reward the attainment of functional excellence and the resolution of functional problems in a process context.
15 20 25 30 35
Implemented Design and approach is not implemented and there is not evidence and anecdotal.
0 5 10 Implemented in about 1/4 of relevant areas.
15 20 25 30 35
Dep
loym
ent
Systematic There is not any plan for deploying and it cannot manage changes in environment and implement in the best time.
0 5 10 Same evidence. 15 20 25 30 35
Definition Cost and quality measures for the process have not determined.
0 5 10 The process has some basic cost and quality metrics.
15 20 25 30 35
Learning and creativity
There is no individual learning and sharing knowledge. From creativity to create new or modified approaches cannot be used.
0 5 10 There are processes for sharing information and knowledge. Creative approaches to develop new or changed somewhat used.
15 20 25 30 35
Innovation and Improvement
Improvement activities are ad hoc and based on customer or regulatory complaints.
0 5 10 Basic improvement processes, based on corrective and preventive actions, are in place and Innovation activities are based on data concerning the needs and expectations of customers.
15 20 25 30 35
Mea
sure
men
t
Uses Management process to track the performance criteria cannot be used to improve operations, root causes of performance failures are not identify.
0 5 10 Managers use the process’s metrics to track its performance, identify root causes of faulty performance, and drive functional improvements.
15 20 25 30 35

A novel model for business process maturity assessment through combining maturity models 179
Table A1 Business process maturity assessment questionnaire (continued)
Business process maturity assessment
Level 1 Level 2 Criteria Index Initial
0 5 10Managed
15 20 25 30 35
Trends Trends are not aligned with strategic goals and with the ‘ideal’ trend. There are not positive trends and sustained good performance.
0 5 10 Positive trends and/or satisfactory performance on some results.
15 20 25 30 35
Targets Targets are not achieved. targets are not appropriate.
0 5 10 For nearly quarter results, objectives, and achieves good.
15 20 25 30 35
Comparisons Comparisons with external organizations do not takes place and results do not compare well with industry averages or acknowledged ‘best in class’.
0 5 10 For about 1/4 results, by comparison, are appropriate and represents good condition.
15 20 25 30 35
Perf
orm
ance
Causes Results are not caused by approach.
0 5 10 For about 1/4 of the impact on their empowerment is evident and there is evidence indicating stable performance.
15 20 25 30 35
Table A2 Business process maturity assessment questionnaire
Business process maturity assessment
Level 3 Level 4 Level 5 Defined
40 45 50 55 60 Quantitatively
managed 65 70 75 80 85Optimizing
90 95 100
The process has been redesigned from end to end in order to optimize its performance.
40 45 50 55 60 The process has been designed to fit with other enterprise processes and with the enterprise’s IT systems in order to optimize the enterprise’s performance.
65 70 75 80 85 The process has been designed to fit with customer and supplier processes in order to optimize the enterprise performance.
90 95 100
The needs of the process’s customers are known and agreed upon.
40 45 50 55 60 The process owner and the owners of the other processes with which the process interfaces have established mutual performance expectations.
65 70 75 80 85 The process owner and the owners of customer and supplier processes with which the process interfaces have established mutual performance expectations.
90 95 100
The new process is designed to identify the processes that are carried out in order to achieve bottleneck.
40 45 50 55 60 Design new processes of identifying process bottlenecks and identify process changes resulted from the strategy shift is done.
65 70 75 80 85 In addition to designing new processes identified in the organization’s strategy stems from the application of process improvement can be done.
90 95 100
Revisions and updates to be done systematically and regularly.
40 45 50 55 60 Review and update the output of some units can be multiplexed for further learning and collaboration.
65 70 75 80 85 Reviewed and updated and shared between all units of output results show the effectiveness of the review and update of the activities.
90 95 100

180 M. Moradi-Moghadam et al.
Table A2 Business process maturity assessment questionnaire (continued)
Business process maturity assessment
Level 3 Level 4 Level 5 Defined
40 45 50 55 60 Quantitatively
managed 65 70 75 80 85Optimizing
90 95 100
There is end-to-end documentation of the process design.
40 45 50 55 60 The process documentation describes the process’s interfaces with, and expectations of, other processes and links the process to the enterprise’s system and data architecture.
65 70 75 80 85 An electronic representation of the process design supports its performance and management and allows analysis of environmental changes and process reconfigurations.
90 95 100
Enterprise leadership has created an official process owner role and has filled the position with a senior manager who has clout and credibility.
40 45 50 55 60 The process comes first for the owner in terms of time allocation, mind share, and personal goals.
65 70 75 80 85 The process owner is a member of the enterprise’s most senior decision-making body.
90 95 100
The process owner articulates the process’s performance goals and a vision of its future; sponsors redesign and improvement efforts; plans their implementation; and ensures compliance with the process design.
40 45 50 55 60 The process owner works with other process owners to integrate processes to achieve the enterprise’s goals.
65 70 75 80 85 The process owner develops a rolling strategic plan for the process, participates in enterprise-level strategic planning, and collaborates with his or her counterparts working for customers and suppliers to sponsor enterprise process redesign initiatives.
90 95 100
The process owner can convene a process redesign team and implement the new design and has some control over the technology budget for the process.
40 45 50 55 60 The process owner controls the IT systems that support the process and any projects that change the process and has some influence over personnel assignments and evaluations as well as the process’s budget.
65 70 75 80 85 The process owner controls the process’s budget and exerts strong influence over personnel assignments and evaluations.
90 95 100
Performers can describe the process’s overall flow; how their work affects customers, other employees in the process, and the process’s performance; and the required and actual performance levels.
40 45 50 55 60 Performers are familiar both with fundamental business concepts and with the drivers of enterprise performance and can describe how their work affects other processes and the enterprise’s performance.
65 70 75 80 85 Performers are familiar with the enterprise’s industry and its trends and can describe how their work affects interenterprise performance.
90 95 100
Performers are skilled in teamwork and self-management.
40 45 50 55 60 Performers strive to ensure that the process delivers the results needed to achieve the enterprise’s goals.
65 70 75 80 85 Performers are skilled at change management and change implementation.
90 95 100

A novel model for business process maturity assessment through combining maturity models 181
Table A2 Business process maturity assessment questionnaire (continued)
Business process maturity assessment
Level 3 Level 4 Level 5 Defined
40 45 50 55 60 Quantitatively
managed 65 70 75 80 85Optimizing
90 95 100
Performers try to follow the process design, perform it correctly, and work in ways that will enable other people who execute the process to do their work effectively.
40 45 50 55 60 Performers strive to ensure that the process delivers the results needed to achieve the enterprise’s goals.
65 70 75 80 85 Performers look for signs that the process should change, and they propose improvements to the process.
90 95 100
An IT system constructed from functional components supports the process.
40 45 50 55 60 An integrated IT system, designed with the process in mind and adhering to enterprise standards, supports the process.
65 70 75 80 85 An IT system with a modular architecture that adheres to industry standards for enterprise communication supports the process.
90 95 100
There are evidence (1/2) of hardware and software equipment and tools for improving processes in an organization.
40 45 50 55 60 There are clear evidence (3/4) of hardware and software equipment and tools to improve the processes in the organization.
65 70 75 80 85 Equipment and software tools are fully observed in the organization.
90 95 100
Information and knowledge are shared with the organization and is reviewed periodically.
40 45 50 55 60 Between the partners and the relevant units of information and knowledge is shared.
65 70 75 80 85 The results of knowledge management is compared with other organizations.
90 95 100
The process’s design drives role definitions, job descriptions, and competency profiles. Job training is based on process documentation.
40 45 50 55 60 Hiring, development, reward, and recognition systems emphasize the process’s needs and results and balance them against the enterprise’s needs.
65 70 75 80 85 Hiring, development, reward, and recognition systems reinforce the importance of intra- and enterprise collaboration, personal learning, and organizational change.
90 95 100
Implemented in abut 1/2 of relevant areas.
40 45 50 55 60 Implemented in about 3/4 of relevant areas.
65 70 75 80 85 Implemented in all relevant areas.
90 95 100
Evidence. 40 45 50 55 60 Clear evidence. 65 70 75 80 85 Comprehensive evidence.
90 95 100
The process has end-to-end process metrics derived from customer requirements.
40 45 50 55 60 The process’s metrics as well as cross-process metrics have been derived from the enterprise’s strategic goals.
65 70 75 80 85 The process’s metrics have been derived from enterprise goals.
90 95 100
There is a system for detecting positive results and lessons learned. From creativity to create new or modified approaches are used.
40 45 50 55 60 Enhance learning and innovation processes is essential. Clear evidence of the use of innovative approaches to the creation of new or changed there.
65 70 75 80 85 Learning culture in the organization is institutionalized and comprehensive evidence of the creativity used to create new or modified approaches exist.
90 95 100

182 M. Moradi-Moghadam et al.
Table A2 Business process maturity assessment questionnaire (continued)
Business process maturity assessment
Level 3 Level 4 Level 5 Defined
40 45 50 55 60 Quantitatively
managed 65 70 75 80 85Optimizing
90 95 100
Improvement efforts can be demonstrated in most of the products and key processes of the organization and The innovation process for new products and processes is able to identify changes in the organization’s environment, in order to plan innovations.
40 45 50 55 60 Results generated from the improvement processes enhance the performance of the organization and The effectiveness and efficiency of the innovation processes are assessed regularly as a part of the learning process.
65 70 75 80 85 Focusing on improving organizational performance and change and learning. Innovation in processes, organizational structure, operating model and management systems are used.
90 95 100
Managers use the process’s metrics to compare its performance to benchmarks, best-in-class performance, and customer needs and to set performance targets.
40 45 50 55 60 Managers present the metrics to process performers for awareness and motivation. They use dashboards based on the metrics for day-to-day management of the process.
65 70 75 80 85 Managers regularly review and refresh the process’s metrics and targets and use them in strategic planning.
90 95 100
Positive trends and/or sustained good performance on many results over the last three years.
40 45 50 55 60 Strongly positive trends and/or sustained excellent performance on most results over at least three years.
65 70 75 80 85 Strongly positive trends and/or sustained excellent performance in all areas over at least five years.
90 95 100
For nearly half results, objectives, and achieves good.
40 45 50 55 60 For about 3/4 results, objectives, and achieves good.
65 70 75 80 85 For all results, set goals, and achieves good.
90 95 100
For about 1/2 results compared to the fit and proper status displays.
40 45 50 55 60 For about 3/4 results, by comparison, are appropriate and represents good condition.
65 70 75 80 85 Excellent in most areas and ‘best in class’ in many areas.
90 95 100
For about half of the impact on their empowerment is evident and there is evidence indicating stable performance.
40 45 50 55 60 For about 3/4 of the impact on their empowerment is evident and there is evidence indicating stable performance.
65 70 75 80 85 For all results, the effect is evident on empowerment and comprehensive evidence exists evidence of performance persistence.
90 95 100

A novel model for business process maturity assessment through combining maturity models 183
Appendix B
Table B1 Business process maturity assessment: corporate results
Business process maturity assessment: corporate results
Processes
Cri
teri
a
Indexes St
rate
gic
man
agem
ent a
nd
perf
orm
ance
man
agem
ent
Kno
wle
dge
man
agem
ent,
impr
ovem
ent a
nd c
hang
e Q
ualit
y, h
ealth
, saf
ety
and
envi
ronm
ent (
QH
SE)
Syst
ems d
esig
n an
d m
etho
ds
Mar
ketin
g an
d sa
les
Supp
ly m
anag
emen
t
Engi
neer
ing
and
cons
ultin
g se
rvic
es
Des
ign,
pro
cure
men
t and
co
nstr
uctio
n (E
PC)
Man
agem
ent c
ontr
act (
MC
)
Inve
stm
ent p
roje
cts
(BO
O, B
OT)
Hum
an re
sour
ce m
anag
emen
t
Man
agem
ent o
f fin
anci
al
reso
urce
s
Asse
t man
agem
ent
Man
agem
ent i
nfor
mat
ion
and
com
mun
icat
ion
tech
nolo
gies
M
anag
emen
t of e
xter
nal
com
mun
icat
ions
Man
agem
ent s
uppo
rt se
rvic
es
purpose 45.5 44.3 52.0 40.0 30.5 38.8 61.2 30.5 33.3 27.5 42.0 44.3 31.3 45.8 35.0 53.0Content 46.0 46.3 53.5 42.0 31.3 38.8 64.3 31.5 34.0 26.8 39.0 44.5 34.0 44.8 34.8 55.0
Alignment with strategy 37.8 44.0 48.8 42.0 31.0 35.0 57.3 33.0 40.3 36.8 40.0 38.8 28.8 38.8 34.8 45.3Assessment or review 43.8 43.5 57.0 40.5 28.8 37.5 63.5 30.3 34.5 27.8 41.3 45.0 35.5 41.0 35.5 45.3D
esig
n
Documentation 50.0 45.5 62.0 40.0 27.3 34.0 65.5 33.5 35.5 26.8 41.5 50.0 32.0 43.5 36.3 52.8Average 44.6 44.7 54.7 40.9 29.8 36.8 62.3 31.8 35.5 29.1 40.8 44.5 32.3 42.8 35.3 51.2
Identity 45.0 43.3 45.3 35.8 30.5 33.8 59.5 29.8 33.5 27.0 40.3 40.3 31.3 41.0 34.3 46.5Activities 47.3 43.0 51.8 38.5 32.3 32.8 59.0 29.5 34.5 27.0 37.0 37.8 29.3 40.0 33.5 46.5
Ow
ner
Authority 44.0 38.5 52.5 38.0 31.3 30.8 58.8 28.0 32.8 27.3 35.5 35.8 30.5 36.5 31.0 45.3Average 45.4 41.6 49.8 37.4 31.3 32.4 59.1 29.1 33.6 27.1 37.6 37.9 30.3 39.2 32.9 46.1
Knowledge 57.3 46.8 58.0 44.5 38.5 43.8 68.5 39.3 43.5 38.0 45.5 49.8 37.5 47.8 42.8 55.3Skills 58.5 51.3 55.8 48.5 36.8 45.5 68.8 40.3 46.3 37.8 41.0 48.8 36.3 49.0 41.3 56.8
Perf
orm
ers
Behaviour 58.0 51.0 54.5 44.0 35.0 40.5 62.0 36.3 42.8 37.3 42.8 46.0 37.5 43.5 38.3 57.3Average 57.9 49.7 56.1 45.7 36.8 43.3 66.4 38.6 44.2 37.7 43.1 48.2 37.1 46.8 40.8 56.4
Information systems 50.5 48.0 45.0 41.0 35.0 40.3 56.8 38.0 35.5 37.0 42.5 41.5 37.3 48.5 38.3 52.3Equipment and
Instruments 53.0 53.8 49.5 44.5 42.0 43.0 59.8 37.3 46.8 37.5 47.5 42.3 39.8 55.3 38.3 56.5
Information and knowledge 52.0 48.5 51.0 44.5 35.0 41.3 62.8 36.8 36.5 32.3 40.5 45.0 36.8 46.5 35.8 51.0
Infr
astru
ctur
e
Human resource systems 45.3 41.3 42.3 36.5 30.0 36.5 51.8 30.3 31.3 28.5 35.0 38.8 35.3 38.0 27.8 49.5Average 50.2 47.9 46.9 41.6 35.5 40.3 57.8 35.6 37.5 33.8 41.4 41.9 37.3 47.1 35.0 52.3
Implemented 56.0 40.8 59.0 41.5 36.5 38.3 64.0 28.3 28.3 24.8 48.3 50.8 40.5 55.3 31.3 63.0
Dep
loym
ent
Systematic 55.3 41.0 60.3 41.0 34.5 38.3 64.8 26.8 26.3 26.3 47.5 45.5 42.5 54.0 34.0 66.0
Average 55.6 40.9 59.6 41.3 35.5 38.3 64.4 27.5 27.3 25.5 47.9 48.1 41.5 54.6 32.6 64.5
Definition 48.3 33.0 45.3 38.8 32.5 38.3 59.5 30.5 30.3 29.0 38.0 38.5 30.8 42.0 31.3 49.0Learning and creativity 44.0 37.3 49.0 39.5 31.8 35.3 59.5 32.5 31.3 26.5 32.0 34.8 30.3 42.0 29.3 45.8
Innovation and improvement 43.0 41.0 47.3 40.5 29.5 34.3 58.5 30.8 32.3 26.5 37.3 35.5 30.8 43.5 30.8 45.5
Mea
sure
men
t
Uses 40.8 39.3 47.5 36.3 31.0 35.5 54.8 31.5 34.3 26.3 39.0 35.0 29.3 41.0 28.5 43.5Average 44.0 37.6 47.3 38.8 31.2 35.8 58.1 31.3 32.0 27.1 36.6 35.9 30.3 42.1 29.9 45.9
Trends 49.8 37.3 52.3 42.8 31.0 38.0 61.0 32.3 30.8 29.3 43.3 41.5 36.0 45.8 35.5 48.0Targets 53.8 40.8 53.0 44.0 35.8 40.5 62.0 32.3 32.3 27.8 43.0 44.8 38.5 47.0 35.3 52.3
Comparisons 54.0 41.5 51.5 37.0 30.8 37.5 58.5 31.8 31.0 25.5 40.8 44.0 36.8 44.8 33.3 50.3
Perf
orm
ance
Causes 51.0 42.3 52.0 39.5 31.0 36.5 58.8 31.8 30.0 25.8 37.8 42.8 36.5 45.8 33.0 51.3Average 52.1 40.4 52.2 40.8 32.1 38.1 60.1 32.0 31.0 27.1 41.2 43.3 36.9 45.8 34.3 50.4
Total average 50.0 43.3 52.4 40.9 33.2 37.8 61.2 32.3 34.4 29.6 41.2 42.8 35.1 45.5 34.4 52.4Average maturity level of the organization and its processes: 41.6 Maturity level 3
184 M. Moradi-Moghadam et al.
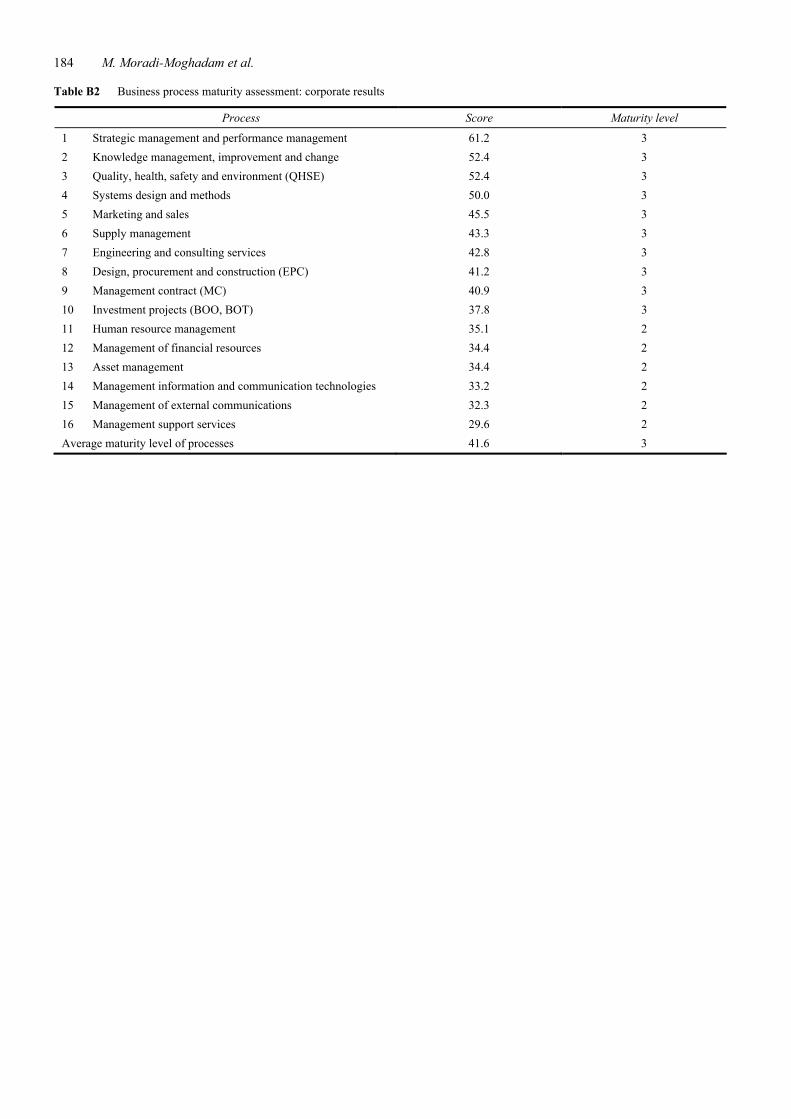
Table B2 Business process maturity assessment: corporate results
Process Score Maturity level
1 Strategic management and performance management 61.2 3 2 Knowledge management, improvement and change 52.4 3 3 Quality, health, safety and environment (QHSE) 52.4 3 4 Systems design and methods 50.0 3 5 Marketing and sales 45.5 3 6 Supply management 43.3 3 7 Engineering and consulting services 42.8 3 8 Design, procurement and construction (EPC) 41.2 3 9 Management contract (MC) 40.9 3 10 Investment projects (BOO, BOT) 37.8 3 11 Human resource management 35.1 2 12 Management of financial resources 34.4 2 13 Asset management 34.4 2 14 Management information and communication technologies 33.2 2 15 Management of external communications 32.3 2 16 Management support services 29.6 2 Average maturity level of processes 41.6 3