A novel, long-lived, and highly engraftable immunodeficient mouse model of mucopolysaccharidosis...
17
Citation: Molecular Therapy — Methods & Clinical Development (2015) 2, 14068; doi:10.1038/mtm.2014.68 © 2015 The American Society of Gene & Cell Therapy All rights reserved 2329-0501/15 www.nature.com/mtm INTRODUCTION Mucopolysaccharidosis type I (MPS I or Hurler syndrome), a lyso- somal storage disorder (LSD), is caused by an autosomally recessive inherited deficiency of the lysosomal glycosaminoglycan (GAG)- degrading enzyme α-L-iduronidase (IDUA). 1–3 IDUA deficiency leads to the lysosomal accumulation of large sugar glycosaminoglycans, primarily dermatan sulfate and heparan sulfate. The buildup of GAGs results in cellular and metabolic dysfunction and the devel- opment of organ abnormalities such as the characteristic increase in liver size seen in MPS I patients. Pathophysiologically, MPS I is a progressive multisystem disorder with multiple organ and tissue abnormalities that include skeletal dysplasia, hearing loss, sleep apnea, corneal clouding, cardiac manifestations, learning difficul- ties, and intellectual disability. Without treatment, severe MPS I patients will die from cardiorespiratory failure, usually within the first 10 years of life. Current available treatment strategies include hematopoietic stem cell (HSC) transplantation (HSCT) and/or enzyme replacement therapy (ERT). 4–7 HSCT in selected children with severe MPS I can increase survival, reduce facial coarseness and hepatosplenomeg- aly, improve hearing, and maintain normal heart function. HSCT may also slow the course of cognitive decline in those patients with mild, but not severe, enzyme deficiency. HSCT does not, however, improve the skeletal, corneal and central nervous system (CNS) manifestations of this disease although recent studies in animal models suggest that early intervention may be important in this regard. 8–11 Enzyme replacement therapy (ERT) can improve liver size, growth, joint mobility, breathing, and sleep apnea in those with attenuated disease. However, ERT is extremely expensive and again fails, like HSCT, to adequately address the critical CNS mani- festations of MPS I. 12 Because SCT has shown benefit when administered peripherally (HSCT) or by direct neural stem cell (NSC) transplantation (NSCT) into the CNS in experimental models, a logical step is to use mul- timodal (peripheral and CNS) SCT to address both types of patho- physiology simultaneously. A long-lived immunodeficient animal model of MPS I is thus needed for these preclinical studies. Current MPS I mouse models based on a NOD/SCID (NS) immuno- deficient background are short-lived, providing a very narrow win- dow to assess the long-term efficacy of therapeutic intervention. 13 These NS mice also develop thymic lymphomas, making the assess- ment of potential tumorigenicity of human stem cell transplanta- tion problematic. 14–17 We therefore developed a new MPS I model by breeding MPS I NS mice with the recently developed NOD/SCID/ Received 12 September 2014; accepted 14 December 2014 Mucopolysaccharidosis type I (MPS I) is an inherited α-L-iduronidase (IDUA, I) deficiency in which glycosaminoglycan (GAG) accumulation causes progressive multisystem organ dysfunction, neurological impairment, and death. Current MPS I mouse models, based on a NOD/SCID (NS) background, are short-lived, providing a very narrow window to assess the long-term efficacy of therapeutic interventions. They also develop thymic lymphomas, making the assessment of potential tumorigenicity of human stem cell transplantation problematic. We therefore developed a new MPS I model based on a NOD/SCID/Il2rγ (NSG) background. This model lives longer than 1 year and is tumor-free during that time. NSG MPS I (NSGI) mice exhibit the typical phenotypic features of MPS I including coarsened fur and facial features, reduced/abnormal gait, kyphosis, and corneal clouding. IDUA is undetectable in all tissues examined while GAG levels are dramatically higher in most tissues. NSGI brain shows a significant inflammatory response and prominent gliosis. Neurological MPS I manifestations are evidenced by impaired performance in behavioral tests. Human neural and hematopoietic stem cells were found to readily engraft, with human cells detectable for at least 1 year posttransplantation. This new MPS I model is thus suitable for preclinical testing of novel pluripotent stem cell-based therapy approaches. Molecular Therapy — Methods & Clinical Development (2015) 2, 14068; doi:10.1038/mtm.2014.68; published online 11 February 2015 1 National Human Neural Stem Cell Resource, Centers for Neuroscience and Translational Research, CHOC Children’s Research Institute, Orange, California, USA; 2 King’s College, London, Institute of Psychiatry, Psychology & Neuroscience, London, UK; 3 Department of Ophthalmology, Gavin Herbert Eye Institute, University of California, Irvine, Irvine, California, USA; 4 Department of Biomedical Engineering, Gavin Herbert Eye Institute, University of California, Irvine, Irvine, California, USA; 5 Department of Pathology and Laboratory Medicine, Sue and Bill Gross Stem Cell Research Center, University of California, Irvine, Irvine, California, USA; 6 Department of Developmental and Cell Biology, Sue and Bill Gross Stem Cell Research Center, University of California, Irvine, Irvine, California, USA; 7 Division of Medical Genetics, Department of Pediatrics, Los Angeles Biomedical Research Institute at Harbor-UCLA Medical Center, Torrance, California, USA. The first four authors contributed equally to this work. Correspondence: PH Schwartz ([email protected]) A novel, long-lived, and highly engraftable immunodeficient mouse model of mucopolysaccharidosis type I Daniel C Mendez 1 , Alexander E Stover 1 , Anthony D Rangel 1 , David J Brick 1 , Hubert E Nethercott 1 , Marissa A Torres 1 , Omar Khalid 1 , Andrew MS Wong 2 , Jonathan D Cooper 2 , James V Jester 3,4 , Edwin S Monuki 5,6 , Cian McGuire 7 , Steven Q Le 7 , Shih-hsin Kan 7 , Patricia I Dickson 7 and Philip H Schwartz 1 ARTICLE
-
Upload
independent -
Category
Documents
-
view
3 -
download
0
Transcript of A novel, long-lived, and highly engraftable immunodeficient mouse model of mucopolysaccharidosis...

Citation: Molecular Therapy — Methods & Clinical Development (2015) 2, 14068; doi:10.1038/mtm.2014.68 © 2015 The American Society of Gene & Cell Therapy All rights reserved 2329-0501/15
www.nature.com/mtm
INTRODUCTIONMucopolysaccharidosis type I (MPS I or Hurler syndrome), a lyso-somal storage disorder (LSD), is caused by an autosomally recessive inherited deficiency of the lysosomal glycosaminoglycan (GAG)-degrading enzyme α-L-iduronidase (IDUA).1–3 IDUA deficiency leads to the lysosomal accumulation of large sugar glycosaminoglycans, primarily dermatan sulfate and heparan sulfate. The buildup of GAGs results in cellular and metabolic dysfunction and the devel-opment of organ abnormalities such as the characteristic increase in liver size seen in MPS I patients. Pathophysiologically, MPS I is a progressive multisystem disorder with multiple organ and tissue abnormalities that include skeletal dysplasia, hearing loss, sleep apnea, corneal clouding, cardiac manifestations, learning difficul-ties, and intellectual disability. Without treatment, severe MPS I patients will die from cardiorespiratory failure, usually within the first 10 years of life.
Current available treatment strategies include hematopoietic stem cell (HSC) transplantation (HSCT) and/or enzyme replacement therapy (ERT).4–7 HSCT in selected children with severe MPS I can increase survival, reduce facial coarseness and hepatosplenomeg-aly, improve hearing, and maintain normal heart function. HSCT may also slow the course of cognitive decline in those patients with
mild, but not severe, enzyme deficiency. HSCT does not, however, improve the skeletal, corneal and central nervous system (CNS) manifestations of this disease although recent studies in animal models suggest that early intervention may be important in this regard.8–11 Enzyme replacement therapy (ERT) can improve liver size, growth, joint mobility, breathing, and sleep apnea in those with attenuated disease. However, ERT is extremely expensive and again fails, like HSCT, to adequately address the critical CNS mani-festations of MPS I.12
Because SCT has shown benefit when administered peripherally (HSCT) or by direct neural stem cell (NSC) transplantation (NSCT) into the CNS in experimental models, a logical step is to use mul-timodal (peripheral and CNS) SCT to address both types of patho-physiology simultaneously. A long-lived immunodeficient animal model of MPS I is thus needed for these preclinical studies.
Current MPS I mouse models based on a NOD/SCID (NS) immuno-deficient background are short-lived, providing a very narrow win-dow to assess the long-term efficacy of therapeutic intervention.13 These NS mice also develop thymic lymphomas, making the assess-ment of potential tumorigenicity of human stem cell transplanta-tion problematic.14–17 We therefore developed a new MPS I model by breeding MPS I NS mice with the recently developed NOD/SCID/
Received 12 September 2014; accepted 14 December 2014
2329-0501
14068
Molecular Therapy — Methods & Clinical Development
10.1038/mtm.2014.68
Article
11February2015
2
12September2014
14December2014
2015
© 2015 The American Society of Gene & Cell Therapy
MPS I model for stem cell transplantation
DC Mendez et al.
Mucopolysaccharidosis type I (MPS I) is an inherited α-L-iduronidase (IDUA, I) deficiency in which glycosaminoglycan (GAG) accumulation causes progressive multisystem organ dysfunction, neurological impairment, and death. Current MPS I mouse models, based on a NOD/SCID (NS) background, are short-lived, providing a very narrow window to assess the long-term efficacy of therapeutic interventions. They also develop thymic lymphomas, making the assessment of potential tumorigenicity of human stem cell transplantation problematic. We therefore developed a new MPS I model based on a NOD/SCID/Il2rγ (NSG) background. This model lives longer than 1 year and is tumor-free during that time. NSG MPS I (NSGI) mice exhibit the typical phenotypic features of MPS I including coarsened fur and facial features, reduced/abnormal gait, kyphosis, and corneal clouding. IDUA is undetectable in all tissues examined while GAG levels are dramatically higher in most tissues. NSGI brain shows a significant inflammatory response and prominent gliosis. Neurological MPS I manifestations are evidenced by impaired performance in behavioral tests. Human neural and hematopoietic stem cells were found to readily engraft, with human cells detectable for at least 1 year posttransplantation. This new MPS I model is thus suitable for preclinical testing of novel pluripotent stem cell-based therapy approaches.
Molecular Therapy — Methods & Clinical Development (2015) 2, 14068; doi:10.1038/mtm.2014.68; published online 11 February 2015
1National Human Neural Stem Cell Resource, Centers for Neuroscience and Translational Research, CHOC Children’s Research Institute, Orange, California, USA; 2King’s College, London, Institute of Psychiatry, Psychology & Neuroscience, London, UK; 3Department of Ophthalmology, Gavin Herbert Eye Institute, University of California, Irvine, Irvine, California, USA; 4Department of Biomedical Engineering, Gavin Herbert Eye Institute, University of California, Irvine, Irvine, California, USA; 5Department of Pathology and Laboratory Medicine, Sue and Bill Gross Stem Cell Research Center, University of California, Irvine, Irvine, California, USA; 6Department of Developmental and Cell Biology, Sue and Bill Gross Stem Cell Research Center, University of California, Irvine, Irvine, California, USA; 7Division of Medical Genetics, Department of Pediatrics, Los Angeles Biomedical Research Institute at Harbor-UCLA Medical Center, Torrance, California, USA. The first four authors contributed equally to this work. Correspondence: PH Schwartz ([email protected])
A novel, long-lived, and highly engraftable immunodeficient mouse model of mucopolysaccharidosis type IDaniel C Mendez1, Alexander E Stover1, Anthony D Rangel1, David J Brick1, Hubert E Nethercott1, Marissa A Torres1, Omar Khalid1, Andrew MS Wong2, Jonathan D Cooper2, James V Jester3,4, Edwin S Monuki5,6, Cian McGuire7, Steven Q Le7, Shih-hsin Kan7, Patricia I Dickson7 and Philip H Schwartz1
ARTICle
2
MPS I model for stem cell transplantationDC Mendez et al.
Molecular Therapy — Methods & Clinical Development (2015) 14068 © 2015 The American Society of Gene & Cell Therapy
Il2rγ (NSG) mouse.14 This IDUA-deficient mouse on the NSG back-ground (the NSGI mouse) is longer lived and tumor-free for the time period examined. We examined tissue IDUA and GAG accumulation, skeletal and corneal abnormalities, tissue pathology, and engraft-ment of human NSCs and human HSCs in this new MPS I model.
ReSUlTSHusbandryAnimals that were heterozygous (Het) for IDUA and homozygous null for IL2ry became the basis of our breeding scheme to produce the NSGI, wild-type (WT) and Het animals used in experiments (Supplementary Figure S1). Het matings produce on average six to eight pups per litter. To date, of 163 Het matings, 503 pups have been produced, 259 of which were female and 244 of which were male. Based on the genotype (Supplementary Figure S2) of the male pups 25% were WT, 50% were Hets, and 25% were NSGI ani-mals. Of the female pups, 26% were WT, 47% were Hets, and 27% were NSGI animals. Matings between NSGI males and Het females or NSGI females and Het males were unproductive. Male and female Het and NSGI animals survived at least 1 year; no thymic lympho-mas were detected in any animals.
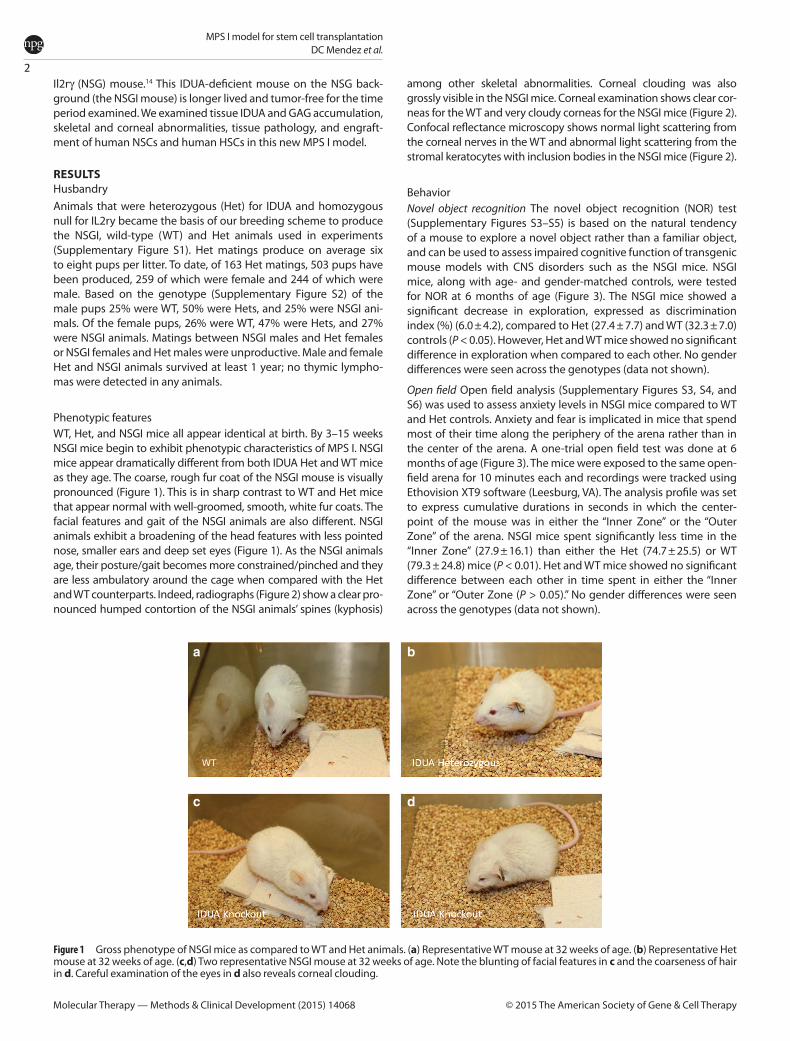
Phenotypic featuresWT, Het, and NSGI mice all appear identical at birth. By 3–15 weeks NSGI mice begin to exhibit phenotypic characteristics of MPS I. NSGI mice appear dramatically different from both IDUA Het and WT mice as they age. The coarse, rough fur coat of the NSGI mouse is visually pronounced (Figure 1). This is in sharp contrast to WT and Het mice that appear normal with well-groomed, smooth, white fur coats. The facial features and gait of the NSGI animals are also different. NSGI animals exhibit a broadening of the head features with less pointed nose, smaller ears and deep set eyes (Figure 1). As the NSGI animals age, their posture/gait becomes more constrained/pinched and they are less ambulatory around the cage when compared with the Het and WT counterparts. Indeed, radiographs (Figure 2) show a clear pro-nounced humped contortion of the NSGI animals’ spines (kyphosis)
among other skeletal abnormalities. Corneal clouding was also grossly visible in the NSGI mice. Corneal examination shows clear cor-neas for the WT and very cloudy corneas for the NSGI mice (Figure 2). Confocal reflectance microscopy shows normal light scattering from the corneal nerves in the WT and abnormal light scattering from the stromal keratocytes with inclusion bodies in the NSGI mice (Figure 2).
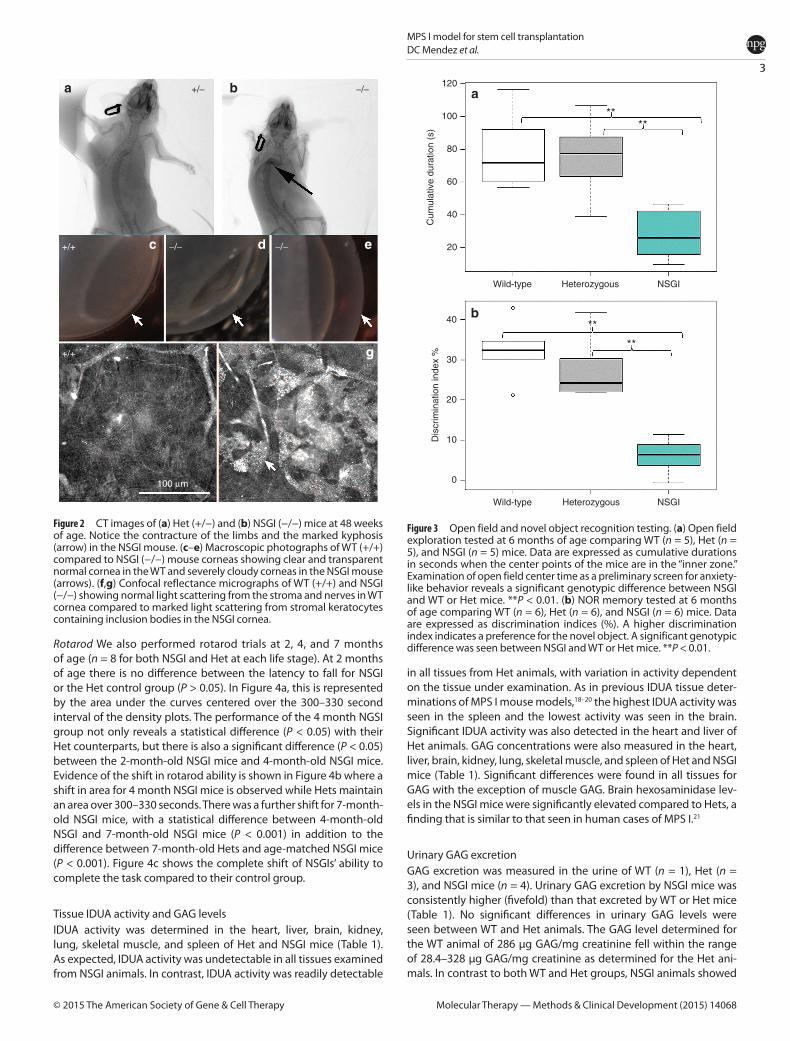
BehaviorNovel object recognition The novel object recognition (NOR) test (Supplementary Figures S3–S5) is based on the natural tendency of a mouse to explore a novel object rather than a familiar object, and can be used to assess impaired cognitive function of transgenic mouse models with CNS disorders such as the NSGI mice. NSGI mice, along with age- and gender-matched controls, were tested for NOR at 6 months of age (Figure 3). The NSGI mice showed a significant decrease in exploration, expressed as discrimination index (%) (6.0 ± 4.2), compared to Het (27.4 ± 7.7) and WT (32.3 ± 7.0) controls (P < 0.05). However, Het and WT mice showed no significant difference in exploration when compared to each other. No gender differences were seen across the genotypes (data not shown).
Open field Open field analysis (Supplementary Figures S3, S4, and S6) was used to assess anxiety levels in NSGI mice compared to WT and Het controls. Anxiety and fear is implicated in mice that spend most of their time along the periphery of the arena rather than in the center of the arena. A one-trial open field test was done at 6 months of age (Figure 3). The mice were exposed to the same open-field arena for 10 minutes each and recordings were tracked using Ethovision XT9 software (Leesburg, VA). The analysis profile was set to express cumulative durations in seconds in which the center-point of the mouse was in either the “Inner Zone” or the “Outer Zone” of the arena. NSGI mice spent significantly less time in the “Inner Zone” (27.9 ± 16.1) than either the Het (74.7 ± 25.5) or WT (79.3 ± 24.8) mice (P < 0.01). Het and WT mice showed no significant difference between each other in time spent in either the “Inner Zone” or “Outer Zone (P > 0.05).” No gender differences were seen across the genotypes (data not shown).
Figure 1 Gross phenotype of NSGI mice as compared to WT and Het animals. (a) Representative WT mouse at 32 weeks of age. (b) Representative Het mouse at 32 weeks of age. (c,d) Two representative NSGI mouse at 32 weeks of age. Note the blunting of facial features in c and the coarseness of hair in d. Careful examination of the eyes in d also reveals corneal clouding.
a b
c d
WT
3
MPS I model for stem cell transplantationDC Mendez et al.
Molecular Therapy — Methods & Clinical Development (2015) 14068© 2015 The American Society of Gene & Cell Therapy
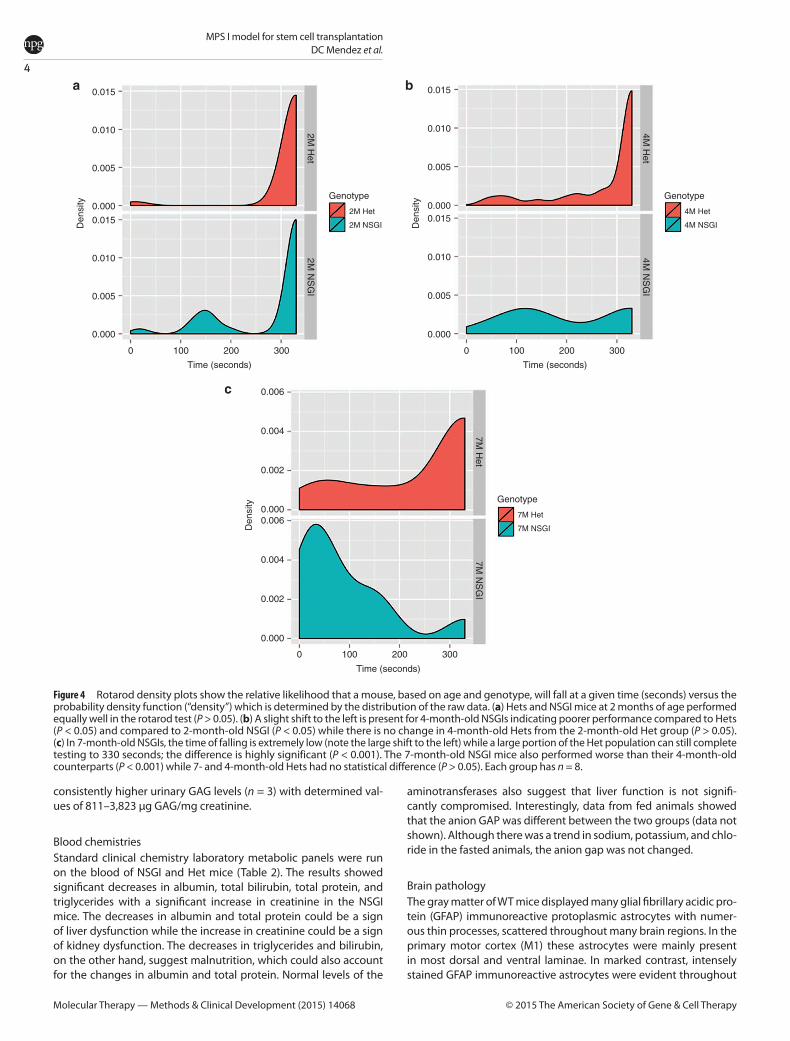
Rotarod We also performed rotarod trials at 2, 4, and 7 months of age (n = 8 for both NSGI and Het at each life stage). At 2 months of age there is no difference between the latency to fall for NSGI or the Het control group (P > 0.05). In Figure 4a, this is represented by the area under the curves centered over the 300–330 second interval of the density plots. The performance of the 4 month NGSI group not only reveals a statistical difference (P < 0.05) with their Het counterparts, but there is also a significant difference (P < 0.05) between the 2-month-old NSGI mice and 4-month-old NSGI mice. Evidence of the shift in rotarod ability is shown in Figure 4b where a shift in area for 4 month NSGI mice is observed while Hets maintain an area over 300–330 seconds. There was a further shift for 7-month-old NSGI mice, with a statistical difference between 4-month-old NSGI and 7-month-old NSGI mice (P < 0.001) in addition to the difference between 7-month-old Hets and age-matched NSGI mice (P < 0.001). Figure 4c shows the complete shift of NSGIs’ ability to complete the task compared to their control group.
Tissue IDUA activity and GAG levelsIDUA activity was determined in the heart, liver, brain, kidney, lung, skeletal muscle, and spleen of Het and NSGI mice (Table 1). As expected, IDUA activity was undetectable in all tissues examined from NSGI animals. In contrast, IDUA activity was readily detectable
in all tissues from Het animals, with variation in activity dependent on the tissue under examination. As in previous IDUA tissue deter-minations of MPS I mouse models,18–20 the highest IDUA activity was seen in the spleen and the lowest activity was seen in the brain. Significant IDUA activity was also detected in the heart and liver of Het animals. GAG concentrations were also measured in the heart, liver, brain, kidney, lung, skeletal muscle, and spleen of Het and NSGI mice (Table 1). Significant differences were found in all tissues for GAG with the exception of muscle GAG. Brain hexosaminidase lev-els in the NSGI mice were significantly elevated compared to Hets, a finding that is similar to that seen in human cases of MPS I.21
Urinary GAG excretionGAG excretion was measured in the urine of WT (n = 1), Het (n = 3), and NSGI mice (n = 4). Urinary GAG excretion by NSGI mice was consistently higher (fivefold) than that excreted by WT or Het mice (Table 1). No significant differences in urinary GAG levels were seen between WT and Het animals. The GAG level determined for the WT animal of 286 µg GAG/mg creatinine fell within the range of 28.4–328 µg GAG/mg creatinine as determined for the Het ani-mals. In contrast to both WT and Het groups, NSGI animals showed
Figure 2 CT images of (a) Het (+/−) and (b) NSGI (−/−) mice at 48 weeks of age. Notice the contracture of the limbs and the marked kyphosis (arrow) in the NSGI mouse. (c–e) Macroscopic photographs of WT (+/+) compared to NSGI (−/−) mouse corneas showing clear and transparent normal cornea in the WT and severely cloudy corneas in the NSGI mouse (arrows). (f,g) Confocal reflectance micrographs of WT (+/+) and NSGI (−/−) showing normal light scattering from the stroma and nerves in WT cornea compared to marked light scattering from stromal keratocytes containing inclusion bodies in the NSGI cornea.
a
c
f g
d e
b+/− −/−
−/− −/−+/+
−/−+/+
100 µm
Figure 3 Open field and novel object recognition testing. (a) Open field exploration tested at 6 months of age comparing WT (n = 5), Het (n = 5), and NSGI (n = 5) mice. Data are expressed as cumulative durations in seconds when the center points of the mice are in the “inner zone.” Examination of open field center time as a preliminary screen for anxiety-like behavior reveals a significant genotypic difference between NSGI and WT or Het mice. **P < 0.01. (b) NOR memory tested at 6 months of age comparing WT (n = 6), Het (n = 6), and NSGI (n = 6) mice. Data are expressed as discrimination indices (%). A higher discrimination index indicates a preference for the novel object. A significant genotypic difference was seen between NSGI and WT or Het mice. **P < 0.01.
120
100
80
Cum
ulat
ive
dura
tion
(s)
60
40
20
40
30
Dis
crim
inat
ion
inde
x %
20
10
0
Wild-type Heterozygous NSGI
Wild-type Heterozygous NSGI
**
****
**
a
b
4
MPS I model for stem cell transplantationDC Mendez et al.
Molecular Therapy — Methods & Clinical Development (2015) 14068 © 2015 The American Society of Gene & Cell Therapy
consistently higher urinary GAG levels (n = 3) with determined val-ues of 811–3,823 µg GAG/mg creatinine.
Blood chemistriesStandard clinical chemistry laboratory metabolic panels were run on the blood of NSGI and Het mice (Table 2). The results showed significant decreases in albumin, total bilirubin, total protein, and triglycerides with a significant increase in creatinine in the NSGI mice. The decreases in albumin and total protein could be a sign of liver dysfunction while the increase in creatinine could be a sign of kidney dysfunction. The decreases in triglycerides and bilirubin, on the other hand, suggest malnutrition, which could also account for the changes in albumin and total protein. Normal levels of the
aminotransferases also suggest that liver function is not signifi-cantly compromised. Interestingly, data from fed animals showed that the anion GAP was different between the two groups (data not shown). Although there was a trend in sodium, potassium, and chlo-ride in the fasted animals, the anion gap was not changed.
Brain pathologyThe gray matter of WT mice displayed many glial fibrillary acidic pro-tein (GFAP) immunoreactive protoplasmic astrocytes with numer-ous thin processes, scattered throughout many brain regions. In the primary motor cortex (M1) these astrocytes were mainly present in most dorsal and ventral laminae. In marked contrast, intensely stained GFAP immunoreactive astrocytes were evident throughout
Figure 4 Rotarod density plots show the relative likelihood that a mouse, based on age and genotype, will fall at a given time (seconds) versus the probability density function (“density”) which is determined by the distribution of the raw data. (a) Hets and NSGI mice at 2 months of age performed equally well in the rotarod test (P > 0.05). (b) A slight shift to the left is present for 4-month-old NSGIs indicating poorer performance compared to Hets (P < 0.05) and compared to 2-month-old NSGI (P < 0.05) while there is no change in 4-month-old Hets from the 2-month-old Het group (P > 0.05). (c) In 7-month-old NSGIs, the time of falling is extremely low (note the large shift to the left) while a large portion of the Het population can still complete testing to 330 seconds; the difference is highly significant (P < 0.001). The 7-month-old NSGI mice also performed worse than their 4-month-old counterparts (P < 0.001) while 7- and 4-month-old Hets had no statistical difference (P > 0.05). Each group has n = 8.
0.015
0.010
0.005
0.000
0.015
Den
sity
0.010
0.005
0.006
0.004
0.002
0.000
Den
sity
0.006
0.004
0.002
0.000
0.000
0 100 200 300
0.015
0.010
0.005
2M H
et2M
NS
GI
4M H
et4M
NS
GI
7M H
et7M
NS
GI
0.0000.015
Genotype
2M Het
2M NSGI
Genotype
4M Het
4M NSGI
Genotype
7M Het
7M NSGI
Den
sity
0.010
0.005
0.000
0 100 200 300
0 100 200
Time (seconds)
Time (seconds)
300
a
c
b
Time (seconds)
5
MPS I model for stem cell transplantationDC Mendez et al.
Molecular Therapy — Methods & Clinical Development (2015) 14068© 2015 The American Society of Gene & Cell Therapy
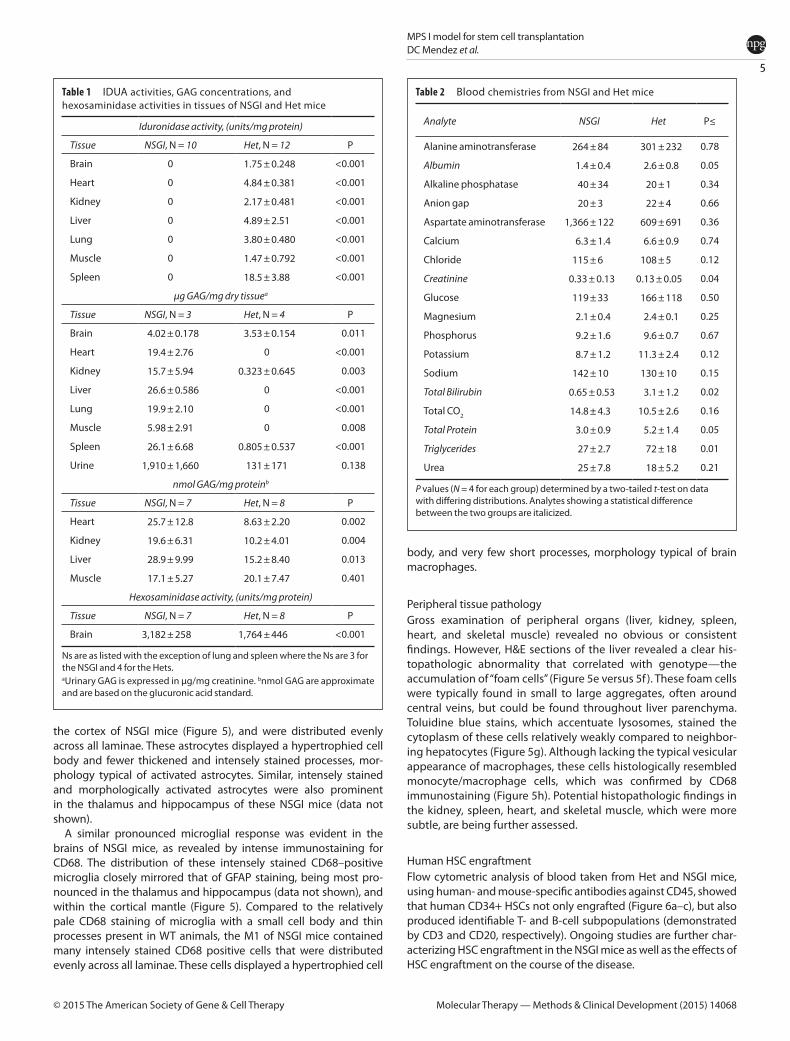
the cortex of NSGI mice (Figure 5), and were distributed evenly across all laminae. These astrocytes displayed a hypertrophied cell body and fewer thickened and intensely stained processes, mor-phology typical of activated astrocytes. Similar, intensely stained and morphologically activated astrocytes were also prominent in the thalamus and hippocampus of these NSGI mice (data not shown).
A similar pronounced microglial response was evident in the brains of NSGI mice, as revealed by intense immunostaining for CD68. The distribution of these intensely stained CD68–positive microglia closely mirrored that of GFAP staining, being most pro-nounced in the thalamus and hippocampus (data not shown), and within the cortical mantle (Figure 5). Compared to the relatively pale CD68 staining of microglia with a small cell body and thin processes present in WT animals, the M1 of NSGI mice contained many intensely stained CD68 positive cells that were distributed evenly across all laminae. These cells displayed a hypertrophied cell
body, and very few short processes, morphology typical of brain macrophages.
Peripheral tissue pathologyGross examination of peripheral organs (liver, kidney, spleen, heart, and skeletal muscle) revealed no obvious or consistent findings. However, H&E sections of the liver revealed a clear his-topathologic abnormality that correlated with genotype—the accumulation of “foam cells” (Figure 5e versus 5f ). These foam cells were typically found in small to large aggregates, often around central veins, but could be found throughout liver parenchyma. Toluidine blue stains, which accentuate lysosomes, stained the cytoplasm of these cells relatively weakly compared to neighbor-ing hepatocytes (Figure 5g). Although lacking the typical vesicular appearance of macrophages, these cells histologically resembled monocyte/macrophage cells, which was confirmed by CD68 immunostaining (Figure 5h). Potential histopathologic findings in the kidney, spleen, heart, and skeletal muscle, which were more subtle, are being further assessed.
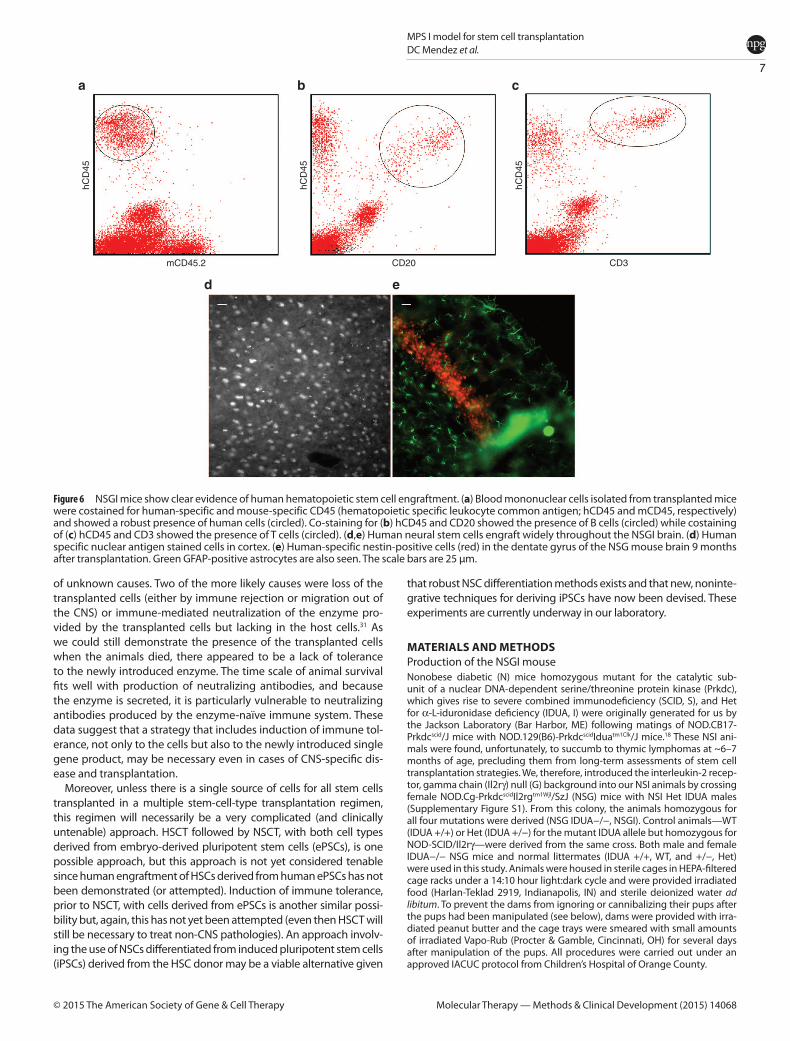
Human HSC engraftmentFlow cytometric analysis of blood taken from Het and NSGI mice, using human- and mouse-specific antibodies against CD45, showed that human CD34+ HSCs not only engrafted (Figure 6a–c), but also produced identifiable T- and B-cell subpopulations (demonstrated by CD3 and CD20, respectively). Ongoing studies are further char-acterizing HSC engraftment in the NSGI mice as well as the effects of HSC engraftment on the course of the disease.
Table 1 IDUA activities, GAG concentrations, and hexosaminidase activities in tissues of NSGI and Het mice
Iduronidase activity, (units/mg protein)
Tissue NSGI, N = 10 Het, N = 12 P
Brain 0 1.75 ± 0.248 <0.001
Heart 0 4.84 ± 0.381 <0.001
Kidney 0 2.17 ± 0.481 <0.001
Liver 0 4.89 ± 2.51 <0.001
Lung 0 3.80 ± 0.480 <0.001
Muscle 0 1.47 ± 0.792 <0.001
Spleen 0 18.5 ± 3.88 <0.001
µg GAG/mg dry tissuea
Tissue NSGI, N = 3 Het, N = 4 P
Brain 4.02 ± 0.178 3.53 ± 0.154 0.011
Heart 19.4 ± 2.76 0 <0.001
Kidney 15.7 ± 5.94 0.323 ± 0.645 0.003
Liver 26.6 ± 0.586 0 <0.001
Lung 19.9 ± 2.10 0 <0.001
Muscle 5.98 ± 2.91 0 0.008
Spleen 26.1 ± 6.68 0.805 ± 0.537 <0.001
Urine 1,910 ± 1,660 131 ± 171 0.138
nmol GAG/mg proteinb
Tissue NSGI, N = 7 Het, N = 8 P
Heart 25.7 ± 12.8 8.63 ± 2.20 0.002
Kidney 19.6 ± 6.31 10.2 ± 4.01 0.004
Liver 28.9 ± 9.99 15.2 ± 8.40 0.013
Muscle 17.1 ± 5.27 20.1 ± 7.47 0.401
Hexosaminidase activity, (units/mg protein)
Tissue NSGI, N = 7 Het, N = 8 P
Brain 3,182 ± 258 1,764 ± 446 <0.001
Ns are as listed with the exception of lung and spleen where the Ns are 3 for the NSGI and 4 for the Hets.aUrinary GAG is expressed in µg/mg creatinine. bnmol GAG are approximate and are based on the glucuronic acid standard.
Table 2 Blood chemistries from NSGI and Het mice
Analyte NSGI Het P≤
Alanine aminotransferase 264 ± 84 301 ± 232 0.78
Albumin 1.4 ± 0.4 2.6 ± 0.8 0.05
Alkaline phosphatase 40 ± 34 20 ± 1 0.34
Anion gap 20 ± 3 22 ± 4 0.66
Aspartate aminotransferase 1,366 ± 122 609 ± 691 0.36
Calcium 6.3 ± 1.4 6.6 ± 0.9 0.74
Chloride 115 ± 6 108 ± 5 0.12
Creatinine 0.33 ± 0.13 0.13 ± 0.05 0.04
Glucose 119 ± 33 166 ± 118 0.50
Magnesium 2.1 ± 0.4 2.4 ± 0.1 0.25
Phosphorus 9.2 ± 1.6 9.6 ± 0.7 0.67
Potassium 8.7 ± 1.2 11.3 ± 2.4 0.12
Sodium 142 ± 10 130 ± 10 0.15
Total Bilirubin 0.65 ± 0.53 3.1 ± 1.2 0.02
Total CO2 14.8 ± 4.3 10.5 ± 2.6 0.16
Total Protein 3.0 ± 0.9 5.2 ± 1.4 0.05
Triglycerides 27 ± 2.7 72 ± 18 0.01
Urea 25 ± 7.8 18 ± 5.2 0.21
P values (N = 4 for each group) determined by a two-tailed t-test on data with differing distributions. Analytes showing a statistical difference between the two groups are italicized.
6
MPS I model for stem cell transplantationDC Mendez et al.
Molecular Therapy — Methods & Clinical Development (2015) 14068 © 2015 The American Society of Gene & Cell Therapy
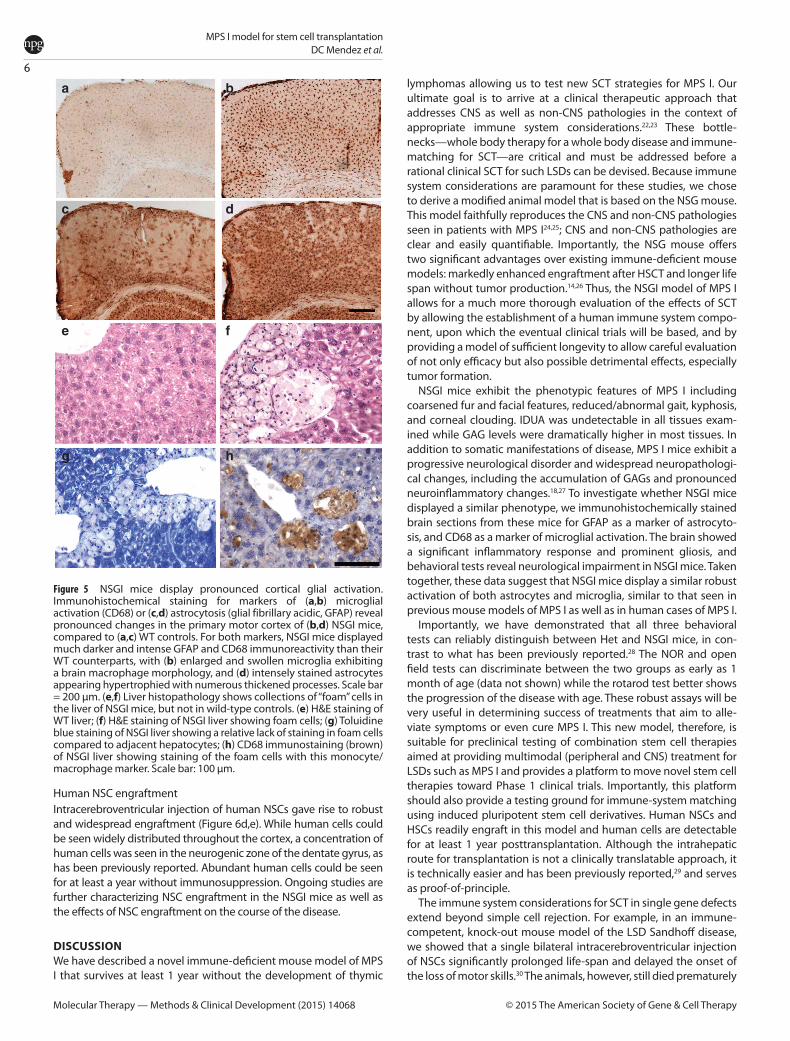
Human NSC engraftmentIntracerebroventricular injection of human NSCs gave rise to robust and widespread engraftment (Figure 6d,e). While human cells could be seen widely distributed throughout the cortex, a concentration of human cells was seen in the neurogenic zone of the dentate gyrus, as has been previously reported. Abundant human cells could be seen for at least a year without immunosuppression. Ongoing studies are further characterizing NSC engraftment in the NSGI mice as well as the effects of NSC engraftment on the course of the disease.
DISCUSSIONWe have described a novel immune-deficient mouse model of MPS I that survives at least 1 year without the development of thymic
lymphomas allowing us to test new SCT strategies for MPS I. Our ultimate goal is to arrive at a clinical therapeutic approach that addresses CNS as well as non-CNS pathologies in the context of appropriate immune system considerations.22,23 These bottle-necks—whole body therapy for a whole body disease and immune-matching for SCT—are critical and must be addressed before a rational clinical SCT for such LSDs can be devised. Because immune system considerations are paramount for these studies, we chose to derive a modified animal model that is based on the NSG mouse. This model faithfully reproduces the CNS and non-CNS pathologies seen in patients with MPS I24,25; CNS and non-CNS pathologies are clear and easily quantifiable. Importantly, the NSG mouse offers two significant advantages over existing immune-deficient mouse models: markedly enhanced engraftment after HSCT and longer life span without tumor production.14,26 Thus, the NSGI model of MPS I allows for a much more thorough evaluation of the effects of SCT by allowing the establishment of a human immune system compo-nent, upon which the eventual clinical trials will be based, and by providing a model of sufficient longevity to allow careful evaluation of not only efficacy but also possible detrimental effects, especially tumor formation.
NSGI mice exhibit the phenotypic features of MPS I including coarsened fur and facial features, reduced/abnormal gait, kyphosis, and corneal clouding. IDUA was undetectable in all tissues exam-ined while GAG levels were dramatically higher in most tissues. In addition to somatic manifestations of disease, MPS I mice exhibit a progressive neurological disorder and widespread neuropathologi-cal changes, including the accumulation of GAGs and pronounced neuroinflammatory changes.18,27 To investigate whether NSGI mice displayed a similar phenotype, we immunohistochemically stained brain sections from these mice for GFAP as a marker of astrocyto-sis, and CD68 as a marker of microglial activation. The brain showed a significant inflammatory response and prominent gliosis, and behavioral tests reveal neurological impairment in NSGI mice. Taken together, these data suggest that NSGI mice display a similar robust activation of both astrocytes and microglia, similar to that seen in previous mouse models of MPS I as well as in human cases of MPS I.
Importantly, we have demonstrated that all three behavioral tests can reliably distinguish between Het and NSGI mice, in con-trast to what has been previously reported.28 The NOR and open field tests can discriminate between the two groups as early as 1 month of age (data not shown) while the rotarod test better shows the progression of the disease with age. These robust assays will be very useful in determining success of treatments that aim to alle-viate symptoms or even cure MPS I. This new model, therefore, is suitable for preclinical testing of combination stem cell therapies aimed at providing multimodal (peripheral and CNS) treatment for LSDs such as MPS I and provides a platform to move novel stem cell therapies toward Phase 1 clinical trials. Importantly, this platform should also provide a testing ground for immune-system matching using induced pluripotent stem cell derivatives. Human NSCs and HSCs readily engraft in this model and human cells are detectable for at least 1 year posttransplantation. Although the intrahepatic route for transplantation is not a clinically translatable approach, it is technically easier and has been previously reported,29 and serves as proof-of-principle.
The immune system considerations for SCT in single gene defects extend beyond simple cell rejection. For example, in an immune-competent, knock-out mouse model of the LSD Sandhoff disease, we showed that a single bilateral intracerebroventricular injection of NSCs significantly prolonged life-span and delayed the onset of the loss of motor skills.30 The animals, however, still died prematurely
Figure 5 NSGI mice display pronounced cortical glial activation. Immunohistochemical staining for markers of (a,b) microglial activation (CD68) or (c,d) astrocytosis (glial fibrillary acidic, GFAP) reveal pronounced changes in the primary motor cortex of (b,d) NSGI mice, compared to (a,c) WT controls. For both markers, NSGI mice displayed much darker and intense GFAP and CD68 immunoreactivity than their WT counterparts, with (b) enlarged and swollen microglia exhibiting a brain macrophage morphology, and (d) intensely stained astrocytes appearing hypertrophied with numerous thickened processes. Scale bar = 200 µm. (e,f) Liver histopathology shows collections of “foam” cells in the liver of NSGI mice, but not in wild-type controls. (e) H&E staining of WT liver; (f) H&E staining of NSGI liver showing foam cells; (g) Toluidine blue staining of NSGI liver showing a relative lack of staining in foam cells compared to adjacent hepatocytes; (h) CD68 immunostaining (brown) of NSGI liver showing staining of the foam cells with this monocyte/macrophage marker. Scale bar: 100 µm.
a b
c d
e f
g h
7
MPS I model for stem cell transplantationDC Mendez et al.
Molecular Therapy — Methods & Clinical Development (2015) 14068© 2015 The American Society of Gene & Cell Therapy
of unknown causes. Two of the more likely causes were loss of the transplanted cells (either by immune rejection or migration out of the CNS) or immune-mediated neutralization of the enzyme pro-vided by the transplanted cells but lacking in the host cells.31 As we could still demonstrate the presence of the transplanted cells when the animals died, there appeared to be a lack of tolerance to the newly introduced enzyme. The time scale of animal survival fits well with production of neutralizing antibodies, and because the enzyme is secreted, it is particularly vulnerable to neutralizing antibodies produced by the enzyme-naïve immune system. These data suggest that a strategy that includes induction of immune tol-erance, not only to the cells but also to the newly introduced single gene product, may be necessary even in cases of CNS-specific dis-ease and transplantation.
Moreover, unless there is a single source of cells for all stem cells transplanted in a multiple stem-cell-type transplantation regimen, this regimen will necessarily be a very complicated (and clinically untenable) approach. HSCT followed by NSCT, with both cell types derived from embryo-derived pluripotent stem cells (ePSCs), is one possible approach, but this approach is not yet considered tenable since human engraftment of HSCs derived from human ePSCs has not been demonstrated (or attempted). Induction of immune tolerance, prior to NSCT, with cells derived from ePSCs is another similar possi-bility but, again, this has not yet been attempted (even then HSCT will still be necessary to treat non-CNS pathologies). An approach involv-ing the use of NSCs differentiated from induced pluripotent stem cells (iPSCs) derived from the HSC donor may be a viable alternative given
that robust NSC differentiation methods exists and that new, noninte-grative techniques for deriving iPSCs have now been devised. These experiments are currently underway in our laboratory.
MATeRIAlS AND MeTHODSProduction of the NSGI mouseNonobese diabetic (N) mice homozygous mutant for the catalytic sub-unit of a nuclear DNA-dependent serine/threonine protein kinase (Prkdc), which gives rise to severe combined immunodeficiency (SCID, S), and Het for α-L-iduronidase deficiency (IDUA, I) were originally generated for us by the Jackson Laboratory (Bar Harbor, ME) following matings of NOD.CB17-Prkdcscid/J mice with NOD.129(B6)-PrkdcscidIduatm1Clk/J mice.18 These NSI ani-mals were found, unfortunately, to succumb to thymic lymphomas at ~6–7 months of age, precluding them from long-term assessments of stem cell transplantation strategies. We, therefore, introduced the interleukin-2 recep-tor, gamma chain (Il2rγ) null (G) background into our NSI animals by crossing female NOD.Cg-PrkdcscidIl2rgtm1Wjl/SzJ (NSG) mice with NSI Het IDUA males (Supplementary Figure S1). From this colony, the animals homozygous for all four mutations were derived (NSG IDUA−/−, NSGI). Control animals—WT (IDUA +/+) or Het (IDUA +/−) for the mutant IDUA allele but homozygous for NOD-SCID/Il2rγ—were derived from the same cross. Both male and female IDUA−/− NSG mice and normal littermates (IDUA +/+, WT, and +/−, Het) were used in this study. Animals were housed in sterile cages in HEPA-filtered cage racks under a 14:10 hour light:dark cycle and were provided irradiated food (Harlan-Teklad 2919, Indianapolis, IN) and sterile deionized water ad libitum. To prevent the dams from ignoring or cannibalizing their pups after the pups had been manipulated (see below), dams were provided with irra-diated peanut butter and the cage trays were smeared with small amounts of irradiated Vapo-Rub (Procter & Gamble, Cincinnati, OH) for several days after manipulation of the pups. All procedures were carried out under an approved IACUC protocol from Children’s Hospital of Orange County.
Figure 6 NSGI mice show clear evidence of human hematopoietic stem cell engraftment. (a) Blood mononuclear cells isolated from transplanted mice were costained for human-specific and mouse-specific CD45 (hematopoietic specific leukocyte common antigen; hCD45 and mCD45, respectively) and showed a robust presence of human cells (circled). Co-staining for (b) hCD45 and CD20 showed the presence of B cells (circled) while costaining of (c) hCD45 and CD3 showed the presence of T cells (circled). (d,e) Human neural stem cells engraft widely throughout the NSGI brain. (d) Human specific nuclear antigen stained cells in cortex. (e) Human-specific nestin-positive cells (red) in the dentate gyrus of the NSG mouse brain 9 months after transplantation. Green GFAP-positive astrocytes are also seen. The scale bars are 25 µm.
hCD
45
hCD
45
mCD45.2
hCD
45
CD20 CD3
a
d e
b c
8
MPS I model for stem cell transplantationDC Mendez et al.
Molecular Therapy — Methods & Clinical Development (2015) 14068 © 2015 The American Society of Gene & Cell Therapy
Mouse genotype determinationMouse genotype was determined with a PCR-based assay for both IDUA and Il2rγ (Supplementary Figure S2) using gene-specific primer sets on DNA extracted from either mouse tail tips or ear punches at the time of wean-ing or the day of birth. Briefly, a small piece (1–2 mm) of the tail or ear is placed in a PCR tube with 200 µl of 50 mmol/l NaOH and heated to 98 °C for 1 hour in a PCR thermocycler (Applied Biosystems 2720, Life Technologies, Carlsbad, CA). Following reduction of the temperature to 15 °C, 20 µl of a 1 mol/l Tris–HCl solution, pH 8.0, is added and the sample is spun at 4,000 g for 3 minutes. 2 µl aliquots are used as template DNA in a final PCR reaction volume of 50 µl.
For IDUA determination, primer pairs oIMR1451 (5’-GGAACTTTGAGACTT GGAATGAACCAG-3’ common forward), and oIMR1452 (5’-CATTGTAAATAGG GGTATCCTTGAACTC-3’ WT reverse) or oIMR1453 (5’-GGATTGGGAAGACAA TAGCAGGCATGCT-3’ mutant reverse) were used in a PCR reaction that involved an initial DNA denaturation at 94 °C for 3 minutes, followed by 35 cycles of denaturation at 94 °C for 30 seconds, primer annealing at 65 °C for 1 minute and by extension at 72 °C for 1 minute.
For Il2rγ determination, primers oIMR5330 (5’-GTGGGTAGCCAGCTCTT CAG-3’ common forward), oIMR5331 (5’-CCTGGAGCTGGACAACAAAT-3’ WT reverse) and oIMR5332 (5’-GCCAGAGGCCACTTGTGTAG-3’ mutant reverse) were used in a PCR reaction that involved an initial DNA denaturation at 94 °C for 3 minutes, followed by 35 cycles of denaturation at 94 °C for 30 sec-onds, primer annealing at 68 °C for 1 minute and by extension at 72 °C for 1 minute. After a final extension at 72 °C for 2 minutes and cooling to 4 °C all PCR products were separated by gel electrophoresis on a 1.5% agarose gel containing ethidium bromide prior to visualization with UV light.
Corneal evaluationCorneal clarity was evaluated in four mice (two WT and two NSGI) and mac-roscopically documented using a Zeiss Discovery.V12 Stereo Microscope (Pleasanton, CA) with attached Nikon D200 digital camera back (Tokyo, Japan). Eyes were then enucleated from terminally anesthetized mice, placed in cold phosphate buffered saline and mounted on the stage of the Zeiss LSM 510 Meta. Confocal reflectance images were obtained using a 40×, NA 1.3 Plan-Neofluor Zeiss objective. Images through the entire cornea at 2 micron steps were collected and representative images were selected.
CT imagingFor whole animal imaging, animals were injected with a lethal dose of sodium pentobarbital (250 mg/kg, i.p.). After the disappearance of the toe-pinch withdrawal reflex, the chest was opened and the animals were trans-cardially perfused with lactated Ringer’s solution for 20 seconds (150 mm Hg) followed by 120 seconds perfusion with fresh 4% paraformaldehyde in PBS, pH 7.4.
The computed tomography (CT) system is comprised of a cone beam X-ray generator and a flat panel X-ray detector array. Cone beam X-ray pro-jection images are acquired at up to 512 equally spaced view angles. The distance from the center of the reconstruction circle to both the source and detector are independently adjustable allowing for a wide range of magni-fications. For the images presented here, the X-ray tube was operated at 50 kVp and 0.5 mA. The flat panel sensor had an active area of 12 × 12 cm and pixel size of 50 µm (c7942GP, Hamamatsu Photonics, Hamamatsu, Japan). Planar images were acquired from 256 projections over 3,600 degree rota-tion in a step and shoot mode. Trans-axial images were reconstructed using a Feldcamp cone beam filtered back projection algorithm. A standard box car filter was used.
Behavioral studiesArena for open field and NOR behaviors. These tests were conducted over a 3-day period using a custom-made open field arena (27.3 × 27.3 × 20.3 cm) composed of clear acrylic walls and base with aluminum supports resting on a white polypropylene base (Med Associates, St Albans, VT) The base was cut and modified to fit a physical layout of four adjacent chambers to measure open field and NOR behavior for four mice simultaneously per recording session (Supplementary Figures S3 and S4). An orientating blue streak was placed on the front end of the chamber. On the opposite side of the blue streak was a partition which allowed the immunodeficient mice to be loaded into the chamber while in a laminar flow hood prior to be-ing moved back by a cart into the behavioral room into its appropriate slot on the base with the aluminum supports. When all four mice were placed
back, the partitions were withdrawn simultaneously and the entire session was video-taped. The different genotypes (WT, Het, and NSGI) within the experimental mice were sex-matched and age-matched.
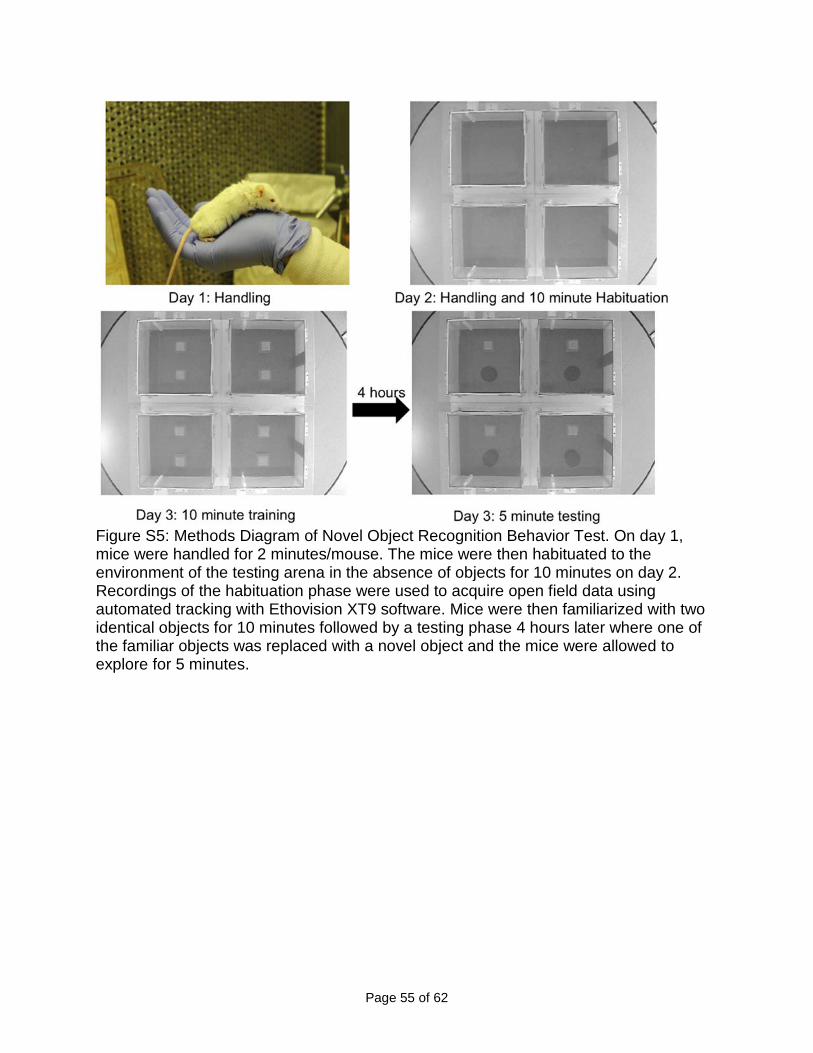
NOR. Training and testing methods for NOR memory test were (Supplemen-tary Figure S5) adopted and modified from the published literature.13,32,33 Mice were first handled one at a time by placing the mouse on one hand while holding onto the tail and letting go only if the mouse was fairly calm for 2 minutes/mouse for 2 days. By the second day, the mice were usually comfortable sitting on the hand thus allowing 2 mice to be handled at a time for 2 minutes. After handling on the second day, the mice were habitu-ated to the arena for 10 minutes at a time without any objects present. The third day was divided into two phases: training (familiarization) and test-ing (NOR). During the training phase, two identical objects (square tea light candle holder 5.08 cm height × 5.08 cm width, filled with hardened cement) were placed in the center of the arena equidistant from the walls and each other. The mice were loaded into the arena as described above and allowed to explore the objects for a total of 10 minutes. After the training session, the mice in the chambers were placed back into the laminar flow hood and returned to their home-cage for 4 hour retention time before testing. For testing, one of the familiar replicates was replaced with a novel object (alu-minum canister 6.045 cm height × 35.56 cm width × 7.3152 cm diameter, filled with hardened cement) and the mice were allowed to explore the objects for 5 minutes. The chambers were disinfected as described in the Supplementary Materials and objects were sprayed with 70% ethanol and allowed to dry overnight in the laminar flow hood.
Exploration was manually scored for cumulative duration (seconds) per object and data was used to calculate the discrimination index [DI% = (time in novel object zone − time in familiar object zone)/(time in novel object zone + time in familiar object zone) × 100]. Exploration was counted when a mouse had its nose oriented towards the object (within plane of the object) within a distance of 2 cm and/or when the nose was touching the object. Exploration was not counted if a mouse was turning around, sitting on top and/or climbing over an object. Exploration also was not counted if the mouse was looking over the object.
Open field. During the habituation phase on day 2, the session was recorded using Noldus Ethovision XT9 software (Wageningen, The Netherlands) to track open field behavior (Supplementary Figure S6). Criteria were set to re-cord four arenas at a time with center-point, nose point, and tail base detec-tion. Arena settings were designed so that each arena was divided into an “outer zone” and a central “inner zone” for exploration. Trial control settings were set to initiate tracking 7.0 seconds after playing the recording to allow sufficient time to withdraw the partitions. The trial control settings were also set to automatically end the trial after a delay of 10.0 minutes after the tracking was started. Acquisition settings were set to record the video only and complete the tracking later on the recorded video files. After all of the trials were recorded, the media files were imported into the corresponding Ethovision data file to be tracked. A background image was taken of the media files to set and apply the appropriate arena settings and calibrate for the size scale of the arena. For detection settings, gray scaling was the optimal detection method since there was a good contrast between the animal and the background. The range was adjusted as necessary to ensure complete tracking of the mice without background noise which could af-fect the results. All of the tracks were selected for analysis when the mouse center-point was either in the “inner zone” or the “outer zone.” The results were then automatically calculated with the data expressed as cumulative duration (seconds) for each zone and exported to an excel file. The data was then analyzed for significant differences in exploration of the “outer zone” and “inner zone” across genotypes.
Statistics for open field and NOR. The Dixon q test was first used in R 3.0.0 to eliminate any single low or high outlier within the data set at the 95% con-fidence level. The data was expressed as discrimination index (%) for NOR and cumulative duration (s) for open field and was statistically analyzed in R using two-way ANOVA for multiple comparisons followed by Tukey’s Post Hoc analysis. Data was considered statistically significant when P ≤ 0.05.
Rotarod. A five station rotarod treadmill (Med Associates), housed in a lami-nar flow hood, was used. The apparatus has five lanes or zones each 5.7 cm across with partitions 24.8 cm in diameter to prevent mice from interact-ing with each other. The suspended beam is 3.2 cm in diameter with rubber grooves to provide a suitable grip for the mouse and 16.5 cm high with a fixed or accelerating rotational capacity. Each lane has a photobeam placed at ground level to record the exact time of the fall.
9
MPS I model for stem cell transplantationDC Mendez et al.
Molecular Therapy — Methods & Clinical Development (2015) 14068© 2015 The American Society of Gene & Cell Therapy
Mice were selected according to age and genotype; group sizes varied from test to test consisting of anywhere between 2–5 participants. Day 1 comprised training for the mice. Each mouse was placed in secluded zones on an already rotating elevated beam (speed = 4 rpm). Once all the mice had established secure footing (not jumping off, not observing the partitions and were facing the opposite direction of the rotating beam away from the handler) the test would begin at an accelerated rate (4 rpm rising to 40 rpm over 300 seconds). The trial was completed once the mouse fell off the beam or 300 seconds had passed. The mice were immediately returned to their cage after their trial was completed. When all mice had fallen or completed 300 seconds, a 10 minute resting time was allotted. All times and speeds are recorded as well as any pertinent observations made about the mouse’s desire to perform or not perform the task at hand. The test was repeated three times.
On day 2, trials for the mice were completed. Each mouse was placed in a secluded zone on an already rotating elevated beam (speed = 32 rpm). As soon as an individual mouse had established secure footing, the test would begin at a constant rate of 32 rpm over 330 seconds. The next mouse would then be placed in the adjacent zone (this would result in a staggered test-ing format). Once a mouse had fallen or completed 330 seconds, it would be placed immediately back into its cage. Time and speed were recorded as well as observations. An intertrial interval of 10 minutes was allowed after all mice had completed their test. The test was repeated four times. The aver-age latency to fall from the rotating beam was calculated using day 2 trials. Testing on consecutive days revealed a learning/training ability in both Het and NSGI mice that decreased the rotarod’s ability to discriminate between the two groups, so a single testing session strategy was employed.
Special attention was given to the disinclination of individual mice to per-form the rotarod test to criterion on day 2. Mice that held onto the beam while it rotated for three consecutive rotations were considered to have fallen and the time and speed would be recorded and the mouse would be placed back into its cage. Mice that attempted to jump lanes, climbing a divider that may or may not have resulted in a fall, for two or more consecu-tive tests were disqualified, all times were omitted from the overall inter-pretation and a replacement was selected. “Jumpers” or mice that used the walls to lower themselves off of the beam for two or more consecutive tests were also disqualified, all data was removed from the pool and a comparable replacement was chosen.
Data analysis and statistics for rotarod studies. Density plots were made using R 3.0.0 and package ggplot2. The probability density function was determined for each condition. The x-axis represents time and the y-axis represents the probability differential. Therefore, the area under the curve at a specific time interval represents the probability of obtaining that time interval from the experiment. The data was also statistically analyzed in R using two-way ANOVA for multiple comparisons followed by Tukey’s Post Hoc analysis. Data was considered statistically significant when P ≤ 0.05.
Tissue samplingFor analysis of human HSC and NSC engraftment and analysis of tissue GAG, IDUA, and hexosaminidase levels, animals were deeply anesthetized with isoflurane. After opening the chest and abdomen, blood was drawn directly from the heart and processed as described below and urine was drawn directly from the bladder and frozen at −80 °C. Subsequently, samples of brain, liver, heart, kidney, spleen, and skeletal muscle were taken and frozen at −80 °C or immersion-fixed in neutral buffered paraformaldehyde.
Measurement of IDUA and GAGsTissues were harvested immediately, frozen on dry ice and stored at −80 °C until assayed. Frozen tissue samples were thawed and homogenized in three volumes of PAD buffer (10 mmol/l sodium phosphate, pH 5.8, 0.002% sodium azide, 0.1 mmol/l dithiothreitol) against wet tissue weight. IDUA activity was assessed using 250 µmol/l 4-methylumbelliferyl α-L-iduronide substrate (4-MUI, Glycosynth, Warrington, Cheshire, UK) as previously described,34 except that the incubation temperature was 37 °C and the incu-bation time was 0.5 hour. Hexosaminidase activity was assessed using 1.25 mmol/l 4-methylumbelliferyl-N-acetyl-β-D-glucosaminide (EMD Millipore Chemicals, Billerica, MA) substrate, incubation time 0.5 hour at a tempera-ture of 37 °C. Protein concentrations in the extracts were determined by the Bradford method using reagents from Bio-Rad Laboratories (Hercules, CA). One unit is defined as the activity catalyzing the hydrolysis of 1 nmol sub-strate in 1 hour. Results were expressed as units per mg of protein.
Urine and tissue GAGs were measured using an Alcian blue dye binding method,35 modified as previously published34 or Carbazole Assay.36 Urinary creatinine was quantified using the direct endpoint creatinine reagent set (Teco Diagnostics, Anaheim, CA) for creatinine and measured by spectro-photometer at 510 nm on the BioSpec-1601 DNA/protein/enzyme ana-lyzer (Shimadzu Scientific Instruments, Columbia, MD). Tissue results were expressed as µg GAG per mg dry weight of tissue or nmol GAG/mg protein and urine results were expressed as µg GAG per mg of creatinine.
Blood chemistriesMice were fasted for 16–18 hours prior to blood drawing. Whole blood sam-ples were collected by terminal cardiac blood draw for each mouse using a 23 g butterfly needle precoated with lithium heparin (Lithium Heparin salt from porcine intestinal mucosa; Sigma Aldrich, St. Louis, MO). The blood was collected in a BD Microtainer green top tube (Franklin Lakes, NJ) with lithium heparin additive and put on ice. Using an adapter, the blood was spun at 3,000 g for 10 minutes. The samples were processed in a biosafety cabinet and serum was carefully pipetted off and put into 1.5 ml screw-top blood collection tubes. Serum was then stored at −80 °C until they were analyzed. On day of analysis, samples were thawed and delivered immediately to CHOC Laboratory Services for analysis. The serum chemistry tests were run on a Vitros 5600 instrument from Ortho Clinical Diagnostics.
HistologyFor fixed tissues other than brain, dehydrations were done using an auto-mated processor (Leica TP1020, Leitz-Park Wetzlar, Germany) or manually using isopropanol rather than ethanol. (Isopropanol caused less tissue shrinkage and brittleness in our hands.) Embedding was performed using an embedding station (Leica EG1150). 4–5 um thick microtome sections (Leica RM2255) were stained and mounted manually for hematoxylin and eosin, toluidine blue, and immunohistochemistry (CD68 antibody) using standard and manufacturer protocols.
For brain histology, NSGI and control mice were perfused and tissue pro-cessed for histology according to established protocols.37–39 Briefly, mice were deeply anesthetized with sodium pentobarbitone (1 g/kg) and transcardially perfused with phosphate buffered saline (PBS) (Sigma-Aldrich, Poole, UK), followed by a freshly made and filtered solution of 4% Paraformaldehyde (PFA) in 0.1 mol/l phosphate buffer, pH 7.4. Brains were removed and post-fixed in 4% PFA at 4 °C for 24 hours, then bisected along the midline. Single hemispheres were cryoprotected in 30% sucrose, 0.5% sodium azide in 50 mmol/l tris buffered saline (TBS), pH 7.6 prior to cutting frozen sections. 40 µm frozen coronal sections through the rostrocaudal extent of the cortical mantle were collected one per well in 96 well plates containing a cryopro-tective solution (30% ethylene glycol (Sigma-Aldrich), 15% sucrose, 0.05% sodium azide in TBS). All subsequent histological analyses were performed blind to genotype.
Immunostaining for glial markers. A standard 3,3’-diaminobenzidine tetrahydro-chloride (DAB) based immunohistochemical protocol was used to assess the relative level of glial activation.37,40 Briefly, endogenous peroxidase activity was quenched in 1% hydrogen peroxidase (VWR, Radnor, PA) in TBS for 15 minutes. Sections were then rinsed in TBS and blocked in 15% normal serum (Vector, Northampton, UK) in TBS with 0.3% Triton-X (TBS-T, Sigma-Aldrich), before in-cubation in the appropriate primary antibody; polyclonal rabbit anti-GFAP (Da-koCytomation 1:4,000, Ely, UK), rat anti-CD68 (Serotec 1:2,000, Raleigh, NC), in 10% normal serum in TBS-T overnight at 4 °C. Sections were next rinsed in TBS and incubated with the appropriate biotinylated secondary antibodies: swine anti-rabbit (DakoCytomation 1:1,000, Carpinteria, CA), rabbit anti-rat (Vector 1:200) for 2 hours at room temperature. Subsequently, sections were rinsed in TBS, followed by incubation in avidin-biotin-peroxidase complex (Vectastain Elite ABC kit, Vector, Labs, Burlingame, CA 1:1,000) in TBS for 2 hours and then rinsed in TBS. To visualize immunoreactivity, sections were incubated in 0.05% DAB (Sigma-Aldrich) containing 0.001% hydrogen peroxide in TBS for up to 25 minutes, depending on the antigen and then rinsed in ice-cold TBS. Finally, sec-tions were mounted on gelatin-chrome-coated Superfrost microscope slides (VWR), air-dried overnight, cleared in xylene, and coverslipped with DPX (VWR).
Hematopoietic stem cell transplantationThe isolation of HSCs from umbilical cord blood (UCB) and subsequent CD34+ HSC isolation was as previously described.41 As the neonatal liver is potentially a more efficient site of hematopoietic stem cell development and
10
MPS I model for stem cell transplantationDC Mendez et al.
Molecular Therapy — Methods & Clinical Development (2015) 14068 © 2015 The American Society of Gene & Cell Therapy
engraftment and the NSG mouse is more completely NK-deficient, poten-tially making it a better model for in vivo differentiation of human HSCs, we injected CD34+ (0.1–1.0 × 10⁶ cells) human HSCs intrahepatically29 on the day of birth into each cryoanesthetized pup. This regimen required no con-ditioning (radiation or chemotherapy) prior to transplantation. Cells were resuspended in 25 µl DPBS per pup to be injected and 25 µl of cell solu-tion was injected directly into the liver of the unconditioned cryoanesthe-tized pups, using 31 G × 8 mm BD Ultra-Fine II insulin syringes, as previously described.29 Pups were warmed before returning them to their dams.
Neural stem cell transplantationHuman NSCs were isolated from cadaveric postnatal brain cortices and grown either as adherent cultures in flasks coated with 10 µg/ml fibronec-tin or in suspension as neurospheres as previously described41,42 and under a CHOC-approved IRB protocol. On the day of birth, pups (and unaffected littermate controls) received bilateral intracerebroventricular injections of a suspension of NSCs (4–5 × 10⁴ cells/µl in PBS with 0.05% trypan blue) as pre-viously described30 using a foot-controlled Eppendorf Femto microinjector (Hamburg, Germany). The lateral ventricles of cryoanesthetized pups were visualized by transillumination of the head; 2 µl of the cellular suspension was expelled gently via a glass micropipette inserted transcutaneously into each ventricle. After warming them on a sterile warm water bottle, the pups were returned to the dams.
Assessment of HSC engraftment by flow cytometryQuantitation of specific cell surface markers by flow cytometry was done to assess HSC engraftment using human-specific and mouse-specific CD45 antibodies. Costaining with CD3 and CD20 was used to determine if there was any T- or B-cell differentiation, respectively, of human HSCs in vivo in the mouse.
Assessment of NSC engraftment by immunohistochemistryImmersion-fixed brains were first cryoprotected by immersion in cold 30% sucrose in PBS for 24–48 hours. Cryoprotected brains were embedded and frozen at −80 °C in OCT (Ted Pella, Redding, CA) and then mounted, warmed to −20 °C and sectioned in a cryostat at 20 µm. Cryostat sections were blocked and permeabilized with 3% donkey serum and 0.1% triton X-100 in PBS, incubated with primary antibody overnight at 4 °C, and then incubated with Alexa 488 goat antirabbit and/or Alexa 594 goat anti-mouse secondary antibodies (Molecular probes, Eugene, OR). Cell type-specific antigens were detected using antibodies against human-specific nestin or human-specific nuclear antigen.
CONFlICT OF INTeReSTThe authors declare no conflict of interest.
ACKNOWleDGMeNTSWe gratefully acknowledge the gift of NOD.SCID.Il2rγ breeder mice from Leonard Shultz (Jackson Laboratory). We are grateful to Leonard Sender (Children’s Hospital of Orange County, CHOC) and the staff of the Umbilical Cord Blood (UCB) Bank at CHOC for the UCB samples. We thank Mei Chang (CHOC Division of Hematology) and Vanessa Scarfone (University of California, Irvine, Stem Cell Research Center) for performing flow cytometry and Tien Chang (CHOC) for assistance with the animal husbandry. We also thank Gultekin Gulsen and Kevin Yan (University of California Irvine, Departments of Radiology, Physics and Biomedical Engineering) at the UCI Imaging Center for the CT images. We are especially grateful to Marcelo Wood and Annie Vogel-Ciernia (University of California Irvine, Department of Neurobiology and Behavior) for assisting us in the design of the NOR and open field studies. This work was initially funded by the Cinderella Guild through the CHOC Foundation for Children and Children’s Hospital or Orange County, then the National Institutes of Health (T15HL074286 to P.H.S.) and the California Institute for Regenerative Medicine (TR3-05476 to P.H.S.).
ReFeReNCeS 1. Scott, HS, Bunge, S, Gal, A, Clarke, LA, Morris, CP and Hopwood, JJ (1995). Molecular
genetics of mucopolysaccharidosis type I: diagnostic, clinical, and biological implications. Hum Mutat 6: 288–302.
2. Peters, C, Shapiro, EG and Krivit, W (1998). Neuropsychological development in children with Hurler syndrome following hematopoietic stem cell transplantation. Pediatr Transplant 2: 250–253.
3. Roubicek, M, Gehler, J and Spranger, J (1985). The clinical spectrum of alpha-L-iduronidase deficiency. Am J Med Genet 20: 471–481.
4. Krivit, W (2004). Allogeneic stem cell transplantation for the treatment of lysosomal and peroxisomal metabolic diseases. Springer Semin Immunopathol 26: 119–132.
5. Wraith, EJ, Hopwood, JJ, Fuller, M, Meikle, PJ and Brooks, DA (2005). Laronidase treatment of mucopolysaccharidosis I. BioDrugs 19: 1–7.
6. Prasad, VK and Kurtzberg, J (2010). Cord blood and bone marrow transplantation in inherited metabolic diseases: scientific basis, current status and future directions. Br J Haematol 148: 356–372.
7. Dickson, PI and Chen, AH (2011). Intrathecal enzyme replacement therapy for mucopolysaccharidosis I: translating success in animal models to patients. Curr Pharm Biotechnol 12: 946–955.
8. Cuvelier, GD, Schultz, KR, Davis, J, Hirschfeld, AF, Junker, AK, Tan, R et al. (2009). Optimizing outcomes of hematopoietic stem cell transplantation for severe combined immunodeficiency. Clin Immunol 131: 179–188.
9. Iguchi, A, Kawamura, N, Kobayashi, R, Takezaki, SI, Ohkura, Y, Inamoto, J et al. (2011). Successful reduced-intensity SCT from unrelated cord blood in three patients with X-linked SCID. Bone Marrow Transplant 46: 1526–1531.
10. Dinardo, L, Brown, V, Perez, E, Bunin, N and Sullivan, KE (2012). A single-center study of hematopoietic stem cell transplantation for primary immune deficiencies (PIDD). Pediatr Transplant 16: 63–72.
11. Kumaki, S, Sasahara, Y, Kamachi, Y, Muramatsu, H, Morio, T, Goi, K et al. (2013). B-cell function after unrelated umbilical cord blood transplantation using a minimal-intensity conditioning regimen in patients with X-SCID. Int J Hematol 98: 355–360.
12. Wang, RY, Cambray-Forker, EJ, Ohanian, K, Karlin, DS, Covault, KK, Schwartz, PH et al. (2009). Treatment reduces or stabilizes brain imaging abnormalities in patients with MPS I and II. Mol Genet Metab 98: 406–411.
13. Garcia-Rivera, MF, Colvin-Wanshura, LE, Nelson, MS, Nan, Z, Khan, SA, Rogers, TB et al. (2007). Characterization of an immunodeficient mouse model of mucopolysaccharidosis type I suitable for preclinical testing of human stem cell and gene therapy. Brain Res Bull 74: 429–438.
14. Pearson, T, Greiner, DL and Shultz, LD (2008). Humanized SCID mouse models for biomedical research. Curr Top Microbiol Immunol 324: 25–51.
15. Miura, K, Okada, Y, Aoi, T, Okada, A, Takahashi, K, Okita, K et al. (2009). Variation in the safety of induced pluripotent stem cell lines. Nat Biotechnol 27: 743–745.
16. Ohnuki, M, Takahashi, K and Yamanaka, S (2009). Generation and characterization of human induced pluripotent stem cells. Curr Protoc Stem Cell Biol Chapter 4: Unit 4A.2.
17. Wesselschmidt, RL (2011). The teratoma assay: an in vivo assessment of pluripotency. Methods Mol Biol 767: 231–241.
18. Clarke, LA, Russell, CS, Pownall, S, Warrington, CL, Borowski, A, Dimmick, JE et al. (1997). Murine mucopolysaccharidosis type I: targeted disruption of the murine alpha-L-iduronidase gene. Hum Mol Genet 6: 503–511.
19. Hartung, SD, Frandsen, JL, Pan, D, Koniar, BL, Graupman, P, Gunther, R et al. (2004). Correction of metabolic, craniofacial, and neurologic abnormalities in MPS I mice treated at birth with adeno-associated virus vector transducing the human alpha-L-iduronidase gene. Mol Ther 9: 866–875.
20. Zheng, Y, Rozengurt, N, Ryazantsev, S, Kohn, DB, Satake, N and Neufeld, EF (2003). Treatment of the mouse model of mucopolysaccharidosis I with retrovirally transduced bone marrow. Mol Genet Metab 79: 233–244.
21. Minami, R, Nakamura, F, Kudoh, T, Oyanagi, K and Nakao, T (1980). An altered hexosaminidase A in the liver affected by Hurler and Hunter syndromes. Tohoku J Exp Med 132: 329–335.
22. Schwartz, PH and Brick, DJ (2008). Stem cell therapies for the lysosomal storage diseases - the quintessential neurodegenerative diseases. Curr Stem Cell Res Ther 3: 88–98.
23. Schwartz, PH (2006). The potential of stem cell therapies for neurological diseases. Expert Rev Neurother 6: 153–161.
24. Bjoraker, KJ, Delaney, K, Peters, C, Krivit, W and Shapiro, EG (2006). Long-term outcomes of adaptive functions for children with mucopolysaccharidosis I (Hurler syndrome) treated with hematopoietic stem cell transplantation. J Dev Behav Pediatr 27: 290–296.
25. Polgreen, LE, Tolar, J, Plog, M, Himes, JH, Orchard, PJ, Whitley, CB et al. (2008). Growth and endocrine function in patients with Hurler syndrome after hematopoietic stem cell transplantation. Bone Marrow Transplant 41: 1005–1011.
26. Giassi, LJ, Pearson, T, Shultz, LD, Laning, J, Biber, K, Kraus, M et al. (2008). Expanded CD34+ human umbilical cord blood cells generate multiple lymphohematopoietic lineages in NOD-scid IL2rgamma(null) mice. Exp Biol Med (Maywood) 233: 997–1012.
27. Russell, C, Hendson, G, Jevon, G, Matlock, T, Yu, J, Aklujkar, M et al. (1998). Murine MPS I: insights into the pathogenesis of Hurler syndrome. Clin Genet 53: 349–361.
28. Reolon, GK, Braga, LM, Camassola, M, Luft, T, Henriques, JA, Nardi, NB et al. (2006). Long-term memory for aversive training is impaired in Idua(-/-) mice, a genetic model of mucopolysaccharidosis type I. Brain Res 1076: 225–230.
11
MPS I model for stem cell transplantationDC Mendez et al.
Molecular Therapy — Methods & Clinical Development (2015) 14068© 2015 The American Society of Gene & Cell Therapy
29. Hexum, MK, Tian, X and Kaufman, DS (2011). In vivo evaluation of putative hematopoietic stem cells derived from human pluripotent stem cells. Methods Mol Biol 767: 433–447.
30. Lee, JP, Jeyakumar, M, Gonzalez, R, Takahashi, H, Lee, PJ, Baek, RC et al. (2007). Stem cells act through multiple mechanisms to benefit mice with neurodegenerative metabolic disease. Nat Med 13: 439–447.
31. Banugaria, SG, Prater, SN, Ng, YK, Kobori, JA, Finkel, RS, Ladda, RL et al. (2011). The impact of antibodies on clinical outcomes in diseases treated with therapeutic protein: lessons learned from infantile Pompe disease. Genet Med 13: 729–736.
32. McQuown, SC, Barrett, RM, Matheos, DP, Post, RJ, Rogge, GA, Alenghat, T et al. (2011). HDAC3 is a critical negative regulator of long-term memory formation. J Neurosci 31: 764–774.
33. Vogel-Ciernia, A, Matheos, DP, Barrett, RM, Kramár, EA, Azzawi, S, Chen, Y et al. (2013). The neuron-specific chromatin regulatory subunit BAF53b is necessary for synaptic plasticity and memory. Nat Neurosci 16: 552–561.
34. Kakkis, ED, McEntee, MF, Schmidtchen, A, Neufeld, EF, Ward, DA, Gompf, RE et al. (1996). Long-term and high-dose trials of enzyme replacement therapy in the canine model of mucopolysaccharidosis I. Biochem Mol Med 58: 156–167.
35. Karlsson, M and Björnsson, S (2001). Quantitation of proteoglycans in biological fluids using Alcian blue. Methods Mol Biol 171: 159–173.
36. Manzi, A and Esko, J (2001). Direct chemical analysis of glycoconjugates for carbohydrates. Curr Protoc Mol Biol Chapter 17: Unit17.9.
37. Bible, E, Gupta, P, Hofmann, SL and Cooper, JD (2004). Regional and cellular neuropathology in the palmitoyl protein thioesterase-1 null mutant mouse model of infantile neuronal ceroid lipofuscinosis. Neurobiol Dis 16: 346–359.
38. Kielar, C, Maddox, L, Bible, E, Pontikis, CC, Macauley, SL, Griffey, MA et al. (2007). Successive neuron loss in the thalamus and cortex in a mouse model of infantile neuronal ceroid lipofuscinosis. Neurobiol Dis 25: 150–162.
39. Pontikis, CC, Cella, CV, Parihar, N, Lim, MJ, Chakrabarti, S, Mitchison, HM et al. (2004). Late onset neurodegeneration in the Cln3-/- mouse model of juvenile neuronal ceroid lipofuscinosis is preceded by low level glial activation. Brain Res 1023: 231–242.
40. Pressey, SN, O’Donnell, KJ, Stauber, T, Fuhrmann, JC, Tyynelä, J, Jentsch, TJ et al. (2010). Distinct neuropathologic phenotypes after disrupting the chloride transport proteins ClC-6 or ClC-7/Ostm1. J Neuropathol Exp Neurol 69: 1228–1246.
41. Stover, AE, Brick, DJ, Nethercott, HE, Banuelos, MG, Sun, L, O’Dowd, DK et al. (2013). Process-based expansion and neural differentiation of human pluripotent stem cells for transplantation and disease modeling. J Neurosci Res 91: 1247–1262.
42. Schwartz, PH, Bryant, PJ, Fuja, TJ, Su, H, O’Dowd, DK and Klassen, H (2003). Isolation and characterization of neural progenitor cells from post-mortem human cortex. J Neurosci Res 74: 838–851.
This work is licensed under a Creative Commons Attribution-NonCommercial-NoDerivs 3.0 Unported License. The images or other
third party material in this article are included in the article’s Creative Commons license, unless indicated otherwise in the credit line; if the material is not included under the Creative Commons license, users will need to obtain permission from the license holder to reproduce the material. To view a copy of this license, visit http://creativecommons.org/licenses/by-nc-nd/3.0/
Supplementary Information accompanies this paper on the Molecular Therapy—Methods & Clinical Development website (http://www.nature.com/mtm)
Page 51 of 62
Supplementary Material for Mendez, et al., “A Novel, Long-Lived, and Highly Engraftable Immunodeficient Mouse Model of Mucopolysaccharidosis Type 1”, Molecular Therapy – Methods and Clinical Development, 2014.
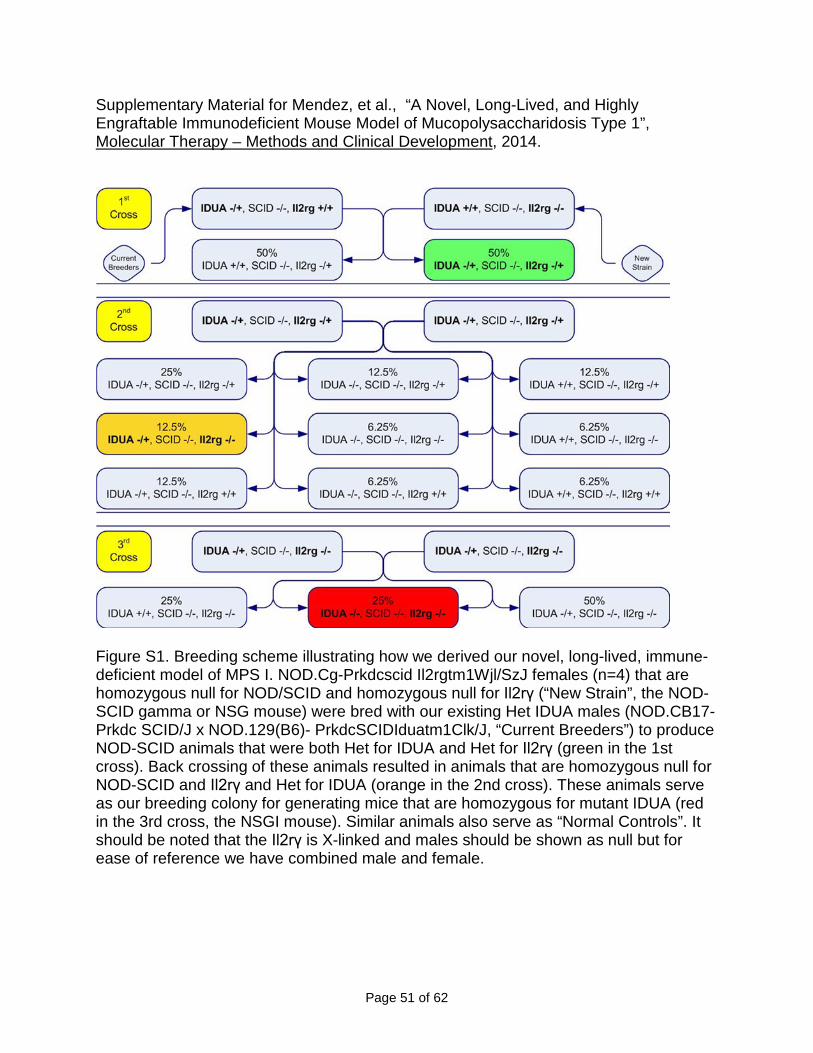
Figure S1. Breeding scheme illustrating how we derived our novel, long-lived, immune-deficient model of MPS I. NOD.Cg-Prkdcscid Il2rgtm1Wjl/SzJ females (n=4) that are homozygous null for NOD/SCID and homozygous null for Il2rγ (“New Strain”, the NOD-SCID gamma or NSG mouse) were bred with our existing Het IDUA males (NOD.CB17-Prkdc SCID/J x NOD.129(B6)- PrkdcSCIDIduatm1Clk/J, “Current Breeders”) to produce NOD-SCID animals that were both Het for IDUA and Het for Il2rγ (green in the 1st cross). Back crossing of these animals resulted in animals that are homozygous null for NOD-SCID and Il2rγ and Het for IDUA (orange in the 2nd cross). These animals serve as our breeding colony for generating mice that are homozygous for mutant IDUA (red in the 3rd cross, the NSGI mouse). Similar animals also serve as “Normal Controls”. It should be noted that the Il2rγ is X-linked and males should be shown as null but for ease of reference we have combined male and female.
Page 52 of 62
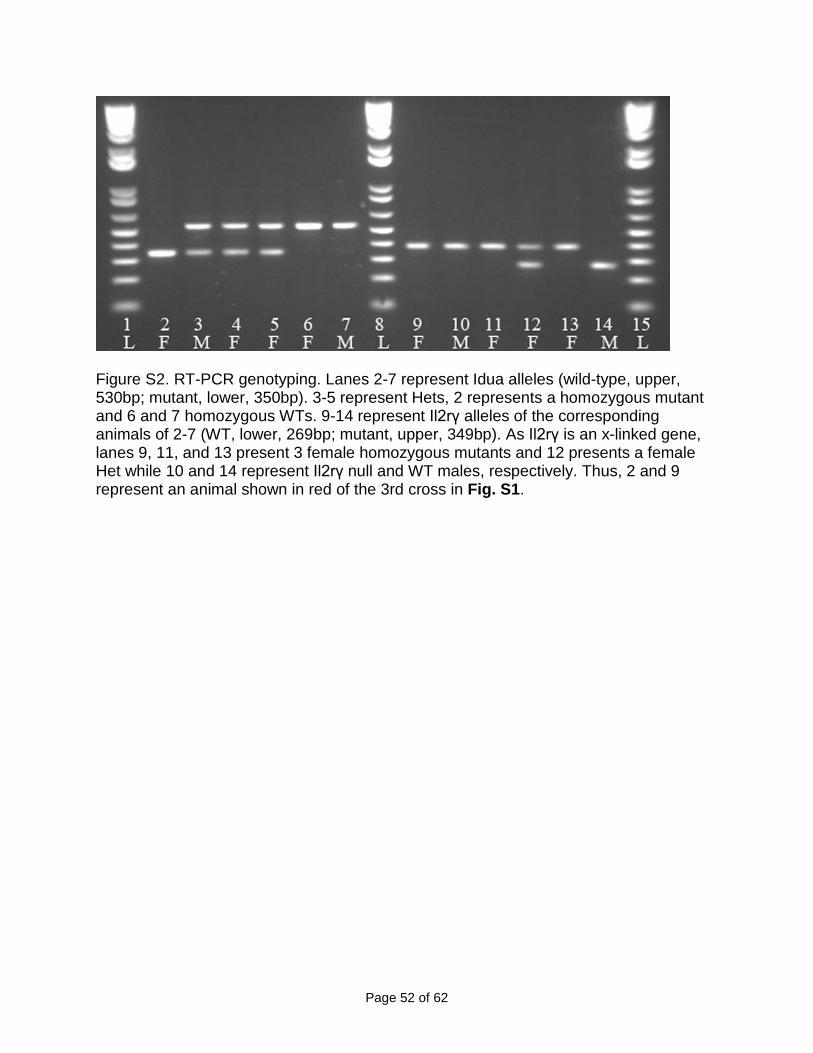
Figure S2. RT-PCR genotyping. Lanes 2-7 represent Idua alleles (wild-type, upper, 530bp; mutant, lower, 350bp). 3-5 represent Hets, 2 represents a homozygous mutant and 6 and 7 homozygous WTs. 9-14 represent Il2rγ alleles of the corresponding animals of 2-7 (WT, lower, 269bp; mutant, upper, 349bp). As Il2rγ is an x-linked gene, lanes 9, 11, and 13 present 3 female homozygous mutants and 12 presents a female Het while 10 and 14 represent Il2rγ null and WT males, respectively. Thus, 2 and 9 represent an animal shown in red of the 3rd cross in Fig. S1.
Page 53 of 62
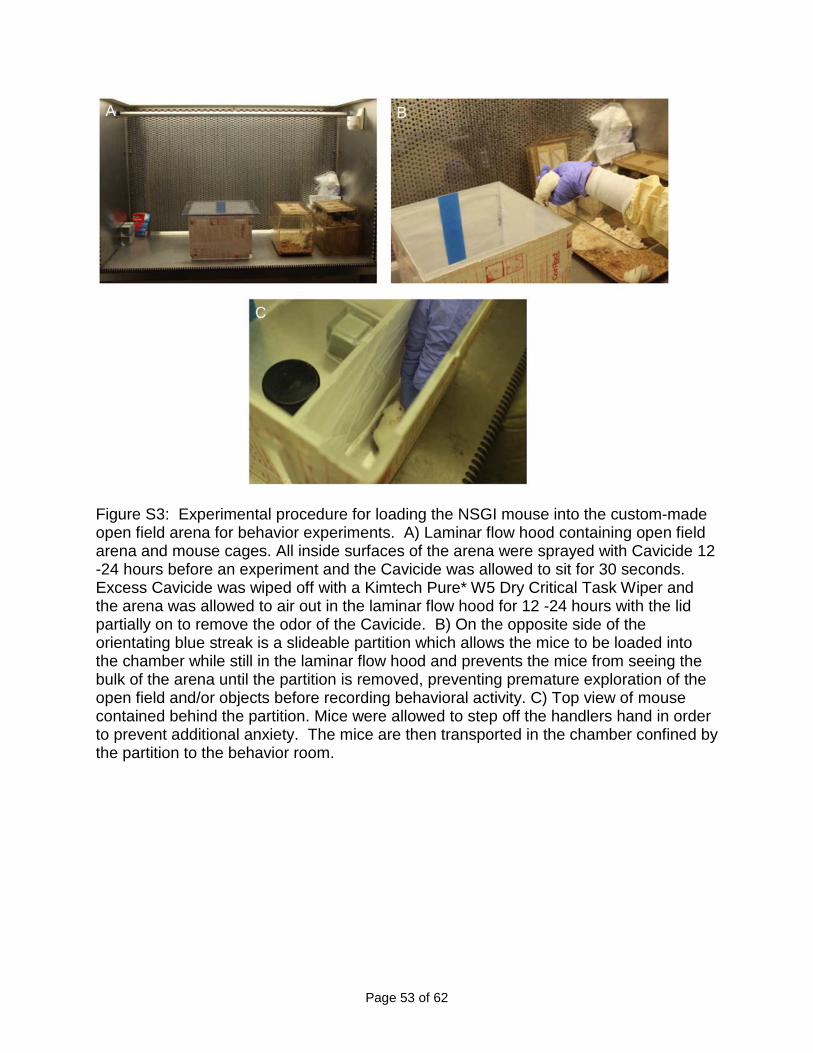
Figure S3: Experimental procedure for loading the NSGI mouse into the custom-made open field arena for behavior experiments. A) Laminar flow hood containing open field arena and mouse cages. All inside surfaces of the arena were sprayed with Cavicide 12 -24 hours before an experiment and the Cavicide was allowed to sit for 30 seconds. Excess Cavicide was wiped off with a Kimtech Pure* W5 Dry Critical Task Wiper and the arena was allowed to air out in the laminar flow hood for 12 -24 hours with the lid partially on to remove the odor of the Cavicide. B) On the opposite side of the orientating blue streak is a slideable partition which allows the mice to be loaded into the chamber while still in the laminar flow hood and prevents the mice from seeing the bulk of the arena until the partition is removed, preventing premature exploration of the open field and/or objects before recording behavioral activity. C) Top view of mouse contained behind the partition. Mice were allowed to step off the handlers hand in order to prevent additional anxiety. The mice are then transported in the chamber confined by the partition to the behavior room.
Page 54 of 62
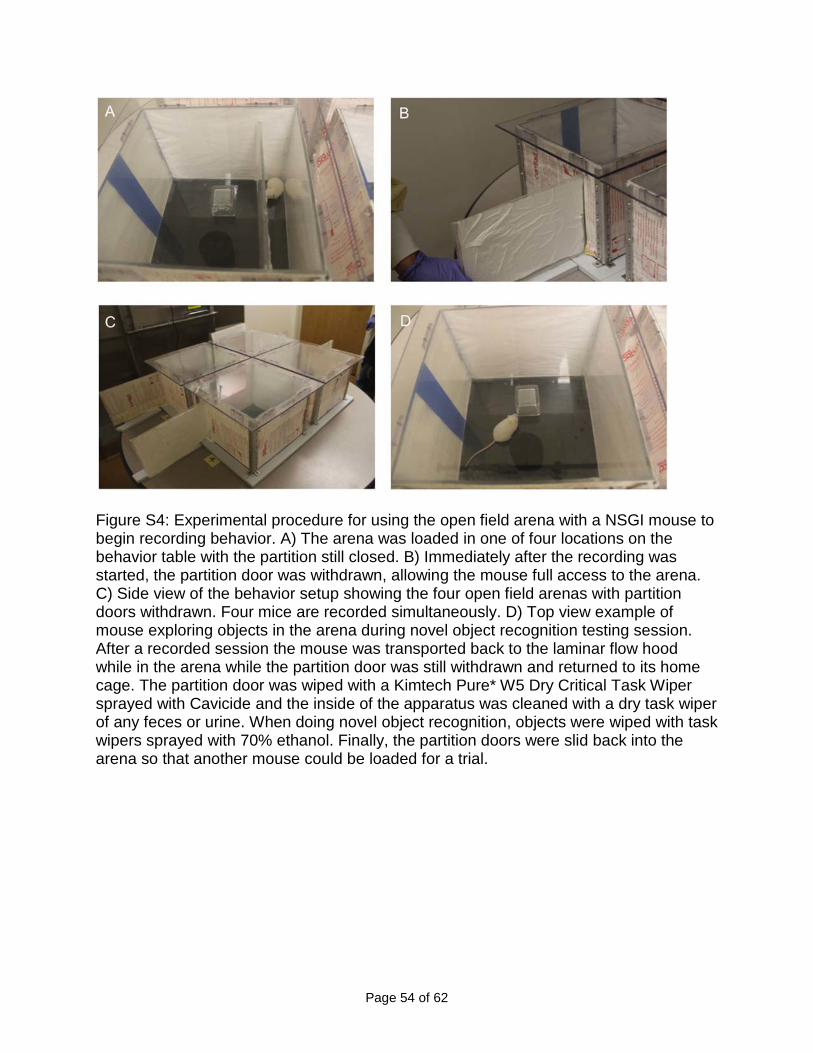
Figure S4: Experimental procedure for using the open field arena with a NSGI mouse to begin recording behavior. A) The arena was loaded in one of four locations on the behavior table with the partition still closed. B) Immediately after the recording was started, the partition door was withdrawn, allowing the mouse full access to the arena. C) Side view of the behavior setup showing the four open field arenas with partition doors withdrawn. Four mice are recorded simultaneously. D) Top view example of mouse exploring objects in the arena during novel object recognition testing session. After a recorded session the mouse was transported back to the laminar flow hood while in the arena while the partition door was still withdrawn and returned to its home cage. The partition door was wiped with a Kimtech Pure* W5 Dry Critical Task Wiper sprayed with Cavicide and the inside of the apparatus was cleaned with a dry task wiper of any feces or urine. When doing novel object recognition, objects were wiped with task wipers sprayed with 70% ethanol. Finally, the partition doors were slid back into the arena so that another mouse could be loaded for a trial.
Page 55 of 62
Figure S5: Methods Diagram of Novel Object Recognition Behavior Test. On day 1, mice were handled for 2 minutes/mouse. The mice were then habituated to the environment of the testing arena in the absence of objects for 10 minutes on day 2. Recordings of the habituation phase were used to acquire open field data using automated tracking with Ethovision XT9 software. Mice were then familiarized with two identical objects for 10 minutes followed by a testing phase 4 hours later where one of the familiar objects was replaced with a novel object and the mice were allowed to explore for 5 minutes.
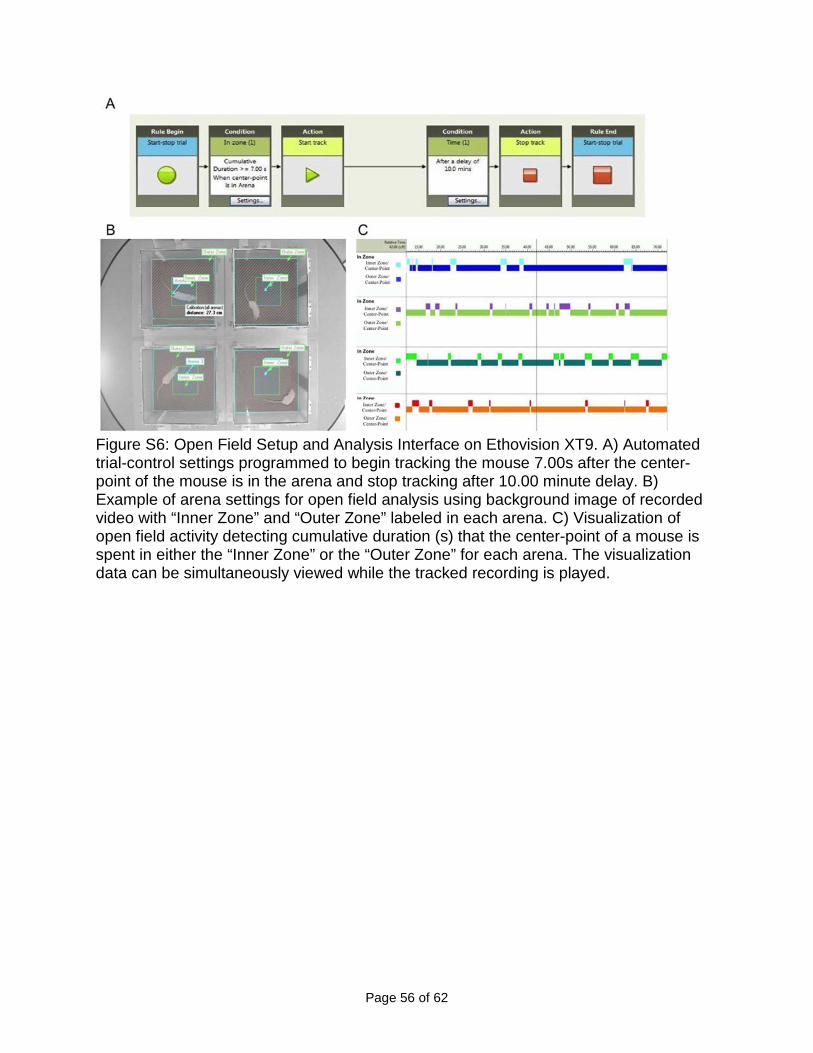
Page 56 of 62
Figure S6: Open Field Setup and Analysis Interface on Ethovision XT9. A) Automated trial-control settings programmed to begin tracking the mouse 7.00s after the center-point of the mouse is in the arena and stop tracking after 10.00 minute delay. B) Example of arena settings for open field analysis using background image of recorded video with “Inner Zone” and “Outer Zone” labeled in each arena. C) Visualization of open field activity detecting cumulative duration (s) that the center-point of a mouse is spent in either the “Inner Zone” or the “Outer Zone” for each arena. The visualization data can be simultaneously viewed while the tracked recording is played.