Canola/rapeseed protein-functionality and nutrition - EDP Open
Upload
independentCategory
view
0download
0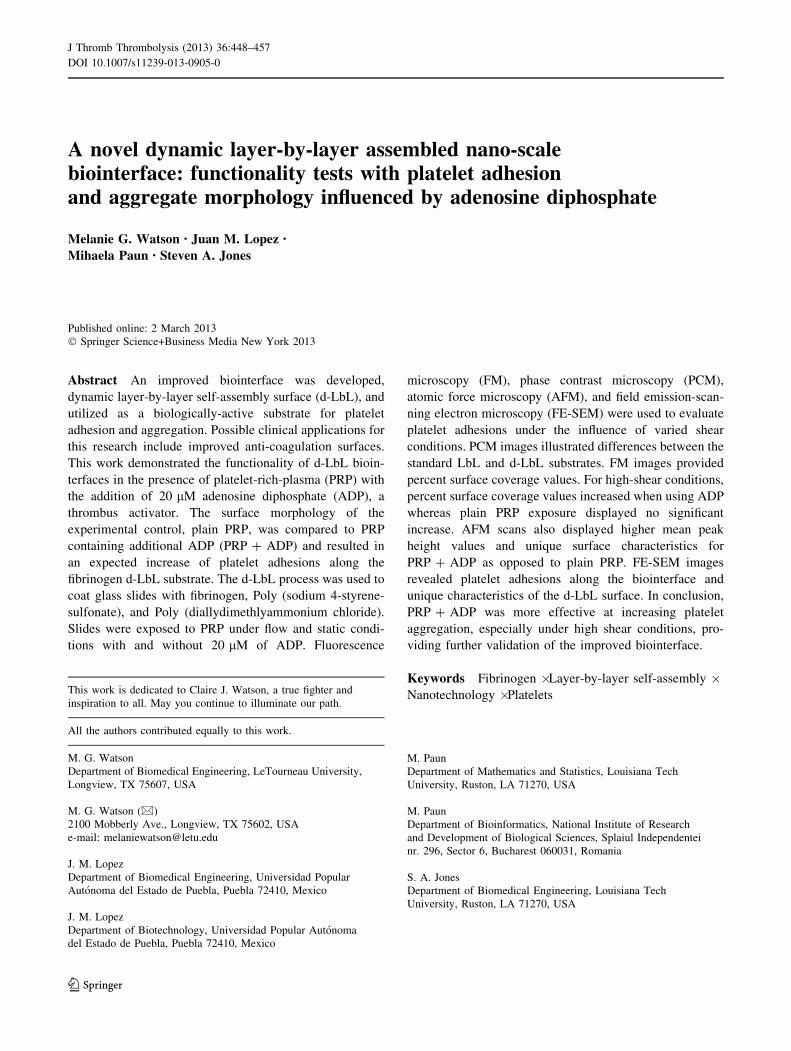
A novel dynamic layer-by-layer assembled nano-scalebiointerface: functionality tests with platelet adhesionand aggregate morphology influenced by adenosine diphosphate
Melanie G. Watson • Juan M. Lopez •
Mihaela Paun • Steven A. Jones
Published online: 2 March 2013
� Springer Science+Business Media New York 2013
Abstract An improved biointerface was developed,
dynamic layer-by-layer self-assembly surface (d-LbL), and
utilized as a biologically-active substrate for platelet
adhesion and aggregation. Possible clinical applications for
this research include improved anti-coagulation surfaces.
This work demonstrated the functionality of d-LbL bioin-
terfaces in the presence of platelet-rich-plasma (PRP) with
the addition of 20 lM adenosine diphosphate (ADP), a
thrombus activator. The surface morphology of the
experimental control, plain PRP, was compared to PRP
containing additional ADP (PRP ? ADP) and resulted in
an expected increase of platelet adhesions along the
fibrinogen d-LbL substrate. The d-LbL process was used to
coat glass slides with fibrinogen, Poly (sodium 4-styrene-
sulfonate), and Poly (diallydimethlyammonium chloride).
Slides were exposed to PRP under flow and static condi-
tions with and without 20 lM of ADP. Fluorescence
microscopy (FM), phase contrast microscopy (PCM),
atomic force microscopy (AFM), and field emission-scan-
ning electron microscopy (FE-SEM) were used to evaluate
platelet adhesions under the influence of varied shear
conditions. PCM images illustrated differences between the
standard LbL and d-LbL substrates. FM images provided
percent surface coverage values. For high-shear conditions,
percent surface coverage values increased when using ADP
whereas plain PRP exposure displayed no significant
increase. AFM scans also displayed higher mean peak
height values and unique surface characteristics for
PRP ? ADP as opposed to plain PRP. FE-SEM images
revealed platelet adhesions along the biointerface and
unique characteristics of the d-LbL surface. In conclusion,
PRP ? ADP was more effective at increasing platelet
aggregation, especially under high shear conditions, pro-
viding further validation of the improved biointerface.
Keywords Fibrinogen � Layer-by-layer self-assembly �Nanotechnology � PlateletsThis work is dedicated to Claire J. Watson, a true fighter and
inspiration to all. May you continue to illuminate our path.
All the authors contributed equally to this work.
M. G. Watson
Department of Biomedical Engineering, LeTourneau University,
Longview, TX 75607, USA
M. G. Watson (&)
2100 Mobberly Ave., Longview, TX 75602, USA
e-mail: [email protected]
J. M. Lopez
Department of Biomedical Engineering, Universidad Popular
Autonoma del Estado de Puebla, Puebla 72410, Mexico
J. M. Lopez
Department of Biotechnology, Universidad Popular Autonoma
del Estado de Puebla, Puebla 72410, Mexico
M. Paun
Department of Mathematics and Statistics, Louisiana Tech
University, Ruston, LA 71270, USA
M. Paun
Department of Bioinformatics, National Institute of Research
and Development of Biological Sciences, Splaiul Independentei
nr. 296, Sector 6, Bucharest 060031, Romania
S. A. Jones
Department of Biomedical Engineering, Louisiana Tech
University, Ruston, LA 71270, USA
123
J Thromb Thrombolysis (2013) 36:448–457
DOI 10.1007/s11239-013-0905-0
Abbreviations
PRP ? ADP 20 lM of ADP added to PRP
d-LbL Dynamic layer-by-layer
Introduction
Platelets are the essential components of hemostasis. Once
produced, platelets circulate within the blood system
awaiting activation [1, 2]. When platelets come into contact
with collagen and/or other factors, they activate other
platelets by discharging coagulation and platelet factors,
such as adenosine diphosphate (ADP), serotonin, thrombin,
von Willebrand factor, and fibrin-stabilizing factors [3].
These agents cause a cascade effect, producing a positive
feedback mechanism [4, 5]. During this process, platelets
bind to one another to form aggregates. Furthermore,
platelet activation increases with increased shear stresses
and exposure time [6]. These platelet aggregates, thrombi,
have the potential to damage biological systems, such as,
vasculature and organs by either obstructing blood flow at
the site of formation or by dislodging fragments in the form
of emboli [7, 8]. When atherosclerosis is present in an
arterial blood vessel, plaque ruptures can lead to thrombi,
which can lead to serious health conditions, including death
[9]. Thrombi can further promote stenosis leading to a
more rapid narrowing or occlusion of the vasculature [10].
Current studies of thrombosis use collagen and fibrinogen
biointerfaces to localize and control platelet depositions to
examine the effects of thrombi under shear rate, lumen
narrowing and occlusion conditions [9, 11, 12].
ADP is a known platelet activator that is released from
dense granules when they are secreted during platelet
activation [13]. Because ADP is a platelet activator, it can
be used as a positive control for platelet activation,
encouraging greater deposition along a surface [14, 15].
One step in characterizing the positive feedback aspects of
platelet adhesion is to quantify the relationship between
concentrations of activators, specifically ADP, and activa-
tion, adhesion and aggregation. Our laboratory examined
the adhesion of platelets to fibrinogen surfaces with the
addition of ADP concentration to further validate the
functionality as a biointerface of the newly developed
d-LbL surface [16, 17].
Biologically-active surfaces were generated with the
traditional static LbL (s-LbL) technique [18–20] and the
novel d-LbL technique [16]. ADP was added to citrated
platelet-rich plasma (PRP) under static and flow conditions.
Platelet adhesions were identified using an AFM, FE-SEM,
and FM. By demonstrating expected ADP responses, even
in a calcium-depleted environment [21], the experimental
potential of these improved d-LbL biointerfaces was fur-
ther examined beyond the initial studies. Other research has
thoroughly documented the role that ADP plays in platelet
activation and adhesion. It is not the intent of this paper
to demonstrate a new mechanism for ADP activation
in platelets or to present the ADP behavior as novel.
Rather, because the role ADP plays as an agonist is so
well-documented, even at physiological shear stress of
approximately 15 dynes-cm2, it serves as a useful reference
to show no undue interactions are occurring between the
platelets and the novel surface preparation technique,
showing the expected ADP behavior under shear [22, 23].
Earlier work from our laboratory has demonstrated the
expected behavior with a platelet activation antagonist
under static and low-shear conditions [4–6]. The experi-
mental shear stresses used for this work ranged from 0.002
to 0.02 dynes-cm2 and served as a test bed for an expected
behavior. For future work, shear stresses can be scaled up
to physiological shear stresses. This study builds upon the
prior antagonist demonstration and adds the agonist ADP
functionality test, as well as advanced imaging to validate
the presence of platelets [21, 23]. Moreover, s-LbL sub-
strates consistently displayed bulk acridine orange fluo-
rescence dye across the surface with and without the
presence of platelet adhesions even after a rising procedure
due to the proposed rougher, porous s-LbL surface char-
acteristics trapping the dye within the LbL itself [16].
Therefore, our laboratory designed the d-LbL technique to
minimize the rough, porous effects allowing the acridine
orange dye, not directly attached to platelet adhesions, to
easily evacuate the d-LbL surface. Our laboratory dem-
onstrated the possibility of using d-LbL for surface gen-
eration, instead of statically layered biointerfaces, to
produce homogenous substrates that are thrombogenic,
generating no observable unwanted agonist or antagonist
reactions. By using the proposed d-LbL method, our lab-
oratory and others might gain better insight into the pre-
vention of coagulation for the aforementioned diseases.
One potential clinical application of the d-LbL technique is
the modification of cardiovascular stents to control
thrombus formation after angioplasty.
Methods
Chemicals
Poly (diallydimethlyammonium chloride) (PDDA), Poly
(sodium 4-styrene-sulfonate) (PSS), sodium phosphate
monobasic (PBS), AO hemi (zinc chloride) salt, tris buffer
saline tablet, fibrinogen fraction 1 type 1-S, hydrochloric
Acid (HCl), ADP and sodium citrate were purchased for
Sigma Aldrich (St. Louis, MO). Sodium hydroxide (NaOH)
pellets were purchased from Fluka, a subsidiary of Sigma
Aldrich (St. Louis, MO).
Platelet adhesion on d-LbL biointerfaces 449
123
Preparation of glass slides
Premiere� 75 9 25 mm plain glass microscope slides were
cleaned with 91 % isopropyl alcohol and de-ionized (DI)
water. Each slide was first inserted into a 50 mL polypro-
pylene conical tube filled with isopropyl alcohol and
oscillated on a VWR advanced digital shaker table at 120
rotations per minute for 7 min. The slides were then
inserted into 50 mL tubes containing DI water and oscillated
on the shaker table for 7 min, at a rate of 120 rotations per
minute. Immediately after this procedure, the slides were
dried and stored until needed for a PRP experiment.
Static layer-by-layer self assembly (s-LbL)
Fifteen clean glass slides were immersed into 750 mL
rectangular dishes, each containing of cationic polyelec-
trolyte PDDA. The slides were removed after 10 min, and
immersed into another set of rectangular dishes containing
DI water. After this 1-min rinse, the slides were placed in
temperature- and humidity-controlled chamber during the
drying process. Following drying, the slides were
immersed into dishes containing PSS. The slides were
removed from the PSS solution after 10 min. Finally, the
slides were rinsed and dried following the same procedure
as previously described. This process was repeated four
more times for a total of five bilayers to form the initial
substrate.
To add the biologically active interface, a layering pro-
cedure similar to the method previously described was fol-
lowed. Each glass slide was exposed to PDDA for 10 min,
rinsed with DI water for 4 min, exposed to fibrinogen for
20 min, and rinsed again with DI water for 4 min. The pro-
cess was repeated to generate a total of 3 bilayers. The
completed surface was thus consisted of 8 bilayers.
Dynamic layer-by-layer self assembly (d-LbL)
Fifteen clean glass slides were immersed into fifteen 50 mL
tubes, each containing 35 mL of cationic polyelectrolyte
PDDA, and oscillated in a horizontal position. The slides
were removed after 10 min, and inserted into another set of
50 mL tubes containing 45 mL of DI water, which was used
as a rinse. After a 1-min rinse, the slides were placed in
temperature- and humidity-controlled chamber during the
drying process. Following drying, the slides were inserted
into tubes containing 35 mL of PSS. The slides were
removed from the PSS solution after 10 min. Finally, the
slides were rinsed and dried following the same procedure as
before. This process was repeated four more times for a total
of 5 bilayers to form the initial substrate.
To add the biologically active interface, a layering
procedure similar to the method previously described was
followed. Each glass slide was exposed to PDDA for
10 min, rinsed with DI water for 4 min, exposed to
fibrinogen for 20 min, and rinsed again with DI water for
4 min. The process was repeated to generate a total of 3
bilayers. The completed surface was thus consisted of 8
bilayers.
Platelet preparation
Approximately 45 mL of bovine whole blood samples
were collected into 50 mL conical tubes at the university
dairy from the same bovine source for each experiment.
Each tube contained 5 mL sodium citrate prior to veni-
puncture allowing a blood-citrate ratio of 9:1. Our blood
collection procedures were approved by Louisiana Tech
University’s Institutional Review Board for ethical han-
dling of animal subjects. Blood samples were obtained
from the subcutaneous abdominal (milk) vein located on
the lower abdomen in front of the udder sack. After col-
lection, the tubes were sealed and gently rocked back and
forth to ensure homogeneous sodium citrate/whole blood
mixing. Sodium citrate is known to form a complex with
calcium [24], and the further dilution with calcium-free
PBS provided a potential for calcium-poor platelets after
incubation for 60–90 min between collection and the
experiments. Thus, all blood samples were taken to the
laboratory directly after collection and centrifuged within
30 min.
The blood from each 50 mL tube was divided into
smaller 15 mL centrifuge tubes and centrifuged at 1,000 rcf
for 25 min, at a temperature of 30 �C using the Eppendorf
Centrifuge 5804R model. A brake setting of 6 up and down
was applied. After spinning, PRP was extracted from each
tube. PBS solution was then added to the PRP bringing the
total mixture to back to the original 50 mL volume for each
tube. Validation of PRP required that platelet counts be
analyzed within the normal bovine platelet count range of
2.0–5.0 9 105 platelet/lL [25–27] and were determined to
consistently fall within range. The platelet counts were
examined using an Agilent 2100 Bioanalyzer�. Platelet
samples were loaded into wells on the lap-on-a-chip assay
tray along with Agilent Cell Assay kit solutions and analyzed.
Exposure of slides to PRP
The petri dish/slide setups were placed directly in the tem-
perature- and humidity-controlled chamber (35 ± 3 �C,
20 ± 3 % relative humidity). Each protein-coated glass
slide was placed in a Petri dish and covered with either plain
PRP or PRP ? ADP for 30 min. To simulate flow condi-
tions, the petri dishes were placed on a VWR Advanced
Digital shaker table set at 60 rotations per minute. After the
exposure time, slides were gently rinsed, dried, stained with
450 M. G. Watson et al.
123

AO, rinsed and dried again. No further platelet fixation,
counterstaining, mounting or preparation methods were
necessary due to a potential for de-staining and/or masking
the fluorescence. Furthermore, the AO staining method
described above does not lead to cellular autolysis for
platelets and allows for preservation of cellular detail under
ultraviolet light [28].
Microscopy and imaging systems
FM
All slides were imaged using the Olympus IX51 fluores-
cence microscope with an Olympus DP71 camera. The
settings for the microscope are as follows: an exposure
time of 667 ms with a 109 magnification. The AO staining
was imaged with a TRITC filter. Slides that were subjected
to flow conditions were partitioned into three regions,
corresponding to low, mid and high shear. For each shear
region, 40 non-overlapping, *2 mm by 1.5 mm images
were obtained.
IrfanView was used to convert all image files from tiff
format to jpeg. An in-house MATLAB m-file resized each
image to 640 by 480 pixels, performed an image subtrac-
tion, converted the image to black and white, and counted
the percent of pixels above a threshold level that indicated
AO staining. However for the purposes of this research, the
original FM tiff files are presented as images in this article.
An additional in-house MATLAB program was used to
determine the sizes of the platelet aggregations in the
images.
PCM
Phase contrast images were collected by a Leica Micro-
systems LTD phase contrast microscope with a DFC290
camera. The settings for the microscope are as follows:
brightfield with a phase contrast ring using with a 109
magnification.
AFM
Dry nitrogen gas was washed over the sample slides to
remove any particulate matter before AFM imaging. The
slides were then placed on the ministage platform of the
Quesant Instrument AFM for scanning. Several
40 9 40 lm sections were taken of each slide.
FE-SEM
A Hitachi S-4800 FE-SEM was used to provide qualitative
characteristic results of platelets adhesions and the bio-
materials. Dry nitrogen gas was washed over the sample
slides to remove any particulate matter before FE-SEM
imaging. Each glass slide was cut into 1-inch squares and
placed on the scanning disk. Samples were loaded into the
microscope and imaged with a voltage setting of approxi-
mately 1–2 kV.
Statistical analysis
All PRP data obtained from the MATLAB program as a result
of the FM images were expressed as percent platelet sur-
face coverage ± SD. Additional statistical analysis tools
were used to calculate means, SDs, and non-parametric
Kruskal–Wallis tests. For the Kruskal–Wallis tests, p-val-
ues (p \ 0.05) were used to compare statistical significance
between groups and sets as a one-way analysis of variance
used to determine if three or more samples originate from
the same distribution. The test makes no assumptions about
the distribution of the data unlike the parametric indepen-
dent group ANOVA. The Kruskal–Wallis test was utilized
for this study due to the non-normally distributed biologi-
cal results obtained. A p-value of less than 0.05 was con-
sidered statistical significant.
Results
Surface morphology
Figure 1a, b illustrate PCM images characterizing the
surface roughness differences when using s-LbL (Fig. 1a)
and d-LbL (Fig. 1b) substrates. The image of Fig. 1a
suggests a substrate rougher in nature than the d-LbL
substrate of Fig. 1b. Figure 1c, d display FM images of the
s-LbL (Fig. 1c) and d-LbL (Fig. 1d) samples stained with
AO and exposed to plain PRP. Figure 1c displays the bulk
staining effect possibility due to the rougher, porous s-LbL
surface as compared to the d-LbL surface (Fig. 1d).
Statistical comparisons for s-LbL versus d-LbL surfaces
suggest significant differences in mean percent surface
coverage of platelet adhesions along the biointerfaces as
shown in Table 1. Under static conditions, s-LbL presented
a mean surface coverage of 5.515 % as compared to d-LbL
results of 0.472 % coverage. At higher shears, s-LbL mean
surface coverage results were 3.392 % versus d-LbL cov-
erage at 0.509 %.
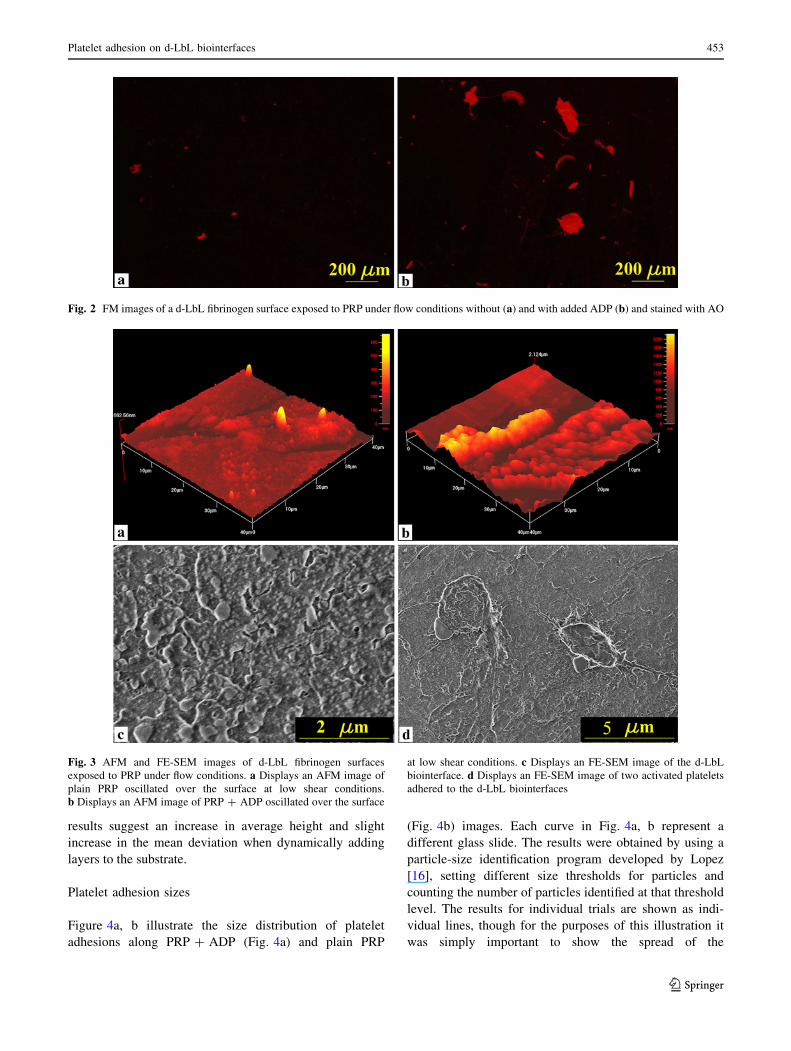
Figure 2a, b show FM images of d-LbL samples stained
with AO and exposed to plain PRP (Fig. 2a) and
PRP ? ADP (Fig. 2b). The images were taken in the low
shear area of the slide. The number of platelet adhesions
appear similar between both images. However, the platelet
adhesions sizes of the PRP ? ADP samples, Fig. 2b, are
larger as compared to the plain PRP platelet adhesion sizes.
Additional, many of the PRP ? ADP platelet adhesions are
Platelet adhesion on d-LbL biointerfaces 451
123
elongated along the surface. The platelet adhesion elon-
gations, as evidenced in Fig. 2b, appeared in numerous
PRP ? ADP images of multiple slides. These elongations
were not found on any of the plain PRP images. When first
discovering these elongations, our laboratory was con-
cerned that they were simply scratches along the surfaces.
However, after further testing with the use of an AFM we
were able to eliminate concerns for surface scratches (see
Fig. 3b).
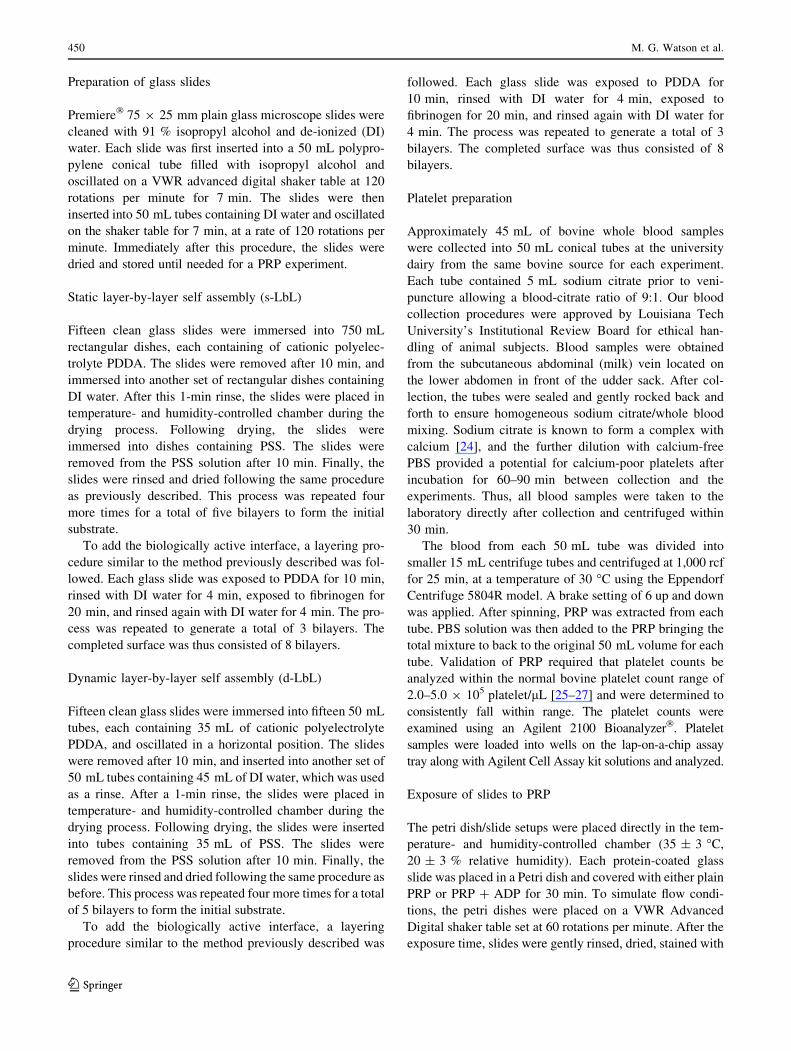
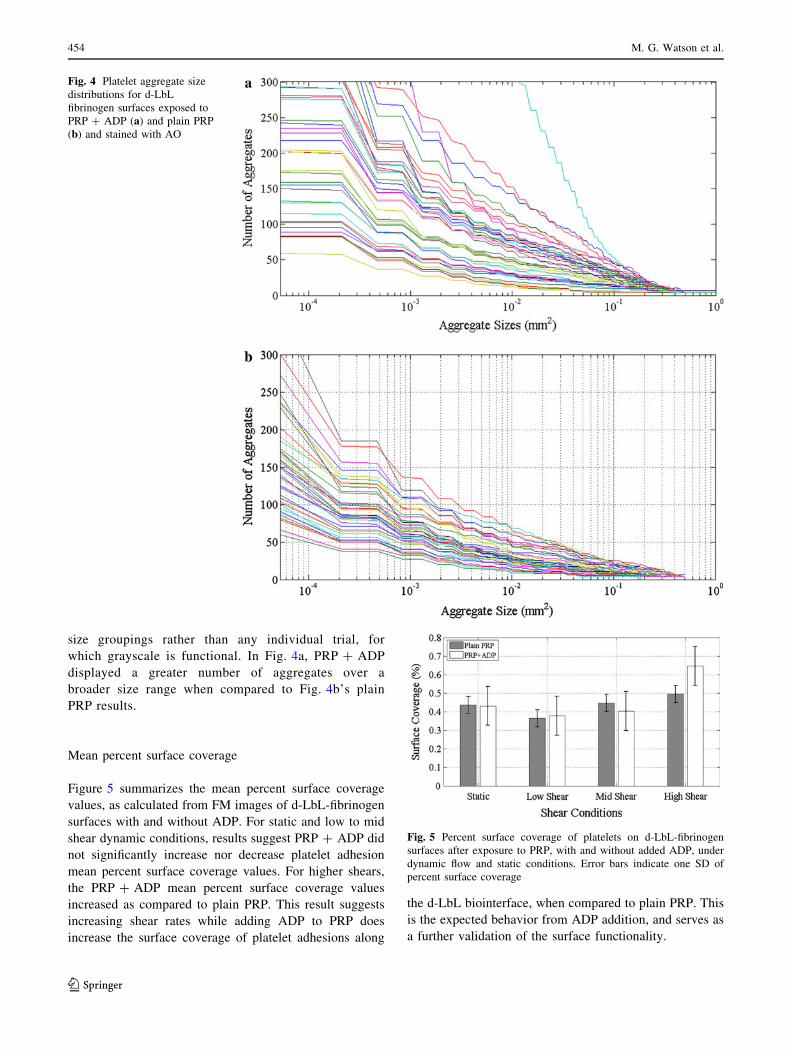
Figure 3a, b display AFM scans of d-LbL-fibrinogen
surfaces exposed to plain PRP (Fig. 3a) and PRP ? ADP
(Fig. 3b). Figure 3a exhibits isolated peaks, the largest of
which is 660 nm. Figure 3b displays elongated features
along the surface that are as much as 2,100 nm in height.
The PRP ? ADP mean peak heights consistently displayed
greater values (1521 ± 657 nm) than plain PRP (893 ±
464 nm). A Kruskal–Wallis test was performed to evaluate
the raw peak height data of plain PRP as compared to
PRP ? ADP. The p-value for this comparison was 0.003.
This result suggests a statistical significance between peak
height values of plain PRP to PRP ? ADP.
Figure 3c, d display FE-SEM images of the surface
morphology and platelet adhesion potential of the d-LbL
interface. The slides used for FE-SEM imaging were lay-
ered with fibrinogen, oscillated with PRP, and coated with
AO. Figure 3c indicates surface roughness and irregulari-
ties of the d-LbL biointerface. Figure 3d displays two
activated platelet adhesions fixed to the d-LbL surface
oscillated with plain PRP.
Additionally, AFM height histograms estimated the
average height and mean deviation of the d-LbL substrates
after immersion and drying of d-LbL bilayers 1 and 4. The
height histogram for bilayer 1 indicated an average height of
29.467 nm with a mean deviation of 14.22 nm along the
d-LbL substrate. The height histogram for bilayer 4 esti-
mated an average height of 48.878 nm with a mean deviation
of 19.54 nm along the d-LbL substrate. The histogram
Fig. 1 PCM images of LbL surfaces statically layered (a) and dynamically layered (b). FM images of LbL surfaces statically layered (c) and
dynamically layered (d)
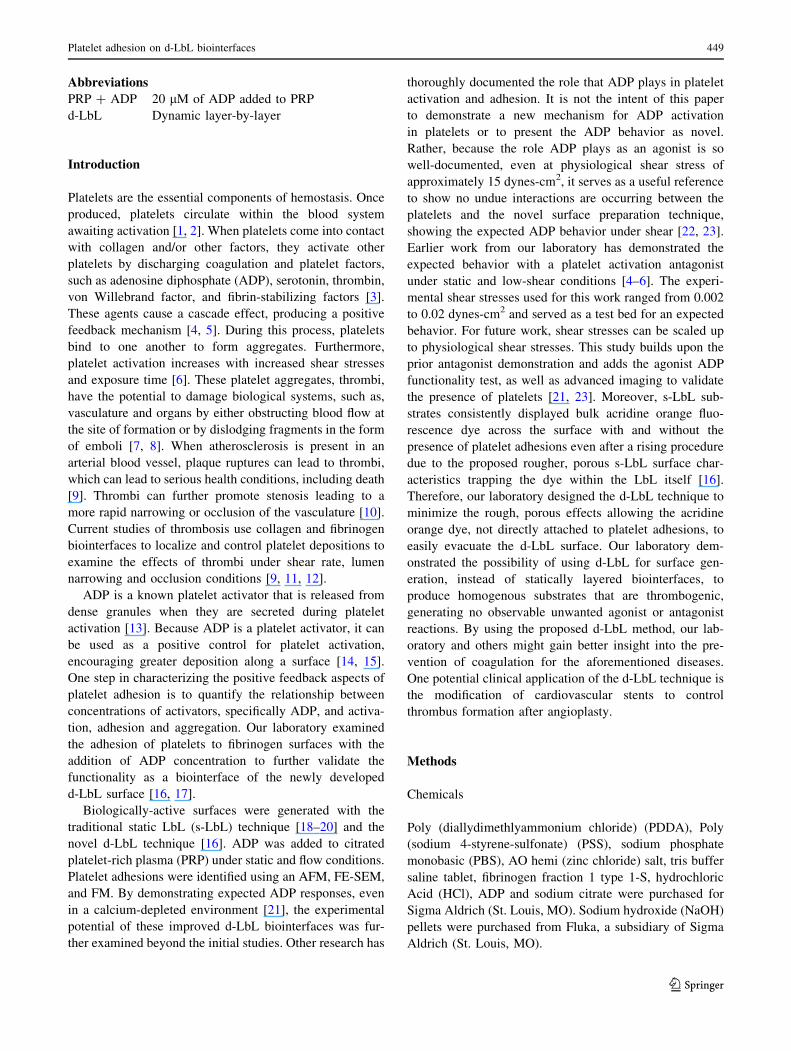
Table 1 Mean percent surface coverage values and SD of d-LbL
versus s-LbL surfaces
Surface type Shear condition Mean % coverage SD
s-LbL Static 5.515 ±4.843
High 3.392
d-LbL Static 0.472 ±0.046
High 0.509
452 M. G. Watson et al.
123
results suggest an increase in average height and slight
increase in the mean deviation when dynamically adding
layers to the substrate.
Platelet adhesion sizes
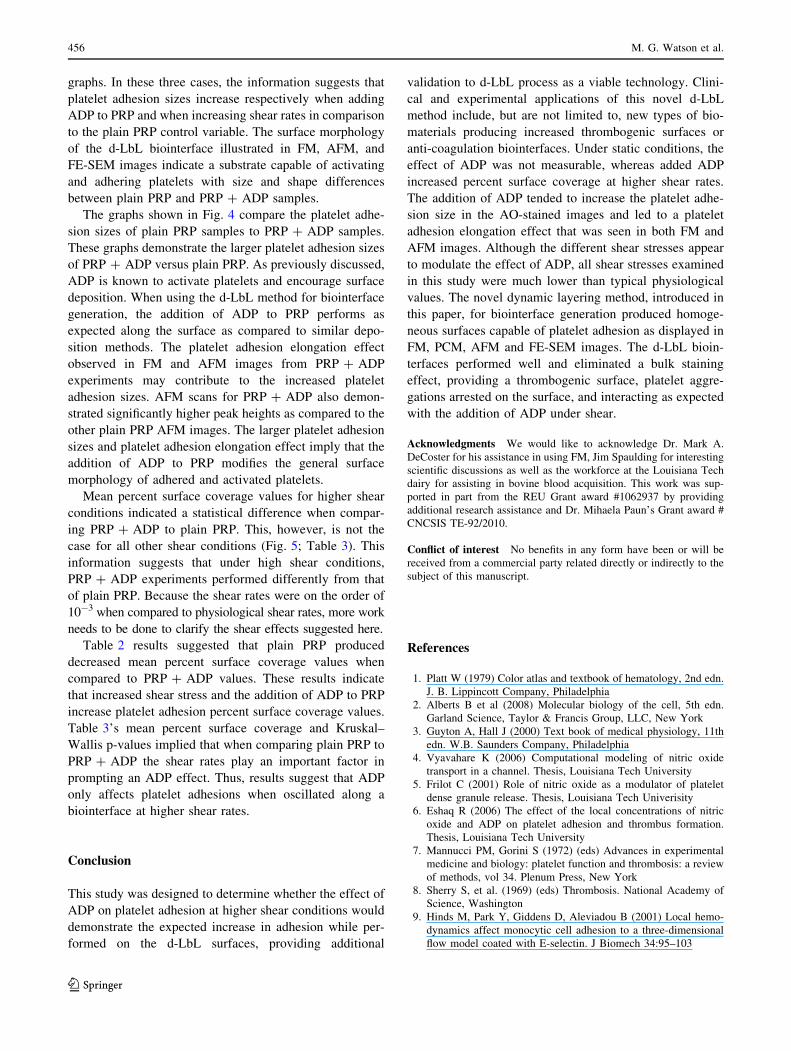
Figure 4a, b illustrate the size distribution of platelet
adhesions along PRP ? ADP (Fig. 4a) and plain PRP
(Fig. 4b) images. Each curve in Fig. 4a, b represent a
different glass slide. The results were obtained by using a
particle-size identification program developed by Lopez
[16], setting different size thresholds for particles and
counting the number of particles identified at that threshold
level. The results for individual trials are shown as indi-
vidual lines, though for the purposes of this illustration it
was simply important to show the spread of the
Fig. 2 FM images of a d-LbL fibrinogen surface exposed to PRP under flow conditions without (a) and with added ADP (b) and stained with AO
Fig. 3 AFM and FE-SEM images of d-LbL fibrinogen surfaces
exposed to PRP under flow conditions. a Displays an AFM image of
plain PRP oscillated over the surface at low shear conditions.
b Displays an AFM image of PRP ? ADP oscillated over the surface
at low shear conditions. c Displays an FE-SEM image of the d-LbL
biointerface. d Displays an FE-SEM image of two activated platelets
adhered to the d-LbL biointerfaces
Platelet adhesion on d-LbL biointerfaces 453
123
size groupings rather than any individual trial, for
which grayscale is functional. In Fig. 4a, PRP ? ADP
displayed a greater number of aggregates over a
broader size range when compared to Fig. 4b’s plain
PRP results.
Mean percent surface coverage
Figure 5 summarizes the mean percent surface coverage
values, as calculated from FM images of d-LbL-fibrinogen
surfaces with and without ADP. For static and low to mid
shear dynamic conditions, results suggest PRP ? ADP did
not significantly increase nor decrease platelet adhesion
mean percent surface coverage values. For higher shears,
the PRP ? ADP mean percent surface coverage values
increased as compared to plain PRP. This result suggests
increasing shear rates while adding ADP to PRP does
increase the surface coverage of platelet adhesions along
the d-LbL biointerface, when compared to plain PRP. This
is the expected behavior from ADP addition, and serves as
a further validation of the surface functionality.
Fig. 4 Platelet aggregate size
distributions for d-LbL
fibrinogen surfaces exposed to
PRP ? ADP (a) and plain PRP
(b) and stained with AO
Fig. 5 Percent surface coverage of platelets on d-LbL-fibrinogen
surfaces after exposure to PRP, with and without added ADP, under
dynamic flow and static conditions. Error bars indicate one SD of
percent surface coverage
454 M. G. Watson et al.
123

For all imaging results, the automated standard image
processing removed individual images from the data set for
a slide if the percent surface area was 3 or more SDs
removed from the mean for the slide and thus considered
an outlier. This only dealt with the outliers in individual
slide sets, but did not consider the slide sets as a whole.
When the data were analyzed for entire slides, two of the
slides were excluded as being 3 or more SDs away from the
means for the rest of the slides in a test group.
Statistical analysis
Table 2 shows mean percent surface coverage values with
SD calculated from the raw percent surface coverage data
of plain PRP and PRP ? ADP experiments. Each mean
percent surface coverage value was determined by ana-
lyzing the raw data for each experiment over multiple days.
All plain PRP experiments performed under static condi-
tions taken over multiple days resulted in data that were
combined into a single file and processed using Excel. This
procedure was repeated for the other coverage values. For
plain PRP, the mean percent surface coverage values
suggested little difference between each shear condition as
evidenced from the SD values. The PRP ? ADP mean
percent surface coverage values with SD indicate an
increase in platelet adhesions along the surface from the
static to high shear conditions when compared to plain PRP
results.
Table 3 shows Kruskal–Wallis test p-values and mean
percent surface coverage values dependent upon shear
conditions for plain PRP and PRP ? ADP samples using
the d-LbL fibrinogen surface. Under static and low to mid
shear dynamic conditions, the Kruskal–Wallis p-values
suggest no significant effect between plain PRP and
PRP ? ADP. However, results for high shear conditions
indicate an increase in the surface coverage of platelet
adhesions. Furthermore, the high shear condition Kruskal–
Wallis p-value of 0.0002 indicates statistical significance
between plain PRP and PRP ? ADP results.
Kruskal–Wallis p-values were used to confirm consis-
tence between each experiment and the individual methods
performed. When observing the plain PRP sessions from a
single day, p-values indicated that the low shear condition
p = 0.331 and the mid shear condition p = 0.384 sug-
gesting consistence between percent surface coverage
values from individual images. For high shear conditions
when observing a single day’s experimental trials, these
results indicated statistical significance. These results
imply that platelet adhesion percent surface coverage val-
ues maintain continuity during experimental trials while
performed under static and low to mid shear conditions, but
varied greatly at higher shears. PRP ? ADP displayed
similar p-values dependent upon the shear condition.
Discussion
The purpose of this study was to examine, in combination,
the effects of adding ADP to PRP and increasing shear
stress on platelet surface morphology while using an
improved nano-scale biointerface made with the novel
d-LbL process. PCM and FM images (Fig. 1) of the s-LbL
and d-LbL substrates illustrated key differences between
the LbL techniques. Imaging results of s-LbL and d-LbL
suggest that s-LbL consistently maintained rougher sur-
faces possibility facilitating a bulk staining effect regard-
less of platelet adhesion attachment thus leading to false
positives in FM when using s-LbL substrates. Statistical
comparisons of the mean percent surface coverage values
between s-LbL and d-LbL (Table 1) indicate quantitative
differences between the two methods. The increased s-LbL
surface coverage results are possibly due to the bulk
staining effect and further validate a need for the improved,
novel technique.
The FM images (Fig. 2) of the d-LbL surfaces oscillated
with plain PRP or PRP ? ADP displayed platelet adhe-
sions along the biointerfaces and are confirmed at platelets
in FE-SEM images (Fig. 3). In the case of PRP ? ADP,
platelet adhesion sizes were larger and elongated. This
result was further validated by statistical AFM mean peak
height comparisons and Fig. 4’s platelet adhesion size
Table 2 FM used to obtain mean percent surface coverage values
with SD of PRP experiments
PRP experiment Shear condition Mean % coverage SD
Plain PRP Static 0.472 ±0.046
Low 0.417
Medium 0.517
High 0.509
PRP ? ADP Static 0.434 ±0.105
Low 0.368
Medium 0.450
High 0.614
Table 3 Statistical analysis information of FM images when com-
paring plain PRP results versus PRP ? ADP
PRP experiment
comparison
Shear
condition
Mean %
coverage
K–W test:
p-value
Plain PRP vs. PRP ? ADP Static 0.461 0.1477
Low 0.407 0.7507
Mid 0.451 0.4292
High 0.571 0.0002
Platelet adhesion on d-LbL biointerfaces 455
123
graphs. In these three cases, the information suggests that
platelet adhesion sizes increase respectively when adding
ADP to PRP and when increasing shear rates in comparison
to the plain PRP control variable. The surface morphology
of the d-LbL biointerface illustrated in FM, AFM, and
FE-SEM images indicate a substrate capable of activating
and adhering platelets with size and shape differences
between plain PRP and PRP ? ADP samples.
The graphs shown in Fig. 4 compare the platelet adhe-
sion sizes of plain PRP samples to PRP ? ADP samples.
These graphs demonstrate the larger platelet adhesion sizes
of PRP ? ADP versus plain PRP. As previously discussed,
ADP is known to activate platelets and encourage surface
deposition. When using the d-LbL method for biointerface
generation, the addition of ADP to PRP performs as
expected along the surface as compared to similar depo-
sition methods. The platelet adhesion elongation effect
observed in FM and AFM images from PRP ? ADP
experiments may contribute to the increased platelet
adhesion sizes. AFM scans for PRP ? ADP also demon-
strated significantly higher peak heights as compared to the
other plain PRP AFM images. The larger platelet adhesion
sizes and platelet adhesion elongation effect imply that the
addition of ADP to PRP modifies the general surface
morphology of adhered and activated platelets.
Mean percent surface coverage values for higher shear
conditions indicated a statistical difference when compar-
ing PRP ? ADP to plain PRP. This, however, is not the
case for all other shear conditions (Fig. 5; Table 3). This
information suggests that under high shear conditions,
PRP ? ADP experiments performed differently from that
of plain PRP. Because the shear rates were on the order of
10-3 when compared to physiological shear rates, more work
needs to be done to clarify the shear effects suggested here.
Table 2 results suggested that plain PRP produced
decreased mean percent surface coverage values when
compared to PRP ? ADP values. These results indicate
that increased shear stress and the addition of ADP to PRP
increase platelet adhesion percent surface coverage values.
Table 3’s mean percent surface coverage and Kruskal–
Wallis p-values implied that when comparing plain PRP to
PRP ? ADP the shear rates play an important factor in
prompting an ADP effect. Thus, results suggest that ADP
only affects platelet adhesions when oscillated along a
biointerface at higher shear rates.
Conclusion
This study was designed to determine whether the effect of
ADP on platelet adhesion at higher shear conditions would
demonstrate the expected increase in adhesion while per-
formed on the d-LbL surfaces, providing additional
validation to d-LbL process as a viable technology. Clini-
cal and experimental applications of this novel d-LbL
method include, but are not limited to, new types of bio-
materials producing increased thrombogenic surfaces or
anti-coagulation biointerfaces. Under static conditions, the
effect of ADP was not measurable, whereas added ADP
increased percent surface coverage at higher shear rates.
The addition of ADP tended to increase the platelet adhe-
sion size in the AO-stained images and led to a platelet
adhesion elongation effect that was seen in both FM and
AFM images. Although the different shear stresses appear
to modulate the effect of ADP, all shear stresses examined
in this study were much lower than typical physiological
values. The novel dynamic layering method, introduced in
this paper, for biointerface generation produced homoge-
neous surfaces capable of platelet adhesion as displayed in
FM, PCM, AFM and FE-SEM images. The d-LbL bioin-
terfaces performed well and eliminated a bulk staining
effect, providing a thrombogenic surface, platelet aggre-
gations arrested on the surface, and interacting as expected
with the addition of ADP under shear.
Acknowledgments We would like to acknowledge Dr. Mark A.
DeCoster for his assistance in using FM, Jim Spaulding for interesting
scientific discussions as well as the workforce at the Louisiana Tech
dairy for assisting in bovine blood acquisition. This work was sup-
ported in part from the REU Grant award #1062937 by providing
additional research assistance and Dr. Mihaela Paun’s Grant award #
CNCSIS TE-92/2010.
Conflict of interest No benefits in any form have been or will be
received from a commercial party related directly or indirectly to the
subject of this manuscript.
References
1. Platt W (1979) Color atlas and textbook of hematology, 2nd edn.
J. B. Lippincott Company, Philadelphia
2. Alberts B et al (2008) Molecular biology of the cell, 5th edn.
Garland Science, Taylor & Francis Group, LLC, New York
3. Guyton A, Hall J (2000) Text book of medical physiology, 11th
edn. W.B. Saunders Company, Philadelphia
4. Vyavahare K (2006) Computational modeling of nitric oxide
transport in a channel. Thesis, Louisiana Tech University
5. Frilot C (2001) Role of nitric oxide as a modulator of platelet
dense granule release. Thesis, Louisiana Tech Univerisity
6. Eshaq R (2006) The effect of the local concentrations of nitric
oxide and ADP on platelet adhesion and thrombus formation.
Thesis, Louisiana Tech University
7. Mannucci PM, Gorini S (1972) (eds) Advances in experimental
medicine and biology: platelet function and thrombosis: a review
of methods, vol 34. Plenum Press, New York
8. Sherry S, et al. (1969) (eds) Thrombosis. National Academy of
Science, Washington
9. Hinds M, Park Y, Giddens D, Aleviadou B (2001) Local hemo-
dynamics affect monocytic cell adhesion to a three-dimensional
flow model coated with E-selectin. J Biomech 34:95–103
456 M. G. Watson et al.
123

10. Jones SA, Fronek A (1986) Analysis of break frequencies
downstream of a constriction in a cylindrical tube. J Biomech
20(3):319–327
11. Matsusaki M, Ajiro H, Kida T, Serizawa T, Akashi M (2012)
Layer-by-layer assembly through weak interactions and their
biomedical applications. Adv Mater 24(4):454–474
12. Berny M, Patel I, White-Adams T, Simonson P, Gruber A,
Rugonyi S (2010) Rational design of an ex vivo model of
thrombosis. Cell Mol Bioeng 3(2):187–189
13. Spaet T, Zucker M (1964) Mechanism of platelet plug formation
and role of adenosine diphosphate. Am J Phys 206(6):1267–1274
14. Turner N, Moake J, McIntire L (2001) Blockade of adenosine
diphosphate receptors P2Y12 and P2Y1 is reguired to inhibit
platelet aggregation in whole blood under flow. Blood 98:
3340–3345
15. Remijn J, Wu Y, Jeninga E, IJssedldijk M, Willigen G, Groot P,
Sixma J, Nurden A, Nurden P (2002) Role of ADP receptor
P2Y12 in platelet adhesion and thrombus formation in flowing
blood. Arterioscler Thromb Vasc Biol 22:686–691
16. Lopez J (2010) An improved layer-by-layer technique to generate
biointerfaces for platelet adhesion studies: dynamic LbL. Dis-
sertation, Louisiana Tech University
17. Watson M (2010) Surface morphology of platelet adhesion
influenced by activators, Inhibitors and Shear Stress. Dissertation,
Louisiana Tech University
18. Zhao Q, Li H, Li B (2011) Nanoencapsulating living biological
cells using electrostatic layer-by-layer self-assembly: platelets as
a model. J Mater Res 26(2):347–351
19. Yu DG, Jou CH, Lin WC, Yang MC (2007) Surface modification
of poly (tetramethylene adiopate-co-terephthalate) membrane via
layer-by-layer assembly of chitosan and dextran sulfate poly-
electrolyte multiplayer. Colloids Surf B 54:222–229
20. Zhao Z, Qi Y, Wei M, Zhang F, Xu S (2012) Layer-by-layer
assembly and morphological characterizations of DNA/layered
double hydroxide thin films. Mater Lett 78:62–65
21. Rinder C, Student L, Bonan J, Rinder H, Smith B (1993) Aspirin
does not inhibit adenosine diphosphate-induced platelet a-granule
release. Blood 82(2):505–512
22. Weiss H, Turitto V, Baumgartner H (1986) Platelet adhesion and
thrombus formation on subendothelium in platelets deficient in
glycoporoteins IIb-IIa, Ib, and storage granules. Blood 67(2):
322–330
23. Anfossi G et al (2002) Adenosine increases human platelet levels
of cGMP through nitric oxide possible role in its antiaggregating
effect. Thromb Res 105:71–78
24. Kingston J, Bayly W, Sellon D, Meyers K, Waldrop K (2001)
Effects of sodium citrate, low molecular weight heparin, and
prostaglandin E1 on aggregation, fibrinogen binding, and enu-
meration of equine platelets. Am J Vet Res 62(4):547–554
25. Woodell-May J, Ridderman D, Swift M, Higgins J (2005) Pro-
ducing accurate platelet counts for platelet rich plasma: validation
of a hematology analyzer and preparation techniques for count-
ing. J Craniofacial Surg 16(5):749–756
26. Schnabel LV, Mohammed HO, Miller BJ, McDermott WG,
Jacobson MS, Santangelo KS, Fortier LA (2006) Platelet rich
plasma (PRP) enhances anabolic gene expression patterns in flexor
digitorum superficialis tendons. J Orthop Res 25(2):230–240
27. Ehrenfest DM, Rasmusson L, Albrektsson T (2008) Classification
of platelet concentrates: from pure platelet-rich plasma (P-PRP)
to leucocyte- and platelet-rich fibrin (L-PRF). Trends Biotechnol
27(3):158–167
28. Jahanmehr SAH, Hyde K, Geary CG, Cinkotai KI, Maciver JE
(1987) Simple technique for fluorescence staining of blood cells
with acridine orange. Tech Methods 40(8):926–929
Platelet adhesion on d-LbL biointerfaces 457
123
Copyright © 2022 FDOKUMEN