A New Lease on Firm Behavior - KOREAN SECURITIES ...
66
A New Lease on Firm Behavior * Matteo Binfar` e Robert A. Connolly Fotis Grigoris Crocker H. Liu August 21, 2020 Abstract In contrast to other types of debt, the value of operating leases on the firm’s balance sheet is set by the firm. Using new information on operating leases from ASC 842, we examine firm behavior in valuing these leases, specifically, discount rate choices. Based on benchmarks we develop, we find that 20% of firms choose higher discount rates than expected. We consider potential motives for these choices. We find that financially fragile firms systematically choose higher discount rates, apparently to appear healthier. These firms also tend to be more informationally opaque and are less-heavily monitored by outsiders. Keywords: ASC 842, Discount Rate, Operating Lease, Leverage. JEL Classification: G00, G30, G31, G32 * Binfar` e([email protected]) is at the University of Missouri, Robert J. Trulaske, Sr. College of Business. Connolly (robert connolly@kenan-flagler.unc.edu) is at the University of North Carolina, Kenan- Flagler Business School. Grigoris ([email protected]) is at Indiana University, Kelley School of Business. Liu ([email protected]) is the Robert A. Beck Professor of Hospitality Financial Management, School of Hotel Administration, Cornell SC Johnson College of Business, Cornell University. First Draft: November 2019.
-
Upload
khangminh22 -
Category
Documents
-
view
2 -
download
0
Transcript of A New Lease on Firm Behavior - KOREAN SECURITIES ...

A New Lease on Firm Behavior∗
Matteo Binfare Robert A. Connolly Fotis Grigoris Crocker H. Liu
August 21, 2020
Abstract
In contrast to other types of debt, the value of operating leases on the firm’s balancesheet is set by the firm. Using new information on operating leases from ASC 842, weexamine firm behavior in valuing these leases, specifically, discount rate choices. Basedon benchmarks we develop, we find that 20% of firms choose higher discount rates thanexpected. We consider potential motives for these choices. We find that financiallyfragile firms systematically choose higher discount rates, apparently to appear healthier.These firms also tend to be more informationally opaque and are less-heavily monitoredby outsiders.
Keywords: ASC 842, Discount Rate, Operating Lease, Leverage.
JEL Classification: G00, G30, G31, G32
∗Binfare ([email protected]) is at the University of Missouri, Robert J. Trulaske, Sr. College ofBusiness. Connolly (robert [email protected]) is at the University of North Carolina, Kenan-Flagler Business School. Grigoris ([email protected]) is at Indiana University, Kelley School of Business. Liu([email protected]) is the Robert A. Beck Professor of Hospitality Financial Management, School of HotelAdministration, Cornell SC Johnson College of Business, Cornell University. First Draft: November 2019.

1 Introduction
Although the average firm makes economically significant use of operating leases, thelimited operating lease data reported has been relegated to the footnotes of financial state-ments.1 With the new reporting requirements specified in Accounting Standards Update(ASC 2016-02), Topic 842 (Leases) (ASC 842, hereafter), firms are required as of 2019 to(1) record operating lease assets and liabilities on their balance sheets, and (2) reveal toinvestors the firm’s own estimates of the value, average remaining life, and discount rate oftheir operating leases, and the presence of renewal or extension options on existing leases.The more granular disclosure on operating leases is important since the value of all types ofbalance sheet debt in a firm’s capital structure is objectively determined except for the valueof leases which is subjectively determined by the firm.2
In this paper, we study the subjective choice of the discount rate that managers use invaluing their operating leases, and the array of related operating lease characteristics. UnderASC 842, managers have discretion in choosing an operating lease discount rate, although thisrule does provide explicit guidelines on the discount rate choice. Specifically, when possible,firms should use the rate implicit in the lease terms, otherwise, the discount rate should reflectthe firms’ incremental borrowing rates. This guidance notwithstanding, the incentives formanagement seem straightforward. If a firm applies an unusually high discount rates to theirlease-related commitments, then unusually low operating lease liabilities and therefore, lowerleverage are reported on the firm’s balance sheet.3 As such, we are particularly interested inthe extent to which firms use unusually high discount rates in valuing their operating leases.
Ex-ante, it is unclear which type of firm will choose to use a high discount rate since weshow that high discount rates are associated with firms that have a low-Tobin’s q as well asfirms that possess a high-Tobin’s q. However, the possible reason(s) for the high discount ratediffers with credit and default risk likely driving the high rates for low-q firms. In contrast,growth options are the likely catalyst for high-q firms choosing high discount rate.
To assess whether a firm chooses a lease-related discount rate far above (or below) itsnormal incremental borrowing rate, we scrape new information on operating leases from
1Eisfeldt & Rampini (2009, p. 1624) say, “Quantitatively, leasing is of first-order importance as a source offinancing...the fraction of capital that firms lease in merged Census-Compustat data is 16%, which is similarto the long-term debt-to-assets ratio of 19%. Graham et al. (1998) report that operating leases, capital leases,and debt are 42%, 6%, and 52% of fixed claims, respectively, in 1981-1992 Compustat data...Moreover, weshow that for small firms, leasing is even more important; firms in the smallest decile lease 46% of theircapital. Leasing may hence be the largest source of external finance for these firms.”
2The value of leases is bounded above by the fair market value of the leased asset. However, ASC 842does not require the firm to disclose the market value of the leased asset.
3Prior to ASC 842, credit rating agencies, analysts, and investors made ad-hoc adjustments to accountfor operating leases. See Liu (2020) for more on how rating agencies operate.
1

annual and quarterly reports filed with the Security and Exchange Commission (SEC) inthe EDGAR database for the universe of firms that have already adhered to the ASC 842reporting standard. We measure the portion of the discount rate not explained by firm-levelrisk measures, differences in the remaining lives of operating leases, lease intensity (lease-to-asset ratios), options to extend or renew existing leases, and industry effects. We alsocompare the actual lease-to-asset, lease-to-adjusted asset, and adjusted-leverage ratios thatfirms report to comply with ASC 842 with proxies implied by various methodologies proposedby Graham et al. (1998), Rauh & Sufi (2012), Cornaggia et al. (2013), and Graham & Lin(2018). We compare these ratios at both quarterly and annual frequencies.
The evidence suggests that 20 percent of firms apply discount rates to their operatinglease commitments that are likely too high compared to their normal borrowing rates. Thissystematically understates the operating lease measures on their balance sheets. We showthat firms choose a discount rate for leases that likely reflects the unsecured (or subordinated)cost of debt even though operating lease contracts do not convey asset ownership to thelessee, and lease payments have priority in bankruptcy settings. The lessor also has the rightto repossess the underlying asset in the event that the lessee enters bankruptcy.
Boyd Gaming, a gaming and hospitality company, offers a stark example of what wedocument in this paper. On March 31, 2019, the company reported a weighted-averagediscount rate of 9.3 percent for its operating leases. The average coupon of its last five bondswas about 6.1 percent, and the corresponding 5-year corporate yield curve for a BB rated firmat that time was about 5.23 percent (Boyd Gaming Corp had a rating of B+, and its secureddebt would have been valued at approximately one notch above its unsecured rating).4 Whilethe calculations underlying the self-reported 9.3 percent discount rate are not disclosed, thefact that this self-reported discount rate is largely different from and higher than the otherdiscount rates an outside investor may use to value the leasing commitments of Boyd GamingCorp raises questions about the operating lease data disclosed under ASC 842.
Our data shows that firms, on average, choose to discount future lease payments atapproximately 5.6 percent. Discount rate choices, however, mask significant heterogeneityacross firms: rates vary from 0.33% to nearly 14.5%. Similarly, firms use operating leaseswith remaining lives of about 8 years. Some companies rely more heavily on short-termleases than other firms, perhaps as a result of their asset composition and capital structuredecisions. The data also reveal a large degree of heterogeneity between and within industries.For instance, firms in industries such as finance and utilities rely on low proportions of leases,with lease-to-asset ratios less than 2 percent. These leases are also long-lived, and discountedat relatively low rates of approximately 4.5 percent. This contrasts sharply with the high
4The yield-to-worst for Boyd Gaming 6.00% 2026-08 USD was 5.58% on April 1, 2019 (S&P Capital IQ).
2
discount rates used by healthcare companies (7.6 percent), or the heavy reliance on operatingleases for firms in the retail and wholesale sector with lease-to-asset ratios of about 16 percent.
For 80 percent of firms, we find that operating lease liability values based on ASC 842closely match values estimated using approximations from the literature.5 Perhaps notsurprisingly, the main difference lies in the discount rate used to value future cash payments.For instance, Graham et al. (1998) use a 10 percent discount rate (and does not include thethereafter portion of lease payments, due to data limitations), and relative to the ASC 842data, this approximation underestimates lease intensity. On the other hand, Rauh & Sufi(2012) slightly overstate lease liabilities, as they use A-rated yields for all firms.6
We consider several motives as to why firms select a higher-than-expected discount rate.One possibility is that operational considerations rather than financial constraints could drivethis decision. Jagannathan et al. (2016) argue that firms use higher discount rates to foregocurrent profitable opportunities in favor of more valuable future investment opportunities.These firms are not financially constrained, but applying unusually high discount ratesmeans they can accumulate cash in anticipation of very profitable future projects. A furtherplausible rationale for using a higher than expected discount rate is that these firms attemptto minimize agency and financial distress costs to preserve or increase their unused debtcapacity. This might be particularly important for a firm with weak governance and minimalexternal monitoring (e.g., no public debt and few analysts who follow the firm). Under thesecircumstances, these firms may also appear to manipulate their earnings to conceal theirfinancial distress, meaning that reported earnings are more likely to be restated. Finally, it isconceivable that firms choose higher discount rates on leases to minimize debt and therebyavoid higher equity costs.7 Of course, these considerations are not mutually exclusive.
We find that self-reported discount rates are highly correlated with most risk measures,especially those most related to default risk (e.g. CDS spreads). Firm characteristicsexplain most of the differences in weighted-average discount rates. Our benchmark cross-sectional regressions explain almost 50% of the variation in discount rates, with 70% of this
5Although the corporate finance and accounting literature have suggested various ways to account forleases (see, e.g., Cornaggia et al. (2013); Graham et al. (1998); Graham & Lin (2018); Rauh & Sufi (2012),the lack of direct data has blocked a consensus among researchers and market participants alike on the valueof these approximations.
6We also acknowledge, however, that values based on the new rule may contain distortions and misrepresenteconomic fundamentals in the context of leases. Therefore, market participants likely benefit from usingmultiple proxies for operating leases, despite potentially ad hoc assumptions. These potential benefits seemhighest in highly levered, riskier, and less profitable firms, where the gains from choosing higher discountrates are likely most significant.
7Recall that the beta for a firm that has debt is βL = βU
[1 + (1− τ) Debt
Equity
]and the cost of equity is
ke = Rf + βL (RM −Rf ). As such, the higher the debt-to-equity ratio, the higher the levered beta (βL) andin turn the higher the cost of equity, ceteris paribus.
3

explanatory power coming from firm-level characteristics. Specifically, leverage, profitability,and idiosyncratic volatility alone account for 50% of this variation in discount rates. Incontrast, variation in operating lease terms – lease-to-asset ratios, remaining lives, and optionsto renew/extend leases – appears largely to reflect industry effects. For example, while ourbenchmark cross-sectional regressions explain about 40% of the variation in lease intensityacross firms, 87% of this explanatory power is attributed to industry fixed effects. Thesefindings support the view that managers of low-q firms (as opposed to high-q firms) exploitconsiderable flexibility in choosing discount rates, whereas the firm’s other lease-relatedchoices reflect industry-level practices.
Our study makes several important contributions to the extant literature. In contrastto the prior literature which either uses a survey approach (see Jagannathan et al. (2016))or an approximation method (Cornaggia et al. (2013); Graham et al. (1998); Graham &Lin (2018); Rauh & Sufi (2012)) to estimate the unobservable discount rate, we are ableto directly observe the actual discount rate that a firm uses given the new ASC 842 filingrequirement. Using this new information on operating leases, we are able to validate whetherapproximations in the literature for capitalizing operating leases are in close alignment tothe actual amounts that firms must now disclose. We are also able to reexamine which firmand/or industry attributes account for a higher discount rate. In the process, we provide thefirst detailed characterization of this new operating lease data.
Most importantly, our study provides new insights into the behavior of management withrespect to how they choose to represent the level of debt in their capital structure. Managersof low profitability firms who are heavily levered, are riskier, and/or have lower credit qualitytend to choose higher discount rates. These same firms tend to be more opaque (followed byfewer analysts; have less institutional ownership; have a lower quality internal informationenvironment) than their low discount rate peers. There is also a greater likelihood that ratingagencies and stock analysts tend to underestimate the actual risk for these firms. For instance,we find that stock analysts produce significantly less accurate forecasts of the earnings ofhigh discount rate firms. Combined, this evidence implies that firms choosing high discountrates for their operating leases are also lower quality firms along other dimensions.
A complementary contribution of our study is to assess whether the intended benefitsof ASC 842 (i.e., increased transparency in reporting lease assets and liabilities) have theunintended consequence of allowing the most financially fragile firms to appear healthier.That is, we examine whether the discretion provided by ASC 842 allows firms to reportsignificantly lower operating lease liabilities on their balance sheets than the values impliedby the traditional methods for capitalizing leases. Our analysis suggests that drawing onfirms’ self-reported balance sheet lease liabilities should, for the most part (80% of firms),
4

circumvent the need to apply approximations proposed in the literature. However, for thesubsets of highly levered and low profitability firms, academics and practitioners may bebetter off relying on approximations in the literature, and thereby avoiding the effects of thesubjective distortions we document in this paper.
Our work adds to a long literature on the economic consequences of changes in accountingstandards, and provides a new benchmark for the empirical corporate finance literature thatconsiders the role and economic significance of operating leases in firms’ capital structures.
Our paper proceeds as follows. Section 2 discusses the institutional details surroundingASC 842 versus the approximation methods commonly used in the empirical corporate financeliterature. Section 3 describes our sample and data collection methods. We also comparemeasures delivered by existing operating lease valuation approximations and values deliveredunder ASC 842. Section 4 provides an in-depth analysis of discount rate choices, the valueimplications for operating leases, and the role of financial contracting costs and financialdistress, while Section 5 studies the determinants of other lease characteristics. A final sectioncontains a summary of the paper and discussion of additional future research issues.
2 Measuring Operating Leases
2.1 ASC 842: New Operating Lease Disclosure Rules
The foundation of the empirical work reported in this paper is the significant change in howfirms must report the value of leases on their financial statements.8 Under the prior disclosurerule, ASC 840, capital (or finance) leases were reported on firms’ financial statements, butdata on operating lease commitments were reported only in financial statement footnotes. Aset of tests determined whether a lease was regarded as an operating lease or financial lease.9
If any of these requirements were satisfied then the lease was classified as a capital lease, and
8A tentative version of the new rule first appeared in a preliminary document circulated by FASB and theIASB in 2009. This was followed by an exposure document in 2010, a revised version in 2013, and a furtherrevised final document in 2016 (ASC 842). As of early 2020, the date when private firms and certain otherentities must adhere to the new rules has been slipped further into the future, largely over concerns aboutthe cost of implementation. As Khan et al. (2018, pg. 212) note, lease accounting changes have a history ofbeing controversial: “the FASB’s precursor, the Accounting Principles Board (APB), was eventually undoneby at least three visible instances in which industry lobbyists prevented it from issuing accounting standardsrelated to (1) the accounting for marketable securities, (2) long-term leases, and (3) exploration and drillingcosts for oil and gas that were opposed, respectively, by the insurance, leasing, and petroleum industries.”
9The specific tests are as follows: a) Leased asset ownership transfers to the lessee at lease termination, b)Lessee has a purchase option for the leased asset at a bargain price at lease termination, c) Lease term equalsor exceeds 75% of leased asset’s economic life, d) Present value of minimum lease payments was greater thanor equal to 90% of leased asset fair value lease inception where these payments include any required lesseeguarantee of leased asset residual value to the lessor at lease termination.
5

would therefore be reported on financial statements. ASC 842 defines an operating lease asa contractual arrangement that conveys to the lessee the right to “control” the use of an“identified asset.” The new rule also exempts firms from reporting all leases with a term of 12months or less.10
The principal impact of the new standard is that lessees must now recognize a right-ofuse asset and a lease liability for virtually every lease (so total assets and liabilities rise onthe balance sheet). The value of the right-of-use asset is the capitalized value of the sum ofthe initial measurement of the lease liability and any lease payments made to the lessor ator before the commencement date, less any lease incentives received, and any initial directcosts incurred by the lessee. Once the lease accounting standards are implemented, standardleverage measures should rise as a result of more debt on the balance sheet.11 Typical liquiditymeasures will also deteriorate, since current liabilities now include the current portion ofoperating lease obligations. However, only the recent changes in finance lease accounting willaffect profitability measures.12
Central to our analysis is the fact that ASC 842 provides guidelines on the discountrate that firms should use to value operating lease commitments. The guidelines state that,when possible, firms should use the rate implicit in the lease terms (previously discussed).Otherwise, the discount rate should reflect firms’ incremental borrowing rates. Spot checksof firms’ 10-K/Qs prepared in accordance with ASC 842 indicate that most firms opt to usethe incremental borrowing rate when valuing their lease portfolios.13
Publicly-traded firms must conform with the new rules for annual reporting periods(including quarterly periods therein) starting after December 15, 2018. Firms must choosewhether to apply the new accounting standard to prior periods, thereby restating values for
10In addition, the following contracts are outside the scope of the leasing rules: leases of inventory orof construction in progress, leases of intangible assets, including licenses of internal-use software, leases toexplore for or use natural resources, leases of biological assets, and service concession arrangements withinthe scope of ASC 853.
11Rating agencies like Moody’s and investors have long made adjustments for operating leases, so it isunclear whether there is significant new information associated with the new lease accounting standards (see,e.g., Liu (2020) for more on how rating agencies operate). Moreover, Palazzo & Yang (2019) document thatbook leverage does indeed increase once the new accounting standards are implemented.
12For the income statement, the cost of the operating lease is calculated on a straight-line basis over thelease term. The right-of-use asset amortization rises as the interest expense on the liability declines. Financelease reporting depends on a financing model. Consequently, the lease expense declines during the lease term.
13PWC (2019, Section 3.3.4.6) discuss the discount rate requirements under the new accounting standard.Where possible, firm should value their leases using ”the rate of interest that, at a given date, causes theaggregate present value of (a) the lease payments and (b) the amount that a lessor expects to derive from theunderlying asset following the end of the lease term to equal the sum of (1) the fair value of the underlyingasset minus any related investment tax credit retained and expected to be realized by the lessor and (2) anydeferred initial direct costs of the lessor.” The same section of PWC (2019) report defines the incrementalborrowing rate as ”the rate of interest that a lessee would have to pay to borrow on a collateralized basisover a similar term an amount equal to the lease payments in a similar economic environment.”
6

earlier periods. If the firm chooses to do so, it applies the new leasing rules to each leasethat existed at the beginning of the earliest comparative period presented in the financialstatements (e.g., January 1, 2017 for a calendar year-end publicly-traded company) andleases that commenced after that date. For leases that began before the earliest comparativeperiod presented, a cumulative effect adjustment is recognized as of that date (e.g., January1, 2017 for a calendar year-end publicly-traded company).14 Firms could alternatively chooseto apply the new rules to each lease in effect as of the beginning of the reporting period inwhich the entity first applies the lease standard with a cumulative effect adjustment as ofthat date. Prior comparative periods would be not be adjusted under this method. Theapplication date is January 1, 2019 for a calendar year-end publicly-traded company choosingthis approach. Regardless of the transition choice that a firm makes, the firm’s classificationof existing leases and its identification of leases in contracts does not need to be reassessed.Consequently, lessees are generally carrying forward the existing lease accounting balanceswhen applying the new rules.
Finally, under the new rules, the existence of either a renewal or termination optionrequires lessees and lessors to determine the length of the lease term at the start of the lease.If the lessee is reasonably certain to exercise the renewal option (or not exercise terminationoptions), this extends the lease termination date and requires that any lease with a likelyextension period that lasts in total for more than 12 months be reported under the newaccounting standards. Under ASC 842, firms must also report the weighted-average life ofoperating leases. Using the information on operating leases as a result of the new disclosurerules one is now able to observe for the first time the discount rate that a firm chooses, thelease payments, the value of the operating lease as well as their choice of lease terms.
2.2 Approximation Methods for Capitalizing Operating Leases
This section briefly discusses four of the most common empirical proxies for the capitalizedvalue of operating leases on a firm’s balance sheet that arose as the result of the older ASC840 accounting standard. This older disclosure rule only required firms to report limitedinformation related to leases in the footnotes of their financial statements. Consequently,past studies had to estimate the present value of operating lease liabilities using data limitedto the minimal rental commitments due in (i) the current fiscal year, (ii) each of the nextfive fiscal years, and (iii) all fiscal years thereafter reported as a single, lump sum figure. Inaddition to making assumptions regarding the distribution of future rental commitments,
14The “look-back period” covers the time from the start of the earliest comparative period until immediatelybefore the effective date. For a calendar year-end publicly-traded company adopting the standard on January1, 2019, the look-back period is January 1, 2017 through December 31, 2018.
7

researchers also had to specify the discount rate used to calculate the present value of theselease payments.
For this discussion, we denote the minimum rental commitment owed by firm i in thecurrent fiscal year t as XRENTi,t, the rental commitment owed in fiscal year t + τ asMRCi,t+τ , and the sum of rental commitments due after fiscal year t + 5 as MRCAi,t+5.ri,t refers to the discount rate applicable to the lease commitments in fiscal year t, whileNi denotes the estimate of the remaining life of firm i’s operating leases after year t + 5.Finally, OpLeasesMi,t represents the estimated value of firm i’s operating leases as of fiscalyear t according to method M .
2.2.1 Graham et al. (1998)
Graham et al. (1998) measure the value of operating leases as the current-year rentalexpense plus the present value of rental commitments over the next five fiscal years, discountedat a constant rate of ri,t = r = 10% for all firms and time periods,15 or
OpLeasesMi,t = XRENTi,t +5∑
τ=1
MRCi,t+τ(1 + r)τ . (1)
In contrast to the other methodologies, described below, the Graham et al. (1998) measuredoes not incorporate the value of operating leases remaining after fiscal year t+ 5, due todata limitations at the time of the study.
2.2.2 Rauh & Sufi (2012)
Rauh & Sufi (2012) measure the value of operating leases as the sum of the present valuesof both the rental commitments over the next five years and the estimated value of the rentalcommitments due thereafter. The magnitude of the rental commitment due in each yearbetween fiscal year t+ 6 to fiscal year t+ 6 +Ni is denoted as MRCi, which is defined asMRCAi,t divided by Ni. Here, Ni is equal to MRCAi,t divided by 1
5∑5τ=1 MRCi,t+τ , rounded
to the nearest year.16 Additionally, ri,t = rt is set to the time t zero-coupon yield associatedwith A rated corporate debt, drawn from Bloomberg, for all firms. Thus, the Rauh & Sufi
15This constant discount rate of 10% is consistent with the average short-term borrowing rate of 9.6%over the sample period underlying Graham et al. (1998).
16The assumption behind this definition of Ni is that rental commitment due in each period beyond yeart+ 5 is equal to the average rental commitment between year t+ 1 and year t+ 5.
8

(2012) measure of operating lease liabilities is
OpLeasesRSi,t =5∑
τ=1
MRCi,t+τ(1 + rt+τ )τ
+6+Ni∑τ=6
MRCi
(1 + rt+τ )τ. (2)
2.2.3 Cornaggia et al. (2013)
Cornaggia et al. (2013) measure the value of a firm’s operating leases as the sum of thecurrent-year rental expenses plus the present value of future minimum rental commitments overthe remaining life of the firm’s operating leases. Similar to the Rauh & Sufi (2012) measure,the estimated lease commitments beyond year t + 5 are denoted MRCi = MRCAi,t/Ni,where Ni is MRCAi,t/MRCi,t+5 rounded to the nearest year. This suggests that a firm paysa lease expense equal to MRCi,t+5 for the Ni years beyond fiscal year t+ 5. Unlike Rauh &Sufi (2012), but in line with Graham et al. (1998), the discount rate used to determine thepresent values is set equal to a constant value of ri,t = r = 10% for all firms. Consequently,Cornaggia et al. (2013) measure operating leases as
OpLeasesCFSi,t = XRENTi,t +5∑
τ=1
MRCi,t+τ(1 + r)τ + MRCi,t+5
(1 + r)5 ×1r
[1− 1
(1 + r)Ni
]. (3)
2.2.4 Graham & Lin (2018)
Graham & Lin (2018) also measure the capitalized value of operating leases as the sum ofthe present value of both the rental commitments over the next five years and the estimatedvalue of the rental commitments due thereafter. Graham & Lin (2018) measure operatingleases similar to the Cornaggia et al. (2013) method. However, instead of using a constantdiscount rate across all firms and years, Graham & Lin (2018) employ a firm-specific discountrate. Here, ri,t = ri is set equal to a firm’s interest expense (Compustat annual item XINT)divided by the sum of short-term and long-term debt (Compustat annual items DLC andDLTT, respectively) if possible, and the median value of ri within the same two-digit SICcode industry if the firm’s interest expense is zero or missing. Thus, according to this measure,
OpLeasesGLi,t =5∑
τ=1
MRCi,t+τ(1 + ri)τ
+ MRCt+5
(1 + ri)5 ×1ri
[1− 1
(1 + ri)Ni
]. (4)
9

3 Data and Summary Statistics
3.1 Data Sources and Sample
We download all annual and quarterly reports (Form 10-K and 10-Q) filed with theSecurity and Exchange Commission (SEC) in the EDGAR database. We scrape these filingsfor information related to operating leases from the Balance Sheet and the Notes to FinancialStatements, which contain supplemental cash flow and balance sheet information relatedto leases (both operating and finance). In particular, we extract the value of the lessee’sright to use the assets underlying their operating leases, the present value of the lessee’sdiscounted operating lease payments (which includes current operating lease liabilities, andlong-term operating lease liabilities), the weighted-average remaining lease term for operatingleases, any option to renew or extend implicit in the lease contract, and the weighted-averagediscount rate for operating leases. We also gather the current portion of operating leasesexpensed on the income statement (for the first m months of the current fiscal year as of thefiling date), and the approximate future remaining lease payments as of the filing date (inexcess of one year due in the remainder of the fiscal year following the latest fiscal year).
As an example of the data we gather, Figure 1 shows the supplemental balance sheetinformation related to leases for Microsoft as of September 30, 2018. Operating lease liabilities(i.e. the present value of future lease payments) stood at $7,024 million, with a weighted-average remaining lease term and discount rate of 7 years and 2.8 percent, respectively.
We start with 19,586 annual and quarterly filings that report positive figures for thepresent value of operating leases. We then merge this operating lease data with CRSP andCompustat, which leaves us with 17,724 firm-year-quarter observations. These represent 3,795unique firms from December 31, 2017 to April 30, 2020. We drop observations with missingvalues for both the weighted-average discount rates and the maturity for operating leases, andonly retain the first year-quarter observation in which a firm adopts the new lease rule. Thisfiltering procedure leaves us with 3,550 firm-year-quarter observations. Approximately 72percent of firms adopt the new rule as of March 31, 2019. A handful of firms (e.g. MicrosoftCorporation, Target Corporation, etc.) are early adopters, while about one-fourth of firmsreport after the first quarter of 2019. Table 1 summarizes the sample construction and timingof adoption of the new ASC 842 rule.
Stock prices and firm characteristics are obtained from CRSP and Compustat, respectively.We compute idiosyncratic volatility and stock betas using 2 years of monthly stock returnsand a minimum of six observations (i.e. six months). We compute a measure of thecost of debt (Kd) using bank loan data from DealScan. Implied-CDS spreads come fromBloomberg. The number of analysts following a firm is from I/B/E/S, and we compute a
10

measure of standardized unexpected earnings following Livnat & Mendenhall (2006). Dataon institutional ownership is from Thomson-Reuters S-34, while measures of discretionaryaccruals and earnings announcement speed follow Kothari et al. (2005) and Gallemore &Labro (2015), respectively. The Online Appendix provides detailed variable descriptions.
3.2 Overview of Operating Lease Characteristics
In this section we describe the use of operating leases within our sample of 3,550 firms, andacross industry groups. We focus on six key variables: (i) the capitalized values of operatingleases, (ii) the right-of-use asset of operating leases, (iii) the proportion of capitalized leases toadjusted assets, which is a firm’s total assets plus the value of the right-of-use asset associatedwith the firm’s operating leases,17 (iv) the weighted-average discount rate used to valueoperating lease commitments, (v) the weighted-average life of operating leases, and (vi) anyoptions to renew or extend the existing operating leases. Our focus on these six variableswhere disclosure is now required provides us with the unique opportunity to observe directlythe capitalized value of firm-level operating leases. Consequently, in contrast to the priorliterature, we can generate insights into the use of operating leases across firms and industrieswithout the need to estimate the value of leases using any of the competing methods wediscussed in Section 2.
Panel A of Table 2 provides summary statistics associated with the observed values ofthese leasing variables across the firms in our sample. The average (median) firm relies onabout $243 ($34) million worth of operating leases that account for 5.22% (2.66%) of thefirm’s total adjusted assets. This lease ratio is similar to, albeit somewhat lower, than the8% figure reported in Graham et al. (1998). The mean discount rate used to compute thepresent values of these lease obligations is 5.66% per annum, but with a range from 0.33% to14.45% per annum. The mean life of operating lease commitments is 8.24 years, althoughthe reported average life of the operating leases ranges from less than one year to 53 years.Finally, 36% of firms in our sample have lease agreements that contain options to renew orextend their original terms.
While both the lease-to-assets ratio and the weighted-average life of leases are relativelyright skewed, the distribution of discount rates reported by firms is more symmetric. Figure2 plots the densities of the lease-to-asset ratio (top left panel), weighted-average discountrate (top right panel), and weighted-average life of operating leases (bottom left panel) and
17ASC 842-20-30-5 states that at the commencement date, the value of the right-of-use asset consists of(a) the amount of the initial measurement of the lease liability, (b) any lease payments made to the lessorat or before the commencement date, minus any lease incentives received, and (c) any initial direct costsincurred by the lessee.
11

highlights these data features. The figure also displays the average discount rate reportedby firms as a function of the average life of operating leases in the bottom right panel. Thebottom right panel shows that while firms assume discount rates of approximately 7% perannum for leases with an average life of three years or less, the average discount rate tends islower for longer-lived leases. For instance, the mean discount rate associated with 20- and30-year leases is about 5.5% (5.75%) per annum, respectively.18
Panel B of Table 2 describes the accounting and return-based characteristics of the firmscomprising our sample. While the average firm is 23 years old and owns roughly $9.4 billionof assets, substantial heterogeneity exists with respect to both firm age and size. The smallest(largest) firm owns $9 million ($221 billion) of assets, and the youngest (oldest) firm is oneyear (70 years) old. While the accounting profitability of the average firm, as measured byreturn on assets, tends to be negative, the median leverage ratio is only 0.27. This indicatesthat most firms only have a moderate amount of leverage in their capital structures. Themean (median) tangibility ratio is 0.22 (0.13), and the mean (median) Tobin’s q of firms is2.07 (1.39). Lastly, firms have a median idiosyncratic volatility of 38% per annum associatedwith their stock.
In Table 3 we breakout the summary statistics related to the total capitalized value ofoperating leases, lease-to-asset ratio, weighted-average discount rate, weighted-average life ofleases, and option to extend or renew existing leases across Fama and French 12 industrygroups. The primary takeaway from this table is that there is a large degree of heterogeneityin the use, cost, and life of operating leases across industries. For instance, firms in industriessuch as finance and utilities tend to rely on low proportions of operating leases in theircapital structures, and exhibit average lease-to-asset ratios of 0.018. The operating leases ofthese finance and utilities firms are generally long lived, with mean lives of 13 years, andare discounted at relatively low discount rates of 4.40% per annum and 4.78% per annum,respectively. In contrast, 16.3% of the assets of retail firms are obtained via operating leasesthat are shorter lived than those of financial and utility firms, lasting 8.67 years on average,and are also discounted at a higher mean discount rate of 5.69% per annum. Finally, almosthalf (two-fifths) of healthcare (wholesale & retail) firms in our sample rely on options toextend or renew existing leases, while only 24% in the oil & gas, and chemical industries.
Figures A.3, A.4, and A.5 in the Online Appendix extend the previous analysis by showingthe distributions of the lease ratio, weighted-average discount rate, and weighted-average lifeof leases within each of the Fama and French 12 industry groups. The primary takeaway from
18The downward sloping nature of the bottom-right panel of Figure 2 holds true when we plot mediandiscount rates across weighted-average life buckets. However, downward slopes seem to be a feature ofnon-rated firms (see Figure A.1 in the Online Appendix). We also find that the shape of the term structurevaries across industry groups, as depicted in Figure A.2 in the Online Appendix.
12

these figures is that in addition to the vast degrees of heterogeneity across industry groups,there is also a large amount of variation in each variable of interest within industry groups.
Overall, the summary statistics in this section show that there is a large degree ofvariation in lease ratios, discount rates, and lengths of operating leases both within and acrossindustries. Since our analysis is based on the observable values of operating leases reportedon firms’ balance sheets in accordance with ASC 842, it is useful to consider whether our newunderstanding of operating lease activity in the United States aligns with, or differs from,the results of prior studies that are based on estimated values of operating leases, such as thework of Rauh & Sufi (2012). We will now address this question as a prelude to examiningthe firm’s decision on which discount rate to use to capitalize operating leases.
3.3 Actual vs. Estimated Operating Lease Values
As previously noted, ASC 842 requires firms to capitalize most of their leases on theirbalance sheets rather than relegate them to the footnotes of financial statements as wasallowed under ASC 840, the previous standard. In this section we compare actual lease-to-asset ratios reported by firms in accordance with ASC 842 to proxies for the lease-to-assetratios implied by various methodologies proposed in the prior literature.
In contrast to the data on the capitalized value of operating leases considered in thisstudy, which are drawn from the 10-K/Q filings of listed corporations, prior studies estimatedthe capitalized values of firms’ operating leases by making assumptions along two maindimensions: (1) the magnitudes of the future commitments related to firms’ leases, and (2)the discount rate applicable to future lease payments. While prior studies use CompustatAnnual data to compute annual lease-to-asset ratios, our use of data obtained from firms’10-Qs implies that, with the introduction of ASC 842, lease-to-asset ratios can now beconstructed on a quarterly basis. With this difference in the increased frequency of theavailable data in mind, Table 4 not only compares lease ratios across methodologies, but alsoconsiders how each proxy performs at both a quarterly and an annual frequency.
Table 4 compares the mean and median values of the actual capitalized values of operatingleases, obtained via the new disclosure rules underlying ASC 842, to the estimated capitalizedvalues of operating leases calculated using each of the four methodologies described in Section2.2. This comparison allows us to determine whether our assessment of the operating leasevalues on the balance sheet changes as a result of the new ASC 842 accounting standard. Wenot only compare the standard lease-to-asset ratio across methodologies at both the quarterlyand annual frequency in Panel A of Table 4, but also examine the adjusted lease ratios inPanel B and the adjusted leverage ratios of firms in Panel C. This examination of adjusted
13

lease and leverage ratios recognizes that operating leases not only commits firms to futurelease payments, but also provide firms with right-to-use assets.19
Panel A of Table 4 shows that when lease-to-asset ratios are computed using quarterly10-Q data, the mean (median) lease ratios of 0.063 (0.027) obtained after ASC 842 takeseffect is most similar to the ratios computed using the methodology proposed by Graham &Lin (2018) (0.067 and 0.027, respectively). On average, the methodologies of Graham et al.(1998) and Cornaggia et al. (2013) underestimate the reported lease ratio, while the Rauh &Sufi (2012) method overestimates the reported lease ratio. Panel B shows that results relatedto the quarterly adjusted lease ratio are similar to those related to the standard lease ratio.
The method that Rauh & Sufi (2012) propose tends to overestimate the capitalized valueof operating leases as the result of discounting all firms’ operating lease commitments atrates based on the yields on A-rated corporate debts. The time-varying yields are oftenmuch lower than the discount rates assumed by other methodologies. For instance, bothGraham et al. (1998) and Cornaggia et al. (2013) discount lease commitments at a flat rateof 10% per annum. While this discount rate reflected average market conditions during timeperiod underlying Graham et al. (1998), this constant rate is too high in the period followingthe publication of Graham et al. (1998). Furthermore, due to a lack of data at the time ofpublication, the method proposed by Graham et al. (1998) is unable to account for leasecommitments remaining beyond fiscal year t+ 5.
When we compute (adjusted) lease ratios using Compustat Annual data in Panel A(Panel B) of Table 4 we see that the estimated value of leases-to-assets tends to rise anddepart from the reported lease-to-asset ratio calculated using the Rauh & Sufi (2012) andCornaggia et al. (2013) methods. However, the lease ratios based on Graham & Lin (2018) aretypically consistent with the reported lease ratio at both the traditional, annual, frequencyof investigating leasing activity in the cross-section of public firms and our novel, quarterly,frequency of investigating leasing activity amongst public firms.
In Panel C of Table 4 we conduct a similar analysis but focus on the adjusted leverageratios of firms. This focus on adjusted book leverage recognizes that operating leases providefirms with right-to-use assets in addition to committing firms to future lease payments. Thismeans that the impact of operating leases on book leverage has to take account of the factthat both total leverage and total assets rise as the result of operating leases. The resultsshow that the mean and median adjusted book leverage ratios for all methods are within0.5 percentage points of the reported adjusted book leverage ratio. This conclusion holdsregardless of whether leverage ratios are computed at a quarterly or an annual frequency.
19We compute the adjusted leverage ratio as book leverage plus the present value of operating leaseliabilities, scaled by the total value of assets plus the right-of-use asset of operating leases.
14

Overall, the results in Table 4 indicate that prior to ASC 842, the method for capitalizingoperating leases payments suggested by Graham & Lin (2018) produced the best estimates ofthe balance sheet values of operating leases. Although the method proposed by Rauh & Sufi(2012) (Cornaggia et al. (2013)) tends to slightly overestimate (underestimate) the reportedbalance sheet values obtained via ASC 842, analyses based on these latter two methods alsodepicted an accurate view of leasing activity in the cross-section of firms.20
While the aforementioned traditional methods of capitalizing operating lease paymentsproduce estimates of the values of leases that are, on average, close to those reported byfirms in accordance with ASC 842, there is an important distinction to keep in mind. Thetraditional methods provide objective estimates of the balance sheet values of operating leasesthat only differ in terms of (i) the discount rate used to value lease payments (which is eithera constant rate, or observable from market prices), and (ii) the assumptions employed to splitthe “thereafter” portion of operating leases into a series of future payments with a specificmaturity. In contrast, the balance sheet values of operating leases self-reported by firmscomplying with ASC 842 are somewhat subjective since firms do not disclose complete detailson their lease portfolio and there is discretion in choosing the discount rate used to valueoperating lease obligations (e.g., the incremental borrowing rates used to value leases).
Given the discretion that firms have in preparing financial statements to comply with ASC842, the next sections examine the relation between firm characteristics and lease contractualterms. Specifically, we investigate why are firms more likely to take advantage of the discretiongranted by ASC 842 to capitalize their leases. Do low-q firms use abnormally higher discountrates to value their leases? Is this also the case for high-q firms? Do highly levered firmsuse abnormally higher discount rates to value their leases, thereby adding abnormally lowerlease liabilities to their already stressed balance sheets? We examine various motives for thisbehavior, and in the process, we also investigate the degree to which firm characteristicsand/or industry attributes are related to firm behavior (e.g., do less profitable firms usehigher discount rates to value their leases?). These analyses provide market participantsand policy makers with the first look into whether the intended benefits of ASC 842 (i.e.,increased transparency in reporting lease assets and liabilities) also have an unintended costof granting the most fragile firms with the means to report significantly lower operating leaseliabilities on their balance sheets than the values implied by the traditional methods forcapitalizing leases.
20In Table A.1 of the Online Appendix we provide more granular evidence on the performance of eachmethodology by conducting the previously described analysis within each Fama-French 12 industry group.
15

4 Choice of the Lease Discount Rate
4.1 Basic Evidence
ASC 842 requires firms to use the rate implicit in the lease to discount future leasepayments. Whenever this rate is unavailable, firms may use the incremental borrowingrate, which is the rate that a firm could borrow at on a secured basis with terms similar tothe terms specified in the lease contract. Although we unable systematically to distinguishbetween implicit and incremental borrowing rates, spot checks of 10-K/Q filings suggest thatmost firms use the latter when discounting future cash flows. Figure 3 depicts the meanvalues of weighted-average discount rates across deciles of firm characteristics. While totalassets and firm age exhibit a monotonically decreasing pattern, discount rates increase withbook leverage, idiosyncratic volatility, and deteriorating credit ratings. Most interestingly,Tobin’s q exhibits a J -curve or smile effect: discount rates decrease with higher investmentopportunities for low-q firms, and subsequently increase as we move to higher q deciles. Thissuggests that both low-q firms and high-q firms have high discount rates. The high discountrate for low-q is likely associated with credit and default risk. In contrast, growth optionsare the probable reason for the high discount rate associated with high-q firms.
To more formally examine the extent to which discount rates vary across firms, we employthe following OLS specification (with some variations):
Yi,t = φj + λt + βXi,t + Γ′Zi,t + εi,t. (5)
Here Yi,t represents a firm’s self-reported weighted-average discount rate, φj represents Fama-French 30 industry fixed effects that control for time-invariant unobservable industry-levelshocks (culture, regulatory risk, etc), and λt represents year-quarter fixed effects that controlfor common shocks to firms in a given year-quarter. We also include the weighted-averageremaining life, the lease-to-asset ratio, and the option flag dummy as controls (Xi,t). Zi,t isa vector of firm-specific controls that features the natural logarithm of total assets, bookleverage, profitability, tangibility, Tobin’s q, idiosyncratic volatility, the natural logarithm offirm age, S&P (Standard & Poor’s) ratings, and a dummy variable that equals one if thefirm is not rated, and zero otherwise. The Online Appendix provides a further description ofeach variable.
Table 5 reports the determinants of weighted-average discount rates in a multivariatesetting. Column (1) controls for the weighted-average life of operating leases, the optiondummy, and the lease-to-asset ratio. We find a positive relationship between lease character-
16

istics and discount rates, while controlling for industry and time fixed effects.21,22 Operatingleases that include renewal or extension options are associated with higher discount rates,echoing findings in the literature on bank loan or corporate debt with embedded options.This pronounced effect translates to a 17 basis points increase in discount rates. Given theunconditional average of 5.66 percent for the weighted-average discount rates, the marginaleffect of an embedded option amounts to about a 3.5 percent increase in the discount rate.
Discount rate choices are also related to firm characteristics. Echoing the results in Figure3, larger and older firms choose lower discount rates. Highly levered firms are associatedwith larger discount rates: a 10% increase in leverage (e.g., from 6% to 6.6%) is associatedwith more than a 25% increase in the disclosed discount rate. Since the unconditional meandiscount rate is 5.66%, this translates into a 1.4 percentage point increase in the discountrate (from 5.66% to 7.08%). Similarly, an increase in firm leverage from the 25th to the 75th
percentile of leverage corresponds to a two-thirds increase in the discount rate. Columns(2)-(5) control for additional firm characteristic and show that more profitable firms, andfirms with more growth opportunities (higher Tobin’s q) have lower discount rates. Moreover,lower rated firms, and those with higher idiosyncratic volatility, are associated with higherdiscount rates.
While the specification underlying column (5) of Table 5 shows that we can explainalmost 50% of the variation in self-reported discount rates, the table does not report theamount of variation accounted for by each individual predictor. To provide more granularityon the determinants of discount rate choices, Table A.2 in the Online Appendix reportsa variance decomposition of the characteristics and fixed effects included in Table 5. Thevariance decomposition shows that half of the explanatory power comes from three firm-levelcharacteristics: leverage, profitability, and idiosyncratic volatility. As we show in Section5, this discount rate result stands in stark contrast to the determinants of the commonlystudied lease-to-asset ratio. Eighty-seven percent of the variation in the lease-to-asset ratio isattributed to industry fixed effects, while only 19 percent of the variation in discount rates isexplained by industry effects.
The fact that (i) variation in firms’ self-reported weighted-average discount rates depends
21A simple regression of discount rates on maturities and option dummies confirms the pattern of Figure2. In fact, without controlling for industry fixed-effects and other firm variables we estimate a coefficient ofabout -0.023 on the weighted-average remaining life. Lease characteristics (maturities and options) explainabout 3 percent of the cross-sectional variation in discount rates. When we control for industry effects, theadjusted-R2 increases to about 22 percent.
22Industry effects have long been associated with debt and leasing policy. Bradley et al. (1984) findpersistent inter-industry differences in leverage ratios, even after controlling for other explanatory variables.Likewise, Ang & Peterson (1984) document inter-industry variation in capital lease intensity, and Sharpe &Nguyen (1995) do the same for operating leases. Graham et al. (1998) and Eisfeldt & Rampini (2009) alsoemploy industry controls.
17

so heavily on firm-level characteristics (see Table A.2 of the Online Appendix), and (ii) lessprofitable, more levered, and more risky firms are associated (i.e. choose) significantly higherdiscount rates when capitalizing their lease commitments to comply with ASC 842 raisesa concern: the rules related to ASC 842 may provide firms with significant discretion inselecting the discount rate used to value their operating lease commitments. In particular, lessprofitable and more highly levered firms may value their operating leases with a significantlyhigher discount rate than outside investors and analysts use, thereby reporting significantlylower operating lease liabilities than might otherwise be expected. As we showed in Section4, although firms complying with ASC 842 now provide market participants with the valuesof their operating lease liabilities on their balance sheets, valuation of these operating leasecommitments by some firms appear to be manipulated to present lower liabilities.
Overall, the results of Table 5 (and Table A.2 of the Online Appendix) show that firmcharacteristics have a strong correlation with the rates firms choose to discount their leasecommitments. This suggests that most of the differences we observe in discount rates dependon firm attributes rather than industry- or lease-specific characteristics. As we subsequentlyshow in Section 5, industry affiliation and lease characteristics, rather than firm characteristics,account for most of the variation we observe in weighted-average lives, option clauses, andlease-to-asset ratios. These findings highlight the significance of firm choices in how theychoose to calculate the present value of future lease payments (and therefore the balancesheet values) versus the industry-based regularities that firms mimic in other dimensionsof leasing activity. As the example of Boyd Gaming discussed in our introduction suggests,at least some firms operating under ASC 842 may choose a discount rate for leases that isinconsistent with the firm’s normal incremental borrowing cost.
4.2 Do (Some) Firms Discount Their Leases Too Much?
4.2.1 Measuring Abnormal Discount Rates
To assess the extent to which the firm’s self-reported discount rate for operating leasesdeviates from the firm’s latent incremental cost of borrowing, we use several measures offirm-level risk as proxies for the incremental cost of borrowing including the cost of bankdebt, the cost of equity, the ratio of total interest expenses to total short- and long-term debt(XINT), and the implied-CDS spread drawn from Bloomberg. The Online Appendix describesthese variables. A self-reported discount rate for operating leases that differs widely fromother measures of firm level-risk is a signal that a firm might opportunistically or strategicallyuse its significant discretion in capitalizing its operating leases. We also compute the implicitdiscount rate that reconciles the capitalized value of a firm’s leases, as required by ASC 842,
18

with the future operating lease commitments, as determined previously by ASC 840. Werefer to this implicit discount rate as the firm’s internal rate of return (IRR) because thisrate is obtained as the solution to the following non-linear optimization problem:
OpLeasesi =5∑t=1
MRCi,t(1 + ri)t
+ MRCAiNi
× 1ri
[1− 1
(1 + ri)Ni
]× 1
(1 + ri)5 . (6)
Here, OpLeasesi represents the capitalized value of firm i’s operating leases, as required byASC 842, MRCi,t denotes the minimum lease commitment of firm i in year t, as requiredby ASC 840, MRCAi is the minimum value of all lease commitments remaining after yeart + 5, Ni denotes the remaining life of the firm’s operating leases after year t + 5, and ri
is the implicit discount rate we solve for. When computing ri we obtain Ni by dividingMRCAi by MRCi,5 (or the last minimum lease commitment available) and rounding theresult to the nearest year, and then assuming that the remaining lease commitments areequally distributed over the remaining life of the lease.23
Panel A of Table 6 reports summary statistics associated with these variables. The averagefirm has a total interest expenses as a fraction of total debt (KXINT
d ) of 5.65%, the cost ofbank loans over the LIBOR (KLoans
d ) of 2.08% (2.04%), and a CDS spread of about 1.5%on 5-year corporate debt. The mean (median) cost of equity is 9.87% (9.15%). The mean(median) firm-level IRR obtained via equation 6 is 5.70% (4.89%) per annum, compared toa mean (median) weighted-average self-reported discount rate of 5.66% (5.00%) (see Table2). Although the IRR calculation provides a simple method to obtain the discount ratethat reconciles a firm’s operating lease payments with the value of its operating leases, thismethod also has a drawback. Specifically, since the IRR calculation assumes that each cashflow is “reinvested” at the same constant rate, a comparison of the IRRs to self-reportedweighted-average discount rates may be misleading if firms rely on different term structuresof time-varying rates to capitalize their lease payments. For this reason, we also compare theself-reported discount rate to other market- and accounting-based measures.
Panel B of Table 6 reports pairwise correlations between discount rates and firm-level riskmeasures. As expected, discount rates correlate positively with all firm-level risk measures.Interestingly, the largest correlation (besides the IRR) is between discount rates and CDSspreads (0.44). This suggests that firms choose a discount rate for leases that likely reflects
23Note that this IRR calculation is made possible by the fact that ASC 842 mandates that firms must nowdisclose the present value of their lease liabilities (the left-hand side of equation (6)). Previous accountingstandards (i.e., ASC 840) only required firms to disclose their lease-related cash flows (the right-hand side ofequation (6)) in the footnotes of their accounting statements, leaving the present value of lease liabilitiesunknown. By expanding the amount of lease-related information that firms must now include in their financialreports, the data underlying ASC 842 allows us to find the implicit discount rate that equates the presentvalue of lease liabilities a firm reports to its future lease-related obligations.
19

the unsecured (or subordinated) cost of debt, loading more heavily on credit default risk thanit is the case for secured debt. This finding is of great interest since operating lease contractsrepresent a form of secured debt with the lessor (not the lessee) owning the asset, and leasepayments have priority in bankruptcy settings.
We formally test the relationship between the weighted-average discount rate and firm-levelrisk measures using a regression framework. The columns of Table 7 show OLS regressioncoefficients, standard errors, and adjusted-R2 across the different risk measures. Panel Areports estimates of a cross-sectional regression without firm-level controls, while Panel Bcontrols for a wide range of firm characteristics. Panel A finds a positive and significant rela-tionship between the weighted-average discount rate and firm-level risk measures. Moreover,the adjusted-R2 of Panel A mirrors the unconditional correlations (ρ2) across measures inTable 6; Panel B adds firm characteristic as controls. A positive and significant relationshipcontinues to exist across firm-level risk measures, although (as expected) the magnitudesare smaller. Interestingly, the adjusted-R2s across all specifications increase to comparablelevels once we control for firm characteristics. The opposite is true for Panel A, where weobserve more heterogeneity in explanatory power across regressions. Overall, Table 7 showthat firm-level risk measures are important determinants of discount rate choices.
The previous analyses confirm that, on average, riskier firms tend to use higher discountrates when valuing their operating lease liabilities. Ceteris paribus, riskier firms tend to reporta lower value for their operating lease liabilities on their balance sheets when complyingwith ASC 842 than less risky firms. To provide more granularity on the extent to whichfirms may use significant discretion in choosing a discount rate for operating leases that isnot in accordance with the rate that an outside investor or analyst may use, we constructabnormal discount rate measures. By construction, our measure captures the portion of theweighted-average discount rate that is not explained by firm-level risk measures, differencesin weighted-average remaining lives of operating leases, lease intensity, options to extend orrenew existing leases, and industry effects. We run the following cross-sectional regressionwithin each industry (j):
DRji,t = βRiski,t + Γ′Xi,t + εi,t, for j ∈ [1, ..., 30]. (7)
Here, Riski,t is a measure of firm-level risk for firm i at time t, Xi,t is a vector of lease-specificcharacteristics (e.g., a dummy variable equal to one for firms with an option to renew theirleases), and εi,t is the residual, i.e. the unexplained part of discount rates. By estimating thisregression within each industry, we allow the sensitivities of firm-level risk and lease-specificcharacteristics to differ across industries (recall from Table 3 that there is a large amount of
20

inter-industry heterogeneity in lease characteristics).To highlight the economic content of abnormal discount rates, consider the top-left panel
of Figure 4. The figure shows how the abnormal component of the self-reported discountrate evolves as a function of leverage after removing both industry- and time-specific effects,and controlling for the IRR implicit in the firm’s leasing schedule.24 For firms in the 5th
percentile of leverage, a 1% increase in leverage is associated with an abnormal discount ratethat is less than 1% higher than predicted. In contrast, for firms in the 95th percentile ofleverage, the same increase in leverage is associated with an abnormal discount rate thatis about 3% higher than predicted. Thus, more highly levered firms discount their leaseliabilities at abnormally higher than anticipated discount rates relative to their less leveredpeers. Since ASC 842 allows firms with abnormally high discount rates for leases to addabnormally understated operating lease liabilities to their balance sheets, this figure identifiesan issue for researchers who might rely on the new data. Operating lease liabilities reportedby firms complying with ASC 842 may differ markedly from the value of leases implied byother conventional methods for capitalizing leases. These differences may be particularlypronounced for lower-quality firms. We obtain the same conclusion when we use multiplemeasures of firm-level risk, and when we partition our sample into quantiles based on thedistance-to-default rather than leverage metric (see Figure 5).
4.2.2 Value Implications for Operating Leases
Firms’ discount rate choices are directly linked to the self-reported and estimated valuesof firms’ operating lease liabilities. More specifically, we show that about 20 percent of firmsuse abnormally high discount rates to value their operating lease liabilities. Abnormallyunderstated lease liabilities are consequently reported on their balance sheets vis-a-vis theestimated values of lease liabilities based on the methods of Rauh & Sufi (2012) and Graham& Lin (2018).25 In contrast, there are no systematic differences between the self-reportedand estimated values of operating leases for the remaining 80 percent of firms in our sample.
To arrive at this result, we first partition our sample of the first-time adopters of ASC 842into quintiles based on each firm’s abnormal discount rate, which we estimate using Equation7. To reduce estimation errors, we average the abnormal discount rate obtained using threedifferent risk measures (cost of bank loans, cost of equity, and interest expenses). We refer
24We perform conditional quantile regressions on the residuals from Equation 7 as a function of a specificfirm characteristic (e.g. leverage) and rely on the bootstrap method with 1,000 draws to estimate standarderrors. Figure 4 plots quantile regression estimates of slope coefficients for q = [.05, .10, .20, .25, .50, .75, .80,.90, .95]. The shaded blue area depicts 90 percent confidence intervals for the quantile regression estimates.
25We focus on these two methodologies as they employ time-varying and/or risk-adjusted discount rates,rather than a fixed rate as in Graham et al. (1998) and Cornaggia et al. (2013) (recall Table 4).
21

to this average abnormal discount rate as εqi,t. Next, we compare the lease ratios computedusing the actual capitalized value of operating leases (from ASC 842) to two estimates of thebalance sheet value of operating leases.
Estimation results are reported in Panel A of Table 8. The panel reports the mean valueof the lease-to-asset ratio and the lease-to-adjusted asset ratio across the quintiles of abnormaldiscount rates. To assess whether the average self-reported lease liability differs from theaverage imputed lease liability according to each methodology, we report t-statistics thatcontrol for industry effects in square brackets. The main conclusion from Panel A of Table 8is that lease-to-asset and lease-to-adjusted asset ratios computed using Rauh & Sufi (2012)and Graham & Lin (2018) are only statistically different from the ratios reported by firmspreparing their financial statements in accordance with ASC 842 values only for top quintileof abnormal discount rate firms. This suggests that approximately 20 percent of firms applydiscount rates to their operating lease commitments that are probably too high compared totheir normal borrowing rates. Since firms with abnormally high discount rates are typicallythose with high leverage and low distances-to-default (recall Figures 4 and 5), this analysisdelivers a dire takeaway: the most financially fragile firms may be systematically understatingthe value of their operating lease liabilities on their balance sheets.
To provide greater insight into the types of firms that choose abnormally high discountrates, the bottom portion of Table 8 reports some of the characteristics of the firms underlyingeach abnormal discount rate quintile. There are a number of stark differences between lesseesthat choose low versus high abnormal discount rates. For example, firms that use a relativelyhigher discount rate are significantly closer to default, and use significantly more discretionaryaccruals. Similarly, these firms have less external oversight than firms who use a low discountrate: institutions investor own 17% less of the equity of high discount rate firms relative to lowdiscount rate firms, and these same firms are followed by half the number of analysts as theirlow discount rate counterparts. Moreover, this smaller set of analysts produce significantlyinferior earnings forecasts for the high discount rate firms relative to the low discount ratefirms. The average standardized unexpected earnings (SUE) of the high discount rate quintileprovides evidence of this with a SUE that is greater in magnitude than the average SUEassociated with the low discount rate quintile. Finally, high discount rate firms have a lowerquality internal information environment; these firms take roughly two extra weeks to reporttheir quarterly earnings to the market (see, e.g., Gallemore & Labro (2015)).
These findings reinforce the concern that the latitude ASC 842 provides firms in valuingtheir operating leases has an unintended consequence of providing firms with already weakbalance sheets an additional means to appear healthier by reporting lower lease liabilities.
Next, we consider several motives for why firms may select higher-than-expected discount
22
rates when valuing their leases. Our focus is to determine which, if any, of these motives canhelp to explain why certain firms discount their operating leases with abnormally high rates.
4.3 Potential Explanations for High Discount Rates
4.3.1 Agency Cost and the Cost of Financial Distress
Agency costs and the cost of financial distress play a role in a firm’s financial policies andchoice of capital structure (Jensen & Meckling (1976), Eisfeldt & Rampini (2009); Grahamet al. (1998)). These costs constrain the levels of debt that firms can incur, providing anincentive for firms to lease, rather than buy, assets. As firms and analysts recognize operatingleases as financial leverage on the balance sheet, we expect managers to choose higher discountrates (i.e. lower adjusted leverage by recognizing lower lease liabilities) when financial distresscosts are higher, ceteris paribus.
Agency costs vary with monitoring costs. Since shareholders can only imperfectly monitorthe decisions of managers, monitoring costs are incurred to limit the aberrant behavior ofmanagers. As we have previously discussed, the bottom portion of Table 8 suggests thatless monitoring is associated with high discount rate firms. In particular, these firms haverelatively lower institutional ownership, a smaller analyst following, inferior earnings forecastfrom these fewer analysts, and a lower quality internal information environment.
Our empirical analysis of the marginal impact of bankruptcy risk on lease-related discountrates in Panel A of Table A.8 of the Online Appendix reports the results of cross-sectionalregressions that add distress risk to Equation 5. We measure distress risk using the structuralmodel of Merton (1974). The table shows that a 1% increase in the probability of defaultcorresponds to a 0.70% higher discount rate. This corroborates the notion that firms thattend to benefit the most from reducing their balance sheet liabilities (i.e., those closer todefault) discount their lease obligations using higher discount rates.
4.3.2 Financial Constraints
Firms might also ration capital due to financial constraints (Eisfeldt & Rampini (2009);Sharpe & Nguyen (1995)). As such, financial constraints could offer another explanation asto why firms use a high discount rates in capital budgeting especially the closer the firm is totheir financial constraints boundary.
To document how financial constraints are related to operating leases, we first constructthe financial constraint index of Hadlock & Pierce (2010). Next, we examine how the measureof constraints is related to operating lease discount rate choices in cross-sectional regressions.The results of these analyses are presented in Panel A of Table A.9. Consistent with the
23

notion that more levered firms choose higher discount rates when valuing their leases, wefind that more financially constrained firms also choose higher discount rates when valuingtheir operating leases, even after controlling for leverage. That is, all else equal, firms thatare more financially constrained appear to add lower lease-related leverage than their lessfinancially constrained peers.
4.3.3 Operational Constraints
Jagannathan et al. (2016) argue that firms use higher discount rates to limit investment inthe face of operational, rather than financial, constraints. More specifically, firms may applyunusually high discount rates to accumulate cash, forgoing current profitable opportunitiesin anticipation of even more profitable future projects. The use of higher discount rates thusacts as a form of capital rationing. We expect that if this reasoning is accurate, firms choosinghigher discount rates are more likely to have a high Tobin’s q, potentially low tangibility, andlimited cash relative to their investment opportunities.
The results in Table A.4 are somewhat inconsistent with this narrative, since firms withhigher investment opportunities (as proxied by Tobin’s q) tend to choose lower discount rates,it is important to highlight a distinction between our analysis and Jagannathan et al. (2016).While Jagannathan et al. (2016) focus on a firm’s WACC to evaluate its projects, we focuson the discount rate applied to operating lease cash flows, which is closely related to a firm’scost of (secured) debt only.
In summary, we find that firms who are less well monitored, in financial distress and/orare financially constrained have a motive to choose a higher discount rate. In contrast, we donot find evidence that firms facing operational constraints tend to use a higher discount rate.
5 Determinants of Lease Contractual Terms
In Section 4, we have shown that most of the variation in the discount rate used tocapitalize lease commitments is attributable to firm-level characteristics such as leverage,profitability, and idiosyncratic volatility. We now consider the extent to which firm attributesalso act as the primary catalyst in determining other contractual terms of operating leases.In particular, we study the role of firm characteristics as the main drivers of the variation in(i) leasing intensity (lease-to-asset ratios), (ii) the average life of operating leases (duration oflease contracts), and (iii) the presence of an option to renew/extend leases.26
26ASC 842 does not require disclosure of the contract extension or renewal option details, so we summarizethis data with a dummy variable which is set to one if a firm can extend or renew its leases and is zerootherwise.
24

To identify the major source of variation in each of the other salient lease terms, we firstconsider each lease term in separate estimations of Equation 5. More specifically, we estimatethe equation using one of the three lease characteristics noted above as the dependent variablein place of the weighted-average discount rate. We also perform a variance decompositionanalysis that partitions the total variation of each lease characteristic into the proportionsattributable to industry and time fixed effects, and lease- and firm-level characteristics.
5.1 Leasing Intensity (Lease-to-Asset Ratio)
In our leasing intensity specification, we control for the firm’s investment opportunityset (this recognizes the under-investment problem that results from conflict between equityand debt-holders). Ex-ante, we expect firms that have significant growth options to useproportionally fewer fixed claims relative to operating leases in their capital structure. Wealso anticipate that the age and size of the firm and the tangibility of the firm’s assets shouldimpact on the operating lease intensity. Firms making more intense use of fixed assets in theproduction process should use more lease financing. We also expect smaller firms to makemore intense use of operating leases versus debt financing.27
Table 9 shows how operating lease intensity (defined as the present value of operatinglease liabilities divided by total existing assets) is linked to various firm characteristics.28
Columns (1)-(5) sequentially control for additional lease and firm characteristics. Firms thatuse leases with embedded options are heavier users of operating leases (0.01 larger ratios)than firms that do not. Moreover, larger, younger, more profitable firms, and those with moreinvestment opportunities have lower lease ratios. Younger firms with smaller employmentnumbers lease smaller physical spaces. These firms may also find it is easier to controlproprietary information about production and service methods if they not only have stronginvestment opportunities but also own rather than lease their equipment.29
Interestingly, we find that lease ratios are not related to lease length, discount rates, creditratings, or idiosyncratic volatility. This suggests that leases are not necessarily used to obtain
27As Graham et al. (1998, p. 138) notes “This may be true because large companies are more diversifiedand, thus, have more stable cash flows. Additionally, large firms may be able to exploit economies of scale inissuing securities. Because of information asymmetries, smaller firms also are likely to face higher costs forobtaining external funds. Sharpe & Nguyen (1995) suggest that leases mitigate these information problemsand provide lower financing costs. Thus, lease usage should be inversely related to firm size.”
28Note that while the definition of the lease-to-asset ratio we employ differs from that in Graham et al.(1998), Tables A.4 to A.7 in the Online Appendix show that all of our results are robust to using the Grahamet al. (1998) definition of lease intensity instead.
29In an interview, one textile manufacturing firm described a strategy for acquiring physical capital thatrelied solely on purchased gear, and even then, larger machinery was split into separate parts that weresubsequently put together by the firm’s own production engineers. The stated aim was to prevent informationabout the production process being leaked to competitors by equipment providers.
25
long-lived assets. This also indicates that the number of leases per unit of assets is unrelatedto common measures of firm-level risk. However, lease intensity is associated with leverage:levered firms have significantly higher lease ratios.
5.2 Weighted-Average Life of Operating Leases
Table 10 presents our empirical findings on the determinants of the weighted-averagelife of operating leases. We find that the weighted-average life is positively correlated tolease options. This suggests that, on average, renewal and extension options are features oflonger-lived leases, such as rental agreements on real estate assets.30 Notably, larger, moreprofitable, and tangible-based firms use longer-lived leases which we believe reflects heavieruse of rented space. Leverage, growth opportunities, age, and rating status of a firm do notseem to account for the cross-sectional variation in maturities. On the other hand, riskierfirms, as proxied by their stock’s idiosyncratic volatility, are associated with shorter-livedleases. Since most leases are non-cancellable, this may indicate an aversion towards long-termrental commitments.
5.3 Option to Extend or Renew Leases
The results from a linear probability model (LPM) estimated via OLS to ascertain whetherfirm characteristics influence the presence of options to extend or renew leases are reported inTable 11. Echoing previous results, longer-lived leases are more likely to include option clauses.Firms that rely more on operating leases, younger firms, and firms with more investmentopportunities, are also more likely to include renewal options. Neither credit ratings, firm size,tangibility, nor the idiosyncratic volatility of a firm’s stock are significantly related to optionuse. These findings indicate that option clauses are a feature of the existing leased-asset base,rather than of each firm’s credit standing or riskiness.
5.4 Variance Decomposition
As an alternative approach to our OLS specification, described above, we also perform avariance decomposition analysis for each salient lease characteristic. For this analysis, wedecompose the total variation of each of the four lease characteristics into the proportions
30Real estate leases tend to be long term in nature, minimally five years, and often more than 10 years foroffice space in attractive locations. Equipment leases are typically shorter than this, often with clauses thatrequire the lessor to substitute newer equipment in the event of significant changes in technology during thelease. Interviews with industry participants indicated that managing technology improvements was a primarymotivation of lessees who acquire computing equipment and instrumentation on operating leases. Operatingleases contracts typically require regular replacement of computing gear, for example, with newer models.
26

of variation explained by industry fixed effects, time fixed effects, and lease and firm-levelcharacteristics. Tables A.2 and A.3 in the Online Appendix report the results of the fourvariance decomposition analyses. The main takeaway from these analyses is that industryfixed effects explain most of the variation in lease-to-asset ratios, the average life of operatingleases, and the presence of an option to renew/extend leases.
5.5 Connection to the Prior Literature
In addition to documenting how each lease-related characteristic varies with industry,time, and firm-specific effects, we also analyze whether lease characteristics vary in theways predicted by prior studies. Specifically, we examine whether the predicted associationsbetween lease intensity and financial distress, financial constraints, and tax considerationshelp explain differences in lease-to-asset ratios within our cross-section of firms. We alsoexamine whether these financial distress, financial constraints, and tax considerations areuseful for explaining the cross-section differences in other lease-related characteristics.
Financial Distress. As firms in financial distress are more likely to arrange favorablelease agreements as opposed to issuing debt (see Graham et al. (1998, p. 137)), we expect apositive relationship to exist between financial distress and lease intensity. Similarly, Eisfeldt& Rampini (2009) recognize that in bankruptcy, lessors can regain control of leased assets fareasier than secured lenders can achieve repossession. However, they reason that differences indistress probabilities across firms are unlikely to explain the cross-sectional variation in leaseintensity. This is because distress probabilities are likely low, and do not exhibit as muchcross-sectional variation as lease ratios.31 While distress considerations may play a secondaryrole to financial constraints in determining lease intensity, a firm’s degree of financial distresscan still have an incremental impact on its lease intensity.32
Panel B, C, and D of A.8 of the Online Appendix show the results of cross-sectionalregressions of distress risk on lease characteristics. The table shows that a 1% increase in theprobability of default corresponds to a 10% lower probability of using leases with options torenew/extend the lease. Firms with higher distress metrics ex-ant also use short-lived lease
31Specifically, Eisfeldt & Rampini (2009, pg. 1623) note that their “... model shows that variation inavailable internal funds affects the leasing decision, even after controlling for the probability of bankruptcy(which is held constant in the model). Empirically, variation in the amount of internal funds across firms islikely to be larger than variation in bankruptcy probabilities and, thus, this variation has the potential togenerate a quantitatively important effect on the leasing decision. As a result, we stress the effect of leasingon debt capacity rather than on bankruptcy costs, which has been emphasized previously.”
32In untabulated analyses we show this is the case. Although we focus on the effect of distress risk withoutcontrolling for financial constraints in Table A.8 of the Online Appendix, including financial distress andfinancial constraints in the same regression shows that both characteristics tends to have a statisticallysignificant impact on determining lease characteristics. That is, financial constraints do not drive out theeffects of distress risk among the first-time adopters of ASC 842.
27

arrangements. Contrary to the prediction in Graham et al. (1998), a higher likelihood offinancial distress is associated with lower lease intensity. On average, a 1% increase in theprobability of default is associated with a 3% decrease in lease intensity among the first-timeadopters of ASC 842.
Financial Constraints. A central idea in earlier research was that leases economizedon expensive fixed capital, particularly for firms with high external funding costs that mightarise from under-investment (Myers (1977); Stulz & Johnson (1985)), asymmetric information(Stewart et al. (1984)), or from agency problems that produce costly monitoring (Smith Jr &Warner (1979)). To study this hypothesis, Sharpe & Nguyen (1995) identify firms substitutingleases for fixed capital as those who pay little or no dividends, have small current cash flow,or have low credit ratings since, they assume, these firms pay relatively high premiumsfor external funds. Among the predictions that they derive are that leasing intensity isdecreasing in available internal funds (to assets), dividends (to assets), cash, and cash flow (toassets), and increasing in Tobin’s q and outstanding debt (to assets). Accordingly, availableinternal funds (to assets) measures such as cash (to assets) and cash flow (to assets), shouldbe negatively related to the leasing intensity.33 Also, debt (to assets) should be positivelyrelated to the fraction leased, to the extent that outstanding debt reduces available internalfunds. Similar intuition underlies the empirical work in Sharpe & Nguyen (1995). Eisfeldt &Rampini (2009) focus on the impact of financial constraints on leasing decisions. The coreof their argument is that the ease with which a lessor (rather than a secured lender) canrepossess an asset “allows a lessor to implicitly extend more credit than a lender whose claimis secured by the same asset. The debt capacity of leasing thus exceeds the debt capacityof secured lending. This makes leasing valuable to financially constrained firms” (Eisfeldt& Rampini, 2009, p. 1621). Motivated by this key prediction, we investigate how financialconstraints impact lease intensity, as well as other operating lease characteristics, among thefirst-time adopters of ASC 842.
Panels B to D of Table A.9 provide evidence on the role of financial constraints on leasecharacteristics. Consistent with the predictions of prior studies, more financially constrainedfirms tend to lease with greater frequency. Specifically, a 1% increase in financial constraintsincreases lease intensity by 1% to 2%. Financial constraints also interact with the length of afirm’s leases, as well as the firm’s use of lease-related options. Firms that are more constrainedtend to rely on leases that are, on average, two years shorter-lived than less constrained firms,and are also 17% less likely to rely on options to renew/extend their operating leases.
Marginal Tax Rates. Research of taxation and leasing extends back nearly 50 years.Graham et al. (1998) provide an influential study on the role of taxation, owing in part to the
33Untabulated results support these predictions.
28
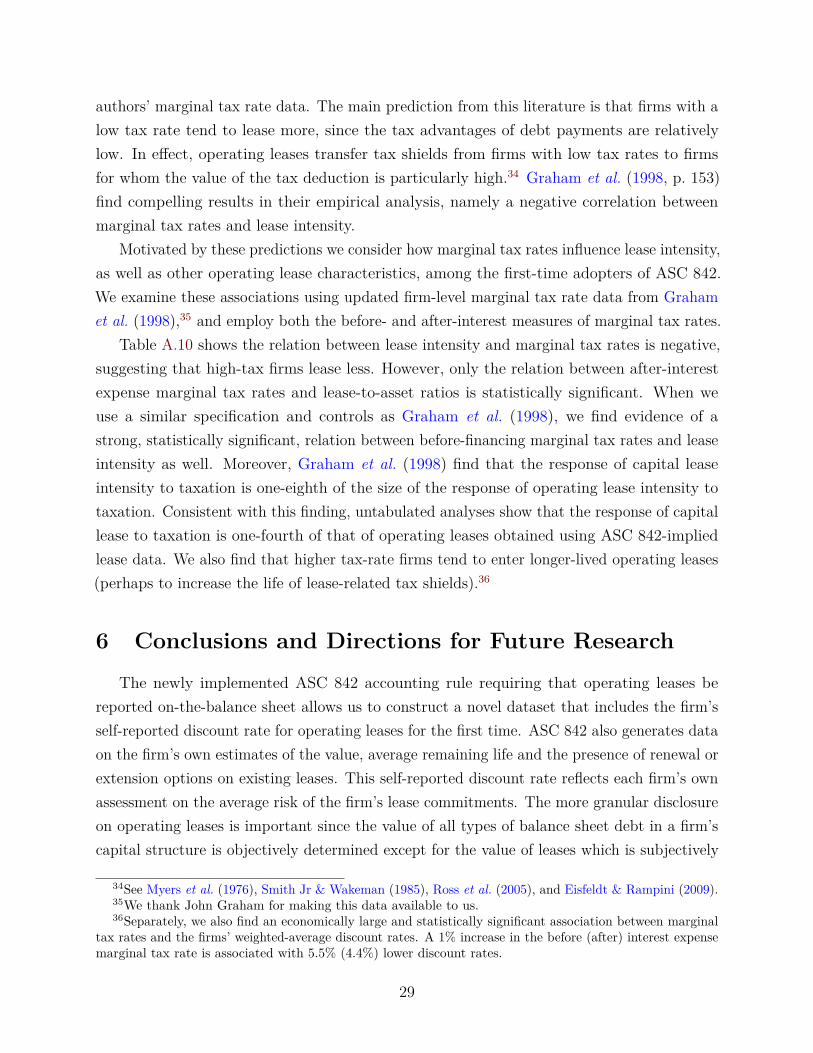
authors’ marginal tax rate data. The main prediction from this literature is that firms with alow tax rate tend to lease more, since the tax advantages of debt payments are relativelylow. In effect, operating leases transfer tax shields from firms with low tax rates to firmsfor whom the value of the tax deduction is particularly high.34 Graham et al. (1998, p. 153)find compelling results in their empirical analysis, namely a negative correlation betweenmarginal tax rates and lease intensity.
Motivated by these predictions we consider how marginal tax rates influence lease intensity,as well as other operating lease characteristics, among the first-time adopters of ASC 842.We examine these associations using updated firm-level marginal tax rate data from Grahamet al. (1998),35 and employ both the before- and after-interest measures of marginal tax rates.
Table A.10 shows the relation between lease intensity and marginal tax rates is negative,suggesting that high-tax firms lease less. However, only the relation between after-interestexpense marginal tax rates and lease-to-asset ratios is statistically significant. When weuse a similar specification and controls as Graham et al. (1998), we find evidence of astrong, statistically significant, relation between before-financing marginal tax rates and leaseintensity as well. Moreover, Graham et al. (1998) find that the response of capital leaseintensity to taxation is one-eighth of the size of the response of operating lease intensity totaxation. Consistent with this finding, untabulated analyses show that the response of capitallease to taxation is one-fourth of that of operating leases obtained using ASC 842-impliedlease data. We also find that higher tax-rate firms tend to enter longer-lived operating leases(perhaps to increase the life of lease-related tax shields).36
6 Conclusions and Directions for Future Research
The newly implemented ASC 842 accounting rule requiring that operating leases bereported on-the-balance sheet allows us to construct a novel dataset that includes the firm’sself-reported discount rate for operating leases for the first time. ASC 842 also generates dataon the firm’s own estimates of the value, average remaining life and the presence of renewal orextension options on existing leases. This self-reported discount rate reflects each firm’s ownassessment on the average risk of the firm’s lease commitments. The more granular disclosureon operating leases is important since the value of all types of balance sheet debt in a firm’scapital structure is objectively determined except for the value of leases which is subjectively
34See Myers et al. (1976), Smith Jr & Wakeman (1985), Ross et al. (2005), and Eisfeldt & Rampini (2009).35We thank John Graham for making this data available to us.36Separately, we also find an economically large and statistically significant association between marginal
tax rates and the firms’ weighted-average discount rates. A 1% increase in the before (after) interest expensemarginal tax rate is associated with 5.5% (4.4%) lower discount rates.
29

determined by the firm. It is also important since the prior literature has used either a surveyapproach or an approximation method to estimate this heretofore unobservable discount rate.
Although ASC 842 provides explicit guidelines on the discount rate choice, managers havediscretion in choosing an operating lease discount rate. Specifically, when possible, firmsshould use the rate implicit in the lease terms, otherwise, the discount rate should reflect thefirms’ incremental borrowing rates. The implications of the choice of discount rate to use isclear. If a firm applies an unusually high discount rates to their lease-related commitments,then this understates their operating lease liabilities and therefore, lower leverage is reportedon a firm’s balance sheet. As such, we are particularly interested in (i) the extent to whichfirms use unusually high discount rates in valuing their operating leases, and (ii) the salientdrivers that act as an impetus that influences a firm’s discount rate choice. We also studywhether these same attributes also exert the same influence in other lease related choices.
Ex-ante, it is unclear which type of firm will choose to use a high discount rate since bothlow-Tobin’s q firms and high-Tobin’s q firms have high discount rates. However, the driversof this high discount rate probably differ substantially with credit and default risk associatedwith the low-q firms while growth options provide the likely catalyst for high-q firms.
While we find that the approximation methods used to estimate the lease values are similarto the self-reported values for 80% of the firms in our sample, we find that the borrowingrate option cannot explain the discount rate choices for 20% of the sample of firms. Forthis latter group of firms, we show that these firms may be using the discretion in the newaccounting standard to discount their operating lease commitments at a higher-than-expecteddiscount rate. Accordingly, these firms report lower than expected lease liabilities on theirbalance sheets. These firms are characterized by high leverage, low profitability, less externalmonitoring, inferior earnings forecasts, and a lower quality internal information environment.As such, the high discount rate is attributable to low-q firms.
Whereas firm-level attributes influence the firm’s choice of the discount rate for operatingleases, industry-level effects appear to exert a greater influence on other lease related choicesincluding lease intensity, average remaining life and the presence of renewal or extensionoptions on existing leases.
Our findings pose a puzzle. Notably, we find that firms choose a discount rate for leasesthat likely reflects the unsecured (or subordinated) cost of debt, loading more heavily on creditdefault risk than it is the case for secured debt. This is puzzling since firms never acquire anyownership stake in the leased assets and repossession by the creditor is straightforward underexisting law; it isn’t obvious why an economically-significant default risk premium should beembedded in the leasing contract terms.37
37Eisfeldt & Rampini (2009) highlight the consequences of the legal dimensions of leasing, and study their
30

References
Ang, James, & Peterson, Pamela P. 1984. The leasing puzzle. Journal of Finance, 39(4),1055–1065.
Bradley, Michael, Jarrell, Gregg A, & Kim, E Han. 1984. On the existence of an optimalcapital structure: Theory and evidence. Journal of Finance, 39(3), 857–878.
Cornaggia, Kimberly J, Franzen, Laurel A, & Simin, Timothy T. 2013. Bringing leased assetsonto the balance sheet. Journal of Corporate Finance, 22, 345–360.
Eisfeldt, Andrea L, & Rampini, Adriano A. 2009. Leasing, ability to repossess, and debtcapacity. Review of Financial Studies, 22(4), 1621–1657.
Gallemore, John, & Labro, Eva. 2015. The importance of the internal information environmentfor tax avoidance. Journal of Accounting and Economics, 60(1), 149–167.
Graham, John R, Lemmon, Michael L, & Schallheim, James S. 1998. Debt, leases, taxes,and the endogeneity of corporate tax status. Journal of Finance, 53(1), 131–162.
Graham, Roger C, & Lin, KC. 2018. How will the new lease accounting standard affect therelevance of lease asset accounting? Advances in Accounting, 42, 83–95.
Hadlock, Charles J, & Pierce, Joshua R. 2010. New evidence on measuring financial constraints:Moving beyond the KZ index. Review of Financial Studies, 23(5), 1909–1940.
Jagannathan, Ravi, Matsa, David A, Meier, Iwan, & Tarhan, Vefa. 2016. Why do firms usehigh discount rates? Journal of Financial Economics, 120(3), 445–463.
Jensen, Michael C, & Meckling, William H. 1976. Theory of the firm: Managerial behavior,agency costs and ownership structure. Journal of Financial Economics, 3(4), 305–360.
Khan, Urooj, Li, Bin, Rajgopal, Shivaram, & Venkatachalam, Mohan. 2018. Do the FASB’sstandards add shareholder value? Accounting Review, 93(2), 209–247.
Kothari, Sagar P, Leone, Andrew J, & Wasley, Charles E. 2005. Performance matcheddiscretionary accrual measures. Journal of Accounting and Economics, 39(1), 163–197.
Liu, Tim. 2020. How does leasing affect leverage. Working paper.
implications for capital structure.
31

Livnat, Joshua, & Mendenhall, Richard R. 2006. Comparing the post–earnings announcementdrift for surprises calculated from analyst and time series forecasts. Journal of AccountingResearch, 44(1), 177–205.
Merton, Robert C. 1974. On the pricing of corporate debt: The risk structure of interestrates. Journal of Finance, 29(2), 449–470.
Myers, Stewart C. 1977. Determinants of corporate borrowing. Journal of FinancialEconomics, 5(2), 147–175.
Myers, Stewart C, Dill, David A, & Bautista, Alberto J. 1976. Valuation of financial leasecontracts. Journal of Finance, 31(3), 799–819.
Palazzo, Dino, & Yang, Jie. 2019 (12). Spike in 2019Q1 Leverage Ratios: The Impact ofOperating Leases. Tech. rept. Board of Governors of the Federal Reserve System.
PWC. 2019. Leases. Tech. rept. PricewaterhouseCoopers.
Rauh, Joshua D, & Sufi, Amir. 2012. Explaining corporate capital structure: Product markets,leases, and asset similarity. Review of Finance, 16(1), 115–155.
Ross, S.A., Westerfield, R., & Jaffe, J.F. 2005. Corporate Finance. Irwin series in finance.McGraw-Hill/Irwin.
Sharpe, Steven A, & Nguyen, Hien H. 1995. Capital market imperfections and the incentiveto lease. Journal of Financial Economics, 39(2-3), 271–294.
Smith Jr, Clifford W, & Wakeman, L MacDonald. 1985. Determinants of corporate leasingpolicy. Journal of Finance, 40(3), 895–908.
Smith Jr, Clifford W, & Warner, Jerold B. 1979. On financial contracting: An analysis ofbond covenants. Journal of Financial Economics, 7(2), 117–161.
Stewart, Myers, Majluf, Nicholas S, et al. 1984. Corporate financing and investment decisionswhen firms have information that investors do not have. Journal of Financial Economics,13(2), 187–221.
Stulz, Rene M, & Johnson, Herb. 1985. An analysis of secured debt. Journal of FinancialEconomics, 14(4), 501–521.
32

Figure 1: Supplemental Information on Leases for Microsoft CorporationThis figure shows supplemental balance sheet information related to leases for Microsoft Corporation.The figure represents part of the 10-Q filed by Microsoft Corporation for the quarter ended onSeptember 30, 2018, and is drawn from the Electronic Data Gathering, Analysis, and Retrieval(EDGAR) system made available by the Security and Exchange Commission (SEC).
33

Figure 2: Distributions and Term Structure of Leasing VariablesThe figure shows the histogram, kernel density (blue line), and median value (red dotted line)of the lease-to-assets ratio (top-left panel), the weighted-average discount rate (top-right panel),and the weighted-average remaining life of operating leases (bottom-left panel) for the first-timeadopters of the new ASC 842 accounting standard. The bottom-right panel displays the meanweighted-average discount rate of operating leases across groups of firms whose operating leaseshave similar weighted-average remaining lives. The blue dashed line in this panel displays a firm’spredicted discount rate as a function of the remaining life of the firm’s leases. This predicted valueis obtained by estimating a firm’s discount rates as a function of the remaining life of a firm’s leasesusing a fractional polynomial function. All continuous variables in each figure are winsorized at the99 percent level.
34

Figure 3: Deciles of Firm Characteristic and Discount RatesThe figures show the average weighted-average discount rates across deciles formed on variousfirm characteristics for the first-time adopters of the new ASC 842 accounting standard. Firmcharacteristics include total assets, book leverage, firm age, Tobin’s q, idiosyncratic volatility, andS&P ratings. All continuous variables in each figure are winsorized at the 99 percent level.
35

Figure 4: Heterogenous Effects of LeverageThis figure shows quantile regression coefficients and 90 percent confidence intervals for the effectof leverage on abnormal discount rates for the first-time adopters of the new ASC 842 accountingstandard. The dependent variable is a measure of abnormal discount rate at the firm-level, computedas the residual from industry-level OLS regressions of weighted-average discount rates on a firm-levelrisk measure and various characteristics of operating leases (Equation 7). Each continuous variableis winsorized at the one percent level in both tails. All variables are described in detail in the OnlineAppendix. Standard errors are estimated using the bootstrap method with 1,000 resamples.
36

Figure 5: Heterogenous Effects of Distance-to-DefaultThis figure shows quantile regression coefficients and 90 percent confidence intervals for the effectof Distance-to-Default on abnormal discount rates for the first-time adopters of the new ASC842 accounting standard. The dependent variable is a measure of abnormal discount rate at thefirm-level, computed as the residual from industry-level OLS regressions of weighted-average discountrates on a firm-level risk measure and various characteristics of operating leases (Equation 7). Eachcontinuous variable is winsorized at the one percent level in both tails. All variables are describedin detail in the Online Appendix. Standard errors are estimated using the bootstrap method with1,000 resamples.
37

Table 1: SampleThis table reports details for the sample construction and timing of adoption of ASC 842. Panel Adetails the filtering procedure and reports the number of firm-year-quarter observations and thenumber of unique firms. Panel B describes the sample distribution of first time adopters over time.
Panel A: Sample ConstructionNumber of Observations Number of Firms
10-K/Q from EDGAR with Op. Lease > 0 19,586 4,235Not on CRSP-Compustat (1,862) (440)Missing Discount Rate or WAL (3,722) (225)Not First Time of Adoption (10,452) (20)Total 3,550 3,550
Panel B: Sample Distribution by Adoption DateNumber of Observations Percent
Q4-2017 4 0.11Q1-2018 7 0.20Q2-2018 7 0.20Q3-2018 5 0.14Q4-2018 23 0.65Q1-2019 2,561 72.14Q2-2019 314 8.84Q3-2019 225 6.34Q4-2019 298 8.39Q1-2020 107 3.01Total 3,550 100.00
38

Table 2: Summary Statistics of Lease and Firm CharacteristicsThis table reports summary statistics for the sample of first time adopters of the new ASC 842accounting standard. Panel A summarizes the univariate distributions of six key leasing variablesextracted from the first 10-K/Q filing reported by a firm that is in accordance with the ASC 842accounting standard. These six key leasing variables are (1) the present value of operating leaseliabilities reported on the balance sheet, expressed in units of millions of dollars, (2) the right-of-useassets of operating leases reported on the balance sheet, in millions of dollars, (3) the ratio ofoperating leases total assets, (4) the weighted-average discount rate used by the firm to compute thepresent value of operating leases, (5) the weighted-average remaining life of firms’ operating leases,and (6) an indicator variable for the presence of options to extend or renew existing leases. PanelB reports the distribution of accounting and return-based firm characteristics, constructed usingCRSP/Compustat data, for first-time adopters of the ASC 842 accounting standard. These firm-levelcharacteristics are described in detail in the Online Appendix. For each variable contained in PanelA and Panel B we report the total number of observations (N), and the mean, standard deviation,minimum, 25th, 50th, and 75th percentile (referred to as p25, median, and p75, respectively), andmaximum value of each variable. Each continuous variable is winsorized at the one percent level inboth tails.
N Mean SD Min p25 Med. p75 MaxPanel A: Op. Lease Characteristics
Lease Liabilities ($M) 3550 242.66 704.21 0.15 6.30 33.58 149.10 5,422.80Lease Assets ($M) 3550 227.22 641.77 0.16 5.92 30.94 140.00 4,798.90Lease/Adj. Assets (%) 3550 5.22 7.29 0.00 0.94 2.66 6.12 43.22Discount Rate (%) 3550 5.66 2.44 0.33 3.99 5.00 6.71 14.45WAL (years) 3550 8.24 7.92 0.42 4.30 6.30 9.08 52.70Lease Option (0/1) 3550 0.36 0.48 0.00 0.00 0.00 1.00 1.00
Panel B: Firm CharacteristicsTotal Assets ($M) 3550 9,442.96 28,020.62 9.07 310.36 1,517.18 5,653.88 221,901.00Age (years) 3550 23.39 17.50 1.00 9.00 20.00 31.00 70.00Profitability 3549 -0.04 0.27 -1.52 -0.02 0.03 0.08 0.29Leverage 3284 0.30 0.25 0.00 0.09 0.27 0.44 1.24Tangibility 3438 0.22 0.23 0.00 0.05 0.13 0.31 0.91Tobin’s q 3548 2.07 1.79 0.52 1.02 1.39 2.33 10.17Idiosyncratic Vol. 3436 0.38 0.26 0.11 0.19 0.30 0.49 1.63
39

Table 3: Summary Statistics of Leasing Variables by IndustryThis table reports summary statistics for the sample of first time adopters of the new ASC 842 accounting standard within eachFama-French 12 industry group. The table reports the mean value of six key leasing variables within each industry, as well as the numberof firms with valid leasing data that are assigned to each industry (denoted by N). The six key leasing variables are (1) the present valueof operating lease liabilities reported on the balance sheet, expressed in units of millions of dollars, (2) the right-of-use assets of operatingleases reported on the balance sheet, in millions of dollars, (3) the ratio of operating leases total assets (adjusted for leases), (4) theweighted-average discount rate used by the firm to compute the present value of operating leases, (5) the weighted-average remaining lifeof firms’ operating leases, and (6) an indicator variable for the presence of options to extend or renew existing leases. Each continuousvariable is winsorized at the 1 percent level in both tails.
Industry N Lease Liab. Lease Assets Lease/Adj. Assets DR WAL OptionConsumer NonDurables 138 276.13 260.13 0.066 4.94 6.61 0.29Consumer Durables 79 201.27 237.82 0.057 4.89 6.73 0.41Manufacturing 289 128.90 125.33 0.036 5.13 6.80 0.33Oil & Gas 162 236.05 231.89 0.025 6.31 5.59 0.24Chemicals 85 278.55 273.44 0.033 5.22 7.82 0.24Business Equipment 574 181.41 154.16 0.052 5.51 6.32 0.33TMT 73 695.47 645.51 0.047 6.41 7.87 0.27Utilities 89 363.53 361.26 0.018 4.78 13.03 0.38Wholesale & Retail 301 741.62 662.26 0.163 5.69 8.67 0.42Healthcare 652 62.24 60.07 0.053 7.64 5.43 0.48Finance 715 186.21 177.57 0.018 4.40 13.00 0.33Other 393 315.68 309.59 0.058 5.56 8.84 0.31
40

Table 4: Summary Statistics Across Different MethodologiesThis table reports the mean and median values of the lease-to-asset ratio (Panel A), the lease-to-adjusted asset ratio (Panel B), and the adjusted book leverage (Panel C) for the sample of first timeadopters of the new ASC 842 accounting standard. Each panel compares each ratio computed usingthe actual capitalized value of operating leases, denoted ASC 842, to four estimates of the balancesheet value of operating leases commonly employed in the literature. The methods for computingthese estimates are drawn from Graham et al. (1998), Rauh & Sufi (2012), Cornaggia et al. (2013),and Graham & Lin (2018). Each panel computes the relevant statistics using quarterly leasingdata extracted from the 10-Q filings of first time adopters, as well as annual leasing data obtainedfrom the most recent 10-K filings of first time adopters and made available via Compustat. Allcontinuous variables are winsorized at the 1 percent level in both tails, and the appendix providesdetailed variable descriptions.
EDGAR 10-Q Compustat 10-KN Mean Median N Mean Median
Panel A: Operating Leases to AssetsASC 842 3474 0.063 0.027 2909 0.068 0.032Graham et al. (1998) 3474 0.045 0.021 2909 0.061 0.032Rauh & Sufi (2012) 3474 0.069 0.029 2909 0.081 0.036Cornaggia et al. (2013) 3474 0.058 0.025 2909 0.073 0.036Graham & Lin (2018) 3474 0.067 0.027 2909 0.068 0.030
Panel B: Operating Leases to Adj. AssetsASC 842 3474 0.053 0.027 2909 0.058 0.031Graham et al. (1998) 3474 0.039 0.020 2909 0.053 0.031Rauh & Sufi (2012) 3474 0.056 0.028 2909 0.066 0.035Cornaggia et al. (2013) 3474 0.049 0.024 2909 0.061 0.035Graham & Lin (2018) 3474 0.054 0.026 2909 0.056 0.029
Panel C: Adjusted Book LeverageASC 842 3284 0.339 0.309 2792 0.375 0.347Graham et al. (1998) 3284 0.328 0.298 2792 0.369 0.344Rauh & Sufi (2012) 3284 0.338 0.311 2792 0.376 0.351Cornaggia et al. (2013) 3284 0.334 0.305 2792 0.374 0.349Graham & Lin (2018) 3284 0.336 0.309 2792 0.371 0.346
41

Table 5: Determinants of Weighted-Average Discount RateThis table reports OLS regression coefficients and standard errors for the effect of lease and firmcharacteristics on the weighted-average discount rate of operating leases of first time adopters ofthe new ASC 842 accounting standard. The dependent variable is the weighted-average discountrate reported in the Notes to Consolidated Financial Statements at the end of the fiscal quarter.Independent variables include the weighted-average life of the lease, lease option dummy, lease-to-asset ratio, the natural logarithm of total assets, leverage, profitability, tangibility, Tobin’s q,idiosyncratic volatility, the natural logarithm of firm age, S&P ratings, and a dummy variable thatequals one if the firm is not rated, zero otherwise. All continuous variables are winsorized at the1 percent level in both tails. All variables are described in detail in the Online Appendix. Allspecifications include year-quarter and Fama-French 30 industry fixed effects. Standard errors arerobust to heteroskedasticity. ***, **, * correspond to statistical significance at the 1%, 5%, and10% level, respectively.
(1) (2) (3) (4) (5)WAL 0.02∗∗∗ 0.03∗∗∗ 0.03∗∗∗ 0.03∗∗∗ 0.03∗∗∗
(0.00) (0.00) (0.01) (0.01) (0.01)Lease Option (Dummy) 0.17∗∗ 0.11 0.16∗∗ 0.17∗∗ 0.17∗∗
(0.08) (0.07) (0.07) (0.07) (0.07)Leases/Assets 3.12∗∗∗ 2.02∗∗∗ 0.71∗ 0.30 0.13
(0.50) (0.45) (0.43) (0.41) (0.41)Assets -0.37∗∗∗ -0.31∗∗∗ -0.22∗∗∗ -0.15∗∗∗
(0.02) (0.02) (0.02) (0.02)Age -0.40∗∗∗ -0.32∗∗∗ -0.24∗∗∗ -0.18∗∗∗
(0.05) (0.04) (0.05) (0.05)Leverage 2.39∗∗∗ 2.19∗∗∗ 2.08∗∗∗
(0.19) (0.18) (0.19)Profitability -2.29∗∗∗ -1.85∗∗∗ -2.02∗∗∗
(0.24) (0.24) (0.24)Tangibility -0.29 -0.30 -0.31
(0.23) (0.23) (0.23)Tobin’s q -0.12∗∗∗ -0.10∗∗∗
(0.02) (0.02)Idiosyncratic Vol. 2.13∗∗∗ 2.01∗∗∗
(0.25) (0.24)S&P Ratings -0.15∗∗∗
(0.02)No Rating -1.27∗∗∗
(0.26)Year–Quarter Fixed Effects Yes Yes Yes Yes YesFF30 Fixed Effects Yes Yes Yes Yes YesAdj.–R2 0.23 0.35 0.44 0.48 0.49Observations 3550 3550 3268 3157 3157
42

Table 6: Discount Rate and Firm-Level Risk MeasuresThis table reports summary statistics and correlation coefficients between firm-level risk measuresof first time adopters of the new ASC 842 accounting standard. Panel A summarizes the univariatedistributions of firm-level risk measures. These variables are (1) the internal rate of return ofoperating leases, (2) the ratio of total interest expenses total debt (KXINT
d ), (3) the spread overLIBOR for bank loans (KLoans
d ), (4) the cost of equity (Ke), and (5) the Bloomberg-Implied CDSspread in basis points (BB-CDS). Panel B shows pairwise correlation coefficients between thesevariables. These firm-level risk measures are described in detail in the Online Appendix. Foreach variable contained in Panel A we report the total number of observations (N), and the mean,standard deviation, minimum, 25th, 50th, and 75th percentile (referred to as p25, median, and p75,respectively), and maximum value of each variable. Each continuous variable is winsorized at the 1percent level in both tails.
Panel A: Summary StatisticsN Mean SD Min p25 Median p75 Max
IRR 3083 5.70 4.07 0.01 3.47 4.89 6.72 30.06KXINTd 3550 5.65 7.10 0.12 3.09 4.15 5.56 58.60
KLoansd 3548 2.08 0.88 0.30 1.64 2.04 2.75 12.00
Ke 3436 9.87 4.92 0.08 6.69 9.15 12.05 25.92BB-CDS 2518 1.48 1.14 0.14 0.67 1.16 1.87 6.01
Panel B: Pairwise Correlations
DR IRR KXINTd KLoans
d Ke CDSDR 1IRR 0.48 1KXINTd 0.27 0.11 1
KLoansd 0.37 0.16 0.14 1
Ke 0.25 0.10 0.13 0.15 1CDS 0.44 0.22 0.20 0.27 0.30 1
43

Table 7: Relationship Between Discount Rates and Firm-Level Risk MeasuresThis table reports OLS regression coefficients and standard errors for the relationship betweenweighted-average discount rates on firm-level risk measures of first time adopters of the new ASC842 accounting standard. The dependent variable is the weighted-average discount rate of operatingleases. Panel A only includes the various firm-level risk measures as independent variables, whilePanel B also includes the weighted-average life of the lease, lease option dummy, lease-to-asset ratio,the natural logarithm of total assets, leverage, profitability, tangibility, Tobin’s q, idiosyncraticvolatility, the natural logarithm of firm age, S&P ratings, and a dummy variable that equals one ifthe firm is not rated, zero otherwise. Each continuous variable is winsorized at the 1 percent level inboth tails. All variables are described in detail in the Online Appendix. Standard errors are robustto heteroskedasticity. ***, **, * correspond to statistical significance at the 1%, 5%, and 10% level,respectively.
Panel A: Without ControlsIRR 0.29∗∗∗
(0.01)
KXINTd 0.09∗∗∗
(0.01)
KLoansd 1.03∗∗∗
(0.04)Ke 0.11∗∗∗
(0.01)BB-CDS 0.96∗∗∗
(0.04)Controls No No No No NoYear Fixed Effects No No No No NoFF30 Fixed Effects No No No No NoAdj.-R2 0.23 0.07 0.14 0.06 0.19Observations 3083 3550 3548 3436 2518
Panel B: With ControlsIRR 0.18∗∗∗
(0.01)
KXINTd 0.03∗∗∗
(0.00)
KLoansd 0.23∗∗∗
(0.05)Ke 0.02∗∗
(0.01)BB-CDS 0.33∗∗∗
(0.05)Controls Yes Yes Yes Yes YesYear Fixed Effects No No No No NoFF30 Fixed Effects No No No No NoAdj.-R2 0.54 0.46 0.45 0.45 0.44Observations 2752 3157 3155 3157 2247
44

Table 8: Differences in Methodologies Across Abnormal Discount RatesThis table reports mean values and t-statistics for the lease-to-asset and lease-to-adjusted asset ratiosfor the sample of first time adopters of the new ASC 842 accounting standard across quantiles ofabnormal discount rates. Abnormal discount rates are denoted εqi,t, and are computed as the residualsfrom industry-level OLS regressions of weighted-average discount rates on a firm-level risk measureand various characteristics of operating leases (see Equation 7). To reduce estimation errors, weaverage residuals estimated using three different risk measures (cost of bank loans, cost of equity, andinterest expenses), and refer to these residuals as εqi,t. We then compare the lease ratios computedusing the actual capitalized value of operating leases, denoted as ASC 842, to the Rauh & Sufi(2012) and Graham & Lin (2018) estimates of balance sheet lease liabilities. The relevant statisticsare computed using quarterly leasing data extracted from the 10-Q filings of first time adopters. Inthe bottom portion of the table we report the characteristics of the firms assigned to each abnormaldiscount rate quintile. Specifically, we report the average distance-to-default (DtD), discretionaryaccruals (Disc. Accruals), institutional ownership (InstOwn), analyst following (# Analysts), thespeed, measured in days, with which firms report their financial statements following the end of afiscal quarter (Speed), and standardized unexpected earnings (SUE). t-statistics (in square brackets)are calculated to test the difference between values based on ASC 842 and values based on therelevant methodology, controlling for industry effects. All continuous variables are winsorized at the1 percent level in both tails, and the appendix provides detailed variable descriptions.
Panel A: Lease Intensity and Adjusted Leverage
εqi,t
Lease-to-Assets Lease-to-Adj. AssetsASC 842 RS 2012 GL 2018 ASC 842 RS 2012 GL 2018
10.075 0.075 0.074 0.062 0.061 0.059
- [0.50] [1.32] - [0.65] [1.53]
2 0.050 0.054 0.053 0.043 0.045 0.043- [0.01] [1.71]∗ - [0.10] [1.75]∗
3 0.056 0.059 0.059 0.046 0.048 0.047- [-0.04] [1.57] - [-0.17] [1.54]
4 0.060 0.065 0.065 0.052 0.055 0.054- [-1.20] [-1.04] - [-1.20] [-1.02]
5 0.065 0.081 0.075 0.056 0.066 0.061- [-2.71]∗∗∗ [-2.21]∗∗ - [-2.73]∗∗∗ [-2.18]∗∗
Panel B: Characteristics Across Abnormal Discount RatesDtD Disc. Accruals InstOwn # Analysts Speed SUE
1 7.89 0.12 0.67 8.09 43.69 0.0002 6.90 0.11 0.69 7.41 41.94 -0.0013 6.71 0.12 0.68 6.64 43.67 0.0004 5.80 0.12 0.67 5.84 48.79 -0.0075 3.67 0.19 0.54 4.23 56.27 0.0175-1 [-15.61]∗∗∗ [5.05]∗∗∗ [-7.71]∗∗∗ [-10.38]∗∗∗ [13.73]∗∗∗ [2.67]∗∗∗
45

Table 9: Determinants of Lease-to-Asset RatiosThis table reports OLS regression coefficients and standard errors for the effect of lease and firmcharacteristics on the lease-to-asset ratios of first time adopters of the new ASC 842 accountingstandard. The dependent variable is the lease-to-asset ratio at the end of the fiscal quarter.Independent variables include the weighted-average discount rate, weighted-average life of the lease,lease option dummy, the natural logarithm of total assets, leverage, profitability, tangibility, Tobin’sq, idiosyncratic volatility, the natural logarithm of firm age, S&P ratings, and a dummy variablethat equals one if the firm is not rated, zero otherwise. Each continuous variable is winsorized atthe 1 percent level in both tails. All variables are described in detail in the Online Appendix. Allspecifications include year-quarter and Fama-French 30 industry fixed effects. Standard errors arerobust to heteroskedasticity. ***, **, * correspond to statistical significance at the 1%, 5%, and10% level, respectively.
(1) (2) (3) (4) (5)Discount Rate 0.00∗∗∗ 0.00∗∗∗ 0.00∗ 0.00 0.00
(0.00) (0.00) (0.00) (0.00) (0.00)WAL -0.00 0.00 0.00 0.00 0.00
(0.00) (0.00) (0.00) (0.00) (0.00)Lease Option (Dummy) 0.01∗∗∗ 0.01∗∗∗ 0.01∗∗∗ 0.01∗∗∗ 0.01∗∗∗
(0.00) (0.00) (0.00) (0.00) (0.00)Assets -0.00∗∗∗ -0.01∗∗∗ -0.01∗∗∗ -0.00∗∗∗
(0.00) (0.00) (0.00) (0.00)Age 0.00∗∗ 0.00∗ 0.00 0.00∗
(0.00) (0.00) (0.00) (0.00)Leverage 0.05∗∗∗ 0.05∗∗∗ 0.05∗∗∗
(0.01) (0.01) (0.01)Profitability -0.02∗∗ -0.01∗ -0.02∗∗
(0.01) (0.01) (0.01)Tangibility 0.07∗∗∗ 0.07∗∗∗ 0.07∗∗∗
(0.01) (0.01) (0.01)Tobin’s q -0.00∗∗ -0.00∗∗
(0.00) (0.00)Idiosyncratic Vol. 0.01 0.01
(0.01) (0.01)S&P Ratings -0.00
(0.00)No Rating 0.01
(0.01)Year–Quarter Fixed Effects Yes Yes Yes Yes YesFF30 Fixed Effects Yes Yes Yes Yes YesAdj.–R2 0.37 0.38 0.41 0.42 0.42Observations 3550 3550 3268 3157 3157
46

Table 10: Determinants of Weighted-Average LifeThis table reports OLS regression coefficients and standard errors for the effect of lease and firmcharacteristics on the weighted-average life of operating leases of first time adopters of the new ASC842 accounting standard. The dependent variable is the weighted-average life reported in the Notesto Consolidated Financial Statements at the end of the fiscal quarter. Independent variables includethe weighted-average discount rate, lease option dummy, lease-to-asset ratio, the natural logarithmof total assets, leverage, profitability, tangibility, Tobin’s q, idiosyncratic volatility, age, S&P ratings,and a dummy variable that equals one if the firm is not rated, zero otherwise. Each continuousvariable is winsorized at the 1 percent level in both tails. All variables are described in detail in theOnline Appendix. All specifications include year-quarter and Fama-French 30 industry fixed effects.Standard errors are robust to heteroskedasticity. ***, **, * correspond to statistical significance atthe 1%, 5%, and 10% level, respectively.
(1) (2) (3) (4) (5)Discount Rate 0.18∗∗∗ 0.45∗∗∗ 0.19∗∗∗ 0.24∗∗∗ 0.23∗∗∗
(0.05) (0.06) (0.04) (0.05) (0.05)Lease Option (Dummy) 0.76∗∗∗ 0.76∗∗∗ 0.81∗∗∗ 0.83∗∗∗ 0.83∗∗∗
(0.27) (0.27) (0.20) (0.21) (0.21)Leases/Assets -0.06 1.23 1.20 0.92 1.08
(1.35) (1.33) (1.08) (1.08) (1.10)Assets 0.74∗∗∗ 0.60∗∗∗ 0.51∗∗∗ 0.47∗∗∗
(0.07) (0.06) (0.07) (0.07)Age 0.48∗∗∗ 0.19 0.13 0.12
(0.15) (0.12) (0.13) (0.13)Leverage 0.01 0.13 -0.11
(0.41) (0.42) (0.44)Profitability 0.80∗∗ 0.54 0.56
(0.34) (0.35) (0.36)Tangibility 5.90∗∗∗ 5.92∗∗∗ 5.91∗∗∗
(0.85) (0.86) (0.86)Tobin’s q -0.04 -0.02
(0.04) (0.04)Idiosyncratic Vol. -1.88∗∗∗ -1.90∗∗∗
(0.41) (0.41)S&P Ratings -0.06
(0.06)No Rating -1.15∗
(0.62)Year-Quarter Fixed Effects Yes Yes Yes Yes YesFF30 Fixed Effects Yes Yes Yes Yes YesAdj.-R2 0.14 0.17 0.20 0.20 0.20Observations 3550 3550 3268 3157 3157
47

Table 11: Determinants of Option to Extend/RenewThis table reports OLS regression coefficients and standard errors for the effect of lease and firmcharacteristics on the presence of option to extend or renew existing leases of first time adopters ofthe new ASC 842 accounting standard. The dependent variable is an indicator that takes a value ofone if a firm uses leases that contain renewal or extension options at the end of the fiscal quarter.Independent variables include the weighted-average discount rate, weighted-average life of the lease,lease-to-asset ratio, the natural logarithm of total assets, leverage, profitability, tangibility, Tobin’sq, idiosyncratic volatility, the natural logarithm of firm age, S&P ratings, and a dummy variablethat equals one if the firm is not rated, zero otherwise. Each continuous variable is winsorized atthe 1 percent level in both tails. All variables are described in detail in the Online Appendix. Allspecifications include year-quarter and Fama-French 30 industry fixed effects. Standard errors arerobust to heteroskedasticity. ***, **, * correspond to statistical significance at the 1%, 5%, and10% level, respectively.
(1) (2) (3) (4) (5)Discount Rate 0.01∗∗ 0.01 0.01∗∗ 0.01∗∗ 0.01∗∗
(0.00) (0.00) (0.00) (0.00) (0.00)WAL 0.00∗∗∗ 0.00∗∗∗ 0.01∗∗∗ 0.01∗∗∗ 0.01∗∗∗
(0.00) (0.00) (0.00) (0.00) (0.00)Leases/Assets 0.30∗∗∗ 0.32∗∗∗ 0.38∗∗∗ 0.41∗∗∗ 0.40∗∗∗
(0.10) (0.10) (0.11) (0.11) (0.11)Assets 0.01∗ 0.01 0.01 0.01
(0.00) (0.01) (0.01) (0.01)Age -0.05∗∗∗ -0.05∗∗∗ -0.05∗∗∗ -0.05∗∗∗
(0.01) (0.01) (0.01) (0.01)Leverage -0.09∗∗ -0.10∗∗ -0.09∗∗
(0.04) (0.04) (0.04)Profitability 0.08∗ 0.08∗ 0.08∗
(0.04) (0.04) (0.04)Tangibility -0.05 -0.03 -0.03
(0.06) (0.06) (0.06)Tobin’s q 0.01∗∗∗ 0.01∗∗
(0.01) (0.01)Idiosyncratic Vol. -0.01 -0.01
(0.04) (0.04)S&P Ratings 0.00
(0.01)No Rating 0.03
(0.06)Year-Quarter Fixed Effects Yes Yes Yes Yes YesFF30 Fixed Effects Yes Yes Yes Yes YesAdj.-R2 0.04 0.05 0.05 0.06 0.05Observations 3550 3550 3268 3157 3157
48

Appendix
Variable Definitions
Age. Age is computed as the difference between the filing year and the first year the firmappears in Compustat. We use the natural logarithm of Age in regressions.
Analyst following (# Analysts). The number of analysts following a firm in year t isdefined as the number of analysts that issue a forecast for firm-level EPS in the same year(I/B/E/S item NUMEST from the Historical Summary Statistics dataset).
Assets. Assets is the book value of assets (Compustat Item atq). We use the naturallogarithm of Compustat Item atq in regressions.
Bloomberg-Implied Credit Default Swap. 5 Year CDS (credit default swap) spread forthe company implied by the Bloomberg Issuer Default Risk model Likelihood of Default.
Cost of Debt (KXINTd ). Cost of debt is calculated as the ratio of interest expenses
(Compustat item xint) divided by total debt (short-term debt and long-term debt).Whenever missing or zero, we replace it with its median value by 2-digits SIC.
Cost of Debt (KLoansd ). Cost of debt is calculated as the weighted-average spread over
LIBOR for the ten most recent bank loans issued by the firm. We use the largest facility ineach loan package to compute the weighted-average cost of debt at each fiscal-year quarter.Whenever missing or zero, we replace it with its median value by 2-digits SIC.
Cost of Equity (Ke). Derived from the Capital Asset Pricing Model (CAPM). Betas areestimated from a regression of stock returns adjusted for delisting on market returns. Dataon the risk-free rate and equity risk premium for each month are from Damodaran.
Discretionary Accruals (Disc. Accruals). Discretionary accruals are obtained byimplementing the procedures outlined by Kothari et al. (2005).
Distance-to-default (DtD). The distance-to-default of each firm is computed inaccordance with the structural model of Merton (1974).
Earnings Announcement Speed (Speed). To proxy for the quality of a firm’s internalinformation environment follow Gallemore & Labro (2015) and compute the number of daysbetween the end of a firm’s fiscal quarter and the announcement of its earnings (asdetermined by Compustat Quarterly item RDQ).
Idiosyncratic Volatility. Idiosyncratic volatility is computed as the annualized standarddeviation of residuals from a regression of stock return adjusted for delisting on marketreturns. We use two years of monthly stock data to estimate market model regressions, anda minimum of six months of valid returns.
49

Institutional Ownership (InstOwn). At time t, the proportion of shares outstandingowned by institutional investors is computed by scaling the shares owned by institutionalinvestors (identified using data from SEC Form 13(f)) by the total split-adjusted sharesoutstanding for each security in CRSP.
Leverage. Leverage is computed as the firm’s short- and long-term debt (Compustat Itemsdlttq + dlcq) divided by the book value of assets (Compustat Item atq).
Profitability (ROA). ROA is computed as the firm’s net income (Compustat Item niq)divided by the book value of assets (Compustat Item atq).
Standardized Unexpected Earnings (SUE). Consistent with the measures ofstandardized unexpected earnings (SUE) based on the seasonal random walk models inLivnat & Mendenhall (2006), SUE1 in quarter t is computed by taking the differencebetween split-adjusted earnings per share excluding extraordinary items (CompustatQuarterly item EPSPXQ divided by item AJEXQ) in quarters t and t− 4, and scaling thisdifference by the split-adjusted price at the end of quarter t (Compustat Quarterly itemPRCCQ divided by item AJEXQ).
Tangibility. Tangibility is defined as a firm’s property, plant, and equipment (CompustatItem ppentq) divided by the book value of assets (Compustat Item atq).
Tobin’s q. Tobin’s q is defined as a firm’s book value of assets minus the book value ofcommon equity plus the market value of common equity (Compustat Items atq - ceqq +cshoq × prccq) divided by the book value of assets (Compustat Item atq).
50

Figure A.1: Discount Rates and RatingsThe figures display mean weighted-average discount rate of operating leases across group of firmsof similar credit rating and whose operating leases have similar weighted-average remaining lives.The blue dashed line in each panel displays a firm’s predicted discount rate as a function of theremaining life of the firm’s leases. This predicted value is obtained by estimating a firm’s discountrates as a function of the remaining life of a firm’s leases using a fractional polynomial function. Allcontinuous variables in each figure are winsorized at the 99 percent level.
51

Figure A.2: Discount Rates and IndustryThe figures display mean weighted-average discount rate of operating leases across Fama-French 12industry groups and whose operating leases have similar weighted-average remaining lives. The bluedashed line in each panel displays a firm’s predicted discount rate as a function of the remaininglife of the firm’s leases. This predicted value is obtained by estimating a firm’s discount rates as afunction of the remaining life of a firm’s leases using a fractional polynomial function. All continuousvariables in each figure are winsorized at the 99 percent level.
52
Figure A.3: Lease Ratios by IndustryThis figure shows the histogram, kernel density (blue line), and median value (red dotted line) ofthe lease-to-assets ratio, referred to as the lease ratio, for the first time adopters of the new ASC 842accounting standard within each Fama-French 12 industry group. Here, the lease ratio is winsorizedat the first and 95th percentile.
53

Figure A.4: Weighted Average Discount Rate by IndustryThis figure shows the histogram, kernel density (blue line), and median value (red dotted line) ofthe weighted-average discount for the first time adopters of the new ASC 842 accounting standardwithin each Fama-French 12 industry group. Here, the weighted-average discount rate is winsorizedat the 99 percent level.
54

Figure A.5: Weighted Average Life by IndustryThis figure shows the histogram, kernel density (blue line), and median value (red dotted line) of theweighted-average life of operating leases for the first time adopters of the new ASC 842 accountingstandard within each Fama-French 12 industry group. Here, the weighted-average life of operatingleases is winsorized at the 99 percent level.
55

Table A.1: Summary Statistics Across Different Methodologies by IndustryThis table reports summary statistics for the sample of first time adopters of the new ASC 842 ruleby industry using the Fama-French 12 industry classification. Panel A summarizes various measuresof operating leases as a percentage of total assets across various methodologies commonly employedin the literature. Panel B summarizes various measures of leverage after adjusting for operatinglease liabilities. We compute each ratio using the actual balance sheet value of operating leases,obtained via the ASC 842 accounting standard and denoted by “10-Q,” as well as four estimates ofthe balance sheet values of leases proposed by the prior literature. These four estimates of the valueof operating leases are drawn from Graham et al. (1998) (denoted “GLS 1998”), Rauh & Sufi (2012)(denoted “RS 20212”), Cornaggia et al. (2013) (denoted “CFS 2013”), and Graham & Lin (2018)(denoted “GK 2018”). All continuous variables are winsorized at the 1 percent level in both tails,and the appendix provides detailed variable descriptions.
Industry10-Q GLS 1998 RS 2012 CFS 2013 GK 2018
Panel A: Lease-to-AssetsConsumer NonDurables 0.080 0.058 0.085 0.072 0.086Consumer Durables 0.073 0.044 0.066 0.056 0.066Manufacturing 0.042 0.032 0.047 0.040 0.045Oil & Gas 0.029 0.023 0.031 0.027 0.029Chemicals 0.034 0.027 0.037 0.032 0.034Business Equipment 0.063 0.049 0.068 0.059 0.066TMT 0.057 0.040 0.072 0.057 0.057Utilities 0.027 0.018 0.031 0.025 0.032Wholesale & Retail 0.239 0.159 0.269 0.219 0.279Healthcare 0.062 0.050 0.073 0.063 0.067Finance 0.022 0.015 0.024 0.020 0.024Other 0.070 0.054 0.076 0.067 0.074
Panel B: Lease-to-Adj. AssetsConsumer NonDurables 0.069 0.051 0.072 0.062 0.072Consumer Durables 0.059 0.039 0.054 0.047 0.053Manufacturing 0.039 0.030 0.042 0.036 0.040Oil & Gas 0.027 0.022 0.028 0.025 0.026Chemicals 0.031 0.025 0.034 0.029 0.032Business Equipment 0.056 0.044 0.059 0.052 0.057TMT 0.050 0.036 0.060 0.049 0.050Utilities 0.021 0.014 0.023 0.019 0.023Wholesale & Retail 0.176 0.126 0.187 0.161 0.189Healthcare 0.055 0.045 0.061 0.054 0.056Finance 0.019 0.013 0.021 0.018 0.021Other 0.060 0.048 0.065 0.058 0.062
Panel C: Adj. LeverageConsumer NonDurables 0.380 0.367 0.380 0.374 0.381Consumer Durables 0.352 0.333 0.344 0.339 0.344Manufacturing 0.330 0.324 0.332 0.328 0.331Oil & Gas 0.383 0.379 0.383 0.382 0.383Chemicals 0.423 0.416 0.421 0.419 0.421Business Equipment 0.286 0.277 0.287 0.282 0.286TMT 0.514 0.506 0.516 0.512 0.512Utilities 0.452 0.429 0.434 0.432 0.434Wholesale & Retail 0.561 0.522 0.552 0.539 0.552Healthcare 0.296 0.287 0.297 0.293 0.294Finance 0.188 0.184 0.187 0.186 0.187Other 0.423 0.415 0.424 0.421 0.423
56

Table A.2: Variance DecompositionThis table reports a variance decomposition for the effect of some variables lease characteristics of first-time adopters of the new ASC842 accounting standard. The dependent variable is either the weighted-average discount rate or the weighted-average remaining life ofoperating lease at the end of the fiscal quarter. Independent variables include the same controls of Tables 5 and 10. We compute thepartial sum of squares for each variable and fixed effects and normalize to sum to one across specifications. Each continuous variable iswinsorized at the 1 percent level in both tails. All variables are described in detail in the Online Appendix.
Weighted-Average Discount Rates Weighted-Average Remaining Lives(1) (2) (3) (4) (5) (6) (1) (2) (3) (4) (5) (6)
Industry FE 0.92 - 0.85 - 0.19 0.19 0.98 - 0.96 - 0.63 0.56Time FE 0.08 - 0.08 - 0.11 0.10 0.02 - 0.01 - 0.02 0.02Discount Rate - - - - - - - 0.66 0.02 - - 0.04WAL - 0.14 0.01 - - 0.02 - - - - - −Lease Option (Dummy) - 0.29 0.00 - - 0.01 - 0.34 0.01 - - 0.04Lease-to-Asset - 0.57 0.05 - - 0.00 - 0.00 0.00 - - 0.00Assets - - - 0.07 0.04 0.04 - - - 0.41 0.10 0.10Age - - - 0.03 0.02 0.02 - - - 0.00 0.00 0.00Leverage - - - 0.26 0.21 0.19 - - - 0.02 0.00 0.00Profitability - - - 0.28 0.17 0.16 - - - 0.01 0.00 0.00Tangibility - - - 0.01 0.00 0.00 - - - 0.30 0.22 0.19Tobin’s q - - - 0.01 0.03 0.03 - - - 0.02 0.00 0.00Idiosyncratic Vol. - - - 0.25 0.15 0.15 - - - 0.19 0.02 0.03SP Ratings - - - 0.05 0.06 0.05 - - - 0.03 0.01 0.00No Rating - - - 0.04 0.03 0.03 - - - 0.03 0.01 0.01Adj-R2 0.22 0.03 0.24 0.44 0.48 0.49 0.13 0.01 0.14 0.12 0.19 0.20
57

Table A.3: Variance DecompositionThis table reports a variance decomposition for the effect of some variables lease characteristics of first time adopters of the new ASC 842accounting standard. The dependent variable is either the lease-to-asset ratio or the option to extend/renew existing operating leases atthe end of the fiscal quarter. Independent variables include the same controls of Tables 9 and 6. We compute the partial sum of squaresfor each variable and fixed effects and normalize to sum to one across specifications. Each continuous variable is winsorized at the 1percent level in both tails. All variables are described in detail in the Online Appendix.
Lease-to-Asset Option to Renew/Extend(1) (2) (3) (4) (5) (6) (1) (2) (3) (4) (5) (6)
Industry FE 0.97 - 0.93 - 0.88 0.87 0.69 - 0.53 - 0.53 0.31Time FE 0.03 - 0.03 - 0.03 0.04 0.31 - 0.32 - 0.29 0.26Discount Rate - 0.77 0.03 - - 0.00 - 0.55 0.03 - - 0.03WAL - 0.00 0.00 - - 0.00 - 0.14 0.06 - - 0.11Lease Option (Dummy) - 0.23 0.01 - - 0.01 - - - - - −Lease-to-Asset - - - - - - - 0.32 0.06 - - 0.08Assets - - - 0.12 0.00 0.01 - - - 0.07 0.01 0.01Age - - - 0.00 0.00 0.00 - - - 0.65 0.12 0.11Leverage - - - 0.75 0.04 0.04 - - - 0.00 0.01 0.03Profitability - - - 0.00 0.00 0.00 - - - 0.01 0.01 0.02Tangibility - - - 0.09 0.03 0.03 - - - 0.00 0.00 0.00Tobin’s q - - - 0.01 0.00 0.00 - - - 0.24 0.03 0.04Idiosyncratic Vol. - - - 0.02 0.00 0.00 - - - 0.02 0.00 0.00SP Ratings - - - 0.00 0.00 0.00 - - - 0.00 0.00 0.00No Rating - - - 0.00 0.00 0.00 - - - 0.00 0.00 0.00Adj-R2 0.36 0.02 0.37 0.09 0.42 0.42 0.03 0.02 0.04 0.01 0.04 0.05
58

Table A.4: Discount Rates and the Graham et al. (1998) Definition of Lease RatiosThis table reports OLS regression coefficients and standard errors for the effect of lease and firmcharacteristics on the weighted-average discount rate of operating leases of first time adopters ofthe new ASC 842 accounting standard. The dependent variable is the weighted-average discountrate reported in the Notes to Consolidated Financial Statements at the end of the fiscal quarter.Independent variables include the weighted-average life of the lease, lease option dummy, lease-to-asset ratio, defined by following Graham et al. (1998), the natural logarithm of total assets,leverage, profitability, tangibility, Tobin’s q, idiosyncratic volatility, the natural logarithm of firmage, S&P ratings, and a dummy variable that equals one if the firm is not rated, zero otherwise. Allcontinuous variables are winsorized at the 1 percent level in both tails. All variables are described indetail in the Online Appendix. All specifications include year-quarter and Fama-French 30 industryfixed effects. Standard errors are robust to heteroskedasticity. ***, **, * correspond to statisticalsignificance at the 1%, 5%, and 10% level, respectively.
(1) (2) (3) (4) (5)WAL 0.02∗∗∗ 0.03∗∗∗ 0.03∗∗∗ 0.03∗∗∗ 0.03∗∗∗
(0.00) (0.00) (0.01) (0.01) (0.01)Lease Option (Dummy) 0.16∗∗ 0.10 0.14∗ 0.16∗∗ 0.16∗∗
(0.08) (0.07) (0.07) (0.07) (0.07)Leases/Value 7.63∗∗∗ 5.68∗∗∗ 4.09∗∗∗ 2.05∗∗ 1.52∗
(0.91) (0.86) (0.84) (0.82) (0.82)Assets -0.36∗∗∗ -0.29∗∗∗ -0.21∗∗∗ -0.15∗∗∗
(0.02) (0.02) (0.02) (0.02)Age -0.41∗∗∗ -0.33∗∗∗ -0.25∗∗∗ -0.19∗∗∗
(0.05) (0.04) (0.05) (0.05)Leverage 2.34∗∗∗ 2.16∗∗∗ 2.06∗∗∗
(0.19) (0.18) (0.19)Profitability -2.29∗∗∗ -1.86∗∗∗ -2.02∗∗∗
(0.24) (0.24) (0.24)Tangibility -0.40∗ -0.34 -0.35
(0.23) (0.23) (0.23)Tobin’s q -0.10∗∗∗ -0.09∗∗∗
(0.02) (0.02)Idiosyncratic Vol. 2.10∗∗∗ 1.99∗∗∗
(0.24) (0.24)S&P Ratings -0.15∗∗∗
(0.02)No Rating -1.26∗∗∗
(0.26)Year-Quarter Fixed Effects Yes Yes Yes Yes YesFF30 Fixed Effects Yes Yes Yes Yes YesAdj.-R2 0.24 0.35 0.45 0.48 0.49Observations 3548 3548 3266 3157 3157
59
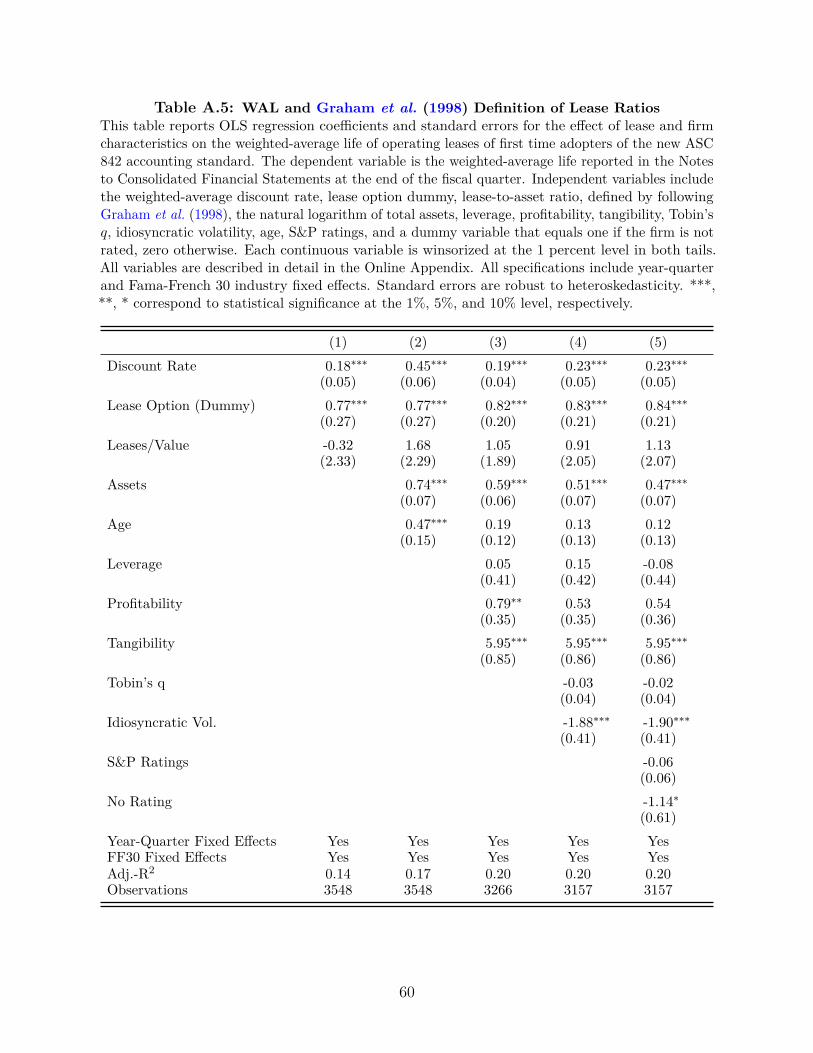
Table A.5: WAL and Graham et al. (1998) Definition of Lease RatiosThis table reports OLS regression coefficients and standard errors for the effect of lease and firmcharacteristics on the weighted-average life of operating leases of first time adopters of the new ASC842 accounting standard. The dependent variable is the weighted-average life reported in the Notesto Consolidated Financial Statements at the end of the fiscal quarter. Independent variables includethe weighted-average discount rate, lease option dummy, lease-to-asset ratio, defined by followingGraham et al. (1998), the natural logarithm of total assets, leverage, profitability, tangibility, Tobin’sq, idiosyncratic volatility, age, S&P ratings, and a dummy variable that equals one if the firm is notrated, zero otherwise. Each continuous variable is winsorized at the 1 percent level in both tails.All variables are described in detail in the Online Appendix. All specifications include year-quarterand Fama-French 30 industry fixed effects. Standard errors are robust to heteroskedasticity. ***,**, * correspond to statistical significance at the 1%, 5%, and 10% level, respectively.
(1) (2) (3) (4) (5)Discount Rate 0.18∗∗∗ 0.45∗∗∗ 0.19∗∗∗ 0.23∗∗∗ 0.23∗∗∗
(0.05) (0.06) (0.04) (0.05) (0.05)Lease Option (Dummy) 0.77∗∗∗ 0.77∗∗∗ 0.82∗∗∗ 0.83∗∗∗ 0.84∗∗∗
(0.27) (0.27) (0.20) (0.21) (0.21)Leases/Value -0.32 1.68 1.05 0.91 1.13
(2.33) (2.29) (1.89) (2.05) (2.07)Assets 0.74∗∗∗ 0.59∗∗∗ 0.51∗∗∗ 0.47∗∗∗
(0.07) (0.06) (0.07) (0.07)Age 0.47∗∗∗ 0.19 0.13 0.12
(0.15) (0.12) (0.13) (0.13)Leverage 0.05 0.15 -0.08
(0.41) (0.42) (0.44)Profitability 0.79∗∗ 0.53 0.54
(0.35) (0.35) (0.36)Tangibility 5.95∗∗∗ 5.95∗∗∗ 5.95∗∗∗
(0.85) (0.86) (0.86)Tobin’s q -0.03 -0.02
(0.04) (0.04)Idiosyncratic Vol. -1.88∗∗∗ -1.90∗∗∗
(0.41) (0.41)S&P Ratings -0.06
(0.06)No Rating -1.14∗
(0.61)Year-Quarter Fixed Effects Yes Yes Yes Yes YesFF30 Fixed Effects Yes Yes Yes Yes YesAdj.-R2 0.14 0.17 0.20 0.20 0.20Observations 3548 3548 3266 3157 3157
60

Table A.6: Option to Extend and Graham et al. (1998) Definition of Lease RatiosThis table reports OLS regression coefficients and standard errors for the effect of lease and firmcharacteristics on the presence of option to extend or renew existing leases of first time adoptersof the new ASC 842 accounting standard. The dependent variable is an indicator that takes avalue of one if a firm uses leases that contain renewal or extension options at the end of the fiscalquarter. Independent variables include the weighted-average discount rate, weighted-average lifeof the lease, lease-to-asset ratio, defined by following Graham et al. (1998), the natural logarithmof total assets, leverage, profitability, tangibility, Tobin’s q, idiosyncratic volatility, the naturallogarithm of firm age, S&P ratings, and a dummy variable that equals one if the firm is not rated,zero otherwise. Each continuous variable is winsorized at the 1 percent level in both tails. Allvariables are described in detail in the Online Appendix. All specifications include year-quarter andFama-French 30 industry fixed effects. Standard errors are robust to heteroskedasticity. ***, **, *correspond to statistical significance at the 1%, 5%, and 10% level, respectively.
(1) (2) (3) (4) (5)WAL 0.00∗∗∗ 0.00∗∗∗ 0.01∗∗∗ 0.01∗∗∗ 0.01∗∗∗
(0.00) (0.00) (0.00) (0.00) (0.00)Discount Rate 0.01∗∗ 0.01 0.01∗∗ 0.01∗∗ 0.01∗∗
(0.00) (0.00) (0.00) (0.00) (0.00)Leases/Value 0.55∗∗∗ 0.63∗∗∗ 0.70∗∗∗ 0.94∗∗∗ 0.93∗∗∗
(0.18) (0.19) (0.19) (0.20) (0.21)Assets 0.01∗ 0.01 0.01 0.01
(0.00) (0.01) (0.01) (0.01)Age -0.05∗∗∗ -0.06∗∗∗ -0.05∗∗∗ -0.05∗∗∗
(0.01) (0.01) (0.01) (0.01)Leverage -0.09∗∗ -0.10∗∗ -0.09∗∗
(0.04) (0.04) (0.04)Profitability 0.07∗ 0.07∗ 0.07
(0.04) (0.04) (0.04)Tangibility -0.05 -0.03 -0.03
(0.06) (0.06) (0.06)Tobin’s q 0.02∗∗∗ 0.02∗∗∗
(0.01) (0.01)Idiosyncratic Vol. -0.02 -0.02
(0.04) (0.04)S&P Ratings 0.00
(0.01)No Rating 0.04
(0.06)Year-Quarter Fixed Effects Yes Yes Yes Yes YesFF30 Fixed Effects Yes Yes Yes Yes YesPseudo.-R2 0.04 0.05 0.05 0.06 0.06Observations 3548 3548 3266 3157 3157
61

Table A.7: Graham et al. (1998) Definition of Lease Ratios and ControlsThis table reports OLS regression coefficients and standard errors for the effect of lease and firmcharacteristics on the lease-to-asset ratios of first time adopters of the new ASC 842 account-ing standard. The dependent variable is the lease-to-asset ratio, defined by following Grahamet al. (1998), at the end of the fiscal quarter. Independent variables include the weighted-averagediscount rate, weighted-average life of the lease, lease option dummy, the natural logarithm oftotal assets, leverage, profitability, tangibility, Tobin’s q, idiosyncratic volatility, the natural log-arithm of firm age, S&P ratings, and a dummy variable that equals one if the firm is not rated,zero otherwise. Each continuous variable is winsorized at the 1 percent level in both tails. Allvariables are described in detail in the Online Appendix. All specifications include year-quarterand Fama-French 30 industry fixed effects. Standard errors are robust to heteroskedasticity.***, **, * correspond to statistical significance at the 1%, 5%, and 10% level, respectively.
(1) (2) (3) (4) (5)Discount Rate 0.00∗∗∗ 0.00∗∗∗ 0.00∗∗∗ 0.00∗∗ 0.00∗
(0.00) (0.00) (0.00) (0.00) (0.00)WAL -0.00 0.00 0.00 0.00 0.00
(0.00) (0.00) (0.00) (0.00) (0.00)Lease Option (Dummy) 0.00∗∗∗ 0.01∗∗∗ 0.01∗∗∗ 0.01∗∗∗ 0.01∗∗∗
(0.00) (0.00) (0.00) (0.00) (0.00)Assets -0.00∗∗∗ -0.00∗∗∗ -0.00∗∗∗ -0.00∗∗∗
(0.00) (0.00) (0.00) (0.00)Age 0.00∗∗∗ 0.00∗∗∗ 0.00∗∗ 0.00∗∗∗
(0.00) (0.00) (0.00) (0.00)Leverage 0.02∗∗∗ 0.02∗∗∗ 0.02∗∗∗
(0.00) (0.00) (0.00)Profitability 0.00 0.00 -0.00
(0.00) (0.00) (0.00)Tangibility 0.04∗∗∗ 0.03∗∗∗ 0.03∗∗∗
(0.01) (0.01) (0.01)Tobin’s q -0.01∗∗∗ -0.01∗∗∗
(0.00) (0.00)Idiosyncratic Vol. 0.01∗∗∗ 0.01∗∗∗
(0.00) (0.00)S&P Ratings -0.00∗∗∗
(0.00)No Rating -0.01
(0.01)Year Fixed Effects Yes Yes Yes Yes YesFF30 Fixed Effects Yes Yes Yes Yes YesAdj.-R2 0.35 0.35 0.38 0.44 0.45Observations 3548 3548 3266 3157 3157
62

Table A.8: The Role of Financial DistressThis table reports OLS regression coefficients and standard errors for the effect of distress onthe weighted-average discount rate, weighted-average remaining life, option to extend/renew, andlease-to-asset ratios of first time adopters of the new ASC 842 accounting standard. The dependentvariable is the weighted-average discount rate (Panel A), the weighted-average remaining life ofoperating lease (Panel B), an indicator that takes a value of one if a firm uses leases that con-tain renewal or extension options (Panel C), and the lease-to-asset ratio (Panel D). Independentvariables include the probability of default estimated using Merton (1974)’s structural model, andcontrols as in Table 5. Each continuous variable is winsorized at the 1 percent level in bothtails. All variables are described in detail in the Online Appendix. All specifications includeyear-quarter and Fama-French 30 industry fixed effects. Standard errors are robust to heteroskedas-ticity. ***, **, * correspond to statistical significance at the 1%, 5%, and 10% level, respectively.
(1) (2) (3) (4) (5)Panel A: Discount Rate
Probability of Default 2.76∗∗∗ 2.26∗∗∗ 1.50∗∗∗ 0.74∗∗∗ 0.70∗∗∗(0.23) (0.23) (0.22) (0.22) (0.22)
Adj.-R2 0.27 0.37 0.47 0.50 0.51Panel B: WAL
Probability of Default -2.13∗∗∗ -1.88∗∗∗ -1.05∗∗ -0.46 -0.46(0.62) (0.60) (0.49) (0.54) (0.55)
Adj.-R2 0.13 0.16 0.18 0.18 0.18Panel C: Option to Extend
Probability of Default -0.12∗∗∗ -0.12∗∗∗ -0.11∗∗∗ -0.10∗∗ -0.10∗∗(0.04) (0.04) (0.04) (0.04) (0.05)
Pseudo.-R2 0.03 0.04 0.04 0.04 0.04Panel D: Lease-to-Asset
Probability of Default -0.00 -0.00 -0.02∗∗ -0.03∗∗∗ -0.03∗∗∗(0.01) (0.01) (0.01) (0.01) (0.01)
Adj.-R2 0.38 0.39 0.42 0.42 0.43
63

Table A.9: The Role of Financial ConstraintsThis table reports OLS regression coefficients and standard errors for the effect of financial constraintson the weighted-average discount rate, weighted-average remaining life, option to extend/renew, andlease-to-asset ratios of first time adopters of the new ASC 842 accounting standard. The dependentvariable is the weighted-average discount rate (Panel A), the weighted-average remaining life of oper-ating lease (Panel B), an indicator that takes a value of one if a firm uses leases that contain renewal orextension options (Panel C), and the lease-to-asset ratio (Panel D). Independent variables include theSA index as measure of financial constraints (as in Hadlock & Pierce (2010)), and controls as in Table5 except for firm size and age. We remove firm size and age as controls due to their mechanically highcorrelations with the SA (size-age) index. Each continuous variable is winsorized at the 1 percent levelin both tails. All variables are described in detail in the Online Appendix. All specifications includeyear-quarter and Fama-French 30 industry fixed effects. Standard errors are robust to heteroskedas-ticity. ***, **, * correspond to statistical significance at the 1%, 5%, and 10% level, respectively.
(1) (2) (3) (4) (5)Panel A: Discount Rate
Financial Constraints 1.99∗∗∗ 2.07∗∗∗ 1.29∗∗∗ 0.69∗∗∗ 0.51∗∗∗(0.12) (0.12) (0.14) (0.15) (0.15)
Adj.-R2 0.30 0.32 0.40 0.46 0.48Panel B: WAL
Financial Constraints -3.36∗∗∗ -4.16∗∗∗ -3.08∗∗∗ -2.60∗∗∗ -2.30∗∗∗(0.22) (0.27) (0.30) (0.34) (0.34)
Adj.-R2 0.16 0.17 0.19 0.19 0.20Panel C: Option to Extend
Financial Constraints -0.08∗∗∗ -0.10∗∗∗ -0.13∗∗∗ -0.15∗∗∗ -0.17∗∗∗(0.02) (0.02) (0.03) (0.03) (0.03)
Pseudo.-R2 0.04 0.05 0.05 0.06 0.06Panel D: Lease-to-Asset
Financial Constraints 0.02∗∗∗ 0.02∗∗∗ 0.02∗∗∗ 0.02∗∗∗ 0.01∗(0.00) (0.00) (0.01) (0.01) (0.01)
Adj.-R2 0.37 0.37 0.41 0.41 0.42
64

Table A.10: Marginal Tax RatesThis table reports OLS regression coefficients and standard errors for the effect of marginal tax rateson the weighted-average discount rate, weighted-average remaining life, option to extend/renew, andlease-to-asset ratios of first time adopters of the new ASC 842 accounting standard. The dependentvariable is the weighted-average discount rate (Panel A), the weighted-average remaining life ofoperating lease (Panel B), an indicator that takes a value of one if a firm uses leases that containrenewal or extension options (Panel C), and the lease-to-asset ratio (Panel D). Independent variablesinclude the before and after financing costs marginal tax rates from Graham et al. (1998), andcontrols as in Table 5. Each continuous variable is winsorized at the 1 percent level in both tails.All variables are described in detail in the Online Appendix. All specifications include year-quarterand Fama-French 30 industry fixed effects. Standard errors are robust to heteroskedasticity. ***,**, * correspond to statistical significance at the 1%, 5%, and 10% level, respectively.
(1) (2) (3) (4) (5)Panel A: Discount Rate
MTR (Before) -11.17∗∗∗ -7.62∗∗∗ -6.15∗∗∗ -5.32∗∗∗ -5.50∗∗∗(0.57) (0.60) (0.66) (0.65) (0.65)
MTR (After) -10.44∗∗∗ -7.27∗∗∗ -5.62∗∗∗ -4.81∗∗∗ -4.84∗∗∗(0.52) (0.54) (0.57) (0.57) (0.56)
Panel B: WALMTR (Before) 14.64∗∗∗ 8.17∗∗∗ 3.02∗∗ 2.26∗ 2.03
(1.57) (1.68) (1.31) (1.33) (1.35)MTR (After) 12.48∗∗∗ 6.86∗∗∗ 2.46∗ 1.95 1.73
(1.59) (1.66) (1.32) (1.34) (1.36)Panel C: Option to Extend
MTR (Before) -0.06 -0.04 -0.19 -0.16 -0.15(0.13) (0.14) (0.15) (0.15) (0.15)
MTR (After) -0.06 -0.06 -0.20 -0.18 -0.17(0.12) (0.13) (0.13) (0.14) (0.14)
Panel D: Lease-to-AssetMTR (Before) -0.03 0.00 -0.00 0.00 0.00
(0.02) (0.02) (0.03) (0.03) (0.03)MTR (After) -0.09∗∗∗ -0.07∗∗∗ -0.07∗∗∗ -0.06∗∗ -0.06∗∗
(0.02) (0.02) (0.03) (0.03) (0.03)
65