A New Color-Texture Approach for Products Inspection using Wavelets
6
G. VikranthKumar et al , International Journal of Computer Science and Mobile Computing Vol.2 Issue. 9, September- 2013, pg. 172-177 © 2013, IJCSMC All Rights Reserved 172 Available Online at www.ijcsmc.com International Journal of Computer Science and Mobile Computing A Monthly Journal of Computer Science and Information Technology ISSN 2320–088X IJCSMC, Vol. 2, Issue. 9, September 2013, pg.172 – 177 RESEARCH ARTICLE A New Color-Texture Approach for Products Inspection using Wavelets G. Vikranth Kumar 1 , Y. Durga Prasad 2 , Dr. Y. Venkateswarulu 3 ¹II M.Tech-CSE, GIETEC-Rajahmundry, Andhra Pradesh, INDIA ²Asst. Professor, Department of CSE, GIETEC-Rajahmundry, Andhra Pradesh, INDIA ³HOD of CSE & IT, GIETEC-Rajahmundry, Andhra Pradesh, INDIA 1 vikranthgiet@gmail.com; 2 ydpciet@gmail.com; 3 yallavenkat@yahoo.com Abstract— In this paper we introduce the concept of classification of color texture images using wavelets gives the better results rather than the existing systems that is Local Binary Pattern (LBP). We introduce the new technique which combines the LBP with Wavelets technique. It gives the more effective or efficient results for classification of various texture images or various products. Keywords— RGB; HSL; GLCM; LBP; DWT I. INTRODUCTION Texture is an important regional characteristic that can be employed in order to analyse an image. There does not exist a widely accepted definition of texture. However, for the sake of simplicity, texture may be considered as a spatial area consisting of an arrangement (regular or otherwise) of primitives resembling each other [1]. The classification of image data into different classes of texture is a challenging problem in image analysis [2]. The texture feature extraction can be classifies in to the five categories those are Statistical, Structural, Geometrical, Model based and Signal Processing. Perhaps the most common approach is to decompose the input image into frequency sub bands, from which, it is hoped, the features associated with textures present in the image can be extracted. Discrete wavelet transform provides a tractable way of decomposing an image into a number of frequency sub bands at different scales, a feature that has been associated with human visual system [3]. A conventional dyadic wavelet transform [4], however, has a shortcoming in that it does not benefit from possibly useful features that can be obtained by further decomposing the high frequency sub bands. There are many statistical methods for classification of texture images such as: Local features, Autoregressive, Galloway – run length matrix, Haralick – co-occurrence matrix, Unser, Sun and Wee, Amadasun, Dapeng and Amalung among the various methods we are using the Haralick features are used for the classification of the images. Haralick features can be calculated as follows: First transform pixels into a co-occurrence matrix then calculate a (large) number of statistical features from the matrix. This paper is based on A New Color-Texture approach for Industrial products inspection [5]. In this paper we introduce the new technique for classification of various products taken from the google data base. We are applying the Discrete Wavelet Transformations before the Texture processing of the images. Frame work of the proposed system as shown in the fig1.In the wavelet transform an image signal can be analyzed by passing it through an analysis filter bank followed by a decimation operation. This analysis filter bank consists of a low
Transcript of A New Color-Texture Approach for Products Inspection using Wavelets
G. VikranthKumar et al, International Journal of Computer Science and Mobile Computing Vol.2 Issue. 9, September- 2013, pg. 172-177
© 2013, IJCSMC All Rights Reserved 172
Available Online at www.ijcsmc.com
International Journal of Computer Science and Mobile Computing
A Monthly Journal of Computer Science and Information Technology
ISSN 2320–088X
IJCSMC, Vol. 2, Issue. 9, September 2013, pg.172 – 177
RESEARCH ARTICLE
A New Color-Texture Approach for Products Inspection using Wavelets
G. Vikranth Kumar1, Y. Durga Prasad2, Dr. Y. Venkateswarulu3 ¹II M.Tech-CSE, GIETEC-Rajahmundry, Andhra Pradesh, INDIA
²Asst. Professor, Department of CSE, GIETEC-Rajahmundry, Andhra Pradesh, INDIA ³HOD of CSE & IT, GIETEC-Rajahmundry, Andhra Pradesh, INDIA
1 [email protected]; 2 [email protected]; 3 [email protected]
Abstract— In this paper we introduce the concept of classification of color texture images using wavelets gives the better results rather than the existing systems that is Local Binary Pattern (LBP). We introduce the new technique which combines the LBP with Wavelets technique. It gives the more effective or efficient results for classification of various texture images or various products. Keywords— RGB; HSL; GLCM; LBP; DWT
I. INTRODUCTION Texture is an important regional characteristic that can be employed in order to analyse an image.
There does not exist a widely accepted definition of texture. However, for the sake of simplicity, texture may be considered as a spatial area consisting of an arrangement (regular or otherwise) of primitives resembling each other [1]. The classification of image data into different classes of texture is a challenging problem in image analysis [2]. The texture feature extraction can be classifies in to the five categories those are Statistical, Structural, Geometrical, Model based and Signal Processing. Perhaps the most common approach is to decompose the input image into frequency sub bands, from which, it is hoped, the features associated with textures present in the image can be extracted.
Discrete wavelet transform provides a tractable way of decomposing an image into a number of frequency sub bands at different scales, a feature that has been associated with human visual system [3]. A conventional dyadic wavelet transform [4], however, has a shortcoming in that it does not benefit from possibly useful features that can be obtained by further decomposing the high frequency sub bands. There are many statistical methods for classification of texture images such as: Local features, Autoregressive, Galloway – run length matrix, Haralick – co-occurrence matrix, Unser, Sun and Wee, Amadasun, Dapeng and Amalung among the various methods we are using the Haralick features are used for the classification of the images. Haralick features can be calculated as follows: First transform pixels into a co-occurrence matrix then calculate a (large) number of statistical features from the matrix.
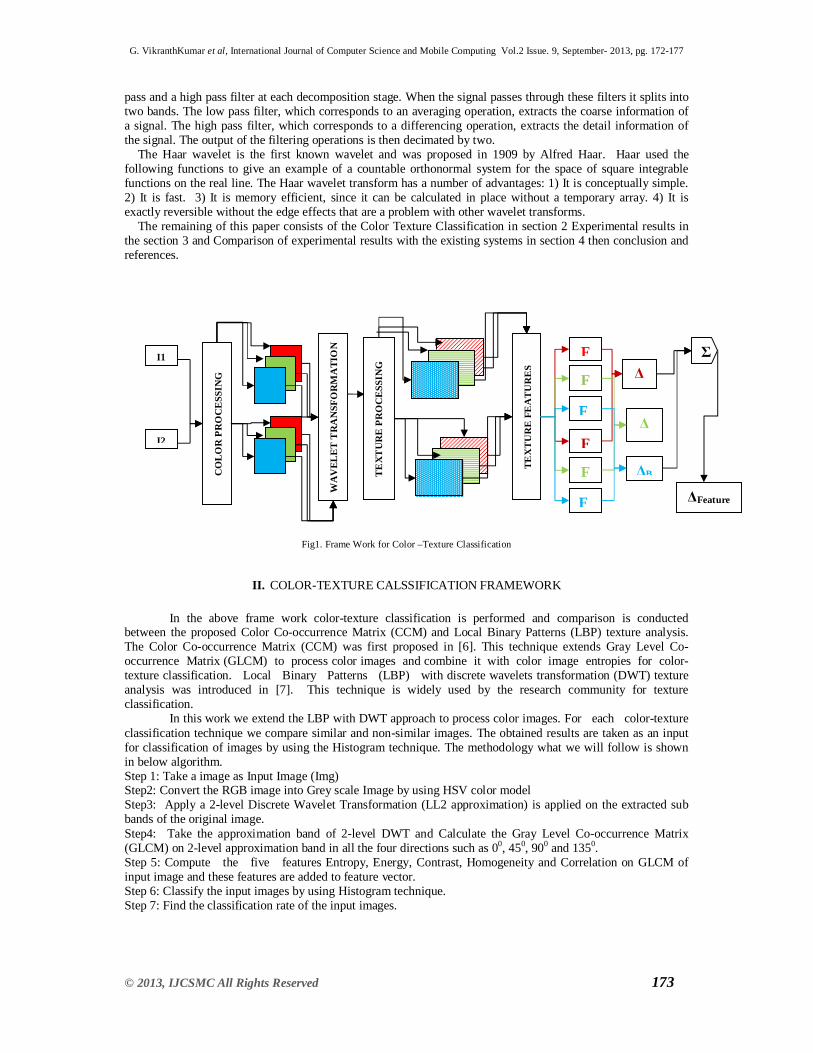
This paper is based on A New Color-Texture approach for Industrial products inspection [5]. In this paper we introduce the new technique for classification of various products taken from the google data base. We are applying the Discrete Wavelet Transformations before the Texture processing of the images. Frame work of the proposed system as shown in the fig1.In the wavelet transform an image signal can be analyzed by passing it through an analysis filter bank followed by a decimation operation. This analysis filter bank consists of a low
G. VikranthKumar et al, International Journal of Computer Science and Mobile Computing Vol.2 Issue. 9, September- 2013, pg. 172-177
© 2013, IJCSMC All Rights Reserved 173
pass and a high pass filter at each decomposition stage. When the signal passes through these filters it splits into two bands. The low pass filter, which corresponds to an averaging operation, extracts the coarse information of a signal. The high pass filter, which corresponds to a differencing operation, extracts the detail information of the signal. The output of the filtering operations is then decimated by two.
The Haar wavelet is the first known wavelet and was proposed in 1909 by Alfred Haar. Haar used the following functions to give an example of a countable orthonormal system for the space of square integrable functions on the real line. The Haar wavelet transform has a number of advantages: 1) It is conceptually simple. 2) It is fast. 3) It is memory efficient, since it can be calculated in place without a temporary array. 4) It is exactly reversible without the edge effects that are a problem with other wavelet transforms.
The remaining of this paper consists of the Color Texture Classification in section 2 Experimental results in the section 3 and Comparison of experimental results with the existing systems in section 4 then conclusion and references.
Fig1. Frame Work for Color –Texture Classification
II. COLOR-TEXTURE CALSSIFICATION FRAMEWORK
In the above frame work color-texture classification is performed and comparison is conducted between the proposed Color Co-occurrence Matrix (CCM) and Local Binary Patterns (LBP) texture analysis. The Color Co-occurrence Matrix (CCM) was first proposed in [6]. This technique extends Gray Level Co-occurrence Matrix (GLCM) to process color images and combine it with color image entropies for color-texture classification. Local Binary Patterns (LBP) with discrete wavelets transformation (DWT) texture analysis was introduced in [7]. This technique is widely used by the research community for texture classification.
In this work we extend the LBP with DWT approach to process color images. For each color-texture classification technique we compare similar and non-similar images. The obtained results are taken as an input for classification of images by using the Histogram technique. The methodology what we will follow is shown in below algorithm. Step 1: Take a image as Input Image (Img) Step2: Convert the RGB image into Grey scale Image by using HSV color model Step3: Apply a 2-level Discrete Wavelet Transformation (LL2 approximation) is applied on the extracted sub bands of the original image. Step4: Take the approximation band of 2-level DWT and Calculate the Gray Level Co-occurrence Matrix (GLCM) on 2-level approximation band in all the four directions such as 00, 450, 900 and 1350. Step 5: Compute the five features Entropy, Energy, Contrast, Homogeneity and Correlation on GLCM of input image and these features are added to feature vector. Step 6: Classify the input images by using Histogram technique. Step 7: Find the classification rate of the input images.
Σ F
F
F
F
F
F
I1
I2
CO
LO
R P
RO
CE
SSIN
G
TE
XT
UR
E P
RO
CE
SSIN
G
TEX
TU
RE
FEA
TU
RE
S Δ
Δ
ΔB
ΔFeature
WA
VEL
ET
TR
AN
SFO
RM
ATI
ON
G. VikranthKumar et al, International Journal of Computer Science and Mobile Computing Vol.2 Issue. 9, September- 2013, pg. 172-177
© 2013, IJCSMC All Rights Reserved 174
III. RESULTS AND DISCUSSIONS
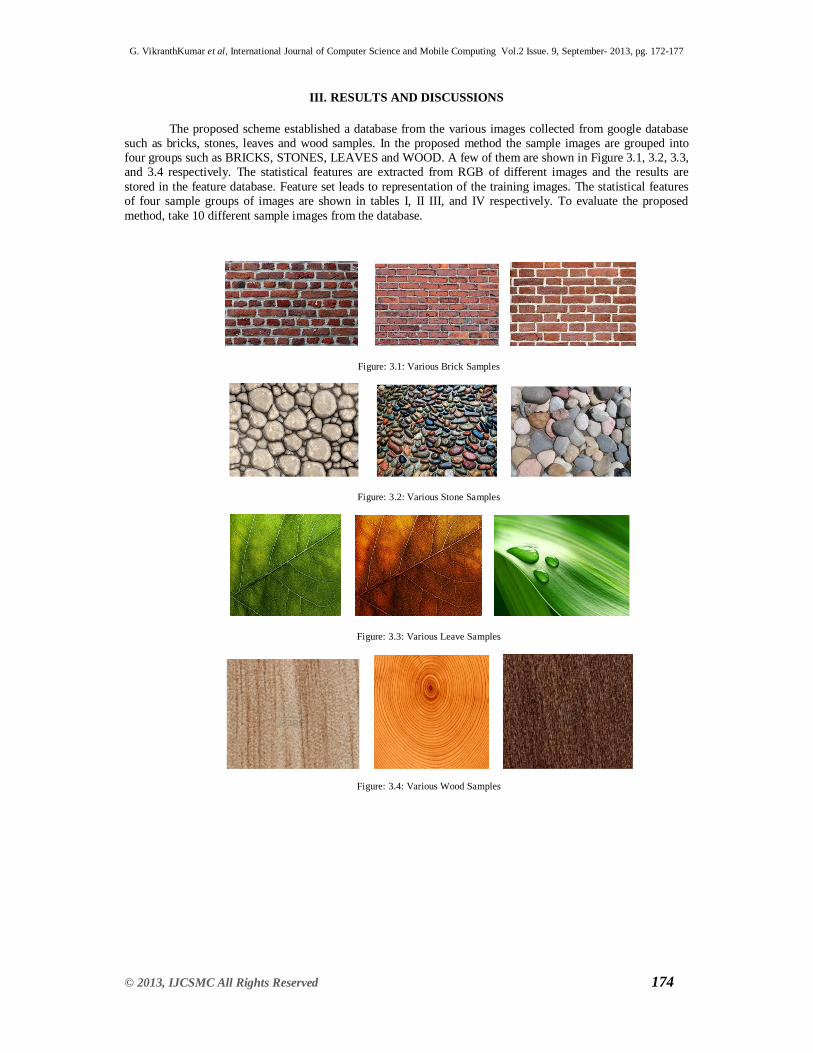
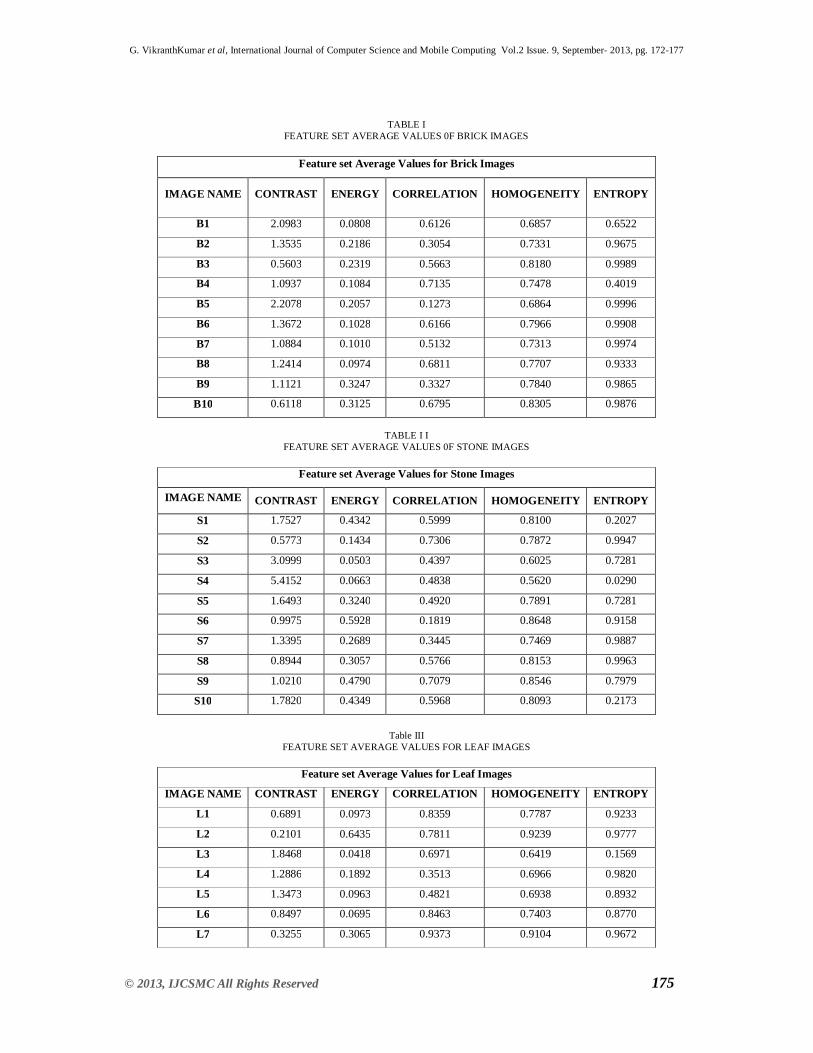
The proposed scheme established a database from the various images collected from google database such as bricks, stones, leaves and wood samples. In the proposed method the sample images are grouped into four groups such as BRICKS, STONES, LEAVES and WOOD. A few of them are shown in Figure 3.1, 3.2, 3.3, and 3.4 respectively. The statistical features are extracted from RGB of different images and the results are stored in the feature database. Feature set leads to representation of the training images. The statistical features of four sample groups of images are shown in tables I, II III, and IV respectively. To evaluate the proposed method, take 10 different sample images from the database.
Figure: 3.1: Various Brick Samples
Figure: 3.2: Various Stone Samples
Figure: 3.3: Various Leave Samples
Figure: 3.4: Various Wood Samples
G. VikranthKumar et al, International Journal of Computer Science and Mobile Computing Vol.2 Issue. 9, September- 2013, pg. 172-177
© 2013, IJCSMC All Rights Reserved 175
TABLE I FEATURE SET AVERAGE VALUES 0F BRICK IMAGES
Feature set Average Values for Brick Images
IMAGE NAME CONTRAST ENERGY CORRELATION HOMOGENEITY ENTROPY
B1 2.0983 0.0808 0.6126 0.6857 0.6522
B2 1.3535 0.2186 0.3054 0.7331 0.9675
B3 0.5603 0.2319 0.5663 0.8180 0.9989
B4 1.0937 0.1084 0.7135 0.7478 0.4019
B5 2.2078 0.2057 0.1273 0.6864 0.9996
B6 1.3672 0.1028 0.6166 0.7966 0.9908
B7 1.0884 0.1010 0.5132 0.7313 0.9974
B8 1.2414 0.0974 0.6811 0.7707 0.9333
B9 1.1121 0.3247 0.3327 0.7840 0.9865
B10 0.6118 0.3125 0.6795 0.8305 0.9876
TABLE I I
FEATURE SET AVERAGE VALUES 0F STONE IMAGES
Feature set Average Values for Stone Images
IMAGE NAME CONTRAST ENERGY CORRELATION HOMOGENEITY ENTROPY
S1 1.7527 0.4342 0.5999 0.8100 0.2027
S2 0.5773 0.1434 0.7306 0.7872 0.9947
S3 3.0999 0.0503 0.4397 0.6025 0.7281
S4 5.4152 0.0663 0.4838 0.5620 0.0290
S5 1.6493 0.3240 0.4920 0.7891 0.7281
S6 0.9975 0.5928 0.1819 0.8648 0.9158
S7 1.3395 0.2689 0.3445 0.7469 0.9887
S8 0.8944 0.3057 0.5766 0.8153 0.9963
S9 1.0210 0.4790 0.7079 0.8546 0.7979
S10 1.7820 0.4349 0.5968 0.8093 0.2173
Table III
FEATURE SET AVERAGE VALUES FOR LEAF IMAGES
Feature set Average Values for Leaf Images
IMAGE NAME CONTRAST ENERGY CORRELATION HOMOGENEITY ENTROPY
L1 0.6891 0.0973 0.8359 0.7787 0.9233
L2 0.2101 0.6435 0.7811 0.9239 0.9777
L3 1.8468 0.0418 0.6971 0.6419 0.1569
L4 1.2886 0.1892 0.3513 0.6966 0.9820
L5 1.3473 0.0963 0.4821 0.6938 0.8932
L6 0.8497 0.0695 0.8463 0.7403 0.8770
L7 0.3255 0.3065 0.9373 0.9104 0.9672

G. VikranthKumar et al, International Journal of Computer Science and Mobile Computing Vol.2 Issue. 9, September- 2013, pg. 172-177
© 2013, IJCSMC All Rights Reserved 176
L8 0.3013 0.5510 0.7451 0.9083 0.9852
L9 0.1124 0.4351 0.7609 0.9438 0.4734
L10 1.5642 0.1157 0.0502 0.6427 0.9945
Table IV
FEATURE SET VALUES FOR WOOD IMAGES
Feature set values for Wood Images
IMAGE NAME CONTRAST ENERGY CORRELATION HOMOGENEITY ENTROPY
W1 0.0737 0.8673 0.5256 0.9722 0.9929
W2 1.3652 0.0976 0.2156 0.6450 0.9376
W3 0.3239 0.2960 0.3698 0.8395 0.5859
W4 0.0476 0.9069 0.6699 0.9807 0.8804
W5 1.3848 0.4108 0.5081 0.8158 0.6877
W6 1.0986 0.2163 0.6243 0.7971 0.8711
W7 1.2012 0.1175 0.6064 0.7247 0.9651
W8 0.0051 0.9850 0.4778 0.9974 0.3373
W9 0.4362 0.2504 0.6953 0.8428 0.9270
W10 1.3652 0.0976 0.2156 0.6450 0.9376
IV. COMPARISON OF THE PROPOSED METHOD WITH OTHER EXISTING METHODS When compare with the other methods in various texture classification systems like Calculation of GLCM of
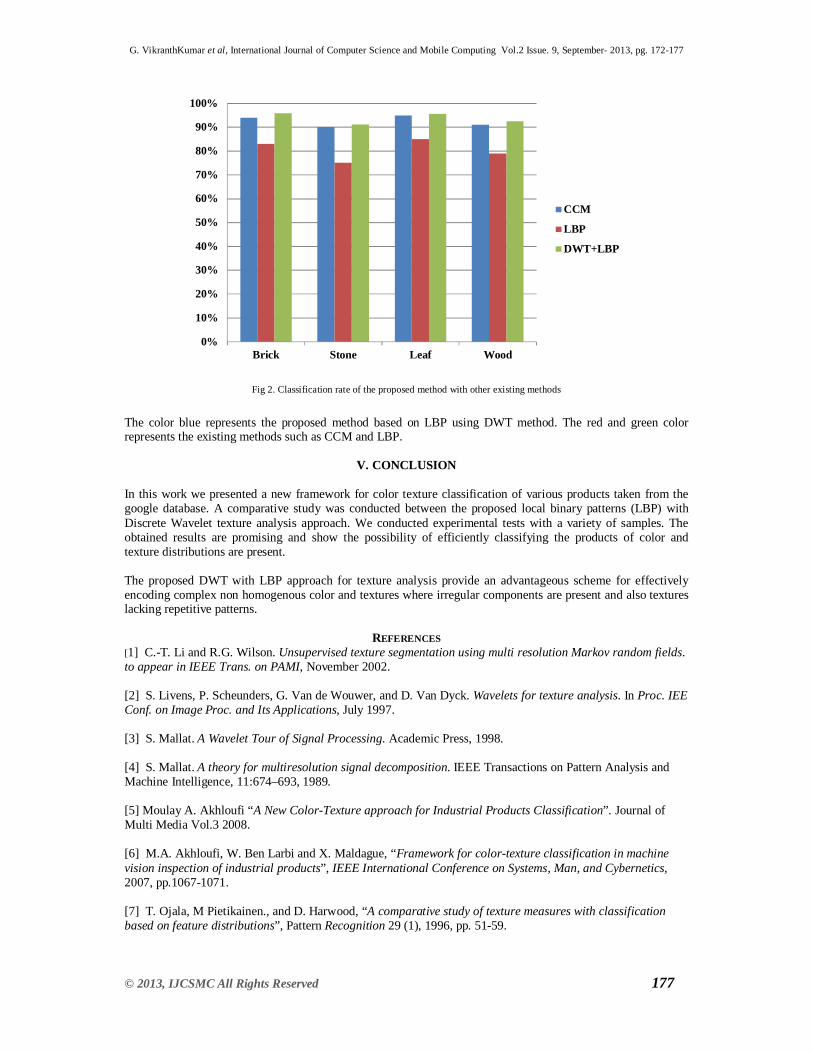
an Image and calculate Texture features such as Energy, Contrast, Entropy, Homogeneity and Correlation. The proposed method gives a higher classification rate than the existing methods. The percentage of classification proposed method and other existing methods are listed in table V. The graphical representation of the percentage mean classification rate for the proposed method and other existing methods are shown in figure 2.
Table V CLASSIFICATION RATE OF THE PROPOSED METHOD WITH OTHER EXISTING METHODS
Image Data Existing Method Proposed Method
CCM LBP DWT+LBP
Brick 94% 83% 95.8%
Stone 90% 75% 91.23%
Leaf 95% 85% 95.57%
Wood 91% 79% 92.6%
G. VikranthKumar et al, International Journal of Computer Science and Mobile Computing Vol.2 Issue. 9, September- 2013, pg. 172-177
© 2013, IJCSMC All Rights Reserved 177
Fig 2. Classification rate of the proposed method with other existing methods
The color blue represents the proposed method based on LBP using DWT method. The red and green color represents the existing methods such as CCM and LBP.
V. CONCLUSION
In this work we presented a new framework for color texture classification of various products taken from the google database. A comparative study was conducted between the proposed local binary patterns (LBP) with Discrete Wavelet texture analysis approach. We conducted experimental tests with a variety of samples. The obtained results are promising and show the possibility of efficiently classifying the products of color and texture distributions are present. The proposed DWT with LBP approach for texture analysis provide an advantageous scheme for effectively encoding complex non homogenous color and textures where irregular components are present and also textures lacking repetitive patterns.
REFERENCES [1] C.-T. Li and R.G. Wilson. Unsupervised texture segmentation using multi resolution Markov random fields. to appear in IEEE Trans. on PAMI, November 2002. [2] S. Livens, P. Scheunders, G. Van de Wouwer, and D. Van Dyck. Wavelets for texture analysis. In Proc. IEE Conf. on Image Proc. and Its Applications, July 1997. [3] S. Mallat. A Wavelet Tour of Signal Processing. Academic Press, 1998. [4] S. Mallat. A theory for multiresolution signal decomposition. IEEE Transactions on Pattern Analysis and Machine Intelligence, 11:674–693, 1989. [5] Moulay A. Akhloufi “A New Color-Texture approach for Industrial Products Classification”. Journal of Multi Media Vol.3 2008. [6] M.A. Akhloufi, W. Ben Larbi and X. Maldague, “Framework for color-texture classification in machine vision inspection of industrial products”, IEEE International Conference on Systems, Man, and Cybernetics, 2007, pp.1067-1071. [7] T. Ojala, M Pietikainen., and D. Harwood, “A comparative study of texture measures with classification based on feature distributions”, Pattern Recognition 29 (1), 1996, pp. 51-59.
0%
10%
20%
30%
40%
50%
60%
70%
80%
90%
100%
Brick Stone Leaf Wood
CCM
LBP
DWT+LBP