A New Approach. Co - ERIC
74
DOCUMENT RESUME - ED 137 025 8C 009 803 AUTHOR Young, Ruth C. TITLE Social Indicators for Developing Countries: A New Approach. Cornell Rural Sociology Bulletin Series - Bulletin No. 82. INSTITUTION Cornell Univ., Ithaca, N.Y. Dept. of-Rural Sociology.; New York Agricultural Experiment Station, Ithaca. PUB DATE Mar 77 NOTE 79p.; Not available in hard copy due to small print size of original document EDRS PRICE MF-$0.83 Plus Postage. HC Not Available frog 2DRS. DESCRIPTORS *Developing Nations; *Food; Guides; *Measurement; Research Methodology; *Rural Development; *Social Indicators; Tables (Data) IDENTIFIERS *Quality of Life ABSTRACT Designed to be self-contained, the material in this workbook on social indicators can be used for teaching and research . purposes by agency field workers and/eir undergraduates from developing nations who do not have a social science background. Originally presented to 22 professional people from Bangladesh, Indonesia, and .the Philippines as part of a 10-week workshop on research methods for rural development held at the East-Vest Center in Honolulu, Hawaii (November 1975),,this material includes many illustrative tables (e.g., Proposed Indicators of Overall Philippine Vell-Being; Criteria of Social Nell-Being and Variables Used in Analysis of 48 United States; Preliminary Cross-Cultural Scale for Measuring level of living; Comparison of level of living Scores for Georgia, Puerto Rico, and the Dominican Republic; Sample Household Food Consumption Schedule; Mauritius: Food Balance Shee4, 1960-64; etc.). Since data indicate food is virtually all that rural poor people in developing nations have and since most social indicator measures are more appropriate for urban dwellers in developed coLntries, especially the more affluent, it is suggested that food be made the core measure at the family, village, and national level. It is further suggested.that food is inherently distributive (even the rich can only eat so much) and that as an indicator of human welfare, food avoids the problem of value judgments upon the relative quality of life provided by a given technological innovation. (JC) *********************************************************************** * Documents acquired by ERIC include many informal unpublished * materials not available from other sources. ERIC makes every effort * * to obtain the best copy available. Nevertheless, items of marginal * * reproducibility are often encountered and this affects the quality * * of the microftche and hardcopy reproductions LAIC makes available * * via the ERIC Document Reproduction Service (EDES). EDRS is not * responsible for the quality of the original document. Reproductions * * supplied by EDES are the best that can be 1.ade from the original. * ***********************************************************************
-
Upload
khangminh22 -
Category
Documents
-
view
0 -
download
0
Transcript of A New Approach. Co - ERIC

DOCUMENT RESUME
- ED 137 025 8C 009 803
AUTHOR Young, Ruth C.TITLE Social Indicators for Developing Countries: A New
Approach. Cornell Rural Sociology Bulletin Series -Bulletin No. 82.
INSTITUTION Cornell Univ., Ithaca, N.Y. Dept. of-RuralSociology.; New York Agricultural Experiment Station,Ithaca.
PUB DATE Mar 77NOTE 79p.; Not available in hard copy due to small print
size of original document
EDRS PRICE MF-$0.83 Plus Postage. HC Not Available frog 2DRS.DESCRIPTORS *Developing Nations; *Food; Guides; *Measurement;
Research Methodology; *Rural Development; *SocialIndicators; Tables (Data)
IDENTIFIERS *Quality of Life
ABSTRACTDesigned to be self-contained, the material in this
workbook on social indicators can be used for teaching and research .
purposes by agency field workers and/eir undergraduates fromdeveloping nations who do not have a social science background.Originally presented to 22 professional people from Bangladesh,Indonesia, and .the Philippines as part of a 10-week workshop onresearch methods for rural development held at the East-Vest Centerin Honolulu, Hawaii (November 1975),,this material includes manyillustrative tables (e.g., Proposed Indicators of Overall PhilippineVell-Being; Criteria of Social Nell-Being and Variables Used inAnalysis of 48 United States; Preliminary Cross-Cultural Scale forMeasuring level of living; Comparison of level of living Scores forGeorgia, Puerto Rico, and the Dominican Republic; Sample HouseholdFood Consumption Schedule; Mauritius: Food Balance Shee4, 1960-64;etc.). Since data indicate food is virtually all that rural poorpeople in developing nations have and since most social indicatormeasures are more appropriate for urban dwellers in developedcoLntries, especially the more affluent, it is suggested that food bemade the core measure at the family, village, and national level. Itis further suggested.that food is inherently distributive (even therich can only eat so much) and that as an indicator of human welfare,food avoids the problem of value judgments upon the relative qualityof life provided by a given technological innovation. (JC)
************************************************************************ Documents acquired by ERIC include many informal unpublished* materials not available from other sources. ERIC makes every effort ** to obtain the best copy available. Nevertheless, items of marginal ** reproducibility are often encountered and this affects the quality ** of the microftche and hardcopy reproductions LAIC makes available ** via the ERIC Document Reproduction Service (EDES). EDRS is not* responsible for the quality of the original document. Reproductions ** supplied by EDES are the best that can be 1.ade from the original. ************************************************************************

CORNELL
RURAL SOCIOLOGY
BULLETIN SERIES
U.S. DEPARTMENT OF HEALTH,EDUCATION& WELFARENATIONAL INSTITUTE OF
EDUCATION
THIS DOCUMENT HAS BEEN REPRO-DUCE!, EXACTLY. AS RECEIVED FROMTHE PERSON OR ORGANUATIONATING IT. POINTs.oF VI EWOR OPINIONSSTATED DO NOT NECESSARILY RepotsSENT OFFICIAL NATIONAL INSTITUTE OFEDUCATION POSITION OR POLICY. -
Department of Rural SociologyCornell University Agricultural Experiment Station
New York State College of Agriculture and Life SciencesA Statutory College at the State University
Cornell University, Ithaca, New York, 14853
2

PREFACE
The material presented in this handbook on social indicators was originally presentedas part of a ten-week workshop on research methods for Technology and Development at theEast-West Center in November, 1975. The workshop was part of the Institute's project onthe Role of Intermediate Institutions in Technology Transfer to Small Farmers. Theparticipants included 22 professional people from Bangladesh, Indonesia and the Philippines.A few of these were sociologists, but most came from a variety ofotherprofessionalfields. All worked on problems of rural development. In the workshop the participantSwere given reprints of much of the material included in the bibliography so that theywould have a self-contained mini-reference library when they returned to their universitiesand agencies where such material would not be available. The aim was to provide enoughmaterial for non-sociologists to do a simple piece of research on one or more measures ofthe quality of life. A new approch is suggested that makes food a core measure at thefamily, village and the national level. Food is virtually all that poor rural people indeveloping countries have or spend money on. Yet most measures used in social indicatorresearch are more appropriate for urban people in developed countries, and especiallythe more affluent among them.
The hope in revising the material presented at the workshop into the handbook was-3to make such material available to a wider audience with similar research needs. It
is meant to be self-contained and many illustrative tables are included to make it so.But it can easily be expanded by using the bibliographic sources. 'It can be-used forteaching and research purposes for persons in agencies carrying on field work andresearch who do not have a social science background and for undergraduates in developingcountries. It does not, of course, include instructional material on statistics or onresearch design, both of which are readily available in standard sources.
I wish to thank Bruce Koppel for suggesting that I do this piece of work and I thankhim and Gary Hansen for making it possible. I thank the workshop participants for theirpatience, support, questions and reactions to the material; sudh help is essential inpreparing teaching material. I thank Laura Felix, Gloria Yu, Helen Honma and FrancineHirokawa for typing and processing materials. I also thank my husband and colleague,Frank W. Young for his customary criticism, advice and support.
3

THE SOCIAL INDICATORS MOVEMENT
In the 1960s the social indicators movement in the United States gained momentum.During the administration of Lyndon Johnson there was a growing feeling of wanting togo around or beyond purely economic approach...:s to national development and to set goals,make efforts and evaluate progress directly in terms of how well people--and especiallypoor people--actually live rather than in narrower terms of market indicators, GNP, andcost-of-living indices. The idea was not that economic indicators could be dispensedwith, but that national goals should not be merely economic nor should economic progressbe accepted as a sufficient definition of national progress. People became concernedabout pockets of poor people living in the midst of the richest nation in the world,about national health statistics where infant mortality fell far behind that of lessaffluent nations, of problems of deprived ethnic groups, of.school systems that werenot educating people, of growing problems of pollution and of use of national resources.The movement had two edges: first, defining national goals in terms of human welfarerather than purely economic progress; secondly, measuring national welfare in terms ofhuman welfare rather than in terms of strictly economic indicators. The two are ofcourse related, and the aim of measurement was to provide a set of social welfareindicators that would be used to evaluate programs, assess change, and guide policy.The aim was to develop social indicators to monitor social change that would be asstandardized, as widely understood, used and accepted as the economic indicators thathave so long fed into government policy.
Similar concerns have arisen in the developing countries and in internationalagencies--the U.N. and the World Bank (World Bank 1975). Their concern wlth themeasurement of social welfare had similar origins. Western economic theories had guidedprograms designed by the developed nations to help the developing since World War II.These subsC.antial efforts did not appear to have had the desired effect. If oneexamined particular programs carefully some seemed to have totally failed. Others mayhave succeeded as planned in terms of doing what they set out to do--such as provideelectrificationwithout having had the desired effect, such as stimulating industry orraising the level of living. Still others could not be evaluated at all. In fact,
development programs are notoriously difficult to evaluate. Designs and measures fordoing so are lacking. This apparent lack of congruence between development efforts anddevelopment outcomes has stimulated social scientists, international agencies andnational governments to go in the direction of a more direct but broader criterion of
development, namely are the people any better off than before we started. Tiles theseagencies, as in the case of the United States groups, have begun to set goals in terms
of human welfare. Currently popular terms that summarize this point of view are suchphrases as integrated rural development, the lowest 40 percent, etc. Agencies arespecifying the use of funds for projects that can demonstrably alter human welfare, not
indirectly by helping large industry in the assumption that itP expansion will haveindirect or trickle-down benefits for the poor, but helping those projects where thepoor are built in directly and in the visible future. These revised views of developmentand dissatisfactions with traditional economic views have also led to a realization of
the need for better measures and more precisely defined goals. For example, nationaldevelopment agencies are trying to work on social indicators for their own countries,and international agencies have social indicator groups or departments.1
There is also, of course, an economic version of this. Some economists are nowconcerned with "income inequality." That is they are interested not only in the size ofthe GNP and its increase, but in how it is distributed. But other social scientistsstill feel that this is a narrowly conceived apprsi%ch that focuses on political andsocialproblems only insofar as they relate to purely economic concerns, and that manysocial and political structures affect well-being directly and have to be dealt withand altered in their own right. If income is poorly distributed, this means that oppor-tunity is also, along with political access, social status, educatthnal opportunity,self-determination, and access to information. It means that policies about use ofresources and government goals are also narrowly conceived. Thus they feel that.thereis a theoretical need to broaden the problem from income inequality to human welfare,social justice, and political participation.
Sheldon2 and Parke (1975) have described the course of the development of the social
indicators movement and distinguish several different types of research efforts thathave developed from these first rather vague beginnings. One is the provision ofstatistical time series that measure changes taking place in society. Another isevaluation of social programs and development experiments. A third is modifying previousmethods of national accounting to provide improved measures of national welfare. A
fourth they mention include efforts to define national goals and priorities and measurecosts of achieving them.
4

In terms of what researehers might actUaliY-dO social IndicatOiS-reSearCh:inelUdes:describing the social system; studying change and trends over time;- evaluating programs,giving policy advice based on these kinds of research. All of these quite generalactivities have a focus on social welfare or the quality of life, vaguely defined butdefinitely going beyond an economic definition.
So far so good. But what is welfare? All that we know so far ith that economic .
definitions are not good enough. The social indicators movement has, been calleda socialmovement because that is a more appropriate term for it in its present'State than any .
other, such as theory, model, paradigm, etc. It is strong on conviction, widelY accepted-and undefined.
Definitions have run largely to lists of what a social scientist or government agency:_consider good indicators of social welfare. These are chosen on a value, normative,or.:idealistic basis, but tend to include many of the same types of elements.: -diet and food,health, education, housing, public safety. Sometimes they include social problems, political participation, use of resources, pollution, the quality of government. One such.list is an attempt by the Development Academy of_the Philippines' to'set'social goals andrecommend measures of them in "Measuring the QUality of Life: Philippine Social Indica7tors" (1975). Another list coMes from David Smith's study, the Geography'of SocialWell-being in the United States (1973). These are very similar and are based on,commonsense or human understanding. They agree quite well on what they think social well-being-is,_bta.they have not defined it conceptually or derivedit from any kind of theory. Wemight say, however, that these list's (and others like them) 'cOnstituté'a range-definitieff'of social welfare. (See Tables 1 and 2.)
The only efforts to reduce these lists of normatively chosem social welfare indica-tors have been empirical. There have been a number of cross-national comparisons in whichfactor analyses were performed on numbers of social indicators and many such indicatorsare reduced to a smaller number of dimension's. A similar cross-state coMpirison was madeby David Smith's study. He reduced the list of state indicators to a small- number ofdimensions. The first he called socioeconomic well-being. Items that-correlate highlywith this dimension are measures of affluence and poverty, infant mortality, diet, housingmeasures, employment, health services, educational services and others. He found a secondcomponent, social pathology, and various indicators of crime, venereal disease and the,like correlated highly with this dimension. Many such studies have found high correlationsamong various types of social welfare indicators, and these lead us.to believe that thereis at least a general affluence-poverty dimension that includes many.hvalth, nutrition,housing, education and other indicators along with poverty and more strictly economicmeasurs.
A NEW EMPIRICAL APPROACH TO THEMEASUREMENT OF SOCIAL WELFARE
A new approach to the problem of measurement of social welfare is needed that is par-ticularly well-suited to developing .L:ountries. Without attempting to discuss it in detailhere, I will give a brief ;Nerview of such an approach. I am going to suggest first thatmeasurement of food supplies be used to stand for social welfare. Measurement of foodsupplies has often been made at the household level through household food consumptionsurveys. In a number of studies that have been conducted, the level of food consumptionhas been shown to be related to other measures of family welfare.
Food supplies have also been measured at the national level through the food balance
sheet. This instrument used all manner of data on agricultural production collected bydepartments of agriculture, data on experts and imports and pulled it together to estimatenational food supplies. These relate to other national measures such as the GNP. Infor-mation compiled in this way has been shown at least in some cases to be close to estimatesmade in carefully conducted household surveys.
The household level of analysis and the national level are used in many studies. 'An
intermediate level of analysis has received relatively less attention even though it is
this intermediate level of the market town, the village, the municipality, county or statethat is very important for national planning and for the evaluation of development pro-
grams and projects. The possibilities of measuring food availability at the intermediatelevel will be emphasized in this review and the links between the family, intermediateand national levels explored.
Agricultural economists have conducted studies of the whole marketing system of anarea or a city including shops, markets, street vendors and all kinds of retail outlets.They have monitored food supplies coming into and going out of an area by stopping trucks
5

Table 1 Criteria of Social Well-being, and Variables Usedin Analysis of 48 United States
Criteria and Variables Direction
I. INCOME, WEALTH AND EOLOYMENT
i. Income and Wealth1. Per capita annual income ($) 19682. Families with annual income less the $3000 (%) 19593. Total bank deposits per capita ($) 1968
ii. Employment Status4. Public assistance recipients (% population) 19645. Union members per 1000 non-agricultural employees
19666. White-collar employees (% of total) 1960
iii. Income Supplements7. Average monthly benefit for retired workers ($) 19688. Average monthly AFDC payments per family ($) 19689. Average monthly aid to the disabled ($) 196810. Average monthly old age assistance ($) 1968II. Avt,rage weekly state unemployment benefit ($) 1968
II. THE ENVIHONMENT
t. Housing12. Median value of owner-occupied houses (S) 196013. Houses dilapidated or lacking cOmplete plumbing
(%) 196014. ,Index of home equipment (max. = 600) 1960
III. HEALTH
i. Physical Health15. Households with poor diets (%) 196516. Infant deaths per 10,000 live births 196717. Tuberculosis deaths per million population 196718. Hospital expenses per patient day ($) 1965
ii. Access to Medical Care19. Hospital beds per 10,000 population 196720. Physicians per 10,000 population 196721. Dentists per 10,000 population 196722. Persons covered by hospital health insurance (%) 1965
iii. Mental Health23. Residents in mental hospitals, etc., per 100,000
population, 196621. Patient days in mental hospitals per 1000 population
196525. Mental hospital expenditures per patient day ($) 1965
IV. EDUCATION
i. Achievement26. illiterates per 1000 population 196027. Draftees failing armed service mental test (%) 1968
ii. Duration28. Median school yearscomPleted(x 10) 196029. Persons attended college per 1000 population aged
25 or over, 1960
iii. Level of Service30. Pupils per teacher 196831. Public school expenditures per pupil ($) 1967
V. SOCIAL DISORGANIZATION
i. Personal Pathologies32. Alcoholics per 10,000 adults, 197033. Narcotics addicts per 10,000 population 197034. Gonorrhea cases per 100,000 population 197035. Syphilis cases per million population 197036. Suicides per million population 1967

4
Table 1-Continued
Criteria and Variables Direction
ii. Family Breakdown37. Divorces 1966 per 1000 marriages 196838. Husband and wife households (% of total) 1966
iii. Crime and Safety39. Crimes of violence per 100,000 population 196940. Crimes against property per 10,000 population 196941. Motor vehicle accident deaths per million pop. 1967
VI. ALIENATION AND PARTICIPATION
i. Democratic Partici ation42. Eligible voters voting (1) 196443. Registered voters per 160 population of voting
age 1968
ii. Criminal Justice44. Jail inmates not convicted (%) 19705. Population per lawyer 1966
iii. Racial Segregation46. Negroes in schools at least 95% negro 196847. City residential segregation index (max. = 100) 1960
NOTE: Direction of.measures--a plus sign means that high values are "good" and loware "bad"; a minus sign means the reverse.
SOURCE: David M. Smith: "The Geography of Social Well-being in the United States"(New York: McGraw Hill Book Co.) , pp. 82-83.
7

Table 2. Proposed Indicators of Overall Pitilippine Well-Being
UMW.
Recommended Indicators
Recommended
Frequency
Health and Nutrition
1. Infant mortality rate
2. Expeetation of life at birth
3. Days disabled due to illness per
capita per year in disability days
equivalent, by membership in the
labor force, and by family status
(Experimental)
3.1. Proportion of persons who are
ill (prevalence), by degree
of disability and by occupa-
tion
3.2. Proportion of persons who be-
came ill during the period
(incidence), by type of di-
sease and by occupation
4. Available supply of calories per
capita per day
4.1. Proportion of children under
4 7 who are underweight, by de-
gree of undernourishment
5. Available suppiy of proteins per
capita per day, by origin (animal
or vegetable)
8
Learning
6. School enrollment ratio, per level
of schooling (primary, secondary,
tertiary)
7. Value of human capital stock cre-
ated by schooling (Experimental)
7.1. Ratio of mean educational
capital in the most educated
quintile to mean educational
capital in the least educated
quintile
Income and Consumption
8. Net Beneficial Product per capita
(Experimental)
9, Proportion and number of families
below the food poverty threshold
(Experimental)
9.1. Proportion and number of fami-
lies below the total poverty
threshold (Experimental)s
annual
quinquennial
annual
semestral
semestral
annual
annual
annual
annual
annual
annual
annual
annual
annual
Recommended Indicators-
Recomiended
Frequency
10. Ratio of mean income of richest
quintile to mean income of poorest
quintile
11. Rate of inflation of consumer
prices
Employment
12. Unemployment rate of the totally
unemployed, by occupation and by
educational attainment
12.1. Underemployment rate, in
totally unemployed equivalent,
by occupation and by educa-
tional attainment
13. Real wage rate index, skilled vs.
unskilled workers, by occupation
Non-Human Productive Resources
14. Reproducible capital stock
15. Arable land
15.1, Concentration ratio of agri-
cultural land ownership
16. Forested land
17. Mineral reserves, by type of mineral
Housing, Utilities, and The Environment
18. Proportion of occupied dwelling
units adequately served with water
18.1. Proportion of the population
served by electricity at home
19. Index of housing adequacy (Experi-
mental)
19.1. Proportion of households with
1.5 persons or less per room
19.2. Proportion of occupied dwel-
ling units made of strong
materials
19,3. Proportion of occupied dwel-
ling units with toilets
20. Air pollution index for Greater
Manila (Experimental)
20.1. Pollution concentration
levels, by type of pollutant,
by station
21. Proportion of river-lengths polluted
by river, by degree of pollution
annual
monthly
quarterly
quarterly
monthly
annual
annual
annual
annual'
annual
biennial
annual
annual
annual
annual
annual
quarterly
quarterly
biennial

Table 2-Continued
Recommended IndicatorsRecommendedFrequency
Public Safety and Justice22. Crime incidence rate, by type of
crime22.1. Index of citizens' percep-
tion of public safety andjustice (Experimental)
23. Backlog of judicial cases23.1. Ratio of judicial cases
disposed to total casesneeding disposition, bycourt of jurisdiction
24. Number admitted to penal insti-tutions24.1. Number confined in penal
institutions
Political Values25. Ratio of votes cast to regis-
tered voters25.1. Ratio of votes cast to
registered voters to po-pulation aged 21 and over
26. Index of political mobility (Ex-perimental)
27. Index of political participation(Experimental)27.1. Index of political aware-
ness (Experimental)27.2. Index of freedom of politi-
cal dissent (Experimental)28. Index of political efficacy (Ex-
perimental)
Social Mobility29. Index of occupational mobility
(gross mobility) (Experimental)29.1 Coefficient of openness of
occupations (circulationmobility) (Experimental)
30. Index of perceived social mobili-ty (Experimental)
monthly
annualannual
-annual
annual
annual
every election
every election
biennial
biennial
biennial
biennial
biennial
quinquennial
quinquennial
.quinquennial
SOURCE: Development Academy of the Philippines:-Measuring the Quality of Life: Philippine Social Indica-tors,- 1975, p. 5-:.

on all ,the'egress and ingress routes. Obviously such a method of assessing food supplies.-',eould be sed for monitoring regional welfare ol all of the states or counties of a coun-try eVe-e time. It would yield information on absolute supplies, on change1 . and trends and:on 'regional problems, imbalances, and special shortages.. Such assessments ought to relate .
well to information gained in household surveys and natienal food balance-Sheets.
.1fithotit discussing theM in detail here, I will propese what I think are the advantages,of focusing on food supplies to measure social welfare.
1. Food is a fundamental need basic to people in all countries.
2. People's nutritional habits do not change as much as many other phenomena thatcould be used to measure welfare over time. Technology rare at' one point in timeis possessed by-everyone at a second point'in time or.has become obsolete. Fooddoes not become obsolete.
3. Similarly, people in one area may have a different material culture than people inanother area, but both peoples will have similar nutritional needs. Differendesin taste may exist. One group may use rice, another wheat. Bizt we know how nitichrice is equivalent to what quantity of wheat nutritionally and can MOT(' readilycompare substitates of food than of housing, technology, education or-Other thingsthat differ more because of availability of resources and cOtural influenceS.That i. food is less cultural specific..
4. Food is inherently distributive. A rich perSon in one of thelarge cities of theworld eats much more proportionally than poor rural people. Bu:teven he can consume only so much and we can study the differences more precisely,than we can withmaterial objects or money. The rich, urbanite can still eat only so.much, but hecan possess billions of dollars. There is no limit On the degree to which mate-rial or monetary wealth can be c ..icentrated,but-there is-a relatively lowHlimiton the amount of food any one person can eat. Therefere, illlowing for well-knownfacts such as that American eat a great deal of grain indirectly in the_form ofbeef, we can assuMe that the more food available, the better most-peeple eat. Thedeviations from the even distribution of food can be readily studied at the:houkehold level.
5. The capacity to buy food measures the economic capacity of the individual betterthan many otiter important welfare indicators. Health facilities-and programs haveto be organized at a governmental level. Hospitals and vaccinationpregrams:arenot good indicators of individual economic'capacity hecauSetheycan-be.availahleto otherwise poor people through government programs. .The samelistrue. of etinea.7tion and many other things.
6. Food is better than any other variable for measuring the welfareofthe Very:poorbedauseit is just about all that many people have or spend money Csii Nonetheless;we often want to monitor change or differences among these-very: poor'long beforethey reach a stage where they can buy household objects or have much cash income.-
7. For similar reasons, it is a best overall indicator for use with rural people. .Itovercomes difficulties of assessing cash income and income'inicind.or of equatinghousehold or farm technology over time.or in non-comparable areas.
8. Food can be studied and-assessed together with the feod utilizing, pi-educing, pro-cessing and distributing institutions at the household level, thervillage or statelevel, and at the national level and the whole process of.gettingat and distribut-ing it can be studied from level to level in such a way as to reveal- national distribution processes and government and social processes as ne other. indicatprmight do. So many other factors enter into health than, health'institutions it .isnot amenable to this treatment. Money can be studied with great difficulty at theintermediate level and the meaning of a certain ameunt of money changes from groupto group, place to piece and time to time in ways difficult to assess.
9. Food is related to Other indicators of social welfare at the household level, theintermediate level, and the national level and thus can stand for a wide range ofmore particularistic measures that can be used in any one group or reg1on or at aparticular time.
10. Food as an indicator of human welfare avoids, as much as anything can, the problemof value judgments, of deciding whether a given technological innovation reallydoes improve life. Anthropologists often quite legitimately raise the question ofwhether a change from the traditional way of life to a modern technology really
1 1.

8
improves health and welfare. By focusing on iMprovement of diet or lack of-it we-are-
proVided with at least one thing that can be evaluated in the'same terms of nutritional
adequacy in both contexts.
The diagram in Figure 1 shows units of analysis at three social system levels of the
household, the village-district, and the national level. It has two columns, one indicat-
ing food-based measures of social welfare, and the other showing a range of measures that
are related to the food indicators. I mn suggesting that food:can stand for a wide range
of the measures of social welfare that are based on services, roles and possessions, and
that it can do so at all three levels. I am also suggesting that there are close rela-
tions between aggregated measures of food at the household level, at the village level,
and the national level. With this larger scheme in mind, we will begin with the household
level of analysis and look at two estbblished methods of research: the household level of
living scale first and then the household food consumption survey. It will be clear that
these two types of measures are related.
LEVEL OF LIVING
In the 1940s rural sociologists in the United States were faced with the same problem
now facing those working in less-developed countries, namely how to measure the affluence
or well-being of rural people much of whose income was not in cash. Rural farm people
presented a particular problem. They earned money by raising cash crops, but they also
raised a good deal of what they ate and this represented a substantial part of their in-
come. In addition they did not keep good accounts of what cash income they did have, so
they were really not sure what their cash income really was.
By 1940, twenty-five years of change had taken place in rural areas of the United
States. An organized attempt to better the lives of rural people had been launched by
President Theodore Roosevelt whoorganized the Rural Country Life Commission in 1912. From
this came the United States Agricultural Extension Service, the Land Grant Colleges, De-
partments of Rural Sociology and Agricultural Economics. There followed a period of
improving agriculture, of trying to build roads, provide electrification to rural are,
improve rural institutions. Schools were centralized, volunteer fire companies orgro.....:v,l,
and there was research on all kinds of rural institutions--churches, clubs, communit.In the wake of these efforts toward rural development, came the need to evaluate them.
There were two questions: First, did life improve for rural people? Second, which rural
people improved; which accepted new farm practices, participated in rural institutions,
became educated, and the like?
These are the same general questions to which the social indicator movement addresses
itself today. In the 1940s researchers realized that cash incane represented only part of
rural farm income. More than this, cash income was only part of what the Rural Country
Life movement aimed at improving. From the beginning it was interested in rural life in
its broader aspects.-
The instrument developed in the '40s by William Sewell and Stuart Chapin and used for
many years for evaluation was the Level of Living Scal . It was based on an assessment o.f
household objects. It sometimes included other aspecl of family life, such as education
and social participation in community organizations. Jaen it did not include these, it
often used information about education, occupation, and income to validate the scales, and
it correlated them with social participation. Thus it assessed more than material posses-
sions. What it measured might be termed style of life. Social class iS probably not a
good label for the reason that some of the groups were not comparable. How do you decide
whether a farmer is higher or lower class than various village occupational groups? They
live and spend their money differently and participate in different social groups. Fur-
thermore, farmers differ widely among themselves in level of living.
A researcher trying to develop a level of living scale first compiles a list of all
kinds of household objects and furnishings commonly used in the area where he is develop-
ing the scale. He tries to include objects owned only by the very rich, but also includes
a range of objects that even the poor own, objects that all but the very poorest own.
Sometimes this list also includes types of house constructions, building materials used,
whether there are floors,numbers of rooms, type of roof, windows, etc. It may include
type of sanitation r-J access to water. It may also include type of lighting, type of
fuel, cooking equipment, transportation (automobile, bicycle, etc.). The aim is to cull
this large pooil, of items and find a smaller number that do the best job of measuring the
level of living. There are two general methods of selecting items. These are described
in det%il in the article by Sharp & Ramsey (1963). One consists of giving every house-
hold a score of one for each item it has and zero for each item it does not have. These
scores are added up, and the group is split into two groups, half assigned to an upper
12

9
Figure 1
Measures Based Other Related Measureson Food of Social Welfare
Family Level Food varietyQuantity
Household objectsHousing qualityHealth ServicesEducationOccupationIncome, etc.Transportation
Intermediate Level(Village, County,etc.)
Food supplies inretail tradesystem (shops,markets, vendors)Food producedFood imported andexported fromarea
Village or Countydifferentiation
National Level National fondbalanc.? shE7t
G.N.P. Infant mortality,Literacy, Housing,Public Health Services.Sanitation, Employment,etc.
13

10
group and half to slower. (These groups are assumed to have known differences of levelof living and are used as a criterion.) Then each item in the item pool is related to thecriterion variable--in this case Sharp & Rameey used chi square--to.see which items do
1the best job of discriminating che two criterion groups. They used thirteen items from anoriginal pool of forty-nine. These are shown in Table 3.
The other method of validing items is to relate each item to an outside criterion,sued as education, Table 4, or occupation, Table 5 (assuming these are not included in theitem pool). Sharp & Ramsey (1963) found that either of the methods produced very similarresults. Scales compiled by these different methods were very highly correlated; the cor-relations ranged from r .71 to .92.
When the pool oi items is reduced to a smaller number that are judged to be bestmeasares, this reduced number of itmas is used to give each family a score based on pos-
session or non-possession.
The advantages of this method are apparent. It is a simple measure with an empirical.basis. It does not depend on knowing how :auch income a family has, nor of finding cashequivalents for income in kind. It does not depend on the researcher's value judgments ofwhat an affluent family ought to buy. Aid above all, it is worked out for each localgroup and therefore is peculiarly appropriate to that group at that time.
Its deficiencies follow from these same characteristics. Because it is calibrated toa particular local group at a particular time, it is not applicable, by definition, 'toanother group, or even to the same group five or ten years hence. Sewell found that hisscale developed in rural Okalahoma was not usable twelve years later for the same people.Items that discriminate the rich from the poor at one period will not.do so later; in tenyears time everyone may have an item only the rich could previously afford. Or an itemmay be made obsolete within a short time when it is replaced by some new invention. Thisis an age of rapid technological change, and this is especially true in rapidly developing
areas, where we most want to do research.
Another problem follows from these same characteristics: itemOthat discriminate wellin one group do not do so in another. Items are difficult to find that discriminate well,for example, in Georgia, Puerto Rico, and the Dominican Republic (Table 6 and 7). Another
example is drawn from a study by Ramsey and Collazo. Tablesli and 9 taken from this studyshow level of living scales developed for Broome County, New York and for Puerto Rico. The
authors set themselves the task of finding a set of items from these that could,form a
single scale nsable in both places. Their solution was to find a set of items that werecorrelated with occupational status in each culture and use them in a single scale, eventhough as Table 10 shows, many items on this reduced list were possessed by over 90 per-
cent of the people in Broome County New York. Even within the same country the same scalewill not do for Georgia and New York State; for urban people and rural people; or even for
rural farm people and rural non-farm people. Theso groups represent distinct styles oflife and people in them spend their money differently. The same item will not have the
same meaning to the different groups.
The problems for which we would like to use level of living measures in developing
areas today are just those for which this type of measure presents problems. For example,
we want to know if a new factory in an area, or A new irrigation system, has improved the
welfare of the people. Using the level of living scale, we would have two different
scales: one for before the change devised in abaseline study, and one for say ten years
after the change. It would yield certain information such as that now everyone has elec-
tricity, before ftw or none did. Now everyone has a can opener; before no one did. We
would be able to see the general pattern of change in household technology. But we would
not be able to get information as to which people improved the most. Nor would we be able
to say how much they have improved. One cannot say life has improved 20 percent becausesomeone has a can opener or an electric light. Nor would cash income provide a much betteranswer, even supposing it were possible to measure it (and it rarely is). How do you com-
pare a person who has changed from farm to factory work? His needs are different, pricesare different, and goods for sale are different. Do these changes constitute an improve-
ment in social welfare?
It would be especially aifficult to compare two regions with this scale. Suppose we
want to know if the people in a region that has a new factory have a higher level of livingthan an adjacent region that has no factory and where the people are still all farmers.
Such a comparison is impossible, because people in the two regions of a similar level ofaffluence will have quite different styles of life and quite different material culture
and household objects. This may be the most common research question in developing coun-
tries and one for which this method is singularly inappropriate.
14

11
, Table 3. Items Included in the Internal Criterion Scale and Chi Squaresof Relationships to Selection CriterionNew York State Level of Living Scale
ItemPercent of
families possessingscorable item Chi square*
Heating system 67.6 117.53Water supply 78.0 137.17Sewage disposal system 60.8 74.35Sweeper 83.2 91.07Lawn mower 44.7 116.38Basement 57.9 56.98Garage 61.2 72.18Condition of lawn 63.8 95.98Living room floor finish 38.8 86.65Condition of living room suite 31.5 96.65Ottoman 58.7 76.09Doorbell 22.8 67.51Number of magazines taken 54.8 58.82
of the chi square values shown are significant at one percent level ofprobability.
SOURCE: See Table 5.
Table 4. Items Included in Education Scale and Chi Squares ofRelationships to Selection CriterionNew York State Level of Living Scale
ItemPercent of
families possessingscorable item Chi square*
Heating system 67.6 11.54Water supply 78.0 21.21Sewage disposal system 60.8 11.78Record player 59.0 27.00.Clothes dryer 11.6 9.80Pressure cooker 51.1 22.91Kitchen range 92.1 9.44Sleeper 83.2 11.78Condition of lawn 63.8 16.70Condition of living room suite 31.5 15.20Bookcase 46.2 11.56Doorbell 22.8 '10.60Number of magazines taken 54.8 9.88
*All of the chi square values shown are significant at one percent level ofprobability.
SOURCE: See Table 5.

12
Table 5. 7.tems Included in Occupation Scale and Chi Squares ofRelationships to Selection CriterionNew York State Level of Living Scale
tern
Percent offamilies possessing
scorable item Chi square*
Heating systemBathroomAdult recreation roomPower lawn mower
67.638.07.2
44.7
29.1620.2227.6115.10
Kitchen of automobile 71.8 14.51Age of automobile 21.0 25.55Basement 57.9 16.53Picture window 20.5 15.17Living room floor finish 33.8 27.22Condition of living room suite 31.5 31.82Living room curtains 6L9 16.70Ottoman 58.7 15.19Drprbell 22.8 16.99
*All of the chi square values shown are significant at one percent level ofprobability.
SOURCE: Emmit F. Sharp and Charles E. Ramsey: "Criteria of Item Selectionin Level of Living Scales," Rural Sociology, Vol. 28, No. 2, June 1963, pp. 150-152.
16

13
Table 6. Preliminary Cross-cultural Scale for Measuring Level of Living
Function 1. Shelter: construction of exterior walls Score
Brick,concrete block masonry, painted frame 5Asbestos or asphalt siding 4Unpainted frame 3Scrap wood, Coca-cola signs 2Grass, leaves, none 1
Function 2. Shelter: construction of living room floor
Finished hardwood, tile, terrazo 5Finished or painted softwood, bare concrete 4Unfinished hardwoods or softwood with tongue and groove 3Wood with cracks 2Earth 1
Function 3. Shelter: construction of roof
Concrete, tile, good shingles 5Corrugated or sheet metal, warped shingles 4Roll roofing, thatch 3Straw, Coca-cola sign 2None, roof with large holes 1
Function 4. Storage of water
Automatic: house piped 5Cistern 4Clay barrel designed solely for water storage 3Large clay jar 2Buckets, tin pails 1
Function 5. Transportation of water to home
Automatic, faucet in home 5Hand pump, faucet in yard 4Bucket with pulley in yard 3Bucket from well or stream in own yard 2Carry over 100 yards 1
Function 6. Lighting
Electric fixture, lamps 5Electric bare bulb 4Carbide or gasoline lantern 3Kerosene lamp 2Candle, open fireplace
Function 7. Preservation of perishable food
E'lectric or gas refrigerator 5Ice box 4'Spring house, cellar 3Window box, clay jar 2None
Function 8. Eating: place settings of flatware
Over two per person--(sets of knife, fork, and spoon) 5One to 1.9 per person 4One utensil or more per person, but less than one
place setting per person 3Partial for entire household--fewer utensils
than people 2None--use hands 1
17

Table 6-Continued
Function 9. Disposal of human wastes Score
Flush toilets 5
Modern pit toilet 4
Privy 3
Trench and stick in fence corner 2
None 1
Function 10. Transportation
Owned or leased automobile; in some situations,a motor boat or airplane 5
Motorcycle or other small motorized vehicle 4
Horse with wagon or buggy 3
Bicycle, horse or mule 2
Foot only, or public facilities 1
Function 11. Cooking food: equipment
Electric or gas range 5
Hot plate, kerosene or oil stove 4
Manufactured wood stove 3
Clay stove, mud table, hibachi 2
Three rocks, bare ground 1
Function 12. Fuel for cooking
Electricity or gas 5
Oil 4
Wood or charcoal 3
Small sticks, scrap wood 2
Weeds, leaves, dung 1
Function 13. Cleaning floors of home
Vacuum cleaner 5
Electric broom or sweeper 4
Pur,:hased dust mop and/or good grade broom 3
Native broom'or mop 2
None 1
Function 14. Washing dishes
Automatic dishwasher 5
Sink with drain 4
Dishpan (no sink) 3
Multipurpose pan: kettle or washpan 2
Wash in stream or at pump 1
SOURCE: John C. Belcher: "A Cross-Cultural Household Level of LivingScale," Rural Sociology, Vol. 37, No. 2, June 1972, pp. 213-217.
18

15
Table 7. Comparison of level-of-living scores for Georgia,Puerto Rico, and the Dominica:, Repnblic
Camden County, GeorgiaRural Rural
Perts Rico Dominican Republic
Sealescore
1965 1966 1067
N percent N percent N percent
70 0 0.0 0 0.0 0 0.065-69 134 30.4 21 3.9 0 0.060-64 191 43.3 80 14.7 0 0.055-59 41 9.3 12C 22.9 0 0.0
50-54 32 7.3 loci 23.7 3 0.245-49 28 6.3 93 17.1 17 1.040-44 12 2.7 53 9.6 60 3.535-39 3 0.7 32 5.9 223 12.930-34 0 0.0 12 2.2 492 28.425-29 0 0.0 0 0.0 666 38.520-24 0 0.0 0 0.0 258 14.915-19 0 0.0 0 0.0 11 0.6
14 0 0.0 0 0.0 0 0.0
Total 441 100.0 545 100.0 1,730 100.0
SOURCE: See Table 6.
19

16
-Table 8. Broome County, New York, Level-of-living_Scale
Item Scorable response*
Correlationwith occupa-tional statust
Washing machine
Water supply
Bath
Separate freezer
Sweeper
Number of automobiles
Magazines taken
Piano
Kinds of clocks
Pressure
Telephone
Basement
Acid of automobiles
Automatic, semiautomatic, orcombination washer-dryer
Inside faucets, both hot andcold water
Inside, both tub and shower
Possession
Electric
Two or more
Four or more
Possessiot
Electric
Possession
Possession
Concrete floor
Two years old or newer
.36
.35
.33
.31
.31
.31
.31
.29
.29
.28
.28
.27
.25
*Response for which a point is given.
tPhi coefficient.
SOURCE: 8, 9, and 10: Charles E. Ramsey and Jenaro Collazo,
"Some Problems of Cross-Cultural Measurement," Rural Sociology,
Vol. 25, March 1960 (91-106), p. 98.
20

17
Table 9. Puerto-Rican- Level-of-living. Scale-
Item Scorable res,donse*Correlationwith incomet
Bed
Newspapers and magazines
Table knivesLinoleumRadioSofaDining room tableLiving room tableBowls (china or glass)Rocking chairsArm chairsBooksBathSaucersPlatterFrying panCook stoveWater storageCan openerElectric lightsDrinking glassesAuto or truckChina dishesChina closetOrange squeezerRefrigeratorForksHome exteriorWall or ceiling lampTrayPepperKitchen knivesWardrobe (clothes closet)ClockEgg beaterSewing machineCoffee cupsDresserGraterToilet
One or more with spring andmattress
Subscribe to one or more ofeither
One or morePossessionPossession, any typePossessionPossession, any typePossession, any typeOne or moreOne or.moreOne or moreOne or moreShower or porcelain tubFive or morePossessionPossessionElectric, gas, or keroseneWater pipe or filter jarPossessionPossessionFive or morePossession of eitherFive or morePossessionPossession, (Loy typeElectric or gasOne or moreCompletely paintedPossessionPossessionPossessionTwo or morePossessionPossession, any typePossessionPossessionFive or morePossessionPossessionIndoor toilet
.61
.60,
.60
.58
.58
.57
.55
.54
.54
.53
.53
.52
.52
.52
.51
.51
.50
.49
.48
.48
.48
.47
.46
.45
.45
.45
.45
.44
.44
.43
.43
.43
.42
.42
.41
.41
.40
.37
.37
.36
*Response for which a point is given.tPhi coefficient.
SOURCE: See Table 8, pp. 96, 97.

18
Table 10. Items with Equal Cutting.Points which are PositivelyCorrelated with Occupational Status with: Culture Controlled
ItemResponse scorable
as high
% of PuertoRicans pos-sessingitem
% ofBroome
Co. respond-ents pos-
sessing item
Sewing machine Electric: 1 46Refrigerator Electric or gas 11 97
Exterior of Other than unpainted orhouse partially painted frame 17 93
Kitchen stove Electric or gas 3 93
Washing machine Electrically powered 2 94
Iron Electrically heated 31 98
Bathroom Bath tub and shower 5 39
Automobile Ownership of at least oneother than truck. 5 91
Pressure cooker Possession 2 52
Toilet Inside house 6 84
SOURCE: See Table 8.
2 2

19
One additional problem that we face in using level of living scales baSed largely oniteMs of Material culture, mainly changes in technelogy;. is whether-such 'changes really-'-do constitute an improvement in people's lives. This is what'We want to know. But itmay be that the diet of farm people was better before they went to work in the factory,their health was better when they were outdoors and 'did not wear city clothes, emoke, orwere subjected to diseases of civilization. Spending money on fancy Clothes rather thanmore fundamental things may constitute a loss.
Nonetheless for many purposes the level of living scale gives us a tool for graspingthe level of affluence of a local group and discovering in its own terms the array ofsocial, educational, cultural, economic and other correlates of various levels of afflu-ence or poverty. It is widely accepted fqr this purpose and it has face validity. In
another unit, I shall show how it is related to measurements based on household food--consumption.
HEALTH MEASURES- -----
Health measures are widely used in national level studies. In national social indi-cators studies you will see measures such as infant mortality, early childhood mortality,incidence of disease and the like. These are important and certainly significant aspectsof human well-being. But if the desire is to study social welfare at a household or vil-lage level, a single measure that is applicable to all people or all villages is needed.Infant mortality at most says something about a certain group of Women of child-bearingage. Absence of a particular disease, such as tuberculosis, is certainly significant,but does not necessarily indicate health. Nor does freedom from-any other disease, even..if such facts could be known. Obviously there are many costs in time and-technology aswell as in money to make any such assessment. -But absence from disease does not indicatedegree of health. Indeed there is no good measure of adequacy of health. . Likewise un-less an individual has a distinct nutritional deficiency disease such a pellagra orkwashiokor, it is very difficult to say that one individual is better nourished than an-other or to what degree. With children measures of.height and weight are sometimes usedas measures of nutritional status, but there is a great doubt about what good height andweight for a given group really are.
Health institutions--hospitals, physicians, nursing care, insurance programs, vac-cination programs, sanitation, drinking water--would all be a part of the assessment ofvillage or district differentiation, and they are importantly related to social welfare.But they do not necessarily indicate family health /or there are many discrepancies inuse; also many other factors influence family health. Such institutions do not neces-sarily indicate a family's or village's own economic capacity, since public healthsystems often must be organized at a higher level of government, state,-region, or nation,and such regional or countrywide systems may not discriminate Poor from 'rich villages ordistricts. For such reasons use of health measures as primary indicators of family orvillage welfare present many problems that no one has solved. While one Would certainlylike to use any available information about health along with other measures,.it is notas good as food-for a core measure.
Ideally one might want to use some kind of subjective measure of personal satisfac-tion or mental health. Again, this area of measurement is not adequately developed forthe present purpose. Theory is difficult, measures complex and much argued, and at roothappiness is perhaps a philosophical question. There may be many legitimate researchneeds to know what people think, but measurement of their general level' of weffare is notone of them.
I believe that food consumption meets many of the objections I have voiced in rela-tion to physical and mental health measures. Therefore we will turn to this generalquestion of nutrition that is closely related to health.
THE HOUSEHOLD FOOD SURVEY
The household food consumption survey is widely used in research in all_ parts of theworld. Ideally nutritionists would like to assess precisely what nutrients each familyeat and in what quantities and they would like-this information over a long period oftime to allow for random and seasonal variation. They would like measurements made bynutritionists in each household of food stored, bought, used, and thrown away. Theywould also like anthropomorphic measurements of heights and weights and a clinical ar..1laboratory assessment of health and nutritional status. This can be done anywhere thatsomeone can assemble the requisite technical aide-the money and the time.
23
20
Table 11. Sample Household Food Consumption Schedule
What foods did your family eat yesterday? (Day of Week
Meals Menu Items Food Items, Amounts, P,H,F Comments
Kinds if known
Breakfast:
Lunch:
Supper:
At OtherTimes:
Notes: P - PurchasedH - Home grown or gatheredF - Free gifts or supplements
No. guests present
No. family members absent
Breakfast Lunch Supper
2 4

Food
Table ll-ContinuedHol Often clOes your family eat the following foodi?
No. of Meals perDay Week Month RemarkS .
Cereals and Cereal ProductsCornRiceWheatBarleyOataQuinoaBreadOther
Milk ProductsMilk, fluidMilk, powderedMilk, evaporatedCheeseOther
Eggs
MeatsFishBeefPorkMuttonLiverPoultryGuinea pigIntestinesOther
Fats and,OilsButterVegetable oilAnimal fatsOther
LegumesChochoDried beansDried peasLentejaPeanutsOthr:AN-A
Tomatoes
Vegetables, Vitamin A-rich(Leafy, green, and yellow)
SpinachCarrotsParsleyLettuceYellow squashOther
Other Leafy, Green, andYellow Vegetables
Sweet potatoesGreen beansGreen peasCabbageOnion tops
,TUrnip topsOther
25

22
Table 11-ContinuedNo. of Meals per
Food Day Week Month Remarks
Other Vegetable's,Vitamin A-poor
Onions1BeetsTurnipsRadishOther
Starchy VegetablesWhite potatoesYucoOcaOther
Citrus FruitsOrangesNaranjillaLemonsLimesPineappleGrapefruit
Starchy FruitsBananaPlantain
_
26

23
Table 12. Guttman Scale Derived from Food Reportsin Rural Mexice -
StepNum-ber
1
2
3
4
5
6
ItemPercent
Of. Sample
Tortilla (corn flat bread; staplecereal)
Frijol (black beans, eaten-cooked andmashed)
Meat; fish, chicken or 6,is (nondairyanimal food) _
Wheat- bread (prepared product, secon-dary cereal)
Dairy food (milk, cheese, or coffeewith milk)
Platano (plantain)
95
77
61
37
20
Number of families = 377.Coefficient of scalability = 0.77.SOURCE: See Table 16.
Table 13. Rank Correlations Between Food. Scale.and Indicators of Dietary.Complexity*
in.Rural Mexico
Indicator
Noon vartetyBreakfast varietyEvening varietyFruit frequencyMeat, fish, chicken, eggs, frequencyVegetable frequency
Correlationwith Food
Scale(Kendall's
tau)
0.480.15.-0.090.510.470.02
* Dietary complexity.as indicated by meal variety .
and food-group frequencies.SOURCE: See Table 16.
Table 14. Families' Reports of Frequency of Verduraillat Different Scale Levels r
in Rural Mexico
Frequency of Verduras
% of Families RepSca1e,Leve.
Low-18s-2-
Medium
1-34-B
Number of families
7226288
61372
151
46504
138
* Leafy vegetables, tomatoes, carrots.SOURCE: See Table 16.
27

24
Table 15. Families' Reports of Frequency of Condiments*at Different Scale Levels --
in Rural Mexico
Frequency of Condiments
01 or 23 or 45 or more
Number_of families
% of Families Reporting-a:at Scale Level
Low:-1.8c 2
16-5223
Medium.3 gr'41
2047-24
a,
High5 & 6
363625
138.,
* Ouions, garlic, tomato paste, peppers.SOURCE: See Table 16,
Table 16. .-Rank Correlations Between FoOd'Sealeand Some Indicators of:Edetary ComPlexity.
.in Bural'Mexico
Kendall'stau-
Fruit frequencyMeat, fish, chicken, eggs,-frequencyVegetable (ever-all), frequencyVerduras* frequencyCondiments**frequency
0.510.47O. 020.25
-0.01
* Leafy vegetables, tomatoes, carrots.** Onion, garlic, tomato paste,A,eppers.
SOURCE: Judith Price Chassy, A.G. Van Veen and F.W. Young:"The Appcation of Social Science Research Methods to the Study of FoodHabits and Food Consumption in an Industrializing Area," American Journalof Clinical Nutrition 20, no.1, January 1967, p. 56-61.
28

25
Table 17. Ghanian Too& Scale
Scale Step Item Content Percent of Sample
1 TomatoOnionPepper
Fish*
Palm oil, palm nuts, 86cooking oil
4 Rice, yam 59
5 Bread :35
-6 Beverages** 24
7Milk "23'
100
99
8 Eggs
9 Banana
Total cases
6
Coefficient of scalability .65.* Probably only a flavoring in the soup or stew.** Coffee, tea, vitacup, milo, ovaltine, and complan.
SOURCE: Frances A. Larkin: "Household Structure and Children'sHealth in Ghana," Unpublished Ph.D. thesis, Cornell University,. 1968, p.41.
Table 18. Philippine Food Consumption Scale
ScaleStep No. Item Content
Number inScale Step Per Cent
-"
Discrithinated
0 Rice 23 11.3 100.0
1 Vegetables 46 22.5 886
2 Dried, salted,or smoked fish
20 V.8 66.1
3 Coffee 48 25.5 56.3
4 Frying oil 40 l.P.6 32.8...., ....._
5 Eggs or milk 27 13.2 13.2
Coefficient of Scalability = 0.63.
SOURCE: Amparo G. Rigor: "Family and Barrio Differentiation in NuevaEcija, Philippines,".Unpublished Ph.D. thesis, Cornell University, 1971, p. 61.
2 9

26
Table 19. Factor Loadings of Rural Mexican DifferentiationMeasures on First Two Rotated Factors
Variable
Father's occupational a.:Iiration for sons
Father's educational aspation for sons
Typology of house constru.!::ion
Guttman scale of level of liing-
Index_Of level of. living
Social participation index
.Food,consumption scale-
Education of male head
Traditional-modern medical-care pattern
Evening family-activity typology
Number of new household items in last tio
Fiesta-attendance scale
Occupational prestige typology
SOURCE: Frank-W.'Young and Ruth C. Young: "The Differentiation
of Family Structure in Rural Mexico", Journal of Marriage and the
Family, February 1968, P. 158.
30

27
However, there is widespread use of a household food consumption survey that yields-much less information than this and is considered useful. The full nutritional.assess-ent not practical in most cases and indeed for purposes of much research not neces-:sary. The household food consumption survey in common use asks the householder aboutmauls, menus, purchasing habits, food raised, who eats what elsewhere. .It gets thehouseholder to tell what she cooked, what the family ate, and contains information aboutestimated quantities using weights or volumes in terms commonly used'in the area. Res-pondents are asked how many times a week they eat various foods. Table 11, is an exampleof such a survey schedule. Such food surveys can be used in conjunction.with. preciseclinical and laboratory assessment in order to validate the method or find the best se-lected items to Andicate the quality and quantity of the diet. For instance in such astudy, the researcher might find that the number of times a week the family eats meat, orthe variety of foods eaten will classify the family in comparison with other tamilies:--sufficiently Nell and in the same ranking as a complete assessment. -The value of doinga complete nutritional study would be the help it would give in finding the best itemsthat one coula gen_information on easily--(by simPly asking the householder)--that couldstand for more elaborate data, and that would classify him in the same way that moreelaborate data would do.
Such attempts have been made by researchers doing what is termed social nutritiohresearch. These researchers are interested in classifying the dietary status of familiesso that they can do research on the social and economic characteristics of-the familyassociated with better or worse diet. In order to do a good job on the social context offamily diet, the clinical assessment is very expensive. Such researchers.have found thatthe variety of foods eaten correlates well with quantity and stands in quite-well forquality. Frequency of eating certain key or expensive foods, such as meat, eggs, milk,fish, can be used similarly. The study by Chassy, et al (1967)-Of Mexican householdsreported how a scale measuring food variety is devised and how it relatesto frequencyof eating certain key foods. It also cites other studies where frequency of'eating relatedwell to quantity eaten and to blOod analysis indicating nutritiOnal statusTable 12shews the food scale that is based on a one-day recall of all foods served'the day beforeby the hcmemaker. Tables 13 through 16 show the relations of the scale tO other aspecta-of food consumption.
.
In terms of patterns of eating among rural people the wOrld ovek this'is a reason-able approach. Most poor rural people the world-over. live:en_a basiC starchy-staple andadd small quantities of other food to this as they are'able to do:so. What iS addedand how much tend to expand together and in a somewhat.orderly way, based 'on availabilityand local custom. Starting with those produced.at 'home and moving.up to:imported items,food habits and food resources are developed over long periods of_time.-:.That they can befound to exist in an orderly and predictable way conforms well tocommiovaense.:"
Many other researchers have produced similar results.. Larkin (1970) did such a .
study of food and health practices in Ghana that alSo included a Ciinical*Mi laboratoryexamination of the children of the households surveyed (Table 17)andRigntAld%u:Slmilar,.study in the Philippines (1971) (Table 18). This method:of getting:asuffidient amount: .
of dietary data to use in investigating its social.and health context haS,--been used_since'in a variety of countries.
Some other research is emerging that suggests that dietary information from food,consumption surveys can be reduced to a small number otcomponents..:Guthrie,et.al(1973) conducted.a,study of pre-school children using'diet and many.other nutrltional:measures. All of the dietary information in the factor analysisperfOrmed fell into onlytwo of the ten components: one factor had high loadings on iroa,, vitamin An A, thiamin'i:riboflavin', niacin and ascorbic acid; anOther had high loadings objtilocalories, protein;fat, carbohydrate, calcium, vitamin A and Riboflavin. ,This parallel!s.Chassy's finding,that vegetables and some other foods did not fit into;a scale in the'Mexican study.; If'
studies are repeated in other areas, the hope is that most items of consumption will fitinto a small number-of scales or Measures:-
This brings us to the second question. Can food stand as a general measure offamily welfare? Do household patterns of food consumption relate to other measures ofsocial welfare--to education, level of,living, income, housing, medical,carp, and thelike? A number of studies have explored just this question. In the.first Of a series, .
F. Young & R. Young (19681 explored the'relation of a Mexican food consumption scale toother such measures by means of a factor analysis and found that many of these correlatedhighly with a single factor (see Table 19). In the Larkin study in Ghana and in theRigor study in the Philippines another pattern of relations between the food scale andother measures of household complexity seemed to emerge. In both cases the food scaleand the other measures seemed to form a quasi-simplex. This is a measure devised byGuttman and what it means is that the various measures all- do measure the same concept,but that each of them does a better job of measuring a different part of the-population.The measures in a simplex when put in order have decreasing correlations going from
31

28
either side of the diagonal. The reason for this is that each measure is related strongly'
to'the measure-on either side of it and:that the relations between theSevadjacent meas-11.1m3, when controlled out leave no relation between a measure and those measurea',that-,are
-more distant:- In these cases, the food scale,on one_side ol eaCh Correlation Matrix-appears:to do:a better job of measuring the poor people in the samPle,and ether meastires:Of:housing,.household possessions, health and sanitation abetter jobef MeaShring the
More affluent. Similar studieeneedto be narried out on,other:places;testihg'whetherHsuch relations Continue to hold. If so, this would point to food as a,best:measure of
-,theA.evel'of living of'the poor. (See Tables 20-and 2.1.) *
-
Many of the other characteristics of family welfare to which the food patterns re-
late are peculiar to a particular area, such as types of housing. Others depend heavily- .
on government organization or input, such as health services or schools, or electrijica..;
tion. Others such as level of living scales based on household objects serve,the purpose_well now, but will be out of date in a few years when technology will ,have changed. But ,
in a few years even if people are using wheat instead of corn, using packaged.and Pro-cessed food instead of, fresh, and buying instead of growing, it will still'be possible,-
to coMpare the adequacy of their diet then in'terms of quantity and variety-and suffi--,ciency-of'nutrients with the diet they now have. Therefore,'I. am suggestine:that the
research procedure to follow would be to study dietary patterns-along. with'a,yariety of
other measures of social welfare--health indicators; household and larni4techhology,
sanitation, transportation, education, housing and the'like and relate diet'to these.Then in comparing one village with others that live in a different Culture or-fypeofeconomic structure, other measures might not have the same meaning, or,offerpossibilitiesfor comparability, but food might serve as an anchor variable that:would.serve this purl-
pose. For example, how do you compare urban-apartment dwelling to'-villigehousing?,
Similarly if one should use such data to compare the welfare of people,of'a, village Mow
and ten years after,their dietary sufficiency might be the most comParOle-and stable
element.
One further problem remains. _Suppose one Were to gather informationAlremeach fami-=--
ly in a village and then compare this aggregated information on family uiwaie.tb mo,us-
ures based on an assessment of village or district institutions', suCh,as the market, the...-
structure of retail trade, the diversity and complexity of village.A.nstitutioia.: Mould:
they correspond? A later section will discuss this question.of-villagebrfdistrict-levelassessment more fully, but I will mention that several researchers have.related Suchvillage level assessment with 'the level of family welfare. In several studies im several .-
different countries, they have found that villages rated as more differentiated (with a
greater number and variety of institutions, stores, etc.) tend tobave residents-with
a higher level Of family living.3
- At first this sounds like one of these'exercises that sociologists deto prove in
some elaborate manner what everyone else in the world knows in a common Senseway ail
along. But if we reflect more closely it is apparent that this piece of information
gives us a lead to a more efficient and economical and less time-consuming.way to meas-.'
ure individual househola progress. If we know theprecise relation betweenthe house-
hold food consumption patterns and the quantity and variety of food found in the village
'retail market system, the possibility.is opened of assessing welfare Progress more effi-
ciently.
So far we have suggested that if methodological research is conducted to find out
the best measures, we might be able to assess a great deal about the lever of. family
welfare by using patterns of food consumption. Secondly, we could conipare families from
place to place and time to time on the basis of food. Third, if-We find the precise re-
lation between aggregated family food consumption patterns and village retailing patterns,
the latter could serve for assessment of regional progress in place of tLac,more expensive
and time-consuming household surveys.
NATIONAL SOCIAL INDICATORS
Before going into village-district level measures, a discussion of the national level
is in order. One approach is the food balance sheet. The food balance sheet is a method
of arriving at the net food supply available for human consumption throughout a whole
country. This is a method fs,.- bringing together all the information oa,the supply and
use of various individual foodstuffs available to a country at a given period of timefrom all sources whether produced locally or imported. It considers production, seed
use, animal food, waste on the farm and in distribution, industrial nonfodd use, proces-sing or extraction losses exports and the net food supply. Information fer this halanyv
sheet is obtained from a variety of sources; in the case or Mauritius (Simmons andPoleman 1974) it was obtained from the Extension Division, the Fisheries Division, The
32

29
Table 20. Correlation Matrix of Measures of HOusehold ComplexitYln Ghana.
(Gamma)
1 2 3 4
Food Scale 1 .22 .16 .16
Sanitation 2 .22 .48 .29
House typology 3 .16 .48 .45
Householdpossessions
4 .16 .29 .45
SOURCE: Frances Larkin: "Household. Structure and Children'sHealth in Ghana," Unpublished Ph.D. thesis, Cornell University, 1968, p. 61.
Table 21. Intercorrelations in Simplex Order Among Five MeasuresOf Family Differentiation in Nueva Ecija, Philippines (N = 204)
1 2 3 4
Food Consumption 1 .287 .269 .244 .062
Household 2 .287 .548 .380 .312Possessions
House Typology 3 .269 .548, .394 .277
Health Practices 4 .244 .380 .394 .251
SOURCE: Amparo G. Rigor: "Family and Barrio Differentiationin Nueva Ecija, Philippines," Unpublished Ph.D. thesis, Cornell University,1971, p. 115.
33

30
Department of agriculture, The Marketing Board, the Census of Industrial Production andfrom the Department of Customs and Exise for information about imports and exports.
-If you look at Table 22 you will see that it takes production and imports and sub-tracts from these totals all kinds of non-food uses and waste to arrive at net supplies.The'authors tell in detail how information was obtained from a variety-of sources for the,
different. foods: cereals, starchy roots, pulses and nuts, vegetables., sugar and syrups,fruit, meat, eggs, fish, fats and oils. On the right hanctside of Table.22 you will seethat all of this information is converted into nutritional terms giving, for'example,
calories; and.proteins per capita per day. Another siMilar study was conducted An Ceylon by:Jogaratnom and Poleman (1969).
In the Mauritius research, a sample survey of 894 rural and urban hOusehOlds was elseconducted. to get the family food purchases. These were obtained daily tOr'twO one week-periods,during the year. From these 894 household food purchasing budgets the.research-.ers also made an estimate of national food supplies. In Table 23 it is:evident that theestimates made in these two different ways match quite well. Upper inComeleyelswersexcluded from the household food budget survey, and if they had been included the'figures'
Would probably be even.closer.
.Both methods had the same goal, to measure national food supplies.. .They, utilized
very different types of data--the one from information procured from'aSaMple of house-holds on their food purchases; the other procured information from goiernmenthureius onagricultural production, Deports and exports of food and various SourCes Ofloss duringthe course of food production and processing. They arrive at similar Ponclusionalromthese very different Methods. In other countries, one might want ,to check:.to'see if . theinformation that was Obtained from the records in government bureauswasacCurate.. If so, .
.such recordsprovide a much simpler, less expensive and,less time Consuting method of:finding out'about food supplies than taking two sets of week long recordspn nearly a
thousand households. However, if government records are not lcept that;aresufficient for
this purpose (and this is often the case) a sample survey of households, Aane'carefully,,
can give us the same type of information about food supplies quite accurately..
National food supplies can be measured in either of twowayt quite satisfactorily.The question then arises as to how food supplies compare with other measures of national
welfare. Many studies have been conducted that make such comparisons. I have included
one of these for illustration. In the study by Harbison and his colleagues. (1970), is a
list of welfare measures they used in their study, such as per capita gross national pro-
duct, per capita energy consumption, newspapers, telephones, literacy, several health
measures and food measures, educational measures and many others. They correlated such
measures for 112 countries Table 24. If you look at the four food variables, namely gramsof protein, per cent animal protein, calories and per cent starch, you will see that these
measures are highly related to the other measures of national welfare. Therefore, one
might say that if one wished to measure national welfare and only had quite accurate mea-
sures of food supplies, such measures would give one's. very good idea of the level of'
welfare as a whole.
Table 25 shows the correlations among this same set of variables but, this time ror
the 31 sub-Saharan African countries only. Comparison with Table 24 show that many ofthese correlations are greatly reduced in Table 25. The same general fact is true if we
look at correlations only among developed countries, Latin America countries.or any other
area group. Within any one area (the developed countries are the United States and Europefor the most part), correlations are from moderate to low among the many-measures of na-
tional development. It may be that the same problems exist in national measurement as in
the household measurement of social indicators, and that one reason that.correlations
among them are not higher is tnat some national measures do a bettei- job bf measuring thedifferences of level of development in poor nations and some in more affluent. Again if we
must choose among these an argument can be made for food-measures ascompared with measuresof urbanization, GDP, health services, educational attainment and media distribution inthat all of these latter have problems that food measures may be free of . Most of thelatter measures apply mainly to urban people and more affluent. Food reaches the rural
poor.
These studies show us then, that national food supplies can be measured at the house-
hold level and the national level, and that informati(,1 obtained at these two levels
matches quite well. They show us that national food supply estimates could stand quite
well as measures of national social welfare. If you look back at Figure 1 you will seethat we have discussed food measures and other social welfare measures at the household
level and at the national level. At both levels food is related to other social welfare
measures. And household food supply information is related to estimates of food supply
obtained at a national level from figures on production, imports and exports, national
3 4

. : .
Oink
Combweeleserient
MIR sakes. WhomGems & win*ahntestiU.-Mid U Ilemer. wt.&CANN pereporaisme. taxa
11101.
bads/ NosPession. kikSeteel moonSkaker.Mos & Rakes a
preron. wow.ellf
Use.
ImesSaw. rserSups. tefibtedCalk cooketworry
Toed
31
Table 22. Mauritius: Food Balance Sheet 1960-1964
(Population: 681,619 on June 30, 1962)
Palm and mosPekes. dried&modems (ies sheikIda* mem ILCS.
Cagooftes. tPtGamow keestatwe
. Tool
VtattalksTheesasele.
Grins St kat,nekt frith & hamsPrink timed
Told .
Ptak;
APPles" Odert. heA
PorwtoriL leirymerilJames elan bun)
Turd
AgneslidIvaGees114wese. hob
-4011.0
171.0
mirk Ism pet trier
9011111 VOA 3.9171
2111.6 11332
74.4 as 73.11
Ike. - 1711.0
3.4491 -. - 0.4190
9401.4 3.1 .. 0133 . --13,11t2 2.3601 NM 13.320.11
- SEL2 LS MIA
4I1.1530 21.4
11.9
217111 234.0 u213.4 1.4
20.2 ILI211.2
1,0132 1.340.11 ...
406.1 72.4 -260.1 .... -.73.7. 423.2 ..
SIM
=ID
41110
/MI
L034.0. 470
MI3014
3 5
MID
5.3113 11.70 24.1 . $1.9 3.3
el 1.017 LS 10.9 as74 - &fa t ."' '0.3 OS
: Ulf 11.417 373 "LS 3.1 1
4.105 7.1% .117 3.7
11362 : 11391 94.4 as al . 'a14.1112 2.357 ' MIS 12.4 3.11,
27.0717 111.0 231 1.7
444 &Al, 2.020 3:1144 10.3 IA" al Ii ^4.
212 '.. 1.311 0.9 14213 SAW II 1.3
210 9311 - 0.9 -Oil SW ILI 114 al
IAN473
SAM la? 24.1
&WS 1.9 73 as 117
1.311 IA LI al ,11trio to 4.11 112 SA
.-

32
Table 22 (continued)
Was=!imamthbre iwwl 6114.11664 %Awl. lawArdrowed p6rparii
roma
Ow11610 how'
prj
Oink tan LillIth$%Art vamillid.466566a. umillkrasnoused13implo
'NW
11111L msl& p1666Ihrols. whisk% um.:
.8.666..n1. summon!11nrdi4z Lauf.,
.166.r tsli Leath;Ileamh
'roma
Los and nth3.6.tioseueurld 491Cromr.65A4h1 hws .nrsh,MastiatnrVag mow 1.1Wr4114Mill
1'651
XS1143....:--
1.2211.0
1352
2051
11M2
KOWA
NO.
-131.6100395.0
SSA
20.11
101.1
1.333.1IIIA
0.1011.2
159.2
13.6713.0
53711.7
160.3303
1.01(01370.403.4
1.01021.31(6
WM33651
- NS- soisi.1
0.6 179.16
02 91.6OA MIii1
0.1 1267.3
02 1.60340.6 13343III 19030.4 LIMA- 301.4
"" 16.0131211 Tz..s20l 1332602 160.1
3033
LI 1.150.16
03 UMA11.2 US2751 1.11112
20.11 1.1016764
MA 3272
MOM
mom.
mom
/NM
MOW
omo.
IMD
OIND
311
103
as
0.0670.300224
0.436
112 22L I LS 11.1
. 0.7 OS 0.1
04 2.0 021.2 IA 0.3
IMD
4.773
120
LEO1.333
1.103
301
7.=
1.11:0
23414
1.939
0.203I.611
0.442
19.2
U
0.33.4924.4
1.2
73
209.6629.7KS
U.
1.3...
SS
MM.
2343
01.016722
1.932101
302
26.431I3392134abs0.430
1123
-
72.4237.11
0.61.2
32.3
43.4
9.736.6IA4.6
sa
2.40.2220.1112
NOD
MOM
21.136
4.460
1.134
1.041
711
31.009
6343I A61
1.7140.111O. 60
114.9
17.11
4A
430.313
961
158240.7
37334.02.6
. 313
3.1
MOD.
MO,
1200 33.1
AkelmAir bewerain
WiserOder16644
Tami
T01
1.120.77133.1123904
1.565.7353
23119332.611331.1.0
16972.4131.132.2
Zoos
7E9302 3335.320.0216.0051 3.300.312.6
43372.4MUSA 1.0C2312.6
MEM
111M.
335.3263.300319
45372IASI=
3.1577.7760.0672.401
142 -213026.6
4.023.40.1
14.7
K1320.100 15.434
5.30L0 192
°All rice exports and reexports are deducted as "Rice trader.tlsopons of sweet potatoes are included as imported vegetables.pane offal: are sold from local slaughterhouses, but the quantity is not available
173LI
423903
SOURCE: Emmy Bartz Simmons and Thomas T. Poleman- "The'Food.Balance Sheet as
a Parameter of Tropical Food Economies: The'Case of Mauritius", Ithaca, Naw York,
State College of Agriculture and Life Sciences, Cornell International Agriculture
-Bulletin 29, June 1974, pp. 9-12,
36

33
Table 23. Mauritius: Comparison of Food Balance Sheet andFamily Budget Inquiry Availabilities, by Major Food Groups*
Food groupFood Balance Sheet Family Budget Inquiry
Grams Caloriesa
Protein(gr.)
1
1 ProteinGrams Calories (gr.)
Cereals 371,5 1,334.9 29.0 428.2 1,453.1 32.5
Starchy roots 34.2 27.8 0.5 28.5 20.0 0.5
Sugar, syrups 105.0 396.2 0.3 68.9 261.2 0.2
Pulses 31.3 99.5 5.9 34.7 119.5 7.8
Vegetables 111.8 23.8 1.7 83.3 16.4 1.4
Fruits 19.2 11.4 0.1 15.2 6.1 0.1
Meatst 19.2 44.8 2.8 12.5 22.7 2.0
Eggs 5.1 7.3 0.6 2.4 3.4 0.3
Fish 18.3 32.3 3.2 24.2 25.7 3.5
Milk, milk products 84.9 96.1 5.1 123.7 108.5 5.9
Fats and oils 33.1 282.5 33.2 287.8
Alcoholic beverages 42.2 ... 43.3
Miscellaneous .t 62.3 50.4 ...§
Total 2,398.8 49.2 2,418.1 54.2
** Calculated froth data in Tables 22.
t Poultry figures not included in the budget inquiry data.
t Figures for miscellaneous items not available through the balance sheet approach.
§ Not available.
SOURCE: See Table 22, page 29.
37

Table 25. SIMPLE CORRELATION COEFFICIENTS FOR SUB-SAHARAN AFRICAN COUNTRIES(for the 26 variables analyzed in the regression equations)
1% significance level with n = 31 is 0.456
. ,NI PM= arms 594414 44.120. NM. Calarin SetN9 19643 tudni 4441 1 Sul 3 U9 1440k4a. 456444. Isamu 0440e;.105mot. loam Taut** CUM 999 140170 MINI!N CM 0.91 0.1136 0.114 0.Ios 0.5c1 4.414 0.510 0.104 0.141 0.4sa 0.44* 4.13111 0.113 0.7N 0.443 0.411 0,323 0.670 -0.30 0.311 0.601 0.310 0.4111 0706. 4.95
0.912 0.024 0.470 0.441 0.343 0.010 4.133 0.01 0.576 0.141 0.406 0.14). -0.1911
0.110S 0.305 0.471 0.93 0.713 4.170 0.4111 0.644 0.371 0.431 0.714 .0.1110
0.644 0.90 0.431 0.300 4.174 0.575 0.s13 0.270 0.713 CUT 4.1044.066 0.461 0.160 4.0111 CIN 0.464 0.794 0,6411; 0,0g 440k
0.030 0.406 4.3N 0.047 0.09 4.09 0.41 0.a72 0.117
-0,111 4.69 0.140 0.454 0.200 0.445 0,451
4.017 0.243 0.341 0.331 0.447 0.471 4.04s0.M -0.240 0.021 -0,334 -5.445 -5.074
0.M 0.176 0.707 0.512 -0.112
0.5U 0.011 0.720 4.3140.M2 0.466 4.1511
0.79 4.1114.203
aim 4.111. csi4 cos.. o.ns.-0.1123
(,.na, 0.464. .054CIL/.0.031
C755, 0.94 0.030
.0.121 1.011 .0.444, 0.49' n.m
01,134/
0:49 CNC;S 413 0.113.
0.49 4.100 0.711, 4.5n 0.s7s 4,071 CM. C4T':0.421. 0.40- 0.450: 0.634 0.147
,.5.504,
0.354 :
4.44k .4,414 O.7t 0.4^4.140 6:411 .0.I4 0.100.
.4*0.03S.
aMt ia0444
0.1 4.336 : .0.363 0.413.1 C503. .
4.400. 4,054 0.514', -0.317 '. 0.356 0.711 . 0.13C ,S.TU-4.c44 0.154.: 4.133 CNC' -0.304 4.3410.404,
- 0.401
4.341. 0.59 0.541 0.533
-0.19 0.119 0.554 0.790.445
0.515
,..0.004 O.02 0.514 0.1100/
0.332
0.23L
0.44
4.341; 0.071 0.466 0.442.
4.113 0.700 0.431. 0.702
-0.343; 0. us 0,531 0.447
0.350.
0.647
0.772
0:416 0:49,01141,, 0.171,
0.610: 0.90.-0.101 0.540 4.230 4.301 -0.144 4.0141.; 4.II
4.434 0.441 0.373, 0.523. 0.612 0.354. 0.607'.0.315 -0.340 -4.401,. -0.150 -0:023' -0.94.
0.94 0. 94 0.760 0.545 0.704
0. 571 0.39 0. sak 0.403C 5711 0.441 0.141
.4N 4.676.
0.530
.1i4 , 0.142
.:41.304 .; 0.604
2 0.163
.0.390.401"-.0.174-0.534 -4.447
2.42974:';;;,-
O.SI 0.3.4?4;
4.4430.19 0!761
0.390 0.703.
0:73 0:430,.4:494 0.714;',0.211 0.734!,.:.,''
0.076 4:146,0.106 0.344' ,
0.123 -0.190.316- 0.740
0.105 0.637
0.144 0.044
0.345
0.449 0.615
0.376 0.M0.264
SOURCE: same as Table 24.

Table 24. Simple Correlation Coefficients for Selected .Countries
(for the 26 variables analyzed in the regression, equations)
1% significance level with n = 112 is 0,239
, ,
.. ,Wei bsibt Nue Wm 101414 b.140. bili. Calvin laud foal 11uW3 WI I Put 1 bel 1 MU lltdo. 00114 1404 14001 15010 blills Ciao 10111 Illkle 101441U ,/,'
ilea' 0111 11,111 CO 1.111 1,111 CIO 1,111 $111 490 1411 C101 0.411 LIN 1,111 4111 UPI 410 11.1111 0111 0111 0017 , 0111 'CM 5,111 , 0111 .,.
ill'''. 1.111 0.111 0,111 Clls LIN ITN 1,111 4111 0,410 1.110 0,414 0,1111 0131 4,111 1.01 4111 1,111 MN 0,111 1,111 0111 C041 L111 011/
:Plositst 0,111 C10 5134 1.111 1,111 0,111 4.111 LIU 1,114 0,111 0,134 1.111 4110 1,111 4111 5111 1,00 1,110 LIN CM 1.111 1441. 0.110
,,PilaThNOO
cola toto
0,523
0330
0,575
0,701
0,41
0,04,140
.0,i15
0,010
0,005
Leo 0,130 0.133 0.01
cm (IMO L01 1.111
4.10
4,141
1.114
0111
4034.10
0,01
0,1N
0411 0.131 0.111 CM
Cm CM 1111 CN1
CMCM 00:11041 0°,440414
hllith 0711 0111 010 4,114 LINI 0114 0,131 0111 LIN 4,10 CM 4111 0,121 0,110 0.111 LIN LW 0,111 0,771 0,111, .otoret. Lill 0,114 .0,055 co/ cm 0,610 0,111 0,111 401 0.111 4111 0.011 0.111 51114 LIN 0.111 003 C113 CH:
0,101 .0,114 0,050 km 0.611 0,111 0,10 4.10 0.111 4110 0.100 0,113 0,111 C111 1.01 0.01 0.111 0,711
31144145 -0,177 0,505 0,550 0.110 L111 0111 4101 0141 404 0,111 0.131 0,111 Cell ,0,130 0,144 0.110 0,01
Iltul 013/ 4,111 AND ,4,111 4.511 0111 4,10 0.10 410 4,113 4.111 4,730 4,314 4,711 .4,01 4.140.:: I:
, 10111,.
A cm . 0,111 0.110 $123 4.144 0,111 430 0110 010 1.114 4144 1,401 4311 0104 0.411 ,
1444143
' lul l,
LIII 0441 0,10
, om 0.4044110
4410
0111
0,111
4114
4411
0,111
0.131
0,10 0,414 0711 1,111
0111 to CM 0,1111,133
1411
11,111
0.131
0131,
WI 1 0.111 4,10 0.03 4.131 0,10 1.101 0.01 0,111 1.111 '1,711 0.131
1il1 3 4.141 0,01 4.111 0.113 01110 0,111 LIN 0.111 1.111 0,111 1.111
,1:111411 4,111 0410 4,111 4.131 4,011 4.163 4.01 4,113 4,91 4,111
;u0411 4.111 0.714 0,141 0,130 0.01 0.411 0,111 0.10 0.113
r,141411. 4,110 4,714 4,07 .0.03 4,113 4131 4.140
litho . 0,111 1.111 C34 0,01 1.111 0.143 0,301
',Inept 0.110 0.111 1,311 1.131 1.111 0.111
.441 0,131 1,310 1,111 Ulf 0.71/
; 14101 0,300 1,110 1,131 1,111
ChM 0351 0,10 LIN41441 0.133 0.101
1,111114 0,10
SOURCE: Frederick H. Harbison, Joan Maruhnic, and
Jane R. Resnick: "Quantitative Analyses of Modernization,and
Development," Princeton, Princeton University Department of
Economics, 1970, P. 120-121, 130-131.

36
Tables 24 and 25-Continued
Economic Development Index: (as a nroxy for economic development)
a. Per capita gross national produce at factor cost (in 1964 U.S.$)b. Per capita energy consumption (in kilograms of coal ton equivalents)
Cultural Development Index: (as a proxy for modernization)
a. Newspaper circulation per 1,000 populationb. Radio receivers per 1,000 populationc. Telephones in use per 1,000 populationd.' Annual cinema attendance per capitae. Passenger cars and commercial vehicles per 1,000 populationf. Literacy rate of adult population (15 plus)
3. Health Index: (as a proxy for modernization and health development)
a. Doctors and dentists per 10,000 populationb. Pharmacists per 10,000 populationc. Nurses per 10,000 populationd. Hospital beds per 10,000 populatione. Daily animal protein as proportion of total grams protein consumed per capitaf. Daily cereals and starches as proportion of total calories consumed per capitag. Life expectancy at birth (in-years)-------- .
4. Educational Effort Index: (as a proxy for skill and knowledge-generation throughformal education)
a. Fi:st-level enrollment (adjusted for 5-14 population and average duration ofs:hool)
b. Sec:ond-level enrollment (adjusted for 15-19 population and average duration ofschool)
c. Third-level enrollment (adjusted for 202-24 population and average duration ofschool)
d. Per capita public recurrent expenditures on educa:don (in U.S.$)
5. High Level Manpower Index: (as a proxy for stock of persons with strategic skillsand knowledge)
a. Doctors and dentists per 10,000 populationb. Pharmacists per 10,000 populationc. Nurses per 10,000 populationd. First-level teachers per 10,000 populatione. Second- and third-level teachers per 10,000 population
6. High Level Manpower Stock/Flow Index: (as a proxy for stock and generating capacityfor strategic skills and knowledge)
a. Doctors and dentists per 10,000 populationb. Pharmacists per 10,000 populationc. Second- and third-level teachers per 10,000 populationd. Proportion of third-level enrollment in agricultural coursese. Proportion of third-level enrollment in medical coursesf. Proportion of third-level enrollment in science and engineering courses
7. Demographic Index:
a. Number of births per 1,000 populationb. Number of deaths per 1,000 populationc. Life expectancy at birth (in years)d. Dependency ratio (0-14 and 65 plus population as porovnt of 15-64 population)
8. Composite Index: (as a proxy to serve as an overall view of development andmodernization)
a. Including most but not all of the preceding indicators plusb. Percent of population living in cities of 20,000 and over.
4 2
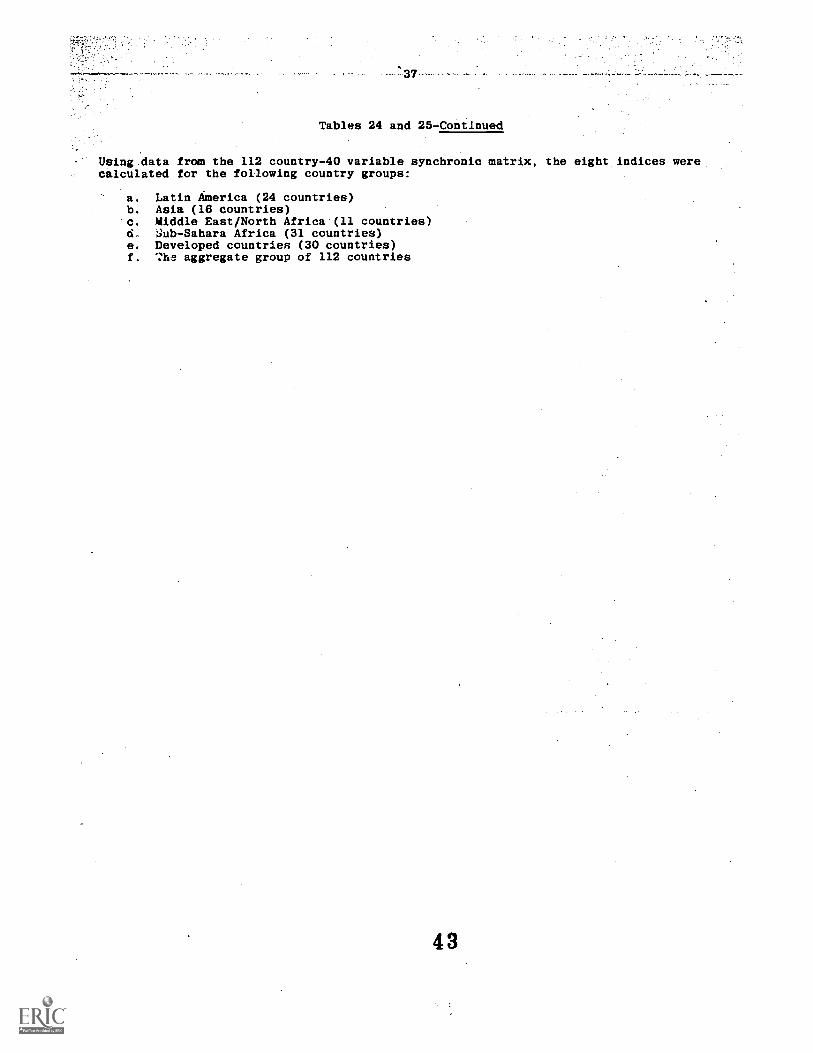
Tables 24 and 25Continued
Using data from the 112 country-40 variable synchronic matrix, the eight indices werecalculated for the following country groups:
a. Latin America (24 countries)b. Asia (16 countries)
"c. Middle East/North Africa (11 countries)d, ..lub-Sahara Africa (31 countries)e. Developed countries (30 countries)f. The aggregate group of 112 countries

38
level information. With this much of the diagram filled in, let us turn to village-ordistrict level study, for this is the level at which many development programs actually
do their work.
. ..
VILLAGE-DISTRICT LEVEL MEASUREMENT OF DIFFERENTIATION
Measurement of social welfare is frequently conducted on a household level and on
the national level. It is rarely conducted on the district-village level. However, itis on the district-village level that most development programs are carried out. The
most frequent question put to researchers in developir,_ countries is whether an area thathas been given a development project--irrigation, a rural credit scheme, cooperatives,a new factory--is any better off than it was before, or is any better off than otherareas that have had different development programs or no program at all. Thereforeefficient measures that would compare one whole area with another--be it a village, a
larger district or a whole region--would be extremely useful.
I am going to argue that in principle it is possible to measure social welfare at thevillage-district level to a degree of accuracy such that these measures would be closelyrelated to measures aggregated from household information. If it is possible to do thisat the national level, it is possible at the village-district level. Such measurementshave not yet been fully developed but many standard research operations at this level
would serve as components.
Differentiation may be considered a measure of the development of the village-district, and from measures of differentiation comes the idea that food supplies may alsobe studied at the village-district level through measures based on the retail marketing
system.
The differentiation of a village or district refers to the specialization anddiversity of its development, especially the complexity and diversity of its institutions.Differentiation is often related to population size, but villages of the same size mayhave very different levels of differentiation from country to country or from region toregion. Differentiation has been measured in various ways, but frequently by a Guttmanscale in which most of the village institutions are included: commercial, governmental,educational, social. Such scales have been devised for many parts of Latin America, inseveral countries of Asia, in the United States, and in several African countries.
Information needed in devising measures of differentiation ciw come from a numberof sources. It can come from a Census of Business; some censuses already provide muchof the necessary information. It can be collected by sending an observer with a datacollection schedule through a village-district noting all of the institutions, differenttypes and numbersof business, schools, health facilities, clubs, political institutions,churches, etc. It can be done by interviewing one or more key informants, persons oftenin some official position but at least persons who know the community well and askingthem about the institutions. Interviewing can provide information also on what changeshave taken place, what institutions have been added and what ones disappeared in recentyears. Information on the past history of institutions in a recent period that informantsprovide has been found to be reliable and can provide a basis for the study of change.
Tables 26 and 27 show two differentiation scales. The first was devised for 24Mexican villages and includes a wide variety of items. The second was devised to measurethe differentiation of 30 communities in Kenya. Both contain a variety of institutionsfrom all sectors, and this is usually the case.
A similar scale was developed in a study of 118 communities in southwestern PuertoRico. It is shown in Table 28. In this case a number of other measures of differenti-ation were also developed (Young and Young 1973). One of these was a scale that includedthe different types of forms found on the village plaza, an institution common to commun-ities in many Spanish-speaking countries. Another scale was based on the elaboration ofthe annual village fiesta. Another reflected the complexity of the settlement pattern,including such items as different street and road patterns, different residential sections,a plaza, roads entering and becoming part of the street system, and a housing project.Other measures consisted of counts of grocery stores, churches and primary schools. In
other studies counts have been made of all of the retail stores lumped together. Stillothers have concentrated on the elaboration of health facilities and medical specialties.Table 29 shows the relation of the various measures used in the Puerto Rican study. Theseare all highly related to each other and the general finding is that various types ofmeasures of differentiation, whether they include all institutions or confine themselvesto a single institutional sector tend to )2e,closely related and may be considered measuresof a single concept, the level of development or differentiation of a community.
4 4

ire
Table 26. Guttman Scale of Differentiation for 24:Mexican.Villages .(Young and Young, 1960b)
Step Proportion-Number Item Content DiscriMinated'
1 Named and autonomous locality 1. 06group
2 One or more governmentallydesignated offical6 -
Moie tean one street
3 One or more organizations invillage
4 A church
5 A school buildingA government organizationAn ejidoMass said in the village more than
annually
.92
.88
.84
.80
6 A functional school .76
Has acoess to a railroad lr infor-,mant voluntarily includes rail-road in list of village needs .63
8 Access to electrib powerInformant estimates that a majority-have electricity
Six or more streets
Railroad stationFour or more bus or train tripsdaily
.46
.41
10 School'has four or more grades .37
11 Village has a public square ,
Village market patronized by'pepplein other villages ..29
12 DoctorPriest resides in village.Ten or more streetsSchool:12as six br radesSix or more storesTwo or more television sets in villagePublic monument .20
13 Has one or more telephones
14 Forty percent oi more have radiosSettlement area one square mile ormore .12
15 Secondary schoolTwenty or more stores .08
Coefficient of scalability is .92.
SOURCES: From Frank W. Young and Ruth C. Young: "Comparative Studies ofCommunity Growth," Rural Sociological Society Monograph No. 2, West VirginiaUniversity, 1973, p. 24.
4 5

'
Table 27. Scale Of,CoMmunity Differentiation, Kenya 1962-68
Step Item1 Village has tea shop
AlternatAves: Has chief's officeTailorHealth centreMore than one
denominationPrimary school
2 Village has over 5 dukas (stores)Alternatives: Has a butcher
Has a shoemaker
3 Village has an agricultural assis-tant
?'
PPrcent Samp16.Error Discriminated
. ,
100
4 Village has wood cutting and char-coal burning
5 Has farmer training recordedattendance
6 Has a barber
7 Has a beer bar
8 Has a blacksmith
9 Has Kenya Farmers' Associationservices 4
10 Has mobile banking services 3
Number of cases - 30 villages
Coefficient of scalability - .68
2
1
5
3
5
87
76
66
53
50
36
20
SOURCE: Philip Mbithi: "Rural Level of Living and Farm Develop-
ment in Eastern Kenya: A Uni-Dimensional Approach," Unpublished M.S.thesis, Cornell University, 1969, p. 38.
46

Table 28. Scale of Local Commercial Differentiation inPuerto Rican Communities, 1966
118
StepNumber Item Content
ProportionDiscriminated
Number ofErrors
1
2
Convenience grocery store
At least one other specialized
1.00
commerical .46 0
3 Gas station .20 3
4 Barber shop .13 5
5 a. Butcher .12 1b. Wholesale store 5
6 Beauty shop .10 1
7 Hotel or guest house .09 1
8 a. Cafe .08b. Medium-sized grocery store 4
c. Bakery 1
9 a. Clothing store specializing inwomen's clothes .06 3
b. Movie theater 0
Coefficient of scalability is .71.Coefficient of reproducibility is .95.
SOURCE: Frank W. Young and Ruth C. Young: "Comparative Studies ofCommunity Growth," Rural Sociological Society Monograph No. 2, West VirginiaUniversity, 1973.
Table 29. Zero Order Correlations Among Community DifferentiationMeasures and Multiple Correlations Between
the Measure and the Rest in 118 Puerto Rican Communities
Variables 1 2 3 4 5 6 7 R*
1. Fiesta scale
2. Commercial differen-tiation scale
3. Settlement patternscale
4. Number of churches
5. Number of grocerystores
6. Number of primaryschools
7. Plaza scale
74 68
79
60
72
80
66
80
76
82
46
60
60
69
79
75
87
83
80
85
66
61
79
76
76
85
64
85
* This column shows the multiple correlations (R) of each of thevariables listed with all the rest. It is included in the tableas a summary measure of the ruws, and aids the assessment of theoverall relationship.
SOURCE: same as fable 28.
47

: There are a number of advantages ... in studying .community differentiatOTWObvious. .
:,one-isthat it describes much of theOrganizationni_lifeof the OommunitY. and2providee.e... ?
jramework,for underStanding the institutions andAaserviceeend_theirphysiealanifesta:tioneA:n! their totality. :It provideS i.basis for:etudyint obanges it(thesOCial'organ4'izationOf the community Over time. :11a's institutiOnal,complexitsrlincreaSedAbOre:Or:JeSSthan the:population? Mow doei its progress compare with other ooMmemities'An:,thearea..ithere.'do new organizations or' institutions fit? Where dOes Changetake4lace?. SuchStudy:e.lso provides the basis for examining the structure ofthe larger:areaytheproVinCeor State ;. the area mainly serveciby-oneyery large;-primatecOmitunity:and.a:lotefsmalLhemlets, or is there a hierarchy of communities?. When changetakespiabe lethearea, how is this structureaffected? Do new power centers arise;:erethere'shifts inrelative differentiation of communities in the area,.doesthe organization of tne area:
- become more hierarchical or- more.centralized?
These are examples of the kinds of questions that can be eXamined,ia,theCouree 'ofsuch a study,that provide understanding of structure and changeneededlOr pelicy assess-,:,
ment: Development-projects frequently mean the introductiOwof nevOnstitiitions, Such. 2..*is credit banks, cooperatives, extension organizations, fertilfzerstoreSetcY Where dO::
they go, where are they needed in order to servide an area, how:differeptiated:muStacommunity be to provide support for a new institutional ..tiniter.ie:whatOOMmUnities dothey survive? ,How do such nevi institutions, and the physical, andpOlitidaVlinks)eiththe outside that they provide, shift the patterns of influeace amodgCOMmunitieb'in-thearea?
The study of village-district-differentiation provides enotherwaY Of.A.Ooking it
individual development. One can do this by lookingAt-thelevel'ofhouseholds, including purchase of household objects, housintZcharieteristies,:edueatiOnal:;-attainment, participation in health, government and social,organizationsBnt,anotherway of examining the level of individual differentiation of one area;OOmpared wita.anotheris by looking at the level of differentiation per capitaIithelevel'of'differentiation
,
greater per unit of population in Village A or Village EL 'Whether .you lOok.at.aimOuntainfrom tbe top down or the bottom up it is the same mountain. Some-studies hive eXaminedthe relation of village differentiation to individual differentiation, and-have toundthat more differentiated villages tend to have more differentiated families...: 'Since the
families are part of the village social organizatioeand must: receive Adeas,-goods,services, practices and habits through its institutions, this makeS goOd sense. Furtherstudy of these relations would be very useful, so that the effect of regional developmentprojects on regions would be better understood and their effect, on families throughvillage institutions, better evaluated. This type of study.provides a look at: theregional and village institutional base from which family progress flows. It means thestudy of social welfare at the social system level on which social programs customarily
operate.
Differentiation scores assigned villages on the basis of their differentiation scale
steps have been shown by experience to indicate what villages are likely to get newinstitutions orprograms first. A new item may go to few or to many communities, but themore differentiated will normally get it first. When this is not the case, when somerelatively undifferentiated village suddenly acquires a number of new institutions, thisis a special case that upon examination usually indicates interesting shifts in regional
structure. For example if aless differentiated community happens to.be _located on.a.new.highway or railroad line, or is located in a region strategic for some new' development,such as tourism, irrigation or mining it will enjoy a sudden leap in differentiation.This rising of a new center will inaugurate many shifts of relations among the people andcommunities of a region that need to be examined for social planning.
It is normally assumed that a community is highly differentiated or has many insti-
tutions and businesses because it serves many people. But the reverse hypothesis is justas plausible. A highly differentiated center with many institutions and services attractspopulation. We know that this is true in some areas through studies of inter-citymigration. New types of transportation, new political divisions or alignments, new economicinstitutions, new ethnic groups can lead to shifts in community differentiation in a
region. Such shifts can be understood graphically in a study of the differentiation of
the communities of an area and their changing relations to each other. Such-a studyindicates which communities have developed and what this has meant for all of the others.With this general framework of differentiation, let us look at it from the point of viewof what it tells us about food supplies.
48

VILLAGE DISTRICT FOOD SUPPLIES
An important ingredient of the study of'village-district differentiation is thestudy of the retail system. This is the beginning of a.study of food supplies availableto the village. One might argue that a study of food supplies at thiS intermediatelevel might be more readily obtained, more accurate and freer from respondent bias thanmeasares based on household interviews, and especially among poor, rural people. Let usconsider what else would be needed in order to measure food supplies available to avillage-district.
First, we would need to have some estimate of what is raised in the area. For thecommercial crops, such estimates probably already exist in many places and are compiledfor other national purposes. If not, for.commercial crops informatioh could.be gleanedfrom those who process and transport these crops for the market. Amounts.of commercialfood crops kept for home use must be related to amounts sent to market and could beestimated from these. Other methods could be developed, such as field sampling, aerialphotographs, and the like.
In many areas even if the crop raised commercially is a food crop that is used forfamily consumption, such as rice, much that is important for family nutrition must liebought. Many studies of retail marketing systems have been conducted by agriculturaleconomists. These yield information about all the different types of retailers and whatthey sell. These may include street vendors, open markets, small shops, supermarkets,And the like. One such example is a study made by a University Of Michigan.group inthe Northeast Brazil (Slater, et.al, 1969) the poorest, least developed area of Brazil.The same group has made similar studies in a number of other Latin. AmeriCan countries.The research team carried on a series of exploratory interviews *itnparticipants in themarketing system. From these they developed questions that were put into a series ofsystematic schedules administered to all kinds of retailers: fair stall operators, fixedfair operators, public market operators, neighborhood-stores, supermarketS,.consumercooperatives and large meat dealers. Table 30 gives the percent of different .types ofretailers that carry different commodities. This table (along with. many Others) wasdeveloped from the retailer'survey schedules. It is.clear that such informationcouldbe elaborated according to the interests of the researcher. In other:studies of thisseries detailed estimates of quantities sold and prices were obtained. In the case ofopen-air markets, sufficient information might be gained by observation 'count', andvarious types of crude measurements of commodities-on sale. Ifthis were.validatedat first with interview information, it might provide a useful shortcut.
In addition to providing information on the variety -and quantity of food onsale,a study of the retailing system could yield much direct evidence on.the whole classstructure of the community. If we know what,types of people purchase food in whattypes of outlets, the number, variety, physical distribution, and quantity of sales indifferent types of outlets could give us a quick picture of the class structure of acommunity--how much is sold in lower-class outlets, as compared with upper, how muchin urban areas as compared with rural. Gradually marketing studies could be refinedso that measures of key commodities might stand for the whole system. 'For instance ifwe know the distribution of meat, fish, milk, eggs--animal protein--we might find thatthis is closely related to the distribution of fruits, vegetables, starches, and to allfoods. But it would be much easier and.more economical:to .gatherinformation on, onlytwo or three key types of foods. These might turn out to be beans,-rice, citrus, orwhatever. What we would be looking for would be some food, the distribution of whicnisclosely related to the distribution of all foods.
In addition to studying farm production figures and the'retail market system, thereis one other type of study that has been conducted to gather, informatlon about foodsupplies. In a study in Ghana Poleman (1961) describes how he conducts What he callsthe Produce Movement Census and tells why he thinks this is a good way of measuring foodsupplies. To conduct this census, road checking stations are set up on All the ingressand egress roads around the study area. Every truck coming in or leaving is stopped andreports what it contains. From this census, food supplies of the area are estimated.Poleman advocates doing this over a long period of time, but obviously experimentationwould provide a basis for sampling here as in any other type of data-gathering.dperation.This may mean sampling on different days, times,andparticularly seasons of the year.Poleman states that many countries conduct such road thecks already for other purposesand that these could be utilized to estimate food supplies.
Let me summarize. The village-district level is an important one in action programs.We may wish to know how one comoares with others, or whether one has made progress insocial welfare over time. General measures oryillage differentiation have peen workedout in many places and relate to aggregated measures of family differentiation in these
4 9

44
Table 30. Percent of Retailers by Type CarryingVarious Commodities in Northeast Brazil
CommodityStreetFair
FixedFair
PublicMarket
Neighbor-hood
Retailers
Self-Service
Retailers
Rice 10% 13% 16% 50% 98%
Beans 11 13 16 51 95
Manioc 15 13 16 52 95
Flour
Liquid 5 7
Milk
Dairy 34 81
Products*
Fresh 6 13 27 6 7
Beef
Other 15 11 10 37 81
Meat
Poultry 4 5 4 3 40
Eggs NA NA 47 50
Bananas 54 39. 32 12
Other 54 39 32 12
Fruits
Tomatoes 11 54 39 16 12
Other 38 54 39 22 12
Vegetables
Canned 5 39 100
Foods
Other 12 1 4 34
* Excluding liquid milk.
SOURCE: Charles C. Slater et al: "Market Processes in the Recife
Area of Northeast Brazil," Research Report No. 2, Latin Amer,ican Studies
Center, Michigan State University, 1969, p. 5-15.
50

-45
same areas. These general differentiation studies have contained enumeration of thetetail trade systems. Such studies could be elaborated tO provide information On theqUantity and variety of food sold. Agricultural economists have.conducted:detailedstUdies of retail marketing systems yielding such information, and these CouldA3eelaborated. Additional information could be added from estimates of lodel crop_produc-tioh, and from the product movement census of food going into and coming out of anarea. Systematic study could lead to sampling procedures that would reduce the amountof work needed, and gradually several commodities could be found that would.téll muchabout the food supply system as a whole. At that stage, such a study Would. providequick, economical and systematic measures of village welfare that could be used to monitorwelfare over time and from area to area.
My main purpose is.to discuss social indicators. But I would like to point outthat studies of retail marketing systems and food supply distribution are valuable intheir own right. In many countries such food supplies as exist are very poorly distrib-uted. A surplus of fruit might lie on the ground rotting in one area, and an acuteshortage of fruit might exist in another area because of the lack of any adequatetransportation or marketing system. Such studies also provide the basis for the studyof the village-district and regional economy, and it is for such reasons that they havebeen typically used in the past. Therefore such studies would be useful apart fromserving purposes of monitoring social welfare. For the latter purpose, my generalargument is that most people in the world are part of a cash economy. Therefore much ofwhat they possess in the household has to be bought. One can either measure a commodityby counting the supply in each of 100 households, or in store from which Gach of the 100households has made it purchases. The latter route makes much sense for efficient -socialmonitoring.
In Chapter 1 a list of social welfare indicators collected by David Smith on the 48United States (excluding Hawaii and Alaska) was presented. Smith performed a factoranalysis on these measures and showed (Table 31) that diet was a pert of a larger socialwelfare factor. This factor included measures of affluence, health, education, housing,voting along with diet. That is, food is part of and could, if well measured, stand forother regional measures of social welfare. This provides another link between food andgeneral welfare measures. We do not have a link between all of the cells in Diagram 1,but we have them between the village-district measures of food and other welfare measures,and between village-district measure of general differentiation and family level measuresof differentiation.
We have now gone over all of the cells in Figure 1 and have discussed how each ofthese cells can be measured. We have discussed food at the national, district-village,
. and family levels. We have discussed national development, village-district differenti-ation, and family differentiation or welfare. Any of these cells can be a researchfocus in its own right for all kinds of applied or theoretical reasons, and indeed hasbeen so. But the links between the different measures at each level are tmportant; forif food is closely related to other measures of welfare at each level, this means thatfood could stand as a measure of social welfare at each or all levels. If measures offood or general differentiation at each level tend to be related to measures of the samething aggregated at lower-system levels, this means that social welfare (or food) canbe studied at any level that is efficient and relevant and related to meaaures at thehigher or lower system level. In some cases the district-village.may be.of-more interestthan individual families. In other cases the interest may be in family welfare programs,but it may be possible to evaluate the general success or failure of such a program bymeasuring the welfare of a whole village or district at which such a family program hasbeen targeted, because of greater cost and time efficiency. These sets of linkageswithin and between levels provide more flexibility in the measurement of social welfaredepending on interests and resources available. But they also provide the possibilityof studying one element central to welfare, food supplies, at all three system levels inorder to gain better understanding of how the family, village, and national systems arelinked together, to understand the distribution of food as a complete social, economicand political process. Understanding of how food production and distribution works fromthe family to the national level would be valuable for its own sake, and would revealmuch about these social systems in a more general way, and particularly the processesand exchange mechanisms linking them together. Therefore the study of any of these setsof links could also be valuable in that respect.
In the last section we will.discuss some general researeh questions that underlieall of these various research possibilities.
51

Table..31. Structure of the Three Leadinc Componenti_ofWell-Being at the State Level,in"48-United.States".
,
COMPONENT 11 GSNERAL'BOCIOECONOMICAYELLBEING(explainedrvariandOT7-728:56%Iiighestjoaditge: fathilIeS with"incomeIessthan,$8000
--;.9083'houSes dilapidated,etc. '
J,-8951 benefits lorietired4orkers.8.8.53,*IrgglitPa-1,PcOme'-
:..8951deatiStell0;11004ioPulaii0n8056 AFE.00.40.7thOW:
..:8086.:StateuileMOloyMent.benef-it': .
r.8065 yalne0t,owne*occupied'hOuseshopeehOlds Wirtb'Oddr.diets
'-.7993.infine,dentha;:.78B840.111c4ohobl expenditure's
tetE&failUred."-.7780 eligible voters voting , .
phYSidianS/16,000'.060iliation.7587 median School years coMpleted ,
SOCIAL PATHOLOGY (explainedfyarianCe.::-.13.74t)highest loadings:
.1236jyphi.1,1SOSSe
..6719.:gbnOrrheibaies
.6528 nii.Cotibsaddfits.6422 Schocegregation'
-.6325,reg1st!red:Yotees:.6043.drimexAigainsi prpperty.5517 4114.teincY. 5413 tuberculosls deiths
-.5329 index ONXime Ocolpment
COMPONENT 2:
COMPONENT 3: MENTAL HEALTH (explained variance: 11.98%)
highest loadings: -.8174 patient days in mental hospitals.7999 hospital expenses/patient day,.
-.7940 residents in mental hospitals etc.-.7800 hospital beds/10,000 population. 6323 divorces.5583 suicides.4932 mental hospital expenditures/patient days
. 4696 motor vehicle accident deaths
.4601 crimes against property
. 4568 median school years completed
. 4548 persons attended college
SOURCE: Taken from David M. Smith: "The Geography orSocial Well-
Being in the United States," New York: McGraw Hill Book Co., p. 94.
52

SOME GENERAL PROBLEMS OF INDICATOR RESEARCH
.%.The last seetion will 'deal briefly with four general problems of.indicater! reaeirCh:!;the general.problem.of social measurement; social monitoring;-evaluation:researCh;;.and..causes Of social well-being.'
In social research no one measure is ever 2erfeet: Unlike ears-:Of..:Corii.:41.)41fige'..human beings are endlessly variable And many diiferent influences iMpingeOnYeverything:they do or say. Therefore no single.item used to tleasure foOd.supplyorhealthAelikoly:to measure that alone, uncontaminated by any other influence. TherefOre.;:40liketO:,uSel,a:series of measures that are all closelyrelated. But to use eachoneus with the problem of which one is best And it also gives usthe,proble0 of.Very
-'voluminous, cumbersome research. Therefore many sociologists:use a ntmber o0i/ayttO1,'simplify this problem. We start with a series of menures-74tsome general concept we are interested in, such as level of living,foodeupOly,familyhealtth Then we use any.of a number of techniques, some of whiCh We:bave already.f.disCussed, to reduce these to one good measure. In this way we feel we have.eliminated!fsome:of the idiosyncratic variation that might be present in any single'item:and,bave-*..stronger, more valid measure of the concept. I have mentioned yarioustypesof:16Calesas ways of dealing with this problem. The first, was the type of ecaleusedin theievelof living study, in which each item was correlated either with some outside Validator:or with a total score of all items. If each item is numerical,,..oneYraightuSeacorrela7tion coefficient of some sort, or if qualitative (non-numeridal) some non=-parinietridmeasure of association. Then one would discard items thatAo not:relate Yin, Much tothis criterion, and add the rest into a score for each case
Another type of scale found useful for qualitiative or non-numerical data is the .
Guttman type of cumulative scale. The appendix by Schlegel (1974), describeswhat.this.:.scale is and how to do. For bost results, do the work by hand. TherenreCOmpater
.
programs tOr Guttman ScaleS, but no matter what mathOdfOf evaluation licWchoose,yownre-in a better position to understand why an:item is working.or,not working:ifyoutWthework by hand and look at it and think about it. In this way You Will aleoi.have'* chanceto look at what appear to be deviant cases. 'Suppose you are tryintto make lipapersonal.:, !
clothing scale. You may look at a case that simply does nOt-seem.tojitthescale:at.,ali:and find that the person is a nun or an army officer Or a restaurant waitressjWhoeeclothing needs are systematically different than the normal person.'s,:youiaideCide eutha oase is not a legitimate part of the population you wish to7etudy, and eXcludefitfrOmconsideration in making up the scale. In making up sCales, sociareaearck,:theaiOre faMiliar you are with every aspect of your data, the more likely you,sre teeueceechIn the ideal case, what comes out of the computer or what is handed te-yOUshould only confirm what you know already because you haye been involved'withjYourand understand what is going on. If you.have a large sample.or pOpulation,HiraW a_eu -sample And work with it in the preliminary stages of analysis.
. , .
Let us take another example.: You may look at two items and see that mostAieople:who have one article, such as a raincoat, do not seem to own an umbrella ind!viceversa, '
lben you can say that either one seems to act as a substitute .for. theother-and:makea new item, person owns a raincoat or an umbrella. The computer would not tell-you thisYou would have to examine the data closely and look for such regularities.
_,
Another way of condensing related items into a single measure An the case of quanti,tative material is the factor analysis. This is probably tootiMe7consUMing without:acomputer, but very simple with one. Even if you do mostrOf youranalysisyoursclfhand or with the aid only of a calculating machine, it might be efficient' totakesegment of it to.an available computer at some distance away to condense your data into
!
a series of simpler measures by factor analysis or eome such method.,7 Then the facterscore_could be taken back home and used in non-computer:methods of analysis:much moreeasily.
Let me emphasize again that I am not suggesting you simply take a large pooi Ofitems of any sort and look to see if you can find some related set to condense into asingle measure to which you will then assign a name. I am suggesting thatArOu must-start with a clear idea that makes sense to you and other people of what..concept4you.want to measure, find a number of items that might measure this concept, thencondeneeall of these into one better measure by some method of scaling or factor analysis, atthe same time eliminating other items that do not work well.
Another problem to whic: to sensitize one's self to is looking at items from thepoint of view of what part of the population they might be measuring well. For examplein a level of living scale, you might find that having a car discriminates the very richfrom all of the rest but does not tell you the difference between an upper-middle-class

UP47:
.
famdly*andaworkingCliss.: family. you mightfind:some itesithateveryone but the very.'pObrhaVetthie will doit: good jOb of telling-You aho,the-very,:pdorare,:''bUtwili motdiatinguiSh therestfromeaca:other. Different tyPeS of measures and-different tyPes-,'-,011E'iSCalesaiist:,be:evaluated'not onlyAm-an-overillirwayfrom,generil:Criterie-Or.adequaCy
Viewrerwtiettierthey:-really separatelrothelichetherthe:partOf. - __ _ .
thit-ja the main focus of research; whether these:are:very-:poor:-yery
. .
,
,A:second'problem I will:mention is that of,social monitoring. 'By soCial.monitoriug
-imean=ind:taking_Of the Same measure at_regular iatervalt ib,time,over.a.large pepula-:tioli:Of7peOple'Or villages. :The censusjof pOpulation-,:thecendtb-of-agriculture,c'the-'-'--
-;,ceisusof.buiinees, tax records; land ownership recordi.,,-birthenedeath,recOrds3oin all;'Ilie.'.ased,for such purposes. :Theideal.resciarchdesign:Compares:at;:leasttwopointaia.tipre%aad coMpares'at least iwo groups at vaChlaoint-in-time.:IBu4,0timPleTViOarcli':,'ASsign mdght work:well,.for an.experiment in feeding pigs or testing fert*lzer. IiFthe:human-wOrlcUgenerally speaking mech:mare is-needed.,'YoU'Olay,need'.to Compare*artygrOUOi*ter Seieril periode in time before-you can'te/l-whether-anyonmgrOuVorany-onetime'period is really different from alltheresitTherefOre:youcanmiltiplythe,effeCtiVe
,-,-'neds.of. your .research tenfold.it. you Can findeVen_a.few meals:Urea ,thattiWimportiat'IM:, -client groups and monitor them over-a wide iirea.,and':repeatedlyoVeralangXticie.::,,:latalking of social indicators the ideal would be .to,:iork:out,:some,gOadflajeaSniejOhav.V.eldthe.kind of social'data that-planners, develOperS,:adminiatratoilekislatora:leea::,Ideally the census office or some central, datagathering offiCe:will:inCor0Oritetheee:;
-into its efforts. Censuses have been developed'to servo Oirfidular:pUrpoSeademdgraphy,-'tax purposes, voting, economic prediction,.public health:organizationlnd:!..the-like.Social scientiate-1-primarily interested in human social welfare: haiienottyPicalli had a,
strong influence on census material up to now. But.for future efforts. in-theotonitoring',--of social welfare, influence on census bureau's to.gather some aell-wworked-oUt7measures /
-is clearly in order.
In Israel, Louis Guttman was the leader of a.researchgrolipthat'walited to doresearchthat would be useful to goverament agencies in:their!regularoperationsiit:his4mip-.,__,found ii very difficult to respond to agency questions-in time for-theresearch the 'group:
did to'be of. any practical use. Starting from scratch:the research-took:toO _
Therefore, they inttiated a system of social monitorinuinciuglit lb g sgrVeyadministeredat regular intervals to a .lample of the whole population-a sat of.core qnestions that.--they decided were of lasting value and relevance. From time to tithe, they apuld add otherspecial questions or questions of temporary value.'.If: reftearcb ia done st'rgularlyplanned intervals, then when social questions arise, chamces are good ttat they can befitted into the regular schedule already in the field on-anf4ut t_c$ be sent, andanswersare secured in much less time thantt wouldotherwise take. It is only by sucth regular .
and systematic work that this group was able to be responsive to gevernment plmMning needs
for information. A core set of well-workedoiit social indicators can provide 21 basis forsuch social monitoring: Depending on the country, additional sets of cicestionis on topicsthat seem to be important over long periods oftime can also be developed.. One,such
topic obviously would be agricultural production for hailers. If a country wished toevaluate a cooperative program a great part of its work wowid already be done if it hadregular information on production and on social welfare at regular intervals and going
back a number of years. One could then compare cooperative afeas with otherle to see ifthe trends in such areas were differentTfrom thenon-cooperatiVe areasti respect to thesetwo fundamental sets of variables. It is only a system of social M904.0ring that islikely to provide such a baseline in most areas of the world. Similarly, in planning a:new program, regular social monitoring provides a much sounder basis for selecting target_areas or populations than a special study launched for the purpose. The measures havebeen well-worked and tested over time, and they are ready in Sufficiently short a time. .
to be of some use to a planner. Furthermore, if the goVernment officials who make deci-sions have been accustomed to receiving informa4on about these measures on a regularbasis, they are already familiar with tbem and communicatiom problems are decreased, ascompared to communicating new research to lay-people.
This leads us to the topic of social indicators as evaluation research. A programcan be evaluated in terms of its own goals: did it set up the organization it intendedto and employ the required personnel, did it spend and distribute its funds properly, didit build buildings, or dams, did it reach its client group, etc.? Did it do all this
efficiently? But after all these questions are answered, the researcher is still leftwith the fundamental question of whether the program may do everything it intended towell and efficiently, and still not improve production or raise the level of living.This, we might say, is the case where the operation was a success but the patient died.Or the converse may be true; a program may not do its job well, but other social forcesmay have improved life in this and other areas. Therefore, no matter how else a projectis evaluated, it must eventually face up to the question of whether life has improved for
54

'Ahe_people:invOlved and for other people indirectly touChed bytheprogram:More than it:,.dtherwige,,would"have Without the program. Therefore,.Social indicatorsiesearch, whether-esPecially carried Out to evaluate a particular program Or pert Of a,generalSOCial:nmonitering,,Must be,the anY evaluation'. .The:target grouvmust.'he compared*ith.VotherS oVer a wide area in this:fundaMental'reSpect, .To find Out whether-it wasAvorth doing,-,we need to find out whether/the target groupAmproved any nmile'thin Untreated-areas,,Or anytore than normal socialtrends would haVe,accomplished in anyCase, AprOgram that has not raised the level of living may say.that that is notwhatAtAttended::7to do,.that its Purpose wasto provide.hydroeleetricAmWer, or a.dampr a.high-Then" the planer is faced with_asking when this program caaheleXpected_tO imOrove thAluge,;_for whom-and how. Many large projects.have thrded out:to be white:elephants:that are,'impresSive;things in themselves but-whiclihave not,improved anyone's life shit.' There,fore-if a project purports to have indirect ori.ong-range effects, evaluation by the useOX social indicators would have the effect of compelling-At to:spell outr,what_these'rindirect vr long-range effects are supposed to-be, whaithey,would cost, and the adminig.trator or planner could then compare the expected results with those of Other prOgranis.7,
' Thisis viten the government's problem. It is not trying,io decide:whether to haVecooperatives or not, whether to build a hydroelectric project or not, whetherto build-lin-industry or not. Rather the problem for a government is which of these:to put itseffort and money into. Comparing such programs is like comparing giraffesjp fleas.; or,apples to'bread, if one evaluates each in its own terms. But there:is:a:66*On set ofterms in which one can evaluate all of them,,namely how much each improves sOcial welfare,in what span of time, for what populations and at whatcOst: Therefore,Jforalanypractical questions, social indicators provide the only possible form of !valuation.
. .
.The last problem that I want to touth on lightly is-the probiem-of'causes and treat-ment of poverty. The lay person's response and often the government,official or legis7lator's response to poverty is to think in terms of,''They are hungry; hand-Out. foodstamps," or "Infant mortality is high, let's build a-clinid." :This approicn seems like,common sense, but we may compare it to a symptomatic treatment.of diseaeln.the caseofAllness, we like to treat whatever causes the disease:rather Alu*merely_alleviateits symptoms. In the case of poverty, then, to make any,real change we need-to analyzewhat about the social structure causes unemployment or undereMployment4",what tbout theagricultural structure pruvents farmers from making a living and alter.these structuresto make poeple self-sufficient.
From this point of view it is useful to look at some definition's of poVerty.Reissman (1973) offers three definitions of poverty: (1) Pciverty asAncome;.(2) povertyas culture; (3) poverty as social class. :If poverty As defined in terms of how much,income a person has, one is faced with setting the amount of income belowwhich peopleare considered poor. Reissman points out that.this,changes from place_to place and titheto time and in terms of-changing ideas and standards of what people'ought te',.haVe. Ifthese problems can be overcome, income,.he says, can,be uged as-a yardstick to measurepoverty. But he points out that increasing income in'Order to solveythe pOilerty problem
_does not solve the problem at all.
"My response to this view (i.e., that the 'solution of peverty lieg idgetting moremoney into,the hands of the poor) is.that its proponents Usually interpret inCome Ansuch a limited fashion that their 'solution' to the problem is hardly a vsolution',atall. For one thing, unless increased economic opportunities are,providedcelong with theincreased income, there is likely to be very little effective change in the situatiOnfor the poor. Added income does little more to solve problems than do current welfarepayments.
"Second, unless there is more widely effective access for social participation, thenincome alone cannot help to remedy even the economic consequences of poverty . . . .
"Finally, unless income differences are interpreted as-signs of the larger condition,of inequality, then the minor tampering with strictly income solutons misses the need fora significant form of income redistribution that ean.be more lasting." (pp. 47-48)
He argues that increases in income do not necessarily provide freedom of choice inits use, increased participation, increased access to economic opportunity or greatercontrol of one's life.
He also rejects another popular conception of poverty as a special culture. OscarLewis introduced this idea in his work on poor Mexicans and Puerto Ricans. But Reissmanpoints out that poverty is not a self-contained culture or a culture that is chosen bythe participants, one that they are free to reject. It is a culture circumscribed ordetertninedby the larger society of which it is part and it is very difficult to leave.Thug it is not really what we ordinarily mean by a culture.
55

e.favors.a third definition, poverty as sonial. 61a-se:, In defining poverty/tie 4
-;Scicial:..nlaSs- he says- that it is thereby ,definetlaS.,."an'-,ineneapab/e-featureThe pOor belong to the lowest stratumof the ilmerican:'ciaikiitrAture.
,TheY:f.lank any effective 'access tO'Situation -whiCh makes the Poor .virtually.-powerleeisemdrimiment.: This Condition is further compounded by the'inability of the:,,Pnor'stO.
.cirginiiethemselves 'into a coherent and conscious class that:might piirsunipOwer.. ,In .
addition.,- it is-quite likely that the poor 'judge- themselves,bY.:,the current ''standards
of: the:Societk-st-large as failures or the 'vintiMs`of 'bad luck." ;(0/3-:-.52-53):::...
, He goestO say that-there ari twO lays Of -diatingulehing,the-condition's* of their existence=-their housing, diet, economic gOcids'; occnpniiinn, -nch;Cation
etc':.v (2) the situation that establishee.'the,entein of :access ,to society.r6..ii.cWardS and
benefits.. It is the first way that we have been:'discusSing-in. this and-'0,*iriOns- sessinnS`
. in ternis of. measurement. In -terms of *solving' the' Problem' of pOverty-:1tiS,::tO-the: second
.7;that.we must look.
In' the 'factor analysis of Social welfare; in the' '4*3 United Statie.performect:by
David Smith (1960), he arrived at two factori, general:' sOcioedinnonliClive214ningi,-and:=social pathology . Young- and MacCannel I (1975, mimeograPhed). triedto,:tind,ont,-.whnt
kinds of- economic, social and political structure's caused- differennee-Inineconoiin:well-being and in Social pathology-among the '461United Mtates.-r-The,utinSlibirpottleSeili,
are` that 'differentiation, urbanization, industrialization' or !'ineresisnlin: anYt.:ol''.these
lead to better social welfare. Young and MacCannell alsO tiad-e.difterentffhypotheeis that-,
social or' political rigidity led to low .social welfare *hatmeant in this case was states with a centralized, stagnani,politidat-ifeteni;:there oneparty had been in power for a long time; a caste system`wherelin.,theSe4iatie,'States there,'
were laws depriving people of social, economic and'polltical-:'OppOrtnnity'becinie of ."..`
race. They had a number of measures of each of -these,concepts on-whinh'they-performed a-
factor analysis to reduce them to the :factors you see in: Table 32. 33: shows-
that the factor that has the greatest influence on- sonioeconomic .110.1A:wing' is the
flexibility-rigidity factor: Differentiation, industrialiZation, -and increased -urbaniz-
ation had some but far less effect. This might be-interpreted as tellinuus that nomatter how much you urbanize, industrialize, differentiate your society,..advances in
these areas are of no use to people who have no access to them. Therefore, 'in American
society the main problem at the moment is the integration of deprived population elements
into the mainstream of economic progress. If we increase ttie whole. cake, as -it is
often put, it does not necessarily mean that everybody is going to get a bigger share
of it, unless we reorganize methods of giving out shares. In other -societies there aresimilar barriers; peasants may lack land or access to means of production.' Or if they
have inputs and a small piece of land, processing, marketing and exporting may be in the
hands of a class that deprives the agricultural producers of access to profits. In
order to cure poverty, this theory implies that it is necessary to make whatever struc-
tural transformations will give deprived groups access to economic, social and political
opportunity. These transformations usually will not be performed by small improvements
to the technology or even redividing the land unless these are accompanied by profoundchanges in the whole economic and poli tical structure so that deprived sectors have
access to economic and political partcipation in such a way that they get control of
their own lives.

Table 32. Varimax Rotated Principal:Components AndlySiS of,.AttributesTqf State Politica/, Economic, and-Social StructUre(N-48)
_
.in the United States
Factor Loadings
c.)
oCD a
C*1
N0
cd .0
0 cd
1o
Differentiation Scale .79 .06 .08 63 :Population Size .97 -.11 .12 .10Number of Engineers .92 .07 .17 .27 95Number Workers in Manufac-
ture of Durable Goods .90 .16 .21 .11No. Workers in Manufacture
Non-Durable Goods .90 -.13 .33 -.91 .6iNo. 500 Largest Corporations
in State .87 .24 .23 :09 -.88
No. of 50 Largest Banks .91 .12 .12 .16.Value added to Manufac-
tures .94 .05 .29 .66 .98No. plants employing 100
or more persons .92 -.03 .36 :01Political Competitiveness
Scale -.00 .85 .03 ;30 :81.Flexibility-Rigidity Scale .31 .88 .11 .14 ,90Per Cent Voting for Humphrey
1968 .15 .78 .44 .02 .83,
Per Cent Voting for Wallace1968 .04 -.94 -.10 .96 ,90
Per Cent Negro .17 -.92 .12 .03 -.90Number of patents per 10,000
workers, 1900-1950 .35 .51 .51Proportion of the labor force .
in manufacturing .37 .05 .84' ,86Population density .34 .08 .86 -88Per cent of labor force
employed in rapidlygrowing lath: tries .33 .45 .64 .45 .93
Per cent population change .02 .02 -.07 .95 2.90Per cent of population urban .43 .29 .34 .71 .89
Cumulative per cent-of vari-ance explained by unrota-ted matrix 51.9 74.0 81.8 .88.8 -
Eigenvalue 10.4 4.4 1.5 1.4
SOURCE: Ruth C. Young andDeanMacCannell: "Predicting theQuality of Life in the United States," Cornell University, 1975. (mimeo-graphed).
57

52
Table 33. Regression Coefficients - Dependent Variable:Smith's Factor 1--General Socio-Economic Well-Being
in the United States
Factor
betaRegression StandardizedCoefficient Regression
Coefficient
Standard Errorof
RegressionCoefficient
F Score
Using Factor Scores to Explain
1. Differentiation 95.96 .22 19.83 23.41
2. Flexibility 353.39 .82 19.83 317.59
3. ProgressiveIndustrialization 76.58 .18 19.83 14.91
4. Population Change 166.70 .39 19.83 70.67
Constant .187
Attribute Adjusted R2
.90
F Ratio 106.65
Using Selected Variables to Explain
1. Population size 0.10 .21 .04 6.15
2. Per cent Negro -37.31 -.77 3.61 106.92
3. Population density 6.62 .32 1.63 16,44
4. Population change 22.43 .30 5.29 17.95
Constant -266.84
A1tribulo Adjumivd R2 .76
F Ratio 38.15
SOURCE: See Table 32.
58

53
APPENDIXGUTTMAN SCALES AND GUTTMAN SCALING
Guttman scaling is a means of transforming qualitative data into an ordinal numericalscale. Although not necessarily limited to dichotomous (two-category)'itemS, these arethe most commonly used in practice, and attention here will be restricted to' them,.more formal terms, a Guttman scale is a method for testing whether a serieSof-qualitativeitems belong in a sielgle dimension. A perfect scale yields'a rank 'ordering of: cases(individuals, districts, nations, or whatever are the units of analysis) -on the basis of .
Aheir possession of attributes'or inst:ktutions which Are ,:hemeelves ranged frem'low toor.frvm less to more "extreme" or, a presumed underlying continuum. The presumption
of unidimensionality derives from the".cumulative nature of the arrangement of items. .
That is, a higher scale score implies,not only that the case in question possesses more ofthe scale items, as well as rarer or more extreme items than caSes ranking below it; inaddition, it indicates that cases with higher scores possess all the attributes of thecases with lower scores, and one or more in addition. In a perfect scale, as:illustratedbelow, if we know the order of the items, the score alone tells us not only how many arepresent for a given case, but also exactly which.ones. If the score is 2, for instance,tt is known that the case possesses only the two lowest, or least extreme, items - in thisinstance A and B.
Cases
Table 1. The Perfect Guttman Scale
Items
ABCDEF Scores
1
2
3
4
5
6
7
1
111
1
1
1
1
1
1
1
1
1
1
1
1
1
1
1
1
1 6
5
4
3
2
1
0
0
10 0
0
0
0
0
10 0
0
0
0
10 0
0
0
1 0
0
0
010
Error, Reproducibility, and Scalability. The difficulty is that perfect scalesare hardly every found in actual practice. There will almost always be some error. Theproblems of determining the amount of error in a set of data, and using this informationto assess the degree to which the data approximate perfect unidimensionality are the oneswhich have to be dealt with in ordinary practice.
Unfortunately, there is more than one way of arriving at a determtion ox whetheror not a set of items is scalable, depending primarily on how "errors" are counted. Thetwo most common ones are known as the Cornell techOqUe and the 0-oodenough technique.Whichever technique is used for counting errors howe7er, th*.: coefficients used tO assessthe degree of approximation to perfect scalability (discussed below) are computed inexactly the same way, .v
Guttman himself originally proposed the "coefficient of reproducibility" as thecriterion ot fit to the ideal pattern. This is obtained by diving the number of errorsby the total number of responses (cases times items), and subtracting the resultingfraction from 1:
ErrorsCoefficient of reproducibility (C.R.) = 1 -Total Responses
This coefficient represents the proportion of actual responses which could be accuratelyreproduced if only the item order and the scale scores for each case were known. In aperfect scale, the C.R. will be 1.00. Guttman recommends a .90 as the minimum acceptablevalue.
Note: This section was prepared by Charles C. Schlegel.
59

nUmber :ot Problems With C.R.;-_the-main one.beimg that Af-falnioStallthe_
. ,:ie-0.0-onseore. given:item,/all into Only one ofthe,categOries-(present7or, abeent)theentOmum'pOesible.sCaleerror contribUted,by:Ahat,item will be very-,Eimailand'rtte-overall.
.-6061414entmay.:t4us..,w,grq;ibiallyinilated..'In:.faCt.; thereprodudibility:of any.ite*:
CapinOlieibelower-than'theprOpOrtiOn Of respOnses fri,the Smallest,category And slide,:"-thereproducibilitY for the whole ecale ie the. simple average of allthe. IteM.ieprOduc-71-
ibilitieSthere.,,is danger Of, inflating C.Ft arti2icially merely,bythe 4nclUelon ofAteme:-LWithtk,extreme:distributions: -Therefore, the minimum value*of..,C:11. dannetbe-.010,
.
even
wiTtetallyrandom reSpOnsee.to each item; and 1Whea-oniydichotommis-itemeare-useditC .6.111120t than
" ,
-"...:112 order...to correctfor these deficiencles,-Menzel developed another coefficient,
Called the."coefficient of scalability". The formula for this
ErrorsCoefficient of Scalability (C.S.) = 1 - Maximum.Errors
where the maximum number of possible errors-is defined (for dichotomoue:.:data ) as .the
.of,:thenon.rmodal (least frequent) reepOnses over all cases, or the.sumi:'of hon-dodals.,:
over all items, whiChever is smaller: (Note:that the number:of nolimOdale.::for both caees,and_iteMs...ie independent of tEgi7.7ingement of .the data: It 'is simply the nOmber of:
.reepOnsesAn the.minority category.) C.S. can range from :00 to 140., and exCepi forperfect scales (where both are 1.00) will'always be smaller than C.R.- Wenzel suggests aminimUm acceptable level of .60 to .65.. The latter value is now generally:employed.
, ..
. For a given set of' data, the denominators in the formulas for both.C.R.. and C.S.
.are fixed; but the number of errors (the numeratore) is ,a:fUnction of the arrangement of
items and cases in the overall pattern. Erroreare those. responseewhich are "out of -
place" with respect to a perfect scale pattern. While,there:ieno.disagreementMn what :
constitutes a perfect scale, there is, paradoxically, considerable controversy over just
.what constitutes a deviation (error) from the ideal'pattern. As the.diffeient methods qfcounting errors can result in quite different coefficients, the two mest COmMon enes--c
the Cornell and theGoodenough techniques--deserve some detailed attention.
The Cornell Technique. To beginAvith, it is necessary to.examine more closely the
properties of the perfect scale. As the exaMple in Table 1 shows, if.columns are arranged
from right to left and rows from top to bottom in descending order of the number ofpositive ("1") responses, the result is a patterned configuration of items and cases such
that there are clear and unambiguous boundaries, or cutting points, between the l's and
O's for every row and simultaneously for every column in the data matrix. Although the
cutting points in this example can easily be located by inspection, precisely the same
result would be obtained by counting the number of positive responses for each ease and
placing the cutting point that many positions over from the left-hand margin or the table.
Similarly, item cutting points could be located by counting down from the top the same'
number of positions as there are positive respoases for that item. This fact may seem
trivial, but its importance in the actual construction of scales from an unordered data
matrix will presently become clear.
A set of hypothetical data is givi?.n in Table 2. This Jc.- a data matrix "as it
comes", that is, before any attempt has been made to rearrange rows and columns to fit
the scalogram pattern. How might we proceed in determining if thie data forms a Guttman
scale?
Since in the perfect case the arrangement is a simple function of the column and rowfrequencies,we might begin by arranging the data in Table 2 according to these criteria.Reordering the cases so that the ones with the most frequent positive responses are placed
at the top of the matrix, and the items w 1 the mout popular ones ., the left, we arrive
at the pattern shown in Table 2a.
Clearly these data do not form a perfeet scale; for items A and F, l's are scattered
among the O's and O's among the l's. The objective of tho Cornell technique is to minimizethe number of l's and O's which are "out of plczt!"--1= otY.eir words, the number of errors.
To do this, we reorder both cases and items until any iurtiAtr rrshuffling will not result
in additional reduction of error. This is a repetitive prrNIVP)A,- and if there are many
cases and/or items it can be very tedious if done by hand, ilthough the method itself is
quite simple. The folloWng step-by-step procedcres may prove helpful.
60

55
Table 2. Hypothetical Data Matrix
ItemsFrequency
Cases ABCDEF (by 'rows)
1 0 0 1 1 0 1 3
2 1 0 1 1 0 0 3
3 0 0 0 1 0 0 1
4 11 1 1 1 1 6
5 1 0 0 1 0 0 2
6 0 0 0 1 0 1 2
7 0 0 0 0 0 0 0
8 1 1 1 1 0 0 4
9 1 0 0 1 0 1 3
10 1 1 1 1 1 0 5
Frequency(by columns)
6 3 5 9 2 4
Table 2a. Data Arranged by Row and Column Frequency
Items
Cases DACFBE Frequency(by rows)
4 1 1 1 1 1 1 6
10 1 1 1 0 1 1 .5
8 1 1 1 0 1 0 4
1 1 0 1 1 0 0 3
2 1 1 1 0 0 0 3
9 1 1 0 1 0 0 3
5 1 1 0 0 0 0 2
6 1 0 0 1 0 0 2
3 1 0 0 0 0 0 1
7 0 0 0 0 0 0 0
Frequency(by columns)
9 6 5 4 3 2
61

56
Steps for Constructing a Scale (Cornell Technique)
:From-the original table or codeSheet containing the data coded 0 and 1, construct a_hew table, arranging the columns ef data so that the item with the highest positivefrequency is on the left,'followed by the remaining items in descending frequency
I order. Be sure to label rows and columns so you can keep track of them. The orderingamong tied items is immaterial,*
, 2.. ilake-iittother-table., Irrangliiethe rows of the table produced in (1) se that the casewith the Ilighest positive freqUency is on top, the case. with the next highest fre-quency second, etc.
Find the cutting points for both cases and items. This is the point between two cellsof the ,table-which divides most of the l's from,most of the O's. 'Each 1 0 patternrepresents a potential.cutting point. The one to choose is the one which minimizesthe error for that case or item.
The errors for a given row is determined by the number of l's to the right of the .
cutting point plus the number of O's to the left of lt. For columns it is the numberof l's below the cutting point plus the number of O's above it. Should more than oneof the potential cutting points result in-the same minimum number of errors, choosethe one farthest to the left (in the case of rows) or nearest the top (in the case ofcolumns).
In a case such as row (a) below, for example, there are three 1 0 response pairs:CD, EF, and HI. There are therefore three possible cutting points. A decision toplace the cutting point between C and D would produce three errors, as shown in (h);
a.
b.
c.
d.
A B C D E F
1 1 1 0 1 0 1 1 0
1 1 1 : 0 7 0 7 7 0
1 1 1 93 1 : 0 7 7 0
1 1 1 9 1 9 1 1 : 0
between E and F would also produce three errors (c). Placing the cutting pointbetween H and I, however, yields only two errors (d), and is thus the one to choose.
If there had been an additional item, J, with a response of 1, the situation wouldhave been slightly different. Potential cutting points in the series A to I remainas before, only now the 1 at the end of the row furnishes another 1 0 pattern (weimagine another column of O's immediately to the right of J), and thus anotherpossible cutting point;
A B C D EFGHIJe. 1 1 1 : 0 1 : 0 1 1 : 0 1 : (0)
Again counting errors, we get four at CD and EF, and three at HI and J-. Followingthe rule to take the left-most alternative in the case of ties, we pick HI.
The procedure for establishing cutting points for items is identical except thaterrors are O's above the cutting point and l's below it. It helps to mark the rowand column cutting points in preparation for the next step.
*Actually, varying the order of tied items (or cases) will sometimes produce differentnumbers of errors. The only fixed rule to follow is the general one of minimizingerror. But since the optimal ordering will never be known until all possibilities aretried, the minor differences that are likely to result will not in most cases justifythe effort.
62

57
Using the cutting points rather than the positive.frequencieses:theguide, repeatstepsAlYand (2). That is, the columns should be rearranged '(if:necessary) so that:.the one with the-longest series of l's (with the cuttingpoint.nearest'..tO the bottomof tka.Co1umn) is at the.left'of the table, while the one with-the-shortest series of-l'sf(With the cutting point nearest the top) is on the right. In Still another table,rearrange the rows so that the longest series of l's are at the top, and the.shortestat the bottom.
Repeat as often as necessary. The optimum arrangement is reached wben no case has acutting point further to the left than any case below it,.and no iteM'S tutting peilitis below that of an item to its left. This is the position at which a furtherrearrangement of rows or columns will not further reduce the amount of error.in thescale
5. Calculate coefficients of reproducibility and scalability as follows:
(a) Count the total number of errors in the scale. An error is a 1 in any row whichis to the right of the cutting point or a 0 which is to the left of the cuttingpoint. Write the number of errors in each row next to the row, and sum them.
(b) Count the number of non-modals for each row and column and write them down.The "non-modal" for a row or column is the frequency of responses in thesmallest category (either l's or O's). If there is an equal number of l's andO's in a row or column, the non-modal is simply the frequency in either category.
Find the total number of non-modals for all rows, and the total for all columns.
(c) Calculate the total number of responses (both O's and l's) in the table bymultiplying the number of columns times the number of rows.
errors(d) Using the formula C.R. = I total responses'
compute the coefficient of reprodue-
ibility. The minimum acceptable value for a good scale is .90.
(e) Compute the coefficient of scalability using C.S. = 1 maximumwhere theerrors
errors'maximum possible number of errors in the table is equal to the smallest of the-two figures arrived at in (b), i.e., the smallest sum of non-modals. The minimumacceptable value is .65.
6 If C.R. and C.S. meet the minimum requirements, your data may be regarded as scalable,and you can assign scores to each of your cases. The scale score for each case isfound by counting the number of positions to the left of the cutting point in each row--including any possible O's, which are regarded as deviations from the case's "true"scale position.
We can illustrate these steps using the data shown in Table 2 above.
63

58
Step 1. Arrange columns according to their positive frequencies......
Step 2.
Table 3a.
Cases
1
2
3
4
5
6
7
8
9
10
Frequency(by columns)
Rearrange Table 3a
Table 3b.
Data Arranged by Column Frequency
Items
D A C F B E Frequency(by rows)
1 0 1 1 0 0 3
1 1 1 0 0 0 3
1 0 0 0 0 0 1
1 1 1 1 1 1 6
1 1 0 0 0 0 2
1 0 0 1 0 0 2
0 0 0 0 0 0 0
1 1 1 0 1 0 4
1 1 0 1 0 0 3
1 1 1 0 1 1 5
9 6 5 4 3 2
according to positlye frequencies of rows.
Data Arranged by Row and Column Frequency
Items
Cases D A C F B EFrequency(by rows)
4 1 1 1 1 1 1 : 6
10 1 1 1 0 1 1 : 5
8 1 1 1 : 0 1 0 4
1 1 0 1 1 : 0 0 3
2 1 1 1 : 0 0 0 3
9 1 1 : 0 1 0 0 3
5 1 1 : 0 0 0 0 2
6 1 : 0 0 1 0 0 2
3 1 : 0 0 0 0 0 1
7 : 0 0 0 0 0 0 0
Frequency(by columns)
9 6 5 4 3 2
Step 3. Find the cutting points. These are shown in Table 3b, with a colon (:)indicating cutting points by rows, and underlining showing cutting points by
columns. Note that for this example the ordering by cutting points does notcorrespond exactly with the ordering by positive frequency.
6 4

59
Step 4. Using the cutting points rather than frequencies, repeat Steps 1 and 2.
Table 3c.
Cases
Data Arranged by Column Cutting
Items
Points
Frequency(by rows)
D A CBEF4 1 1 1 1 1 1 : 6
10 1 1 1 1 1 : 0 5
8 1 1 1 1 : 0 0 4
1 1 : 0 1 0 0 1 3
2 1 1 1 : 0 0 0 3
9 1 1 : 0 0 0 1 3
5 1 1 : 0 0 0 0 2
6 1 : 0 0 0 0 1 2
3 1 : 0 0 0 0 0 1
7 : 0 0 0 0 0 0 0
Frequency(by columns) 9 6 5 3 2 4
Table 3d. Data Arranged by Row Cutting Points
Items
Cases D ACBEF Frequency(by rows)
4 1 1 1 1 1 1 6
10 1 1 1 1 1 0 5
8 1 1 1 110 0 4
2 1 1 lJ0 0 0 3
9 I 1 0 0 0 1 3
5 1 1 0 0 0 0 2
1 1 0 1 0 0 1 3
6 1 0 0 0 0 1 2
3 1 0 0 0 0 0 1
7 [0 0 0 0 0 0 0
Frequency9 6 5 3 2 4(by columns)
Table 3d represents the optimal row and column ordering and the connected cutting pointsexhibit the characteristic stair-step pattern. With some data it is necessary to repeatSteps 3 and 4 more than once.
6 5

60
Step 5. Calculate coefficients and assign scale score.
Table 3e. Completed Scale Shcming Errors, Non-Modals,Coefficients, and Scale Scores
Items
Frequency(by rows)
Non-Moda1s(across) ScoresCases D A CBEF
4 1 1 1 1 1 1 6 0 6
10 1 1 1 1 110 5 1 5
8 1 1 1 110 0 4 2 4
2 1 1 110 00 3 3 3
9 1 1 0 0 0 / 3 3 2
5 1 1 0 0 0 0 2 2 2
1 1 0 X 0 0 X 3 3 1
6 1 0 '0 0 0 X 2 2 1
3 1 0 0 0 0 0 1 1 1
7 0 0 0 0 0 0 0 0
Frequency 96 5 3 2 4
(by columns)
Non-Modals1 4 5 3 2 4
(down)
Errors 0.0 1 0 0 3
TOTALS: Non-modals down = 19; across = 17; errors = 4
Coefficient of Reproducibility = 1 - (4/(6x10)) = .933
Coefficient of Scalability = 1 - (4/17) = .765
The Goodenough Technique. For some, the Cornell method rests too heavily on thesubjective judgement and experience of the analyst, on rules of thumb and arbitrarydecisions. They criticize the minimization-of-error criterion, and the data manipulationwhich it implies, as a type of cheating, in the sense that by way of such manipulationone consciously attempts to improve the odds in favor of a preferred outcome. There isanother set of procedures, usually called the Goodenough technique, which is more straight-forward in its error counting rules and permits less manipulation of the data.
It will be recalled that in a perfect Guttman scale the cutting points correspondperfectly to the number of positive responses for both items and cases. If the items areordered from left to right according to their decreasing popularity, all cases having onlyone positive response will have l's only in the left-most column, and O's in all othercolumns. If two items are present in a given case, they will necessarily be those twowhich are the "easiest'2, and therefore the most frequent, and therefore the ones whichwere placed farthest to the left when the items were ranked by positive frequency. This' ,
characteristic becomes the standard according to which cutting points are established,. and errors counted, using the Goodenough technique.
Once the items are arranged according tO their popularity, no further shuffling ispermitted. Cases may be ordered for convenience in detecting patterns of irregularity,but this is unnecessary for determining scale scores. The scores are simply the numberof positive responses for each case. Errors are counted according to whether the l's andO's for each case conform to the pattern expected from their scores.
Table 4 shows the data matrix after it has been arranged by row and column frequency,and is identical to Table 2b. (As already noted, the rearrangement by row frequency isunnecessary, but it makes error counting easier, and facilitates comparison with theCornell technique.)
66

Cases
61
Table 4. Final Scale Using Goodenough Technique
Items
ACFBE Frequency Non-Modals(by rows) (across) Scores'
4 1 1 1 1 1 1 : 6 0 6
fo 1 1 1 p 1: A 5 1 5
8 1 1 1 0 : X 0 4 2 4
1 1 0 1 : X 0 0 3 3 3
2 1 1 1 : 0 0 0 3 3
9 1 1 0 : X 0 0 3 3 3
5 1 1 : 0 0 0 0 2 2 2
6 1 p : o x o 0 2 2 2
3 1 : 0 0 0 0 0 1 1 1
7 : 0 0 0 0 0 0 0 0 0
Frequency(by columns)
Non-Modals(down)
6 5 4 3 2
1 4 5 4 3 2
Errors 0 2 1 5 1 1
TOTALS: Non-modals down = 19; across = 17; errors = 10
Coefficient of Reproducibility = 1 - (10/(6x10)) = .833
Coefficient of Setflability = 1 - (10/17) = .412.
The location of cutting points is very simple. If a case has a score of 4, then l'sshould be found in (and only in) the first four positions on the left. These positionscorrespond in Table 4 with Items D, A, C and F. The cutting point, therefore, liesbetween Items F and B. Case 8, with a score of 4, has a 0 for Item F which'"should be"a 1 (because it is to the left of the cutting point), and a 1 for Item B which "shouldbe" a 0 (because it is to the right of the cutting point). Both of these responses aretherefore counted as errors. In general, one error is counted for each position where 1is absent but "should be" present, and also for each position where it is present but"should be" absent.
Comparing Tables 3e and 4, we see that the number of errors counted accordinvto theGoodenough criteria is considerably larger than the number using tne Cornell technique.The coefficients of scalability and reproducibility are accordingly quite different.There are also variations in the ranking of,cases, though the differences are rather small.The number of errors in a Cornell scale will ordinarily be smaller than in i Goodenoughscale using the same databecausewith the Cornell technique the explicit objective As tominimize error. Consequeatly, the minimum values of C.R. and C.S. are easier to achieve.
From this point of view, the Goodenough method clearly provides the more.rigorous,test of scalability. The Cornell method,- on the other hand, would appear to make fulleruse of the information contained in the data. The manipulations which the latter'scritics call cheating, its supporters call a more thorough search for a,pattern that inlaybe embedded in the data.
We cannot resolve the issue here. As with most matters of this kind, the decision.must be made by the analyst himself, taking into account the .problem at hand, his data,and his personal preference.
Item Elimination. Two separate but related problems which usually arise in scalogramanalysis concern the elimination of "unscalable" items and the "best" limber of scalableitems to retain in the final scale. An example may help to clarify thest_ -,ssues.
In the example shown in Table 5 we have already taken steps 1-3 above. (We are usingthe Cornell technique.) At this stage, both C.R. and C.S. are slightly below the acceptable
67

Table 5, Scalogram Showing Items with LoIrScalability
Items
CasesABCDEFO1 1 1 1
2 1 1 1
3 1 1 1
4 0 1 1
7 1 1 1
1 1 1
1 1 1
1 f 1
1 1 1
1 1 1
1 1 1
1 1 1
0 0
0 /
8 1 1 1 0 0 0 0 0
9 1 0 0 1 0 0 1 0
10 0 0 1 0 / 0 1 0 0
Errors: 1 0 2 1 2 0
Non.modals
(down)2 2 2 2 3 3
Item C,S. ,50 1,0 0.0 .50 .33 1,0
4 0 2
4 4 5 4
0,0 .75 1,0 .50 1,0 ,87 1,0
TOTALS: Non-modals down g 38; across g 39; errors g 14
C.R. 2 .892 C.S. g .632
69

63
minimum values. In general, this means that the scale as it stands contailts too manyerrors.
As noted earlier, the smaller total nunoer of non-modals is the factor which determinethe maximum possible number of errc.:-rri in t.!.le scale. The number of non-modals for a giveniteia i3 likewise the largest pcsble nrmoer of errors for that item. We can thereforecompute a C.S. for each column anJ use these coerficients as one criterion for eliminat:;:gitems which contribute relatively 5igh proportions of the total scale error.
In Table 5, C.S. for each item has been calculated. We see that items C and G eachhave their maximum possible number of errors, and C.S. for each of them is consequently0.0. Other items have coefficients of scalabilly below the minimum value that woul..1 beacceptable for the scale as a whole. The question is how many items sho,ld be droppetl,and which ones. `;everal factors might be relevant in making this decision.
In the first place, it may well be possible to achieve a satisfactory overall C.S.without dropping all item5 whoso individual C.S.'s are low. Dropping only item G fromTable 5, for instance, pr.,- uceki TiC.2ie 5a. Note that the removal of this item has changedthe overall pattern scmewhat, so that cases 6 and 7 must now be reversed to restore thecharacteristic stair-step configuration. When this is done, the new optimal situation isEl3 is shown in 5b. A recalculation of C.P. and C S. indicate that by eliminating onlyitem G the coefficients have been raised above the, minimtrn values.
Cases
1
2
4
5
ti
7
8
9
10
Table 5a. Table 5 Afte7 Itemovnl of iten G
Items
A PCDEFHIJKLM1 1 1 1 1 1 1 1 1
1 1 1 1 1 1 .. 1 0
1 1 1 1 0 . 1 1 1 1
0 1 1 1 1 1 1 i 1
1 1 0 1 1 1 1 1 0I I I 1 1 1 1 0 o 0
1 1 1 1 1 1 110 01. I 1 1 0 0 0 0 0 1
11 0 0 1 0 0 0 0 0
rb 01 0 1 0 0 1 0
1 1 1
1 1 1 0
I 1 0 0
1 0 0 0
C., i' 0
0 0 0
0 0 0
0 1 0
0 0 0
0 0 0
Whether this is good enough depends upon what is wanted from the scale, and what price oneis willing to pay in order to achieve the most nearly perfect pattern.
Had we dropped all items with a C.S. below .65, we would have endcti up with the seven-item scale shown in Table 5c. Both scale coefficient*, in Table 5c are very high. It willbe noted, however, that although the scale scores have changed, the ranking of caseshas not, except that whereas no ranks werl tled in 5b, cases 3 and 4 and cases 9 and 10are nov indistinguishable :!rom one anothr.. By dropping the poorer items we have gainedreliabi'ity. The high coe:!ficients i.. E indicate that our ability to predict the exactresponse.s for L.ach case if we know only the item order and the scale scores is now nearlyperfect. But in part this necessarily to, fo.: as the number of possible responsesdecreases, ae probability of predicting correct responses, even by chance, increasescorrespondinsly. In other respects there has been a net loss. We have lost the abilityto distinguish between cases 2 and 4 and between 9 and 10, and the reduced scale indicatesthe ordering of fewer items, and thus has less descriptive value than 5b.
70
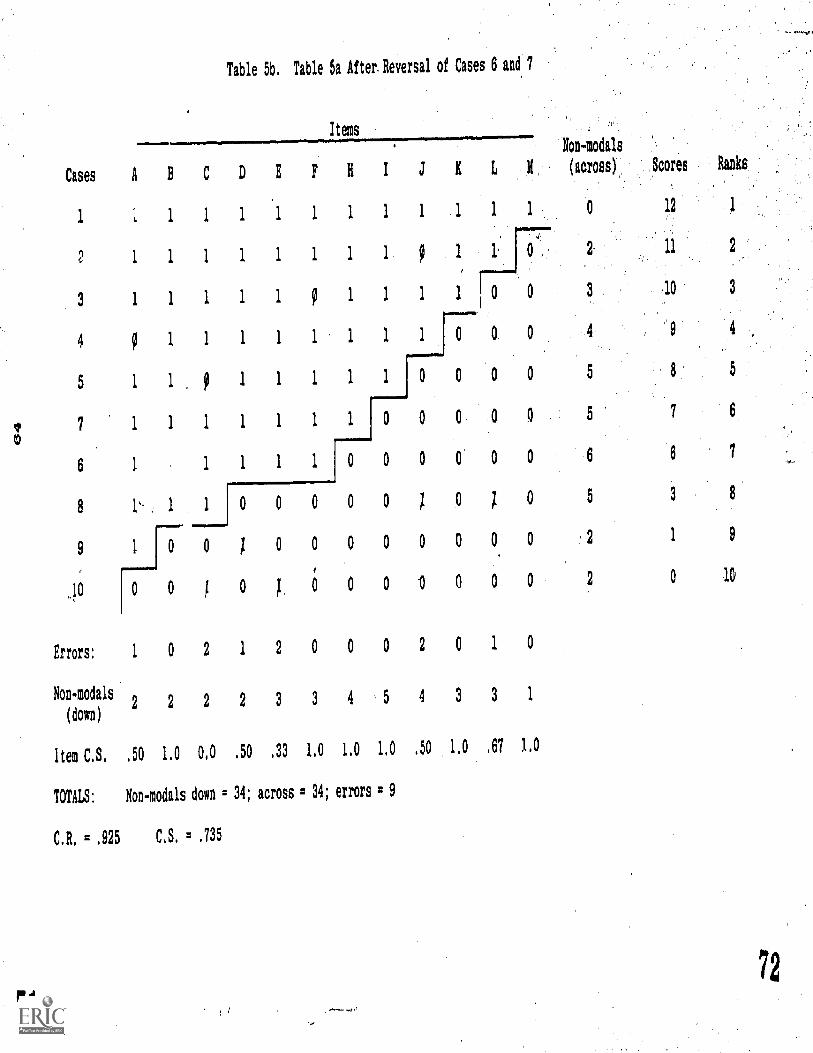
Table 5b. Table 5a After. Reversal of Cases 6 and 7
CasesABCDEFRI1
Items
11111111111111111011111 1 01111
4 9 1 1 I 1 1 1 1 1
5 1 10111110tn
7 1 1 1 1 1 1 0 0
6 1 1 1 1 1 0 0
8 1 1 0 0 0 0 0
IMMII=N"
9 1 0 0 0 0 0 0 0
10 0 0 0 0 0 0 '0
Errors: 1 0 2 1 2 0 0 0 2
Non.modals
(down)2 2 2 2 3 3 4 5 4
Item C.S. .50 1.0 0,0 .50 ,33 1,0 1.0 1,0 .50
TOTALS: Non.modals down = 34; across 34; errors : 9
C.R, = .925 C.S. = .735
71
Non.modals
(across) Scores Ranks
0
o
0
0
0
0
0 0
0
0 0
0 0
0 5 8 5
QH 5 7 6
0 6 6 7
0 5 8
0 2 1 9
0 2 0 10,
0 1 0
3 3 1
1.0 .67 1,0
72

65
Table 5c. Scale After Dropping All Items with C.S. Below .65
Items
Cases BEHIK1
2
3
4
5
7
6
8
9
10
Errors:
Non-Modals(down)
1 1
1 1
1 1
1 1
1 1
1 1
1 1
1 10
0 0
0 0
0 0
2 3
1 1 1
1 1 I
1 1 1
1 1 1
1 1 1 0
1 1 0 0
10 0 0
0 0 0
0 0 0
0 0 0
Non-modals(across) Scores Ranks
0 7 1
1 6 2
2 5 3.5
O 0 2 5 3.5
O 0 3 4 5
O 0 3 3 6
O 0 2 2 7
X O. 2 1 8
O 0 0 0 9.5
O 0 0 0 9.5
0 0 0 1 0
4 5 4 3 I
Item C.S. 1.0 1.0 1.0 1.0 1.0 .67 1.0
TOTALS: Non-modals down = 22; across = 15; errors = 1
C.R. = .986 C.S. = .933
The foregoing reduces to the single questionofwhether an item with low scalabilityactually "belongs" in the scale. Unfortunately, as the discussion has suggested, thereare no absolute criteria for answering the question either yes or no. In the end, thedecision will probably depend primarily on the relative importance, for the particularjob at hand, of the content of the scale as against the scale itself as a numericalmeasure of some variable or dimension.
Quite often more than one item will discriminate the same cases in a scale. Thesescale equivalents are uselest for ranking cases on the scaled variable, but, other -thingsbeing equal, it generally makes little difference whether they are dropped or retained.An argument for the retention of equivalents is that, from a purely technical point ofview there is little basis for deciding which of an equivalent set to keep and which toeliminate.
There are tAmes, however, when equivalent items are somewhat more prot. !nzi.ti.c. Aswe have already nttl,,6, the Guttman scaling technique produces only an ordi-gaI ranki,.Jg ofscale scores. Thia means that one cannot say that the interval between, say, scores of5 and 6 is equAl to the interval between scores of 10 and 11. And since tar cgl1-interval property is one of the assumptions underlying many common statistical operations,such operations are not, strictly speaking, appropriate for ordinal-level data.
Nevertheless, it is sometimes possible to assume that the ordinal scale approximatesinterval-level measurement, and to use parametric techniques to determine correlations orother statistical relationships. Special consideration should be given in such cases tothe question of whether to include equivalent items. This is because the distancesbetween scores, now assumed to represent meaningful distances on an interval scale, canbe changed quite arbitrarily merely by including or excluding equivalent items. Table 5above, for instance, includes three sets of equivalents: items B and C, items D, E, andF, and items G, H, and I. The interval between the highest score (13) and the lowest (0)is 13 "suale units", if we assume interval measurement. If.we were to drop all but oneof the items in each equivalent group, however, case 1 would have a score of 8, case 10would still have a score of 0, but the interval between the two cases would have beenreduced from 13 to 8 "scale units". Intervals between most other pairs of scores wouldhave changed also, only not necessarily by equal, or even proportional, amounts. The rankorder of cases, on the other hand, remains unaffected,
7 3

66
....Since parametric statistics are sensitive to scale distances, whether .oraot equivalentitems aie included will affect the relationship between the Guttmaa Scale and othekVariables; as measured W these statistics. This beiag.so, it may'be advisable to exclude-equivalentS itparametric methods of analysis areto.he used. -.
It goes without saying that this brief paper cannot claim to have covered all therelevant and Important issues relating to scalogram analysis..' -We have taken what is kriównas-the "cookbook" or "how to" approach, concentrating onpractical and mundafie mattersand largely neglecting theoretical arid tochnical-questions such aw'signi.ficance tests,.interitem correlations, etc. .
The exclusion of these issueS is not to .Miaimize 'their'importance; it is merely to-recognize thelimitsor the writer's competence.and the need-.-to keep.the discussion within reasonable bounds. :Treatment of the more .complex,issues'is to be found in the readings listed at the end of this. section.
7 4
mr.
2

67
Selected Readings on Guttman Scaling
Chilton, Roland J. "A Review and Comparison of Simple Statistical Tests for ScalogramAnalysis". American Sociological Review 34:2 (September 1959), pp. 237-243.
Edwards, Allen L. Techniques of Attitude Scale Construction. New York: Appleton-Century-Crofts, Inc., 951. Chapter 7.
Goodman, Leo A. "Simple Statistical Methods for Scalogram Analysis". Psychometrika24:1 (March 1958), pp. 29-43.
Green, Bert F. "A Method of Scalogram Analysis Using Summary Statistics". Psychometrika21:1 (March 1956), pp. 7r q8.
Guttman, Louis. "The Basis for Scalogram Analysis" and "The Relation. of ScalogramAnalysis to Other Techniques". Chapters 3 and 6 in Samuel A. Stouffer, et.al.,Measurement and Prediction. Princeton, N.J. Princeton University Press, 1950.
Menzel, Herbert. "A New Coefficient for Scalogram Analysis".17:2 (September 1953), pp. 268-280.
Mokken, R.J. A Theory and Procedure of Scale Analysis. The Hague, Paris: Mouton, 1971.

68
BIBLIOGRAPHY
A.I.D. Bibliography Series: Technical Assistance Methodology No. 2, "Social Indicators"prepared by Technical Assistance Methodology Division Bureau for Technical Assistance
(December 15, 1972).
Belcher, John C. "A Cross-Cultural Household Level-of-Living Scale," Rural Sociology,
Vol. 37, No. 2, June 1972.
Belcher, John C., Crader, Kelly W. and Vazquez-Calcerrada, Pablo B., "Determinants ofLevel of Living in Rural Puerto Rico," Rural Sociology, Vol. 38, No. 2, Summer 1973.
Chapin, F. Stuart. "Contemporary American Institutions," New York, Harper, 1935.
Chassy, Judith Price, Veen, A.G. van and Young, F.W. "The Application of Social ScienceResearch Methods to the Study of Food Habits and Food Consumption in an Industri-alizing Area," The American Journal of Clinical Nutrition, Vol. 20, No. 1, January,
1967, pp. 56-64.
Development Academy of the Philippines. "Measuring the Quality of Life: Philippine
Social Indicators," 1975.
Engberg, Lila E. "Household Differentiation and Integration as Predictors of Child
Welfare in a Ghanaian Community," Journal of Marriage and the Family, May 1974.
F.A.O. Manual on Household Food Consumption Surveys, Rome, 1962.
Guthrie, Helen A, Owen, George M. and Guthrie, George "Factor Analysis or Measures ofNutritional Status of Pre-School Children," The American Journal of Clinical
Nutrition 26, May 1973, pp. 497-502.
Harbison, Frederick H., Maruhnic, Joan and Resnick, Jane R. "Quantitative Analyses ofModernization and Development," Princeton, New Jersey: 1970.
Jogaratnam, Thambapillai and Poleman, Thomas T. "Food in the Economy of Ceylon,"Cornell International Agricultural Development Bulletin 11, October 1969.
Larkin, Frances A. "Household Structure and Children's Health in Ghana," Unpublished
Ph.D. Thesis, Cornell University 1968.
Larkin, Frances, Owen, Carol and Rhodes, Kathleen. "The Differentiation of Households
in a Ghanaian Community," Journal of Marriage and the Family, Vol. XXXII, No. 2,
May, 1970.
Poleman, Thomas T. "The Food Economies of Urban-- m.tuu4=-nrrmt.m..- auv ymov vI Ghana,"Food Research Institute Studies, Vol. II, No. 2, May, 1961.
Ramsey, Charles E. and Jenaro Collazo. "Some Problems of Cross-Cultural Measurement,"Rural Sociology, 25 (March 1960), pp. 91-106.
Reissman, Leonard. "Inequality.in American Society" (Social Stratification), Glenview,
Illinois: Scott, Foresman and Company, 1973.
Rigor, Amparo G. "Family and Barrio Differentiation in Nueva Ecija, Philippines,"Unpublished Ph.D. Thesis, Cornr11 University 1971.
Schlegel, Charles C. "Two Simple Scaling Techniques: Guttman Scales and Summed T
Scores," 1974.
Sewell, William H. "The Construction and Standardization of a Scale for the Measurement
of the Socio-economic Status of Oklahoma Farm Families," Stillwater, OklahomaAgricultural Experiment Station Technical Bulletin 9, 1940.
Sharp, Emmit F. and RamsLy, Charles E. "Criteria of Item Selection in Level of LivingScales," Rural Sociology, Vol. 28, No. 2, June, 1963.
Sheldon, Eleanor Bernert and Parke, Robert. "Social Indicators," Science, Vol. 188,
May, 16, 1975.
76

69
BIBLIOGRAPHY-Continued
Simmons, Emmy Bartz and Poleman, Thomas T. "The Food Balance Sheet as a Parameter ofTropical Food Economies: The Case of Mauritius," Cornell International AgricultureBulletin 29, June, 1974.
Slater, Charles C. et.al. Marketing in Developing Communities Series: Research ReportNo. 2, "Market Processes in the Recife Area of Northeast Brazil," Michigan StateUniversity, Latin American Market Planning Center, 1969.
Smith, David M. "The Geography of Social Well-Being in the United States," McGraw-HillBook Company, 1973.
Wilcox, Leslie D., Ralph M. Brooks, George M. Beal and Gerata E. Rlonglan. "SocialIndicators and Social Monitoring: An Annotated Bibliography," Amsterdam, TheNetherlands, Elsevier Publishing Co., 1972.
World Bank. "Rural Sector Policy Paper," 1975.
Young, Frank and Young, Ruth C. "The Differentiation of Family Structure in RuralMexico," Journal of Marriage and the Family, February 1968.
Young, Ruth C. and MacCannell, Dean. "Predicting the Quality of Life in the UnitedStates." Mimeographed, 1976. Presented at Rural Sociological Society Meetings,1974.
10

70
FOOTNOTES
1 For bibliography of the social indicators movement see Leslie D. Wilcox, Ralph M.Brooks, George M. Beal and Gerald E. Klonglan, "Social Indicators and Societal
Monitoring: An Annotated Bibliography," Amsterdam, Elsevier Publishing Co., 1972,or for a shorter list A.I.D. Bibliography Series: Technical Assistance MethodologyNo. 2, "Social Indicators," Agency for International Development, Department of
State, 1972.
2. For a detailed description of how to conduct such a study see "Manual on HouseholdFood Consumption Surveys," Food and Agriculture Organization of the United Nations,
Rome, 1962. Agricultural economists also use the household food budget for this-purpose and this is described in Simmons, Emmy Bartz, and Poleman, Thomas T. (1974).
3 For a description of several such studies see Young, F.W. and Young, R.C. (1973),
pages 51-52.
78

THE EAST-WEST CENTER is a national educational institution estab-lished in Hawaii by the U.S. Congress in 1960 to "promote better relationsand understanding between the United States and the nations of Asia and thePacific through cooperative study, training and rer:uh."
Each year the East-West Center brings together more than4,500 men andwomen from the many nations and cultures of these regions. They work andstudy together while exchanging ideas and experiences in cooperativeprograms seeking solutions to important problems of mutual concern to Eastand West. For each participant from the United States in Center programs,two participants are sought from the more than 60 countries and territories inAsia and the Pacific area.
Five institutes with international, interdisciplinary academic and profes-sional staffs conduct the East-West Center's problem-oriented programs.East-West areas on which Center programs are focused include communica-tion across national barriers, culture and language learning, food systems,population dynamics, and technological adaptation in development& pro-cesses aimed at improving the quality of life. Each year the Center awards alimited number of Open Grants for graduate degree education and innovativeresearch by Senior Fellows in areas not encompassed by institute programs.
The Center is directedThy the Board of Governors of a public, non-profiteducational corporationknown as "The Center for Cultural and TechnicalInterchange Between East and West, Inc."created by the Hawaii StateLegislature in 1975. The U.S. Congress provides basic funding for Centerprograms and a variety of scholarships, fellowships, internships and otherawards. Additional cost-sharing of programs and participants is worked outwith Asian/Pacific governments, regional agencies, private enterprise andfoundations. The Center is situated on lard adjacent to and provided by theUniversity of Hawaii, which conducts classes and grants degrees fordegree-seeking East-West Center students who also are involved in theCenter's problem-oriented programs.
79