A N N U A L R E P O R T - Cision
67
2 4 ANNUAL REPORT
-
Upload
khangminh22 -
Category
Documents
-
view
2 -
download
0
Transcript of A N N U A L R E P O R T - Cision

2 4
A N N U A L R E P O R T
SALES140
120
100
80
60
40
20
02000 2001 2002 2003 2004
RETURN ON EQUITY
2000 2001 2002 2003 2004
US D
ollars in Millions
NET PROFIT16
14
12
10
8
6
4
2
0
2000 2001 2002 2003 2004
DISTRIBUTION OF SALES BY REGION
North America 53%
Europe 26%
Other Markets 7%
US D
ollars in Millions
EARNINGS PER SHARE7
6
5
4
3
2
1
02000 2001 2002 2003 2004
R&D EXPENSES*
*According to the company’s accounting policy all R&D costs are expensed.
10
9
8
7
6
5
4
3
2
1
0
2000 2001 2002 2003 2004
US C
ent
US D
ollars in Millions
K E Y F I G U R E S
Scandinavia 14%
50%
40%
30%
20%
10%
0%
For the second year in a row, Ossur earne d plaudits for good investor relations at the annual awards ceremony of Investor Relations Magazine,held in Copenhagen in May 2003.
The Company established in Reykjavík by Ossur Kristinsson, prosthetist, together with several organizations of the disabled in Iceland.
Ossur granted its first patent.
Ossur listed on the Iceland Stock Exchange.
Ossur acquires Flex-Foot Inc., PI Medical AB, Karlson & Bergström AB and Century XXII Inc.
A new computer-controlled Patient Activity Monitor (PAM) developed to measure the
activit y level of prosthetic users was launche d in May. The tool assists prosthetists in
selecting the appropriate products for their patients.In late September 2003 Ossur hf. acquired
Generation II Group, a leading company in the design and manufacture of knee braces in
North America. A new range of ankle braces was also launched, making September a
milestone month in Ossur’s expansion into the orthotics market.
Ossur introduces a line of cosmetic hands base d on the technical expertise of the Swedis h compan y Linea Orthopedic, acquired by Ossur in 2003.
O S S U R M I L E S T O N E S

T A B L E O F C O N T E N T S
Ossur withdrew from all its business activities in Dayton, Ohio, selling its subsidiary, Mauch
Inc., and thereby all the manufacturin g equipmen t and business relationships relatin g
to components for spinal implants.
ANNUAL REPORT 2004
02 Taking the Initiative, CEO‘S Address
04 Values
05 Mission Statement
05 Quality Policy
05 Financial Goals
06 The Market
08 Operations 2004
08 Board of Directors
08 Focus on Innovation
08 Increased Production Capacity
08 Quality System
09 Customer Satisfaction Survey
09 Important Structural Changes in
North America
11 Steady Organic Growth in Europe
11 Strong Market Share in the Nordic
Countries
11 Growth Opportunities
12 Locations
13 We Care
14 Value Proposition through Innovation
16 The Bionic Future of Ossur
18 Products
23 Human Resources
24 Stocks and Shareholders
26 Performance Overview 2004
CONSOLIDATED FINANCIAL STATEMENTS 2004
32 Financial Ratios
33 Report by the Board of Directors
34 Auditor‘s Report
35 Income Statements
36 Balance Sheets
38 Statements of Cash Flows
40 Notes
The silicone liner, Iceross® Seal-InTM, launched in November 2003, followed by a new version for transfemoral amputees, the Iceross® Transfemoral Seal-InTM, in June 2004. A leading company in liner design and manu-facture, Ossur presses its advantage through the development of a technology which is independent of conventional locking systems. The new sealing technique has generated widespread interest and proven a welcome solution for Ossur customers.
Ossur launches TT Flex-SkinTM, a new cosmetic solution for prosthetic feet.
Ossur sponsors 27 athletes of various nationalitie s competing in the Athens Paralympics on 17-28 September. The team achieved out-standing results at the Games, winning a total of 29 medals, 13 gold, 9 silver and 7 bronze, in addition to setting ten world records. The team’s success and determination provide an even greater incentive for Ossur to excel.
Launch of the Flex-Foot® Axia, an ankle specificall y intended to meet the needs of users of average activity with long residual limbs. The Flex-Foot Axia ankle is designed for improved dynamics and a more natural gait.
October saw the introduction of the Rheo KneeTM, the largest and most complex development
project ever undertaken by Ossur. Based on a totally new design, the knee uses innovative
electronics and hydraulics technology to adjust the motion of the knee to the gait of the user.
Time Magazine voted the knee one of the year’s most amazing inventions and Fortune Magazine
featured it in an article as one of the Best Products of the year.
OSSUR_EN_ARS2005.indd 1 18.2.2005 12:16:49
2
T A K I N G T H E I N I T I A T I V E
Ossur passed several important milestones last year,
successfully launching some new and exciting products
which attracted deserved attention. Market conditions
were favorable and investor interest in Ossur continued
to grow.
AT THE FOREFRONT OF TECHNICAL INNOVATIONFollowing extensive development, Ossur presented to
the world one of the largest and most complex projects
ever undertaken by the Company: the high-tech Rheo
KneeTM, which is not only a brand-new product but also
the first product in the Company’s new Bionic techno-
logy platform. Development and testing of the knee has
taken place over the past four years in a process which
is typical of the outstanding development partner-
ship between Ossur experts and specialists at Dr. Hugh
Herr’s Media Lab at the Massachusetts Institute of
Technology (MIT). The knee attracted deserved atten-
tion. At year-end, Fortune magazine featured the Rheo
Knee in an article on the “25 Best Products of the Year,”
and it was also featured in Time Magazine’s cover story
“Most Amazing Inventions of 2004”.
Another technical innovation of revolutionary promise
is currently being developed in a partnership between
Ossur and the Canadian R&D company Victhom
Human Bionics: a new prosthetic knee system based
on bionic design methods. The knee will be tested in
several selected countries.
The innovations launched by Ossur during the year are
the result of continuous development efforts. They re-
flect the creative energy inherent in the Company and
bear witness to the potential of good partnerships. In-
credible progress in the field of prosthetics has been
made in a relatively short period. Few would have be-
lieved several years ago that we would be where we
are today. Therefore, we must occasionally pause to
consider how far we can go in development. We can of
course not say with certainty what kind of products we
will see in ten to fifteen years, but it is certain that while
Ossur possesses the creative energy characterizing the
Company today, the possibilities appear to be endless.
GROWING MARKETOur initiatives concentrate on introducing products
which truly improve the quality of life of physically dis-
abled people and help them live a life without limitations.
It is estimated that approximately two million people in
the Western world are facing disabilities caused by am-
putation, primarily as a result of various cardiovascular
diseases. The products developed and manufactured
by Ossur offer new opportunities and improve the qual-
ity of life of this growing population.
But Ossur serves a much wider group of people. As the
life expectancy of people in the Western countries con-
tinues to increase, so does the risk of disease, including
osteoarthritis, which is forecast to become a substan-
tially large health threat in the near future. Braces and
other orthotic products make it possible to ease the pain
of people suffering from this disease and improve their
quality of life. The number of people needing Ossur’s
technology and assistance is therefore likely to grow.
DEPENDABLE INVESTORS, QUALIFIED EMPLOYEES, IMPRESSIVE USERSConcurrently with Ossur’s growth in recent years and
the favorable reception of its products, investor interest
has grown. Last spring, William Demant Invest A/S, a
well-known Danish investment company with extensive
involvement in the health technology sector, made the
decision to invest in Ossur hf. Their choice of Ossur
as an attractive investment option is a matter of great
satisfaction to the Company.
Over 600 people of numerous nationalities are now
working for Ossur in seven locations around the globe.
This diverse workforce works extremely well together,
and a workplace audit conducted last year showed that
employees of Ossur are overall very satisfied working for
the Company. The best measure of employee satisfac-
tion is undoubtedly the success of the Company, as a
good working spirit is invaluable to the operation of any
enterprise. Toward the end of last year, we worked on
bringing into sharper focus the values that we incorpo-
rate into our daily work, defining as our core values the
human virtues of honesty, frugality and courage.
Concurrently with Ossur’s growth in recent years and the favorable reception of its products, investor interest has grown. Last spring, William Demant In-vest A/S, a well-known Danish investment company with extensive involvement in the health technology sector, made the decision to invest in Ossur hf. Their choice of Ossur as an attractive investment option is a matter of great satisfaction to the Company.
OSSUR_EN_ARS2005.indd 2 18.2.2005 12:16:50
3
The outstanding performance of the people using
Ossur’s products was also at the center of our attention
last year. In September, we focused on the Paralympic
Games in Athens, Greece. Twenty-seven athletes of
diverse nationalities, all sponsored by Ossur, success-
fully competed in the Games. The athletes won numer-
ous medals, setting a number of world records in the
process. Disabled athletes perform incredible feats,
and it is a matter of great satisfaction that the public is
gaining awareness of their prowess. In October, Sarah
Reinertsen, a member of Team Ossur, became the first
disabled athlete to be featured on the cover of Runner’s
World magazine. This was not only a personal victory for
Sarah, who keeps setting herself ever more ambitious
goals, but also a step in the direction of full recognition
of amputee athletes and their equal status with other
athletes.
Most of the people using our products are not athletes.
Nonetheless, they deserve gold medals for their efforts
and success. Just to learn to walk again, to climb stairs
or go shopping are important victories and deserve our
admiration and respect. For us here at Ossur, these
victories represent a constant incentive in our work.
It has long been Ossur’s mission to exceed customer
expectations and maintain our status as a leading
Company in the field of prosthetics and orthotics. The
victories of last year are confirmation that we have not
deviated from our mission. We intend to continue our
unflagging efforts to help people live Life Without Limi-
tations.
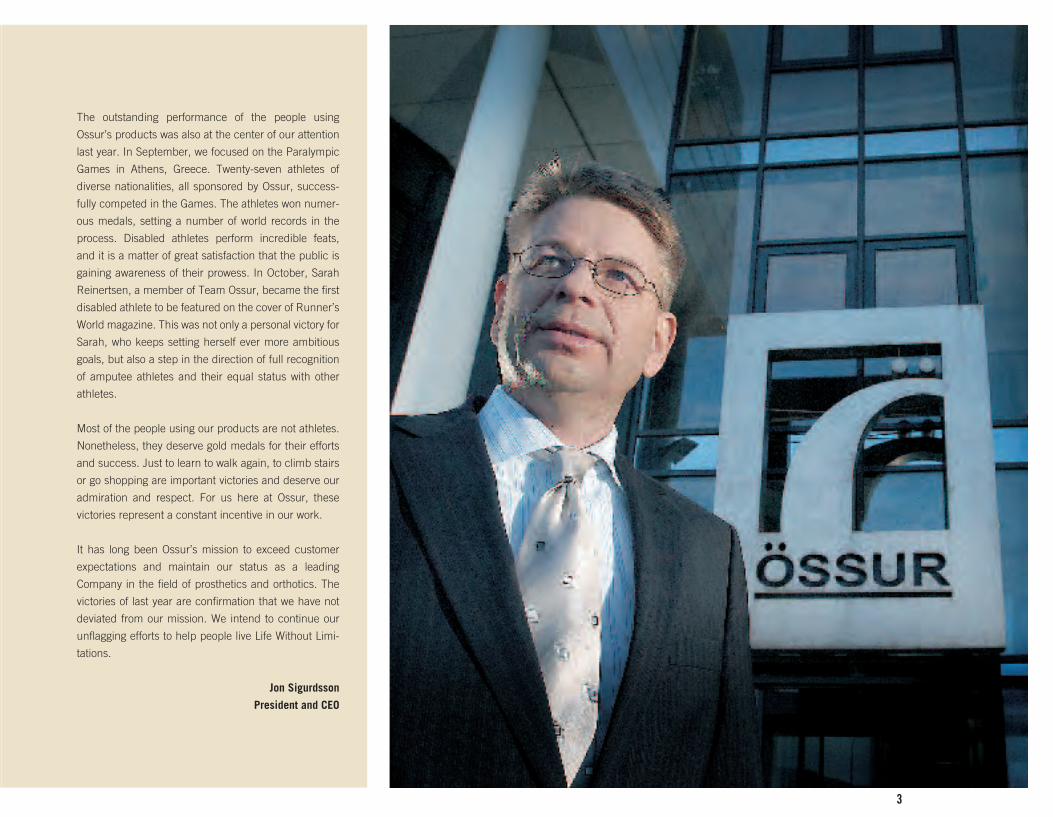
Jon Sigurdsson
President and CEO
OSSUR_EN_ARS2005.indd 3 18.2.2005 12:16:57
4
V A L U E S
Ossur’s corporate culture is characterized by initiative, ambition,
drive and cooperation. In order to promote the working environ-
ment that we wish to maintain, we have set our sights on three core
values:
Honesty – We show respect by adhering to facts and
reality, fulfilling promises and claims, and admitting fail-
ures. We nurture honest communication throughout the
Company by sharing information and respecting each
other’s time and workload.
Frugality – We use resources wisely. We aim to mini-
mize cost across all areas of our business through eff-
ective communication, preparedness, planning and
optimized processes.
Courage – We are open to change and constantly
strive for improvement. We challenge unwritten rules,
show initiative and take risks, while, at the same time,
we take responsibility for our ideas, decisions, and
actions.
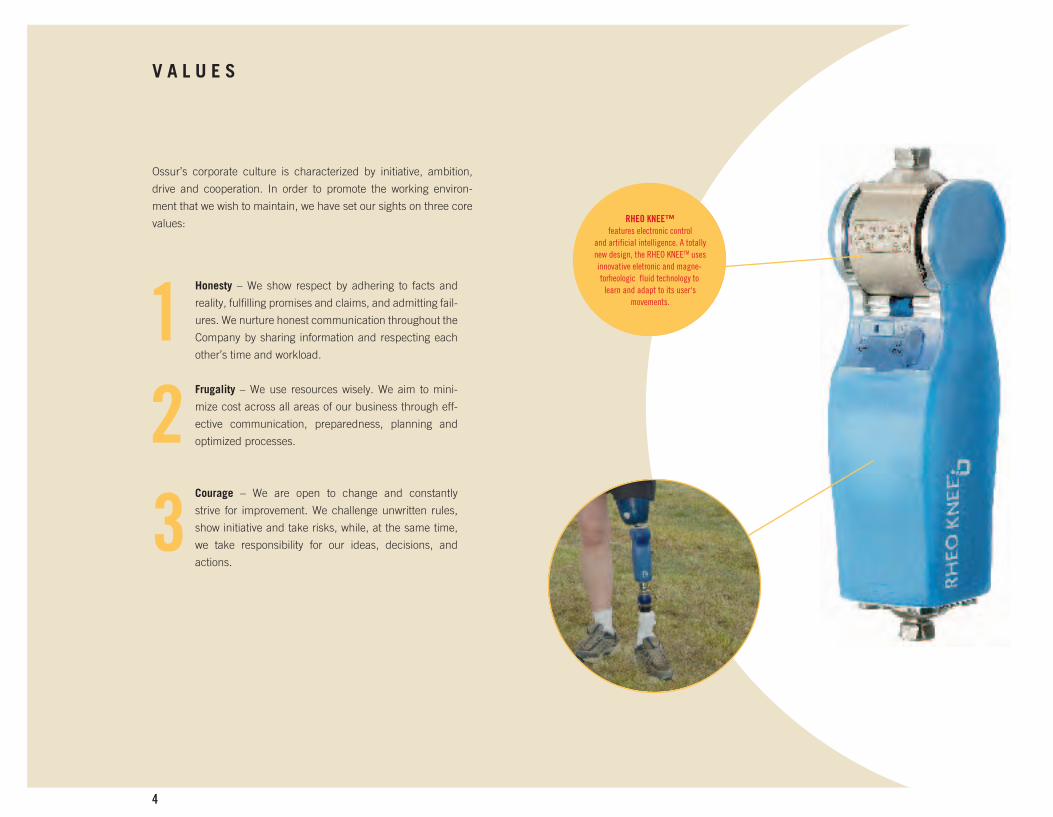
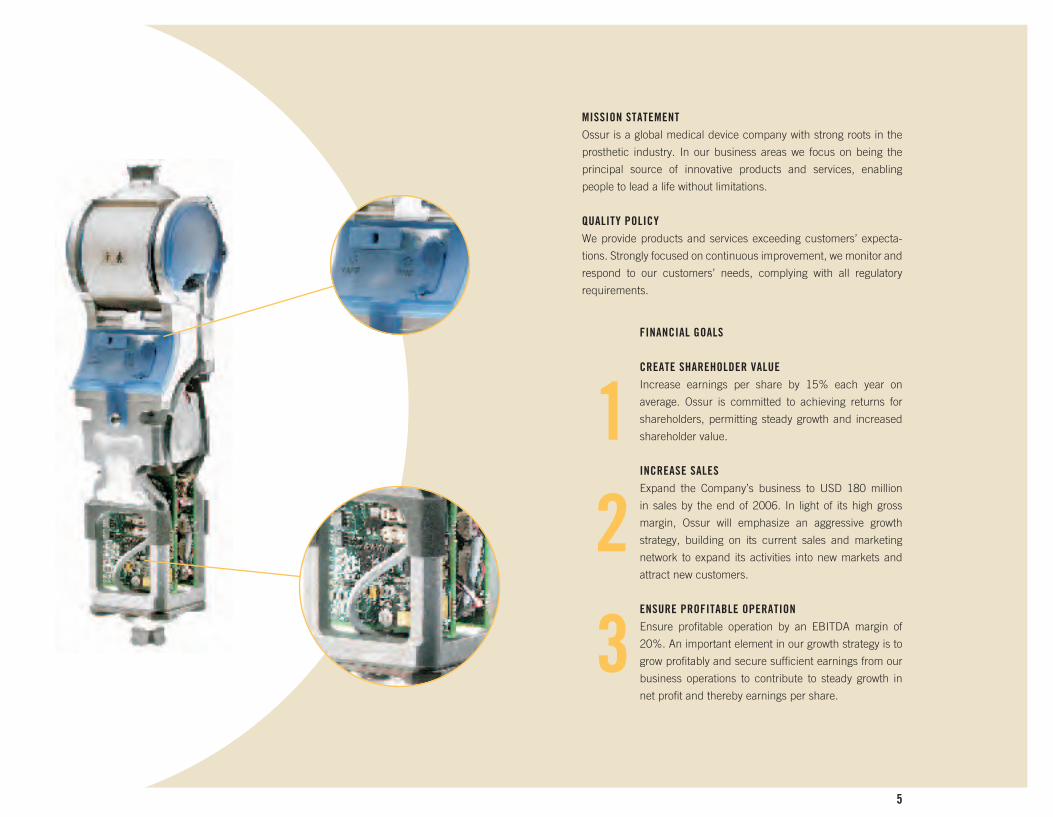
RHEO KNEE™ features electronic control
and artificial intelligence. A totally new design, the RHEO KNEETM uses innovative eletronic and magne-torheologic fluid technology to
learn and adapt to its user‘s movements.
OSSUR_EN_ARS2005.indd 4 18.2.2005 12:17:08
5
FINANCIAL GOALS
CREATE SHAREHOLDER VALUEIncrease earnings per share by 15% each year on
average. Ossur is committed to achieving returns for
shareholders, permitting steady growth and increased
shareholder value.
INCREASE SALESExpand the Company’s business to USD 180 million
in sales by the end of 2006. In light of its high gross
margin, Ossur will emphasize an aggressive growth
strategy, building on its current sales and marketing
network to expand its activities into new markets and
attract new customers.
ENSURE PROFITABLE OPERATIONEnsure profitable operation by an EBITDA margin of
20%. An important element in our growth strategy is to
grow profitably and secure sufficient earnings from our
business operations to contribute to steady growth in
net profit and thereby earnings per share.
MISSION STATEMENTOssur is a global medical device company with strong roots in the
prosthetic industry. In our business areas we focus on being the
principal source of innovative products and services, enabling
people to lead a life without limitations.
QUALITY POLICYWe provide products and services exceeding customers’ expecta-
tions. Strongly focused on continuous improvement, we monitor and
respond to our customers’ needs, complying with all regulatory
requirements.
OSSUR_EN_ARS2005.indd 5 18.2.2005 12:17:13
6
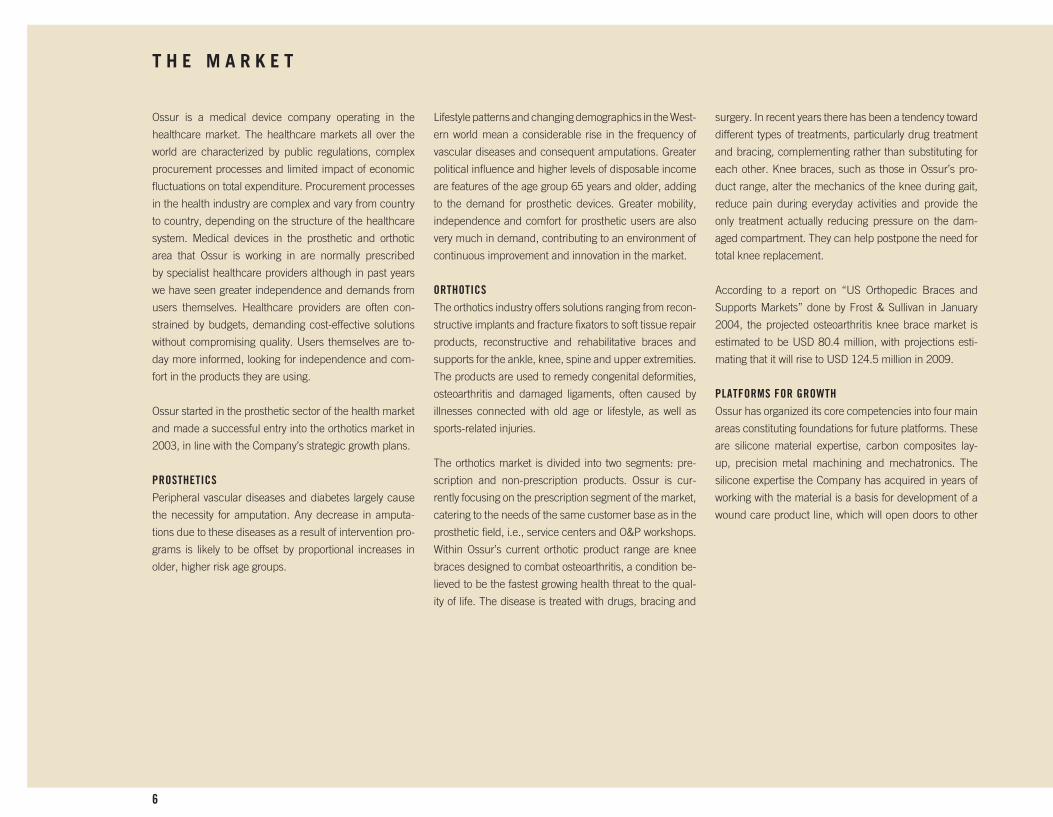
T H E M A R K E T
Ossur is a medical device company operating in the
healthcare market. The healthcare markets all over the
world are characterized by public regulations, complex
procurement processes and limited impact of economic
fluctuations on total expenditure. Procurement processes
in the health industry are complex and vary from country
to country, depending on the structure of the healthcare
system. Medical devices in the prosthetic and orthotic
area that Ossur is working in are normally prescribed
by specialist healthcare providers although in past years
we have seen greater independence and demands from
users themselves. Healthcare providers are often con-
strained by budgets, demanding cost-effective solutions
without compromising quality. Users themselves are to-
day more informed, looking for independence and com-
fort in the products they are using.
Ossur started in the prosthetic sector of the health market
and made a successful entry into the orthotics market in
2003, in line with the Company’s strategic growth plans.
PROSTHETICSPeripheral vascular diseases and diabetes largely cause
the necessity for amputation. Any decrease in amputa-
tions due to these diseases as a result of intervention pro-
grams is likely to be offset by proportional increases in
older, higher risk age groups.
Lifestyle patterns and changing demographics in the West-
ern world mean a considerable rise in the frequency of
vascular diseases and consequent amputations. Greater
political influence and higher levels of disposable income
are features of the age group 65 years and older, adding
to the demand for prosthetic devices. Greater mobility,
independence and comfort for prosthetic users are also
very much in demand, contributing to an environment of
continuous improvement and innovation in the market.
ORTHOTICSThe orthotics industry offers solutions ranging from recon-
structive implants and fracture fixators to soft tissue repair
products, reconstructive and rehabilitative braces and
supports for the ankle, knee, spine and upper extremities.
The products are used to remedy congenital deformities,
osteoarthritis and damaged ligaments, often caused by
illnesses connected with old age or lifestyle, as well as
sports-related injuries.
The orthotics market is divided into two segments: pre-
scription and non-prescription products. Ossur is cur-
rently focusing on the prescription segment of the market,
catering to the needs of the same customer base as in the
prosthetic field, i.e., service centers and O&P workshops.
Within Ossur’s current orthotic product range are knee
braces designed to combat osteoarthritis, a condition be-
lieved to be the fastest growing health threat to the qual-
ity of life. The disease is treated with drugs, bracing and
surgery. In recent years there has been a tendency toward
different types of treatments, particularly drug treatment
and bracing, complementing rather than substituting for
each other. Knee braces, such as those in Ossur’s pro-
duct range, alter the mechanics of the knee during gait,
reduce pain during everyday activities and provide the
only treatment actually reducing pressure on the dam-
aged compartment. They can help postpone the need for
total knee replacement.
According to a report on “US Orthopedic Braces and
Supports Markets” done by Frost & Sullivan in January
2004, the projected osteoarthritis knee brace market is
estimated to be USD 80.4 million, with projections esti-
mating that it will rise to USD 124.5 million in 2009.
PLATFORMS FOR GROWTHOssur has organized its core competencies into four main
areas constituting foundations for future platforms. These
are silicone material expertise, carbon composites lay-
up, precision metal machining and mechatronics. The
silicone expertise the Company has acquired in years of
working with the material is a basis for development of a
wound care product line, which will open doors to other
OSSUR_EN_ARS2005.indd 6 18.2.2005 12:17:14

7
parts of the medical market. Mechatronics, a platform
combining mechanical engineering, electronics and intel-
ligent computer control, is a key development area of the
Company. Rheo Knee is the first result of the innovative
application of Ossur’s technologies combined with latest
advancements in computer science. The Company plans
to continue cooperation in research projects with univer-
sities and research companies in order to maintain the
highest level of innovation in the medical device industry.
COMPETITIONCompetition in the prosthetic and orthotic market, as
in other parts of the medical sector, is characterized by
trends toward consolidation, continuous innovation and
fast technical development. The biggest companies in
the market besides Ossur are the German company Otto
Bock and the US-based orthotics manufacturer DJ Or-
thopedics.
REASONS FOR AMPUTATION IN WESTERN EUROPE AND NORTH AMERICA
Cancer 20% Diabetes 34%
Trauma 6%Vascular diseases 40%
PLATFORMS FOR GROWTH
����������
��������
�����
���� ��������
�������
�������������
�����������������������
�������
����������������������
�������������������������
�������������������
���������
���������
����
���
���
�����������
OSSUR_EN_ARS2005.indd 7 18.2.2005 12:17:20
8
FOCUS ON INNOVATIONEver since Ossur was founded, innovation has been
the key factor in all of the Company’s business act-
ivities. One of the goals of the Company is to maintain
its growth through the introduction of new products
and new technologies in the prosthetics and orthotics
sector, and this year saw the ongoing progress of
numerous large-scale projects. The biggest research
and development project to date is the Rheo KneeTM.
Introduced in October of last year, the knee features
electronic control and artificial intelligence and
represents a revolution in the prosthetics market.
The outstanding feature of last year’s operations was
that all major business targets of the Company were
achieved. Ossur’s sales over the year increased by
32%, amounting to a total of USD 124,4 million. The
principal challenge of the year regarding the acquisition
of Generation II was to maintain the level of sales at the
same time as the Company was undergoing rapid trans-
formation, and the development work on the Generation
II product line within Ossur was just getting under way.
As it turned out, the integration of Generation II with
Ossur’s operations was quite successful.
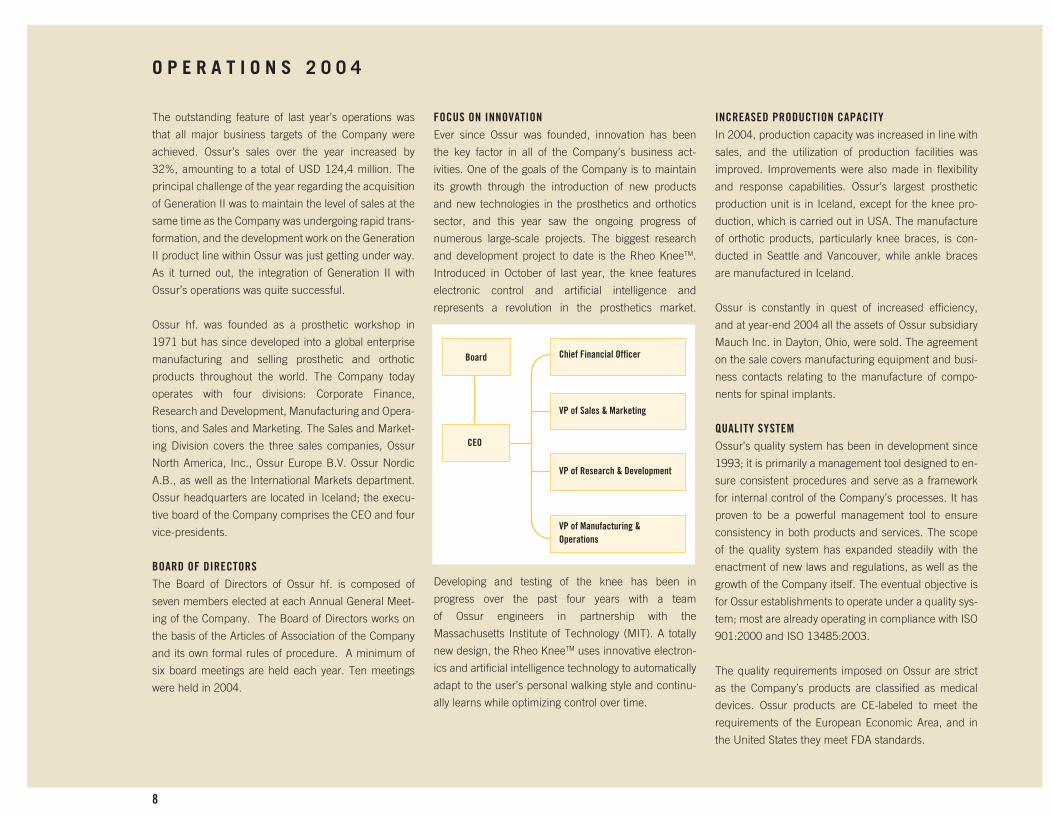
Ossur hf. was founded as a prosthetic workshop in
1971 but has since developed into a global enterprise
manufacturing and selling prosthetic and orthotic
products throughout the world. The Company today
operates with four divisions: Corporate Finance,
Research and Development, Manufacturing and Opera-
tions, and Sales and Marketing. The Sales and Market-
ing Division covers the three sales companies, Ossur
North America, Inc., Ossur Europe B.V. Ossur Nordic
A.B., as well as the International Markets department.
Ossur headquarters are located in Iceland; the execu-
tive board of the Company comprises the CEO and four
vice-presidents.
BOARD OF DIRECTORSThe Board of Directors of Ossur hf. is composed of
seven members elected at each Annual General Meet-
ing of the Company. The Board of Directors works on
the basis of the Articles of Association of the Company
and its own formal rules of procedure. A minimum of
six board meetings are held each year. Ten meetings
were held in 2004.
Developing and testing of the knee has been in
progress over the past four years with a team
of Ossur engineers in partnership with the
Massachusetts Institute of Technology (MIT). A totally
new design, the Rheo KneeTM uses innovative electron-
ics and artificial intelligence technology to automatically
adapt to the user’s personal walking style and continu-
ally learns while optimizing control over time.
O P E R A T I O N S 2 0 0 4
INCREASED PRODUCTION CAPACITYIn 2004, production capacity was increased in line with
sales, and the utilization of production facilities was
improved. Improvements were also made in flexibility
and response capabilities. Ossur’s largest prosthetic
production unit is in Iceland, except for the knee pro-
duction, which is carried out in USA. The manufacture
of orthotic products, particularly knee braces, is con-
ducted in Seattle and Vancouver, while ankle braces
are manufactured in Iceland.
Ossur is constantly in quest of increased efficiency,
and at year-end 2004 all the assets of Ossur subsidiary
Mauch Inc. in Dayton, Ohio, were sold. The agreement
on the sale covers manufacturing equipment and busi-
ness contacts relating to the manufacture of compo-
nents for spinal implants.
QUALITY SYSTEMOssur’s quality system has been in development since
1993; it is primarily a management tool designed to en-
sure consistent procedures and serve as a framework
for internal control of the Company’s processes. It has
proven to be a powerful management tool to ensure
consistency in both products and services. The scope
of the quality system has expanded steadily with the
enactment of new laws and regulations, as well as the
growth of the Company itself. The eventual objective is
for Ossur establishments to operate under a quality sys-
tem; most are already operating in compliance with ISO
901:2000 and ISO 13485:2003.
The quality requirements imposed on Ossur are strict
as the Company’s products are classified as medical
devices. Ossur products are CE-labeled to meet the
requirements of the European Economic Area, and in
the United States they meet FDA standards.
Board
VP of Manufacturing &Operations
VP of Research & Development
VP of Sales & Marketing
Chief Financial Officer
CEO
OSSUR_EN_ARS2005.indd 8 18.2.2005 12:17:21
9
CUSTOMER SATISFACTION SURVEYAt the beginning of the year, Gallup organized an ex-
tensive service survey for Ossur. The survey extended
to Ossur customers in the United States, Germany and
Scandinavia. The purpose of the survey was to measure
customer satisfaction with Ossur prosthetic products
and services and obtain a comparison with the products
and services of major competitors. This is the second
year in a row the Company carries out such a survey
which gives a good and comparable picture of our
market position.
The results of the survey were extremely gratifying for
the Company’s staff. Ossur enjoys a strong position
among its customers in regards of quality, service and
employees’ attitude. Ossur elicited a positive response
of 4,7 on the scale of 5 for quality of products and for
employees’ knowledge 4,4 on the scale of 5.The results
of the survey represent a major challenge for the Ossur
staff to hold this course.
IMPORTANT STRUCTURAL CHANGES IN NORTH AMERICAOssur North America Inc. serves as the headquarters
for Ossur’s subsidiaries in Aliso Viejo, Vancouver and
Seattle. At year-end 2003, changes were made in the
Ossur North America management structure, designed
to bring about a shift in emphasis in the sales and
marketing operations in the North American market. The
Company’s largest market, the North American market,
underwent extensive restructuring as regards the
entire sales and marketing operation, with the merger
of the orthotic and prosthetic sales departments.
In late February last year, Ossur North America entered
into an agreement with SPS (Southern Prosthetic Sup-
ply), one of the United States’ largest suppliers of O&P
products, on the distribution of the Company’s pro-
ducts in USA. An agreement has also been reached
with Hanger Orthopaedic Group on the sale of Ossur
products in Hanger-owned workshops.
The major organizational changes and rapid integration
of the Generation II companies into the operations of
Ossur have now paid off in the form of greater operating
efficiency. Extensive reorganization has been carried
out on the product control and orthotics research and
development work within Ossur. Several large product
development projects were begun in the course of the
year involving knee braces, and significant changes
were also made in their manufacture. Substantial
changes were made in the manufacture of knee braces
for the US market, as well as the introduction of Ossur’s
CadCam solutions, which shortened turnaround time
and increased the level of customer service, primarily
in shipping.
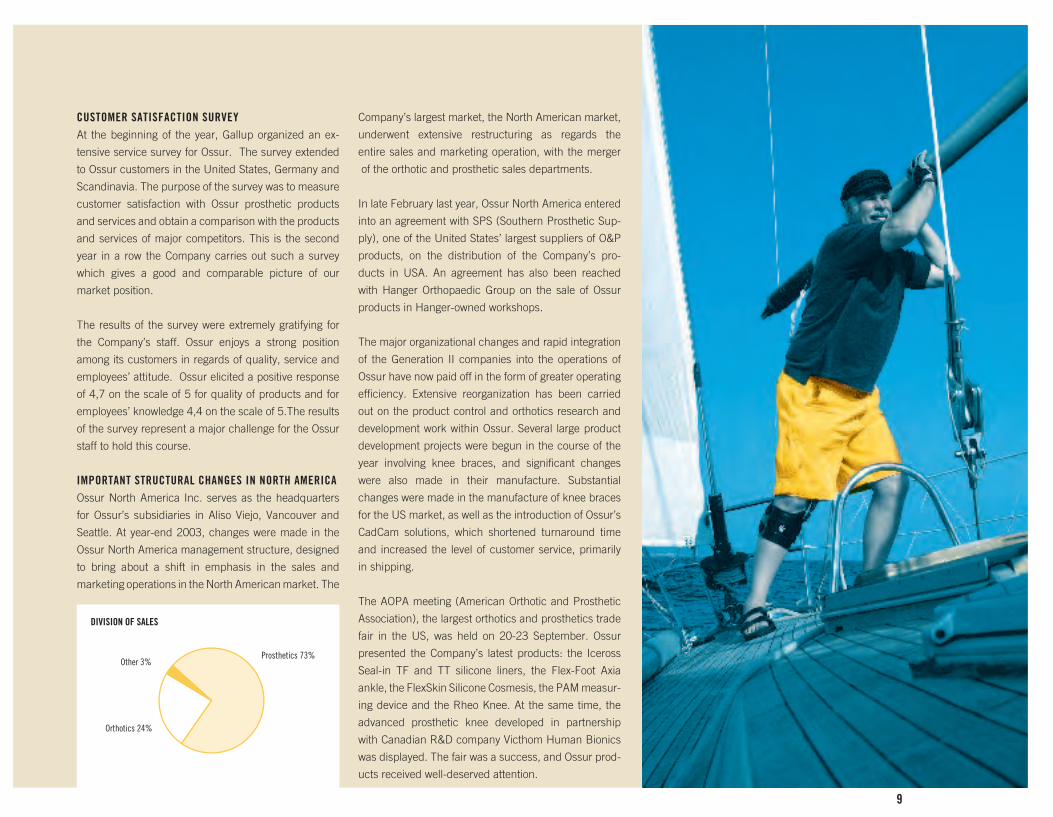
The AOPA meeting (American Orthotic and Prosthetic
Association), the largest orthotics and prosthetics trade
fair in the US, was held on 20-23 September. Ossur
presented the Company’s latest products: the Iceross
Seal-in TF and TT silicone liners, the Flex-Foot Axia
ankle, the FlexSkin Silicone Cosmesis, the PAM measur-
ing device and the Rheo Knee. At the same time, the
advanced prosthetic knee developed in partnership
with Canadian R&D company Victhom Human Bionics
was displayed. The fair was a success, and Ossur prod-
ucts received well-deserved attention.
Prosthetics 73%
DIVISION OF SALES
Orthotics 24%
Other 3%
OSSUR_EN_ARS2005.indd 9 18.2.2005 12:17:45

10
OSSUR_EN_ARS2005.indd 10 18.2.2005 12:18:50
11
Sales in 2004 in the North American market were 53%
of the total sales of the company. Sales increase in North
America was 33%. Sales of prosthetic and orthotic prod-
ucts in Canada increased by 10% as measured in local
currency.
STEADY ORGANIC GROWTH IN EUROPEEuropean sales continued with strong, steady,
organic growth, posting a 12% increase as measured in
local currencies. Innovation was the word of the year in
Europe like elsewhere in the Company. Among many
great new products launched in 2004, the Iceross
Seal-In liner stands out. Despite different reimbursement
systems and working methods in the 13 countries Ossur
Europe is operating in, the Iceross Seal-In liners were
highly successful in all markets without cannibalizing any
existing liner sales. The world congress “Orthopädie &
Reha-Technik” in Leipzig, Germany, the largest confer-
ence and trade fair in the industry, was held in May.
This proved a splendid opportunity to promote a dozen
new innovative solutions to 12,300 visitors from the
O&P industry. The Rheo Knee was introduced for the
first time in a pre-launch stage as the Company’s first
step into bionics.
The pressure from healthcare authorities and insurance
companies continues in Europe. Germany took its share
last year. One of the responses to the reimbursement
changes in Germany was to create tools presented as
O&P Business Solutions for our customers to enable
them to better manage their businesses. Among the
innovative tools introduced was the Empower SMART
work improvement quality concept and individualized
prosthetic service fabrication, both focusing on improv-
ing efficiency and profit for O&P facilities. A number of
selected customers Europe-wide have started prepar-
ations for and implementation of one or more tools
connected with Ossur O&P Business Solutions.
Numerous other important projects contributed to
successful growth. Worth mentioning is the full inte-
gration of GII, an orthotic company in Brussels,
Belgium, into the European office in Eindhoven, The
Netherlands, resulting in the closure of the Brussels
office in April. A project was initiated to evaluate and
improve all processes centered on the customer to
ensure our goal of maintaining an outstanding service
level, with the target of guaranteeing delivery of 98% of
our product range within 24 hours to our customers in
13 European countries.
STRONG MARKET SHARE IN THE NORDIC COUNTRIESThe sales region of Ossur Nordic AB includes both
Scandinavia and the Baltic States. In the course of the
year, sales of prosthetics began in Poland, with sales
of orthotic products scheduled for 2005. Ossur Nordic
headquarters are located in Uppsala Sweden. Ossur’s
market position in the prosthetics market in this region
is extremely strong, and therefore growth and growth
opportunities here are less than in other markets of the
Company. Ossur Nordic sales over the year amounted
to 14% of the total sales of the consolidated group.
GROWTH OPPORTUNITIESOssur is determined to expand into all the major market
areas in the world, with the efforts of the International
Markets department focusing on Asia, Australia, Eastern
Europe, South America and Africa. Substantial growth
potential is seen in these markets, with Ossur’s most
significant growth being in Australia, China and
Japan. Four employees were stationed in Asia during
the year. The internal growth of International Markets
was 25% over the year, with sales accounting for 7% of
the Group’s total sales.
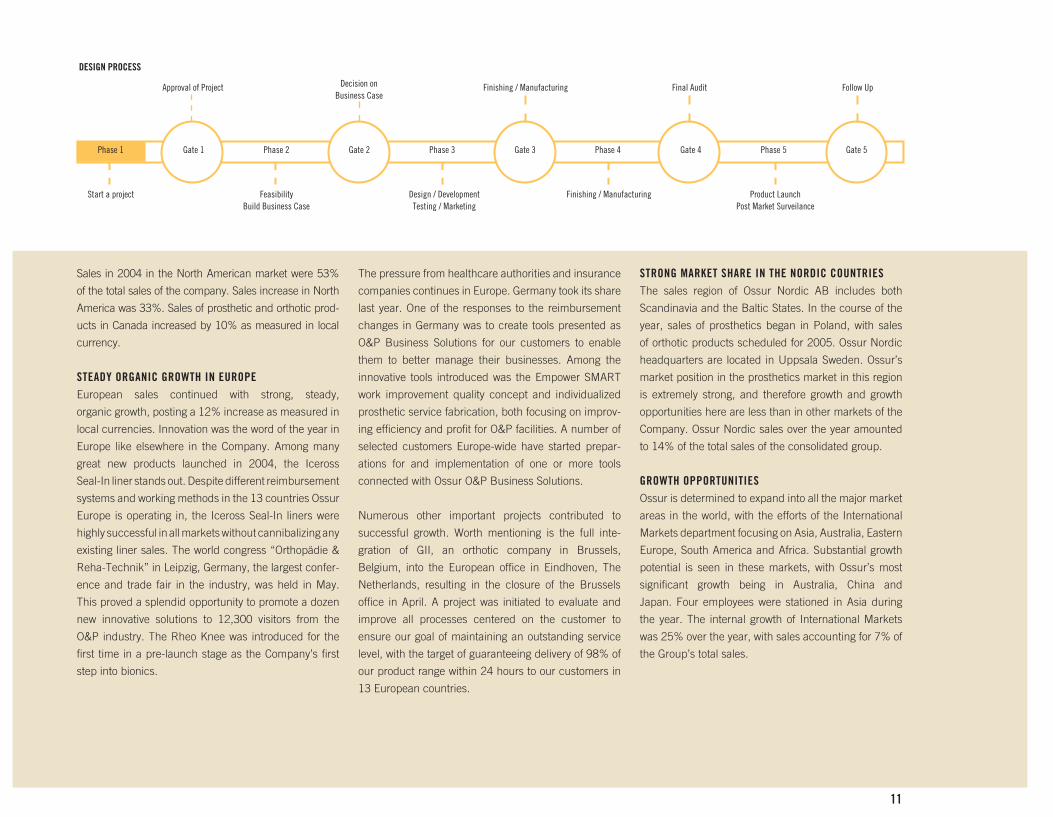
DESIGN PROCESS
Start a project
Approval of Project
FeasibilityBuild Business Case
Decision onBusiness Case
Design / DevelopmentTesting / Marketing
Finishing / Manufacturing
Finishing / Manufacturing
Final Audit
Product LaunchPost Market Surveilance
Follow Up
Phase 1 Gate 1 Phase 2 Gate 2 Phase 3 Gate 3 Phase 4 Gate 4 Phase 5 Gate 5
OSSUR_EN_ARS2005.indd 11 18.2.2005 12:19:39
12
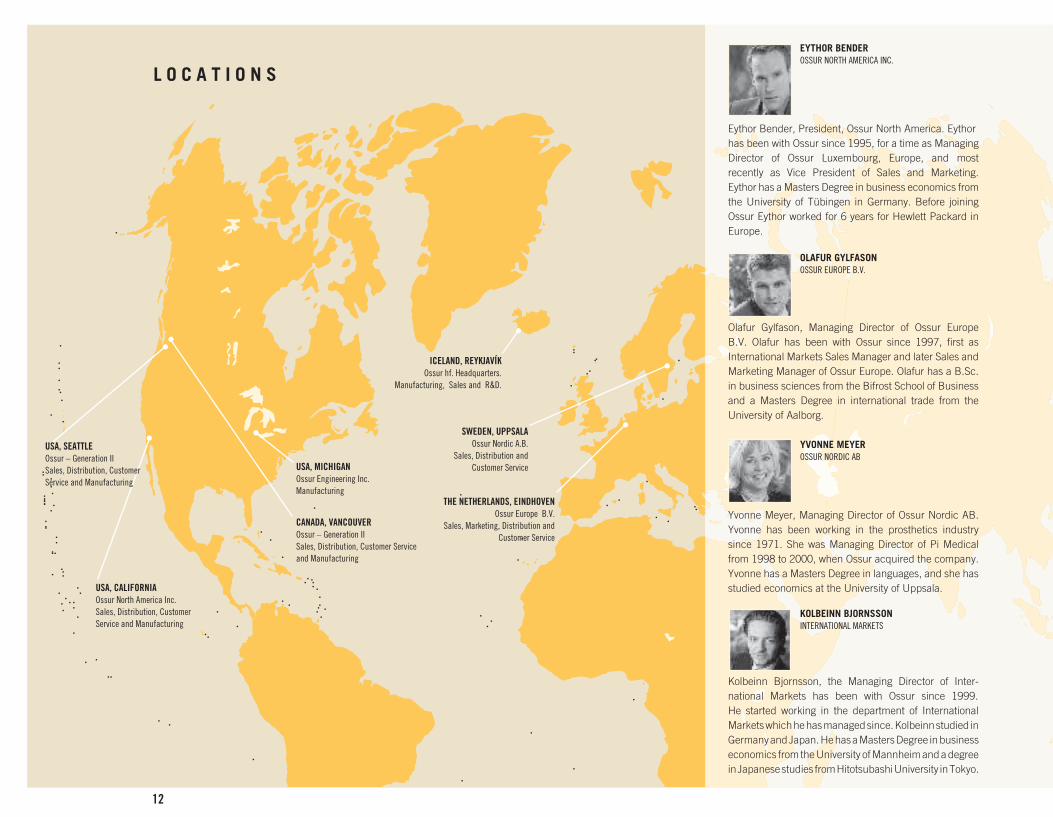
L O C A T I O N S
ICELAND, REYKJAVÍK Ossur hf. Headquarters.
Manufacturing, Sales and R&D.
CANADA, VANCOUVEROssur – Generation IISales, Distribution, Customer Service and Manufacturing
SWEDEN, UPPSALAOssur Nordic A.B.
Sales, Distribution and Customer Service
USA, CALIFORNIAOssur North America Inc.Sales, Distribution, Customer Service and Manufacturing
USA, MICHIGANOssur Engineering Inc.Manufacturing
THE NETHERLANDS, EINDHOVENOssur Europe B.V.
Sales, Marketing, Distribution and Customer Service
Eythor Bender, President, Ossur North America. Eythorhas been with Ossur since 1995, for a time as Managin g Director of Ossur Luxembourg, Europe, and most recently as Vice President of Sales and Marketing. Eythor has a Masters Degree in business economics from the University of Tübingen in Germany. Before joining Ossur Eythor worked for 6 years for Hewlett Packard in Europe.
EYTHOR BENDEROSSUR NORTH AMERICA INC.
Olafur Gylfason, Managing Director of Ossur Europe B.V. Olafur has been with Ossur since 1997, first as International Markets Sales Manager and later Sales and Marketing Manager of Ossur Europe. Olafur has a B.Sc.in business sciences from the Bifrost School of Businessand a Masters Degree in international trade from the University of Aalborg.
OLAFUR GYLFASONOSSUR EUROPE B.V.
Yvonne Meyer, Managing Director of Ossur Nordic AB. Yvonne has been working in the prosthetics industry since 1971. She was Managing Director of Pi Medical from 1998 to 2000, when Ossur acquired the company. Yvonne has a Masters Degree in languages, and she has studied economics at the University of Uppsala.
YVONNE MEYEROSSUR NORDIC AB
Kolbeinn Bjornsson, the Managing Director of Inter-national Market s has been with Ossur since 1999. He started workin g in the department of International Markets which he has managed since. Kolbeinn studied in Germany and Japa n. He has a Masters Degree in business economics from the University of Mannheim and a degreein Japanes e studies from Hitotsubashi University in Tokyo.
KOLBEINN BJORNSSONINTERNATIONAL MARKETS
USA, SEATTLEOssur – Generation IISales, Distribution, Customer Service and Manufacturing
OSSUR_EN_ARS2005.indd 12 18.2.2005 12:19:43
13
Ossur is staffed with passionate, ambitious people
eager to help those who live with disabilities. Our
corporate slogan, Life Without Limitations, is much
more than a marketing move. It is a vision that we
share as a dedicated and caring organization.
We believe that as a leading orthotic and prosthetic
manufacturer, it is our responsibility and privilege
to support our industry and to serve patients and
practitioners in every way we can. In fulfilling this
mission, we believe it is our obligation to provide
not only world-class products but also support to
those relying on them.
We partner with a great variety of both large and
small organizations and continually explore oppor-
tunities for additional partnerships. We are proud
to be working with respected organizations such
as:
Amputee Coalition of America (ACA)
Challenged Athletes Foundation (CAF)
Orthotic and Prosthetic Assistance Fund (OPAF)
American Orthotic and Prosthetic Association
(AOPA)
American Academy of Orthotists and Prosthetists
(AAOP)
California State University Dominguez Hills
Iceland Sport Association for the Disabled
Amputee Mobility and Performance Workshop
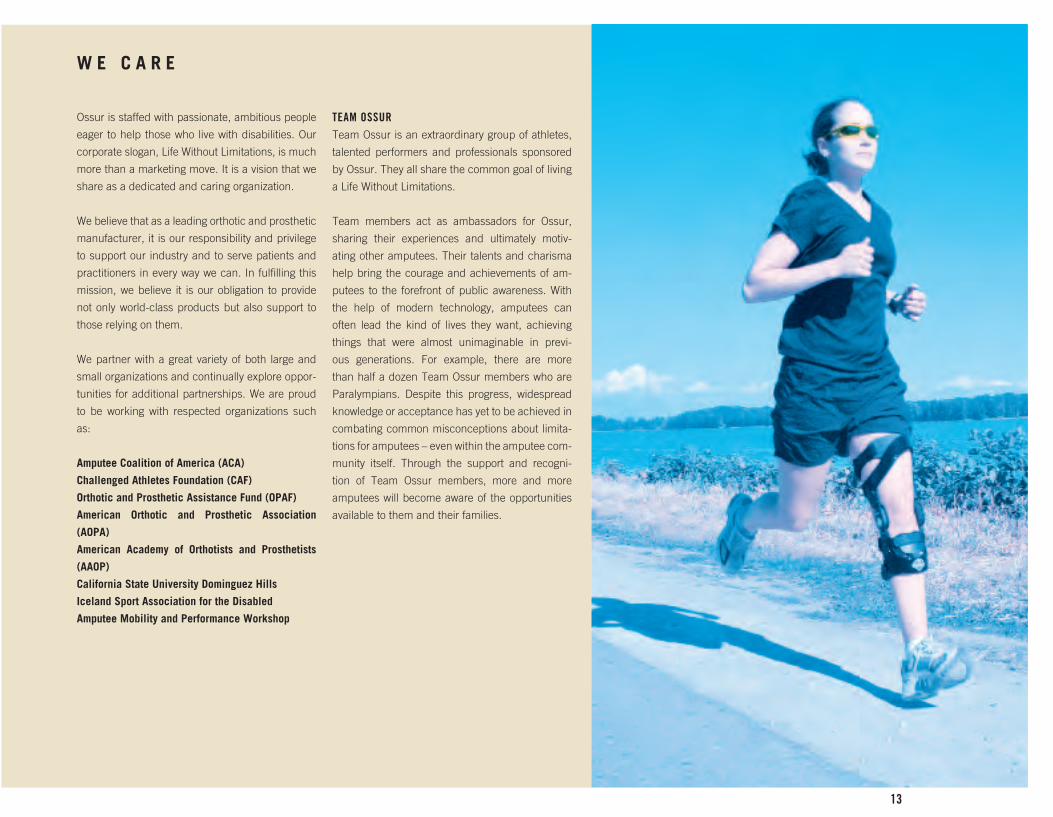
TEAM OSSURTeam Ossur is an extraordinary group of athletes,
talented performers and professionals sponsored
by Ossur. They all share the common goal of living
a Life Without Limitations.
Team members act as ambassadors for Ossur,
sharing their experiences and ultimately motiv-
ating other amputees. Their talents and charisma
help bring the courage and achievements of am-
putees to the forefront of public awareness. With
the help of modern technology, amputees can
often lead the kind of lives they want, achieving
things that were almost unimaginable in previ-
ous generations. For example, there are more
than half a dozen Team Ossur members who are
Paralympians. Despite this progress, widespread
knowledge or acceptance has yet to be achieved in
combating common misconceptions about limita-
tions for amputees – even within the amputee com-
munity itself. Through the support and recogni-
tion of Team Ossur members, more and more
amputees will become aware of the opportunities
available to them and their families.
W E C A R E
OSSUR_EN_ARS2005.indd 13 18.2.2005 12:19:52
14
V A L U E P R O P O S I T I O N T H R O U G H I N N O V A T I O N
Ossur’s mission is to be the principal source of inno-
vative, high-quality prosthetic and orthotic products
and services. The Company has always seen R&D as
essential to future development and is determined to
maintain its technological leadership through record
investment in research and development activities. Last
year’s investment in R&D was 7% of total sales of the
Company.
R&D efforts continue to focus on further develop-
ing technical platforms giving a proprietary, competi-
tive advantage in four areas that were defined several
years ago as core competencies within the Company:
silicone material, carbon fiber composites, precision
metal machinin g and mechatronics. The expertise
in these area s acquired during years of research and
development in the prosthetics field has been utilized
in expanding the business into other fields, such as
orthotics and wound care.
Record investment in R&D continues to secure exciting
new products, introducing break-through technologies,
like the one underlying the Rheo KneeTM. The organic
growth of the Company is secured through continuous
introduction of new products.
The advancements in prosthetics in the last few
decades are enormous. By constantly breaking through
constraints of the already known, Ossur has developed
a range of prosthetic products that not only substitute
for missing limbs but also push the boundaries of
performance and mobility, enhancing the quality of life
for all users.
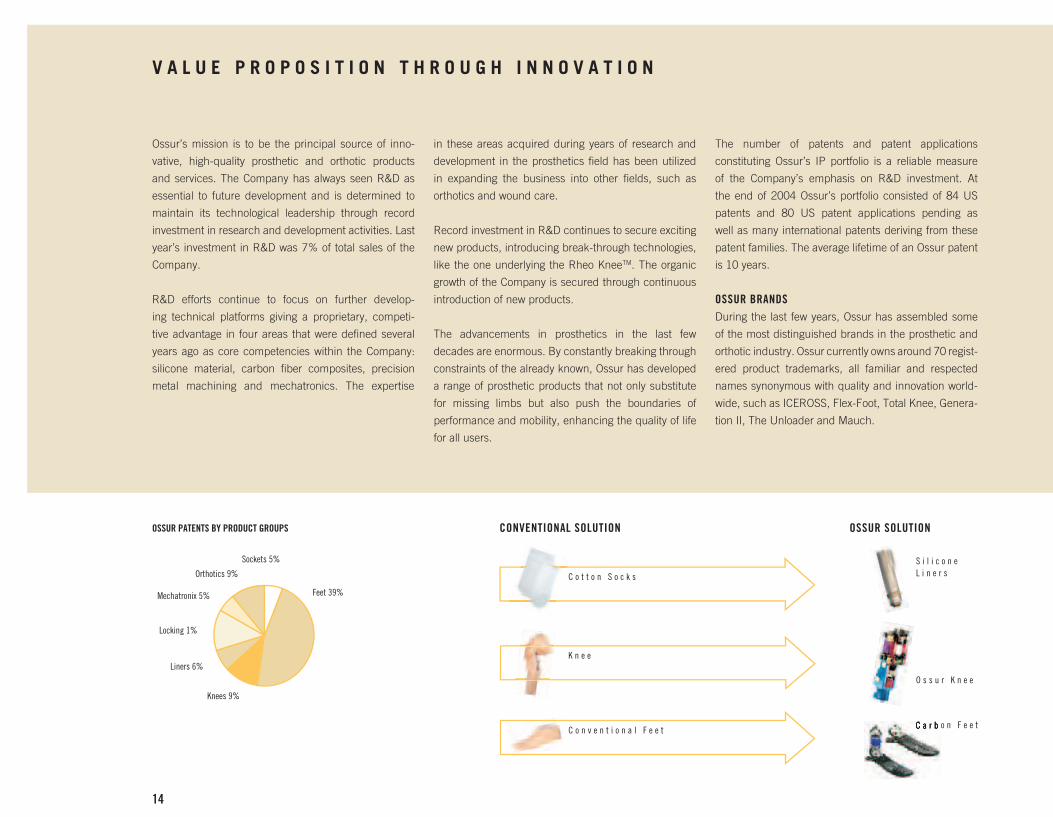
The number of patents and patent applications
constituting Ossur’s IP portfolio is a reliable measure
of the Company’s emphasis on R&D investment. At
the end of 2004 Ossur’s portfolio consisted of 84 US
patents and 80 US patent applications pending as
well as many international patents deriving from these
patent families. The average lifetime of an Ossur patent
is 10 years.
OSSUR BRANDSDuring the last few years, Ossur has assembled some
of the most distinguished brands in the prosthetic and
orthotic industry. Ossur currently owns around 70 regist-
ered product trademarks, all familiar and respected
names synonymous with quality and innovation world-
wide, such as ICEROSS, Flex-Foot, Total Knee, Genera-
tion II, The Unloader and Mauch.
CONVENTIONAL SOLUTION OSSUR SOLUTION
S i l i c o n e L i n e r s
O s s u r K n e e
C o t t o n S o c k s
K n e e
C o n v e n t i o n a l F e e t C a r b o n F e e tC a r b o n F e e t
�������������������������������
��������
���������
����������
��������������
������������
����������
��������
OSSUR_EN_ARS2005.indd 14 18.2.2005 12:20:00
15
OSSUR_EN_ARS2005.indd 15 18.2.2005 12:20:05

16
O S S U R ’ S B I O N I C V I S I O N O F T H E F U T U R E
Ossur’s vision for the future of prosthetics and orthotics lies in the attainment of advanced physiological function. Tech-nology based on the precise fusion of electronics, mechanics and human physiology will allow us to design products enhancing the fundamental human needs of comfort, security and independence.
The term bionic describes the application of biological prin-ciples to the study and design of engineering systems, espe-cially electronic systems - bi(o) + (electr)onics. Applied to the field of prosthetics and orthotics, the description is specified as the integration of electronic and/or mechanical compo-nents, defined as smart structures, intended to replace or enhance anatomical structures or human physiological proc-esses.
With the introduction of the Rheo KneeTM and the forthcom-ing Power KneeTM, Ossur is pioneering the first and second step, respectively, in the evolution of bionic prostheses. The Rheo Knee differentiates itself from established prosthetic knee systems through the incorporation of Artificial Intelli-gence (AI). The Power Knee is the first prosthetic solution to combine a similar type of AI with a power source.
T H E B I O N I C F U T U R E O F O S S U R
OSSUR_EN_ARS2005.indd 16 18.2.2005 12:20:19
17
OSSUR_EN_ARS2005.indd 17 18.2.2005 12:20:24

P R O D U C T S
PROSTHETICSYears of experience in materials technology and
innovative design have made Ossur a leading developer
of prosthetic systems that provide extraordinary fit and
function. The Company’s prosthetic offering reflects its
continuing commitment to amputees, practitioners and
the prosthetic industry.
Ossur’s prosthetic produc t line has a full spectrum of
prem ium lower limb prosthetic components, designed
to reflect the individual nature of users.
FEETThe unique design of FLEX-FOOT® prosthetic feet,
combined with the superior strength and flexible
properties of carbon fiber, has permitted amputees
to walk with a gait indistinguishable from a natural
gait and has enabled athletic amputees to break
world records and achieve athletic results com-
parable to those of able-bodied athletes. The
fundamental advantages of the Flex-Foot prod-
uct range include advanced R&D work, in-house
production, testing procedures, proprietary
strengths and unique attributes of the feet. The design
work is performed by specialists combining deep sci-
entific knowledge with the prosthetic environment and
benefiting from the experience of other advanced in-
dustries. The main features of Ossur’s own carbon com-
posite production are automation, advanced technology
and a modern and dynamic manufacturing process, all
leading to a greater level of quality, cost reduction and
R&D flexibility. Strict testing procedures performed at
Ossur ensure the required durability of products, user
safety and acceptance of features.
In 2004 Ossur launched Flex-Foot® Axia, a much
anticipated addition to the foot product range, featuring a
design that guides the foot through each step, contri-
buting to stability, balance and easy guided roll-over.
LP CETERUS®
LP VARI-FLEX®
FLEX-FOOT® Axia
OSSUR_EN_ARS2005.indd 18 18.2.2005 12:20:28
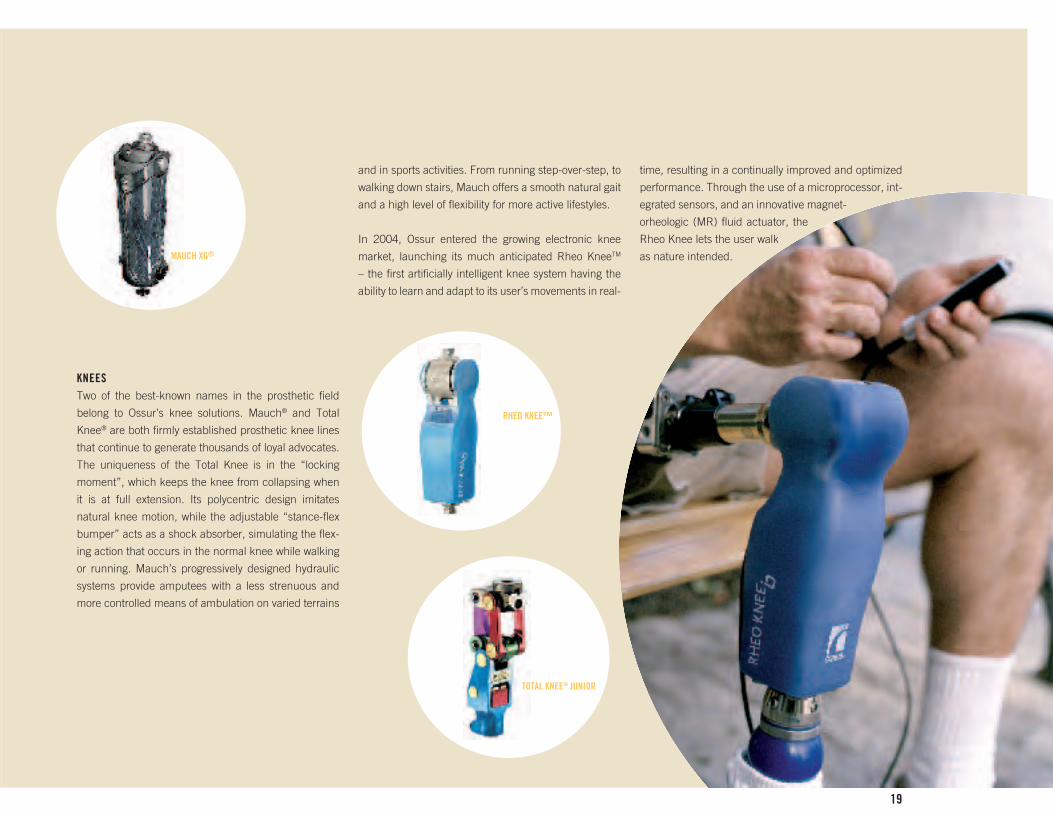
KNEESTwo of the best-known names in the prosthetic field
belong to Ossur’s knee solutions. Mauch® and Total
Knee® are both firmly established prosthetic knee lines
that continue to generate thousands of loyal advocates.
The uniqueness of the Total Knee is in the “locking
moment”, which keeps the knee from collapsing when
it is at full extension. Its polycentric design imitates
natural knee motion, while the adjustable “stance-flex
bumper” acts as a shock absorber, simulating the flex-
ing action that occurs in the normal knee while walking
or running. Mauch’s progressively designed hydraulic
systems provide amputees with a less strenuous and
more controlled means of ambulation on varied terrains
and in sports activities. From running step-over-step, to
walking down stairs, Mauch offers a smooth natural gait
and a high level of flexibility for more active lifestyles.
In 2004, Ossur entered the growing electronic knee
market, launching its much anticipated Rheo KneeTM
– the first artificially intelligent knee system having the
ability to learn and adapt to its user’s movements in real-
MAUCH XG®
time, resulting in a continually improved and optimized
performance. Through the use of a microprocessor, int-
egrated sensors, and an innovative magnet-
orheologic (MR) fluid actuator, the
Rheo Knee lets the user walk
as nature intended.
TOTAL KNEE® JUNIOR
RHEO KNEE™
OSSUR_EN_ARS2005.indd 19 18.2.2005 12:20:35

20
Among numerous liners in the Iceross range are Iceross
Original, Iceross Comfort, Iceross Dermo, Iceross Sta-
bilo, and Iceross Sport. The new addition to the product
line in 2003 was Iceross Seal-InTM. The proprietary seal-
ing feature on the liner provides the ultimate in vacuum
suspension systems and their capacity to function with
other means of suspension. In 2004, Ossur launched
Iceross Seal-In Transfemoral (for above-knee amputees)
and Conical versions, thus completing the Seal-In range
to cater to all lower extremity amputees.
ORTHOTICSOrthoses are appliances used to control parts of the
body. Attached externally, they aid or correct the func-
tion of a particular limb. Designed to stabilize fractures,
facilitate controlled motion and to protect and correct
parts of the body, orthoses are primarily utilized to
apply or reduce controlled force in order to protect a
body part, restrict or alter motion to prevent or correct a
deformity and compensate for a weakness or deformity.
Already working closely with O&P professionals across
the world, Ossur’s next logical step was to extend the
Company’s core competencies to orthotics. The devel-
opment of Ossur Orthotics combines some of the best,
most effective technologies available today with over 30
years of design experience and a broad knowledge of
biomechanics.
The Ossur orthotics range aims to provide orthotists
with the best possible solutions for their customers. It
incorporates the most effective materials and hi-tech,
quality-controlled processes throughout design and
production.
LINERSICEROSS® liners are made of proprietary silicone blends
for optimal security, durability and comfort. Silicone is
one of the most bio-inert materials available, making it
the material of choice in numerous medical applica-
tions. Ossur silicone blends are specially formulated to
provide precisely the right level of softness and
strength to suit individual needs. The
design of ICEROSS liners for am-
putees stabilizes soft tissues,
minimizes stretching,
and improves circula-
tion, making them
comfortable to
wear.
ICEROSS®
DERMO SEAL-INICEROSS® STABILO
OSSUR JUNIOR ADAPTER
OSSUR_EN_ARS2005.indd 20 18.2.2005 12:20:43

21
FOOT ORTHOSESIncorporating the design elements and performance of
proven Flex-Foot carbon fiber technology, Ossur foot
orthoses are set to inspire a revolution in lower limb or-
thotics. The same amazing energy-return construction,
that fueled radical improvements in prosthetic perform-
ance, is now available throughout the product line of
foot and ankle orthotics.
The Ossur AFO Dynamic is a pre-fabricated ankle-foot
orthosis, made of carbon fiber. It is dynamic and of-
fers energy return. The energy-storing properties of car-
bon fiber make it the ideal material for an ankle-foot
orthosis. With the full-length toe lever, anterior shell and
Flex-Foot technology, this device gives a mild extension
moment to the knee to help with mild knee instability.
Incorporating the best of Flex-Foot technology, the
Ossur AFO Dynamic provides a strong, yet lightweight,
solution for people with drop foot or other musculoskele-
tal or neurological conditions.
KNEE BRACESIn 2003 Ossur acquired Generation II Group, a leading
North American developer and manufacturer of orthotic
knee braces. Generation II’s diverse product line con-
sists of customized and off-the-shelf braces. It special-
izes in braces for ligament injuries, osteoarthritis and
post-operative conditions. Nine published clinical and
biomechanical outcome studies support the efficacy of
GII bracing. The addition of GII’s line of clinically proven
osteoarthritis (OA) and ligament knee braces makes
Ossur an important player in the orthotic sector.
In 1988, Generation II was the first company to develop
a brace to manage the pain of knee osteoarthritis, a
condition thought to be one of the fastest growing health
threats to the quality of life in the developed world. To-
day, The Unloader® product line continues to be the
most prescribed OA brace on the market.
The introduction of the GII 3DX Synergy® Hinge System
marked the first major innovation in ligament bracing
for over two decades since the brace replicates the
n a t u r a l
anatomic
movement
of the knee, a
feature not pre-
viously available
with braces on the
market.
Additionally, Ossur offers a full
line of ligament, post-operative and
patella-stabilizing knee braces under the
GII brand.
THE ENVIRONMENTOssur pursues a policy of sound environmental practice
in recycling and disposal of hazardous waste. All waste
is sorted and recycled when applicable. Materials which
cannot be recycled, or which are classified as hazard-
ous waste, are appropriately handled and disposed of in
full compliance with applicable regulations.OSSUR AFO DYNAMICOSSUR AFO LIGHT
3DX™
UNLOADER EXPRESS®
OSSUR_EN_ARS2005.indd 21 18.2.2005 12:20:58

22
REVENUE PER EMPLOYEE
0
300
200
400
500
600
20042003200220012000
in USD thousands
0
100000
50000
150000
200000
250000
Avarage Revenue Per Employee (USD)
Avarage Number of Employees
OSSUR_EN_ARS2005.indd 22 18.2.2005 12:21:03

23
H U M A N R E S O U R C E S
WORKING ENVIRONMENTIn today’s world, companies need to provide their
employees with an environment that is both stimulating
and challenging. People embarking on their careers no
longer look for a workplace to last them a lifetime; they
want to work under the best possible conditions at jobs
suited for their skills. Jobs at Ossur are certainly challeng-
ing, and Ossur is dedicated to the ideal of creating
working conditions in which employees can achieve
optimum results.
Ossur’s best recruiters are its own employees, who
attract new talent by praising their workplace.
WORKPLACE AUDITIn 2004, a workplace audit was conducted at Ossur
where employees were asked to respond to various
questions relating to their workplace. The overall result
was extremely good, and the same was in fact true in
2002. The statement “On the whole I am happy in my
work at Ossur” elicited a positive response of 4.41 on
a scale of 5.
Ossur employees also felt that the Company projected
a positive image. It is extremely important for all em-
ployees to make an effort to promote Ossur’s strong,
positive image, and the Company’s managers must
keep up their efforts to create a working environment
which is both challenging and satisfying.
CORE VALUESIn order to promote the working environment that we
wish to maintain, we have set our sights on three core
values: courage, frugality and honesty. All employee
conduct and decisions must take our core values into
account.
Ossur’s corporate culture is characterized by initiative,
ambition, drive and cooperation, and it is important for
management and other employees to make every effort
to preserve the current culture.
PERFORMANCE AUDITIn order to enable employees to achieve the Comp-
any’s set objectives, it is important to assess their per-
formance on a regular basis. A formal performance
audit is usually conducted annually, when employees
and their supervisors jointly assess the employees’
performance in the light of the objectives and values
of the Company. Audits of this kind have proven to be
an extremely useful tool for employees, and they also
ensure that the Company is always alert to the perfor-
mance of every individual working at Ossur.
EXPERTISEThe scope of Ossur’s activities has broadened, resulting
in an increased need for employees with diverse ex-
pertise. The Company employs people with different ex-
perience and backgrounds, which makes our working
environment more exciting. It is important that em-
ployees share their expertise, and cross-departmental
team projects are common. The year 2004 represents
a milestone in the history of the Company, as it marks
the launch of the Company’s new electronic knee.
Behind the development process of such products lies
extensive staff expertise, and the potential for progress
in Ossur’s product line lies primarily in the knowledge
of our employees.
NUMBER OF EMPLOYEESOver the course of five years, the number of employees
at Ossur has grown from 120 to over 600. An average
of 580 employees worked for the Company during the
year. The staff turnover at Ossur in 2004 was approxi-
mately 16%.
University 33,8%
Other 40,1%
Vocational orTechnical Training 26,1%
EDUCATION/QUALIFICATION
GENDER RATIO
Male 62%
Female 38%
OSSUR_EN_ARS2005.indd 23 18.2.2005 12:21:04

24
Ossur’s shares are listed on the Iceland Stock Exchange,
with Ossur included as one of the companies forming
the ICEX-15, the selected share index. The price of Os-
sur stock rose by 74.3% in 2004, from 43.6 at year-end
2003 to 76 at year-end 2004. The ICEX-15 increased
by 58.9% over the same period.
The total volume of trading in Ossur stock over the
year amounted to ISK 24 billion in 4,705 trades, which
corresponds to a turnover of 118%. One of the principal
tests of the liquidity of stock is the difference between
the most favorable bid and offer prices for the stock,
i.e., the spread. The average spread of Ossur stock over
the year was 0.75%.
STOCKS The market value of the Company at year-end was just
short of USD 400 million. At the Annual General Meet-
ing of the Company in 2004, a resolution was passed to
reduce the share capital of the Company by 10,000,000
shares, from 328,441,000 to 318,441,000 shares,
using the method of reducing the Company’s treasury
shares by the said amount. Ossur’s market value at
year-end makes it the 11th largest company listed on
the Iceland Stock Exchange.
SHAREHOLDERSAt year-end, the number of Ossur shareholders was
3,376. The largest single shareholder is Industrivärden
AB, with holdings of 20.45%. Industrivärden AB is list-
ed on Stockholm Stock Exchange. The second largest
shareholder is Mallard Holding, owned by the founder
of the Company, Össur Kristinsson, with holdings of
18.69%. The third largest single shareholder is William
Demant Invest A/S, with holdings of 16.14%.
During the year, Ossur hf. exercised the authorization
granted by shareholders to acquire some of its own
stock, and the Company currently holds 4.5 million
treasury shares. The shares were used, among other
things, to meet employee stock options.
DIVIDEND POLICYNo dividends have been paid to Ossur shareholders.
In the event that annual general meeting resolves
to pay dividends, the dividends will be paid to regis-
tered shareholders pursuant to the share ledger on the
day of the AGM. According to Ossur prospectus, the
Company does not plan to pay dividends to shareholders
in the near future; instead, earnings will be reinvested
in the growth of the Company for as long as the return
on investment in Ossur’s business sectors exceeds the
returns offered in other sectors at same level of risk.
ANNUAL GENERAL MEETINGThe annual general meeting of the Company is held be-
fore the end of June each year. According to the Articles
of Association of the Company, the meeting is convened
under the same procedure as other shareholders’ meet-
ings, with at least two weeks’ notice. The results of the
Annual General Meeting are sent to the Iceland Stock
Exchange immediately following the meeting and are
made available on the Company website in the course
of the following business days. The 2006 Annual Gen-
eral Meeting will be held on 24 February.
INVESTOR RELATIONSOssur hf. places great emphasis on providing inves-
tors, analysts and other stakeholders with timely and
accurate information concerning the Company. Investor
meetings, teleconferences and Internet presentations
have been organized on the occasion of press releases
and financial reports over the year.
The cornerstone of the Company policy on investor re-
lations is to secure equal access for all shareholders
to all information. In order to secure equal access for
Icelandic and non-Icelandic investors, all information
is published simultaneously in Icelandic and English.
Through efficient reporting, the Company ensures that
all necessary information concerning the progress of
the Company is clear and contributes to the correct
price formation of the Company’s stock.
Information from Ossur hf.’s share ledger or concerning
the Company’s stock can be obtained by contacting the
Company’s share ledger by telephone (tel. 515-1339 or
515-1388) or by e-mail ([email protected]).
SHAREHOLDER INFORMATION ON THE INTERNETOssur hf.’s website hosts extensive information on the
Company. For example, stakeholders can read and
subscribe to press releases sent to the Iceland Stock
Exchange, monitor the price trends of their shares, read
the Company’s annual reports and listen to telecon-
ferences with the Company management for 10 days
following the conferences. The website also contains
information about the Company’s products.
www.ossur.com – www.ossur.com/investors
S T O C K S A N D S H A R E H O L D E R S
OSSUR_EN_ARS2005.indd 24 18.2.2005 12:21:04

25
ACCORDING TO THE ARTICLES OF ASSOCIATION OF OSSUR HF, THE FOLLOWING ISSUES ARE REQUIRED ITEMS OF BUSINESS AT EACH ANNUAL GENERAL MEETING:
1. The report of the Board of Directors on the activities of the Company in the preceding year of operation.
2. Submission of the annual Financial statements of the Company for the preceding year, for confirmation.
3. Decision on remuneration to the Members of the Board of Directors.
4. Decision on the disposal of the profit or loss of the Company for the fiscal year.
5. Elections to the Board of Directors pursuant to Section 5.01.
6. Election of the Company auditor pursuant to Section 7.02.
7. Any other business lawfully submitted or approved for discussion by the Meeting.
OSSUR STOCK PRICE TRENDS IN COMPARISON WITH STOCK MARKET INDICES IN 2004
PUBLICATION SCHEDULE FOR FINANCIAL REPORTS
28 April 1st quarter27 July 2nd quarter25 October 3rd quarter6 February 4th quarter24 February Annual General Meeting of Ossur hf. 2006
OSSUR HF. PRESS RELEASES IN 2004
2 February Ossur hf. Annual Financial Statement 13 February Results of the Annual General Meeting of Ossur hf.22 March Reduction in Share Capital reported29 April 1st quarter report3 June William Demant Invest A/S invests in Ossur hf.27 July 2nd quarter report7 October New bionic invention in partnership with Victhom.26 October 3rd quarter report22 November Rheo Knee featured in Time Magazine’s cover story “The Most
Amazing Inventions of 2004” 23 December Ossur hf. sells Mauch
LARGEST OSSUR HF. SHAREHOLDERS AT YEAR-END
Name Nominal Price of Stock %
01. Industrivärden AB 65.118.000 20,4502. Mallard Holding S.A. 59.531.846 18,6903. William Demant Invest A/S 51.382.101 16,1404. Eyrir fjárfestingafélag ehf 31.539.167 9,9005. Arion hf. v/viðskiptavina-safnreikningur 10.098.524 3,1706. Lífeyrissjóðurinn Framsýn 6.652.929 2,0907. Lífeyrissjóður verslunarmanna 6.613.305 2,0808. Vik Investment Holding S.a.r.L. 5.872.423 1,8408. Sameinaði lífeyrissjóðurinn 4.727.805 1,4810. Össur hf 4.469.051 1,4011. Fidelity Funds-Nordic Fund 3.169.344 1,0012. Lífeyrissjóður sjómanna 3.04.126 0,9713. Lífeyrissjóðurinn Lífiðn 2.897.295 0,9114. Verðbréfastofan hf 2.832.264 0,8915. Landsbanki Íslands hf, aðalstöðvar 1.780.466 0,56 Total Holdings of 15 Largest Shareholders 259.805.646 81,57 Other Shareholders 58.635.354 18,43 Total Shares 318.441.000 100
OSSUR HF. ANALYSTS 2004
Íslandsbanki hf.Atli Gudmundsson / [email protected] +354 664-4632
Kaupthing Bank hf.Davíd Rúdólfsson / [email protected] +354 444-6951
Landsbanki hf.Bjarki Logason / [email protected] +354 560-3137 Cazenove & Co, London
Mike Yates / [email protected] +44 207 155 8214
%04-
%02-
%0
%02
%04
%06
%08
%001
%021
%041
%061
January - March April - June July - August September - December
OMX 16,42%
ÖSSUR 75,46%
ICEX 58,90%
Nasdaq 8,59%
OSSUR_EN_ARS2005.indd 25 18.2.2005 12:21:06

26
OPERATING INCOMENet sales over the year amounted to USD 124.4 mil-
lion, as compared to USD 94.5 million in 2003, which
represents an increase of slightly less than USD 30 mil-
lion, or just over 32%. Last year was the first full year
of operation following the acquisition of Generation II,
whose sales of orthotic products were first included in
the consolidated accounts in the last quarter of 2003.
The increase in sales over the year measured in local
currencies was 8%, as compared to 2% in 2003. This
is based on continuous operations, where Generation II
sales are included for the entire year of 2003, with the
sale of discontinued units written out.
The average annual growth in sales from 2000 to 2004
has been just over 28%. The proportional division of
sales between market areas remained virtually un-
changed between years. The North American market
accounted for 53% of total sales, the European market
for 40% and other international markets 7%. The rapid
organic growth in the European market and other inter-
national markets weighed against the increase in sales
stemming from acquisitions, whose impact was felt pri-
marily in North America. The average exchange rate of
the euro against the US dollar strengthened substantial-
ly between 2003 and 2004, which also partially explains
this trend. A turning point was reached in the North
American market, where new management succeeded
in turning a 4% decline in prosthetic sales in 2003 into
an 8% increase in 2004. The principal factors in these
results were the restructuring of the sales system and
both new and renewed contracts with distributors.
There were some discernible changes in sales by pro-
duct category between years. Prosthetics accounted for
approximately 73% of total sales, orthotic products for
24% and other products for 3%. In 2003 the respective
ratios were 84% for prosthetics, 13% for orthotics and
3% for other products. The weight of the Icelandic mar-
ket was less than 2% of sales. The increased weight of
orthotic products in the total sales in 2004 are a result
of the expansion into the orthotics market, which began
in the fourth quarter of 2003.
Ossur had operations in eight places in the world in
2004. At year-end, Ossur withdrew from all its business
activities in Dayton, Ohio, selling its subsidiary, Mauch
Inc., and thereby all the manufacturing equipment and
business relationships relating to components for spinal
implants. Mauch’s sales in 2004 amounted to USD 2.2
million.
OPERATING EXPENSESOperating expenses before interest and taxes amounted
to USD 105 million, or approximately 84% of sale, as
compared to USD 88.6 million, or 94% of income, in
2003. General operations were quite successful, and all
key ratios were in line with targets. Gross profit amount-
ed to 60% of sales, profit from operations 16% and net
profit 12%. Earnings before interest, taxes, depreciation
and amortization (EBITDA) were 20%.
Any comparison between operations in 2004 and 2003
must take account of the fact that operating expens-
es in 2003 included extraordinary expenses resulting
from litigation, severance arrangements, restructur-
ing and other items, amounting to a total of USD 4.3
million, which corresponds to over 4% of sales in that
year. There were no significant extraordinary expenses
in 2004. Furthermore, note must be taken of the fact
that the operation of Generation II was included in the
Consolidation over the entire year of 2004, but only one
quarter in 2003. Concerning expenses, the merger of
this new operating unit with Ossur and efforts to achieve
significantly improved efficiency were quite successful.
Gross profit margin increased by just short of 3%. Gross
profit over the year was 60.2% of sales, as compared
to 57.4% in 2003. Excellent results were achieved in
the control of production processes and production
costs, but in addition increased sales have resulted in
improved utilization of production factors. The principal
production lines remained unchanged between years.
Sales and marketing expenses amounted to 21.5% of
sales in 2004, as compared to 22.5% in 2003. The re-
duction reaffirms the success of the merger of Genera-
tion II with Ossur. The ratio of sales costs to sales was
much higher in the Generation II companies than at
Ossur, which in fact should have led to an increase in
this expense item on the merger of the companies. The
successful cost cutting and restructuring of the sales
process is reflected in these results.
R&D expenses were 7.3%, down from 10.2% in the
preceding year. Virtually all research and development
costs were incurred within the Company and expensed
in the income statement. Ossur’s long-term target is to
P E R F O R M A N C E O V E R V I E W 2 0 0 4
The operating ratios for the last three years are as follows: 2004 2003 2002 Cost of goods sold 40% 43% 41%Gross profit 60% 57% 59%Sales & marketing expenses 22% 22% 21%Research & development expenses 7% 10% 9%General & administrative expenses 16% 19% 16%Profit from operations 16% 6% 14%Profit before tax 15% 6% 15%Tax rate 20% 18% 15%Net profit 12% 5% 12%EBITDA 20% 10% 18%
OSSUR_EN_ARS2005.indd 26 18.2.2005 12:21:07

27
allocate 6-8% of sales to research and development.
The ratio of research and development expenses in
2003 was unusually high owing to projects such as
the Rheo KneeTM and the development of Ossur’s first
orthotic products. The restructuring of the develop-
ment units, coupled with the fact that the Generation
II companies spent a lower proportion on development
than Ossur, also contributed to the falling cost ratio.
General and administrative expenses amounted to
15.8% of sales in 2004, as compared to 18.6% in
2003. The principal reason for the reduction between
years can be traced to the unusually high expenses re-
lating to structural changes and litigation in 2003.
FINANCIAL ITEMSNo new long-term loans were taken during the year.
The Company’s long-term borrowings fall into two prin-
cipal categories: on the one hand a fixed-interest bullet
loan in US dollars and euros and, on the other hand, a
variable-interest revolving credit facility in US dollars.
The amount of the revolving credit facility varies from
time to time, but has a ceiling of USD 15 million. At
year-end, 55% of the Company’s borrowings carried
fixed interest, while 45% carried variable interest. The
interest on the fixed-interest loans is 3.99% for the USD
tranche and 4.38% for the euro tranche. Approximately
80% of the long-term borrowings mature on a single
due date in 2008.
Interest income amounted to USD 256 thousand, while
financial expenses amounted to USD 1,617 thousand.
Taking exchange-rate gains into account, financial
items were negative by USD 1,232 thousand, as com-
pared to a negative outcome of USD 407 thousand in
the preceding year.
At year-end, 70% of the Company’s consolidated long-
term liabilities were in US dollars, while 30% were in
euros. Approximately 59% of the sales for the year was
in US dollars and Canadian dollars, and about 57% of
operating expenses. Sales in euros were 21% and ex-
penses were 14%. Revenues in European currencies
other than euros corresponded to 21% and expenses
to 29%. Of this figure, the weight of the Icelandic króna
was 1.7% in income and 23% in expenses. On the
whole, operating sales and operating expenses in US
dollars and European currencies were in good balance;
the general strategy of the Company is to limit currency
risk by promoting a currency balance in its operations.
No forward currency swaps, options or derivative con-
tracts are in effect within the Consolidation or its indi-
vidual companies.
INCOME TAXConsolidated income tax amounted to just over USD 4
million, which corresponds to slightly more than 20% of
total pre-tax income. The corresponding ratio in 2003
was 18%. The consolidated company as a whole is not
jointly taxed, although the U.S. sub-consolidation is. In
other regions, individual companies are independent
taxable entities. In the U.S. the consolidated company
is entitled to substantial tax concessions in connection
with its acquisitions in 2000. The income tax rate of the
parent company in Iceland is 18%, which is among the
most favorable tax terms available in the world. The fol-
lowing table shows the income tax ratios in the different
operation regions in 2004, excluding deductions and
concessions.
Iceland 18%United States:
California 40%Washington 38%Michigan 36%
Canada, British Columbia 38%Sweden 28%Netherlands 34,5%Germany 40%
PROFIT FOR THE YEAROperating profit for the year was just over USD 20.4
million, increasing by 233% from USD 6.1 million in the
preceding year. The ratio of operating profit to sales was
16%, as compared to 6% for 2003. Earnings before
interest, taxes, depreciation and amortization (EBITDA)
was just over USD 25 million, or 20%, as compared
to USD 9 million, or 10%, in the preceding year. Net
profit for the year was USD 15.2 million, as compared to
4.7 million in 2003, up by USD 10.6 million, or 227%.
Extraordinary expenses resulting from litigation, sever-
ance agreements, restructuring and other items added
approximately USD 4.3 million to operating expenses in
2003, which corresponds to over 4% of sales.
EARNINGS PER SHAREEarnings per share in 2004 came to 4.80 US cents,
as compared to 1.45 US cents in 2003, increasing by
232%. Earnings per share, taking account of stock
options, came to 4.80 US cents, as compared to 1.44
US cents in the preceding year. The annual average
growth in earnings per share from 2000 to 2004 has
been just over 34%.
OSSUR_EN_ARS2005.indd 27 18.2.2005 12:21:07
28
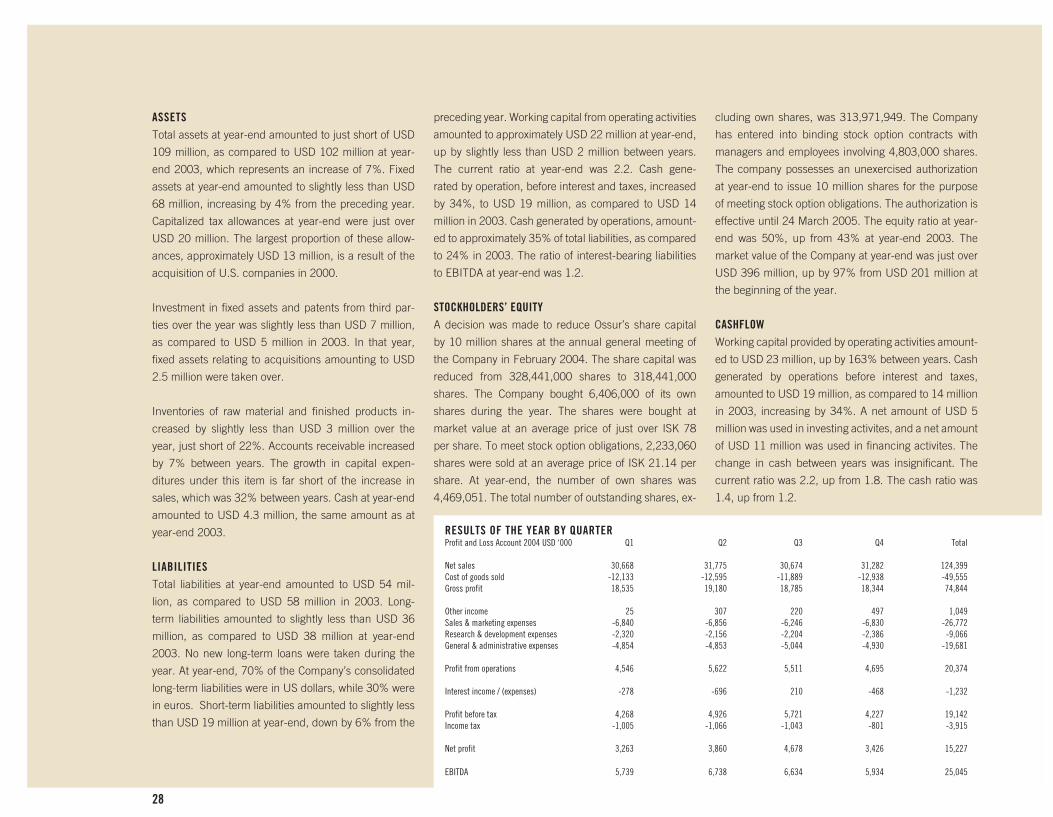
ASSETSTotal assets at year-end amounted to just short of USD
109 million, as compared to USD 102 million at year-
end 2003, which represents an increase of 7%. Fixed
assets at year-end amounted to slightly less than USD
68 million, increasing by 4% from the preceding year.
Capitalized tax allowances at year-end were just over
USD 20 million. The largest proportion of these allow-
ances, approximately USD 13 million, is a result of the
acquisition of U.S. companies in 2000.
Investment in fixed assets and patents from third par-
ties over the year was slightly less than USD 7 million,
as compared to USD 5 million in 2003. In that year,
fixed assets relating to acquisitions amounting to USD
2.5 million were taken over.
Inventories of raw material and finished products in-
creased by slightly less than USD 3 million over the
year, just short of 22%. Accounts receivable increased
by 7% between years. The growth in capital expen-
ditures under this item is far short of the increase in
sales, which was 32% between years. Cash at year-end
amounted to USD 4.3 million, the same amount as at
year-end 2003.
LIABILITIESTotal liabilities at year-end amounted to USD 54 mil-
lion, as compared to USD 58 million in 2003. Long-
term liabilities amounted to slightly less than USD 36
million, as compared to USD 38 million at year-end
2003. No new long-term loans were taken during the
year. At year-end, 70% of the Company’s consolidated
long-term liabilities were in US dollars, while 30% were
in euros. Short-term liabilities amounted to slightly less
than USD 19 million at year-end, down by 6% from the
preceding year. Working capital from operating activities
amounted to approximately USD 22 million at year-end,
up by slightly less than USD 2 million between years.
The current ratio at year-end was 2.2. Cash gene-
rated by operation, before interest and taxes, increased
by 34%, to USD 19 million, as compared to USD 14
million in 2003. Cash generated by operations, amount-
ed to approximately 35% of total liabilities, as compared
to 24% in 2003. The ratio of interest-bearing liabilities
to EBITDA at year-end was 1.2.
STOCKHOLDERS’ EQUITYA decision was made to reduce Ossur’s share capital
by 10 million shares at the annual general meeting of
the Company in February 2004. The share capital was
reduced from 328,441,000 shares to 318,441,000
shares. The Company bought 6,406,000 of its own
shares during the year. The shares were bought at
market value at an average price of just over ISK 78
per share. To meet stock option obligations, 2,233,060
shares were sold at an average price of ISK 21.14 per
share. At year-end, the number of own shares was
4,469,051. The total number of outstanding shares, ex-
cluding own shares, was 313,971,949. The Company
has entered into binding stock option contracts with
managers and employees involving 4,803,000 shares.
The company possesses an unexercised authorization
at year-end to issue 10 million shares for the purpose
of meeting stock option obligations. The authorization is
effective until 24 March 2005. The equity ratio at year-
end was 50%, up from 43% at year-end 2003. The
market value of the Company at year-end was just over
USD 396 million, up by 97% from USD 201 million at
the beginning of the year.
CASHFLOWWorking capital provided by operating activities amount-
ed to USD 23 million, up by 163% between years. Cash
generated by operations before interest and taxes,
amounted to USD 19 million, as compared to 14 million
in 2003, increasing by 34%. A net amount of USD 5
million was used in investing activites, and a net amount
of USD 11 million was used in financing activites. The
change in cash between years was insignificant. The
current ratio was 2.2, up from 1.8. The cash ratio was
1.4, up from 1.2.
RESULTS OF THE YEAR BY QUARTERProfit and Loss Account 2004 USD ‘000 Q1 Q2 Q3 Q4 Total Net sales 30,668 31,775 30,674 31,282 124,399Cost of goods sold -12,133 -12,595 -11,889 -12,938 -49,555Gross profit 18,535 19,180 18,785 18,344 74,844 Other income 25 307 220 497 1,049Sales & marketing expenses -6,840 -6,856 -6,246 -6,830 -26,772Research & development expenses -2,320 -2,156 -2,204 -2,386 -9,066General & administrative expenses -4,854 -4,853 -5,044 -4,930 -19,681 Profit from operations 4,546 5,622 5,511 4,695 20,374 Interest income / (expenses) -278 -696 210 -468 -1,232 Profit before tax 4,268 4,926 5,721 4,227 19,142Income tax -1,005 -1,066 -1,043 -801 -3,915 Net profit 3,263 3,860 4,678 3,426 15,227 EBITDA 5,739 6,738 6,634 5,934 25,045
OSSUR_EN_ARS2005.indd 28 18.2.2005 12:22:02

29
OSSUR_EN_ARS2005.indd 29 18.2.2005 12:22:52

30
O S S U R H F .C O N S O L I D A T E DF I N A N C I A L S T A T E M E N T S 2 0 0 4
OSSUR_EN_ARS2005.indd 30 18.2.2005 12:23:20
31
OSSUR_EN_ARS2005.indd 31 18.2.2005 12:23:28
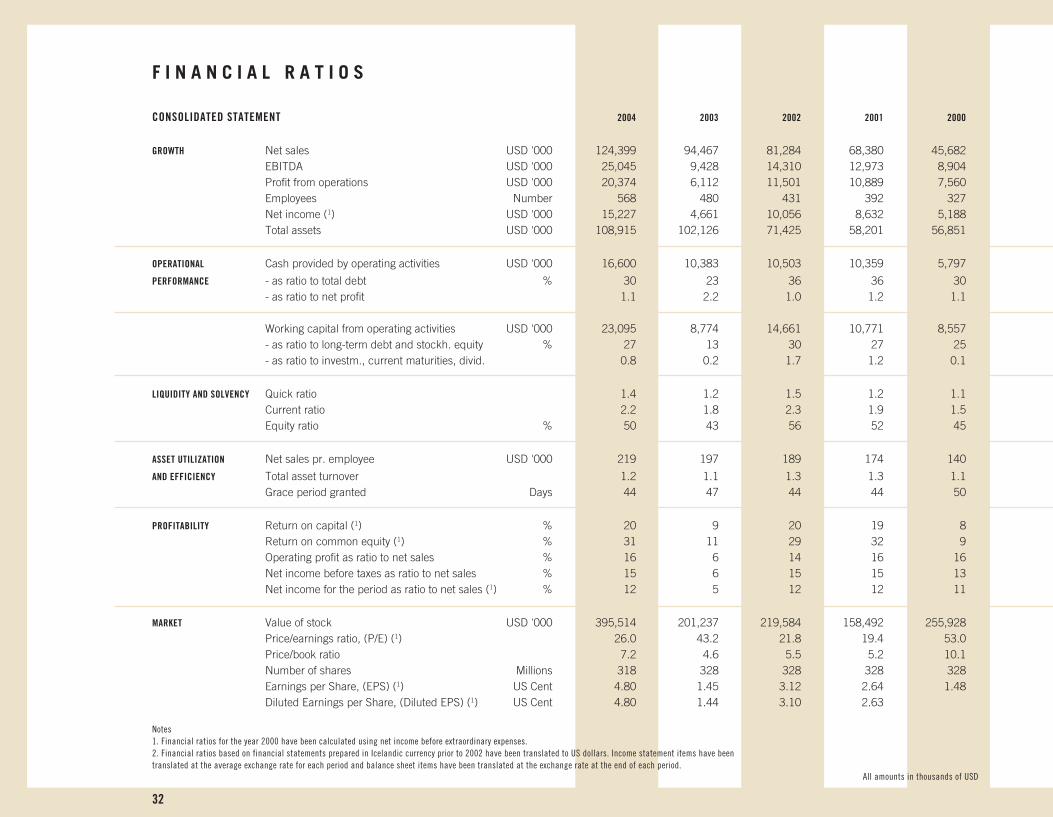
32
F I N A N C I A L R A T I O S
CONSOLIDATED STATEMENT 2004 2003 2002 2001 2000
GROWTH Net sales USD '000 124,399 94,467 81,284 68,380 45,682 EBITDA USD '000 25,045 9,428 14,310 12,973 8,904 Profit from operations USD '000 20,374 6,112 11,501 10,889 7,560 Employees Number 568 480 431 392 327 Net income (1) USD '000 15,227 4,661 10,056 8,632 5,188 Total assets USD '000 108,915 102,126 71,425 58,201 56,851
OPERATIONAL Cash provided by operating activities USD '000 16,600 10,383 10,503 10,359 5,797
PERFORMANCE - as ratio to total debt % 30 23 36 36 30 - as ratio to net profit 1.1 2.2 1.0 1.2 1.1
Working capital from operating activities USD '000 23,095 8,774 14,661 10,771 8,557 - as ratio to long-term debt and stockh. equity % 27 13 30 27 25 - as ratio to investm., current maturities, divid. 0.8 0.2 1.7 1.2 0.1
LIQUIDITY AND SOLVENCY Quick ratio 1.4 1.2 1.5 1.2 1.1 Current ratio 2.2 1.8 2.3 1.9 1.5 Equity ratio % 50 43 56 52 45
ASSET UTILIZATION Net sales pr. employee USD '000 219 197 189 174 140
AND EFFICIENCY Total asset turnover 1.2 1.1 1.3 1.3 1.1 Grace period granted Days 44 47 44 44 50
PROFITABILITY Return on capital (1) % 20 9 20 19 8 Return on common equity (1) % 31 11 29 32 9 Operating profit as ratio to net sales % 16 6 14 16 16 Net income before taxes as ratio to net sales % 15 6 15 15 13 Net income for the period as ratio to net sales (1) % 12 5 12 12 11
MARKET Value of stock USD '000 395,514 201,237 219,584 158,492 255,928 Price/earnings ratio, (P/E) (1) 26.0 43.2 21.8 19.4 53.0 Price/book ratio 7.2 4.6 5.5 5.2 10.1 Number of shares Millions 318 328 328 328 328 Earnings per Share, (EPS) (1) US Cent 4.80 1.45 3.12 2.64 1.48 Diluted Earnings per Share, (Diluted EPS) (1) US Cent 4.80 1.44 3.10 2.63
Notes1. Financial ratios for the year 2000 have been calculated using net income before extraordinary expenses.2. Financial ratios based on financial statements prepared in Icelandic currency prior to 2002 have been translated to US dollars. Income statement items have been translated at the average exchange rate for each period and balance sheet items have been translated at the exchange rate at the end of each period.
All amounts in thousands of USD
OSSUR_EN_ARS2005.indd 32 18.2.2005 12:23:29

33
It is the opinion of the Board of Directors and the Presi-
dent and CEO of Ossur hf., that these Financial State-
ments present the necessary information to evaluate the
financial position of the Company at year-end, the op-
erating results for the year and financial developments
during the year 2004. Ossur Financial statements are
prepared in accordance with IFRS reporting standards.
Ossur hf. designs, manufactures and sells prosthetic
and orthotic solutions. The Company’s headquarters
are located in Iceland, but the Company owns and op-
erates subsidiaries in the United States, Canada, Hol-
land and Sweden. The Company sells its products world
wide, but the principal market areas are North America
and Europe. In the year 2004, Ossur Consolidation con-
sisted of Ossur hf. in Iceland, the Ossur Holdings, Inc.
Consolidation in the United States, Generation II Orthot-
ics, Inc. in Canada, the Ossur Holding, A.B. Consolida-
tion in Sweden, and Ossur Europe B.V. in Holland.
The total sales of the Ossur Consolidation amounted to
USD 124.4 million, compared to USD 94.5 million in the
preceding year. This represents an increase in sales of
approximately 32%. Net profit amounted to USD 15.2
million compared to USD 4.7 million in 2003. Earnings
per Share (EPS) amounted to US cents 4.80 compared
to US cents 1.45 in 2003. Earnings before interests,
taxes, depreciation and amortization (EBITDA) amount-
ed to USD 25 million.
The total assets of the Ossur Consolidation amounted to
USD 108.9 million at year-end, liabilities were 54.2 mil-
lion, and equity was 54.7 million. The equity ratio at year-
end was 50%, compared to 43% the preceding year.
In the course of the year the Company employed 568
employees, of which 213 were employed by the parent
company in Iceland. Throughout 2003 an average of
480 employees were employed with the Company, of
which 184 were employed by the parent company.
During the year, the Company acquired 6.4 million of
treasury shares and handed over 2.2 million shares to
meet stock option agreements. The share price of the
Company was 76 at year-end, compared to 43.6 at the
beginning of the year. The market value of the Com-
pany at year-end was 396 million USD and increased
97% over the year. At year-end, shareholders in Ossur
hf. numbered 3,376, compared to 4,429 at the begin-
ning of the year. Three shareholders owned more than
R E P O R T B Y T H E B O A R D O F D I R E C T O R S A N D P R E S I D E N T A N D C E O
Reykjavik, February 7, 2005
Board of Directors
Petur GudmundarsonChairman of the Board
Ossur Kristinsson Gunnar Stefansson
Heimir Haraldsson Kristjan T. Ragnarsson
Sigurbjorn Thorkelsson Bengt Kjell
President and CEOJon Sigurdsson
10% of the shares in the Company at year-end: AB In-
dustrivärden, with 20.45%, Mallard Holding SA, with
18.69%, and William Demant Invest A/S, with 16.14%.
In its procedures, the Board of Directors complies with
the Articles of Association of the Company and Internal
Rules of Procedure set by the Board back in 1999. The
rules comply with the guideline on Corporate Governance
set in March 2004 by the Icelandic Stock Exchange, the
Iceland Chamber of Commerce and SA-Confederation
of Icelandic Employers. The Internal Rules address is-
sues such as allocation of responsibilities and power of
decision within the Board, independency issues, confi-
dentiality etc. An Audit Committee has not been set up
within the Board and the Board itself handles all issues
that would be decided by an Audit Committee. A Com-
pensation Committee is present within the Board. The
Compensation Committee decides on compensation for
the President & CEO. No Ossur employees are sitting on
the Board of Directors.
The Board of Directors does not recommend payment of
dividends to shareholders in 2005. As regards changes
in the equity of the Company, the Board refers to the
Notes attached to the Financial Statements.
The Board of Directors and President and CEO of Ossur hf. hereby confirm the Consolidated
Financial Statements of Ossur for the year 2004 with their signatures.
OSSUR_EN_ARS2005.indd 33 18.2.2005 12:23:30
34
To the Board of Directors and Shareholders of Ossur hf.
We have audited the accompanying Consolidated Bal-
ance Sheets of Ossur hf. and subsidiaries as of Decem-
ber 31, 2004, and the related Consolidated Statements
of Income and Cash Flows for the year then ended.
These Financial Statements are the responsibility of the
Company’s management. Our responsibility is to ex-
press an opinion on these Financial Statements based
on our audit. The Financial Statements of the foreign
subsidiaries of Ossur hf. were audited by Deloitte mem-
ber firms.
We conducted our audit in accordance with Interna-
tional Standards on Auditing. Those standards require
that we plan and perform the audit to obtain reasonable
assurance about whether the Financial Statements are
free of material misstatement. An audit includes exam-
ining, on a test basis, evidence supporting the amounts
and disclosures in the Financial Statements. An audit
also includes assessing the accounting principles used
and significant estimates made by management, as well
as evaluating the overall Financial Statement presenta-
tion. We believe that our audit provides a reasonable
basis for our opinion.
In our opinion, based on our own audit and the audit
reports on the Financial Statements of the foreign sub-
sidiaries of Ossur hf., the Consolidated Financial State-
ments give a true and fair view of the financial position
of Ossur hf. and subsidiaries as of December 31, 2004
and of the results of their operations and their cash flows
for the year then ended in accordance with International
Financial Reporting Standards.
A U D I T O R ’ S R E P O R T
Reykjavik, 7 February 2005
Deloitte hf.
Heimir Thorsteinsson
State Authorized Public Accountant
Thorvardur Gunnarsson
State Authorized Public Accountant
OSSUR_EN_ARS2005.indd 34 18.2.2005 12:23:30
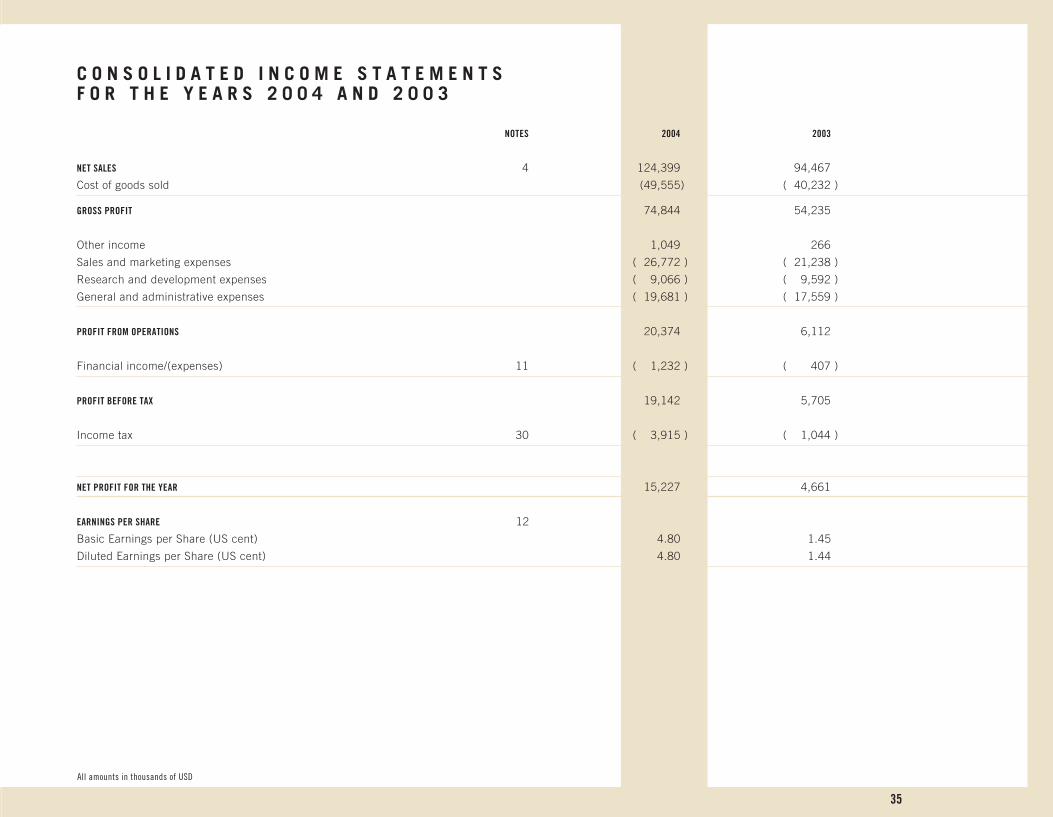
35
C O N S O L I D A T E D I N C O M E S T A T E M E N T S F O R T H E Y E A R S 2 0 0 4 A N D 2 0 0 3
NOTES 2004 2003
NET SALES 4 124,399 94,467
Cost of goods sold (49,555) ( 40,232 )
GROSS PROFIT 74,844 54,235
Other income 1,049 266
Sales and marketing expenses ( 26,772 ) ( 21,238 )
Research and development expenses ( 9,066 ) ( 9,592 )
General and administrative expenses ( 19,681 ) ( 17,559 )
PROFIT FROM OPERATIONS 20,374 6,112
Financial income/(expenses) 11 ( 1,232 ) ( 407 )
PROFIT BEFORE TAX 19,142 5,705
Income tax 30 ( 3,915 ) ( 1,044 )
NET PROFIT FOR THE YEAR 15,227 4,661
EARNINGS PER SHARE 12
Basic Earnings per Share (US cent) 4.80 1.45
Diluted Earnings per Share (US cent) 4.80 1.44
All amounts in thousands of USD
OSSUR_EN_ARS2005.indd 35 18.2.2005 12:23:31
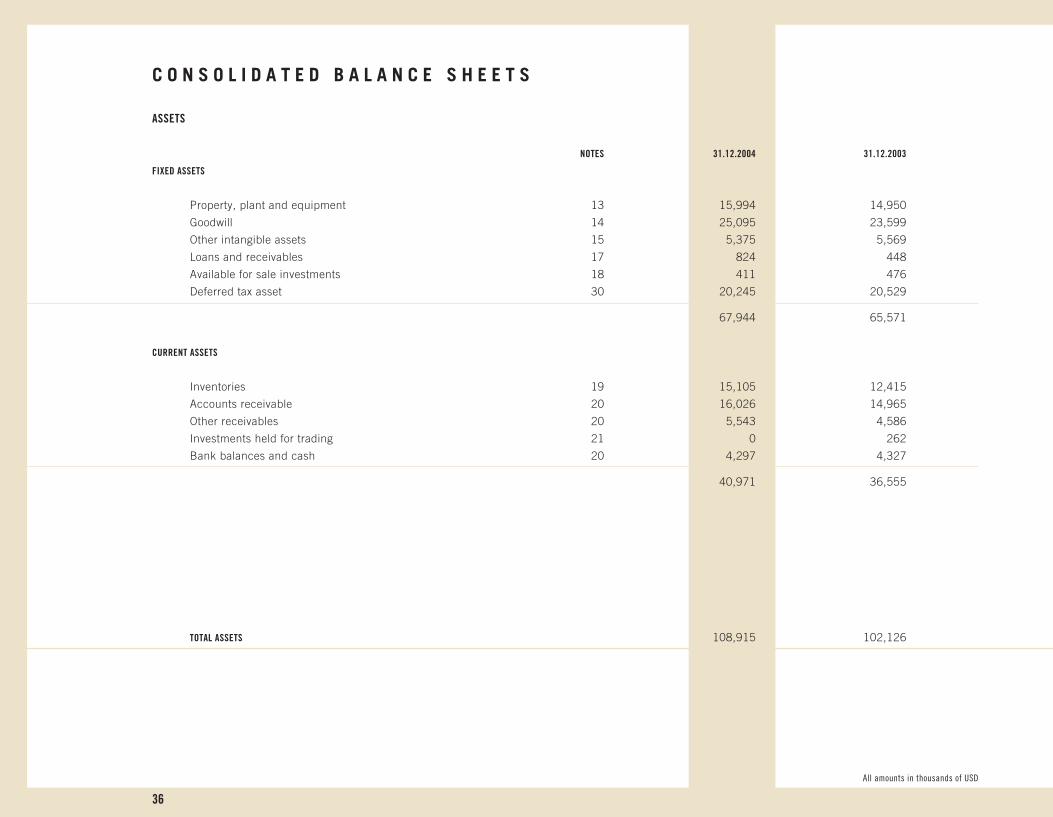
36
C O N S O L I D A T E D B A L A N C E S H E E T S
ASSETS
NOTES 31.12.2004 31.12.2003
FIXED ASSETS
Property, plant and equipment 13 15,994 14,950
Goodwill 14 25,095 23,599
Other intangible assets 15 5,375 5,569
Loans and receivables 17 824 448
Available for sale investments 18 411 476
Deferred tax asset 30 20,245 20,529
67,944 65,571
CURRENT ASSETS
Inventories 19 15,105 12,415
Accounts receivable 20 16,026 14,965
Other receivables 20 5,543 4,586
Investments held for trading 21 0 262
Bank balances and cash 20 4,297 4,327
40,971 36,555
TOTAL ASSETS 108,915 102,126
All amounts in thousands of USD All amounts in thousands of USD
OSSUR_EN_ARS2005.indd 36 18.2.2005 12:23:31

37
3 1 D E C E M B E R 2 0 0 4 A N D 2 0 0 3
EQUITY AND LIABILITIES
NOTES 31.12.2004 31.12.2003
STOCKHOLDERS’ EQUITY
Share capital 22 3,042 3,083
Capital reserves 23 17,747 24,412
Translation reserves 24 4,636 2,448
Accumulated profits 25 29,295 14,068
54,720 44,011
LONG-TERM LIABILITES
Loans from credit institutions 27 32,187 34,892
Obligation under finance leases 28 240 767
Other long-term liabilities 29 332 482
Deferred tax liabilities 30 2,863 2,206
35,622 38,347
CURRENT LIABILITES
Long-term liabilities – due within one year 31 2,556 3,314
Accounts payable 3,417 4,263
Tax liabilities 2,425 606
Other current liabilities 9,559 9,872
Provisions 32 616 1,713
18,573 19,768
TOTAL EQUITY AND LIABILITIES 108,915 102,126
All amounts in thousands of USD All amounts in thousands of USD
OSSUR_EN_ARS2005.indd 37 18.2.2005 12:23:31
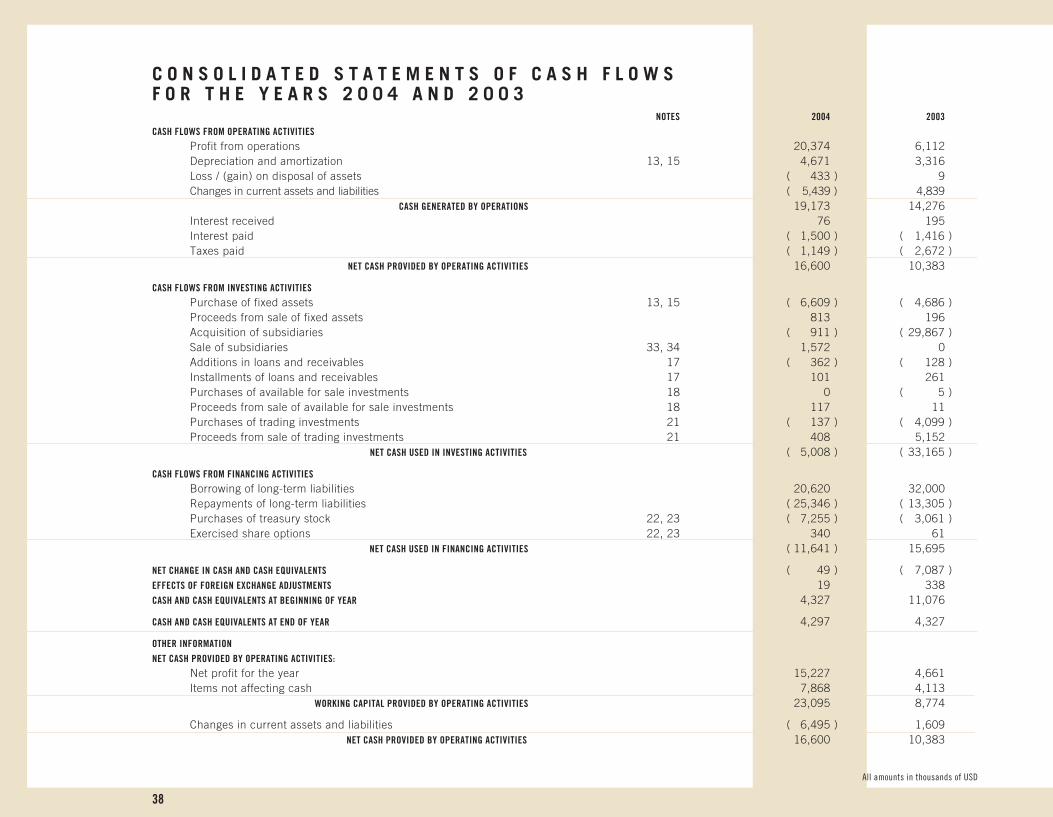
38
C O N S O L I D A T E D S T A T E M E N T S O F C A S H F L O W S F O R T H E Y E A R S 2 0 0 4 A N D 2 0 0 3 NOTES 2004 2003CASH FLOWS FROM OPERATING ACTIVITIES
Profit from operations 20,374 6,112 Depreciation and amortization 13, 15 4,671 3,316 Loss / (gain) on disposal of assets ( 433 ) 9 Changes in current assets and liabilities ( 5,439 ) 4,839
CASH GENERATED BY OPERATIONS 19,173 14,276 Interest received 76 195 Interest paid ( 1,500 ) ( 1,416 )Taxes paid ( 1,149 ) ( 2,672 )
NET CASH PROVIDED BY OPERATING ACTIVITIES 16,600 10,383
CASH FLOWS FROM INVESTING ACTIVITIES Purchase of fixed assets 13, 15 ( 6,609 ) ( 4,686 )Proceeds from sale of fixed assets 813 196 Acquisition of subsidiaries ( 911 ) ( 29,867 ) Sale of subsidiaries 33, 34 1,572 0 Additions in loans and receivables 17 ( 362 ) ( 128 ) Installments of loans and receivables 17 101 261 Purchases of available for sale investments 18 0 ( 5 ) Proceeds from sale of available for sale investments 18 117 11Purchases of trading investments 21 ( 137 ) ( 4,099 )Proceeds from sale of trading investments 21 408 5,152
NET CASH USED IN INVESTING ACTIVITIES ( 5,008 ) ( 33,165 )
CASH FLOWS FROM FINANCING ACTIVITIES Borrowing of long-term liabilities 20,620 32,000 Repayments of long-term liabilities ( 25,346 ) ( 13,305 )Purchases of treasury stock 22, 23 ( 7,255 ) ( 3,061 )Exercised share options 22, 23 340 61
NET CASH USED IN FINANCING ACTIVITIES ( 11,641 ) 15,695
NET CHANGE IN CASH AND CASH EQUIVALENTS ( 49 ) ( 7,087 ) EFFECTS OF FOREIGN EXCHANGE ADJUSTMENTS 19 338 CASH AND CASH EQUIVALENTS AT BEGINNING OF YEAR 4,327 11,076
CASH AND CASH EQUIVALENTS AT END OF YEAR 4,297 4,327
OTHER INFORMATION NET CASH PROVIDED BY OPERATING ACTIVITIES:
Net profit for the year 15,227 4,661 Items not affecting cash 7,868 4,113
WORKING CAPITAL PROVIDED BY OPERATING ACTIVITIES 23,095 8,774
Changes in current assets and liabilities ( 6,495 ) 1,609 NET CASH PROVIDED BY OPERATING ACTIVITIES 16,600 10,383
All amounts in thousands of USD All amounts in thousands of USD
OSSUR_EN_ARS2005.indd 38 18.2.2005 12:23:32

39
All amounts in thousands of USD All amounts in thousands of USD
C O N S O L I D A T E D S T A T E M E N T O F C H A N G E S I N E Q U I T YF O R T H E P E R I O D E N D E D 3 1 D E C E M B E R 2 0 0 4
SHARE CAPITAL TRANSLATION ACCUMULATED CAPITAL RESERVES RESERVES PROFITS TOTAL
Balance at 1 January 2003 3,123 26,903 368 9,467 39,861Translation difference of shares in foreign companies 2,080 2,080Net gains / losses not recognised in the income statement 0 0 2,080 0 2,080Purchases of treasury stock ( 50 ) ( 3,011 ) ( 3,061 )Exercised share options 2 59 61Allocation of treasury stock to sellers of subsidiaries 8 401 409Net profit for the year 4,661 4,661Transferred to statutory reserves 60 ( 60 ) 0
Balance at 1 January 2004 3,083 24,412 2,448 14,068 44,011
Translation difference of shares in foreign companies 2,318 2,318Net gains / losses not recognised in the income statement 0 0 2,318 0 2,318Transfered to income due to sale of subsidiaries ( 130 ) ( 130 )Purchases of treasury stock ( 62) ( 7,193 ) ( 7,255 )Exercised share options 16 324 340Allocation of treasury stock to sellers of subsidiaries 5 204 209 Net profit for the year 15,227 15,227
Balance at 31 December 2004 3,042 17,747 4,636 29,295 54,720
OSSUR_EN_ARS2005.indd 39 18.2.2005 12:23:32
40
1. OPERATIONSOssur hf. designs, manufactures and markets prosthetic
and orthotic solutions. The principal products manufac-
tured by the Company include liners, sockets, prosthetic
feet, prosthetic knees, various components used for
the manufacture of artificial limbs and ankle and knee
braces. The principal market areas of the Company are
North America and Europe, which are served by com-
panies in the United States, Canada, Sweden and the
Netherlands, in addition to the Iceland-based parent
company.
The production and assembly of the Company’s prod-
ucts was conducted in seven places during the period:
at Ossur North America, Inc., in Aliso Viejo, California,
which assembled prosthetic feet; at Ossur Engineer-
ing, Inc. in Albion, Michigan, which manufactured
prosthetic knees; at Mauch, Inc. in Dayton, Ohio,
which manufactured components for spinal implants,
and at Ossur hf. in Iceland, which manufactured lin-
ers, prosthetic feet and components. Orthotic devices
were manufactured at Ossur hf. in Iceland, Generation
II in Vancouver, Canada and Generation II in Seattle
in the US. The parent company operated a prosthetic
workshop in Iceland.
According to organizational structure, the consolidation
is divided into four divisions, i.e. Corporate Finance; re-
sponsible for overall financial management; Manufac-
turing & Operations, responsible for all production and
inventory management; Sales and Marketing, respon-
sible for overall marketing and sales units and R&D and
Product Management; responsible for Quality Control,
Product Development and New Product Management.
Localized marketing, sales distribution and services is
handled by four independent sales companies, Ossur
North America, Inc. in California, the Generation II Op-
erations in Canada, Ossur Europe, B.V., Netherlands,
and Ossur Nordic, AB, Sweden.
2. SUMMARY OF SIGNIFICANT ACCOUNTING POLICIESThe Consolidated Financial Statements have been pre-
pared in accordance with International Financial Re-
porting Standards (IFRS) and are prepared under the
historical cost convention except for revaluation of cer-
tain financial instruments.
The preparation of the Consolidated Financial State-
ments in conformity with generally accepted accounting
principles requires management to make estimates and
assumptions that affect the reported amounts of assets
and liabilities and disclosure of contingent assets and
liabilities at the date of the Consolidated Financial State-
ments and the reported amounts of revenues and ex-
penses during the reporting period. Actual results could
differ from those estimates.
The principal accounting policies adopted are set out
below.
BASIS OF CONSOLIDATIONThe Consolidated Financial Statements incorporate
the financial statements of the Company and enter-
prises controlled by the Company (its subsidiaries).
Control is achieved where the Company has the power
to govern the financial and operating policies of an
investee enterprise so as to obtain benefits from its
activities.
The Consolidated Financial Statements have been pre-
pared using the purchase method of consolidation ac-
counting. When ownership in subsidiaries is less than
100%, the minority interest in the subsidiaries’ income
or loss and stockholders equity is accounted for in the
calculation of the consolidated income or loss and the
consolidated stockholders equity. Immaterial minority
interest is not accounted for in the Consolidated Finan-
cial Statements.
On acquisition, the assets and liabilities of a subsidiary
are measured at their fair values at the date of acquisi-
tion. Any excess of the cost of acquisition over the fair
values of the identifiable net assets acquired is recog-
nised as goodwill.
The results of subsidiaries acquired or disposed of dur-
ing the period are included in the Consolidated Income
Statement from the effective date of acquisition or up to
the effective date of disposal, as appropriate.
One of the purposes of Consolidated Financial State-
ments is to show only the net external sales, expenses,
assets and liabilities of the consolidated entities as a
whole. Hence, intercompany transactions have been
eliminated within the consolidated businesses in the
presentation of the Consolidated Financial Statements.
Unrealised gain in inventories resulting from intercom-
pany transactions has been eliminated and calculated
income tax in the Consolidated Financial Statements
adjusted accordingly.
Where necessary, adjustments are made to the financial
statements of subsidiaries to bring the accounting poli-
cies used into line with those used by other members of
the Consolidation.
GOODWILLGoodwill arising on consolidation represents the ex-
cess of the cost of acquisition over the Consolidations
N O T E S T O T H E F I N A N C I A L S T A T E M E N T S
All amounts in thousands of USD All amounts in thousands of USD
OSSUR_EN_ARS2005.indd 40 18.2.2005 12:23:33

41
interest in the fair value of the identifiable assets and
liabilities of a subsidiary at the date of acquisition.
Goodwill is recognised as an asset and reviewed for
impairment at each balance sheet date. The amount
of impairment is calculated using discounted expected
future cash flows. The discount rate applied to these
cash flows is based on weighted average cost of capi-
tal, which represents the cost of debt and equity after
taxation. Impairment charges are measured on the ba-
sis of comparison of estimated fair values (discounted
expected future cash flows) with corresponding book
values.
RISK MANAGEMENTOssur hf. overall philosophy towards foreign exchange
risk is to manage risk by applying natural hedging to as
much extent as possible and that way keep risk within
acceptable level. The company does not apply forward
contracts, derivatives or other form of financial hedg-
ing tools.
Long term financing is managed from Corporate Fi-
nance and individual subsidiaries do not engage in sub-
stantial external financing contracts with banks or credit
institutions. Approximately 55% of the companies long
term debt contracts have fixed interests which limits the
exposure towards fluctuation in long term interest.
Almost 80% of the company’s long term debt are bul-
let loans that will become due 2008. Interests are paid
periodically. This limits considerably the cash flow
and the liquidity risk for the company for the next 3-
4 years. The loans are however subject to financial
covenants the major ones being debt to EBITDA ratio
and equity ratio.
The company is outset for normal business risk in col-
lecting accounts receivable. Adequate allowance is
made for bad debt expenses.
REVENUE RECOGNITIONRevenue from product sales are recognized when
earned as required by generally accepted accounting
principles. Product sales are recognised when goods
are delivered and title has passed and are shown in the
Income Statement net of value added tax, discount and
internal sales.
Interest income is accrued on a time basis, by reference
to the principal outstanding and at the interest rate ap-
plicable.
LEASINGLeases are classified as finance leases whenever the
terms of the lease transfer substantially all the risks and
rewards of ownership to the lessee. All other leases are
classified as operating leases. Assets held under finance
leases are recognised as assets at their cost value at
the date of acquisition. The corresponding liability to the
lessor is included in the balance sheet as an obligation
under finance leases.
FOREIGN CURRENCIESTransactions in currencies other than USD are initial-
ly recorded at the rates of exchange prevailing on the
dates of the transactions. Monetary assets and liabilities
denominated in such currencies are retranslated at the
rates prevailing on the balance sheet date. Profits and
losses arising on exchange are included in net profit or
loss for the period.
For consolidation purposes, the assets and liabilities of
the consolidation’s overseas operations are translated
at exchange rates prevailing on the balance sheet date.
Income and expense items are translated at the aver-
age exchange rates for each quarter. Translation differ-
ences from foreign companies are posted to translation
reserves among equity. Such translation differences are
recognised as income or as expenses in the period in
which the operation is disposed of.
BORROWING COSTSAll borrowing costs are expensed in the period they
incur.
TAXATIONThe income tax currently payable is based on taxable
profit for the period. Taxable profit differs from net
profit as reported in the income statement because it
excludes items of income or expense that are taxable or
deductible in other periods and it further excludes items
that are never taxable or deductible. The consolidated
company’s current tax liability is calculated using the tax
rates for each country.
Deferred tax is the tax expected to be payable or re-
coverable on differences between the carrying amount
of assets and liabilities in the financial statements and
the corresponding tax basis used in the computation
of taxable profit. Deferred tax liabilities are gener-
ally recognised for all taxable temporary differences
and deferred tax assets are recognised to the extent
that it is probable that taxable profits will be available
against which deductible temporary differences can
be utilised. Such assets and liabilities are not recog-
nised if the temporary difference arises from goodwill
(or negative goodwill) or from the initial recognition
(other than in a business combination) of other assets
and liabilities in a transaction which affects neither the
tax profit nor the accounting profit. Deferred tax assets
and liabilities are offset when they relate to income
All amounts in thousands of USD All amounts in thousands of USD
OSSUR_EN_ARS2005.indd 41 18.2.2005 12:23:34

42
All amounts in thousands of USD All amounts in thousands of USD
taxes levied by the same taxation authority and the
Group intends to settle its current tax assets and li-
abilities on a net basis.
The carrying amount of deferred tax assets is reviewed
at each balance sheet date and reduced to the extent
that it is no longer probable that sufficient taxable profit
will be available to allow all or part of the asset to be
recovered.
Deferred tax is calculated at the tax rates that are ex-
pected to apply to the period when the asset is realised
or the liability is settled. Deferred tax is charged or cred-
ited in the income statement, except when it relates to
items credited or charged directly to equity, in which
case the deferred tax is also dealt with in equity.
In the preparation of the Consolidated Financial State-
ments, accumulated gains in inventories from inter-
company transactions are eliminated. This has an ef-
fect on the income tax expenses of the consolidated
companies and an adjustment is included in the de-
ferred tax asset. Income tax expense is calculated in
accordance with tax rates in the countries where the
inventories originate.
PROPERTY, PLANT AND EQUIPMENTProperty, plant and equipment are recognised as an as-
set when it is probable that future economic benefits
associated with the asset will flow to the consolidation
and the cost of the asset can be measured in a reliable
manner.
Property, plant and equipment which qualifies for rec-
ognition as an asset is initially measured at cost.
The cost of a property, plant and equipment com-
prises its purchase price and any directly attributable
cost of bringing the asset to working condition for its
intended use.
The depreciable amount of the asset is allocated on a
straight-line basis over its useful life. The depreciation
charge for each year is recognised as an expense, on
the following bases:
Buildings 5%
Fixtures and furniture 10-34%
Automobiles 10-32%
Machinery and equipment 12-20%
Assets held under finance leases are depreciated over
their expected useful lives on the same basis as owned
assets.
The gain or loss arising on the disposal or retirement of
an asset is determined as the difference between the
sales proceeds and the carrying amount of the asset
and is recognised in the income statement.
OTHER INTANGIBLE ASSETSOther intangible assets are recognised in an acquisition
of subsidiaries only if an asset can be identified (such as
patents and new technical solutions), it is probable that
the asset will generate future economic benefits and the
cost of the asset can be measured reliably.
Other intangible assets consist of capitalized develop-
ment expenses from previous years and the cost of
obtaining patents and technical solutions. Intangible
assets include non-compete agreements, non-disclo-
sure agreements, patented and unpatented technology.
These intangible assets will be amortized on a straight-
line basis over their useful life. The amortization charge
for each period is recognised as an expense. The amor-
tization charge for each year is recognised as expense,
on the following bases:
Patent 10-25%
Development cost 20%
Other intangible assets 20%
All research and development costs and costs relating to
internally-generated patents incurred during the period
are expensed.
INVESTMENTSInvestments in securities are recognised on a trade-date
basis and are initially measured at cost.
Bonds and long-term receivables which the company
has the expressed intention and ability to hold to ma-
turity (Investments held to maturity or loans and receiv-
ables) are valued at cost, less an allowance for estimated
irrecoverable amounts.
Investments other than held to maturity are classified
as either held for trading or available for sale, and are
measured at subsequent reporting dates at fair value.
Gains and losses arising from changes in fair value are
included in net profit or loss for the period.
IMPAIRMENTAt each balance sheet date, the company reviews the
carrying amounts of its tangible and intangible assets
to determine whether there is any indication that those
assets have suffered an impairment loss. If any such
indication exists, the recoverable amount of the asset is
estimated in order to determine the extent of the impair-
OSSUR_EN_ARS2005.indd 42 18.2.2005 12:23:35

43
ment loss (if any). Where it is not possible to estimate
the recoverable amount of an individual asset, the Com-
pany estimates the recoverable amount of the cash-gen-
erating unit to which the asset belongs.
Recoverable amount is the greater of net selling price
and value in use. In assessing value in use, the esti-
mated future cash flows are discounted to their present
value using a pre-tax discount rate that reflects current
market assessments of the time value of money and the
risks specific to the asset.
If the recoverable amount of an asset is estimated to be
less than its carrying amount, the carrying amount of the
asset is reduced to its recoverable amount. Impairment
losses are recognised as an expense immediately.
Where an impairment loss subsequently reverses, the
carrying amount of the asset is increased to the revised
estimate of its recoverable amount, but so that the in-
creased carrying amount does not exceed the carry-
ing amount that would have been determined had no
impairment loss been recognised for the asset in prior
years. A reversal of an impairment loss is recognised as
income immediately, unless the relevant asset is carried
at a revalued amount, in which case the reversal of the
impairment loss is treated as a revaluation increase.
INVENTORIESInventories are stated at the lower of cost or net real-
isable value, after taking obsolete and defective goods
into consideration. Cost comprises direct materials and,
where applicable, direct labor costs and those overhead
expenses that have been incurred in bringing the in-
ventories to their present location and condition. Cost
is calculated using the standard costing method. Net
realisable value represents the estimated selling price
less all estimated costs to completion and costs to be
incurred in marketing, selling and distribution.
ACCOUNTS RECEIVABLEAccounts receivables are valued at nominal value less
an allowance for doubtful accounts. The allowance is
deducted from accounts receivable in the balance sheet
and does not represent a final write-off. Accounts re-
ceivable in other currencies than USD, have been en-
tered at the exchange rates prevailing on the balance
sheet date.
STOCK OPTION CONTRACTS AND OBLIGATIONS TO INCREASE
SHARE CAPITAL
The consolidated companies have made stock option
agreements with directors, employees and other par-
ties relating to operations. Furthermore, a portion of the
purchase price of companies purchased by the consoli-
dation is contingent upon the achievement of specified
operating results. These agreements represent an obli-
gation to increase share capital in the future.
On 1 January 2004, Ossur Consolidated applied the re-
quirement of IFRS 2 Share-based Payments. In accor-
dance with the transition provisions, IFRS will be applied
to all options granted after 7 November 2002 that were
unvested as of 1 January 2004. All options in Ossur hf.
were granted prior to 7 November 2002.
LONG-TERM LIABILITIESLong-term liabilities are valued at nominal value less
payments made and the remaining nominal balance is
adjusted by exchange rate or index, if applicable. Long-
term liabilities in other currency than USD, are recorded
at the exchange rates prevailing on the balance sheet
date. Interest expense is accrued on a periodical basis,
based on the principal outstanding and at the interest
rate applicable. Borrowing fees are expensed in the pe-
riod they are incurred.
ACCOUNTS PAYABLEAccounts payable are valued at nominal value and ac-
counts payable in other currencies than USD have been
booked at the exchange rates prevailing on the balance
sheet date.
PROVISIONSProvision is recognised when an enterprise has a pres-
ent obligation as a result of a past event, it is probable
that an outflow of resources embodying economic bene-
fits will be required to settle the obligation and a reliable
estimate can be made of the amount of the obligation.
Provisions for warranty costs are recognised at the date
of sale of the relevant products, at the directors’ best
estimate of the expenditure required to settle the Con-
solidation’s liability.
Provisions for restructuring costs are recognised when
the company has a detailed formal plan for the restruc-
turing which has been notified to affected parties.
All amounts in thousands of USD All amounts in thousands of USD
OSSUR_EN_ARS2005.indd 43 18.2.2005 12:23:35
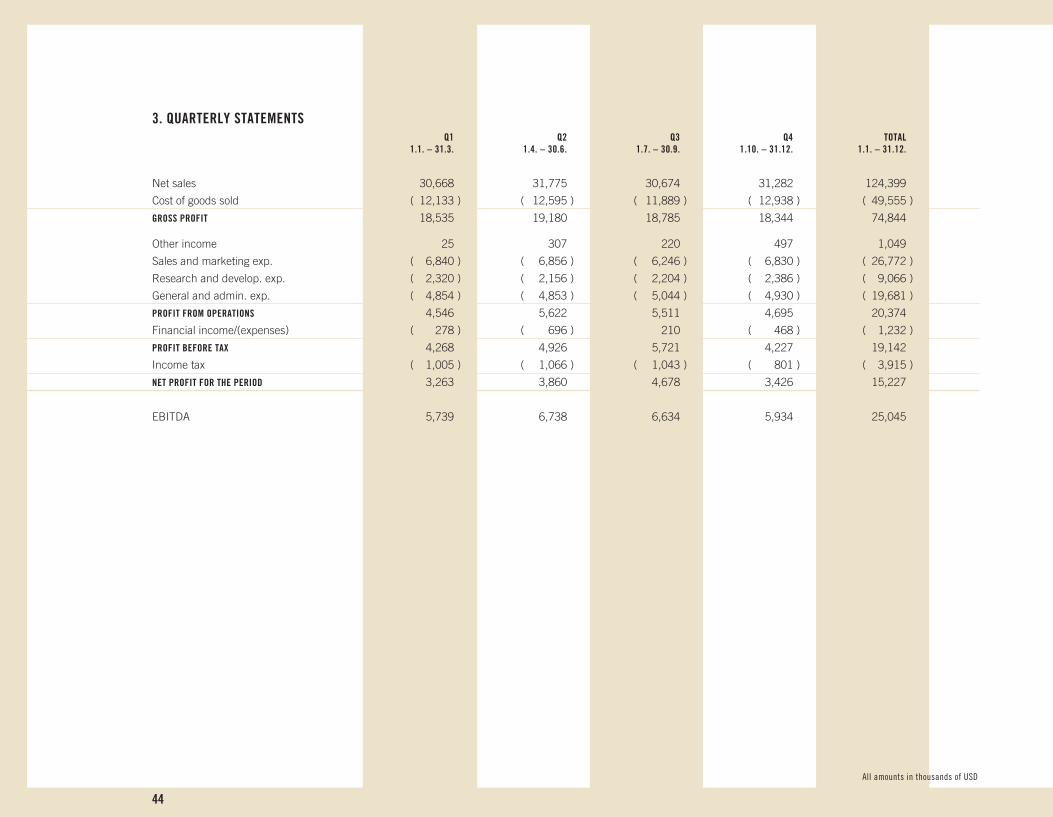
44
3. QUARTERLY STATEMENTS Q1 Q2 Q3 Q4 TOTAL 1.1. – 31.3. 1.4. – 30.6. 1.7. – 30.9. 1.10. – 31.12. 1.1. – 31.12.
Net sales 30,668 31,775 30,674 31,282 124,399
Cost of goods sold ( 12,133 ) ( 12,595 ) ( 11,889 ) ( 12,938 ) ( 49,555 )
GROSS PROFIT 18,535 19,180 18,785 18,344 74,844
Other income 25 307 220 497 1,049
Sales and marketing exp. ( 6,840 ) ( 6,856 ) ( 6,246 ) ( 6,830 ) ( 26,772 )
Research and develop. exp. ( 2,320 ) ( 2,156 ) ( 2,204 ) ( 2,386 ) ( 9,066 )
General and admin. exp. ( 4,854 ) ( 4,853 ) ( 5,044 ) ( 4,930 ) ( 19,681 )
PROFIT FROM OPERATIONS 4,546 5,622 5,511 4,695 20,374
Financial income/(expenses) ( 278 ) ( 696 ) 210 ( 468 ) ( 1,232 )
PROFIT BEFORE TAX 4,268 4,926 5,721 4,227 19,142
Income tax ( 1,005 ) ( 1,066 ) ( 1,043 ) ( 801 ) ( 3,915 )
NET PROFIT FOR THE PERIOD 3,263 3,860 4,678 3,426 15,227
EBITDA 5,739 6,738 6,634 5,934 25,045
All amounts in thousands of USD All amounts in thousands of USD
OSSUR_EN_ARS2005.indd 44 18.2.2005 12:23:36

45
4. NET SALES
Net sales are specified as follows according to markets: 2004 2003
North America 65,899 49,488
Europe, other 32,620 24,387
Nordic 17,722 14,089
International markets 8,158 6,503
124,399 94,467
Net sales are specified as follows according to currency: 2004 2003
Canadian dollar, CAD 9,187 4,046
Swiss Franc, CHF 958 656
Euro, EUR 25,504 18,999
British Pound, GBP 7,482 5,760
Icelandic Krona, ISK 2,178 1,629
Norwegian Krona, NOK 4,950 3,873
Swedish Krona, SEK 10,265 8,404
US Dollar, USD 63,875 51,100
124,399 94,467
All amounts in thousands of USD All amounts in thousands of USD
OSSUR_EN_ARS2005.indd 45 18.2.2005 12:23:36
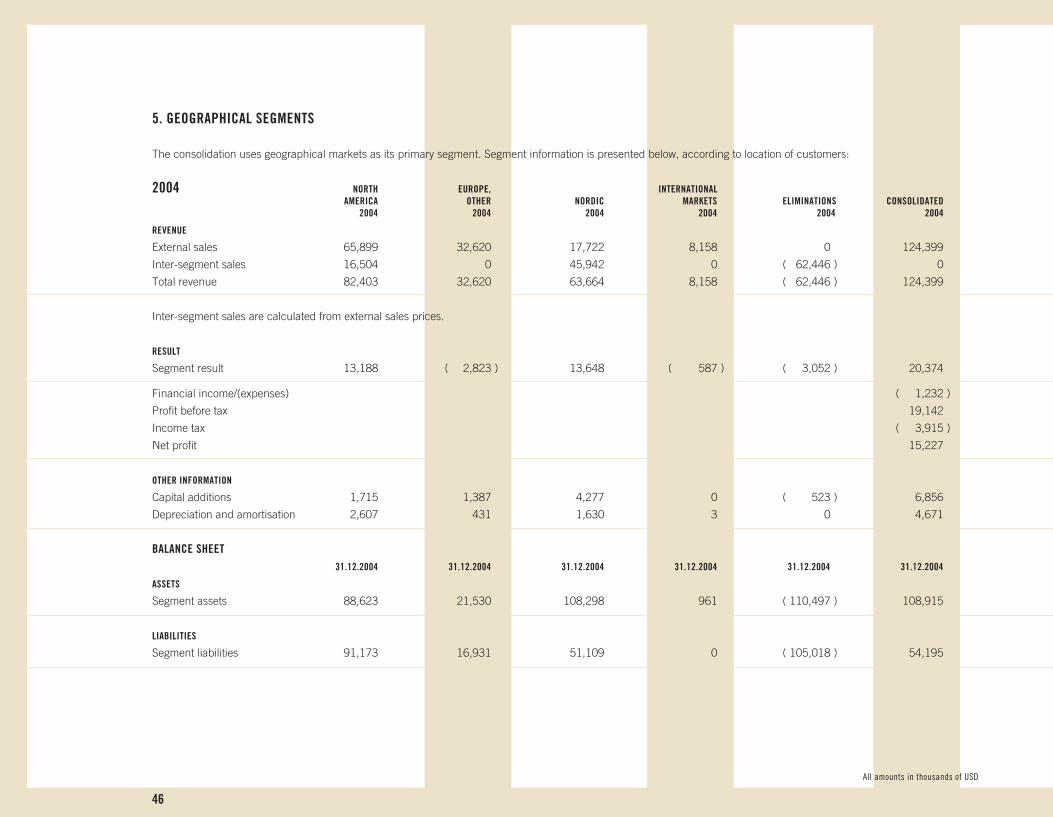
46
5. GEOGRAPHICAL SEGMENTS
The consolidation uses geographical markets as its primary segment. Segment information is presented below, according to location of customers:
2004 NORTH EUROPE, INTERNATIONAL AMERICA OTHER NORDIC MARKETS ELIMINATIONS CONSOLIDATED 2004 2004 2004 2004 2004 2004
REVENUE
External sales 65,899 32,620 17,722 8,158 0 124,399
Inter-segment sales 16,504 0 45,942 0 ( 62,446 ) 0
Total revenue 82,403 32,620 63,664 8,158 ( 62,446 ) 124,399
Inter-segment sales are calculated from external sales prices.
RESULT
Segment result 13,188 ( 2,823 ) 13,648 ( 587 ) ( 3,052 ) 20,374
Financial income/(expenses) ( 1,232 )
Profit before tax 19,142
Income tax ( 3,915 )
Net profit 15,227
OTHER INFORMATION
Capital additions 1,715 1,387 4,277 0 ( 523 ) 6,856
Depreciation and amortisation 2,607 431 1,630 3 0 4,671
BALANCE SHEET 31.12.2004 31.12.2004 31.12.2004 31.12.2004 31.12.2004 31.12.2004
ASSETS
Segment assets 88,623 21,530 108,298 961 ( 110,497 ) 108,915
LIABILITIES
Segment liabilities 91,173 16,931 51,109 0 ( 105,018 ) 54,195
All amounts in thousands of USD All amounts in thousands of USD
OSSUR_EN_ARS2005.indd 46 18.2.2005 12:23:36
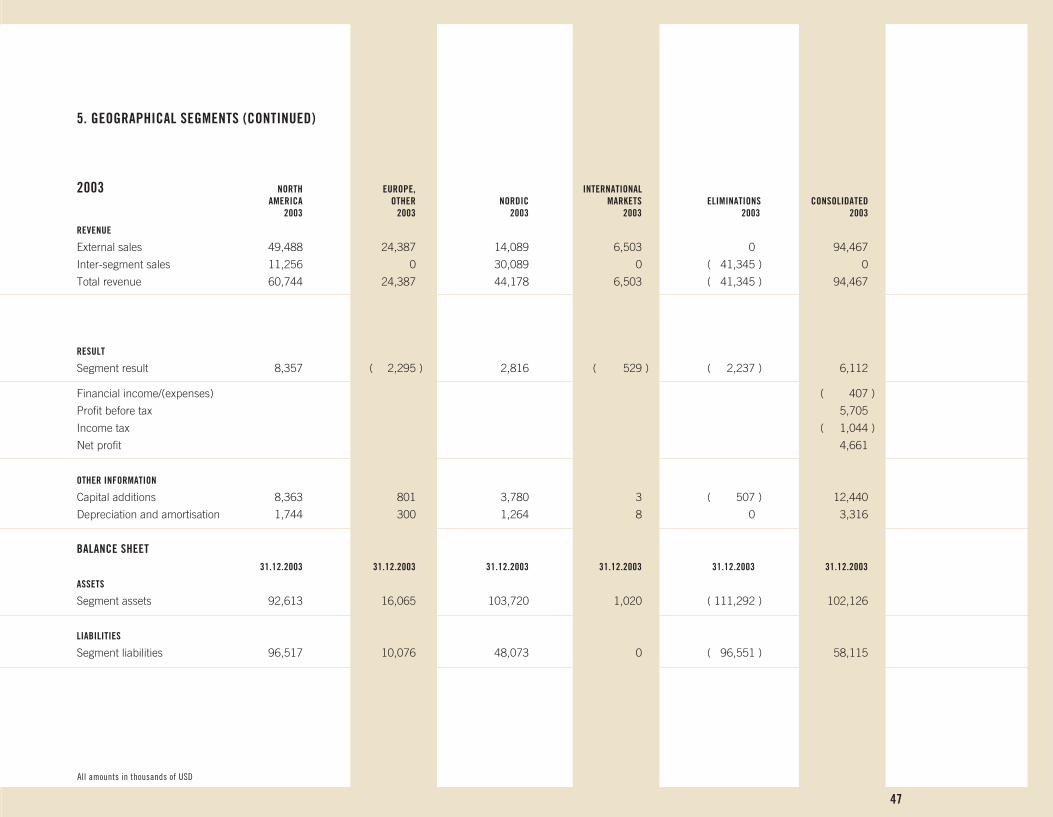
47
All amounts in thousands of USD All amounts in thousands of USD
5. GEOGRAPHICAL SEGMENTS (CONTINUED)
2003 NORTH EUROPE, INTERNATIONAL AMERICA OTHER NORDIC MARKETS ELIMINATIONS CONSOLIDATED 2003 2003 2003 2003 2003 2003
REVENUE
External sales 49,488 24,387 14,089 6,503 0 94,467
Inter-segment sales 11,256 0 30,089 0 ( 41,345 ) 0
Total revenue 60,744 24,387 44,178 6,503 ( 41,345 ) 94,467
RESULT
Segment result 8,357 ( 2,295 ) 2,816 ( 529 ) ( 2,237 ) 6,112
Financial income/(expenses) ( 407 )
Profit before tax 5,705
Income tax ( 1,044 )
Net profit 4,661
OTHER INFORMATION
Capital additions 8,363 801 3,780 3 ( 507 ) 12,440
Depreciation and amortisation 1,744 300 1,264 8 0 3,316
BALANCE SHEET 31.12.2003 31.12.2003 31.12.2003 31.12.2003 31.12.2003 31.12.2003
ASSETS
Segment assets 92,613 16,065 103,720 1,020 ( 111,292 ) 102,126
LIABILITIES
Segment liabilities 96,517 10,076 48,073 0 ( 96,551 ) 58,115
OSSUR_EN_ARS2005.indd 47 18.2.2005 12:23:37
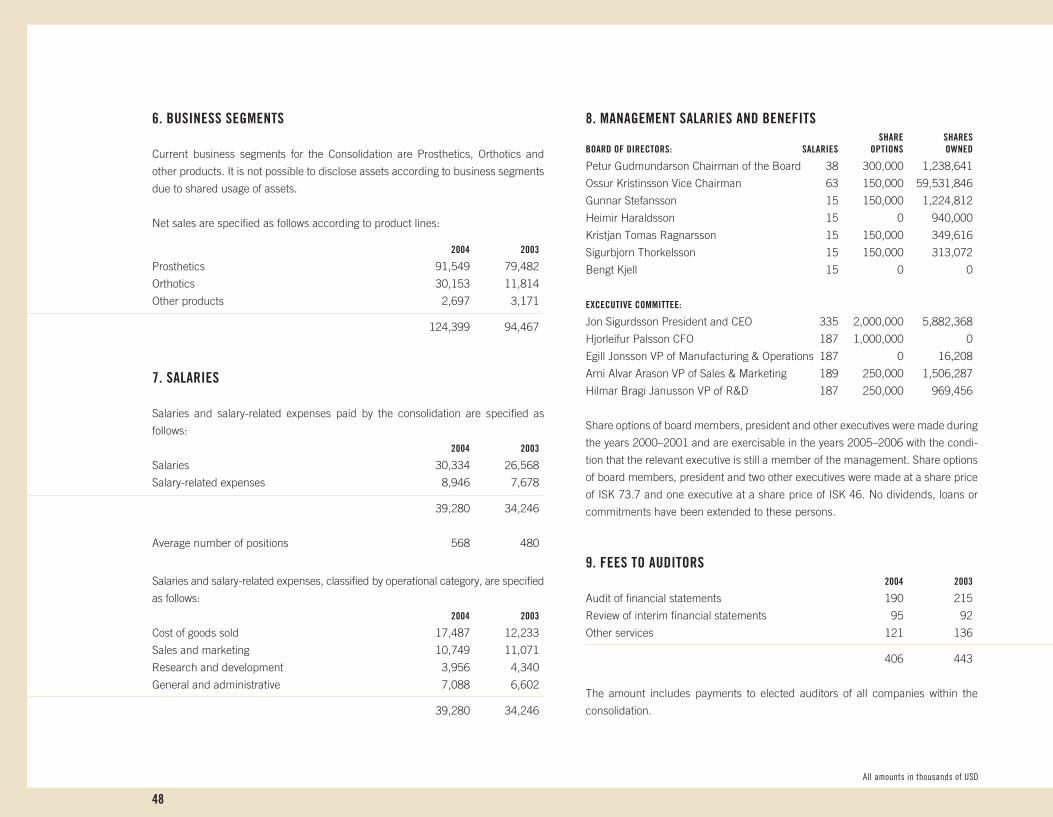
48
All amounts in thousands of USD All amounts in thousands of USD
6. BUSINESS SEGMENTS
Current business segments for the Consolidation are Prosthetics, Orthotics and
other products. It is not possible to disclose assets according to business segments
due to shared usage of assets.
Net sales are specified as follows according to product lines:
2004 2003
Prosthetics 91,549 79,482
Orthotics 30,153 11,814
Other products 2,697 3,171
124,399 94,467
7. SALARIES
Salaries and salary-related expenses paid by the consolidation are specified as
follows:
2004 2003
Salaries 30,334 26,568
Salary-related expenses 8,946 7,678
39,280 34,246
Average number of positions 568 480
Salaries and salary-related expenses, classified by operational category, are specified
as follows:
2004 2003
Cost of goods sold 17,487 12,233
Sales and marketing 10,749 11,071
Research and development 3,956 4,340
General and administrative 7,088 6,602
39,280 34,246
8. MANAGEMENT SALARIES AND BENEFITS SHARE SHARESBOARD OF DIRECTORS: SALARIES OPTIONS OWNED
Petur Gudmundarson Chairman of the Board 38 300,000 1,238,641
Ossur Kristinsson Vice Chairman 63 150,000 59,531,846
Gunnar Stefansson 15 150,000 1,224,812
Heimir Haraldsson 15 0 940,000
Kristjan Tomas Ragnarsson 15 150,000 349,616
Sigurbjorn Thorkelsson 15 150,000 313,072
Bengt Kjell 15 0 0
EXCECUTIVE COMMITTEE:
Jon Sigurdsson President and CEO 335 2,000,000 5,882,368
Hjorleifur Palsson CFO 187 1,000,000 0
Egill Jonsson VP of Manufacturing & Operations 187 0 16,208
Arni Alvar Arason VP of Sales & Marketing 189 250,000 1,506,287
Hilmar Bragi Janusson VP of R&D 187 250,000 969,456
Share options of board members, president and other executives were made during
the years 2000–2001 and are exercisable in the years 2005–2006 with the condi-
tion that the relevant executive is still a member of the management. Share options
of board members, president and two other executives were made at a share price
of ISK 73.7 and one executive at a share price of ISK 46. No dividends, loans or
commitments have been extended to these persons.
9. FEES TO AUDITORS 2004 2003
Audit of financial statements 190 215
Review of interim financial statements 95 92
Other services 121 136
406 443
The amount includes payments to elected auditors of all companies within the
consolidation.
OSSUR_EN_ARS2005.indd 48 18.2.2005 12:23:37

49
10. RESTRUCTURING COSTS
Restructuring costs, classified by operational category, are specified as follows:
2004 2003
Cost of goods sold 241 162
Sales and marketing 0 480
Research and development 0 556
General and administrative 260 333
501 1,531
The restructuring costs represent severance costs associated with changes in the
management team, elimination of the sales and marketing positions in Seattle and
elimination of positions due to sale of Mauch’s assets.
11. FINANCIAL INCOME / (EXPENSES)
INCOME FROM INVESTMENTS: 2004 2003
Interest on bank deposits 54 150
Profit from loans and receivables 115 58
Profit from available for sale investments 52 72
Profit from trading investments 9 125
Other interest income 26 43
256 448
FINANCE COSTS:
Interest on bank loans ( 1,441 ) ( 1,138 )
Interest on obligations under finance leases (48 ) ( 63 )
Other interest expenses ( 128 ) ( 141 )
( 1,617 ) ( 1,342 )
Exchange rate differences 129 487
( 1,232 ) ( 407 )
12. EARNINGS PER SHARE
The calculation of Earnings per Share is based on the following data:
2004 2003
Net profit for the year 15,227 4,661
Total average number of shares outstanding during
the year (in thousands) 317,001 322,186
Total average number of shares including potential
shares (in thousands) 317,363 323,431
Basic Earnings per Share (US cent) 4.80 1.45
Diluted Earnings per Share (US cent) 4.80 1.44
All amounts in thousands of USD All amounts in thousands of USD
OSSUR_EN_ARS2005.indd 49 18.2.2005 12:23:38

50
All amounts in thousands of USD All amounts in thousands of USD
13. PROPERTY, PLANT AND EQUIPMENT BUILDINGS MACHINERY FIXTURES & COST AND SITES & EQUIPMENT OFFICE EQUIP. TOTAL
At 1 January 2004 3,598 17,348 8,549 29,495
Correction 0 92 ( 92 ) 0
Adjusted opening balance 3,598 17,440 8,457 29,495
Additions 0 3,680 2,516 6,196
Exchange differences ( 13 ) 475 162 624
Disposed of on disposal of a susidiary 0 ( 2,826 ) ( 252 ) ( 3,078 )
Eliminated on disposal ( 419 ) ( 662 ) ( 104 ) ( 1,185 )
Fully depreciated assets ( 5 ) ( 1,262 ) ( 1,682 ) ( 2,949 )
At 31 December 2004 3,161 16,845 9,097 29,103
ACCUMULATED DEPRECIATION
At 1 January 2004 403 8,917 5,225 14,545
Correction 0 92 ( 92 ) 0
Adjusted opening balance 403 9,009 5,133 14,545
Charge for the year 112 2,242 1,198 3,552
Exchange differences 1 286 68 355
Disposed of on disposal of a susidiary 0 ( 1,691 ) ( 201 ) ( 1,892 )
Eliminated on disposal ( 9 ) ( 434 ) ( 59 ) ( 502 )
Fully depreciated assets ( 5 ) ( 1,263 ) ( 1,681 ) ( 2,949 )
At 31 December 2004 502 8,149 4,458 13,109
CARRYING AMOUNT
At 31 December 2004 2,659 8,696 4,639 15,994
At 31 December 2003 3,195 8,431 3,324 14,950
The management estimates the fair value of buildings and sites at USD 4,500 thousand and other operating fixed asset at their book value.
The carrying amount of the Consolidation’s fixtures and equipment includes an amount of USD 771 thousand (2003: USD 1,319 thousand) in respect of assets held under
finance leases. No other assets are pledged.
OSSUR_EN_ARS2005.indd 50 18.2.2005 12:23:38

51
All amounts in thousands of USD All amounts in thousands of USD
13. PROPERTY, PLANT AND EQUIPMENT (CONTINUED)
Depreciation, classified by operational category, is shown in the following
schedule:
2004 2003
Cost of goods sold 1,986 1,372
Sales and marketing expenses 138 127
Research and development expenses 231 313
General and administrative expenses 1,197 1,122
3,552 2,934
Sales gain and loss classified by operational category, are shown in the following
schedule:
2004 2003
Other income 178 0
General and administrative expenses ( 48 ) ( 9 )
130 ( 9 )
14. GOODWILL 31.12.2004
COST
At 1 January 2004 23,599
Arising on a acquisition of a subsidiary 459
Exchange differences 1,037
At 31 December 2004 25,095
CARRYING AMOUNT
At 31 December 2004 25,095
Additions arising on acquisition of a subsidiary relate to the acquisition of the
Generation II Group in 2003. USD 410 thousand are due to receivables which
where owned by the former sellers in accordance with the purchase agreement
and should therefore not have been included in the opening balance which was
consolidated into the Ossur consolidation. USD 49 thousand are due to invoices
received in 2004 which related to the acquisition of Generation II and should
therefore have been included in the goodwill entries. Total additions amounted
therefore to USD 459 thousand.
During the year an indipendent party, other than the company’s auditor, was hired
to perform an impairment test on the goodwill of the company. According to the
conclusion of the test no impairment loss has occured.
OSSUR_EN_ARS2005.indd 51 18.2.2005 12:23:38

52
All amounts in thousands of USD All amounts in thousands of USD
15. OTHER INTANGIBLE ASSETS
DEVELOPMENT-
COST PATENT COST OTHER TOTAL
At 1 January 2004 3,578 458 2,609 6,645
Additions 658 0 2 660
Exchange differences 182 0 155 337
At 31 December 2004 4,418 458 2,766 7,642
AMORTIZATION
At 1 January 2004 769 46 261 1,076
Charge for the year 521 104 494 1,119
Exchange differences 44 0 28 72
At 31 December 2004 1,334 150 783 2,267
CARRYING AMOUNT
At 31 December 2004 3,084 308 1,983 5,375
At 31 December 2003 2,809 412 2,348 5,569
The amortazion of other intangible assets, classified by operational category, is
specified as follows:
2004 2003
Cost of goods sold 114 0
Sales and marketing expenses 339 0
Research and development expenses 291 256
General and administrative expenses 375 126
1,119 382
16. THE CONSOLIDATION
The Consolidated Financial Statements of Ossur hf. pertain to the following sub-
sidiaries:
PLACE OF REGISTRATION OWNER-NAME OF SUBSIDIARY AND OPERATION SHIP % PRINCIPAL ACTIVITY
Ossur Holding, AB Sweden 100% Holding
Ossur Nordic, AB Sweden 100% Sales, distribution
and services
Ossur Nordic, AS Norway 100% Sales, distribution
and services
Empower H. C. Solution, AB Sweden 100% Healthcare consulting
Ossur Holdings, Inc. USA 100% Holding
Ossur Engineering, Inc. USA 100% Manufacturer
Ossur North America, Inc. USA 100% Sales, distribution
and services
Mauch, Inc. USA 100% No operation
Generation II USA, Inc USA 100% Manufacturer, sales
Generation II Orthotics, Inc., Canada 100% Manufacturer, sales,
distribution and services
GII Orth. Europe, Holding SA Belgium 100% Holding
GII Orthotics Europe, NV Belgium 100% No operation
Ossur Europe, BV Netherlands 100% Sales, distribution
and services
Ossur hf. operates a finance branch in Switzerland to govern intercompany long-
term liabilities and investments.
At the end of the year the net assets and operations of Mauch, Inc. in the United
States were sold. Further information regarding the sale is disclosed in note 33.
At the end of October Ossur hf. sold the subsidiaries Mega Hali Med AB and Linea
Orthopedics AB in Sweden. At the date of the disposal there were no operations in
the companies. Further information regarding the sale is disclosed in note 34.
The subsidiary Ossur UK Ltd. was dissolved during the year. No operations were in
the company during 2004.
OSSUR_EN_ARS2005.indd 52 18.2.2005 12:23:39
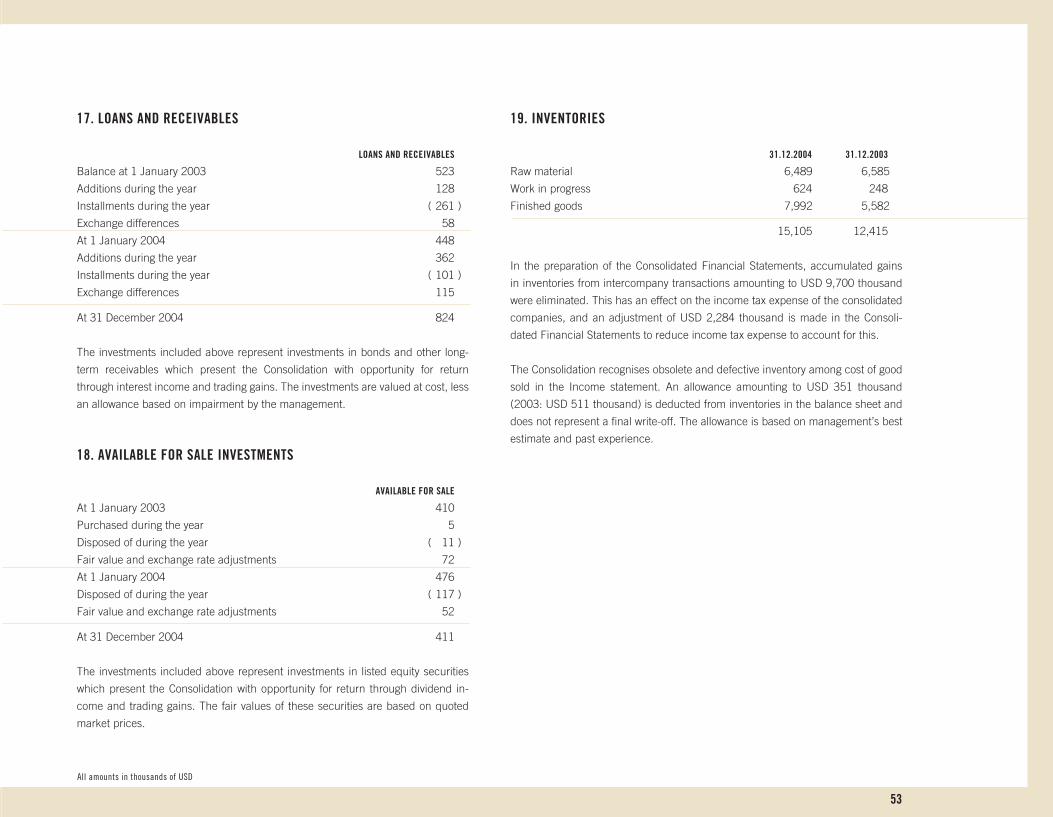
53
All amounts in thousands of USD All amounts in thousands of USD
17. LOANS AND RECEIVABLES
LOANS AND RECEIVABLES
Balance at 1 January 2003 523
Additions during the year 128
Installments during the year ( 261 )
Exchange differences 58
At 1 January 2004 448
Additions during the year 362
Installments during the year ( 101 )
Exchange differences 115
At 31 December 2004 824
The investments included above represent investments in bonds and other long-
term receivables which present the Consolidation with opportunity for return
through interest income and trading gains. The investments are valued at cost, less
an allowance based on impairment by the management.
18. AVAILABLE FOR SALE INVESTMENTS
AVAILABLE FOR SALE
At 1 January 2003 410
Purchased during the year 5
Disposed of during the year ( 11 )
Fair value and exchange rate adjustments 72
At 1 January 2004 476
Disposed of during the year ( 117 )
Fair value and exchange rate adjustments 52
At 31 December 2004 411
The investments included above represent investments in listed equity securities
which present the Consolidation with opportunity for return through dividend in-
come and trading gains. The fair values of these securities are based on quoted
market prices.
19. INVENTORIES
31.12.2004 31.12.2003
Raw material 6,489 6,585
Work in progress 624 248
Finished goods 7,992 5,582
15,105 12,415
In the preparation of the Consolidated Financial Statements, accumulated gains
in inventories from intercompany transactions amounting to USD 9,700 thousand
were eliminated. This has an effect on the income tax expense of the consolidated
companies, and an adjustment of USD 2,284 thousand is made in the Consoli-
dated Financial Statements to reduce income tax expense to account for this.
The Consolidation recognises obsolete and defective inventory among cost of good
sold in the Income statement. An allowance amounting to USD 351 thousand
(2003: USD 511 thousand) is deducted from inventories in the balance sheet and
does not represent a final write-off. The allowance is based on management’s best
estimate and past experience.
OSSUR_EN_ARS2005.indd 53 18.2.2005 12:23:39
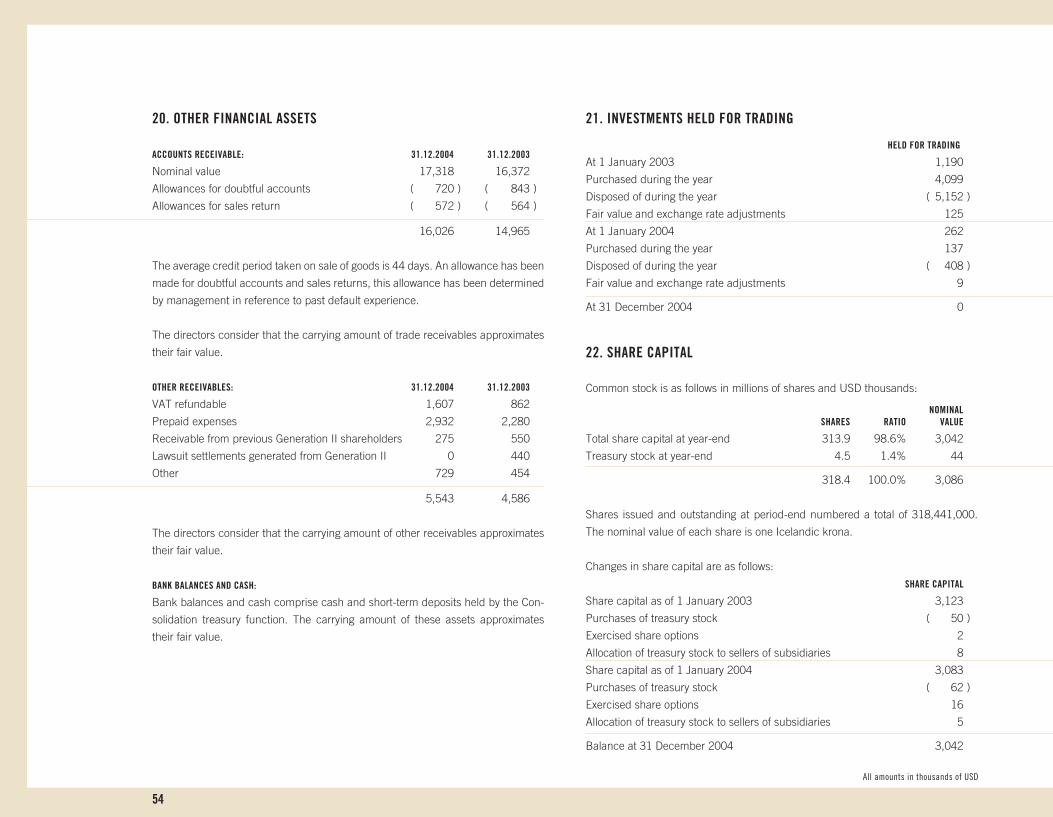
54
All amounts in thousands of USD All amounts in thousands of USD
20. OTHER FINANCIAL ASSETS
ACCOUNTS RECEIVABLE: 31.12.2004 31.12.2003
Nominal value 17,318 16,372
Allowances for doubtful accounts ( 720 ) ( 843 )
Allowances for sales return ( 572 ) ( 564 )
16,026 14,965
The average credit period taken on sale of goods is 44 days. An allowance has been
made for doubtful accounts and sales returns, this allowance has been determined
by management in reference to past default experience.
The directors consider that the carrying amount of trade receivables approximates
their fair value.
OTHER RECEIVABLES: 31.12.2004 31.12.2003
VAT refundable 1,607 862
Prepaid expenses 2,932 2,280
Receivable from previous Generation II shareholders 275 550
Lawsuit settlements generated from Generation II 0 440
Other 729 454
5,543 4,586
The directors consider that the carrying amount of other receivables approximates
their fair value.
BANK BALANCES AND CASH:
Bank balances and cash comprise cash and short-term deposits held by the Con-
solidation treasury function. The carrying amount of these assets approximates
their fair value.
21. INVESTMENTS HELD FOR TRADING
HELD FOR TRADING
At 1 January 2003 1,190
Purchased during the year 4,099
Disposed of during the year ( 5,152 )
Fair value and exchange rate adjustments 125
At 1 January 2004 262
Purchased during the year 137
Disposed of during the year ( 408 )
Fair value and exchange rate adjustments 9
At 31 December 2004 0
22. SHARE CAPITAL
Common stock is as follows in millions of shares and USD thousands:
NOMINAL SHARES RATIO VALUE
Total share capital at year-end 313.9 98.6% 3,042
Treasury stock at year-end 4.5 1.4% 44
318.4 100.0% 3,086
Shares issued and outstanding at period-end numbered a total of 318,441,000.
The nominal value of each share is one Icelandic krona.
Changes in share capital are as follows:
SHARE CAPITAL
Share capital as of 1 January 2003 3,123
Purchases of treasury stock ( 50 )
Exercised share options 2
Allocation of treasury stock to sellers of subsidiaries 8
Share capital as of 1 January 2004 3,083
Purchases of treasury stock ( 62 )
Exercised share options 16
Allocation of treasury stock to sellers of subsidiaries 5
Balance at 31 December 2004 3,042
OSSUR_EN_ARS2005.indd 54 18.2.2005 12:23:40
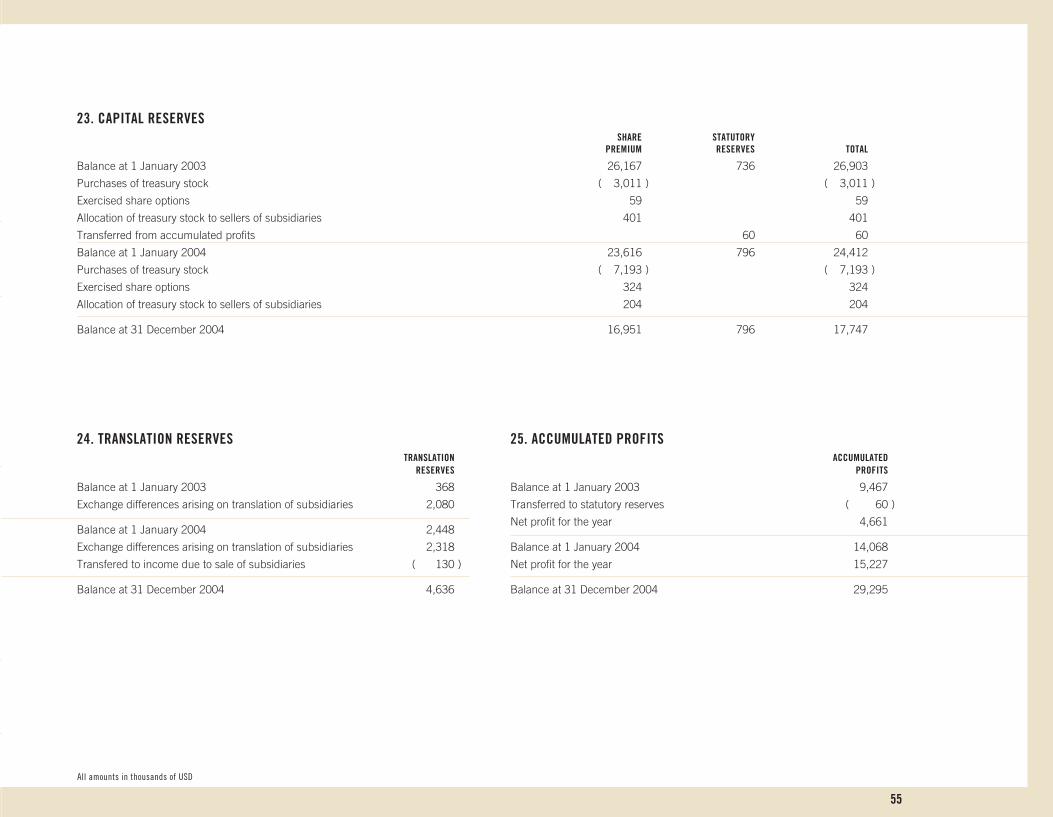
55
24. TRANSLATION RESERVES TRANSLATION RESERVES
Balance at 1 January 2003 368
Exchange differences arising on translation of subsidiaries 2,080
Balance at 1 January 2004 2,448
Exchange differences arising on translation of subsidiaries 2,318
Transfered to income due to sale of subsidiaries ( 130 )
Balance at 31 December 2004 4,636
25. ACCUMULATED PROFITS ACCUMULATED PROFITS
Balance at 1 January 2003 9,467
Transferred to statutory reserves ( 60 )
Net profit for the year 4,661
Balance at 1 January 2004 14,068
Net profit for the year 15,227
Balance at 31 December 2004 29,295
23. CAPITAL RESERVES SHARE STATUTORY PREMIUM RESERVES TOTAL
Balance at 1 January 2003 26,167 736 26,903
Purchases of treasury stock ( 3,011 ) ( 3,011 )
Exercised share options 59 59
Allocation of treasury stock to sellers of subsidiaries 401 401
Transferred from accumulated profits 60 60
Balance at 1 January 2004 23,616 796 24,412
Purchases of treasury stock ( 7,193 ) ( 7,193 )
Exercised share options 324 324
Allocation of treasury stock to sellers of subsidiaries 204 204
Balance at 31 December 2004 16,951 796 17,747
All amounts in thousands of USD All amounts in thousands of USD
OSSUR_EN_ARS2005.indd 55 18.2.2005 12:23:40

56
All amounts in thousands of USD All amounts in thousands of USD
26. STOCK OPTION CONTRACTS AND OBLIGATIONS TO INCREASE SHARE CAPITAL
Following is a schedule of stock option agreements and obligations to increase
share capital assuming all conditions will be fully met:
NUMBER OF SHARES ( IN THOUSANDS) CONTRACT RATE ISK / CONDITIONS / DATE GRANTED 2005 2006 TOTAL
24.0 / conditional / September 2000 84 0 84
46.0 / conditional / June 2001 0 1,000 1,000
58.5 / conditional / January 2001 319 0 319
73.7 / conditional / July 2000 3,400 0 3,400
3,803 1,000 4,803
All options are forfeited if the employee leaves the company before the options
vest. The stock option agreements with contract rate of 58.5 expire in 2006 unless
terminated.
1.1–31.12 2004 1.1–31.12 2003
WEIGHTED WEIGHTED NUMBER OF AVERAGE NUMBER OF AVERAGE SHARES (IN CONTRACT SHARES (IN CONTRACT THOUSANDS) RATE (IN ISK) THOUSANDS) RATE (IN ISK)
Outstanding at beginning of year 6,655 52.80 7,606 52.00
Forfeited during the year ( 169 ) 58.50 ( 761 ) 51.92
Exercised during the year ( 1,683 ) 14.45 ( 190 ) 24.00
Outstanding at the end of the year 4,803 66.05 6,655 52.80
Exercisable at the end of the year 319 58.50 1,458 25.91
At 31 December 2004, the total outstanding number of shares in Ossur hf. amount-
ed to 318,441,000. The Articles of Association of the Company authorizes the
Board of Directors to issue up to 10,000,000 shares for the purposes of the above
contracts. This authorization is valid until 24 March 2005. The listed market price
per share at period-end 2004 was ISK 76.0 per share.
27. LOANS FROM CREDIT INSTITUTIONS
REMAINING BALANCES 31.12.2004 31.12.2003
Loans in USD 23,115 25,600
Loans in EUR 10,053 10,199
Loans in ISK 0 25
33,168 35,824
Current maturities ( 981 ) ( 932 )
Loans from credit institutions 32,187 34,892
Aggregated annual maturities are as follows:
In 2005 / 2004 981 932
In 2006 / 2005 981 906
In 2007 / 2006 981 906
In 2008 / 2007 28,754 906
In 2009 / 2008 981 30,813
Later 490 1,361
33,168 35,824
The terms of a USD 23.1 million and EUR 7.4 million loan facilities include various
provisions that limits certain actions by the company without prior consulting with
the lender. In addition the loan facilities include certain financial covenants.
OSSUR_EN_ARS2005.indd 56 18.2.2005 12:23:41

57
All amounts in thousands of USD All amounts in thousands of USD
28. OBLIGATION UNDER FINANCE LEASES
MINIMUM LEASE PAYMENTS REMAINING BALANCES 31.12.2004 31.12.2003 31.12.2004 31.12.2003
Finance leases in USD 174 704 168 650
Finance leases in EUR 403 547 385 512
Finance leases in ISK 0 49 0 48
577 1,300 553 1,210
Current maturities ( 331 ) ( 494 ) ( 313 ) ( 443 )
Obligation under finance leases 246 806 240 767
Aggregated annual maturities are as follows:
MINIMUM LEASE PAYMENTS REMAINING BALANCES
31.12.2004 31.12.2003 31.12.2004 31.12.2003
In 2005 / 2004 331 494 313 444
In 2006 / 2005 215 439 209 411
In 2007 / 2006 31 316 31 305
In 2008 / 2007 0 51 0 50
577 1,300 553 1,210
Less: future finance charges ( 24 ) ( 90 )
Remaining balances 553 1,210
The management estimates that the fair value of the consolidated lease obligations
approximates their carrying amount.
The obligations under finance leases are pledged by the lessor’s charge over the
leased assets.
29. OTHER LONG-TERM LIABILITIES
REMAINING BALANCES 31.12.2004 31.12.2003
Other liabilities in USD 1,457 2,420
Other liabilities in EUR 137 0
1,594 2,420
Current maturities ( 1,262 ) ( 1,938 )
Other long-term liabilities 332 482
Aggregated annual maturities are as follows:
In 2005 / 2004 1,262 1,938
In 2006 / 2005 189 287
In 2007 / 2006 50 52
In 2008 / 2007 48 50
In 2009 / 2008 45 48
Later 0 45
1,594 2,420
OSSUR_EN_ARS2005.indd 57 18.2.2005 12:23:41

58
All amounts in thousands of USD All amounts in thousands of USD
30. DEFERRED TAX DEFERRED TAX DEFERRED TAX ASSET LIABILITIES TOTAL
At 1 January 2004 20,529 ( 2,206 ) 18,323
Calculated tax for the year ( 1,468 ) ( 2,447 ) ( 3,915 )
Income tax payable for the year 932 1,929 2,861
Exchange differences 252 ( 139 ) 113
At 31 December 2004 20,245 ( 2,863 ) 17,382
The following are the major deferred tax liabilities and assets recognised:
31.12.2004
Intangible assets ( 1,306 )
Fixed tangible assets ( 782 )
Goodwill 13,301
Inventories 2,409
Accrued expenses 89
Reserves and credits 667
Other ( 725 )
Loss carry-forward 3,729
17,382
At balance sheet date the consolidation has unused tax losses available for offset
against future profits as follows:
TAX LOSS DEFERRED TAX
Available for 15 years 1,276 434
Available indefinitely 9,080 3,295
10,356 3,729
31. LONG-TERM LIABILITIES – DUE WITHIN ONE YEAR
31.12.2004 31.12.2003
Loans from credit institutions 981 932
Obligations under finance leases 313 444
Other long-term liabilities 1,262 1,938
2,556 3,314
32. PROVISIONS WARRANTY RESTRUCTURING PROVISIONS PROVISIONS TOTAL
At 1 January 2004 392 1,321 1,713
Additional provision in the year 435 501 936
Exchange differences 0 ( 18 ) ( 18 )
Utilisation of provision ( 270 ) ( 1,745 ) ( 2,015 )
At 31 December 2004 557 59 616
The warranty provision represents management’s best estimate of the Consolida-
tion’s liability under warranties granted on prosthetics products, based on past ex-
perience and industry averages for defective products.
The restructuring provision relates to the sale of Mauch’s Inc. assets.
OSSUR_EN_ARS2005.indd 58 18.2.2005 12:23:41

59
33. DISPOSAL OF THE NET ASSETS OF MAUCH, INC. IN THE UNITED STATES.
On 31 December 2004 the net assets and operations of Mauch, Inc in the United
States were sold for cash consideration of USD 1.569 thousand.
DISPOSALNET ASSETS AT THE DATE OF DISPOSAL 31.12.2004
Operating fixed assets 1,186
Current assets 598
Long-term liabilites ( 241 )
Current liabilities ( 150 )
1,393
Total consideration 1,569
Net assets at the date of disposal ( 1,393 )
Gain on disposal 176
Satisfied by cash 1,575
Accounts payable ( 6 )
1,569
NET CASH INFLOW ARISING ON DISPOSAL
Cash consideration 1,575
The operations of Mauch, Inc. are not material in the Ossur hf. consolidation and
therefore the disposal is not classified as discontinued operations. The gain on dis-
posal is included with other income in the consolidated income statement.
Mauch, Inc. contributed USD 2.2 million of revenue and generated loss of USD
810 thousand for the period between the beginning of the year and the date of
disposal.
34. DISPOSAL OF THE SUBSIDIARIES MEGA HALI MED AB AND LINEA ORTHOPEDICS AB IN SWEDEN
On 31 October 2004 Ossur hf. sold the subsidiaries Mega Hali Med AB and Linea
Orthopedics AB in Sweden. The total cash consideration amounted to SEK 264 thou-
sand or USD 37 thousand. At the date of disposal there were no operations in the
companies.
DISPOSALNET ASSETS AT THE DATE OF DISPOSAL 31.12.2004
Bank balances and cash 40
Total consideration 37
Net assets at the date of disposal ( 40 )
Translation reserves transferred to income 130
Gain on disposal 127
Satisfied by cash 37
NET CASH INFLOW ARISING ON DISPOSAL
Cash consideration 37
Cash and cash equivalents disposed of ( 40 )
( 3 )
The operations of Mega Hali Med AB and Linea Orthopedics AB are not material
in the Ossur hf. consolidation and therefore the disposal is not classified as dis-
continued operations. The gain on disposal is included with other income in the
consolidated income statement.
Mega Hali Med AB and Linea Orthopedics AB contributed no revenue and gener-
ated loss of USD 10 thousand for the period between the beginning of the year and
the date of disposal.
All amounts in thousands of USD All amounts in thousands of USD
OSSUR_EN_ARS2005.indd 59 18.2.2005 12:23:42
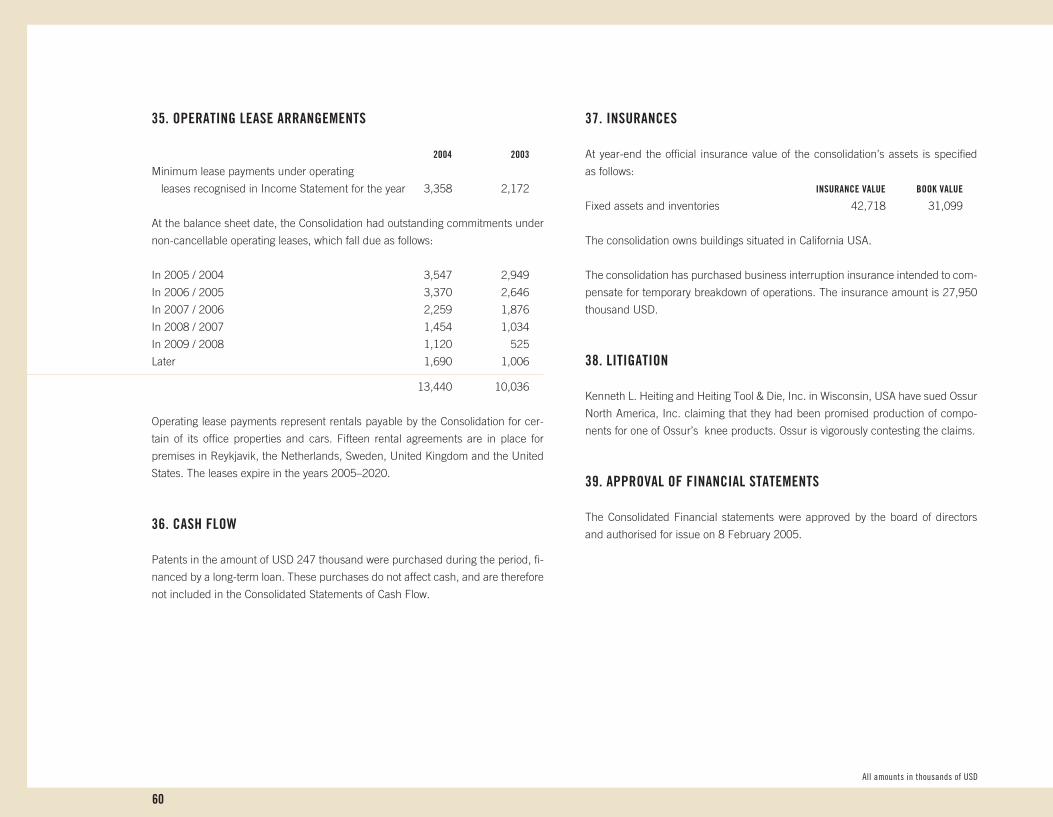
60
35. OPERATING LEASE ARRANGEMENTS
2004 2003
Minimum lease payments under operating
leases recognised in Income Statement for the year 3,358 2,172
At the balance sheet date, the Consolidation had outstanding commitments under
non-cancellable operating leases, which fall due as follows:
In 2005 / 2004 3,547 2,949
In 2006 / 2005 3,370 2,646
In 2007 / 2006 2,259 1,876
In 2008 / 2007 1,454 1,034
In 2009 / 2008 1,120 525
Later 1,690 1,006
13,440 10,036
Operating lease payments represent rentals payable by the Consolidation for cer-
tain of its office properties and cars. Fifteen rental agreements are in place for
premises in Reykjavik, the Netherlands, Sweden, United Kingdom and the United
States. The leases expire in the years 2005–2020.
36. CASH FLOW
Patents in the amount of USD 247 thousand were purchased during the period, fi-
nanced by a long-term loan. These purchases do not affect cash, and are therefore
not included in the Consolidated Statements of Cash Flow.
37. INSURANCES
At year-end the official insurance value of the consolidation’s assets is specified
as follows:
INSURANCE VALUE BOOK VALUE
Fixed assets and inventories 42,718 31,099
The consolidation owns buildings situated in California USA.
The consolidation has purchased business interruption insurance intended to com-
pensate for temporary breakdown of operations. The insurance amount is 27,950
thousand USD.
38. LITIGATION
Kenneth L. Heiting and Heiting Tool & Die, Inc. in Wisconsin, USA have sued Ossur
North America, Inc. claiming that they had been promised production of compo-
nents for one of Ossur’s knee products. Ossur is vigorously contesting the claims.
39. APPROVAL OF FINANCIAL STATEMENTS
The Consolidated Financial statements were approved by the board of directors
and authorised for issue on 8 February 2005.
All amounts in thousands of USD
OSSUR_EN_ARS2005.indd 60 18.2.2005 12:23:42
61
Ossur Investor Realations
Mr. Hjorleifur Palsson, CFO
e-mail: [email protected]
Ms. Sigurborg Arnarsdottir
IR Manager
Tel: +354-515-1339
e-mail: [email protected]
In cooperation with:
For US based Investors
Mr. Hans Westerberg
Tel: +1-212-644-2561
e-mail: [email protected]
For European Investors
Mr. Lynge Blak
Tel: +45-44-47-07-09
e-mail: [email protected]
OSSUR_EN_ARS2005.indd 61 18.2.2005 12:23:43

62
OSSUR_EN_ARS2005.indd 62 18.2.2005 12:23:50

GUNNAR STEFÁNSSON (9/8/1955) has been a Member of the Board since 1993. He is currently a Professorin Mathematics at the University of Iceland and has also worked for the International MarineResearch Council. Mr. Stefansson holds a Ph.D. in statistics from Ohio State University in Columbus,Ohio. Mr. Stefánsson and Mr. Kristinsson, also a board member, are married to sisters.
OSSUR SHARES: 1.224.812 • SHARE OPTIONS: 150.000 AT 73,7 ISK/PR. SHARE
HEIMIR HARALDSSON (22/4/1955) joined the Board in 2001. Former CEO and a partner at KPMG for anumber of years. Currently he manages his own investment company along with other consultingprojects. Mr. Haraldsson graduated with a degree in business administration from the Universityof Iceland in 1979 and has been a certified public accountant since 1982.
OSSUR SHARES: 940 • SHARE OPTIONS: 0
KRISTJÁN TÓMAS RAGNARSSON (15/11/1943) became a Member of the Board in 1999. He has been workingfor many years in the United States as a physician for people with disability. Since 1986, he hasserved as the Professor and Chairman of the Department of Rehabilitation Medicine of the MountSinai Hospital and its School of Medicine in New York and from 1997 to 2003 he served asChairman of the Board of the Mount Sinai Faculty Practice Associates. Dr. Ragnarsson graduatedfrom the University of Iceland School of Medicine in 1969 and was certified by the AmericanBoard of Physical Medicine and Rehabilitation in 1976.
OSSUR SHARES: 349.616 • SHARE OPTIONS: 150.000 AT 73,7 ISK/PR. SHARE
PÉTUR GUDMUNDARSON (5/5/1950) has been Chairman of the Board since 1995. Mr. Gudmundarsonstudied law at the University of Iceland, completing his cand. jur. degree in 1978. He has beena practicing attorney at law since 1978 as a partner of the Logos Law Firm.
OSSUR SHARES: 1.238.641 • SHARE OPTIONS: 300.000 AT 73,7 ISK/PR. SHARE
SIGURBJÖRN THORKELSSON (13/9/1966) joined the Board of Directors in 1999. He was Managing Directorat Lehman Brothers Investment Bank in New York in 1998-2002 and from 2002 with the LehmanBrothers in London. Mr. Thorkelsson took a degree in mechanical engineering at the Universityof Iceland in 1990 and a Masters Degree in industrial engineering and finance at Stanford Universityin 1992.
OSSUR SHARES: 313.072 • SHARE OPTIONS: 150.000 AT 73,7 ISK/PR. SHARE
ÖSSUR KRISTINSSON (5/11/1943) is the founder of the Company. He has served on the Board of Directorssince 1971 and was Managing Director of the Company from 1971 to 1989. Mr. Kristinssonstudied prosthetics in Sweden and received his certification from the Swedish Board of Certificationfor Prosthetics and Orthotics in 1971. Mr. Kristinsson and Mr. Stefánsson, also a board member,are married to sisters.
OSSUR SHARES: 59.531.846 • SHARE OPTIONS: 150.000 AT 73,7 ISK/PR. SHARE
BENGT KJELL (16/9/1954) became a Board Member in 2003. Currently he is Executive Vice Presidentand Head of new investments at AB Industrivärden. He has previously been at the managementconsultancy firm Navet AB as senior partner. He has also worked at K.G. Knutsson AB as FinanceDirector and Senior Vice President. Mr Kjell holds an MBA from Stockholm School of Economics.He is Chairman of the Board at Pandox AB and Kungsleden AB and also holds a seat on the Boardof Munters AB.
OSSUR SHARES: 0 • SHARE OPTIONS: 0
JÓN SIGURDSSON (29/6/1956) Ossur President and Chief Executive Officer,has led the Company since 1996. He was Commercial Advisor toIceland's Export Council in New York from 1992 to 1996 and previouslyCFO at Alafoss hf. (1989-1992). Mr. Sigurdsson also worked as Headof the Foreign Division of Eimskip hf. (1986-1989) and in theDevelopment Division of Bang & Olufsen AS in Denmark (1982-1984).He serves on the Boards of Directors of Reykjavik University, AlcanIceland and the fisheries company Samherji hf. Mr. Sigurdsson hasa degree in administrative technical engineering from the TechnicalSchool in Odense, Denmark, and an MBA from the United StatesInternational University in San Diego.OSSUR SHARES: 5.882.368 • SHARE OPTIONS: 2.000.000 AT 73,7 ISK/PR. SHARE
MANUFACTURING & OPERATIONSEGILL JÓNSSON (13/5/1957) Vice President of Manufacturing and Operations, hasbeen with Ossur since 1996. He has led the Manufacturing from that period.He was formerly a Project Manager at VGK hf an engineering firm in Reykjavik(1985-1996). Mr. Jonsson has a Masters degree in Mechanical Engineeringfrom the Technical University in Copenhagen, DTU (1984).
OSSUR SHARES: 16.208 • SHARE OPTIONS: 0
CORPORATE FINANCEHJÖRLEIFUR PÁLSSON (28/11/1963) Chief Financial Officer, joined Ossur in 2001.He is a former partner of Deloitte & Touche in Iceland. Mr. Palsson graduatedfrom the University of Iceland in 1988 with a degree in business administrationand qualified as a certified public accountant in 1989.
OSSUR SHARES: 0 • SHARE OPTIONS: 1.000.000 AT 46 ISK/PR. SHARE
SALES & MARKETINGÁRNI ALVAR ARASON (2/7/1964) Vice President, Sales & Marketing, has been withOssur since 1996. Before taking his present position he worked for theCompany as Chief Financial Officer, Marketing Manager and Product Manager.From 1994 to 1996, he served as Marketing Manager at Folda hf., and beforethat Sales and Distribution manager with Christoph Fritzsch GmbH in Germany.Mr. Arason graduated from the University of Trier in Germany with a degreein business administration.
OSSUR SHARES: 1.506.287 • SHARE OPTIONS: 250.000 AT 73,7 ISK/PR. SHARE
RESEARCH & DEVELOPMENTHILMAR BRAGI JANUSSON (31/8/1961) President, Research and Development, hasbeen with Ossur since 1993. He was formerly a researcher at the TechnologicalInstitute of Iceland from 1987 to 1988. Dr. Janusson is also on the Boardof a number of other Icelandic companies. He holds a degree in chemistryfrom the University of Iceland and a Doctorate in chemical science andengineering from Leeds University in England.
OSSUR SHARES: 969.456 • SHARE OPTIONS: 250.000 AT 73,7 ISK/PR. SHARE
The Board of Directors of Ossur is composed of sevenmembers e lected at the Annual General Meet ing ofthe Company. Ossur ’s operat ions are conducted infour div is ions, with the heads of div is ions forming theBoard of Management under the leadership of thePresident and Chief Execut ive Off icer.
THE BOARD PRESIDENTAND CEO
DIVISIONS
B O A R D A N D M A N A G E M E N T
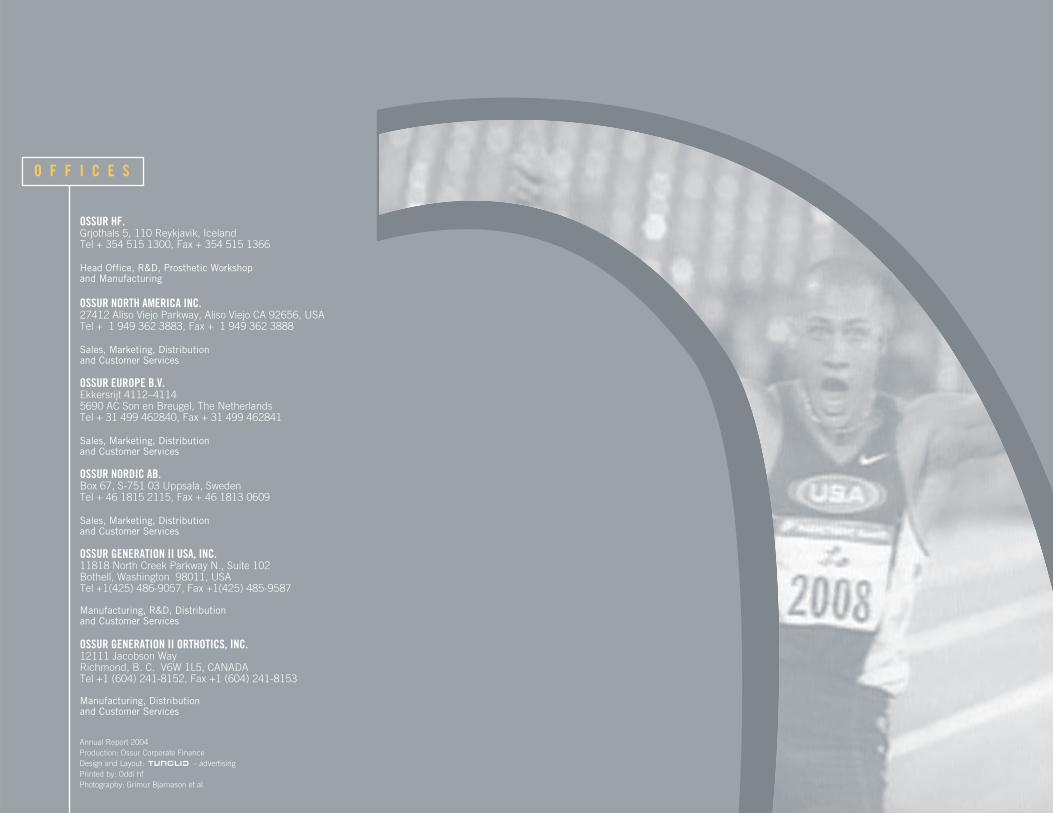
OSSUR HF.Grjothals 5, 110 Reykjavik, IcelandTel + 354 515 1300, Fax + 354 515 1366
Head Office, R&D, Prosthetic Workshopand Manufacturing
OSSUR NORTH AMERICA INC.27412 Aliso Viejo Parkway, Aliso Viejo CA 92656, USATel + 1 949 362 3883, Fax + 1 949 362 3888
Sales, Marketing, Distributionand Customer Services
OSSUR EUROPE B.V.Ekkersrijt 4112–41145690 AC Son en Breugel, The NetherlandsTel + 31 499 462840, Fax + 31 499 462841
Sales, Marketing, Distributionand Customer Services
OSSUR NORDIC AB.Box 67, S-751 03 Uppsala, SwedenTel + 46 1815 2115, Fax + 46 1813 0609
Sales, Marketing, Distributionand Customer Services
OSSUR GENERATION II USA, INC.11818 North Creek Parkway N., Suite 102Bothell, Washington 98011, USATel +1(425) 486-9057, Fax +1(425) 485-9587
Manufacturing, R&D, Distributionand Customer Services
OSSUR GENERATION II ORTHOTICS, INC.12111 Jacobson WayRichmond, B. C. V6W 1L5, CANADATel +1 (604) 241-8152, Fax +1 (604) 241-8153
Manufacturing, Distributionand Customer Services
Annual Report 2004Production: Ossur Corporate FinanceDesign and Layout: – advertisingPrinted by: Oddi hfPhotography: Grímur Bjarnason et al.