Aquifer Storage Recovery (ASR) of chlorinated municipal drinking water in a confined aquifer
Water 2015, 7, 4638-4656; doi:10.3390/w7094638
water ISSN 2073-4441
www.mdpi.com/journal/water
Article
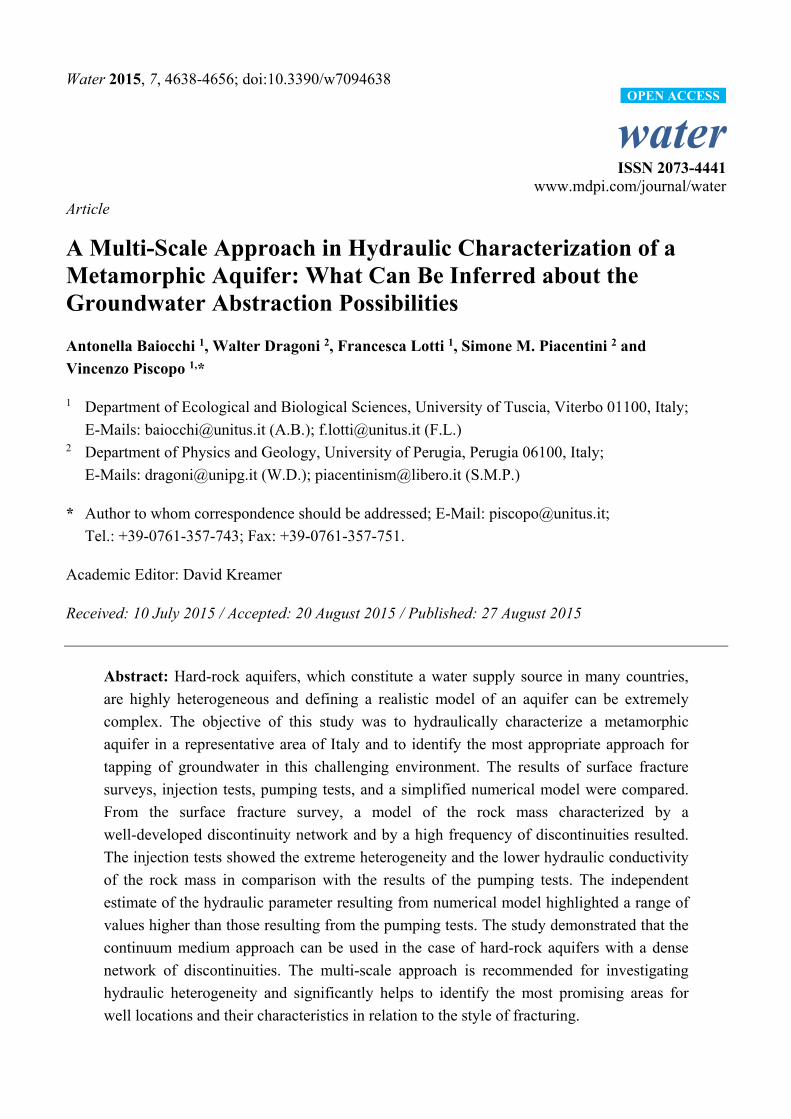
A Multi-Scale Approach in Hydraulic Characterization of a Metamorphic Aquifer: What Can Be Inferred about the Groundwater Abstraction Possibilities
Antonella Baiocchi 1, Walter Dragoni 2, Francesca Lotti 1, Simone M. Piacentini 2 and
Vincenzo Piscopo 1,*
1 Department of Ecological and Biological Sciences, University of Tuscia, Viterbo 01100, Italy;
E-Mails: [email protected] (A.B.); [email protected] (F.L.) 2 Department of Physics and Geology, University of Perugia, Perugia 06100, Italy;
E-Mails: [email protected] (W.D.); [email protected] (S.M.P.)
* Author to whom correspondence should be addressed; E-Mail: [email protected];
Tel.: +39-0761-357-743; Fax: +39-0761-357-751.
Academic Editor: David Kreamer
Received: 10 July 2015 / Accepted: 20 August 2015 / Published: 27 August 2015
Abstract: Hard-rock aquifers, which constitute a water supply source in many countries,
are highly heterogeneous and defining a realistic model of an aquifer can be extremely
complex. The objective of this study was to hydraulically characterize a metamorphic
aquifer in a representative area of Italy and to identify the most appropriate approach for
tapping of groundwater in this challenging environment. The results of surface fracture
surveys, injection tests, pumping tests, and a simplified numerical model were compared.
From the surface fracture survey, a model of the rock mass characterized by a
well-developed discontinuity network and by a high frequency of discontinuities resulted.
The injection tests showed the extreme heterogeneity and the lower hydraulic conductivity
of the rock mass in comparison with the results of the pumping tests. The independent
estimate of the hydraulic parameter resulting from numerical model highlighted a range of
values higher than those resulting from the pumping tests. The study demonstrated that the
continuum medium approach can be used in the case of hard-rock aquifers with a dense
network of discontinuities. The multi-scale approach is recommended for investigating
hydraulic heterogeneity and significantly helps to identify the most promising areas for
well locations and their characteristics in relation to the style of fracturing.
OPEN ACCESS
Water 2015, 7 4639
Keywords: hard-rock aquifers; hydraulic properties; aquifer heterogeneity; numerical
modeling; Italy
1. Introduction
Hard-rock aquifers constitute a water supply source in many regions of Africa, America, and Asia.
These aquifers are generally characterized by a low yield due to their low intrinsic primary
permeability and porosity. Several factors influence the occurrence of groundwater in hard rocks, such
as lithology, geomorphology, tectonics, and climate conditions.
Many studies have shown that hard-rock aquifers are comprised of weathered mantle and fissured
bedrock where the groundwater movement takes place. The hydraulic conductivity and storage of the
weathered mantle and underlying fissured bedrock are derived from geodynamic and geomorphic
processes. The fissures have been explained by several processes, such as lithostatic decompression,
tectonic activity, cooling stress, and weathering processes. These two layers make up a composite
aquifer followed in depth by the fresh basement, which is only locally permeable where tectonic
fractures are present [1–8].
Hard-rock aquifers, such as those constituted by plutonic and metamorphic rocks, are recognized to
be highly heterogeneous, particularly in relation to the different degrees of fracturing. This implies that
the bedrock transmissivity can vary over many orders of magnitude [3,7,9–13]. Therefore, well yields
are highly variable, and a high incidence of well failure occurs. Thus, defining a sustainable pumping
rate is more difficult here than in other cases because of the extremely complex aquifer behavior. In
this case, more so than in other cases, considerations of the discontinuous flow system, anisotropy, and
heterogeneity are required to develop a reasonable model of the aquifer.
To plan for the optimal management and sustainable groundwater development of these aquifers
when the bedrock is densely fractured, the continuum approach is the characterization method
frequently used. This approach is less expensive than discrete-fracture or hybrid approaches. Even if
several studies have concluded that the porous medium approximation is valid in densely fractured
aquifers [14–16], the scientific debate is still open, particularly with regard to the scale at which the
approximation becomes appropriate [17–22].
In Italy, where hard rocks outcrop over large areas in the Alps, Calabria, and Sardinia, the
hydrogeological properties of plutonic and metamorphic rocks are not well known. The groundwater
yields of these aquifers (generally less than 5 × 10⁻³ m3/s per km2) are lower than those in the more
common carbonate and alluvial aquifers (up to 3 × 10⁻² m3/s per km2), which are widely used for the
water supply. The interest in hard-rock aquifers is, thus, generally scarce; nevertheless, the large extent
of these rocks and the scarcity of water resources in Sardinia (where hard-rock aquifers constitute 51%
of the regional area) and Calabria regions (where hard-rock aquifers constitute 39% of the regional
area) justify a thorough analysis [23]. Interest in these aquifers becomes even more relevant in the
framework of the ongoing climate change: most of the scenarios regarding future climate scenarios in
the Mediterranean area suggest a reduction in rainfall and, thus, a reduction in water resources [24,25].
Water 2015, 7 4640
This is the context of our study, which concerns a dam site in metamorphic rock in southern
Sardinia. The dam site provides an opportunity to characterize a hydraulically fractured, metamorphic
aquifer using a multi-scale approach. The results of the surface fracture surveys, injection tests,
pumping tests, and simplified numerical model were compared to examine the heterogeneity of the
hard-rock aquifer and to verify the degree of approximation of the porous medium approach. The
objective of the study was to hydrogeologically characterize these low-permeability rocks and to
examine which approach could better represent the fractured aquifer. This is a key point in the
identification of the appropriate tapping method in a hydrogeological environment where water
resources are generally scarce, but are fundamental to the drinking and irrigation water supply.
2. Study Area
The area under examination is 25 km west of the town of Cagliari, in the Sardinia region (Figure 1),
where the Paleozoic basement related to the Hercynian orogenic evolution outcrops. The Paleozoic
basement consists of an originally-sedimentary succession (Lower Cambrian to Early Carboniferous)
that was deformed during the Carboniferous period under the low metamorphic to anchizonal
setting [26]. The Arburese Unit outcropping at the dam site consists of the Arenarie di San Vito
Formation (Middle Cambrian to Lower Ordovician), which is several hundred meters thick and is
composed of decimetric to metric alternations between micaceous metasandstones, quartzites, and
metasiltstones. Clastic, poorly-cemented sediments, from gravels to sands and silts, of the Upper
Pleistocene to the Holocene overlay the metamorphic basement [27]. The structural framework is
mainly linked to the Hercynian Orogeny and Pliocene tectonic events. The Hercynian tectonics
favored the thrust of the Arburese Unit over the Upper Ordovician to Lower Carboniferous succession
and its deformation in large scale folding with axes of folds E–W and N–S oriented. The Pliocene
tectonics shallow modified the structural setting through normal fault systems E–W, and N–S to
NNW–SSE oriented [28,29].
The hydrogeological properties of the Paleozoic basement are not well known. It is only known that
metamorphic rocks form a low-permeability aquifer (until 20 years ago, these rocks were considered to
be impervious) where groundwater circulation occurs in the fissured zones close to the surface
(on average, the first tens of meters). In the most heavily fractured zones (i.e., near the faults), the
groundwater flow is more active and can occur at a greater depth [30].
The study site corresponds to the building zone of the Medau Zirimilis Dam (Figure 1), a 50-m-high
rockfill dam that was completed with an upstream impervious face and with a grout curtain 10–50 m
deep. The drainage basin of the reservoir, 29.5 km2 of extension, is characterized by a typical
Mediterranean climate with mean annual precipitation between 700 and 900 mm and air temperature
between 15 and 16 °C.
During the construction of the dam and the initial reservoir filling, several hydrogeological
investigations were conducted. One of these was the measurement of the seepage through the rock
foundation and laterally to the dam, that discharged in the drainage systems located at the base of the
dam embankment and downstream of the grout curtain. These and other investigations highlighted the
fact that the groundwater circulation involved the most fissured layers closest to the surface, including,
Water 2015, 7 4641
on average, the first 50 m of the Paleozoic rocks, up to a depth of 100 m in the faulted zones. The most
evident faulted zone has been found in the valley bottom at the site of the dam [30].
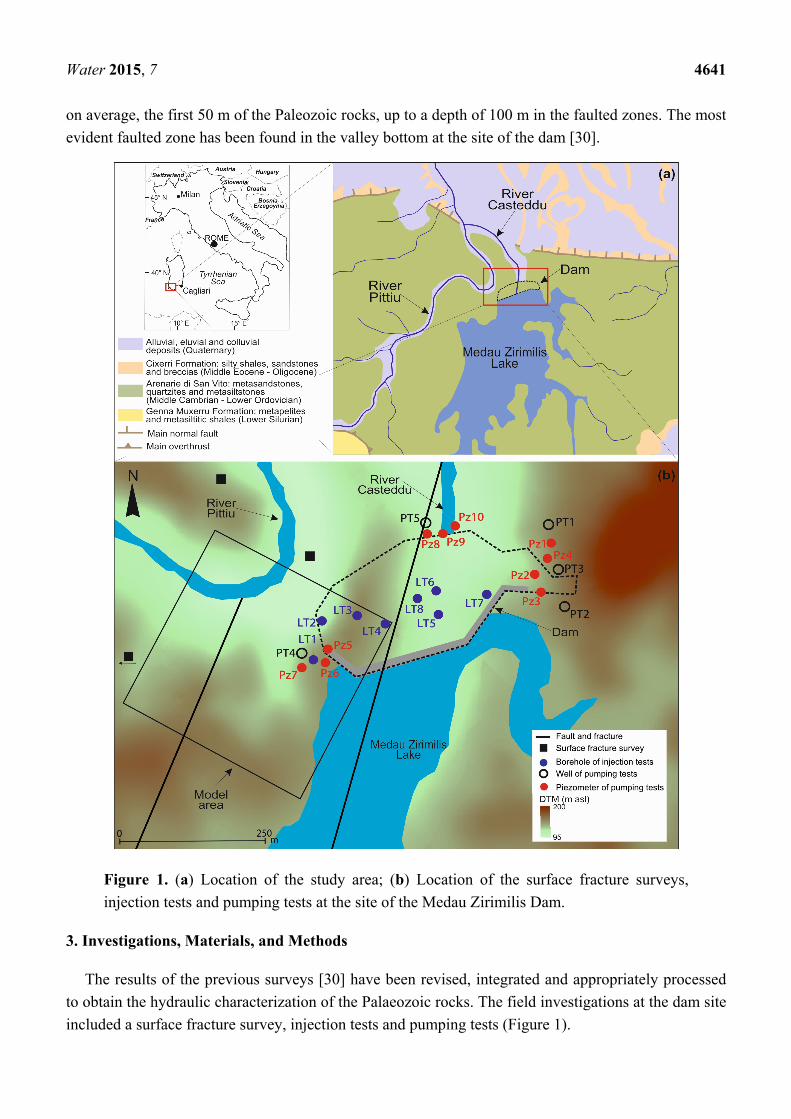
Figure 1. (a) Location of the study area; (b) Location of the surface fracture surveys,
injection tests and pumping tests at the site of the Medau Zirimilis Dam.
3. Investigations, Materials, and Methods
The results of the previous surveys [30] have been revised, integrated and appropriately processed
to obtain the hydraulic characterization of the Palaeozoic rocks. The field investigations at the dam site
included a surface fracture survey, injection tests and pumping tests (Figure 1).

Water 2015, 7 4642
The surface fracture survey concerned the Arenarie di San Vito Formation on three rock walls
(ranging in size from 20 to 30 m2) with different orientations located in the western sector of the dam
(Figure 1): there were two vertical planes oriented to 60° N and 350° N and one horizontal plane. For
each planar surface, the discontinuity orientation, the apparent aperture (measured by a feeler gauge
with minimum determinable aperture of 0.05 mm), and the spacing between the discontinuities
belonging to the same set were determined. The discontinuities considered were those having a trace
length greater than 80% of the size of the measured plane (from 2 × 10 to 3 × 10 m).
The injection tests (Lugeon tests) concerned single-hole tests conducted on sealed sections with packers
(from 3 to 5 m in length). Five pressure steps were applied (generally 0.2–0.5–1.0–0.5–0.2 MPa at the
manometer), measuring the undisturbed water level before injection and making sure that the injected
discharge was stabilized. A total of 76 tests were performed in eight boreholes penetrating the Arenarie
di San Vito Formation (Figure 1) to a maximum depth of 60 m; one of the boreholes was drilled with a
dip angle of 60° (LT8 in Figure 1).
During the initial reservoir filling, pumping tests were performed at five wells (Figure 1), with
depths between 73 and 100 m (dip angle from 10° to 30°). The pumping tests lasted between 7.5 and
45 h at a constant rate between 2.1 × 10⁻³ and 3.5 × 10⁻³ m3/s, with the observation of a drawdown in
at least one piezometer nearby the tested well. The pumping data were interpreted using analytical
techniques [31] and commercial software (Aquifer Test 4.1, Nova Metrix GM, Kitchener, Canada).
Based on the results of the hydraulic characterization of the site, a simplified numerical model was
constructed for the western sector of the dam site (Figure 1), where one of the tested wells is located,
and nearby the outcrops of the surface fracture surveys. The purpose of the numerical simulation was
to examine the results of pumping tests to a further scale, different from that of the analytical solutions
and of the other hydraulic tests. The model was implemented with the code MODFLOW-2000
(Groundwater Vistas 6 graphical user interface). The reconstruction of the DTM provided the top
elevation. The initial heads were obtained using the interpolation of the heads measured during the
initial reservoir filling.
4. Results
The results are reported with reference to different methods of the hydraulic characterization and to
the numerical simulation.
4.1. Discontinuity-Network Characterization
Two discontinuity types were identified in the examined outcrops. The first type consisted of
regular bedding planes that were continuous at the scale of the outcrops and delimited the various
metasandstone and metasiltstone beds. The second type of discontinuity consisted of sub-vertical
straight joints of varying orientations that cut the bedding planes.
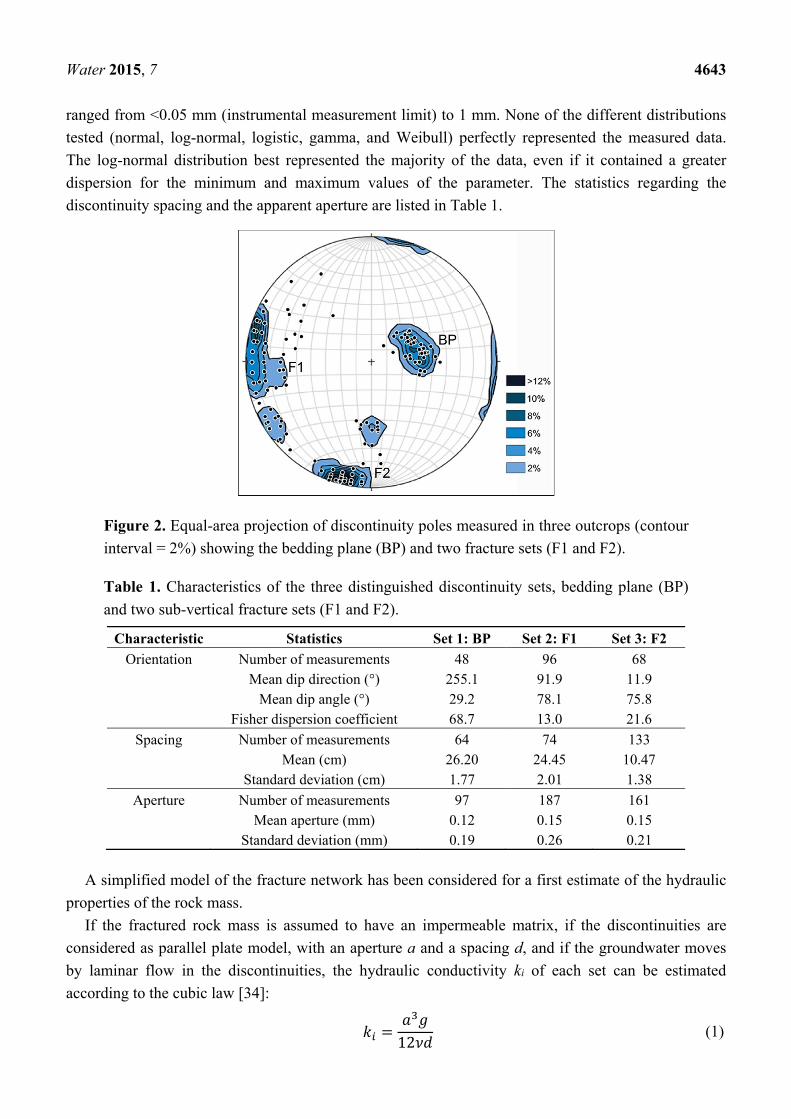
The projection of the discontinuity poles on a stereographic net [32,33] made it possible to group
the systematic discontinuities into three different sets (Figure 2). Table 1 lists the average values of the
dip direction, dip angle and Fisher dispersion coefficient of each set.
The measured spacing approaches a log-normal distribution for the three sets. The apertures were
measured on discontinuity segments when they were not altered by the weathering phenomena and
Water 2015, 7 4643
ranged from <0.05 mm (instrumental measurement limit) to 1 mm. None of the different distributions
tested (normal, log-normal, logistic, gamma, and Weibull) perfectly represented the measured data.
The log-normal distribution best represented the majority of the data, even if it contained a greater
dispersion for the minimum and maximum values of the parameter. The statistics regarding the
discontinuity spacing and the apparent aperture are listed in Table 1.
Figure 2. Equal-area projection of discontinuity poles measured in three outcrops (contour
interval = 2%) showing the bedding plane (BP) and two fracture sets (F1 and F2).
Table 1. Characteristics of the three distinguished discontinuity sets, bedding plane (BP)
and two sub-vertical fracture sets (F1 and F2).
Characteristic Statistics Set 1: BP Set 2: F1 Set 3: F2
Orientation Number of measurements 48 96 68 Mean dip direction (°) 255.1 91.9 11.9 Mean dip angle (°) 29.2 78.1 75.8 Fisher dispersion coefficient 68.7 13.0 21.6
Spacing Number of measurements 64 74 133 Mean (cm) 26.20 24.45 10.47 Standard deviation (cm) 1.77 2.01 1.38
Aperture Number of measurements 97 187 161 Mean aperture (mm) 0.12 0.15 0.15 Standard deviation (mm) 0.19 0.26 0.21
A simplified model of the fracture network has been considered for a first estimate of the hydraulic
properties of the rock mass.
If the fractured rock mass is assumed to have an impermeable matrix, if the discontinuities are
considered as parallel plate model, with an aperture a and a spacing d, and if the groundwater moves
by laminar flow in the discontinuities, the hydraulic conductivity ki of each set can be estimated
according to the cubic law [34]:
12 (1)
Water 2015, 7 4644
where g is the gravitational acceleration and υ is the kinematic viscosity of water.
The values of a and d introduced in Equation (1) are the mean values of the apparent aperture and
spacing resulting from the statistical analysis (Table 1). The calculated hydraulic conductivities of the
different sets ranged from 5 × 10⁻⁶ to 3 × 10⁻⁵ m/s (Table 2).
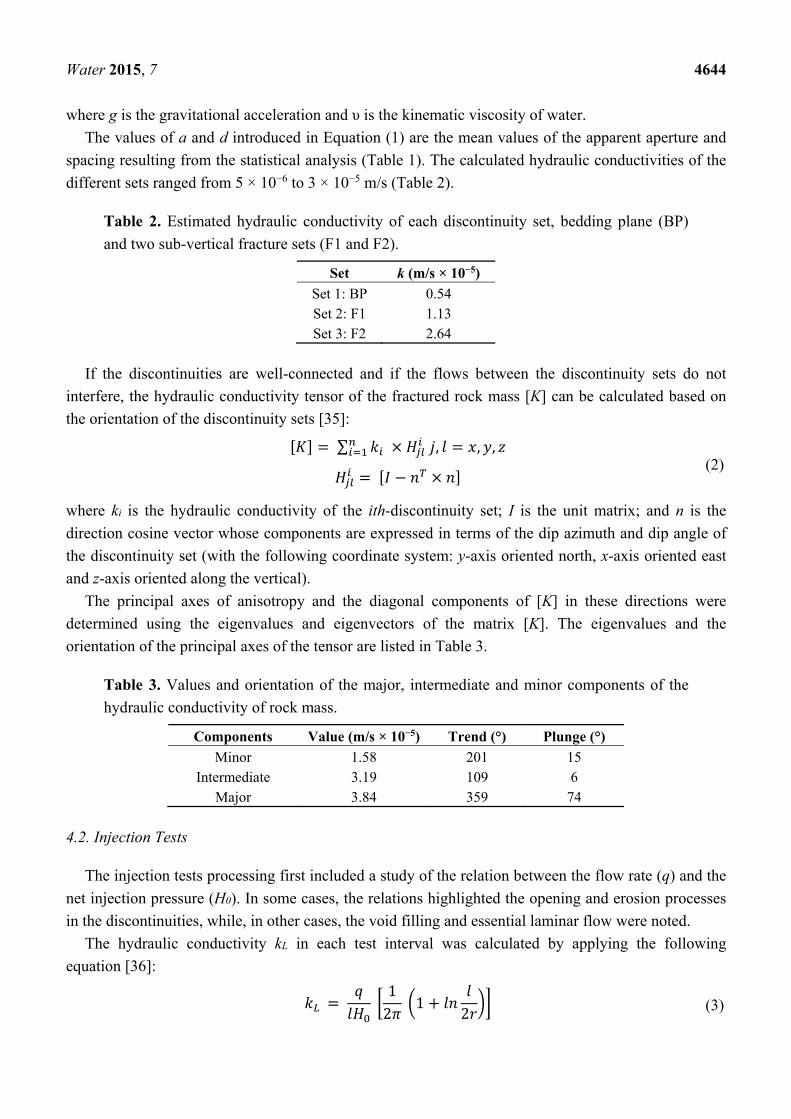
Table 2. Estimated hydraulic conductivity of each discontinuity set, bedding plane (BP)
and two sub-vertical fracture sets (F1 and F2).
Set k (m/s × 10−5)
Set 1: BP 0.54 Set 2: F1 1.13 Set 3: F2 2.64
If the discontinuities are well-connected and if the flows between the discontinuity sets do not
interfere, the hydraulic conductivity tensor of the fractured rock mass [K] can be calculated based on
the orientation of the discontinuity sets [35]: ∑ , , ,
(2)
where ki is the hydraulic conductivity of the ith-discontinuity set; I is the unit matrix; and n is the
direction cosine vector whose components are expressed in terms of the dip azimuth and dip angle of
the discontinuity set (with the following coordinate system: y-axis oriented north, x-axis oriented east
and z-axis oriented along the vertical).
The principal axes of anisotropy and the diagonal components of [K] in these directions were
determined using the eigenvalues and eigenvectors of the matrix [K]. The eigenvalues and the
orientation of the principal axes of the tensor are listed in Table 3.
Table 3. Values and orientation of the major, intermediate and minor components of the
hydraulic conductivity of rock mass.
Components Value (m/s × 10−5) Trend (°) Plunge (°)
Minor 1.58 201 15 Intermediate 3.19 109 6
Major 3.84 359 74
4.2. Injection Tests
The injection tests processing first included a study of the relation between the flow rate (q) and the
net injection pressure (H0). In some cases, the relations highlighted the opening and erosion processes
in the discontinuities, while, in other cases, the void filling and essential laminar flow were noted.
The hydraulic conductivity kL in each test interval was calculated by applying the following
equation [36]:
12 1 2 (3)

Water 2015, 7 4645
where l and r are the length of the injection section and the borehole radius, respectively; and q and H0
are the flow rate and the net injection pressure values under laminar flow, respectively.
The calculated values of kL fell within three orders of magnitude (10−8–10−6 m/s), with a geometric
mean of 2.81 × 10⁻⁷ m/s. Figure 3 shows the kL values of each borehole plotted versus the average
depth of the injection section. At depths greater than 25 m, there was a significant decrease in the
hydraulic conductivity, with the exception of the inclined borehole (LT8 in Figure 3). Above a depth
of 25 m, the boreholes that were located in the valley bottom (LT4-LT8 in Figure 3), corresponding to
a faulted zone, exhibited a higher kL.
Figure 3. Hydraulic conductivity kL from the injection tests versus the average depth of the
injection section.
4.3. Pumping Tests
The pumping test data diagnosis included a comparison of the drawdown plots of each piezometer
with theoretical models to determine the aquifer parameters. This analysis showed that the Theis [37],
leaky aquifer [38] and double porosity [39] models could explain most of the measured drawdowns; in
some cases, two or three theoretical models interpreted the same drawdown-time trend without
significant differences in the calculated aquifer parameters, i.e., the transmissivity and storage
coefficient. For wells with more than one piezometer, there was a simultaneous response in the
pumping, and generally, a similar shape for the drawdown curve for the different observation wells
was reported, as observed in Figure 4.
Table 4 summarizes the results of the aquifer parameters, which were calculated as an average value
when more than one model presented a good fit with the measured data and with the statistics of the
curve matching. The overall transmissivity and storage coefficients varied from 2.3 × 10⁻⁴ to
3.6 × 10⁻³ m2/s and from 3.1 × 10⁻⁵ to 2.6 × 10⁻², respectively. The transmissivities were converted into
hydraulic conductivities (KP) based on the saturated aquifer thickness intercepted by the tested well. The
values of KP fell in the range of 4.6 × 10⁻⁶–4.1 × 10⁻⁵ m/s, with a geometric mean of 1.68 × 10⁻⁵ m/s.
Water 2015, 7 4646
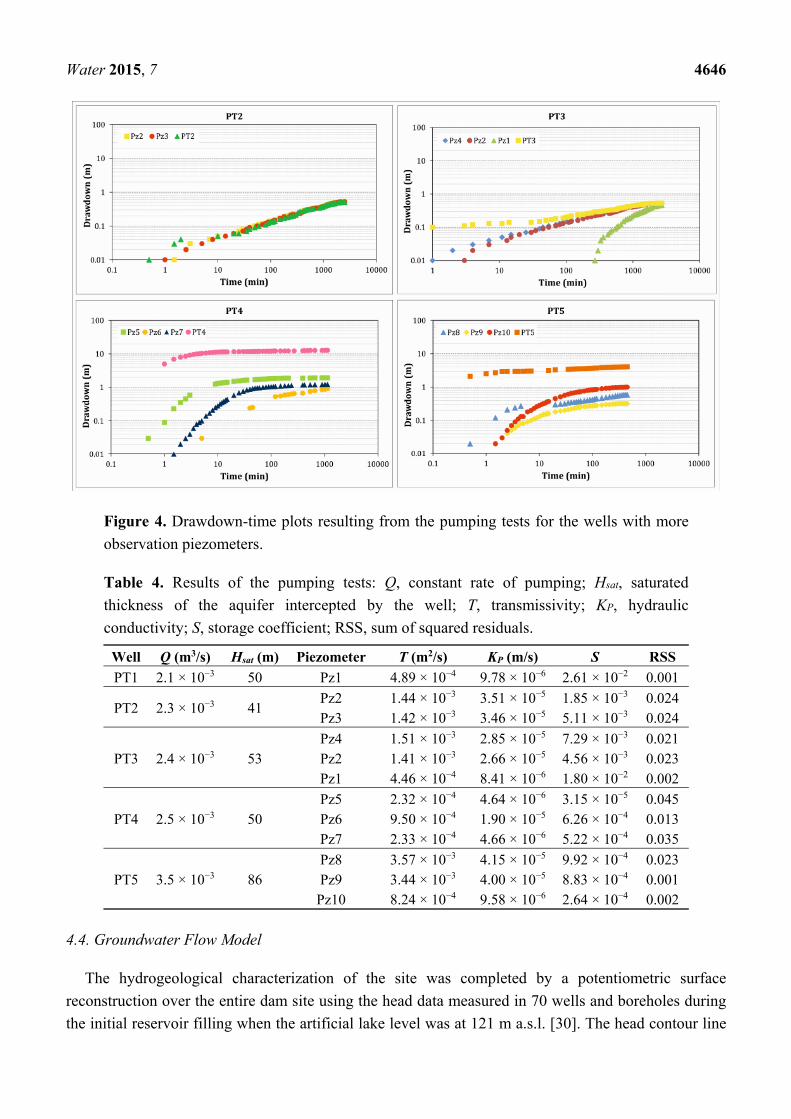
Figure 4. Drawdown-time plots resulting from the pumping tests for the wells with more
observation piezometers.
Table 4. Results of the pumping tests: Q, constant rate of pumping; Hsat, saturated
thickness of the aquifer intercepted by the well; T, transmissivity; KP, hydraulic
conductivity; S, storage coefficient; RSS, sum of squared residuals.
Well Q (m3/s) Hsat (m) Piezometer T (m2/s) KP (m/s) S RSS
PT1 2.1 × 10⁻³ 50 Pz1 4.89 × 10⁻⁴ 9.78 × 10⁻⁶ 2.61 × 10⁻² 0.001
PT2 2.3 × 10⁻³ 41 Pz2 1.44 × 10⁻³ 3.51 × 10⁻⁵ 1.85 × 10⁻³ 0.024 Pz3 1.42 × 10⁻³ 3.46 × 10⁻⁵ 5.11 × 10⁻³ 0.024
PT3 2.4 × 10⁻³ 53 Pz4 1.51 × 10⁻³ 2.85 × 10⁻⁵ 7.29 × 10⁻³ 0.021 Pz2 1.41 × 10⁻³ 2.66 × 10⁻⁵ 4.56 × 10⁻³ 0.023 Pz1 4.46 × 10⁻⁴ 8.41 × 10⁻⁶ 1.80 × 10⁻² 0.002
PT4 2.5 × 10⁻³ 50 Pz5 2.32 × 10⁻⁴ 4.64 × 10⁻⁶ 3.15 × 10⁻⁵ 0.045 Pz6 9.50 × 10⁻⁴ 1.90 × 10⁻⁵ 6.26 × 10⁻⁴ 0.013 Pz7 2.33 × 10⁻⁴ 4.66 × 10⁻⁶ 5.22 × 10⁻⁴ 0.035
PT5 3.5 × 10⁻³ 86 Pz8 3.57 × 10⁻³ 4.15 × 10⁻⁵ 9.92 × 10⁻⁴ 0.023 Pz9 3.44 × 10⁻³ 4.00 × 10⁻⁵ 8.83 × 10⁻⁴ 0.001
Pz10 8.24 × 10⁻⁴ 9.58 × 10⁻⁶ 2.64 × 10⁻⁴ 0.002
4.4. Groundwater Flow Model
The hydrogeological characterization of the site was completed by a potentiometric surface
reconstruction over the entire dam site using the head data measured in 70 wells and boreholes during
the initial reservoir filling when the artificial lake level was at 121 m a.s.l. [30]. The head contour line
Water 2015, 7 4647
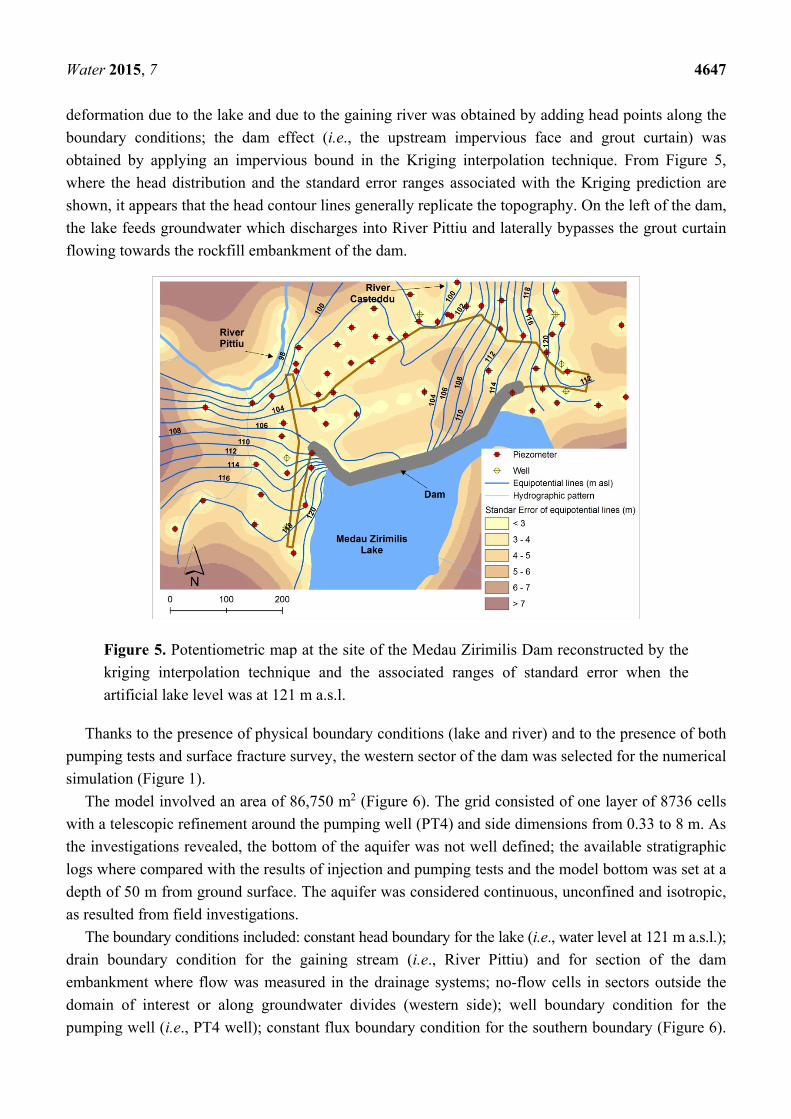
deformation due to the lake and due to the gaining river was obtained by adding head points along the
boundary conditions; the dam effect (i.e., the upstream impervious face and grout curtain) was
obtained by applying an impervious bound in the Kriging interpolation technique. From Figure 5,
where the head distribution and the standard error ranges associated with the Kriging prediction are
shown, it appears that the head contour lines generally replicate the topography. On the left of the dam,
the lake feeds groundwater which discharges into River Pittiu and laterally bypasses the grout curtain
flowing towards the rockfill embankment of the dam.
Figure 5. Potentiometric map at the site of the Medau Zirimilis Dam reconstructed by the
kriging interpolation technique and the associated ranges of standard error when the
artificial lake level was at 121 m a.s.l.
Thanks to the presence of physical boundary conditions (lake and river) and to the presence of both
pumping tests and surface fracture survey, the western sector of the dam was selected for the numerical
simulation (Figure 1).
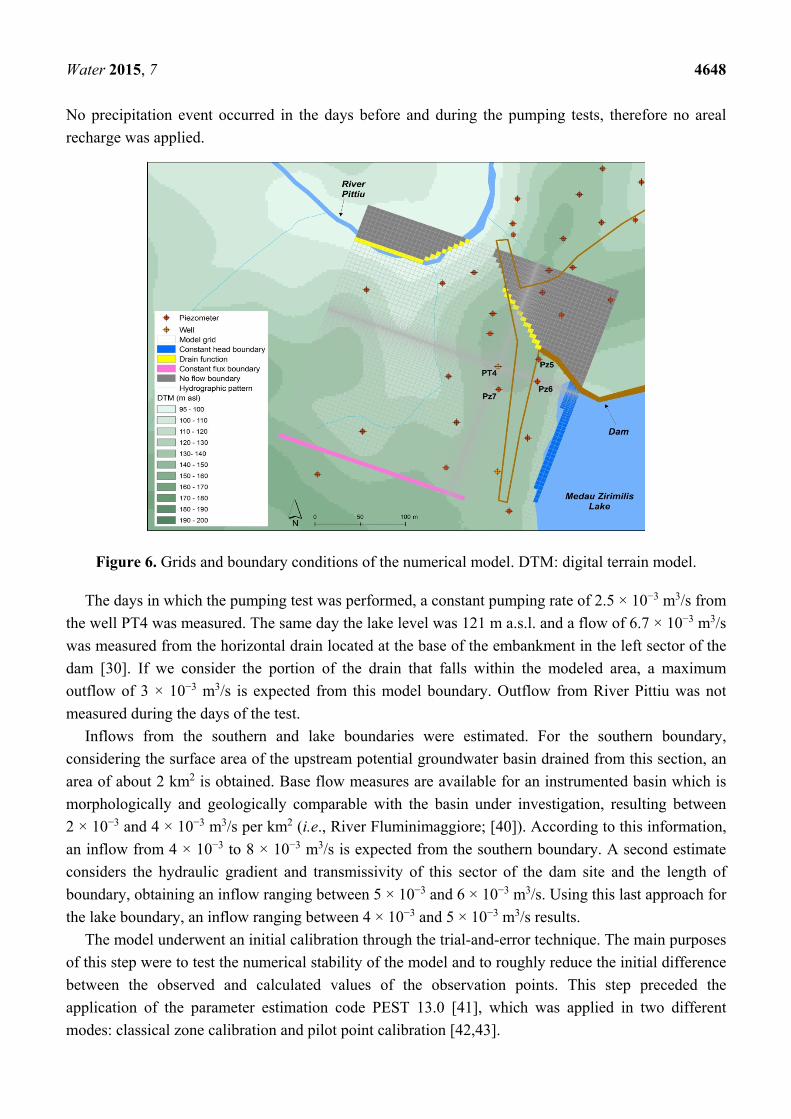
The model involved an area of 86,750 m2 (Figure 6). The grid consisted of one layer of 8736 cells
with a telescopic refinement around the pumping well (PT4) and side dimensions from 0.33 to 8 m. As
the investigations revealed, the bottom of the aquifer was not well defined; the available stratigraphic
logs where compared with the results of injection and pumping tests and the model bottom was set at a
depth of 50 m from ground surface. The aquifer was considered continuous, unconfined and isotropic,
as resulted from field investigations.
The boundary conditions included: constant head boundary for the lake (i.e., water level at 121 m a.s.l.);
drain boundary condition for the gaining stream (i.e., River Pittiu) and for section of the dam
embankment where flow was measured in the drainage systems; no-flow cells in sectors outside the
domain of interest or along groundwater divides (western side); well boundary condition for the
pumping well (i.e., PT4 well); constant flux boundary condition for the southern boundary (Figure 6).
Water 2015, 7 4648
No precipitation event occurred in the days before and during the pumping tests, therefore no areal
recharge was applied.
Figure 6. Grids and boundary conditions of the numerical model. DTM: digital terrain model.
The days in which the pumping test was performed, a constant pumping rate of 2.5 × 10⁻³ m3/s from
the well PT4 was measured. The same day the lake level was 121 m a.s.l. and a flow of 6.7 × 10⁻³ m3/s
was measured from the horizontal drain located at the base of the embankment in the left sector of the
dam [30]. If we consider the portion of the drain that falls within the modeled area, a maximum
outflow of 3 × 10⁻³ m3/s is expected from this model boundary. Outflow from River Pittiu was not
measured during the days of the test.
Inflows from the southern and lake boundaries were estimated. For the southern boundary,
considering the surface area of the upstream potential groundwater basin drained from this section, an
area of about 2 km2 is obtained. Base flow measures are available for an instrumented basin which is
morphologically and geologically comparable with the basin under investigation, resulting between
2 × 10⁻³ and 4 × 10⁻³ m3/s per km2 (i.e., River Fluminimaggiore; [40]). According to this information,
an inflow from 4 × 10⁻³ to 8 × 10⁻³ m3/s is expected from the southern boundary. A second estimate
considers the hydraulic gradient and transmissivity of this sector of the dam site and the length of
boundary, obtaining an inflow ranging between 5 × 10⁻³ and 6 × 10⁻³ m3/s. Using this last approach for
the lake boundary, an inflow ranging between 4 × 10⁻³ and 5 × 10⁻³ m3/s results.
The model underwent an initial calibration through the trial-and-error technique. The main purposes
of this step were to test the numerical stability of the model and to roughly reduce the initial difference
between the observed and calculated values of the observation points. This step preceded the
application of the parameter estimation code PEST 13.0 [41], which was applied in two different
modes: classical zone calibration and pilot point calibration [42,43].
Water 2015, 7 4649
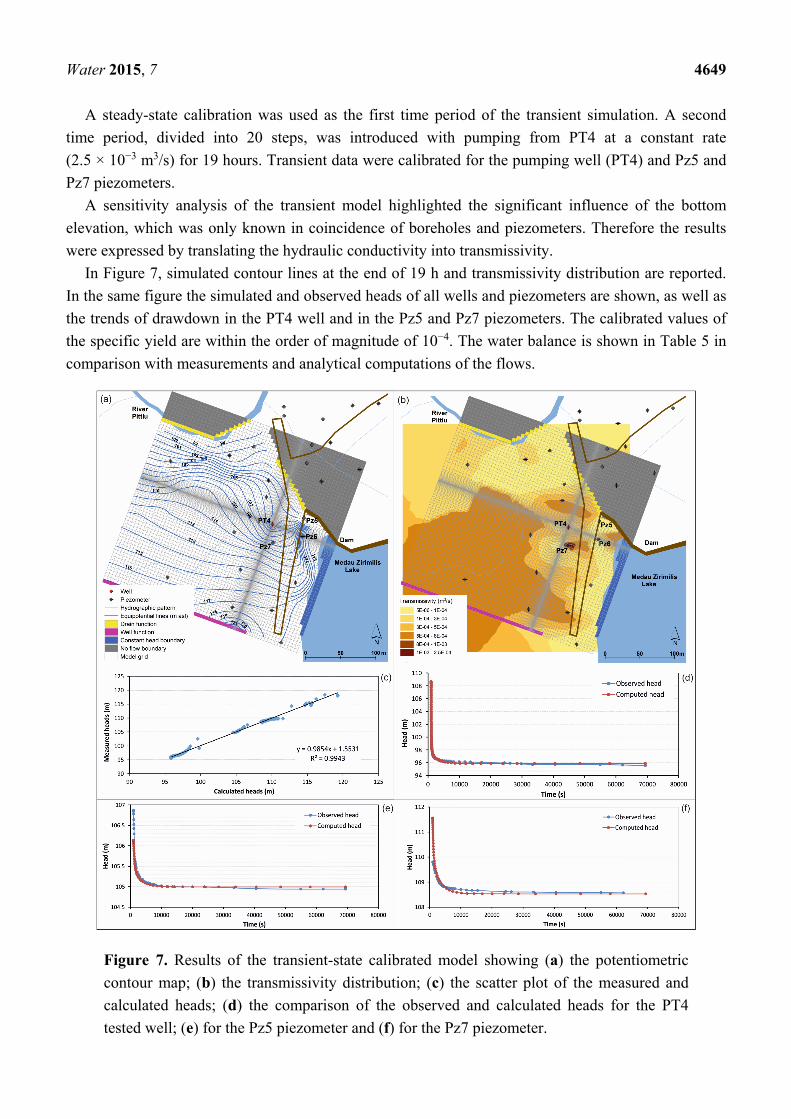
A steady-state calibration was used as the first time period of the transient simulation. A second
time period, divided into 20 steps, was introduced with pumping from PT4 at a constant rate
(2.5 × 10⁻³ m3/s) for 19 hours. Transient data were calibrated for the pumping well (PT4) and Pz5 and
Pz7 piezometers.
A sensitivity analysis of the transient model highlighted the significant influence of the bottom
elevation, which was only known in coincidence of boreholes and piezometers. Therefore the results
were expressed by translating the hydraulic conductivity into transmissivity.
In Figure 7, simulated contour lines at the end of 19 h and transmissivity distribution are reported.
In the same figure the simulated and observed heads of all wells and piezometers are shown, as well as
the trends of drawdown in the PT4 well and in the Pz5 and Pz7 piezometers. The calibrated values of
the specific yield are within the order of magnitude of 10−4. The water balance is shown in Table 5 in
comparison with measurements and analytical computations of the flows.
Figure 7. Results of the transient-state calibrated model showing (a) the potentiometric
contour map; (b) the transmissivity distribution; (c) the scatter plot of the measured and
calculated heads; (d) the comparison of the observed and calculated heads for the PT4
tested well; (e) for the Pz5 piezometer and (f) for the Pz7 piezometer.
Water 2015, 7 4650
Table 5. Groundwater budget resulting from the numerical model compared with the
estimated terms from the conceptual model.
Model Inflow ( × 10−3 m3/s) Outflow ( × 10−3 m3/s) % Error
(in-out) Lateral Boundaries Lake Storage Well River Lateral Boundaries
Numerical Model 6.84 3.10 0.08 2.50 5.69 1.81 0.2
Conceptual model 4–8 4–5 - 2.50 na 3 -
Notes: na: not available.
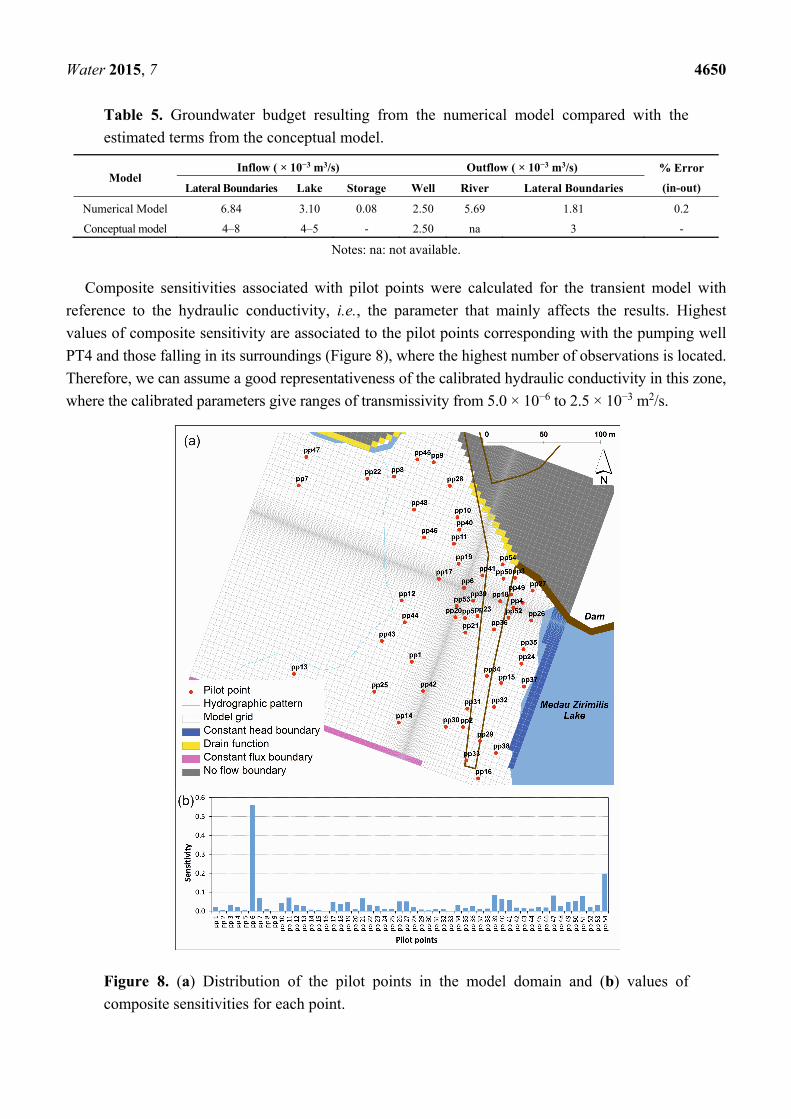
Composite sensitivities associated with pilot points were calculated for the transient model with
reference to the hydraulic conductivity, i.e., the parameter that mainly affects the results. Highest
values of composite sensitivity are associated to the pilot points corresponding with the pumping well
PT4 and those falling in its surroundings (Figure 8), where the highest number of observations is located.
Therefore, we can assume a good representativeness of the calibrated hydraulic conductivity in this zone,
where the calibrated parameters give ranges of transmissivity from 5.0 × 10⁻⁶ to 2.5 × 10⁻³ m2/s.
Figure 8. (a) Distribution of the pilot points in the model domain and (b) values of
composite sensitivities for each point.
Water 2015, 7 4651
5. Discussion
Investigations concerning fractured metamorphic rocks in a representative area of Sardinia can be
used to hydrogeologically characterize these low-permeability rocks and to examine which approach
can be used to represent the fractured aquifer. By interfacing the results of surface fracture surveys,
injection tests and pumping tests with those of a flow numerical model, we inspected if the porous
equivalent approach could (or could not) provide a good approximation of a fractured aquifer.
The surface fracture survey provides a model of rock mass that is characterized by a well-developed
discontinuity network (three discontinuity sets), a high frequency of discontinuities (spacing of less
than 0.5 m) and comparable values of the average apparent aperture of the different sets
(approximately 0.1 mm). Therefore the results of the surface fracture survey implied the possibility of
considering the fractured medium as an equivalent porous medium at the outcrop scale, because the
discontinuity network gives rise to a reduced representative elementary volume (less than 1 m3) for the
rock mass.
The discontinuity network produces a slight anisotropy in the medium, with the major principal
component of the hydraulic conductivity directed vertically downward, as expected given the
predominance of vertical discontinuities over horizontal ones in the studied area. However, the
modules of the hydraulic conductivity determined for the rock mass should be considered in relative
terms and not in absolute terms because the apparent aperture does not correspond to the hydraulic
aperture. A greater reliability can be assigned to the orientation of the three principal components,
independent from the aperture.
The injection tests clearly showed the extreme heterogeneity of the rock mass, as highlighted by the
wide range of values determined for the hydraulic conductivity (10−8–10−6 m/s). This can be
interpreted by considering the variability of the rock mass fracturing in relation to the proximity to the
faulted zone in the valley of the dam site. The highest values of hydraulic conductivity were found for
the inclined borehole, which was close to the fault zone and, thus, intercepted a great number of
vertical fractures. With the exception of the inclined borehole close to fault zone, the hydraulic
conductivity was observed to diminish below a depth of 25 m.
The hydraulic conductivity derived from the pumping tests covered a lower range of values
(10−6–10−5 m/s) than did those calculated using the injection tests. No particular trend was evident
from the comparison of the values of hydraulic conductivity obtained for piezometers located in
different directions from the pumped well. The variation in the parameter is therefore attributable to
the heterogeneity of the aquifer rather than to its horizontal anisotropy. Moreover, if we consider the
simultaneous response to pumping and the similar shape of the drawdown curves for the different
piezometers when the pumping was performed from the same well, the porous medium approximation
appears appropriate.
The comparison between the hydraulic conductivity determined by the injection tests and the
pumping tests revealed values that were substantially lower in the first case (Figure 9). This can be
attributed to the limited volume of rock mass affected by the injection tests compared to that affected
by the pumping tests. In both cases, the hydraulic heterogeneity of the rock mass was evident. The
injection tests and the pumping tests also converged and indicated higher hydraulic conductivities near
the fault that runs in the valley of the dam site (Figure 3 and Table 4). Instead, the limit for the

Water 2015, 7 4652
determination of the aperture by the surface survey did not permit a direct comparison of the hydraulic
conductivity values determined using this method. However, if the average hydraulic conductivity
(i.e., the geometric mean) calculated from the pumping tests and the average spacing of the three sets
determined from the surface survey are introduced in Equation (1), the average aperture value would
be 0.16 mm, which is comparable with those measured in outcrop. However, the range of hydraulic
conductivity resulting from the surface survey (10−6–10−5 m/s) is consistent with that evaluated by
pumping tests (Figure 9).
Figure 9. Hydraulic parameters and scale of measurement of the different methods used.
This scale effect of the parameter is expected in heterogeneous media [44–47] because the volume
investigated by the injection tests was significantly smaller than that of the pumping tests. In the graph
of Figure 9 one can see that the range of hydraulic conductivity values obtained from the surface
fracture survey is consistent with the increase of hydraulic conductivity with the increase of the
measuring scale. This implies that the results of surface fracture survey can be considered in the
characterization of hard rocks when the discontinuity apertures are measured on the unweathered
portions of discontinuity, at least to identify the order of magnitude of the parameter.
The numerical model considered one representative pumping test and provided additional
information on the hydrogeological characterization of the hard rocks.
The results of the field investigations together with the model output would encourage the
equivalent porous approach, at least in geological situations similar to that here considered. The
estimate of transmissivity resulting from the model highlighted a range of values higher than those
resulting from the pumping tests. However, the transmissivity values determined in the pumping tests
(from 10−4 to 10−3 m2/s) fell in the range of the calibrated values of the model (from 10−6 to 10−3 m2/s),
with a common upper limit of the parameter (Figure 9). This still seems to be consistent with what is
reported in the literature, i.e., that the increase in average permeability apparently does not continue
from the pumping test to a regional scale [44,45]. On the other hand, four orders of magnitude of
transmissivity obtained from the model compared with two orders of magnitude from the pumping
Water 2015, 7 4653
tests, highlight a high hydraulic heterogeneity of the aquifer, this time in agreement with the results of
the injection tests.
6. Conclusions
The multi-scale characterization of the metamorphic rocks of the area studied herein demonstrated
that the continuum medium approach can be used when a dense network of discontinuities exists
(representative elementary volume of few cubic meters), as in the case of the fractured aquifer
examined. What strongly affects this approach is the hydraulic heterogeneity of the medium. The
multi-scale approach is thus recommended for investigating the hydraulic heterogeneity, and it can
help to manage uncertainty by placing greater trust in the obtained results. In particular, it is evident
that the surface fracture survey enhances the hydraulic characterization of fractured rocks, when the
fracturing affects the layers closest to the surface, as the general case of the hard-rock aquifers.
Regarding the transmissivity of the examined hard-rock aquifer, it falls in the classes III and IV of
the classification proposed by Krasny [48], corresponding to rocks from low to intermediate
transmissivity magnitude. This aquifer, commonly believed to be not productive, may be of interest for
the local water supply, especially if one considers the large extent of these rocks and the scarcity of
water resources in Sardinia. The same concept could be applied in other regions of the world where
these aquifers outcrop over very large areas. In this regard, our findings confirm that the most
promising areas for well location correspond to valleys close to faulted zones where transmissivity
increases; in these specific zones a relative higher yield of wells is expected, especially in case of
boreholes inclined according to an angle which can be determined after the fracture characterization.
Acknowledgments
The authors wish to thank the two anonymous reviewers for their constructive comments and
suggestions. Vincenzo Piscopo want to remember recently deceased Pietro Celico to have introduced
him with passion and dedication to hydrogeology.
Author Contributions
All of the authors contributed extensively to the work. Vincenzo Piscopo led the research.
Antonella Baiocchi, Francesca Lotti and Simone Piacentini performed the data analysis and numerical
modeling. Walter Dragoni contributed to the manuscript review. All authors contributed to the
manuscript preparation, discussing and sharing the conclusions.
Conflicts of Interest
The authors declare no conflict of interest.
References
1. Banks, D.; Banks, S. Hydrogeology of Hard Rocks. In Proceedings of the Memoires of the 24th
Congress, International Association of Hydrogeologists, Oslo, Norway, 28th June–2nd July 1993;
volume 28, pp. 1–684.

Water 2015, 7 4654
2. Stober, I.; Bucher, K. Hydrogeology of Crystalline Rocks; Kluwer Academic Publishers:
Dordrecht, The Netherlands, 2003.
3. Taylor, R.; Howard, K. A tectono-geomorphic model of the hydrogeology of deeply weathered
crystalline rock: Evidence from Uganda. Hydrogeol. J. 2000, 8, 279–294.
4. Cho, M.; Ha, K.-M.; Choi, Y.-S.; Kee, W.-S.; Lachassagne, P.; Wyns, R. Relationship between
the Permeability of Hard-Rock Aquifers and Their Weathered Cover Based on Geological and
Hydrogeological Observation in South Korea. In Proceedings of the IAH Conference on
“Groundwater in fractured rocks”, Prague, Czech, 15–19 September 2003.
5. Dewandel, B.; Lachassagne, P.; Wyns, R.; Maréchal, J.C.; Krishnamurthy, N.S. A generalized 3-D
geological and hydrogeological conceptual model of granite aquifers controller by single or
multiphase weathering. J. Hydrol. 2006, 320, 260–284.
6. Krasny, J.; Sharp, J.M. Groundwater in Fractured Rocks; Taylor & Francis: London, UK, 2007.
7. Foster, S. Hard-rock aquifers in tropical regions: Using science to inform development and
management policy. Hydrogeol. J. 2012, 20, 659–672.
8. Sharp, J.M. Fractured Rock Hydrogeology; Taylor & Francis: London, UK, 2014.
9. Uhl, V.W.; Sharma, G.K. Results of pumping tests in crystalline-rock aquifers. Ground Water
1978, 16, 192–203.
10. Howard, K.W.K.; Hughes, M.; Charlesworth, D.L.; Ngobi, G. Hydrogeologic evaluation of
fracture permeability in crystalline basement aquifers of Uganda. Hydrogeol. J. 1992, 1, 55–65.
11. Chilton, P.J.; Foster, S.S.D. Hydrogeological characteristics and water-supply potential of
basement aquifers in tropical Africa. Hydrogeol. J. 1995, 3, 3–49.
12. Maréchal, J.C.; Dewandel, B.; Subrahmanyam, K. Use of hydraulic tests at different scales to
characterize fracture network properties in the weathered-fractured layer of a hard rock aquifer.
Water Resour. Res. 2004, 40, doi:10.1029/2004WR003137.
13. Banks, D.; Gundersen, P.; Gustafson, G.; Makela, J.; Morland, G. Regional similarities in the
distributions of well yield from crystalline rocks in Fennoscandia. Norges Geol. Unders. Bull.
2010, 450, 33–47.
14. Lee, C.H.; Chang, J.L.; Deng, B.W. A continuum approach for estimating permeability in
naturally fractured rocks. Eng. Geol. 1995, 39, 71–85.
15. Scanlon, B.R.; Mace, R.E.; Barrett, M.E.; Smith, B. Can we simulate regional groundwater flow
in a karst system using equivalent porous media models? Case study, Barton Springs Edwards
aquifer, USA. J. Hydrol. 2003, 276, 135–158.
16. Lemieux, J-M.; Therrien, R.; Kirkwood, D. Small scale study of groundwater flow in a fractured
carbonate-rock aquifer at the St-Eustache quarry, Québec, Canada. Hydrogeol. J. 2006, 14, 603–612.
17. Long, J.C.S.; Remer, J.S.; Wilson, C.R.; Witherspoon, P.A. Porous media equivalents for
networks of discontinuous fractures. Water Resour. Res. 1982, 18, 645–658.
18. Hsieh, P.A.; Neuman, S.P.; Stiles, G.K.; Simpson, E.S. Field determination of the three-dimensional
hydraulic conductivity tensor of anisotropic media. 2 Methodology and application to fractured
rocks. Water Resour. Res. 1985, 21, 1667–1676.
19. Neuman, S.P. Stochastic Continuum Representation of Fractured Rock Permeability as an
Alternative to the Rev and Fracture Network Concepts. In Proceedings of the 28th US Symposium
on Rock Mechanics, Tucson, AZ, USA, 29 June–1 July 1987; pp. 533–561.
Water 2015, 7 4655
20. Bradbury, K.R.; Muldoon, M.A.; Zaporec, A.; Levy, J. Delineation of Wellhead Protection Areas
in Fractured Rocks; US EPA Technical Guidance Document, EPA 570/9-91-009; EPA:
Washington, DC, USA, 1991.
21. Nuclear Regulatory Commission (NRC). Rock Fractures and Fluid Flow: Contemporary
Understanding and Applications; National Academy Press: Washington, DC, USA, 1996.
22. Neuman, S.P. Trends, prospects and challenge in quantifying flow and transport through fractured
aquifer. Hydrogeol. J. 2005, 13, 124–147.
23. Baiocchi, A.; Dragoni, W.; Lotti, F.; Piscopo, V. Sustainable yield of fractured rock aquifers:
The case of crystalline rocks of Serre Massif (Calabria, Southern Italy). In Fractured Rock
Hydrogeology; Sharp, J.M., Ed.; Taylor & Francis Group: London, UK, 2014; pp. 79–97.
24. Dragoni, W. Some considerations on climatic changes, water resources and water needs in the
Italian region south of the 43° N. In Water, Environment and Society in Times of Climatic
Change; Issar, A., Brown, N., Eds.; Kluwer Academic Publishers: Dordrecht, The Netherlands,
1998; pp. 241–271.
25. Intergovernmental Panel on Climate Change (IPCC). Summary for Policymakers. In Climate
Change 2013: The Physical Science Basis; Cambridge University Press: Cambridge, UK, 2013.
26. Carmignani, L.; Cocozza, T.; Gandin, A.; Pertusati, P.C. Lineamenti della geologia
dell’Iglesiente-Sulcis [Outlines of the geology of the Iglesiente-Sulcis Region]. In Guida alla
Geologia del Paleozoico Sardo; Società Geologica Italiana, Guide Geologiche Regionali: Roma,
Italy, 1982; pp. 65–77.
27. Istituto Superiore per la Protezione e la Ricerca Ambientale (ISPRA). Notes to the Geological Map of
Italy 1:50,000 “Sheet 566–Assemini”; Servizio Geologico d’Italia: Roma, Italy, 2009. (In Italy)
28. Barca, S.; Cocozza, T.; del Rio, M.; Pittau Demelia, P. Discovery of lower Ordovician Acritarchs
in the “Postgotlandiano” sequence of southwestern Sardinia (Italy): Age and tectonic implications.
Boll. Soc. Geol. Ital. 1981, 100, 377–392.
29. Carmignani, L.; Conti, P.; Barca, S.; Cerbai, N.; Eltrudis, A.; Funedda, A.; Oggiano, G.;
Patta, E.D. Notes to the Geological Map of Italy 1:50,000 “Sheet 549–Muravera”; Servizio
Geologico d’Italia: Roma, Italy, 2001. (In Italy)
30. Celico, P.; Piscopo, V.; Berretta, G. Influence of a reservoir on groundwater flow in metamorphic
rocks. Geol. Appl. Idrogeol. 1993, 28, 253–261. (In Italy)
31. Kruseman, G.P.; de Ridder, N.A. Analysis and Evaluation of Pumping Test Data; ILRI
Publication 47; International Institute for Land Reclamation and Improvement: Wageningen,
The Netherlands, 1994.
32. Allmendinger, R.W.; Cardozo, N.C.; Fisher, D. Structural Geology Algorithms: Vectors &
Tensors; Cambridge University Press: Cambridge, UK, 2013.
33. Cardozo, N.; Allmendinger, R.W. Spherical projections with OSX Stereonet. Comput. Geosci.
2013, 51, 193–205.
34. Snow, D.T. Anisotropic permeability of fractured media. Water Resour. Res. 1969, 5, 1273–1289.
35. Oda, M. Permeability tensor for discontinuous rock masses. Geotechnique 1985, 35, 483–495.
36. Moye, D.G. Diamond drilling for foundation exploration. Civil Eng. Trans. Inst. Eng. 1967, 9,
95–100.
Water 2015, 7 4656
37. Theis, C.V. The relation between the lowering of the piezometric surface and the rate and duration
of discharge of a well using groundwater storage. Am. Geophys. Union Trans. 1935, 2, 519–524.
38. Hantush, S.M.; Jacob, C.E. Non-steady radial flow in an infinite leaky aquifer. Am. Geophys.
Union Trans. 1955, 36, 95–100.
39. Warren, J.E.; Root, P.J. The behavior of naturally fractured reservoirs. One Petro 1963, 3, 245–255.
40. Regione Sardegna (2010) Annali Idrologici. Available online: www.regione.sardegna.it (accessed
on 25 October 2014).
41. Doherty, J. PEST, Model-Independent Parameter Estimation–User Manual, 5th ed.; Watermark
Numerical Computing: Brisbane, Australia, 2010.
42. De Marsily, G.; Lavedan, C.; Boucher, M.; Fasaniso, G. Interpretation of interference tests in a
well field using geostatistical techniques to fit the permeability distribution in a reservoir model.
In Geostatistics for Natural Resources Characterization; NATO Advanced Study Institute:
Dordrecht, The Netherlands, 1984; pp. 831–849.
43. Doherty, J. Groundwater model calibration using pilot-points and regularization. Ground Water
2003, 41, 170–177.
44. Clauser, C. Permeability of crystalline rocks. EOS 1992, 73, 233–240.
45. Schulze-Makuch, D.; Carlson, D.A.; Cherkauer, D.S.; Malik, P. Scale dependency of hydraulic
conductivity in heterogeneous media. Ground Water 1999, 37, 904–919.
46. Renard, P.; de Marsily, G. Calculating equivalent permeability: A review. Adv. Water Res. 1997,
20, 253–278.
47. Neuman, S.P.; di Federico, V. Multifaceted nature of hydrogeologic scaling and its interpretation.
Rev. Geophys. 2003, 41, doi:10.1029/2003RG000130.
48. Krasny, J. Classification of transmissivity magnitude and variation. Ground Water 1993, 31, 230–236.
© 2015 by the authors; licensee MDPI, Basel, Switzerland. This article is an open access article
distributed under the terms and conditions of the Creative Commons Attribution license
(http://creativecommons.org/licenses/by/4.0/).
Copyright © 2022 FDOKUMEN