A model separating leaf structural and physiological effects on carbon gain along light gradients...
22
Plant, Cell and Environment (1997) 20, 845–866 ABSTRACT A process-based leaf gas exchange model for C 3 plants was developed which specifically describes the effects observed along light gradients of shifting nitrogen investment in carboxylation and bioenergetics and modified leaf thick- ness due to altered stacking of photosynthetic units. The model was parametrized for the late-successional, shade- tolerant deciduous species Acer saccharum Marsh. The specific activity of ribulose-1,5-bisphosphate carboxylase (Rubisco) and the maximum photosynthetic electron transport rate per unit cytochrome f (cyt f) were used as indices that vary proportionally with nitrogen investment in the capacities for carboxylation and electron transport. Rubisco and cyt f per unit leaf area are related in the model to leaf dry mass per area (M A ), leaf nitrogen content per unit leaf dry mass (N m ), and partitioning coefficients for leaf nitrogen in Rubisco (P R ) and in bioenergetics (P B ). These partitioning coefficients are estimated from charac- teristic response curves of photosynthesis along with infor- mation on leaf structure and composition. While P R and P B determine the light-saturated value of photosynthesis, the fraction of leaf nitrogen in thylakoid light-harvesting components (P L ) and the ratio of leaf chlorophyll to leaf nitrogen invested in light harvesting (C B ), which is depen- dent on thylakoid stoichiometry, determine the initial pho- tosynthetic light utilization efficiency in the model. Carbon loss due to mitochondrial respiration, which also changes along light gradients, was considered to vary in proportion with carboxylation capacity. Key model parameters – N m , P R , P B , P L , C B and stomatal sensitivity with respect to changes in net photosynthesis (G f ) – were examined as a function of M A , which is linearly related to irradiance during growth of the leaves. The results of the analysis applied to A. saccharum indicate that P B and P R increase, and G f , P L and C B decrease with increasing M A . As a result of these effects of irradiance on nitrogen parti- tioning, the slope of the light-saturated net photosynthesis rate per unit leaf dry mass (A m max ) versus N m relationship increased with increasing growth irradiance in mid-sea- son. Furthermore, the nitrogen partitioning coefficients as well as the slopes of A m max versus N m were independent of season, except during development of the leaf photosyn- thetic apparatus. Simulations revealed that the acclima- tion to high light increased A m max by 40% with respect to the low light regime. However, light-saturated photo- synthesis per leaf area (A a max ) varied 3-fold between these habitats, suggesting that the acclimation to high light was dominated by adjustments in leaf anatomy (A a max = A m max M A ) rather than in foliar biochemistry. This differed from adaptation to low light, where the alter- ations in foliar biochemistry were predicted to be at least as important as anatomical modifications. Due to the light- related accumulation of photosynthetic mass per unit area, A a max depended on M A and leaf nitrogen per unit area (N a ). However, N a conceals the variation in both M A and N m (N a = N m M A ), and prevents clear separation of anatomical adjustments in foliage structure and biochemi- cal modifications in foliar composition. Given the large seasonal and site nutrient availability-related variation in N m , and the influences of growth irradiance on nitrogen partitioning, the relationship between A a max and N a is uni- versal neither in time nor in space and in natural canopies at mid-season is mostly driven by variability in M A . Thus, we conclude that analyses of the effects of nitrogen invest- ments on potential carbon acquisition should use mass- based rather than area-based expressions. Key-words: acclimation to growth irradiance; cytochrome f; leaf morphology; light use efficiency; nitrogen content; nitro- gen partitioning model; nitrogen use efficiency; Rubisco; shade tolerance. INTRODUCTION The above-ground physiological activity of temperate for- est trees occurs in long-term equilibrium with a moderate supply of nutrients and infrequent temperature and water stress. Thus, productivity is affected annually by changes in canopy light interception (Linder 1985; Cannell et al. 1987; McMurtrie et al. 1992). Carbon acquisition also depends on the manner in which leaf structure and physiol- ogy are modified along light availability gradients, a regu- lated response that determines the gas exchange perfor- mance of the canopy (Tooming 1967; Gutschick & Wiegel 1988; Baldocchi & Harley 1995; Sands 1995b). © 1997 Blackwell Science Ltd 845 A model separating leaf structural and physiological effects on carbon gain along light gradients for the shade-tolerant species Acer saccharum Ü. NIINEMETS* & J. D. TENHUNEN Plant Ecology II (BITÖK), University of Bayreuth, D-95440 Bayreuth, Germany TECHNICAL REPORT (white this line if not required) *Correspondence and present address: Ülo Niinemets, Institute of Ecology, Estonian Academy of Sciences, Riia 181, EE-2400 Tartu, Estonia.
Transcript of A model separating leaf structural and physiological effects on carbon gain along light gradients...

Plant, Cell and Environment (1997) 20, 845–866
ABSTRACT
A process-based leaf gas exchange model for C3 plants wasdeveloped which specifically describes the effects observedalong light gradients of shifting nitrogen investment incarboxylation and bioenergetics and modified leaf thick-ness due to altered stacking of photosynthetic units. Themodel was parametrized for the late-successional, shade-tolerant deciduous species Acer saccharum Marsh. Thespecific activity of ribulose-1,5-bisphosphate carboxylase(Rubisco) and the maximum photosynthetic electrontransport rate per unit cytochrome f (cyt f) were used asindices that vary proportionally with nitrogen investmentin the capacities for carboxylation and electron transport.Rubisco and cyt f per unit leaf area are related in themodel to leaf dry mass per area (MA), leaf nitrogen contentper unit leaf dry mass (Nm), and partitioning coefficientsfor leaf nitrogen in Rubisco (PR) and in bioenergetics (PB).These partitioning coefficients are estimated from charac-teristic response curves of photosynthesis along with infor-mation on leaf structure and composition. While PR andPB determine the light-saturated value of photosynthesis,the fraction of leaf nitrogen in thylakoid light-harvestingcomponents (PL) and the ratio of leaf chlorophyll to leafnitrogen invested in light harvesting (CB), which is depen-dent on thylakoid stoichiometry, determine the initial pho-tosynthetic light utilization efficiency in the model.Carbon loss due to mitochondrial respiration, which alsochanges along light gradients, was considered to vary inproportion with carboxylation capacity. Key modelparameters – Nm, PR, PB, PL, CB and stomatal sensitivitywith respect to changes in net photosynthesis (Gf) – wereexamined as a function of MA, which is linearly related toirradiance during growth of the leaves. The results of theanalysis applied to A. saccharum indicate that PB and PR
increase, and Gf, PL and CB decrease with increasing MA.As a result of these effects of irradiance on nitrogen parti-tioning, the slope of the light-saturated net photosynthesisrate per unit leaf dry mass (Am
max) versus Nm relationshipincreased with increasing growth irradiance in mid-sea-son. Furthermore, the nitrogen partitioning coefficients as
well as the slopes of Ammax versus Nm were independent of
season, except during development of the leaf photosyn-thetic apparatus. Simulations revealed that the acclima-tion to high light increased Am
max by 40% with respect tothe low light regime. However, light-saturated photo-synthesis per leaf area (Aa
max) varied 3-fold between thesehabitats, suggesting that the acclimation to high light wasdominated by adjustments in leaf anatomy(Aa
max = Ammax MA) rather than in foliar biochemistry.
This differed from adaptation to low light, where the alter-ations in foliar biochemistry were predicted to be at leastas important as anatomical modifications. Due to the light-related accumulation of photosynthetic mass per unitarea, Aa
max depended on MA and leaf nitrogen per unitarea (Na). However, Na conceals the variation in both MA
and Nm (Na = Nm MA), and prevents clear separation ofanatomical adjustments in foliage structure and biochemi-cal modifications in foliar composition. Given the largeseasonal and site nutrient availability-related variation inNm, and the influences of growth irradiance on nitrogenpartitioning, the relationship between Aa
max and Na is uni-versal neither in time nor in space and in natural canopiesat mid-season is mostly driven by variability in MA. Thus,we conclude that analyses of the effects of nitrogen invest-ments on potential carbon acquisition should use mass-based rather than area-based expressions.
Key-words: acclimation to growth irradiance; cytochrome f;leaf morphology; light use efficiency; nitrogen content; nitro-gen partitioning model; nitrogen use efficiency; Rubisco;shade tolerance.
INTRODUCTION
The above-ground physiological activity of temperate for-est trees occurs in long-term equilibrium with a moderatesupply of nutrients and infrequent temperature and waterstress. Thus, productivity is affected annually by changesin canopy light interception (Linder 1985; Cannell et al.1987; McMurtrie et al. 1992). Carbon acquisition alsodepends on the manner in which leaf structure and physiol-ogy are modified along light availability gradients, a regu-lated response that determines the gas exchange perfor-mance of the canopy (Tooming 1967; Gutschick & Wiegel1988; Baldocchi & Harley 1995; Sands 1995b).
© 1997 Blackwell Science Ltd 845
A model separating leaf structural and physiological effects on
carbon gain along light gradients for the shade-tolerant
species Acer saccharum
Ü. NIINEMETS* & J. D. TENHUNEN
Plant Ecology II (BITÖK), University of Bayreuth, D-95440 Bayreuth, Germany
TECHNICAL REPORT (white this line if not required)
*Correspondence and present address: Ülo Niinemets, Instituteof Ecology, Estonian Academy of Sciences, Riia 181, EE-2400Tartu, Estonia.

846 Ü. Niinemets and J. D. Tenhunen
Consistently greater light-saturated photosynthesis ratesper leaf area (Aa
max) are reported for leaves growing athigher quantum flux densities in the sun crown as com-pared to shade leaves (e.g. Björkman 1981; Jurik 1986b;Ellsworth & Reich 1993; Harley & Baldocchi 1995). Asmaximum photosynthesis rates decrease with decreasinglight availability, a linear relationship is also observedbetween growth irradiance and leaf thickness or leaf drymass per area (MA) (Ellsworth & Reich 1992a; Kull &Niinemets 1993; Niinemets 1995; Niinemets & Kull1995). Furthermore, a strong positive correlation is com-monly observed between photosynthetic activity underambient conditions and leaf nitrogen content, because asmuch as three-quarters of foliar nitrogen may be investedin photosynthetic function (Field & Mooney 1986; Evans1989b). However, the way in which nitrogen content andphotosynthetic activity are coupled is open to interpreta-tion and depends on whether nitrogen is expressed on anarea (Na) or a mass (Nm) basis (Ellsworth & Reich 1992a;Reich & Walters 1994; Reich et al. 1995).
If biochemical potentials of leaf cells remained constantalong the light gradient, i.e. if the light-saturated photosyn-thesis rate on a mass basis (Am
max) were constant, then aone-to-one dependence of Aa
max on MA would also beanticipated. However, nitrogen partitioning between thethylakoid proteins regulating reductant supply and Calvincycle enzymes determining CO2 fixation depends on thelocal light climate during leaf development (Chow et al.1988; Evans 1989b, 1993a; Evans & Seemann 1989), andinfluences the relationship between Aa
max and MA. Nm andMA may also be correlated, further complicating matters(Reich & Walters 1994; Schulze et al. 1994; Niinemets1995, 1997a,b; Reich et al. 1995). While there is a broadconsensus that leaf nitrogen content provides a useful basisfor standardizing the biochemical potentials of foliage,contemporary models of photosynthesis and canopy gasexchange have only considered the effects of variation inNa (Hirose & Werger 1987; Harley et al. 1992; Chen et al.1993; Schulze et al. 1994; Leuning et al. 1995; Sands1995a). In so far as variability of Na within the canopy isdominated by leaf anatomy (Walters & Field 1987;Ellsworth & Reich 1992a, 1993; Harley & Baldocchi1995; Niinemets 1995, 1997a,b), it is doubtful whetherexisting model analyses of ‘nitrogen’ effects on annual car-bon gain have really added concretely to theoretical analy-ses based only on MA (e.g. Gutschick & Wiegel 1988), andthere is much to be achieved in understanding canopyphotosynthetic production as affected by light availability,nitrogen availability, and nitrogen partitioning, if Na is sep-arated, allowing independent consideration of Nm and MA.
This paper examines the potential consequences ofvariation in leaf structural (MA) and physiological charac-teristics (Nm partitioning) for canopy carbon acquisitionwith the aid of a process-based simulation model. The taskundertaken here was to develop a model explicitly separat-ing the qualitative effects of partitioning of nitrogenresources between various pools of the photosyntheticmachinery from the cumulative effects of having more
photosynthetic machinery per unit leaf area. Acer saccha-rum, a North-American late-successional, shade-tolerantdeciduous species, was chosen for the model-based charac-terization of nitrogen investments because extensive infor-mation exists on its leaf biochemistry and structure as wellas on its ecophysiological response along light gradients(Jurik 1986a,b; Reich, Walters & Ellsworth 1991;Ellsworth & Reich 1992a,b; Ellsworth & Liu 1994;Kloeppel & Abrams 1995; Tjoelker et al. 1995). From thissynthesis with A. saccharum, we hope to draw conclusionson the basic relationships amongst leaf structure, chemicalcomposition and photosynthesis in temperate deciduousforest species, and on how these relationships are alteredby foliage acclimation to long-term irradiance conditionsin the canopy, and to reconcile the inconsistencies betweenmass- and area-based expressions for net photosynthesis,MA and leaf nitrogen content (as pointed out by e.g.Ellsworth & Reich 1992a; Reich & Walters 1994; Reich etal. 1995). The second objective of the current study was toclassify existing information for temperate forest trees andto consider the best way to carry out future experimentsrelated to differences in nitrogen partitioning and distribu-tion patterns along light gradients in species with differingabilities to tolerate shade. We expected our analysis to pro-vide important insight into how canopy carbon gain is opti-mized in relation to foliar nitrogen investments but also inresponse to other variables that are modified during thecourse of succession.
METHODS
Biochemical model of leaf photosynthesisspecifying nitrogen investments
According to the model of Farquhar et al. (Farquhar, vonCaemmerer & Berry 1980; Farquhar & von Caemmerer1982; Harley & Tenhunen 1991), photosynthetic carbondioxide uptake, An, is limited either by ribulose-bisphos-phate (RUBP) concentration, or at saturating RUBP by theactivity of ribulose-bisphosphate carboxylase/oxygenase(Rubisco) or the concentrations of CO2 and O2.Considering that the rate of RUBP carboxylation in photo-synthesis is either equal to the potential rate allowed by theconcentration of RUBP (Wj, RUBP-limited rate), or to thepotential rate limited by the activity of Rubisco and theconcentrations of CO2 and O2 (Wc, Rubisco-limited rate),the rate of net photosynthesis is:
Ci – Γ*An = Vcmax –––––––––––––– – Rd, if Wc<WjO
Ci + Kc 1 + ––( Ko ) (1)
Ci – Γ*
An = J ––––––––– – Rd, if Wc>Wj$
4(Ci + 2Γ*)
where Vcmax is the maximum rate of carboxylation allowedby Rubisco, J is the potential electron transport rate, Ci is
© 1997 Blackwell Science Ltd, Plant, Cell and Environment, 20, 845–866

Carbon gain along light gradients in Acer 847
the intercellular concentration of CO2 and O that of O2, Kc
is the Michaelis-Menten constant for carboxylation and Ko
that for oxygenation, and Rd is the mitochondrial respira-tion rate continuing in the light. Γ*, the CO2 compensationpoint in the absence of Rd (Laisk 1977), is equal to 0·5O/τ,where τ is the substrate specificity factor of Rubisco(Jordan & Ogren 1984). Implicit in Eqn 1 is the assumptionthat transport of 4 mol electrons through the photosyntheticelectron transport chain produces sufficient chemicalenergy to regenerate 1 mol RUBP in the Calvin cycle(Harley & Tenhunen 1991; Harley et al. 1992), i.e. thatNADPH+ is limiting RUBP regeneration (Farquhar & vonCaemmerer 1982). Light dependence of potential electronflow is given by the empirical equation of Smith(Tenhunen et al. 1976):
αQJ = ––––––––––––– ,
α2 Q2
1 + –––––– (2)√ J2max
where α is the quantum utilization efficiency [mol elec-trons (mol quanta)–1] at saturating Ci and on an incidentlight basis, Q is incident quantum flux density (pmol m–2
s–1), and Jmax is the light-saturated value of J.To calculate Ci for a given ambient CO2 concentration
(Ca), the biochemical photosynthesis model is coupledwith an empirical model of stomatal conductance (gs)(Ball, Woodrow & Berry 1987; Harley & Tenhunen1991):
hsgs = Gf An –– , (3)Cs
where Cs is the CO2 concentration (µmol mol–1), hs the rel-ative humidity (decimal fraction) at the leaf surface, and Gf
a constant representing stomatal sensitivity to these factors(Tenhunen et al. 1994; Sala & Tenhunen 1996). Boundarylayer conductance, which determines Cs and hs, is calcu-lated according to Nobel (1983). Ci, which is dependent onboth gs and An according to Fick’s law (Ci = Ca – 56An/gs),is found iteratively.
To model leaf gas exchange along light gradients, whereboth leaf morphology (e.g. Ellsworth & Reich 1993; Kull &Niinemets 1993; Niinemets 1995; Niinemets & Kull 1995)and chemical composition (e.g. Chow et al. 1988; Evans1989b; Evans & Seemann 1989; Niinemets 1995) are mod-ified in response to the prevailing radiation regime, we for-mulate simple but explicit rules which explain the effects ofleaf nitrogen investments in the Calvin cycle and electrontransport processes on potential flux rates Wc and Wj, i.e. onthe basic biochemical characteristics of leaf gas exchange.We also consider the effects of stacking multiple units of aparticular biochemical nature (changing leaf thickness).Given the large investment of leaf nitrogen in the photosyn-thetic machinery, specific nitrogen contributions to Calvincycle and electron transport constituents provide an effec-tive means by which coordinated regulation of canopy gasexchange may be achieved by plants (Chen et al. 1993).
Rubisco-limited rate of carboxylation
Rubisco is the dominant protein component of Calvincycle enzymes, incorporating as much as 30% of total leafnitrogen (Evans 1989b). We assume that Calvin cycleactivity is proportional to Rubisco activity and define theindex PR [‘nitrogen in Rubisco’; g N in Rubisco (g totalleaf N)–1], which in effect defines the overall capacity forthe reaction Wc. Since relative changes in the parameter PR
along light gradients are of interest, expression of rates interms of Rubisco is adequate and offers the long-term pos-sibility of examining responses in relation to measuredRubisco activity from leaf material harvested in the field.With knowledge of the specific activity of Rubisco, i.e. themaximum rate of RUBP carboxylation per unit Rubiscoprotein [Vcr, µmol CO2 (g Rubisco)–1 s–1], and provided allleaf Rubisco is in the fully activated state, the maximumrate of carboxylation per unit leaf area (Vcmax, µmol m–2
s–1) is given by
Vcmax = 6·25Vcr MA PR Nm, (4)
where MA is leaf dry mass per area (g m–2), Nm is leafnitrogen content per leaf dry mass (g g–1), and 6·25 [gRubisco (g nitrogen in Rubisco)–1] converts nitrogen con-tent to protein content. Of course, the proportion of leafnitrogen invested in carboxylation is actually greater thanPR. However, since other Calvin cycle enzymes are likelyto change in concert with Rubisco, use of an alternativeindex for Calvin cycle activity would only mean that alter-native values for Vcr would also be required when fittingthe model to experimental data. Friend (1991, 1995) andAmthor (1994b) also invoke PR, but their models do notseparate the different components of Na (Nm and MA).
Potential rate of photosynthetic electron flow
Depending on light availability, the protein composition ofchloroplast thylakoids varies to maintain efficiency in thebalance between light harvesting and light energy conver-sion to photoproducts (Chow et al. 1988; Evans 1989b;Evans & Seemann 1989). Evans & Seemann (1989)divided thylakoid nitrogen investments between light har-vesting (‘nitrogen in light harvesting’; PL) and bioener-getic pools (‘nitrogen in bioenergetics’; PB). Nitrogeninvestment in light harvesting determines the content ofchlorophyll a/b protein complexes associated with photo-systems I (PSI) and II (PSII), while investment in bioener-getics determines the protein content limiting the capacityfor photosynthetic electron transport and photophosphory-lation. Both PB, influencing Jmax (in µmol e– m–2 s–1), andPL, influencing quantum conversion efficiency on an inci-dent light basis in our model (α; see Eqn 2), determine Wj.
There is a wide consensus that the rate-limiting step ofthe light-saturated rate of thylakoid electron transportresides between the two photosystems (e.g. Foyer 1993;Harbinson 1994). Thus, we consider the index PB to reflectchanges in content of cytochrome f, ferredoxin NADPreductase (FNR), and the coupling factor (CF) which are
© 1997 Blackwell Science Ltd, Plant, Cell and Environment, 20, 845–866
848 Ü. Niinemets and J. D. Tenhunen
the primary proteins determining the overall rate of elec-tron transport (Evans & Seemann 1989). Considering aconstant 1:1:1·2 molar ratio for cyt f:FNR:CF, the invest-ment in bioenergetics is at least 0·124 g N (µmol cyt f)–1
[or 8·06 µmol cyt f (g N in bioenergetics)–1; Evans &Seemann 1989]. As in the case of PR, PB expressed in theunits of g leaf nitrogen in cyt f, FNR, and CF per g totalleaf N is an adequate index for nitrogen investments inelectron transport, if the activity of electron transport, Jmc,is standardized in mol electrons (mol cyt f)–1 s–1.Standardizing the biochemical component of electrontransport enables us to distinguish the determinants of Jmax
that result from modifications in leaf structure:
Jmax = 8·06Jmc MA PB Nm. (5)
Friend (1991, 1995) calculated the proportional investmentof leaf nitrogen for a given potential electron transport rateper unit leaf chlorophyll. However, the latter basis is notstraightforward, because Jmax per unit chlorophyll is highlyvariable (Fig. A1). Understanding this, Hikosaka &Terashima (1995) used cyt f (as in the current model) as arepresentative protein to scale proteins of electron trans-port chain with leaf nitrogen. However, they, as well asAmthor (1994b) and Amthor et al. (1994), assume astrictly coordinated change in the capacities for RUBP car-boxylation and electron transport. Though Jmax and Vcmax
determined from net photosynthesis versus Ci curves aregenerally correlated (Wullschleger 1993), the ratio ofJmax/Vcmax varies by almost a factor of 3 for 59 speciesmeasured at 25 °C in the data set of Wullschleger (1993) –the minimum is 1·43 ± 0·27 and the maximum 3·90 ± 0·70(averages ± SE of three lowest and three largest estimates,respectively). In the light of this evidence, we consider thata model examining nitrogen partitioning strategies shouldbe flexible enough to change Jmax and Vcmax indepen-dently. Recent findings do show that a separate examina-tion of Jmax and Vcmax across light environments is rele-vant, because the adaptation to growth irradiance may shiftthe balance between electron transport and Rubisco activi-ties (Sukenik, Bennett & Falkowski 1987; Ögren 1993).
In our model formulation, the specific activity ofRubisco, Vcr, and the potential rate of photosynthetic elec-tron transport per unit cytochrome f, Jmc, are considered asessentially conserved among C3 species. Temperaturedependences of the activities of Rubisco and potential elec-tron flow used in the model are scaled to results from anumber of species as described in Appendix A.
Initial quantum yield
The quantum yield of photosynthesis at CO2 saturation andat low light of 0·073 mol CO2 (mol quanta)–1 is extremelyconstant for all C3 species (Ehleringer & Björkman 1977).The assumption that 4 mol electrons is sufficient to regen-erate enough RUBP for the carboxylation of 1 mol CO2
gives an equivalent value of 0·292 mol e– (mol quanta)–1.However, C3 leaves functioning in natural environmentsutilize light with a lower efficiency due to species-specific
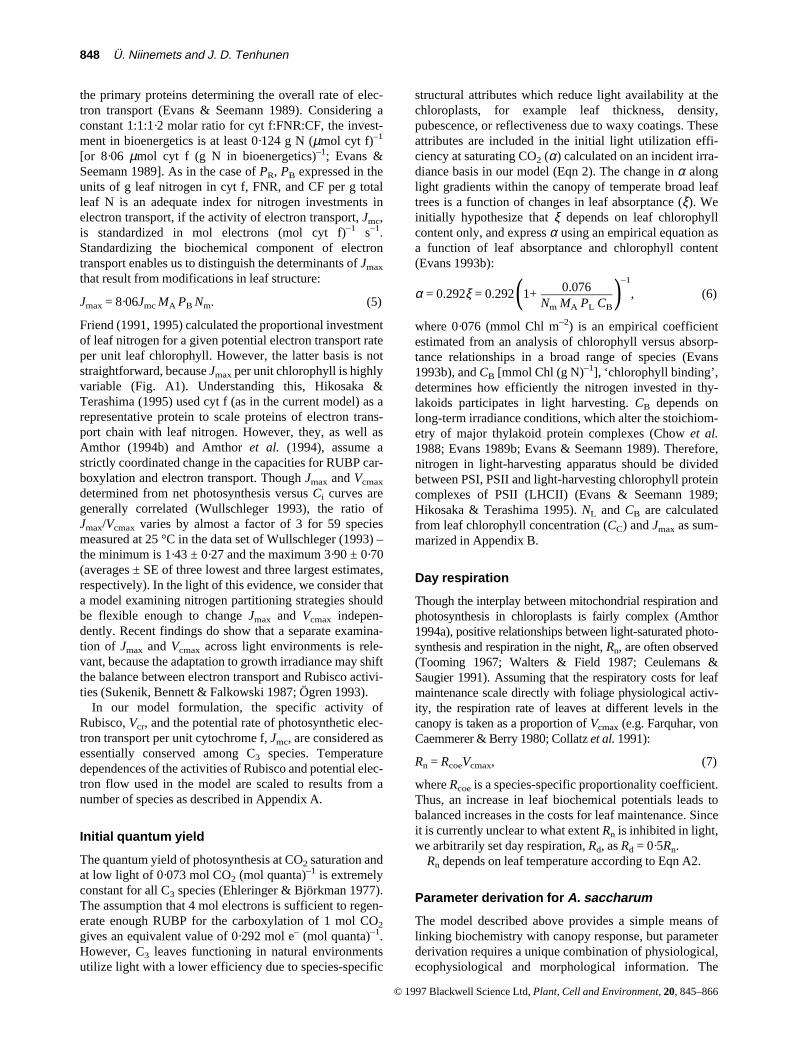
structural attributes which reduce light availability at thechloroplasts, for example leaf thickness, density,pubescence, or reflectiveness due to waxy coatings. Theseattributes are included in the initial light utilization effi-ciency at saturating CO2 (α) calculated on an incident irra-diance basis in our model (Eqn 2). The change in α alonglight gradients within the canopy of temperate broad leaftrees is a function of changes in leaf absorptance (ξ). Weinitially hypothesize that ξ depends on leaf chlorophyllcontent only, and express α using an empirical equation asa function of leaf absorptance and chlorophyll content(Evans 1993b):
0.076–1
α = 0.292ξ = 0.292 1+ ––––––––––– , (6)( Nm MA PL CB)
where 0·076 (mmol Chl m–2) is an empirical coefficientestimated from an analysis of chlorophyll versus absorp-tance relationships in a broad range of species (Evans1993b), and CB [mmol Chl (g N)–1], ‘chlorophyll binding’,determines how efficiently the nitrogen invested in thy-lakoids participates in light harvesting. CB depends onlong-term irradiance conditions, which alter the stoichiom-etry of major thylakoid protein complexes (Chow et al.1988; Evans 1989b; Evans & Seemann 1989). Therefore,nitrogen in light-harvesting apparatus should be dividedbetween PSI, PSII and light-harvesting chlorophyll proteincomplexes of PSII (LHCII) (Evans & Seemann 1989;Hikosaka & Terashima 1995). NL and CB are calculatedfrom leaf chlorophyll concentration (CC) and Jmax as sum-marized in Appendix B.
Day respiration
Though the interplay between mitochondrial respiration andphotosynthesis in chloroplasts is fairly complex (Amthor1994a), positive relationships between light-saturated photo-synthesis and respiration in the night, Rn, are often observed(Tooming 1967; Walters & Field 1987; Ceulemans &Saugier 1991). Assuming that the respiratory costs for leafmaintenance scale directly with foliage physiological activ-ity, the respiration rate of leaves at different levels in thecanopy is taken as a proportion of Vcmax (e.g. Farquhar, vonCaemmerer & Berry 1980; Collatz et al. 1991):
Rn = RcoeVcmax, (7)
where Rcoe is a species-specific proportionality coefficient.Thus, an increase in leaf biochemical potentials leads tobalanced increases in the costs for leaf maintenance. Sinceit is currently unclear to what extent Rn is inhibited in light,we arbitrarily set day respiration, Rd, as Rd = 0·5Rn.
Rn depends on leaf temperature according to Eqn A2.
Parameter derivation for A. saccharum
The model described above provides a simple means oflinking biochemistry with canopy response, but parameterderivation requires a unique combination of physiological,ecophysiological and morphological information. The
© 1997 Blackwell Science Ltd, Plant, Cell and Environment, 20, 845–866
Carbon gain along light gradients in Acer 849
required information has seldom, if at all, been collected inan individual examination of leaf morphological and phys-iological properties along light gradients. An extensive lit-erature search indicated that foliage functional and struc-tural characteristics along light gradients are particularlywell characterized for A. saccharum. Thus, we haveattempted an initial parametrization of the model for thistemperate tree species. Given that parameters must be esti-mated from a number of independent studies of A. saccha-rum, we followed a stepwise procedure, sequentially fixingthose parameters which could be best determined, andusing these fixed values to limit the range in possible val-ues for variables yet undetermined. Despite the breadth ofinformation available for this species, a number of assump-tions were required in order to complete the parameterderivation.
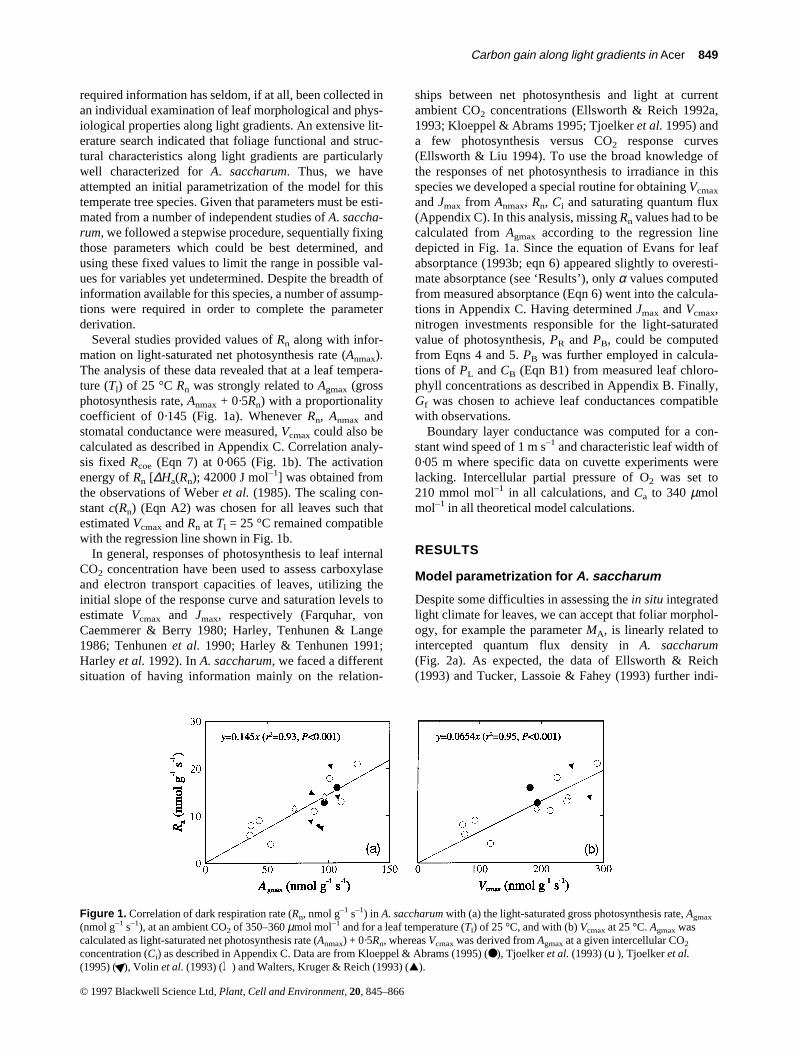
Several studies provided values of Rn along with infor-mation on light-saturated net photosynthesis rate (Anmax).The analysis of these data revealed that at a leaf tempera-ture (Tl) of 25 °C Rn was strongly related to Agmax (grossphotosynthesis rate, Anmax + 0·5Rn) with a proportionalitycoefficient of 0·145 (Fig. 1a). Whenever Rn, Anmax andstomatal conductance were measured, Vcmax could also becalculated as described in Appendix C. Correlation analy-sis fixed Rcoe (Eqn 7) at 0·065 (Fig. 1b). The activationenergy of Rn [∆Ha(Rn); 42000 J mol–1] was obtained fromthe observations of Weber et al. (1985). The scaling con-stant c(Rn) (Eqn A2) was chosen for all leaves such thatestimated Vcmax and Rn at Tl = 25 °C remained compatiblewith the regression line shown in Fig. 1b.
In general, responses of photosynthesis to leaf internalCO2 concentration have been used to assess carboxylaseand electron transport capacities of leaves, utilizing theinitial slope of the response curve and saturation levels toestimate Vcmax and Jmax, respectively (Farquhar, vonCaemmerer & Berry 1980; Harley, Tenhunen & Lange1986; Tenhunen et al. 1990; Harley & Tenhunen 1991;Harley et al. 1992). In A. saccharum, we faced a differentsituation of having information mainly on the relation-
ships between net photosynthesis and light at currentambient CO2 concentrations (Ellsworth & Reich 1992a,1993; Kloeppel & Abrams 1995; Tjoelker et al. 1995) anda few photosynthesis versus CO2 response curves(Ellsworth & Liu 1994). To use the broad knowledge ofthe responses of net photosynthesis to irradiance in thisspecies we developed a special routine for obtaining Vcmax
and Jmax from Anmax, Rn, Ci and saturating quantum flux(Appendix C). In this analysis, missing Rn values had to becalculated from Agmax according to the regression linedepicted in Fig. 1a. Since the equation of Evans for leafabsorptance (1993b; eqn 6) appeared slightly to overesti-mate absorptance (see ‘Results’), only α values computedfrom measured absorptance (Eqn 6) went into the calcula-tions in Appendix C. Having determined Jmax and Vcmax,nitrogen investments responsible for the light-saturatedvalue of photosynthesis, PR and PB, could be computedfrom Eqns 4 and 5. PB was further employed in calcula-tions of PL and CB (Eqn B1) from measured leaf chloro-phyll concentrations as described in Appendix B. Finally,Gf was chosen to achieve leaf conductances compatiblewith observations.
Boundary layer conductance was computed for a con-stant wind speed of 1 m s–1 and characteristic leaf width of0·05 m where specific data on cuvette experiments werelacking. Intercellular partial pressure of O2 was set to210 mmol mol–1 in all calculations, and Ca to 340 µmolmol–1 in all theoretical model calculations.
RESULTS
Model parametrization for A. saccharum
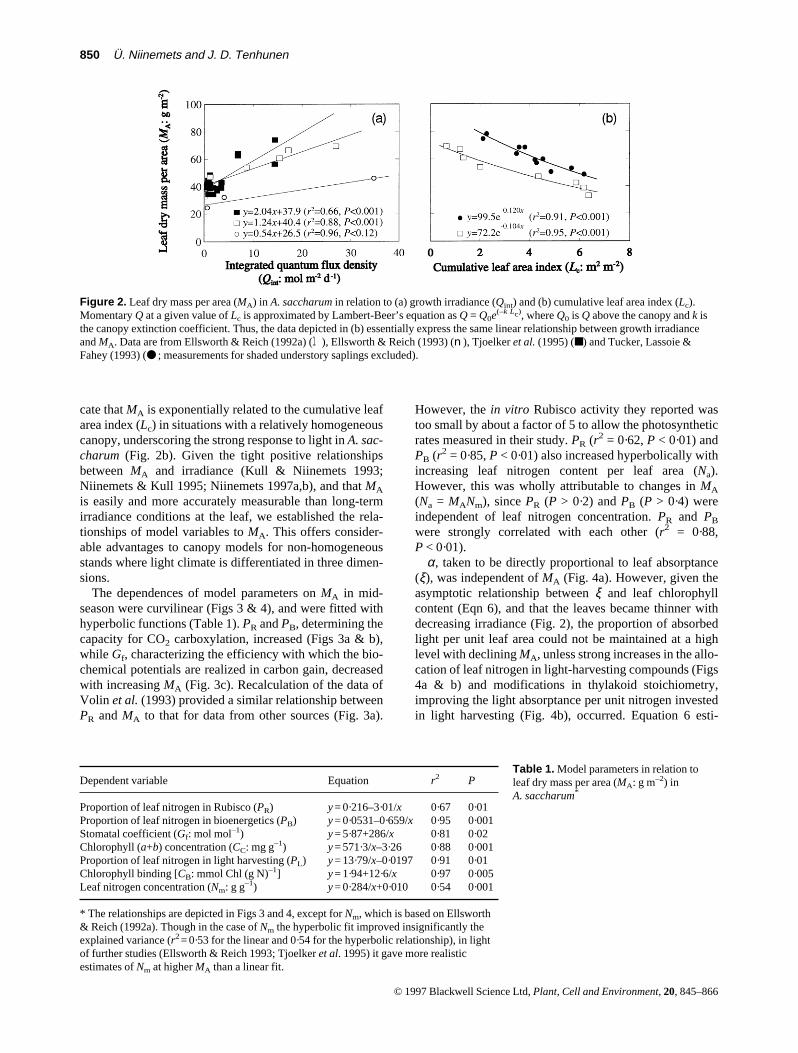
Despite some difficulties in assessing the in situ integratedlight climate for leaves, we can accept that foliar morphol-ogy, for example the parameter MA, is linearly related tointercepted quantum flux density in A. saccharum(Fig. 2a). As expected, the data of Ellsworth & Reich(1993) and Tucker, Lassoie & Fahey (1993) further indi-
© 1997 Blackwell Science Ltd, Plant, Cell and Environment, 20, 845–866
Figure 1. Correlation of dark respiration rate (Rn, nmol g–1 s–1) in A. saccharum with (a) the light-saturated gross photosynthesis rate, Agmax
(nmol g–1 s–1), at an ambient CO2 of 350–360 µmol mol–1 and for a leaf temperature (Tl) of 25 °C, and with (b) Vcmax at 25 °C. Agmax wascalculated as light-saturated net photosynthesis rate (Anmax) + 0·5Rn, whereas Vcmax was derived from Agmax at a given intercellular CO2
concentration (Ci) as described in Appendix C. Data are from Kloeppel & Abrams (1995) (●), Tjoelker et al. (1993) (u), Tjoelker et al.(1995) ( ), Volin et al. (1993) (l) and Walters, Kruger & Reich (1993) (▲).©
850 Ü. Niinemets and J. D. Tenhunen
cate that MA is exponentially related to the cumulative leafarea index (Lc) in situations with a relatively homogeneouscanopy, underscoring the strong response to light in A. sac-charum (Fig. 2b). Given the tight positive relationshipsbetween MA and irradiance (Kull & Niinemets 1993;Niinemets & Kull 1995; Niinemets 1997a,b), and that MA
is easily and more accurately measurable than long-termirradiance conditions at the leaf, we established the rela-tionships of model variables to MA. This offers consider-able advantages to canopy models for non-homogeneousstands where light climate is differentiated in three dimen-sions.
The dependences of model parameters on MA in mid-season were curvilinear (Figs 3 & 4), and were fitted withhyperbolic functions (Table 1). PR and PB, determining thecapacity for CO2 carboxylation, increased (Figs 3a & b),while Gf, characterizing the efficiency with which the bio-chemical potentials are realized in carbon gain, decreasedwith increasing MA (Fig. 3c). Recalculation of the data ofVolin et al. (1993) provided a similar relationship betweenPR and MA to that for data from other sources (Fig. 3a).
However, the in vitro Rubisco activity they reported wastoo small by about a factor of 5 to allow the photosyntheticrates measured in their study. PR (r2 = 0·62, P < 0·01) andPB (r2 = 0·85, P < 0·01) also increased hyperbolically withincreasing leaf nitrogen content per leaf area (Na).However, this was wholly attributable to changes in MA
(Na = MANm), since PR (P > 0·2) and PB (P > 0·4) wereindependent of leaf nitrogen concentration. PR and PB
were strongly correlated with each other (r2 = 0·88,P < 0·01).
α, taken to be directly proportional to leaf absorptance(ξ), was independent of MA (Fig. 4a). However, given theasymptotic relationship between ξ and leaf chlorophyllcontent (Eqn 6), and that the leaves became thinner withdecreasing irradiance (Fig. 2), the proportion of absorbedlight per unit leaf area could not be maintained at a highlevel with declining MA, unless strong increases in the allo-cation of leaf nitrogen in light-harvesting compounds (Figs4a & b) and modifications in thylakoid stoichiometry,improving the light absorptance per unit nitrogen investedin light harvesting (Fig. 4b), occurred. Equation 6 esti-
© 1997 Blackwell Science Ltd, Plant, Cell and Environment, 20, 845–866
Figure 2. Leaf dry mass per area (MA) in A. saccharum in relation to (a) growth irradiance (Qint) and (b) cumulative leaf area index (Lc).Momentary Q at a given value of Lc is approximated by Lambert-Beer’s equation as Q = Q0e(–k Lc), where Q0 is Q above the canopy and k isthe canopy extinction coefficient. Thus, the data depicted in (b) essentially express the same linear relationship between growth irradianceand MA. Data are from Ellsworth & Reich (1992a) (l), Ellsworth & Reich (1993) (n), Tjoelker et al. (1995) (■) and Tucker, Lassoie &Fahey (1993) (● ; measurements for shaded understory saplings excluded).
Dependent variable Equation r2 P
Proportion of leaf nitrogen in Rubisco (PR) y = 0·216–3·01/x 0·67 0·01Proportion of leaf nitrogen in bioenergetics (PB) y = 0·0531–0·659/x 0·95 0·001Stomatal coefficient (Gf: mol mol–1) y = 5·87+286/x 0·81 0·02Chlorophyll (a+b) concentration (CC: mg g–1) y = 571·3/x–3·26 0·88 0·001Proportion of leaf nitrogen in light harvesting (PL) y = 13·79/x–0·0197 0·91 0·01Chlorophyll binding [CB: mmol Chl (g N)–1] y = 1·94+12·6/x 0·97 0·005Leaf nitrogen concentration (Nm: g g–1) y = 0·284/x+0·010 0·54 0·001
* The relationships are depicted in Figs 3 and 4, except for Nm, which is based on Ellsworth& Reich (1992a). Though in the case of Nm the hyperbolic fit improved insignificantly theexplained variance (r2 = 0·53 for the linear and 0·54 for the hyperbolic relationship), in lightof further studies (Ellsworth & Reich 1993; Tjoelker et al. 1995) it gave more realisticestimates of Nm at higher MA than a linear fit.
Table 1. Model parameters in relation toleaf dry mass per area (MA: g m–2) inA. saccharum*

Carbon gain along light gradients in Acer 851
mated significantly (P < 0·05, paired t-test) higher α values(mean ± SE = 0·250 ± 0·006) as compared to an estimatefrom measured ξ values (0·242 ± 0·013).
Though the dependences of model parameters on MA
were only established for mid-season, analysis of addi-tional measurements for A. saccharum provided evidencethat these relationships may be constant over most of theseason. Leaf nitrogen concentration was highest in earlyseason in expanding leaves, was stable in mid-season anddeclined consistently during leaf senescence (Fig. 5a). Atthe same time, the fraction of leaf nitrogen in Rubiscochanged during the development of the leaf photosyntheticapparatus, but PR was independent of season and leaf nitro-gen status after leaf maturation (Fig. 5b).
Comparison of model predictions with measuredgas exchange
Weber et al. (1985) provided an independent series of diur-nal time courses of transpiration and net photosynthesis forunderstory seedlings of A. saccharum (Fig. 6). Since nostructural information was available from this study, MA
had to be determined first to calculate model parametersfrom the equations in Table 1. This was accomplishedusing the following routine: (1) total daily Q values werecalculated from the data in Figs 6a and b; (2) these valueswere corrected according to Gates (1980) to yield meanseasonal daily Q (Qint), and (3) MA values (27·6 and 27·5 gm–2 for 12·09·1981 and 13·09·1981, respectively) werecalculated according to the regression line of the data ofEllsworth & Reich (1992a) in Fig. 2a, using Qint as thex value. All model parameters except Gf were subse-quently calculated from MA (Figs 3 & 4; Table 1). Gf wasadjusted so as reasonably to describe measured water useand held constant at 10·5 mol mol–1 for both days.Nevertheless, the photosynthetic rate was insensitive todifferent values of Gf (9–14) at the air temperatures andirradiances observed during the simulated period. Eventhough we derived the model parametrization for theunderstory seedlings from the light measurements on onlytwo consecutive days, the correspondence between mea-sured and simulated values of gas exchange was striking(Figs 6c–f), signifying the robustness of the currentmodelling scheme.
© 1997 Blackwell Science Ltd, Plant, Cell and Environment, 20, 845–866
Figure 3. Results of model analysis showing relationshipsbetween MA and (a,b) leaf nitrogen partitioning into (a) Rubiscoand (b) bioenergetics, and (c) stomatal sensitivity correlated withchanges in net photosynthesis in A. saccharum. Data are fromEllsworth & Liu (1994) (■), Ellsworth & Reich (1992a) ( ),Ellsworth & Reich (1993) (n), Ellsworth et al. (1994) (❋),Kloeppel & Abrams (1995) (●), and Tjoelker et al. (1995) (ÊÊ ). PR
values obtained from laboratory estimates of Rubisco activity(assuming a Rubisco assay temperature of 25 °C) of Volin et al.(1993; l; r2 = 0·95, P < 0·05) are also plotted. Regressionequations based on coefficients from gas exchange analyses aregiven in Table 1.
Figure 4. Leaf nitrogen partitioning into light-harvestingapparatus in A. saccharum and associated changes in initialquantum conversion efficiency on an incident light basis (α) asaffected by MA. All symbols are as in Fig. 3, except for
l
· – St-Jacques, Labrecque & Bellefleur (1991) (MA was calculated fromthe values of leaf fresh mass per unit area assuming an appropriateleaf water content given in Schultz, Nothnagle & Baldwin 1982).Regression equations are given in Table 1.
©
©

852 Ü. Niinemets and J. D. Tenhunen
Since the temperature dependence of photosynthetic elec-tron transport may be affected by growth temperature andspecies-specific adaptations (cf. Appendix A), we also com-pared the shapes of the response curves of Jmax determinedfor Hordeum vulgare (Fig. A2 & Table A1) and of gross pho-tosynthesis under conditions of light and CO2 saturation(Agmax) for seedlings of A. saccharum (Weber et al. 1985).Agmax was calculated from Anmax and the dark respiration rateas described above, and, assuming that (1) the photosyntheticrate is limited by electron transport capacity at saturatingCO2 and light and (2) the flow of 4 mol e– through the elec-tron transport chain provides sufficient reductive equivalentsfor assimilation of 1 mol CO2, the cytochrome f concentra-tion was calculated from Agmax at 25 °C and from Jmc [equalto 156 µmol electrons (µmol cyt f)–1 s–1 at this temperature;Fig. A1]. The juxtaposition of the two estimates of electrontransport capacity (Fig. 7) demonstrates that the generalresponse of Jmax agreed over a wide temperature range withthe measured Agmax versus temperature relationship.
Adaptation to growth irradiance: the case ofA. saccharum
Changes in the nitrogen partitioning coefficients PB andPR with MA (Fig. 3) influence correlations between light-
saturated net photosynthesis rate per leaf mass (Ammax) and
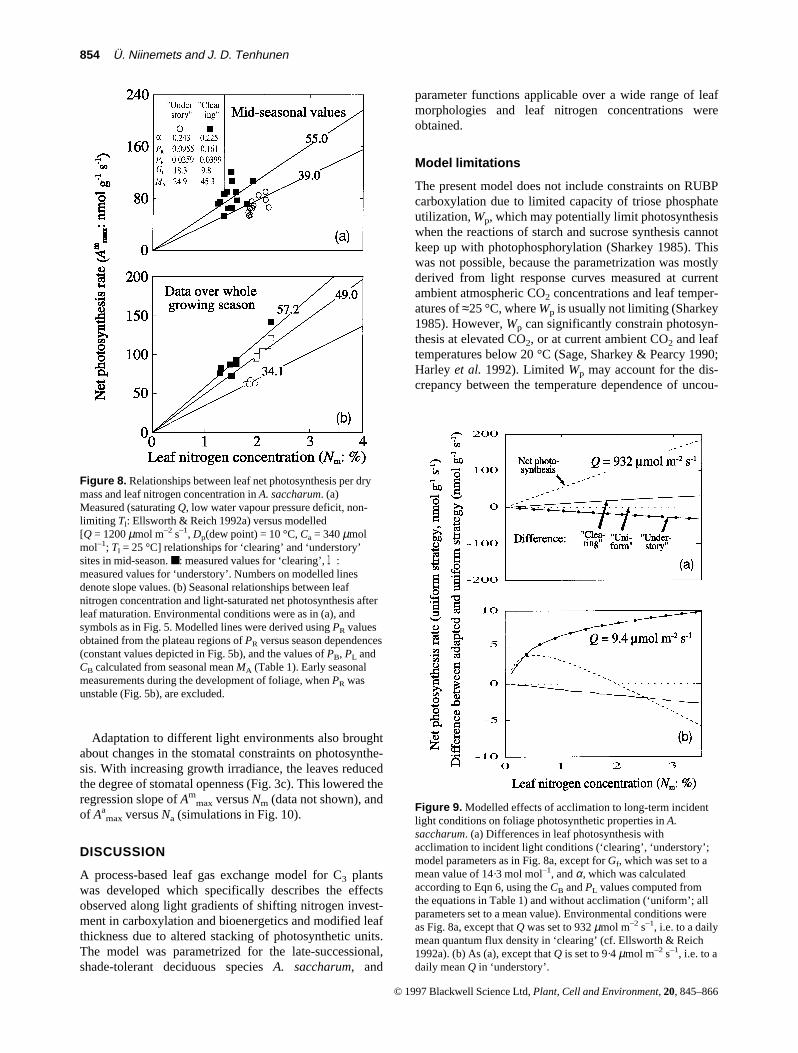
leaf nitrogen concentration (Fig. 8). As a result of thedependences shown in Fig. 3, the slope of Am
max versus Nm
increased with increasing growth irradiance (Fig. 8). Theeffects of acclimation responses in PB and PR on the slopeof Am
max versus Nm were seen both at mid-season (Fig. 8a)and in a data set covering the entire growing season afterleaf maturation occurred (Fig. 8b).
To gain a quantitative perspective on the significance ofthe influences of biochemical adaptation to growth lightclimate on carbon assimilation, we compared three differ-ent acclimation strategies – ‘high light’, ‘low light’ and‘uniform’ (no adaptation). For high light acclimated plants,the ‘clearing’ sample grown at a daily mean Q (Qm) of932 µmol m–2 s–1 and, for low light acclimated plants, the‘understory’ sample (Qm = 9·4 µmol m–2 s–1; both from thestudy of Ellsworth & Reich 1992a; model parameters asFig. 8a) were considered representative. All parameterswere set to the mean value for low and high light accli-mated specimens for the ‘uniform’ strategy. Model simula-tions demonstrated that, with respect to the non-acclima-tion strategy, the acclimation to high light increased the netphotosynthesis rate by about 18% at high quantum flux,while the acclimation to low light decreased net CO2
acquisition by about 19% under these conditions (Fig. 9a).However, the trend observed in high light was reversed atlow Q, where the leaves grown at 9·4 µmol m–2 s–1 werepredicted to assimilate CO2 at a several times higher ratethan the leaves grown at 932 µmol m–2 s–1 (Fig. 9b). Theacclimation to low Qm involves a greater nitrogen invest-ment in light harvesting which improves the initial quan-tum utilization efficiency for a given nitrogen concentra-tion (Fig. 4). A greater respiratory requirement formaintenance of the biochemical potentials of photosynthe-sis also reduces the efficiency of high light-grown leaves inlow light conditions.
Nm was not constant amongst various light microenvi-ronments in mid-season. Instead, it increased with decreas-ing MA (Ellsworth & Reich 1992a; Table 1). As the modelcalculations depicted in Fig. 9b suggest, this investmentpattern is beneficial for the leaves developed under lowQm, since it results in an improvement of the light use effi-ciency for an incident irradiance. Differences in Nm in mid-season also meant that when Am
max values for low and highlight-grown leaves were examined at the respective meanleaf nitrogen concentrations (0·0194 g g–1 for ‘understory’and 0·0154 g g–1 for ‘clearing’; Ellsworth & Reich 1992a),Am
max was only c. 11% higher in the ‘clearing’ than in the‘understory’ (cf. Figs 8a & 9a).
Anatomical adjustments in foliar structure also played amajor role in acclimation to growth irradiance in thisspecies. Given that MA varies by more than 3-fold acrosslight gradients (Fig. 2), and Am
max at a common nitrogenconcentration by roughly 40% (Fig. 9a), it is clear that, inmid-season, the variability in light-saturated net photosyn-thesis rate per unit area (Aa
max = AmmaxMA), which
increases strongly with MA (data not shown; see Ellsworth& Reich 1992a, 1993), is mostly governed by plastic
© 1997 Blackwell Science Ltd, Plant, Cell and Environment, 20, 845–866
Figure 5. Leaf developmental effects on leaf nitrogen concentrationand proportional investment of leaf nitrogen in Rubisco in A.saccharum. (a) Seasonal variability in leaf nitrogen concentration.(b) Leaf nitrogen partitioning into Rubisco. PR was calculated fromlight-saturated net photosynthesis at a given Ci as described inAppendix C. A mean seasonal Ci/Ca ratio of 0·792 obtained fromJurik (1986a) was used for the data of Reich et al. (1991). Ci,calculated from seasonal mean light-saturated net photosynthesisand stomatal conductances, was also held constant for each of thelight environments of Ellsworth & Reich (1992a). Curves are fittedby hand, whereas the PR values depicted in the curves refer to theplateau regions of PR versus season dependences. Lightenvironments of Ellsworth & Reich (1992a) are plotted in Fig. 2a.

Carbon gain along light gradients in Acer 853
changes in leaf anatomy rather than in biochemistry.Variability in MA with irradiance (Fig. 2) also provides anexplanation as to why leaf nitrogen content per unit areaincreased strongly with irradiance and MA (Na = NmMA;data not shown; see Ellsworth & Reich 1992a, 1993), evenwhen Nm decreased significantly with increasing MA
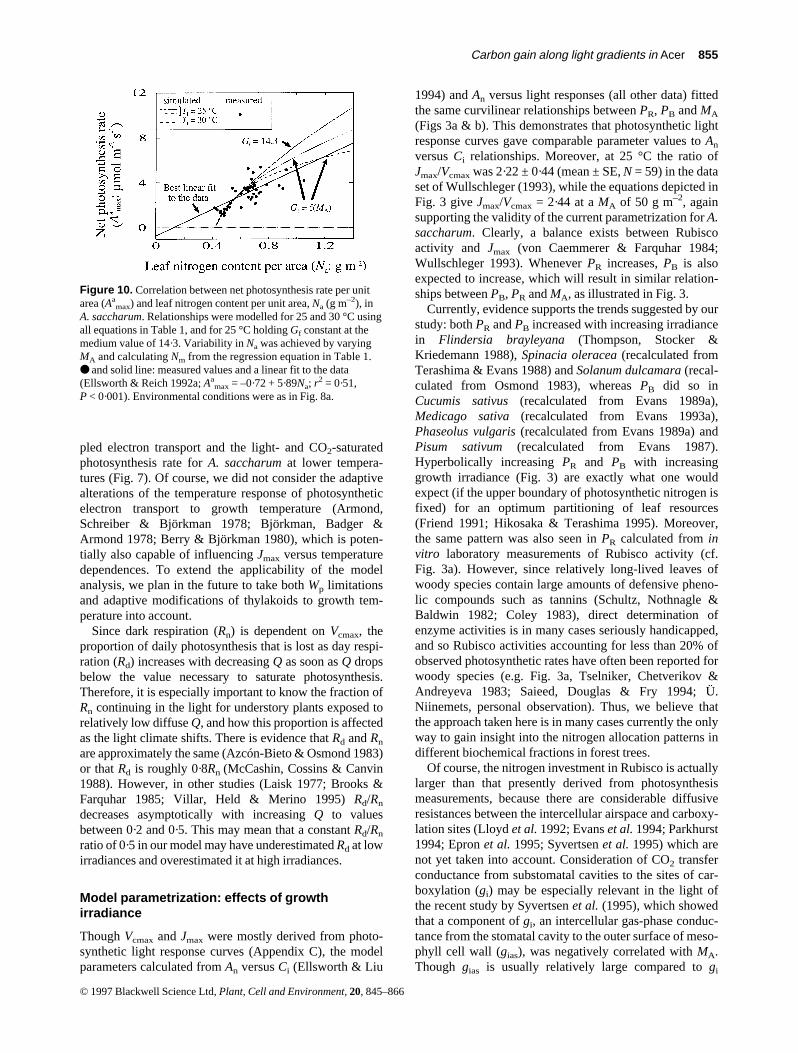
(Table 1). Acclimation of MA to growth irradiance is alsothe major factor governing the positive correlationbetween Aa
max and Na when all measurements across thelight gradient are pooled in mid-season (Fig. 10).However, the role of nitrogen and nitrogen partitioning onAa
max is not directly evident in this relationship, becausethe same Na may be determined from different paired val-ues of Nm and MA. Accordingly, Na alone contains noinformation concerning the biochemical light-adaptationstate of foliage, and therefore the correlation betweenAa
max and Na lacks universality.
© 1997 Blackwell Science Ltd, Plant, Cell and Environment, 20, 845–866
Figure 6. Observed and predicted photosynthesis and transpiration rates for leaves of understory seedlings of A. saccharum measured on twodays at the University of Michigan Biological Station near Pelleston, Michigan (45° 33´ N, 84° 42´ W; Weber et al. 1985). Momentary valuesof Q, Tl, Ca and air humidity are used to predict leaf photosynthesis rates. (a,b) Diurnal changes in quantum flux density. The line drawnthrough the data represents diffuse Q and was found by fitting a sinusoidal function to the diurnal course of Q after removing the higher lightintensities apparently affected by direct flux. (c,d) Daily courses of net photosynthesis rate. (e,f) Daily courses of transpiration rate.
Figure 7. Comparison of the shapes of temperature-responsecurves for light- and CO2-saturated gross photosynthesis rate(Agmax; Anmax + 0·5Rn) for A. saccharum (recalculated from Weberet al. 1985) and Jmax, established by temperature constants of Jmc
(Table A1) and a cyt f concentration of 0·287 µmol m–2 s–1.
854 Ü. Niinemets and J. D. Tenhunen
Adaptation to different light environments also broughtabout changes in the stomatal constraints on photosynthe-sis. With increasing growth irradiance, the leaves reducedthe degree of stomatal openness (Fig. 3c). This lowered theregression slope of Am
max versus Nm (data not shown), andof Aa
max versus Na (simulations in Fig. 10).
DISCUSSION
A process-based leaf gas exchange model for C3 plantswas developed which specifically describes the effectsobserved along light gradients of shifting nitrogen invest-ment in carboxylation and bioenergetics and modified leafthickness due to altered stacking of photosynthetic units.The model was parametrized for the late-successional,shade-tolerant deciduous species A. saccharum, and
parameter functions applicable over a wide range of leafmorphologies and leaf nitrogen concentrations wereobtained.
Model limitations
The present model does not include constraints on RUBPcarboxylation due to limited capacity of triose phosphateutilization, Wp, which may potentially limit photosynthesiswhen the reactions of starch and sucrose synthesis cannotkeep up with photophosphorylation (Sharkey 1985). Thiswas not possible, because the parametrization was mostlyderived from light response curves measured at currentambient atmospheric CO2 concentrations and leaf temper-atures of ≈25 °C, where Wp is usually not limiting (Sharkey1985). However, Wp can significantly constrain photosyn-thesis at elevated CO2, or at current ambient CO2 and leaftemperatures below 20 °C (Sage, Sharkey & Pearcy 1990;Harley et al. 1992). Limited Wp may account for the dis-crepancy between the temperature dependence of uncou-
© 1997 Blackwell Science Ltd, Plant, Cell and Environment, 20, 845–866
Figure 8. Relationships between leaf net photosynthesis per drymass and leaf nitrogen concentration in A. saccharum. (a)Measured (saturating Q, low water vapour pressure deficit, non-limiting Tl: Ellsworth & Reich 1992a) versus modelled[Q = 1200 µmol m–2 s–1, Dp(dew point) = 10 °C, Ca = 340 µmolmol–1; Tl = 25 °C] relationships for ‘clearing’ and ‘understory’sites in mid-season. ■: measured values for ‘clearing’, l:measured values for ‘understory’. Numbers on modelled linesdenote slope values. (b) Seasonal relationships between leafnitrogen concentration and light-saturated net photosynthesis afterleaf maturation. Environmental conditions were as in (a), andsymbols as in Fig. 5. Modelled lines were derived using PR valuesobtained from the plateau regions of PR versus season dependences(constant values depicted in Fig. 5b), and the values of PB, PL andCB calculated from seasonal mean MA (Table 1). Early seasonalmeasurements during the development of foliage, when PR wasunstable (Fig. 5b), are excluded.
Figure 9. Modelled effects of acclimation to long-term incidentlight conditions on foliage photosynthetic properties in A.saccharum. (a) Differences in leaf photosynthesis withacclimation to incident light conditions (‘clearing’, ‘understory’;model parameters as in Fig. 8a, except for Gf, which was set to amean value of 14·3 mol mol–1, and α, which was calculatedaccording to Eqn 6, using the CB and PL values computed fromthe equations in Table 1) and without acclimation (‘uniform’; allparameters set to a mean value). Environmental conditions wereas Fig. 8a, except that Q was set to 932 µmol m–2 s–1, i.e. to a dailymean quantum flux density in ‘clearing’ (cf. Ellsworth & Reich1992a). (b) As (a), except that Q is set to 9·4 µmol m–2 s–1, i.e. to adaily mean Q in ‘understory’.
Carbon gain along light gradients in Acer 855
pled electron transport and the light- and CO2-saturatedphotosynthesis rate for A. saccharum at lower tempera-tures (Fig. 7). Of course, we did not consider the adaptivealterations of the temperature response of photosyntheticelectron transport to growth temperature (Armond,Schreiber & Björkman 1978; Björkman, Badger &Armond 1978; Berry & Björkman 1980), which is poten-tially also capable of influencing Jmax versus temperaturedependences. To extend the applicability of the modelanalysis, we plan in the future to take both Wp limitationsand adaptive modifications of thylakoids to growth tem-perature into account.
Since dark respiration (Rn) is dependent on Vcmax, theproportion of daily photosynthesis that is lost as day respi-ration (Rd) increases with decreasing Q as soon as Q dropsbelow the value necessary to saturate photosynthesis.Therefore, it is especially important to know the fraction ofRn continuing in the light for understory plants exposed torelatively low diffuse Q, and how this proportion is affectedas the light climate shifts. There is evidence that Rd and Rn
are approximately the same (Azcón-Bieto & Osmond 1983)or that Rd is roughly 0·8Rn (McCashin, Cossins & Canvin1988). However, in other studies (Laisk 1977; Brooks &Farquhar 1985; Villar, Held & Merino 1995) Rd/Rn
decreases asymptotically with increasing Q to valuesbetween 0·2 and 0·5. This may mean that a constant Rd/Rn
ratio of 0·5 in our model may have underestimated Rd at lowirradiances and overestimated it at high irradiances.
Model parametrization: effects of growthirradiance
Though Vcmax and Jmax were mostly derived from photo-synthetic light response curves (Appendix C), the modelparameters calculated from An versus Ci (Ellsworth & Liu
1994) and An versus light responses (all other data) fittedthe same curvilinear relationships between PR, PB and MA
(Figs 3a & b). This demonstrates that photosynthetic lightresponse curves gave comparable parameter values to An
versus Ci relationships. Moreover, at 25 °C the ratio ofJmax/Vcmax was 2·22 ± 0·44 (mean ± SE, N = 59) in the dataset of Wullschleger (1993), while the equations depicted inFig. 3 give Jmax/Vcmax = 2·44 at a MA of 50 g m–2, againsupporting the validity of the current parametrization for A.saccharum. Clearly, a balance exists between Rubiscoactivity and Jmax (von Caemmerer & Farquhar 1984;Wullschleger 1993). Whenever PR increases, PB is alsoexpected to increase, which will result in similar relation-ships between PB, PR and MA, as illustrated in Fig. 3.
Currently, evidence supports the trends suggested by ourstudy: both PR and PB increased with increasing irradiancein Flindersia brayleyana (Thompson, Stocker &Kriedemann 1988), Spinacia oleracea (recalculated fromTerashima & Evans 1988) and Solanum dulcamara (recal-culated from Osmond 1983), whereas PB did so inCucumis sativus (recalculated from Evans 1989a),Medicago sativa (recalculated from Evans 1993a),Phaseolus vulgaris (recalculated from Evans 1989a) andPisum sativum (recalculated from Evans 1987).Hyperbolically increasing PR and PB with increasinggrowth irradiance (Fig. 3) are exactly what one wouldexpect (if the upper boundary of photosynthetic nitrogen isfixed) for an optimum partitioning of leaf resources(Friend 1991; Hikosaka & Terashima 1995). Moreover,the same pattern was also seen in PR calculated from invitro laboratory measurements of Rubisco activity (cf.Fig. 3a). However, since relatively long-lived leaves ofwoody species contain large amounts of defensive pheno-lic compounds such as tannins (Schultz, Nothnagle &Baldwin 1982; Coley 1983), direct determination ofenzyme activities is in many cases seriously handicapped,and so Rubisco activities accounting for less than 20% ofobserved photosynthetic rates have often been reported forwoody species (e.g. Fig. 3a, Tselniker, Chetverikov &Andreyeva 1983; Saieed, Douglas & Fry 1994; Ü.Niinemets, personal observation). Thus, we believe thatthe approach taken here is in many cases currently the onlyway to gain insight into the nitrogen allocation patterns indifferent biochemical fractions in forest trees.
Of course, the nitrogen investment in Rubisco is actuallylarger than that presently derived from photosynthesismeasurements, because there are considerable diffusiveresistances between the intercellular airspace and carboxy-lation sites (Lloyd et al. 1992; Evans et al. 1994; Parkhurst1994; Epron et al. 1995; Syvertsen et al. 1995) which arenot yet taken into account. Consideration of CO2 transferconductance from substomatal cavities to the sites of car-boxylation (gi) may be especially relevant in the light ofthe recent study by Syvertsen et al. (1995), which showedthat a component of gi, an intercellular gas-phase conduc-tance from the stomatal cavity to the outer surface of meso-phyll cell wall (gias), was negatively correlated with MA.Though gias is usually relatively large compared to gi
© 1997 Blackwell Science Ltd, Plant, Cell and Environment, 20, 845–866
Figure 10. Correlation between net photosynthesis rate per unitarea (Aa
max) and leaf nitrogen content per unit area, Na (g m–2), inA. saccharum. Relationships were modelled for 25 and 30 °C usingall equations in Table 1, and for 25 °C holding Gf constant at themedium value of 14·3. Variability in Na was achieved by varyingMA and calculating Nm from the regression equation in Table 1.● and solid line: measured values and a linear fit to the data(Ellsworth & Reich 1992a; Aa
max = –0·72 + 5·89Na; r2 = 0·51,
P < 0·001). Environmental conditions were as in Fig. 8a.

856 Ü. Niinemets and J. D. Tenhunen
(Evans et al. 1994; Syvertsen et al. 1995), this observationmay indicate that the underestimation of PR is greater forleaves at higher irradiance. On the other hand, it is wellknown that stomatal density increases, and the distributionof stomata shifts from hypostomy towards amphistomywith increasing irradiance (Oberbauer, Strain & Riechers1987; Peat & Fitter 1994), effectively compensating fordecreasing gias (Parkhurst 1994). However, changes instomatal distribution with respect to adaxial and abaxialleaf surface with irradiance do not appear to play a role inA. saccharum (D. S. Ellsworth, Brookhaven NationalLaboratory, Upton, New York, personal communication).Be that as it may, further testing of the model and its utilityfor calculating the carbon balance of different canopy lay-ers requires an examination of the dependences of parame-ters PB and PR on irradiance in the natural environmentwith a number of species.
Initial quantum conversion efficiency was modelledbased on the assumption that leaf absorptance is affectedby changes in leaf chlorophyll concentration only (Eqn 6).However, ξ is also a function of leaf structure as it influ-ences optical properties (Fukshansky 1981; Osborne &Raven 1986; Lee et al. 1990; Vogelmann 1993), and toaccount for the slight model overestimation of α we mayneed to modify Eqn 6 with a parameter describing howanatomical changes occurring across light gradients inleaves alter ξ for a given leaf chlorophyll content.Nevertheless, both model predictions and actual measure-ments agreed in that α is constant with irradiance in mid-season (Fig. 4a). In addition, the model also showed thatthis constancy is achieved at low irradiances with dispro-portionate investments of leaf nitrogen in light-harvestingapparatus. Non-linear effects of growth irradiance on thy-lakoid composition have also been observed previously(Leong & Anderson 1984a,b; Chow et al. 1988; Lee &Whitmarsh 1989), and, given that the upper boundary ofphotosynthetic nitrogen is fixed, represent the optimumstrategy for leaf nitrogen partitioning (Hikosaka &Terashima 1995).
As it stands, the model appears also to be useful for han-dling seasonal data, because the relationship between PR
and MA is largely independent of the phenological stage ofleaves (Fig. 5). Further evidence indicates that leaf chloro-phyll concentration declines in direct proportion to totalleaf nitrogen during senescence (Zolg & Bornkamm 1981;Evans 1983; Hikosaka 1996), suggesting that the coeffi-cients CB and PL at a given MA may also be used to modelthe changes in α from leaf maturation till abscission.However, for early season data, changes in PR, PB and PL
associated with leaf maturation (Figs 5 & 8b; see alsoReich, Walters & Ellsworth 1991) should be taken intoaccount. Other data indicate that the limiting step of photo-synthetic electron transport resides before plastohydro-quinone reoxidation in developing leaves (Holloway,Maclean & Scott 1983), suggesting that PSII rather than cytf may provide the appropriate basis for expressing the ratesof photosynthetic electron transport during the develop-ment of photosynthetic apparatus. Consequently, modelling
of stand carbon gain during canopy leaf area developmentis currently restricted by many uncertainties and requiresfurther experimental as well as theoretical work.
Scaling carbon gain across light gradients withnitrogen: mass or area basis?
Since most of foliar nitrogen is invested in photosyntheticfunction, and it is also the mineral element required in thelargest quantities for photosynthesis, the photosynthesis ofa leaf is tightly related to its nitrogen content (e.g. Field &Mooney 1986). Though Field & Mooney (1986), Evans(1989b) and Field (1991) suggest that this relationship isnot fundamentally different on an area or a mass basis,recent studies demonstrate that the measurement basis maycrucially alter An–N relationships (Reich & Walters 1994;Reich et al. 1995). In general, Na is more variable acrossthe canopy and along light gradients (Ellsworth & Reich1993; Kull & Niinemets 1993; Niinemets 1995, 1997a)than Nm, which tends to be relatively constant (Chazdon &Field 1987; Walters & Field 1987; Sims & Pearcy 1989;Ellsworth & Reich 1993; Harley & Baldocchi 1995;Tjoelker et al. 1995). Similarly, both Nm and Am
max in A.saccharum varied little in mid-season (Fig. 8a) – in markedcontrast to Aa
max and Na (Fig. 10). Furthermore, acclima-tion to local light conditions, altering nitrogen partitioningbetween various components of photosynthetic apparatus(Figs 3 & 4) and thereby changing the slope of Am
max ver-sus Nm dependences, resulted in a statistically insignificantrelationship for a pooled set of data (Ellsworth & Reich1992a; Fig. 8a). Thus, collectively the evidence outlinedabove seems to favour Na for obtaining momentary esti-mates of canopy photosynthesis as is done in numerousmodels (cf. ‘Introduction’). However, area basis is theproduct of mass basis and MA. Given that the acclimationof foliar biochemistry to growth irradiance altered Am
max atmost by 40% (Figs 8 & 9a), and that MA varied by morethan 3-fold (Fig. 2), the positive relationship betweenAa
max and Na in mid-season is primarily the product ofplastic changes in leaf anatomy (Fig. 2), which alter theamount of photosynthetic tissue per unit area rather thananything intimately related to ‘nitrogen’. Gutschick &Wiegel (1988) and Baldocchi & Harley (1995) modelledcanopy photosynthesis, accounting for the variability inMA with canopy depth, and concluded that canopy photo-synthesis is optimized for a given foliar biomass if MA
declines with increasing canopy depth. A similar conclu-sion is reached for ‘optimal nitrogen distribution’ on thebasis of Na (Hirose & Werger 1987; Leuning et al. 1995;Sands 1995a), and in all situations in which Nm remainsconstant throughout the canopy. Though the analyses of Na
include ‘nitrogen’, they do not really enhance the under-standing based on MA.
Nevertheless, nitrogen plays a prominent role in thedeciduous forest canopy, and in a time dimension overwhich a canopy model should make useful predictions, Nm
varies 4-fold (Figs 5a and 8b), but MA varies much less(Reich, Walters & Ellsworth 1991). This leads seasonally
© 1997 Blackwell Science Ltd, Plant, Cell and Environment, 20, 845–866

Carbon gain along light gradients in Acer 857
to a highly heterogeneous population of Na values in termsof Nm, MA and the partitioning of nitrogen between thecomponents of the photosynthetic apparatus. Consequently,no single relationship satisfies the correlation betweenAa
max and Na (see also Fig. 10), and we think that it is highlyrelevant to distinguish between structural dry matter parti-tioning (MA) and the cost of this dry matter in terms ofnitrogen concentration (Nm). Na as the product of both MA
and Nm says nothing about nitrogen availability and parti-tioning unless the simultaneous variation in MA is known.Of course, there is also no single relationship between Nm
and Ammax; rather the slope of this dependence increases
with increasing growth irradiance (Fig. 8b). Given that lightacclimation is related to MA (Figs 3 & 4), MA and Nm con-tain more information than the product variable Na.
The shape of the nitrogen versus photosynthesisrelationship: is there ‘structural’ nitrogen?
Scaling of carbon fluxes with nitrogen at the canopy levelrequires that the form of the relationship between N andAmax be established explicitly. Often these dependencesintersect the x-axis at a positive value of leaf nitrogen, N0
(e.g. Field & Mooney 1986; Evans 1989b; Reich et al.1994). Currently N0 is interpreted as the basic nitrogen costof ‘structural’ or non-photosynthetic components of leaves(Pons et al. 1990) or as the minimum leaf nitrogen for pho-tosynthesis (Schulze et al. 1994; Leuning et al. 1995;Sands 1995a). Thus, one may claim that, if the leaf satisfiesN0, any extra nitrogen will be invested in the photosyn-thetic apparatus. Yet, the data supporting the existence of a‘structural’ nitrogen pool inherently different from an‘assimilative’ pool are fragile. As the analysis of seasonalAm
max versus Nm relationships in A. saccharum revealed,PR was independent of leaf nitrogen concentration overmost of the season, except during the development of leafphotosynthetic apparatus in early spring (Fig. 5b). Thispattern was exactly the same in Oryza sativa (Makino, Mae& Ohira 1984). Further studies show that PB and PR
decline in a parallel manner during senescence (Evans1983). Since the remobilization of ‘structural’ and ‘assim-ilative’ nitrogen proceeds with identical kinetic constants,we suggest that seasonal Am
max versus Nm relationshipsshould go through the origin. Of course, heterogeneity inPB and PR values depending on light-acclimation state inthe sample used to develop an Am
max versus Nm relation-ship may result in a non-zero x-intercept (cf. Figs 3 & 8),but this is certainly not ‘structural’ or ‘non-photosynthetic’nitrogen.
Many fertilization experiments, where leaf nitrogen con-centration has been changed over a broad range at approxi-mately constant growth irradiances, also provide no strongevidence for the existence of N0. PR was independent ofnitrogen nutrition regime in Triticum aestivum (Evans1983) and Oryza sativa (Makino, Mae & Ohira 1984), PB
was independent in O. sativa (Makino, Nakano & Mae1994), and PR and PB were independent in Flindersiabrayleyana (Thompson, Stocker & Kriedemann 1988); no
clear-cut differences were found between nitrogen avail-ability treatments in the proportion of leaf nitrogen in pho-tosynthetic components in four wild grasses (Pons, van derWerf & Lambers 1994). In contrast, PR and PB increasedwith increasing nitrogen availability in Solanum dulca-mara (recalculated from Osmond 1983) and Spinacia oler-acea (recalculated from Evans & Terashima 1987), and PR
did so in O. sativa (Makino, Nakano & Mae 1994),whereas PR, PB and PL decreased with increasing nitrogenavailability in T. aestivum (van den Boogaard et al. 1995),and so also did the proportion of enzymes responsible fortriose phosphate utilization in O. sativa (Makino, Nakano& Mae 1994). Thus, the patterns are contradictory betweenand within species (cf. O. sativa and T. aestivum) and col-lectively do not contribute to the fundamental hypothesisof a basic nitrogen cost of leaf structure independent ofnutrient availability. Moreover, in studies highlightinggreater nitrogen partitioning into ‘assimilative’ compart-ments, investment in Rubisco far exceeds the investment inPB (Osmond 1983; Evans & Terashima 1987; Makino,Nakano & Mae 1994) or proceeds simultaneously withdecreasing nitrogen investments in enzymes responsiblefor sucrose and starch synthesis (Makino, Nakano & Mae1994). The latter evidence should be tempered in the lightof the opinion that Rubisco also functions essentially as amajor storage protein (Millard 1988; Stitt & Schulze1994), and that optimal PR and PB should vary little withnitrogen availability (Friend 1991). In fact, positive y-intercepts occasionally calculated for Am
max versus Nm
relationships (e.g. Leuning, Cromer & Rance 1991; Reichet al. 1994, 1995) show that N0 obtained from regressionanalysis is physiologically meaningless.
However, in contrast to Ammax versus Nm relationships,
linear regressions of Aamax versus Na should not go through
origin. This is simply because the lowest values of Na aredetermined by MA (which is always larger than zero) ratherthan by Nm. In seedlings of A. saccharum, the most shadedleaves are expected to have an MA of not less than 20 g m–2
(Fig. 2a), and assuming a realistic value of 0·02 g g–1 forNm, minimum measurable Na is at least 0·4 g m–2 in mid-season – exactly what one observes (Fig. 10). Yet, thisminimum Na is certainly not ‘structural’ nitrogen. In fact,the Aa
max versus Na relationship is truncated, having no x-intercept value, and it is important to recognize that N0
obtained from a linear fit of Aamax versus Na relations is a
‘fudge factor’ and has nothing to do with nitrogen.
Nitrogen partitioning in relation to shadetolerance and succession
Leaf nitrogen in sunny habitats is optimally partitioned ifnitrogen is preferentially invested in Rubisco and electrontransport components, and in shady conditions if it isdirected towards effective light harvesting. However,shade-tolerant A. saccharum demonstrated a low potentialfor biochemical acclimation to high irradiance (Fig. 9a)relative to the adjustment to low irradiance (Fig. 9b). Thus,this species was able to achieve the goal of enhanced light
© 1997 Blackwell Science Ltd, Plant, Cell and Environment, 20, 845–866
858 Ü. Niinemets and J. D. Tenhunen
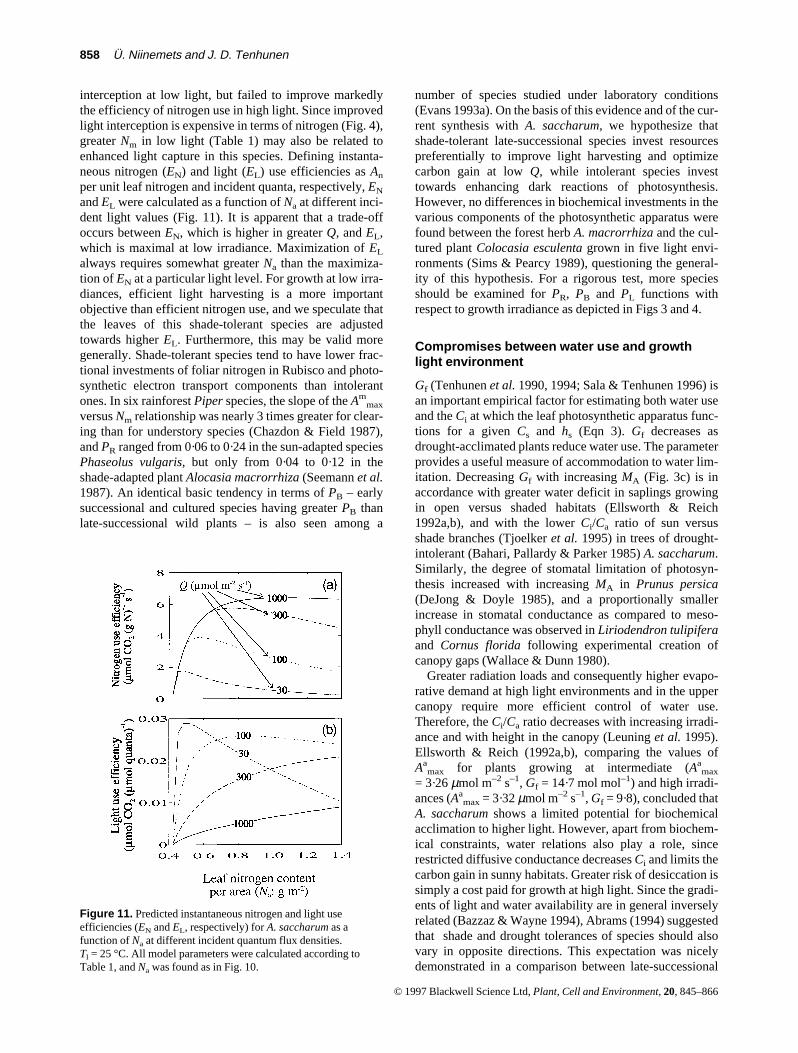
interception at low light, but failed to improve markedlythe efficiency of nitrogen use in high light. Since improvedlight interception is expensive in terms of nitrogen (Fig. 4),greater Nm in low light (Table 1) may also be related toenhanced light capture in this species. Defining instanta-neous nitrogen (EN) and light (EL) use efficiencies as An
per unit leaf nitrogen and incident quanta, respectively, EN
and EL were calculated as a function of Na at different inci-dent light values (Fig. 11). It is apparent that a trade-offoccurs between EN, which is higher in greater Q, and EL,which is maximal at low irradiance. Maximization of EL
always requires somewhat greater Na than the maximiza-tion of EN at a particular light level. For growth at low irra-diances, efficient light harvesting is a more importantobjective than efficient nitrogen use, and we speculate thatthe leaves of this shade-tolerant species are adjustedtowards higher EL. Furthermore, this may be valid moregenerally. Shade-tolerant species tend to have lower frac-tional investments of foliar nitrogen in Rubisco and photo-synthetic electron transport components than intolerantones. In six rainforest Piper species, the slope of the Am
max
versus Nm relationship was nearly 3 times greater for clear-ing than for understory species (Chazdon & Field 1987),and PR ranged from 0·06 to 0·24 in the sun-adapted speciesPhaseolus vulgaris, but only from 0·04 to 0·12 in theshade-adapted plant Alocasia macrorrhiza (Seemann et al.1987). An identical basic tendency in terms of PB – earlysuccessional and cultured species having greater PB thanlate-successional wild plants – is also seen among a
number of species studied under laboratory conditions(Evans 1993a). On the basis of this evidence and of the cur-rent synthesis with A. saccharum, we hypothesize thatshade-tolerant late-successional species invest resourcespreferentially to improve light harvesting and optimizecarbon gain at low Q, while intolerant species investtowards enhancing dark reactions of photosynthesis.However, no differences in biochemical investments in thevarious components of the photosynthetic apparatus werefound between the forest herb A. macrorrhiza and the cul-tured plant Colocasia esculenta grown in five light envi-ronments (Sims & Pearcy 1989), questioning the general-ity of this hypothesis. For a rigorous test, more speciesshould be examined for PR, PB and PL functions withrespect to growth irradiance as depicted in Figs 3 and 4.
Compromises between water use and growthlight environment
Gf (Tenhunen et al. 1990, 1994; Sala & Tenhunen 1996) isan important empirical factor for estimating both water useand the Ci at which the leaf photosynthetic apparatus func-tions for a given Cs and hs (Eqn 3). Gf decreases asdrought-acclimated plants reduce water use. The parameterprovides a useful measure of accommodation to water lim-itation. Decreasing Gf with increasing MA (Fig. 3c) is inaccordance with greater water deficit in saplings growingin open versus shaded habitats (Ellsworth & Reich1992a,b), and with the lower Ci/Ca ratio of sun versusshade branches (Tjoelker et al. 1995) in trees of drought-intolerant (Bahari, Pallardy & Parker 1985) A. saccharum.Similarly, the degree of stomatal limitation of photosyn-thesis increased with increasing MA in Prunus persica(DeJong & Doyle 1985), and a proportionally smallerincrease in stomatal conductance as compared to meso-phyll conductance was observed in Liriodendron tulipiferaand Cornus florida following experimental creation ofcanopy gaps (Wallace & Dunn 1980).
Greater radiation loads and consequently higher evapo-rative demand at high light environments and in the uppercanopy require more efficient control of water use.Therefore, the Ci/Ca ratio decreases with increasing irradi-ance and with height in the canopy (Leuning et al. 1995).Ellsworth & Reich (1992a,b), comparing the values ofAa
max for plants growing at intermediate (Aamax
= 3·26 µmol m–2 s–1, Gf = 14·7 mol mol–1) and high irradi-ances (Aa
max = 3·32 µmol m–2 s–1, Gf = 9·8), concluded thatA. saccharum shows a limited potential for biochemicalacclimation to higher light. However, apart from biochem-ical constraints, water relations also play a role, sincerestricted diffusive conductance decreases Ci and limits thecarbon gain in sunny habitats. Greater risk of desiccation issimply a cost paid for growth at high light. Since the gradi-ents of light and water availability are in general inverselyrelated (Bazzaz & Wayne 1994), Abrams (1994) suggestedthat shade and drought tolerances of species should alsovary in opposite directions. This expectation was nicelydemonstrated in a comparison between late-successional
© 1997 Blackwell Science Ltd, Plant, Cell and Environment, 20, 845–866
Figure 11. Predicted instantaneous nitrogen and light useefficiencies (EN and EL, respectively) for A. saccharum as afunction of Na at different incident quantum flux densities.Tl = 25 °C. All model parameters were calculated according toTable 1, and Na was found as in Fig. 10.

Carbon gain along light gradients in Acer 859
A. macrorrhiza and early-successional C. esculenta (Sims& Pearcy 1989); though there were no differences in bio-chemical acclimation to irradiance, A. macrorrhiza hadgreater diffusive resistances to CO2 than C. esculenta, andthis led to lower carbon gain at high irradiances in the late-successional species. As the latter study and the currentsynthesis with A. saccharum demonstrate, in addition tothe economies of light harvesting and nitrogen partition-ing, changes in water availability may significantly modifythe success and distribution of species across thegap–understory continuum.
ACKNOWLEDGMENTS
We thank David S. Ellsworth (Brookhaven NationalLaboratory, Upton, New York) for sharing with us essen-tial unpublished background data for A. saccharum, JamesA. Weber (EPA, Corvallis, Oregon) for providing the diur-nal courses of gas exchange of A. saccharum, and EvaFalge (BITÖK, Universität Bayreuth), D. S. Ellsworth andOlevi Kull (Institute of Ecology, Estonian Academy ofSciences) for reading, and providing useful comments on,earlier versions of the manuscript. This work was sup-ported by Deutsche Akademische Austauschdienst(DAAD), by the Estonian Science Foundation (ETF grants1597 and 2048) and by the German Ministry of Research,Science, Education and Technology (BMBF grant BEO51–0339476 A).
REFERENCES
Abrams M.D. (1994) Genotypic and phenotypic variation as stressadaptations in temperate tree species: a review of several casestudies. Tree Physiology 14, 833–842.
Amthor J.S. (1994a) Higher plant respiration and its relationships tophotosynthesis. In Ecophysiology of Photosynthesis. EcologicalStudies 100 (eds E.-D. Schulze & M. M. Caldwell), pp. 71–101.Springer Verlag, Berlin.
Amthor J.S. (1994b) Scaling CO2-photosynthesis relationshipsfrom the leaf to the canopy. Photosynthesis Research 39,321–350.
Amthor J.S., Goulden M.L., Munger J.W. & Wofsy S.C. (1994)Testing a mechanistic model of forest-canopy mass and energyexchange using eddy correlation: carbon dioxide and ozoneuptake by a mixed oak-maple stand. Australian Journal of PlantPhysiology 21, 623–651.
Armond P.A., Schreiber U. & Björkman O. (1978) Photosyntheticacclimation to temperature in the desert shrub, Larreadivaricata. II. Light harvesting efficiency and electron transport.Plant Physiology 61, 411–415.
Azcón-Bieto J. & Osmond C.B. (1983) Relationship between pho-tosynthesis and respiration. The effect of carbohydrate status onthe rate of CO2 production by respiration in darkened and illumi-nated wheat leaves. Plant Physiology 71, 574–581.
Bahari Z.A., Pallardy S.G. & Parker W.C. (1985) Photosynthesis,water relations, and drought adaptation in six woody species ofoak-hickory forests in central Missouri. Forest Science 31,557–569.
Baldocchi D.D. & Harley P.C. (1995) Scaling carbon dioxide andwater vapour exchange from leaf to canopy in a deciduous forest.II. Model testing and application. Plant, Cell and Environment18, 1157–1173.
Ball J.T., Woodrow I.E. & Berry J.A. (1987) A model predictingstomatal conductance and its contribution to the control of photo-synthesis under different environmental conditions. In Progressin Photosynthesis Research. Proceedings of the VIIthInternational Photosynthesis Congress, Vol. IV (ed. J. Biggens),pp. 221–224. Martinus Nijhoff Publishers, Dordrecht.
Bazzaz F.A. & Wayne P.M. (1994) Coping with environmentalheterogeneity: the physiological ecology of tree seedling regen-eration across the gap–understory continuum. In Exploitationof Environmental Heterogeneity by Plants. EcophysiologicalProcesses Above- and Belowground. Physiological Ecology: aSeries of Monographs, Texts and Treatises (eds M. M.Caldwell & R. W. Pearcy), pp. 349–390. Academic Press, SanDiego.
Berry J. & Björkman O. (1980) Photosynthetic response and adap-tation to temperature in higher plants. Annual Review of PlantPhysiology 31, 491–543.
Björkman O. (1981) Responses to different quantum flux densities.In Physiological Plant Ecology, Vol. I, Encyclopedia of PlantPhysiology 12A (eds O. L. Lange, P. S. Nobel, C. B. Osmond &H. Ziegler), pp. 57–107. Springer-Verlag, Berlin.
Björkman O., Badger M. & Armond P.A. (1978) Thermal acclima-tion of photosynthesis: effect of growth temperature on photo-synthetic characteristics and components of the photosyntheticapparatus in Nerium oleander. Carnegie Institution Year Book77, 262–276.
Brooks A. & Farquhar G.D. (1985) Effects of temperature on theCO2/O2 specificity of ribulose-1,5-bisphosphate carboxylase/oxygenase and the rate of respiration in the light. Estimates fromgas-exchange measurements on spinach. Planta 165, 397–406.
Cannell M.G.R., Milne R., Sheppard L.J. & Unsworth M.H. (1987)Radiation interception and productivity of willow. Journal ofApplied Ecology 24, 261–278.
Ceulemans R.J. & Saugier B. (1991) Photosynthesis. In Physiologyof Trees (ed. A. S. Raghavendra), pp. 21–50. John Wiley & SonsInc., New York.
Chazdon R.L. & Field C.B. (1987) Determinants of photosyn-thetic capacity in six rainforest Piper species. Oecologia 73,222–230.
Chen J.-L., Reynolds J.F., Harley P.C. & Tenhunen J.D. (1993)Coordination theory of leaf nitrogen distribution in a canopy.Oecologia 93, 63–69.
Chow W.S., Adamson H.Y. & Anderson J.M. (1991) Photosyn-thetic acclimation of Tradescantia albiflora to growth irradi-ance: lack of adjustment of light-harvesting components and itsconsequences. Physiologia Plantarum 81, 175–182.
Chow W.S. & Anderson J.M. (1987a) Photosynthetic responses ofPisum sativum to an increase in irradiance during growth. I.Photosynthetic activities. Australian Journal of Plant Physiology14, 1–8.
Chow W.S. & Anderson J.M. (1987b) Photosynthetic responses ofPisum sativum to an increase in irradiance during growth. II.Thylakoid membrane components. Australian Journal of PlantPhysiology 14, 9–19.
Chow W.S., Hope A.B. & Anderson J.M. (1989) Oxygen per flashfrom leaf disks quantifies photosystem II. Biochimica etBiophysica Acta 973, 105–108.
Chow W.S., Qian L., Goodchild D.J. & Anderson J.M. (1988)Photosynthetic acclimation of Alocasia macrorrhiza (L.) G. Donto growth irradiance: structure, function and composition ofchloroplasts. Ecology of Photosynthesis in Sun and Shade (eds J.R. Evans, S. von Caemmerer & W. W. Adams III), pp. 107–122.CSIRO, Melbourne.
Coley P.D. (1983) Herbivory and defensive characteristics of treespecies in a lowland tropical forest. Ecological Monographs 53,209–233.
© 1997 Blackwell Science Ltd, Plant, Cell and Environment, 20, 845–866
860 Ü. Niinemets and J. D. Tenhunen
Collatz G.J., Ball J.T., Grivet C. & Berry J.A. (1991) Physiologicaland environmental regulation of stomatal conductance, photosyn-thesis and transpiration: a model that includes a laminar boundarylayer. Agricultural and Forest Meteorology 54, 107–136.
DeJong T.M. & Doyle J.F. (1985) Seasonal relationships betweenleaf nitrogen content (photosynthetic capacity) and leaf canopylight exposure in peach (Prunus persica). Plant, Cell andEnvironment 8, 701–706.
Ehleringer J. & Björkman O. (1977) Quantum yields for CO2
uptake in C3 and C4 plants. Dependence on temperature, CO2
and O2 concentration. Plant Physiology 59, 86–90.Ellsworth D.S. & Liu X. (1994) Photosynthesis and canopy nutri-
tion of four sugar maple forests on acid soils in northernVermont. Canadian Journal of Forest Research 24, 2118–2127.
Ellsworth D.S. & Reich P.B. (1992a) Leaf mass per area, nitrogencontent and photosynthetic carbon gain in Acer saccharumseedlings in contrasting forest light environments. FunctionalEcology 6, 423–435.
Ellsworth D.S. & Reich P.B. (1992b) Water relations and gasexchange of Acer saccharum seedlings in contrasting naturallight and water regimes. Tree Physiology 10, 1–20.
Ellsworth D.S. & Reich P.B. (1993) Canopy structure and verticalpatterns of photosynthesis and related leaf traits in a deciduousforest. Oecologia 96, 169–178.
Ellsworth D.S., Tyree M.T., Parker B.L. & Skinner M. (1994)Photosynthesis and water-use efficiency of sugar maple (Acersaccharum) in relation to pear thrips defoliation. TreePhysiology 14, 619–632.
Epron D., Godard D., Cornic G. & Genty B. (1995) Limitation ofnet CO2 assimilation rate by internal resistances to CO2 transferin the leaves of two tree species (Fagus sylvatica L. andCastanea sativa Mill.). Plant, Cell and Environment 18, 43–51.
Evans J.R. (1983) Nitrogen and photosynthesis in the flag leaf ofwheat (Triticum aestivum L.). Plant Physiology 72, 297–302.
Evans J.R. (1987) The relationship between electron transport com-ponents and photosynthetic capacity in pea leaves grown at dif-ferent irradiances. Australian Journal of Plant Physiology 14,157–170.
Evans J.R. (1989a) Partitioning of nitrogen between and withinleaves grown under different irradiances. Australian Journal ofPlant Physiology 16, 533–548.
Evans J.R. (1989b) Photosynthesis and nitrogen relationships inleaves of C3 plants. Oecologia 78, 9–19.
Evans J.R. (1993a) Photosynthetic acclimation and nitrogen parti-tioning within a lucerne canopy. I. Canopy characteristics.Australian Journal of Plant Physiology 20, 55–67.
Evans J.R. (1993b) Photosynthetic acclimation and nitrogen parti-tioning within a lucerne canopy. II. Stability through time andcomparison with a theoretical optimum. Australian Journal ofPlant Physiology 20, 69–82.
Evans J.R., Jakobsen I. & Ögren E. (1993) Photosynthetic light-response curves. 2. Gradients of light absorption and photosyn-thetic capacity. Planta 189, 191–200.
Evans J.R. & Seemann J.R. (1989) The allocation of protein nitro-gen in the photosynthetic apparatus: costs, consequences, andcontrol. In Photosynthesis. Proceedings of the C.S. FrenchSymposium on Photosynthesis held in Stanford, California, July17–23, 1988. Plant Biology 8 (ed. W. R. Briggs), pp. 183–205.Alan R. Liss, Inc., New York.
Evans J.R. & Terashima I. (1987) Effects of nitrogen nutrition onelectron transport components and photosynthesis in spinach.Australian Journal of Plant Physiology 14, 59–68.
Evans J.R., von Caemmerer S., Setchell B.A. & Hudson G.S.(1994) The relationship between CO2 transfer conductance andleaf anatomy in transgenic tobacco with a reduced content ofRubisco. Australian Journal of Plant Physiology 21, 475–495.
Farquhar G.D. & von Caemmerer S. (1982) Modeling of photosyn-thetic response to environmental conditions. In PhysiologicalPlant Ecology, Vol. II. Encyclopedia of Plant Physiology 12B(eds O. L. Lange, P. S. Nobel, C. B. Osmond & H. Ziegler), pp.549–588. Springer-Verlag, Berlin.
Farquhar G.D., von Caemmerer S. & Berry J.A. (1980) A biochem-ical model of photosynthetic CO2 assimilation in leaves of C3
species. Planta 149, 78–90.Field C.B. (1991) Ecological scaling of carbon gain to stress and
resource availability. In Response of Plants to Multiple Stresses.Physiological Ecology: a Series of Monographs, Texts, andTreatises (eds H. A. Mooney, W. E. Winner & E. J. Pell), pp.35–65. Academic Press, San Diego.
Field C. & Mooney H.A. (1986) The photosynthesis–nitrogen rela-tionship in wild plants. In On the Economy of Plant Form andFunction. Proceedings of the Sixth Maria Moors CabotSymposium, ‘Evolutionary Constraints on Primary Productivity:Adaptive Patterns of Energy Capture in Plants’, Harvard Forest,August 1983 (ed. T. J. Givnish), pp. 25–55. CambridgeUniversity Press, Cambridge.
Foyer C.H. (1993) Interactions between electron transport and car-bon assimilation in leaves. Coordination of activities and control.In Photosynthesis Photoreactions to Plant Productivity (eds Y.P. Abrol, P. Mohanty & Govindjee), pp. 199–223. Oxford andIBH Publishing Co. Pvt. Ltd, New Delhi.
Friend A.D. (1991) Use of a model of photosynthesis and leafmicroenvironment to predict optimal stomatal conductance andleaf nitrogen partitioning. Plant, Cell and Environment 14,895–905.
Friend A.D. (1995) PGEN: an integrated model of leaf photosyn-thesis, transpiration, and conductance. Ecological Modelling 77,233–255.
Fukshansky L. (1981) Optical properties of plants. In Plant and theDaylight Spectrum (ed. H. Smith), pp. 22–40. Academic Press,London.
Gates D.M. (1980) Biophysical Ecology, Springer-Verlag, Berlin.Gutschick V.P. & Wiegel F.W. (1988) Optimizing the canopy pho-
tosynthetic rate by patterns of investment in specific leaf mass.The American Naturalist 132, 67–86.
Hanson P.J., McRoberts R.E., Isebrands J.G. & Dixon R.K. (1987)An optimal sampling strategy for determining CO2 exchange rateas a function of photosynthetic photon flux density.Photosynthetica 21, 98–101.
Harbinson J. (1994) The responses of thylakoid electron transportand light utilization efficiency to sink limitation of photosynthe-sis. In Photoinhibition of Photosynthesis: from MolecularMechanisms to the Field. Environmental Plant Biology (eds N.R. Baker & J. R. Bowyer), pp. 273–295. Bios ScientificPublishers Ltd, Oxford.
Harley P.C. & Baldocchi D.D. (1995) Scaling carbon dioxide andwater vapour exchange from leaf to canopy in a deciduous forest.I. Leaf model parametrization. Plant, Cell and Environment 18,1146–1156.
Harley P.C. & Tenhunen J.D. (1991) Modeling the photosyntheticresponse of C3 leaves to environmental factors. In ModelingCrop Photosynthesis – from Biochemistry to Canopy, CSSASpecial Publication No. 19 (ed. K. J. Boote), pp. 17–39.American Society of Agronomy and Crop Science Society ofAmerica, Madison.
Harley P.C., Tenhunen J.D. & Lange O.L. (1986) Use of an analyti-cal model to study limitations on net photosynthesis in Arbutusunedo under field conditions. Oecologia 70, 393–401.
Harley P.C., Thomas R.B., Reynolds J.F. & Strain B.R. (1992)Modelling photosynthesis of cotton in elevated CO2. Plant, Celland Environment 15, 271–282.
Hikosaka K. (1996) Effects of leaf age, nitrogen nutrition and pho-
© 1997 Blackwell Science Ltd, Plant, Cell and Environment, 20, 845–866
Carbon gain along light gradients in Acer 861
ton flux density on the organization of the photosynthetic appara-tus in leaves of a vine (Ipomoea tricolor Cav.) grown horizon-tally to avoid mutual shading of leaves. Planta 198, 144–150.
Hikosaka K. & Terashima I. (1995) A model of the acclimation ofphotosynthesis in the leaves of C3 plants to sun and shade withrespect to nitrogen use. Plant, Cell and Environment 18,605–618.
Hirose T. & Werger M.J.A. (1987) Maximizing daily canopy pho-tosynthesis with respect to the leaf nitrogen allocation pattern inthe canopy. Oecologia 72, 520–526.
Holloway P.J., Maclean D.J. & Scott K.J. (1983) Rate-limitingsteps of electron transport in chloroplasts during ontogeny andsenescence of barley. Plant Physiology 72, 795–801.
Johnson F.H., Eyring H. & Williams R.W. (1942) The nature ofenzyme inhibitions in bacterial luminescence: sulfanilamide,urethane, temperature, and pressure. Journal of Cellular andComparative Physiology 20, 247–268.
Jordan D.B. & Ogren W.L. (1984) The CO2/O2 specificity of ribu-lose 1,5-bisphosphate carboxylase/oxygenase. Dependence onribulosebisphosphate concentration, pH and temperature. Planta161, 308–313.
Jurik T.W. (1986a) Seasonal patterns of leaf photosynthetic capac-ity in successional northern hardwood tree species. AmericanJournal of Botany 73, 131–138.
Jurik T.W. (1986b) Temporal and spatial patterns of specific leafweight in successional northern hardwood tree species.American Journal of Botany 73, 1083–1092.
Kloeppel B.D. & Abrams M.D. (1995) Ecophysiological attributesof the native Acer saccharum and the exotic Acer platanoides inurban oak forests in Pennsylvania, USA. Tree Physiology 15,739–746.
Kull O. & Niinemets Ü. (1993) Variation in leaf morphometry andnitrogen concentration in Betula pendula Roth., Corylus avel-lana L. & Lonicera xylosteum L. Tree Physiology 12, 311–318.
Laisk A. (1977) Kinetika fotosinteza i fotodyhaniya C3-rastenii.[Kinetics of Photosynthesis and Photorespiration in C3-Plants].Nauka, Moscow (In Russian).
Lee D.W., Bone R.A., Tarsis S.L. & Storch D. (1990) Correlates ofleaf optical properties in tropical forest sun and extreme-shadeplants. American Journal of Botany 77, 370–380.
Lee, W.-J. & Whitmarsh J. (1989) Photosynthetic apparatus of peathylakoid membranes. Response to growth light intensity. PlantPhysiology 89, 932–940.
Leong T.-Y & Anderson J.M. (1984a) Adaptation of the thylakoidmembranes of pea chloroplasts to light intensities. I. Study on thedistribution of chlorophyll-protein complexes. PhotosynthesisResearch 5, 105–115.
Leong T.-Y. & Anderson J.M. (1984b) Adaptation of the thylakoidmembranes of pea chloroplasts to light intensities. II. Regulationof electron transport capacities, electron carriers, coupling factor(CF1) activity and rates of photosynthesis. PhotosynthesisResearch 5, 117–128.
Leuning R., Cromer R.N. & Rance S. (1991) Spatial distributions offoliar nitrogen and phosphorus in crowns of Eucalyptus grandis.Oecologia 88, 504–510.
Leuning R., Kelliher F.M., de Pury D.G.G. & Schulze, E.-D. (1995)Leaf nitrogen, photosynthesis, conductance and transpiration:scaling from leaves to canopies. Plant, Cell and Environment 18,1183–1200.
Linder S. (1985) Potential and actual production in Australian for-est stands. In Research for Forest Management (eds J. J.Landsberg & W. Parsons), pp. 11–35. CSIRO, Melbourne.
Lloyd J., Syvertsen J.P., Kriedemann P.E. & Farquhar G.D. (1992)Low conductances for CO2 diffusion from stomata to the sites ofcarboxylation in leaves of woody species. Plant, Cell andEnvironment 15, 873–899.
Makino A. Mae T. & Ohira K. (1984) Relation between nitrogen andribulose-1,5-bisphosphate carboxylase in rice leaves from emer-gence through senescence. Plant and Cell Physiology 25, 429–437.
Makino A., Nakano H. & Mae T. (1994) Responses of ribulose-1,5-bisphosphate carboxylase, cytochrome f, and sucrose synthesisenzymes in rice leaves to leaf nitrogen and their relationships tophotosynthesis. Plant Physiology 105, 173–179.
McCashin B.G., Cossins E.A. & Canvin D.T. (1988) Dark respira-tion during photosynthesis in wheat leaf slices. Plant Physiology87, 155–161.
McMurtrie R.E., Comins H.N., Kirschbaum M.U.F. & Wang, Y.-P.(1992) Modifying existing forest growth models to take accountof effects of elevated CO2. Australian Journal of Botany 40,657–677.
Millard P. (1988) The accumulation and storage of nitrogen byherbaceous plants. Plant, Cell and Environment 11, 1–8.
Niinemets Ü. (1995) Distribution of foliar carbon and nitrogenacross the canopy of Fagus sylvatica: adaptation to a verticallight gradient. Acta Oecologica 16, 525–541.
Niinemets Ü. (1997a) Distribution patterns of foliar carbon andnitrogen as affected by tree dimensions and relative light condi-tions in the canopy of Picea abies. Trees: Structure and Function11, 144–154.
Niinemets Ü. (1997b) Role of foliar nitrogen in light harvesting andshade-tolerance in four temperate deciduous woody species.Functional Ecology 11 in press.
Niinemets Ü. & Kull O. (1995) Effects of light availability and treesize on the architecture of assimilative surface in the canopy ofPicea abies: variation in needle morphology. Tree Physiology15, 307–315.
Nobel P.S. (1983) Biophysical Plant Physiology and Ecology.W.H. Freeman and Company, San Francisco.
Nolan W.G. & Smillie R.M. (1976) Multi-temperature effects onHill reaction activity of barley chloroplasts. Biochimica etBiophysica Acta 440, 461–475.
Oberbauer S.F., Strain B.R. & Riechers G.H. (1987) Field waterrelations of a wet-tropical forest tree species, Pentaclethramacroloba (Mimosaceae). Oecologia 71, 369–374.
Ögren E. (1993) Convexity of the photosynthetic light-responsecurve in relation to intensity and direction of light during growth.Plant Physiology 101, 1013–1019.
Ögren E. & Evans J.R. (1993) Photosynthetic light-responsecurves. 1. The influence of CO2 partial pressure and leaf inver-sion. Planta 189, 182–190.
Osborne B.A. & Raven J.A. (1986) Light absorption by plants andits implications for photosynthesis. Biological Reviews of theCambridge Philosophical Society 61, 1–61.
Osmond C.B. (1983) Interactions between irradiance, nitrogennutrition, and water stress in the sun-shade responses of Solanumdulcamara. Oecologia 57, 316–321.
Parkhurst D.F. (1994) Tansley review no. 65. Diffusion of CO2 andother gases inside leaves. The New Phytologist 126, 449–479.
Parry M.A.J., Schmidt C.N.G., Cornelius M.J., Millard B.N.,Burton S., Gutteridge S., Dyer T.A. & Keys A.J. (1987)Variations in properties of ribulose-1,5-bisphosphate carboxy-lase from various species related to differences in amino acidsequences. Journal of Experimental Botany 38, 1260–1271.
Peat H.J. & Fitter A.H. (1994) A comparative study of the distribu-tion and density of stomata in the British flora. BiologicalJournal of the Linnean Society 52, 377–393.
Pons T.L., van der Werf A. & Lambers H. (1994) Photosyntheticnitrogen use efficiency of inherently slow- and fast-growingspecies: possible explanations for observed differences. In AWhole Plant Perspective on Carbon–Nitrogen Interactions (edsJ. Roy & E. Garnier), pp. 61–77. SPB Academic Publishing bv,The Hague.
© 1997 Blackwell Science Ltd, Plant, Cell and Environment, 20, 845–866

862 Ü. Niinemets and J. D. Tenhunen
Pons T.L., Schieving F., Hirose T. & Werger M.J.A. (1990)Optimization of leaf nitrogen allocation for canopy photosynthe-sis in Lysimachia vulgaris. In Causes and Consequences ofVariation in Growth Rate and Productivity of Higher Plants (edsH. Lambers, M. L. Cambridge, H. Konings & T. L. Pons), pp.175–186. SPB Academic Publishing, The Hague.
Reich P.B. & Walters M.B. (1994) Photosynthesis-nitrogen rela-tions in Amazonian tree species. II. Variation in nitrogen vis-a-vis specific leaf area influences mass- and area-based expres-sions. Oecologia 97, 73–81.
Reich P.B., Walters M.B. & Ellsworth D.S. (1991) Leaf age andseason influence the relationships between leaf nitrogen, leafmass per area and photosynthesis in maple and oak trees. Plant,Cell and Environment 14, 251–259.
Reich P.B., Walters M.B., Ellsworth D.S. & Uhl C. (1994)Photosynthesis-nitrogen relations in Amazonian tree species. I.Patterns among species and communities. Oecologia 97, 62–72.
Reich P.B., Kloeppel B.D., Ellsworth D.S. & Walters M.B. (1995)Different photosynthesis-nitrogen relations in deciduous hardwoodand evergreen coniferous tree species. Oecologia 104, 24–30.
Sage R.F., Sharkey T.D. & Pearcy R.W. (1990) The effect of leafnitrogen and temperature on the CO2 response of photosynthesisin the C3 dicot Chenopodium album L. Australian Journal ofPlant Physiology 17, 135–148.
Saieed N.T., Douglas G.C. & Fry D.J. (1994) Somaclonal variationin growth, leaf phenotype and gas exchange characteristics ofpoplar: utilization of leaf morphotype analysis as a basis forselection. Tree Physiology 14, 17–26.
Sala A. & Tenhunen J.D. (1996) Simulations of canopy net photo-synthesis and transpiration in Quercus ilex L. under the influenceof seasonal drought. Agricultural and Forest Meteorology 78,203–222.
Sands P.J. (1995a) Modelling canopy production. I. Optimal distri-bution of photosynthetic resources. Australian Journal of PlantPhysiology 22, 593–601.
Sands P.J. (1995b) Modelling canopy production. II. From single-leaf photosynthetic parameters to daily canopy photosynthesis.Australian Journal of Plant Physiology 22, 603–614.
Schultz J.C., Nothnagle P.J. & Baldwin I.T. (1982) Seasonal andindividual variation in leaf quality of two northern hardwood treespecies. American Journal of Botany 69, 753–759.
Schulze, E.-D., Kelliher F.M., Körner C., Lloyd J. & Leuning R.(1994) Relationships among maximum stomatal conductance,ecosystem surface conductance, carbon assimilation rate, andplant nitrogen nutrition: a global ecology scaling exercise.Annual Review of Ecology and Systematics 25, 629–660.
Seemann J.R. & Berry J.A. (1982) Interspecific differences in thekinetic properties of RuBP carboxylase protein. CarnegieInstitution Year Book 81, 78–83.
Seemann J.R., Sharkey T.D., Wang J.L. & Osmond C.B. (1987)Environmental effects on photosynthesis, nitrogen-use effi-ciency, and metabolite pools in leaves of sun and shade plants.Plant Physiology 84, 796–802.
Sharkey T.D. (1985) Photosynthesis in intact leaves of C3 plants:physics, physiology and rate limitations. The Botanical Review51, 53–105.
Sims D.A. & Pearcy R.W. (1989) Photosynthetic characteristics ofa tropical forest understory herb, Alocasia macrorrhiza, and arelated crop species, Colocasia esculenta grown in contrastinglight environments. Oecologia 79, 53–59.
Spiller S. & Terry N. (1980) Limiting factors in photosynthesis. II.Iron stress diminishes photochemical capacity by reducing thenumber of photosynthetic units. Plant Physiology 65, 121–125.
Stitt M. & Schulze D. (1994) Does Rubisco control the rate of pho-tosynthesis and plant growth? An exercise in molecular ecophys-iology. Plant, Cell and Environment 17, 465–487.
St-Jacques C., Labrecque M. & Bellefleur P. (1991) Plasticity ofleaf absorptance in some broadleaf tree seedlings. BotanicalGazette 152, 195–202.
Sukenik A., Bennett J. & Falkowski P. (1987) Light-saturated pho-tosynthesis – limitation by electron transport or carbon fixation?Biochimica et Biophysica Acta 891, 205–215.
Syvertsen J.P., Lloyd J., McConchie C., Kriedemann P.E. &Farquhar G.D. (1995) On the relationship between leaf anatomyand CO2 diffusion through the mesophyll of hypostomatousleaves. Plant, Cell and Environment 18, 149–157.
Tenhunen J.D., Weber J.A., Yocum C.S. & Gates D.M. (1976)Development of a photosynthesis model with an emphasis onecological applications. I. Analysis of a data set describing thePm surface. Oecologia 26, 101–109.
Tenhunen J.D., Sala Serra A., Harley P.C., Dougherty R.L. &Reynolds J.F. (1990) Factors influencing carbon fixation andwater use by mediterranean sclerophyll shrubs during summerdrought. Oecologia 82, 381–393.
Tenhunen J.D., Hanano R., Abril M., Weiler E.W. & Hartung W.(1994) Above- and below-ground environmental influences onleaf conductance of Ceanothus thyrsiflorus growing in a cha-parral environment: drought response and the role of abscisicacid. Oecologia 99, 306–314.
Terashima I. & Evans J.R. (1988) Effects of light and nitrogennutrition on the organization of the photosynthetic apparatus inspinach leaves. Plant and Cell Physiology 29, 143–155.
Thompson W.A., Stocker G.C. & Kriedemann P.E. (1988) Growthand photosynthetic response to light and nutrients of Flindersiabrayleyana F. Muell., a rainforest tree with broad tolerance tosun and shade. Australian Journal of Plant Physiology 15,299–315.
Tjoelker M.G., Volin J.C., Oleksyn J. & Reich P.B. (1993) Lightenvironment alters response to ozone stress in seedlings of Acersaccharum Marsh. and hybrid Populus L. I. In situ net photo-synthesis, dark respiration and growth. The New Phytologist 124,627–636.
Tjoelker M.G., Volin J.C., Oleksyn J. & Reich P.B. (1995)Interaction of ozone pollution and light effects on photosynthesisin a forest canopy experiment. Plant, Cell and Environment 18,895–905.
Tooming H. (1967) Mathematical model of plant photosynthesisconsidering adaptation. Photosynthetica 1, 233–240.
Tselniker Y.L., Chetverikov A.G. & Andreyeva T.F. (1983) Effectsof irradiance on photosynthesis, ribulose 1,5-bisphosphatecarboxylase activity and photosynthetic unit in Populus tremula.Photosynthetica 17, 550–556.
Tucker G.F., Lassoie J.P. & Fahey T.J. (1993) Crown architectureof stand-grown sugar maple (Acer saccharum Marsh.) in theAdirondack Mountains. Tree Physiology 13, 297–310.
van den Boogaard R., Kostadinova S., Veneklaas E. & Lambers H.(1995) Association of water use efficiency and nitrogen use effi-ciency with photosynthetic characteristics of two wheatcultivars. Journal of Experimental Botany 46, 1429–1438.
Villar R., Held A.A. & Merino J. (1995) Dark leaf respiration inlight and darkness of an evergreen and a deciduous plant species.Plant Physiology 107, 421–427.
Vogelmann T.C. (1993) Plant tissue optics. Annual Review of PlantPhysiology and Plant Molecular Biology 44, 231–252.
Volin J.C., Tjoelker M.G., Oleksyn J. & Reich P.B. (1993) Lightenvironment alters response to ozone stress in seedlings of Acersaccharum Marsh. and hybrid Populus L. II. Diagnostic gasexchange and leaf chemistry. The New Phytologist 124, 637–646.
von Caemmerer S. & Farquhar G.D. (1984) Effects of partial defo-liation, changes of irradiance during growth, short-term waterstress and growth at enhanced p(CO2) on the photosyntheticcapacity of leaves of Phaseolus vulgaris L. Planta 160, 320–329.
© 1997 Blackwell Science Ltd, Plant, Cell and Environment, 20, 845–866

Carbon gain along light gradients in Acer 863
Wallace L.L. & Dunn E.L. (1980) Comparative photosynthesis ofthree gap phase successional tree species. Oecologia 45,331–340.
Walters M.B. & Field C.B. (1987) Photosynthetic light acclimationin two rainforest Piper species with different ecological ampli-tudes. Oecologia 72, 449–456.
Walters M.B., Kruger E.L. & Reich P.B. (1993) Growth, biomassdistribution and CO2 exchange of northern hardwood seedlingsin high and low light: relationships with successional status andshade tolerance. Oecologia 94, 7–16.
Weber J.A., Jurik T.W., Tenhunen J.D. & Gates D.M. (1985)Analysis of gas exchange in seedlings of Acer saccharum: inte-gration of field and laboratory studies. Oecologia 65, 338–347.
Wilhelm C. & Wild A. (1984) The variability of the photosyntheticunit in Chlorella. II. The effect of light intensity and cell devel-opment on photosynthesis, P700 and cytochrome f in homocon-tinuous and synchronous cultures of Chlorella. Journal of PlantPhysiology 115, 125–135.
Wullschleger S.D. (1993) Biochemical limitations to carbon assim-ilation in C3 plants – a retrospective analysis of the A/Ci curvesfrom 109 species. Journal of Experimental Botany 44, 907–920.
Zolg M. & Bornkamm R. (1981) Analytische Untersuchung anBlättern während des Alterungsprozesses vor dem Laubfall.Flora 171, 355–366.
Received 2 October 1996; received in revised form 8 January 1997;accepted for publication 25 January 1997
APPENDIX A: PARAMETER DERIVATION FORTEMPERATURE DEPENDENCE OF THE C3
PHOTOSYNTHESIS MODEL
Rubisco kineticsTemperature dependence of the specific activity ofRubisco, Vcr, is described as (cf. Johnson, Eyring &Williams 1942; Harley et al. 1992):
∆Ha
c– –––( RTk)
eVcr = –––––––––––––– , (A1)
∆STk – ∆Hd
––––––––––
1+e( RTk
)where R is the gas constant (8·314 J K–1 mol–1), Tk leaftemperature (K), ∆Ha an activation energy and ∆Hd a deac-tivation energy, ∆S an entropy term and c a scaling con-stant. The temperature dependence of light-saturated elec-tron transport rate per unit cyt f is similarly fitted (see thefollowing section), whereas other kinetic constants ofRubisco (cf. Eqn 1) – Kc, Ko, τ -, and Rd – are related totemperature according to:
∆Hac– –––
Parameter = e RTk (A2)
Temperature dependences of the kinetic parameters ofRubisco were obtained from Jordan & Ogren (1984) forpurified enzyme from Spinacia oleracea (Table A1).Several experimental studies have found differing in vivoRubisco specific activities among C3 species (e.g.Seemann & Berry 1982). Minor differences in amino acidsequences and in specific activity at 25 °C of Rubisco puri-fied from various C3 species are described by Parry et al.
(1987). Apparently, the Rubisco specificity factor calcu-lated for a given Ci may differ between species due to vary-ing internal transport resistances and CO2 concentrations atthe carboxylation site (Evans et al. 1994; Epron et al.1995).
Cytochrome f limitation of electron transport
Evans (1993a), considering the conservative structure ofelectron transport integrated within the thylakoid mem-branes, proposed a constant value of 148 mol e– (mol cytf)–1 s–1 for potential photosynthetic electron flow per unitcyt f, Jmc, at 25 °C in C3 plants. Use of several new datasources provides an updated value of 156 mol e– (mol cytf)–1 s–1 at 25 °C (Fig. A1). Accepting the latter estimate,we assumed that the temperature dependence of Jmc was ofthe form found for 2,6-dichlorophenolindophenol (DCIP)reduction by uncoupled chloroplasts of Hordeum vulgare(Nolan & Smillie 1976; Fig. A2), and a scaling factor,µmol electrons (µmol cyt f)–1/[µmol DCIP (g chl)–1], wasfound using a Jmc value of 156 µmol electrons (µmol cytf)–1 s–1 at 25 °C (slope of the regression in Fig. A1) toderive the temperature parameters of cyt f limitation ofelectron transport (Table A1). The temperature stability ofthylakoid membranes and consequently the shape of theresponse curve in Fig. A2 depend on growth temperatureand the genetic potentials of species (Björkman, Badger &Armond 1978; Berry & Björkman 1980). These adaptiveand regulatory phenomena, which may be associated withthe temperature parameters of thylakoid electron transport(Table A1), relate to the response of plants under high- and
© 1997 Blackwell Science Ltd, Plant, Cell and Environment, 20, 845–866
Table A1. Parameters describing temperature dependences (EqnsA1–A2) of the kinetic constants of Rubisco and photosyntheticelectron transport for C3 plants
Temperature constants
Model parameter* Parameter Value
Vcr [µmol CO2 c(Vcr) 32·9(g Rubisco)–1 s–1] ∆Ha(Vcr) 74000 J mol–1
∆Hd(Vcr) 203000 J mol–1
∆S(Vcr) 645 J K–1 mol–1
Kc (µmol mol–1) c(Kc) 38·08∆Ha(Kc) 80470 J mol–1
Ko (mmol mol–1) c(Ko) 11·88∆Ha(Ko) 14510 J mol–1
τ c(τ) –3·949∆Ha(τ) –28990 J mol–1
Jmc [µmol e– (µmol c(Jmc) 14·77cyt f)–1 s–1] ∆Ha(Jmc) 24100 J mol–1
∆Hd(Jmc) 564150 J mol–1
∆S(Jmc) 1810 J K–1 mol–1
*Temperature constants of Rubisco were derived from Jordan &Ogren (1984; Spinacia oleracea), and of photosynthetic electrontransport from Nolan & Smillie (1976; Hordeum vulgare; see alsoFig. A2).

864 Ü. Niinemets and J. D. Tenhunen
low-temperature stress. Such potential plant behaviourmay be very important to characterize, but it is not consid-ered in the current model version.
APPENDIX B: ESTIMATION OF FOLIARNITROGEN COST FOR LIGHT HARVESTING
Nitrogen investment in light harvesting depends on the con-centration and stoichiometry of chlorophyll protein com-plexes associated with photosystems I (PSI) and II (PSII),and with light-harvesting chlorophyll protein complexes ofPSII (LHCII) (Evans & Seemann 1989; Hikosaka &Terashima 1995). Apart from light-harvesting function,
certain thylakoid chlorophyll–protein complexes participatein electron transport, and according to the current model ofelectron transport (cf. Methods) their concentration shouldscale with cytochrome f. This holds in particular for theconcentration of photosystem II reaction centres, which isstrongly related to potential photosynthetic electron flow(Evans 1987; Hikosaka & Terashima 1995). In the light ofthis correlation, Hikosaka & Terashima (1995) took thecontent of PSII as being directly proportional to light-satu-rated net photosynthesis rate. However, a comparison ofactually measured PSII contents (data in Fig. B1) with thosecalculated according to Hikosaka & Terashima revealed anoverall poor fit (r2 = 0·55). Furthermore, their formulaappeared to consistently underestimate PSII content at lowvalues of leaf photosynthesis and overestimate at highervalues: for example, in Pisum sativum (Evans 1987) at agrowth irradiance of 80 µmol m–2 s–1 the mean oxygen evo-lution rate at saturating CO2 concentration and light was32·9 mmol O2 mol Chl–1 s–1, and the respective PSII con-tent 1·94 mmol (mol Chl)–1, but it was only 1·01 as based onthe model of Hikosaka & Terashima. This discrepancyarises because, apart from electron transport function, thecomplexing of thylakoid membranes always requires a cer-tain amount of PSII. Given this extra PSII, the slope of PSIIversus electron transport activity should increase withdecreasing capacity for photosynthetic electron transport.Therefore, a curvilinear relationship is appropriate to esti-mate PSII content from leaf electron transport potentials(Fig. B1). Taking the content of PSI as proportional to total
© 1997 Blackwell Science Ltd, Plant, Cell and Environment, 20, 845–866
Figure A1. Relationships between the capacity of photosyntheticelectron transport estimated from O2 evolution at saturatingirradiance and CO2 concentration, and cytochrome f content at25 °C. Rates of O2 evolution were converted to rates of electrontransport assuming that one molecule of O2 is released per fourelectrons driven through the photosynthetic electron transportchain. Data were standardized to a common temperature using thetemperature coefficients of photosynthetic electron transport givenin Table A1. Data are from Wilhelm & Wild (1984) (u), Evans(1987) (●, means per treatment), Chow & Anderson (1987a,b)(l), Lee & Whitmarsh (1989) (■), Evans & Terashima (1987)(n), Terashima & Evans (1988) (▲), and Chow, Adamson &Anderson (1991) (s).
Figure A2. Temperature dependence of the reduction of 2,6-dichlorophenolindophenol (DCIP) of uncoupled chloroplasts ofHordeum vulgare (●: Nolan & Smillie 1976) and ofphotosynthetic electron transport rate per unit cytochrome f, Jmc
(solid line, parameter values in Table A1), scaled as described inthe text to results from a number of C3 species (Fig. A1).
Figure B1. Dependence of thylakoid composition oncytochrome f content. Variability in thylakoid composition wasachieved by growing plants under different irradiances or atvarious nutrient availabilities. In the case of photosystem II, thecontents of total rather than functional photosystems are plotted(see e.g. Chow, Hope & Anderson 1989). All symbols are as inFig. A1, except for ◆: Beta vulgaris (Spiller & Terry 1980).

Carbon gain along light gradients in Acer 865
leaf chlorophyll (Fig. B1; Hikosaka & Terashima 1995),LHCII content is calculated from the difference betweentotal leaf chlorophyll and the chlorophyll associated withPSI and PSII (Hikosaka & Terashima 1995). Finally thefraction of leaf nitrogen in light harvesting, PL, is given as:
CC PC(PSI) PC(PSII) PC(LHCII) CCPL = ––– –––––– + –––––– + –––––––– = –––––– ,
Nm( CB(PSI) CB(PSII) CB(LHCII)
) Nm CB
(B1)
where CC is leaf chlorophyll concentration (mmol g–1),PC(PSI), PC(PSII) and PC(LHCII) are the fractions of leafchlorophyll associated with PSI, PSII and LHCII, respec-tively, and the chlorophyll bindings of the thylakoid pro-tein complexes used in the current model [0·858 mmolChl (g N)–1 for PSII, 2·18 for PSI and 2·75 for LHCII] arethose from Hikosaka & Terashima (1995). Since thechlorophyll binding of various thylakoid protein com-plexes is still not exactly known (Hikosaka & Terashima1995), CB for the whole leaf is defined in the model as theweighted average of chlorophyll bindings of PSI, PSII andLHCII. CB and PL may be estimated for a collection ofleaves where light response curves have been determined,since estimates of PB at light saturation provide values forcytochrome f content in each specific leaf which may beused with the relations from Fig. B1 to derive the fractionsof chlorophyll associated with PSI, PSII and LHCII.
APPENDIX C: DERIVATION OF Vcmax ANDJmax FROM PHOTOSYNTHESIS VERSUSLIGHT RESPONSE CURVES AT CURRENTAMBIENT CO2 CONCENTRATIONS
We assume that at present ambient CO2 concentrations thesaturated portion of the light response curve is determinedby Rubisco activity (Wc < Wj) (Fig. C1; see also Sukenik,Bennett & Falkowski 1987; Ögren 1993; Ögren & Evans1993). Thus, calculating the Ci value from Anmax and stom-atal conductance according to Fick’s law, correcting netphotosynthesis for non-photorespiratory losses of CO2
(Rn) to yield the gross photosynthesis rate (Agmax), andconsidering that all Rubisco is in the fully activated state,one may directly compute Vcmax. In so far as calculatedVcmax was relatively insensitive to Rn correction, weassume that Agmax = Anmax + 0·5Rn.
Considering that the light saturation of net assimilationis reached at an incident quantum flux density, Q, at whichWc = Wj (Fig. C1), the capacity for light reactions of photo-synthesis may be calculated from Wc and saturating Q(Qsat, Fig. C1). Writing
J CiWj = –––––––––– (C1)4(Ci + 2Γ*)
andVcmax CiWc = –––––––––––––– (C2)
OCi + Kc 1+ ––( Ko)
(Farquhar, von Caemmerer & Berry 1980; Harley &Tenhunen 1991), substituting Eqn 2 in Eqn C1, and reveal-ing Q at Wj = Wc gives Qsat as:
– 1–2
1 1 1Qsat = –– ––––––––––––––– – –––– · (C3)
α J2max2Γ* 2
16Wc2 1 + –––( ( Ci
) )The light-response curve of photosynthesis is abruptlytruncated only if the gradients in the light absorption andphotosynthetic potentials of leaf cells are identical acrossthe leaf. However, recent experimental evidence showsthat these gradients are not the same and that net photosyn-thesis saturates at higher Q values than those establishedby Eqn C3 (Evans, Jakobsen & Ögren 1993; Ögren 1993).
© 1997 Blackwell Science Ltd, Plant, Cell and Environment, 20, 845–866
Figure C1. Illustration of the light response of (a) netphotosynthesis and (b) the ratio of Wj to Wc in A. saccharum asaffected by the nitrogen partitioning between bioenergetics andcarboxylation (PB and PR). Tl and intercellular CO2 concentration(Ci) were fixed at representative values of 25 °C and 260 µmolmol–1, respectively. Leaf nitrogen concentration per unit dry mass(Nm), leaf dry mass per unit area (MA) and initial quantumconversion efficiency on an incident light basis (α) were heldconstant at 0·0154 g g–1, 45·3 g m–2 and 0·225 mol electrons (molquanta)–1, respectively. Wj equals Wc at the crossover point ofphotosynthetic light response, where photosynthesis becomeslimited by Wc. Photosynthetic quantum flux density (Q) at Wc = Wj
is termed saturating quantum flux density (Qsat, µmol m–2 s–1; seeEqn C3). PB, necessary for the same Qsat, increases with increasingAgmax (with increasing PR). 1: Qsat = 210; 2: Qsat = 500; 3: Qsat
= 255; 4: Qsat = 165.

866 Ü. Niinemets and J. D. Tenhunen
This would inevitably lead to an underestimation of Jmax.Nevertheless, in the paper of Ellsworth & Reich (1992a)Qsat was defined as the Q level required to reach 95% ofthe light-saturated value of net photosynthesis. Given theasymptotic nature of the photosynthesis versus quantumflux relationship, defining Qsat in this way may give a bet-ter basis for determination of Jmax from experimentallyestablished values of saturating quantum flux.
To test the applicability of the outlined method for calcu-lation of Vcmax and Jmax from net photosynthesis versuslight-response curves, the data of Sims & Pearcy (1989),which contain the dependences of photosynthesis on bothintercellular CO2 and incident Q, were re-analysed.Photosynthesis versus Q relationships were fitted by anempirical equation of Hanson et al. (1987):
Q1– ––
QcRnAn = Anmax 1– 1– ––––– , (C4)( Anmax)[ ]
where Rn is the dark respiration rate and Qc is Q at An = 0.We used this equation because it gave a good fit to the data(explained variance for non-linear regressions was always> 99·8%, on average 99·9%) and because Ellsworth &Reich (1992a) previously fitted the photosynthetic light-response curves of A. saccharum with it. Q for 95% Anmax
is given by:
RnLog 1– –––– – Log (0.05)( Anmax)
Qsat = Qc –––––––––––––––––––––––––– · (C5)RnLog 1– –––––( Anmax )
Using the temperature constants of Rubisco and photo-synthetic electron transport depicted in Table A1, Vcmax
and Jmax were estimated from photosynthesis versus Ci
curves as described in Wullschleger (1993), except that αwas calculated from leaf chlorophyll content according toan empirical equation of Evans (1993b; see also Eqn 6).
As may be suggested from the results presented in Fig.C2, the different methods gave very similar estimates forVcmax and Jmax. Though both were slightly underesti-
mated from light-response curves (Fig. C2), the ratios ofJmax/Vcmax from light- (2·62 ± 0·11) and CO2-responsecurves (2·62 ± 0·03) were not different (t-test, P > 0·9),signifying that the photosynthetic light-response curvesmeasured at current ambient CO2 concentrations may beused for derivation of the parameters of biochemicalphotosynthesis models. Although the definition of Qsat
as Q, which is necessary to reach 95% of Anmax, resultedin an excellent agreement between the values of Jmax
estimated from An versus Q and An versus Ci curves forthe herbs Alocasia macrorrhiza and Colocasiaesculenta, in the further development of the method oneneeds to define explicitly how Qsat is related to leafstructure and the gradients of light and photosyntheticcapacity across the leaves (e.g. Evans, Jakobsen &Ögren 1993; Ögren 1993). Nevertheless, given the simi-lar range of leaf dry mass per area and growth light envi-ronments for A. macrorrhiza, C. esculenta (Sims &Pearcy 1989) and for the seedlings of A. saccharum(Ellsworth & Reich 1992a), we suggest that the abovedefinition of Qsat should give Jmax values from An–Qcurves, which are in close agreement with those fromAn–Ci curves for A. saccharum.
© 1997 Blackwell Science Ltd, Plant, Cell and Environment, 20, 845–866
Figure C2. Relationships between Vcmax and Jmax obtained fromphotosynthetic light-response curves measured at an ambient CO2
concentration of 340 µmol mol–1, and between Vcmax and Jmax
calculated from photosynthesis versus intercellular CO2 curves.Data are from Sims & Pearcy (1989) for Alocasia macrorrhiza andColocasia esculenta. For Vcmax: y = 1·04x (r2 = 0·99, P < 0·001);for Jmax: y = 1·06x (r2 = 0·98, P < 0·001).