A mobile sensing architecture for massive urban scanning
6
A Mobile Sensing Architecture for Massive Urban Scanning Jo˜ ao G. P. Rodrigues † , Ana Aguiar † , Fausto Vieira † , Jo˜ ao Barros † and Jo˜ ao P. Silva Cunha ‡ Abstract— Mobile Sensor Networks based on connected ve- hicles and smart phones are poised to become key enablers in the development of sustainable and intelligent transportation systems in urban environments. By gathering and processing massive amounts of data in real-time, this form of information and communication infrastructure can be instrumental towards improving traffic flow, reducing carbon emissions and promot- ing multi-modal mobility and enhanced coordination among public transit systems. We propose a system architecture for a Massive Multi-Sensor Urban Scanner capable of acquiring large quantities of real-time information from a vast variety of sources and sending the data to a back-end data processing cloud using multiple communication interfaces. Requirements, technical challenges, design choices and first results are ex- plained in detail based on a prototype that is currently being deployed in Porto, Portugal. I. I NTRODUCTION Vehicles and smart phones have one thing in common: they come out of the factory with more and more sensors and different kinds of interfaces. If connected to each other and to a back-end cloud, they can form a massive urban scanner, i.e. a city-scale mobile sensor network that offers valuable information for city planners, traffic controllers, public trans- portation authorities, tourists and citizens alike. This is the goal of a large research effort currently under development in Porto, Portugal. The key ideas are illustrated in Figure 1. A vehicular network of about 500 vehicles, in most cases taxis and city buses equipped with mobile communication devices and IEEE 802.11p compliant radios, shall soon be gathering large amounts of data with on-board sensing units. This information will then be sent in real-time over multiple wireless interfaces to a cloud computing facility. Likewise, smart phones owned by volunteering citizens shall send additional sensor readings to the cloud, thus enhancing the outcomes of the estimation and decision processes that can be carried out to support a multitude of services. As an example, once combined with other data on the various transportation systems (e.g. their schedules and delays), this mobility cloud can compute multi-modal routes that satisfy certain user preferences (e.g. reduced carbon emissions or energy consumption), thus helping travelers who wish to navigate through multiple means of transportation simply using their smart phones. † Instituto de Telecomunicac ¸˜ oes, Departamento de Engenharia Elec- trot´ ecnica e Computadores, Faculdade de Engenharia da Universidade do Porto, Porto, Portugal ‡ Dep. de Electr´ onica, Telecomunicac ¸˜ oes e Inform´ atica and IEETA, Uni- versidade de Aveiro, Aveiro, Portugal Part of this work was supported by the Portuguese Foundation for Science and Technology (FCT) and the international partnership program MIT|Portugal under the MISC project MIT-PT/TS-ITS/0059/2008. Fig. 1. A Multi-Sensor Urban Scanner. We propose a system architecture for a massive multi- sensor urban scanner, which lays out the infrastructure for reliable data gathering and storage of city-scale data sets, making them widely available for processing and analysis. This platform relies on software applications (apps) to be installed in on-board computers and mobile phones of users who wish to participate and profit from such systems. Smart phones have been previously proposed as urban sen- sors [1], [2] and they are currently leveraged by commercial services, such as AirSage or Google for traffic estimation. But such sensing systems are mostly proprietary, commonly focus on a specific aspect of transportation systems and data is often gathered without explicit consent of the user. Parallel transportation Management Systems (PtMS) is an advanced holistic approach to transportation systems management that relies on a strong connection between the physical and the simulated world [3]. We propose a cyberphysical system that gather data on traffic, as well as vehicle, behavioral, social and environmental aspects of an urban area, that can feed such advanced management systems with massive amounts of historic and real-time data, enabling more realistic models for simulation as well as fast feedback for adaptive management. CarTel [4] has a similar approach, but gathers information solely from Global Positioning System (GPS) and On-Board Diagnostics (OBD). In our previous work [5], we showed how new generation wearable technologies can be integrated in an on-board unit to continuously monitor the driver’s heart wave, thus providing relevant information with respect to his fatigue and stress levels. The integration of physiological sensors enabling collection of information on driver behavior,
-
Upload
independent -
Category
Documents
-
view
0 -
download
0
Transcript of A mobile sensing architecture for massive urban scanning
A Mobile Sensing Architecture for Massive Urban Scanning
Joao G. P. Rodrigues†, Ana Aguiar†, Fausto Vieira†, Joao Barros† and Joao P. Silva Cunha‡
Abstract— Mobile Sensor Networks based on connected ve-hicles and smart phones are poised to become key enablers inthe development of sustainable and intelligent transportationsystems in urban environments. By gathering and processingmassive amounts of data in real-time, this form of informationand communication infrastructure can be instrumental towardsimproving traffic flow, reducing carbon emissions and promot-ing multi-modal mobility and enhanced coordination amongpublic transit systems. We propose a system architecture fora Massive Multi-Sensor Urban Scanner capable of acquiringlarge quantities of real-time information from a vast varietyof sources and sending the data to a back-end data processingcloud using multiple communication interfaces. Requirements,technical challenges, design choices and first results are ex-plained in detail based on a prototype that is currently beingdeployed in Porto, Portugal.
I. INTRODUCTION
Vehicles and smart phones have one thing in common:they come out of the factory with more and more sensors anddifferent kinds of interfaces. If connected to each other andto a back-end cloud, they can form a massive urban scanner,i.e. a city-scale mobile sensor network that offers valuableinformation for city planners, traffic controllers, public trans-portation authorities, tourists and citizens alike. This is thegoal of a large research effort currently under developmentin Porto, Portugal. The key ideas are illustrated in Figure 1.A vehicular network of about 500 vehicles, in most casestaxis and city buses equipped with mobile communicationdevices and IEEE 802.11p compliant radios, shall soon begathering large amounts of data with on-board sensing units.This information will then be sent in real-time over multiplewireless interfaces to a cloud computing facility. Likewise,smart phones owned by volunteering citizens shall sendadditional sensor readings to the cloud, thus enhancing theoutcomes of the estimation and decision processes that canbe carried out to support a multitude of services. As anexample, once combined with other data on the varioustransportation systems (e.g. their schedules and delays), thismobility cloud can compute multi-modal routes that satisfycertain user preferences (e.g. reduced carbon emissions orenergy consumption), thus helping travelers who wish tonavigate through multiple means of transportation simplyusing their smart phones.
†Instituto de Telecomunicacoes, Departamento de Engenharia Elec-trotecnica e Computadores, Faculdade de Engenharia da Universidade doPorto, Porto, Portugal
‡Dep. de Electronica, Telecomunicacoes e Informatica and IEETA, Uni-versidade de Aveiro, Aveiro, Portugal
Part of this work was supported by the Portuguese Foundation forScience and Technology (FCT) and the international partnership programMIT|Portugal under the MISC project MIT-PT/TS-ITS/0059/2008.
Fig. 1. A Multi-Sensor Urban Scanner.
We propose a system architecture for a massive multi-sensor urban scanner, which lays out the infrastructure forreliable data gathering and storage of city-scale data sets,making them widely available for processing and analysis.This platform relies on software applications (apps) to beinstalled in on-board computers and mobile phones of userswho wish to participate and profit from such systems.
Smart phones have been previously proposed as urban sen-sors [1], [2] and they are currently leveraged by commercialservices, such as AirSage or Google for traffic estimation.But such sensing systems are mostly proprietary, commonlyfocus on a specific aspect of transportation systems and datais often gathered without explicit consent of the user.
Parallel transportation Management Systems (PtMS) isan advanced holistic approach to transportation systemsmanagement that relies on a strong connection betweenthe physical and the simulated world [3]. We propose acyberphysical system that gather data on traffic, as wellas vehicle, behavioral, social and environmental aspects ofan urban area, that can feed such advanced managementsystems with massive amounts of historic and real-timedata, enabling more realistic models for simulation as wellas fast feedback for adaptive management. CarTel [4] hasa similar approach, but gathers information solely fromGlobal Positioning System (GPS) and On-Board Diagnostics(OBD). In our previous work [5], we showed how newgeneration wearable technologies can be integrated in anon-board unit to continuously monitor the driver’s heartwave, thus providing relevant information with respect tohis fatigue and stress levels. The integration of physiologicalsensors enabling collection of information on driver behavior,
online or offline, eases gathering data on behavioral responseof trainees and learners, and developing more accurate be-havioral models, empowering another component of PtMS.
Our main contributions are 1) the description of themain challenges and design choices pertaining the proposedsystem in Section II; 2) the discussion of the implicationsof integrating various classes of sensors in a massive urbanscanner in Section III; 3) a discussion of how data is or-ganized and stored; and 4) the illustration of the capabilitiesof the proposed system in Section VI for an example thatcorrelates fuel consumption, speed and vehicle trajectory.
The main novelty of the proposed system architectureis its tiered back-end server structure and the scalable andtransparent way in which it is able to accommodate for largenumbers of heterogeneous information sources.
II. MAIN APPLICATIONS AND SYSTEM ARCHITECTURE
A. Examples of Applications
The proposed system architecture is motivated by a num-ber of applications to be implemented in close collaborationwith public transportation authorities in Porto, Portugal. It istherefore useful to explain the targeted applications, beforeproceeding with the technical description of our system:
• Real-Time Traffic Estimation: The proposed platformgathers, processes and shares information , which canbe used to infer the traffic status of a city in useful time.
• Real-Time Estimation of Energy Efficiency and CarbonEmissions: Based on the make of a vehicle, its oper-ational parameters such as speed of travel, occupancyand type of fuel used, it is possible to compute reliableestimates of energy consumption and carbon emissionsto travel from point A to point B. The proposed systemcan make such data available to support the decisionsof travelers and transportation systems.
• Multi-Modal Route Optimization: Using the traffic con-gestion and emission estimates obtained from real-time data, the calculation of the best route betweentwo locations can target the minimization of differenttarget functions beyond traditional measures such asdistance and time, including total emissions and energyconsumption. Rather than expecting human travelers tomake decisions based on deterministic routes and staticschedules, the availability of massive quantities of real-time data can be leveraged to guide a user throughouthis chosen route across multiple transportation modesin a simple, rational and efficient way, while adaptingthe indications in real-time.
• Personalized Mobility Recommendations: Moreover, themassive amount of data gathered by a user can be usefulin inferring his routines and suggesting improvementsto each one’s specific demands, in terms of time, costor environmental footprint. Suggestions can range frommodality change to ride sharing with other user withsimilar routes (in origin, destination and time), but canalso simply be raising awareness to how much emis-sions would be saved by choosing another modality.
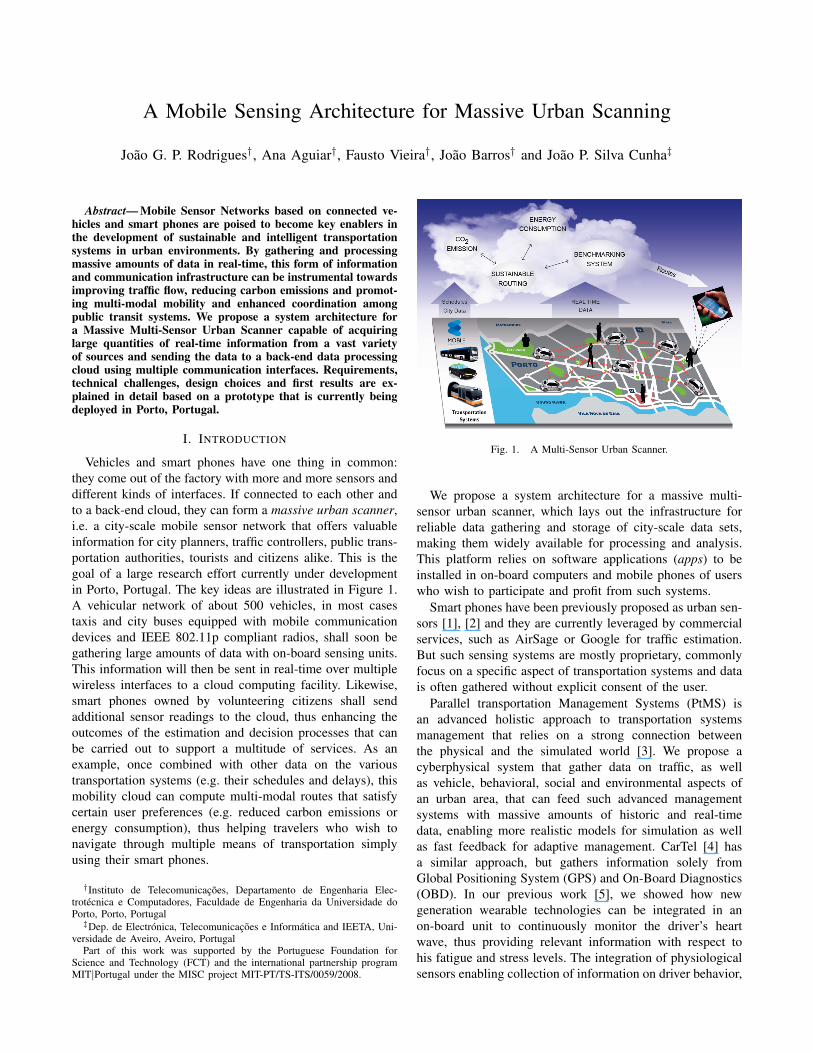
Fig. 2. System Architecture
• Expanded Citizen Information: A further application ofthe platform is its use for improving the informationavailable to users, like geo-indexed pollution or noisemaps, or benchmarking fuel consumption or emissionsacross vehicles, for different trips and various times ofday, enabling more informed decisions to be made aboutcar makes, fuel brands, routes or trips.
First results showing how the proposed architecture cansupport some of these services are presented in Section VI.
B. System Architecture
The proposed system architecture is illustrated in Fig. 2.There are three main building blocks: sensing technologies,data gathering units and back-end servers. The gatheringunits collect data acquired by the sensors. This can be a car-PC installed in a vehicle or an application running on hissmartphone. Said units are also responsible for aggregating,synchronizing and securely transmitting the data to theservers. The sensors and gathering units are autonomous andtransparent to the user, requiring minimal user interaction. Inpresent, physiological sensors analyzing the user can be non-intrusive, thus avoiding obtaining biased readings.
The primary function of the servers is to store the dataand ensure its integrity, security, and availability. Servicesrunning on the main server are kept to a minimum in orderto guarantee high uptime and sufficient bandwidth. The dataretrieval, analysis and visualization is offered via the Interneton one or more secondary servers, considering user definedprivacy policies.
The functionalities and operation modes of the differentsystem components are explained in the following sections.
III. SENSING AND DATA ACQUISITION
Sensors perform the basic data acquisition functionalitiesof the system. These sensors can be embedded in thegathering unit, such as GPS receivers in smartphones, orconnected via an interface such as USB or bluetooth.
A. Classes of Sensors1) Wifi Monitoring: This module periodically detects wifi
devices within range, acquiring information from the beaconpackets. For every device detected, a timestamp is saved,as are mac address, received signal strength and noise, ifavailable. When a new device is detected for the first time,we additionally gather its essid, channel, type (AP, Repeater,Ad-Hoc, etc) and protection mode (Open, WEP, WPA, etc).
The information gathered by this module can be very use-ful in designing new communication methods and analyzingthe security trends of deployed wireless devices.
2) Bluetooth Monitoring: Our system also integratesa bluetooth monitoring module that periodically inquiriesnearby bluetooth devices. It saves the timestamp, mac ad-dress and received signal strength of every device detected.Like the Wifi module, static information is only saved oncefor each device, such as its mac address, name and class.
It has been shown before that the bluetooth device densityis highly correlated to human density, and thus can be usedto estimate bus utilization ratio [6].
3) GPS - Global Positioning System: Navigation systemsare becoming very common in modern vehicles. However,existing integrated systems typically do not allow a user toretrieve GPS information.
In our system we created a module that can gatherGPS data from a wide range of GPS receivers, which arecommonly available in electronic stores. Such devices aretypically connected via USB or bluetooth to a computer, anduse an emulated serial connection to transmit GPS sentences.
From this GPS setup we decided to gathered two kinds ofdata. First, typical GPS data, known as Time-Position-Speed(TPV) values provides information on latitude, longitude,altitude, direction, speed, vertical speed and error estimationsof almost all of these variables. Moreover, this location infor-mation is timestamped with the corresponding epoch time.Second, information about the current Skyview, consistingof a Satellite ID, Elevation, Azimuth, and Received SignalStrength, for every satellite detected by the GPS receiver,which can be very useful for, e. g. mathematical studieson how to improve GPS precision using link info from allsatellites. GPS information, mainly TPV, is very importantfor a system like ours because it allows us to correlate theposition with data from other sensors.
Common devices have an horizontal precision of about9m, and report a new TPV and Skyview once per second.At this rate, in a vehicle moving at 50 km/h, we can gathera new TPV and Skyview set every 14m of road, per vehicle.
4) OBD - On Board Diagnostics: On-Board Diagnostics(OBD) is a system present in almost every vehicle producedsince 1996, which offers them self-diagnostic and reportingcapabilities. The OBD system is accessible through a stan-dard connector which is always near the driver seat, and usesa digital communication protocol, such as CAN, to queryinformation from the connected vehicle sub-systems.
There are many commercially available tools that connectto an OBD port and are capable of gathering data in real-time from more than 50 different sensors. These tools usually
provide a USB or Bluetooth connection and allow the userto query data from any sensor, processing between 5 and50 queries per second, depending on the device and vehicle.Our system can automatically detect connected OBD-toolsand use them to acquire information from a large sensor pool,including vehicle reported speed (km/h), engine rotations perminute (RPM), accelerator pedal position (%), engine load(%), Fuel Rate (L/h), mass air flow (g/s), mass air pressure(kPa), in-take air temperature (C), ambient air temperature(C). Our module detects the speed and sensors available andadapts the list and rate of automatically, in order to maximizethe usefulness of acquired data. Other data is gathered only atthe beginning of each trip, such as the Vehicle IdentificationNumber (VIN), Fuel Type and vehicle Mileage.
Correlation of GPS data with data acquired by an OBDsystem can result in very useful information, such as a mapof the average speed or pollution per street segment, andthe creation of an individual driving profile in terms offuel-efficiency. However, the variable number of queries persecond allowed by the OBD devices can be a big limitationwhen analyzing driver input. For example, a slow samplingrate can make a fast gear-change pass undetected in the dataacquired from the pedal-position sensors.
5) Video and Audio: Video cameras pointing to the inte-rior of the vehicle can be used to analyze driver status andbehavior, while pointing to the exterior provide context aboutthe environment, such as traffic and road conditions. Audiorecording is usually carried out in the interior and capturedby the smartphone or car-PC microphone.
By default, video and audio data is streamed to a tem-porary 30s buffer, but it is only recorded in the case ofan unusual event. An event detector operating over all thesensors, including this buffer, searches for such events, likeaggressive turning or breaking (OBD, Accelerometers), col-lisions (OBD), traffic jam (Video), cardiac arrest and strongemotional responses as explained below, and an extremelyloud noise such as shouting (Audio). When such an eventis detected, the data from this buffer is copied to a file aswell as the upcoming video stream until the event is nolonger detected. With the 30 seconds of video and audiopreceding an event, the user or researcher can better analyzethe conditions leading to the event. However, for privacyreasons, video and audio data are not sent to our server bydefault. Users can choose to opt-in and help research, anddecide which kind of events shall be shared.
6) Accelerometer: Our system is also capable of gather-ing data from accelerometers. These sensors are nowadayspresent in many integrated devices, such as smartphones, andcan give us useful information about the environment anduser behavior. The most common and available accelerome-ters have a typical range in the order of [-4, 4] Gs with 8 bitprecision and a sample-rate between 10 Hz and 100 Hz ineach of the 3-axis. For consistency reasons, we decided togather accelerometer data at 10 Hz and 8 bits resolution.
With this data we can infer drivers’ driving and steeringaggressiveness, as well as use it to predict or improve carlocation in GPS grey-zones.
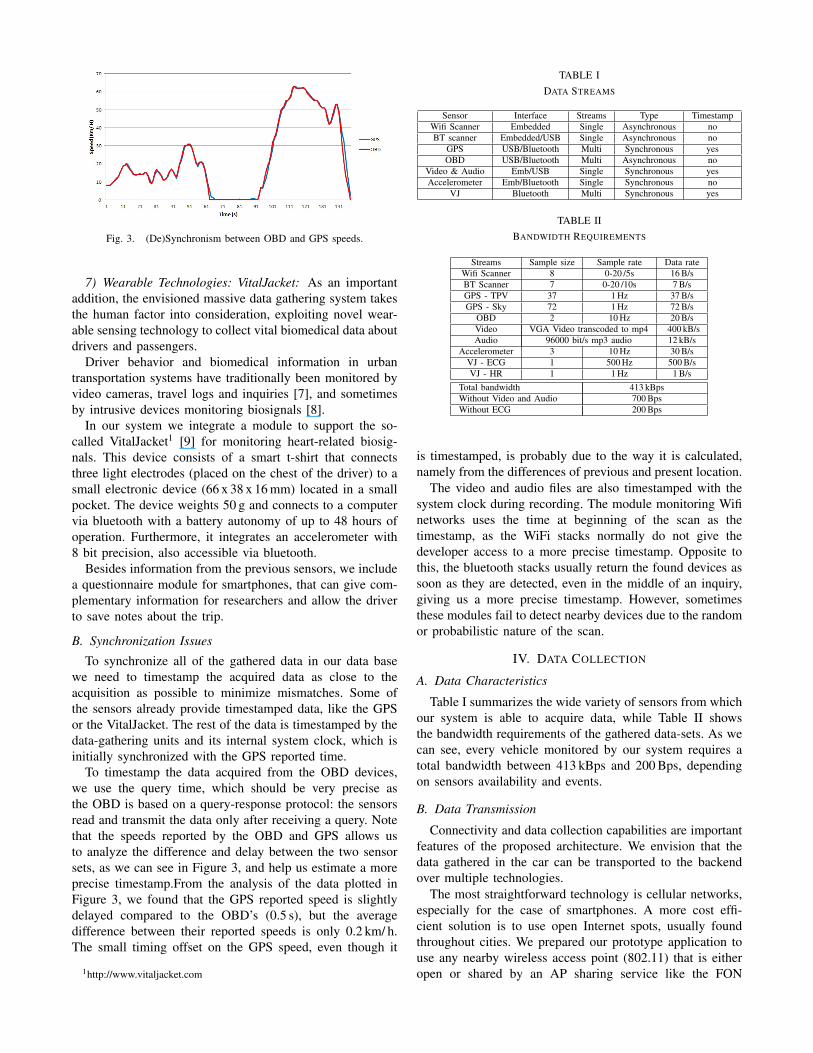
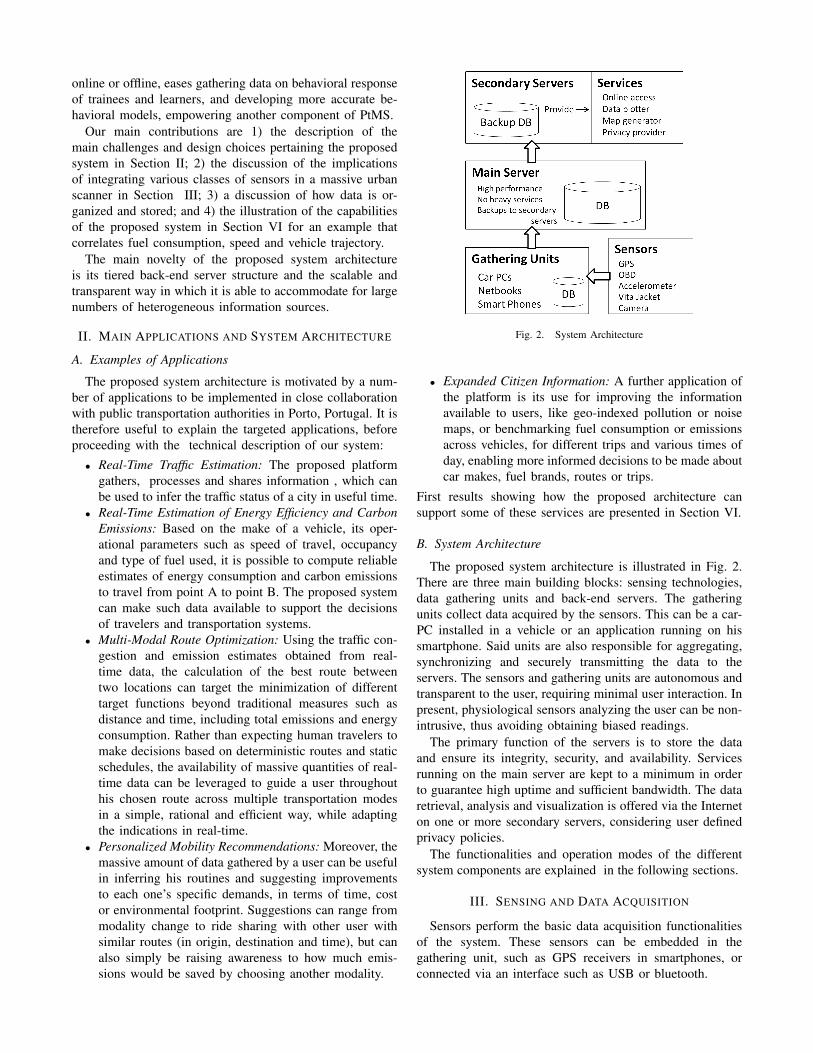
Fig. 3. (De)Synchronism between OBD and GPS speeds.
7) Wearable Technologies: VitalJacket: As an importantaddition, the envisioned massive data gathering system takesthe human factor into consideration, exploiting novel wear-able sensing technology to collect vital biomedical data aboutdrivers and passengers.
Driver behavior and biomedical information in urbantransportation systems have traditionally been monitored byvideo cameras, travel logs and inquiries [7], and sometimesby intrusive devices monitoring biosignals [8].
In our system we integrate a module to support the so-called VitalJacket1 [9] for monitoring heart-related biosig-nals. This device consists of a smart t-shirt that connectsthree light electrodes (placed on the chest of the driver) to asmall electronic device (66 x 38 x 16 mm) located in a smallpocket. The device weights 50 g and connects to a computervia bluetooth with a battery autonomy of up to 48 hours ofoperation. Furthermore, it integrates an accelerometer with8 bit precision, also accessible via bluetooth.
Besides information from the previous sensors, we includea questionnaire module for smartphones, that can give com-plementary information for researchers and allow the driverto save notes about the trip.
B. Synchronization Issues
To synchronize all of the gathered data in our data basewe need to timestamp the acquired data as close to theacquisition as possible to minimize mismatches. Some ofthe sensors already provide timestamped data, like the GPSor the VitalJacket. The rest of the data is timestamped by thedata-gathering units and its internal system clock, which isinitially synchronized with the GPS reported time.
To timestamp the data acquired from the OBD devices,we use the query time, which should be very precise asthe OBD is based on a query-response protocol: the sensorsread and transmit the data only after receiving a query. Notethat the speeds reported by the OBD and GPS allows usto analyze the difference and delay between the two sensorsets, as we can see in Figure 3, and help us estimate a moreprecise timestamp.From the analysis of the data plotted inFigure 3, we found that the GPS reported speed is slightlydelayed compared to the OBD’s (0.5 s), but the averagedifference between their reported speeds is only 0.2 km/ h.The small timing offset on the GPS speed, even though it
1http://www.vitaljacket.com
TABLE IDATA STREAMS
Sensor Interface Streams Type TimestampWifi Scanner Embedded Single Asynchronous noBT scanner Embedded/USB Single Asynchronous no
GPS USB/Bluetooth Multi Synchronous yesOBD USB/Bluetooth Multi Asynchronous no
Video & Audio Emb/USB Single Synchronous yesAccelerometer Emb/Bluetooth Single Synchronous no
VJ Bluetooth Multi Synchronous yes
TABLE IIBANDWIDTH REQUIREMENTS
Streams Sample size Sample rate Data rateWifi Scanner 8 0-20 /5s 16 B/sBT Scanner 7 0-20 /10s 7 B/sGPS - TPV 37 1 Hz 37 B/sGPS - Sky 72 1 Hz 72 B/s
OBD 2 10 Hz 20 B/sVideo VGA Video transcoded to mp4 400 kB/sAudio 96000 bit/s mp3 audio 12 kB/s
Accelerometer 3 10 Hz 30 B/sVJ - ECG 1 500 Hz 500 B/sVJ - HR 1 1 Hz 1 B/s
Total bandwidth 413 kBpsWithout Video and Audio 700 BpsWithout ECG 200 Bps
is timestamped, is probably due to the way it is calculated,namely from the differences of previous and present location.
The video and audio files are also timestamped with thesystem clock during recording. The module monitoring Wifinetworks uses the time at beginning of the scan as thetimestamp, as the WiFi stacks normally do not give thedeveloper access to a more precise timestamp. Opposite tothis, the bluetooth stacks usually return the found devices assoon as they are detected, even in the middle of an inquiry,giving us a more precise timestamp. However, sometimesthese modules fail to detect nearby devices due to the randomor probabilistic nature of the scan.
IV. DATA COLLECTION
A. Data Characteristics
Table I summarizes the wide variety of sensors from whichour system is able to acquire data, while Table II showsthe bandwidth requirements of the gathered data-sets. As wecan see, every vehicle monitored by our system requires atotal bandwidth between 413 kBps and 200 Bps, dependingon sensors availability and events.
B. Data Transmission
Connectivity and data collection capabilities are importantfeatures of the proposed architecture. We envision that thedata gathered in the car can be transported to the backendover multiple technologies.
The most straightforward technology is cellular networks,especially for the case of smartphones. A more cost effi-cient solution is to use open Internet spots, usually foundthroughout cities. We prepared our prototype application touse any nearby wireless access point (802.11) that is eitheropen or shared by an AP sharing service like the FON
Movement (http://corp.fon.com/). This option provides uswith bursts of high-speed connectivity at certain locationand times, which can be predicted using our own data ongathering Wifi networks.
On the other hand, wireless communications have bottle-necks that cannot be completely eliminated for every placeand scenario. The local 3G network can have grey-spotsor be inexistent, while open APs are not always present.However, in the future, DSRC-based VANET will likelyachieve significant market penetration, thus increasing thewireless reachability and allowing for more VANET-basedcommunications to take place. In dense network scenarios,this solution can greatly improve the network capacity, allow-ing the data to quickly reach a Road-side Unit (RSU) or openAP. Our prototype applications for in-car units and mobiledevices allow the user to choose the type of connections thathe wishes to use.
C. Security and Privacy Considerations
We use public-key cryptography to authenticate a user atthe beginning of each trip and negotiate parameters for thedata to be gathered in that trip, such as trip id and a key tosign the data. Authentication and integrity of the data sentby the gathering units is guaranteed by a digital signature.
Regarding privacy, we have taken three different ap-proaches: we give users control of their participation, weseparate and protect the database table containing the datathat identifies each user, and we enable each user to definea privacy policy for its data. First, our applications empowerthe user to decide when to send data and which data tosend, gathering data only from users that voluntarily andconsciously decide to participate in the urban scanner whenthey choose to do so. Second, the identification of a useris saved in a separate table in the database with restrictedaccess, and it is not copied to the secondary servers, sothat services do not have access to any data that directlyidentifies the user. Finally, our system provides for flexibleprivacy policies to be defined by each user and depending onthe user type. This enables, for example, that only a user hasfull access to his own data, a company has access to the datafrom all its vehicles, while traffic management companies orpublic transportation authorities may have access to all non-personal shared data.
V. BACK-END SERVERS
The gathered data is sent to the backend servers, whereit is stored, analyzed and visualized. As shown in Figure 2,our backend servers can have two distinct roles, as a mainor secondary server.
Main servers are responsible to collect data from the gath-ering units, in a secure and reliable way. They need to have avery high storage capacity and a reliable Internet connectionwith very low downtimes. Although this connections have avery low bandwidth requirements, as seen in Table II, thetotal bandwidth and storage space used by the system canbecome very high as the number of gathering units increases.For example, if a public transportation company with 500
vehicles running for 8 hours a day were to use gatheringunits in every vehicle, it would gather more than 3 GB ofdata per day.
However, data analysis and visualization requires a muchhigher processing power, often requiring access to manydifferent tables and rows, located in different places on thehard-drives. Moreover, a malformed or non-optimized readoperation in a database can result in a read-and-process overthe entire dataset, which can take a very long time even forsmall datasets. To reduce the burden on the main servers,we decided to implement these services on a different set ofservers, called secondary servers. These servers constantlyreceive data from the main server, with either the completedata-set or a specialized sub-set of information, such asinformation from a group of vehicles/drivers belonging toa transportation company.
The system core has been designed in a modular structurebased on tiered servers with different roles, thus allowingthe current system that is running on two physical servers,expand to multiple servers in order to provide load balancingand scalability.
A. Database Structure
In this system we decided to store the data in a relationaldatabase (MySQL), instead of a key-value one, because itis easier and faster for correlating the data between thedifferent sensors through their indexed-keys, such as time andtrip id. Furthermore, one of the main drawback of relationaldatabases was internally solved by our backend architecture,by separating the write-intensive main server from the read-intensive secondary ones, preventing complex operationsfrom crashing and slowing down the main server.
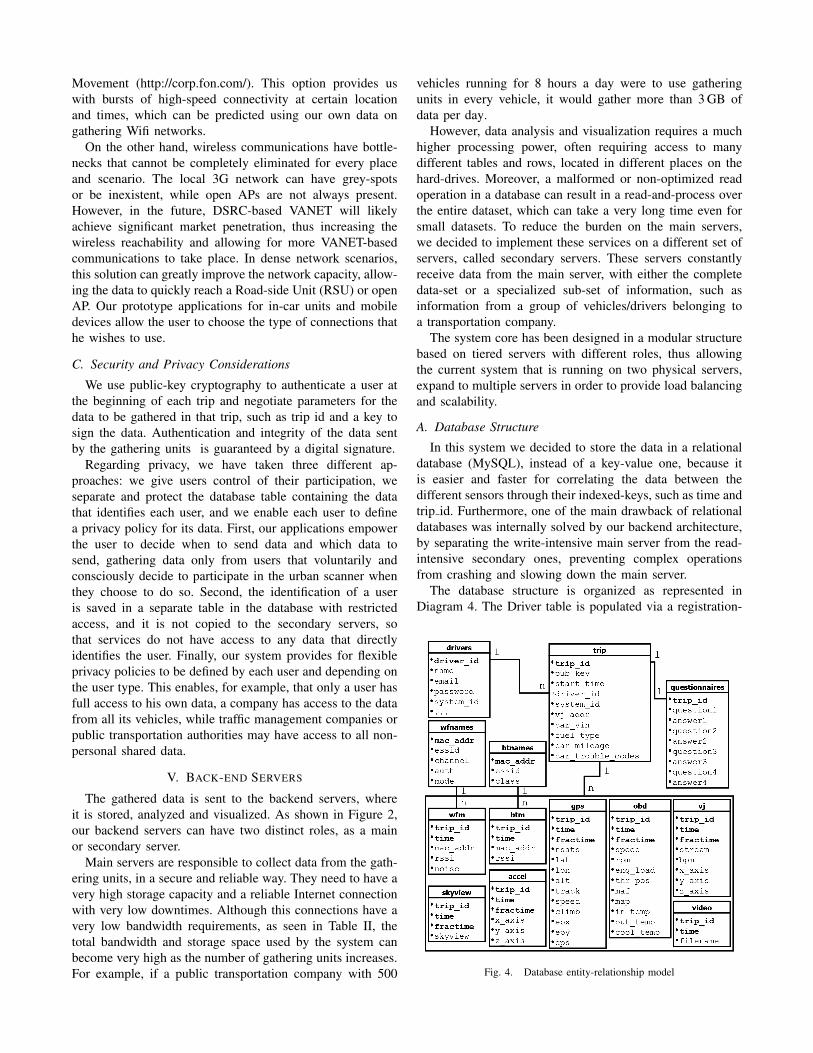
The database structure is organized as represented inDiagram 4. The Driver table is populated via a registration-
Fig. 4. Database entity-relationship model
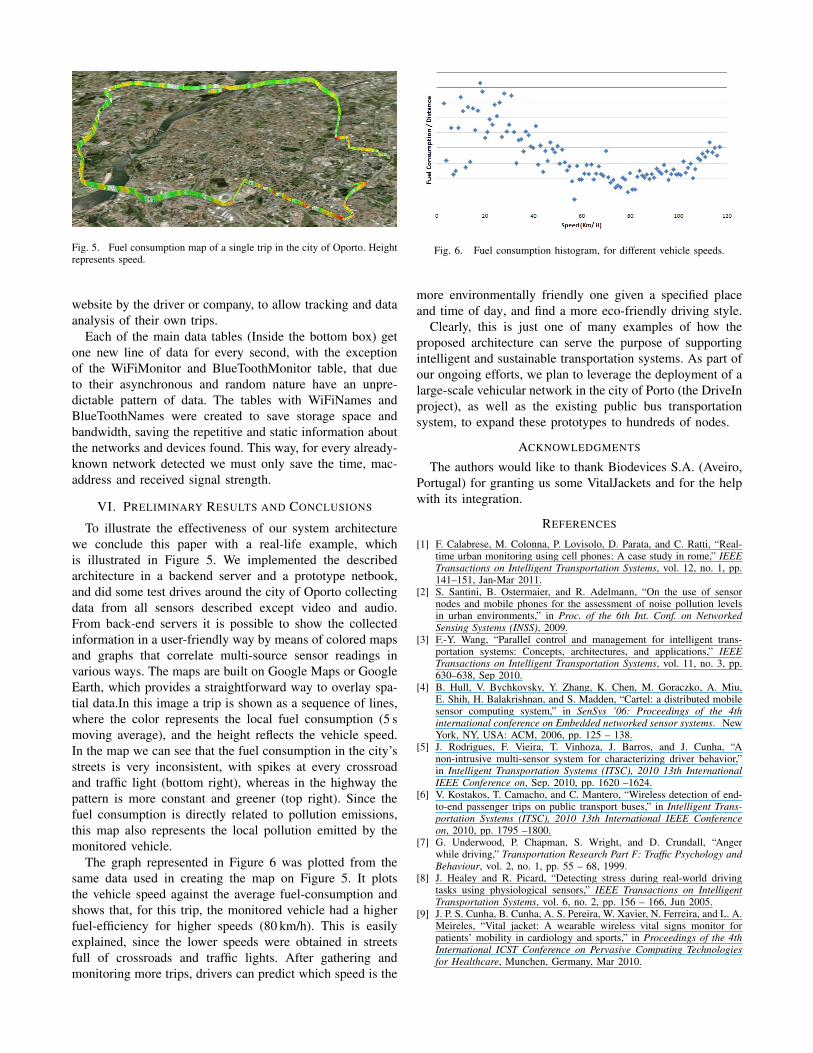
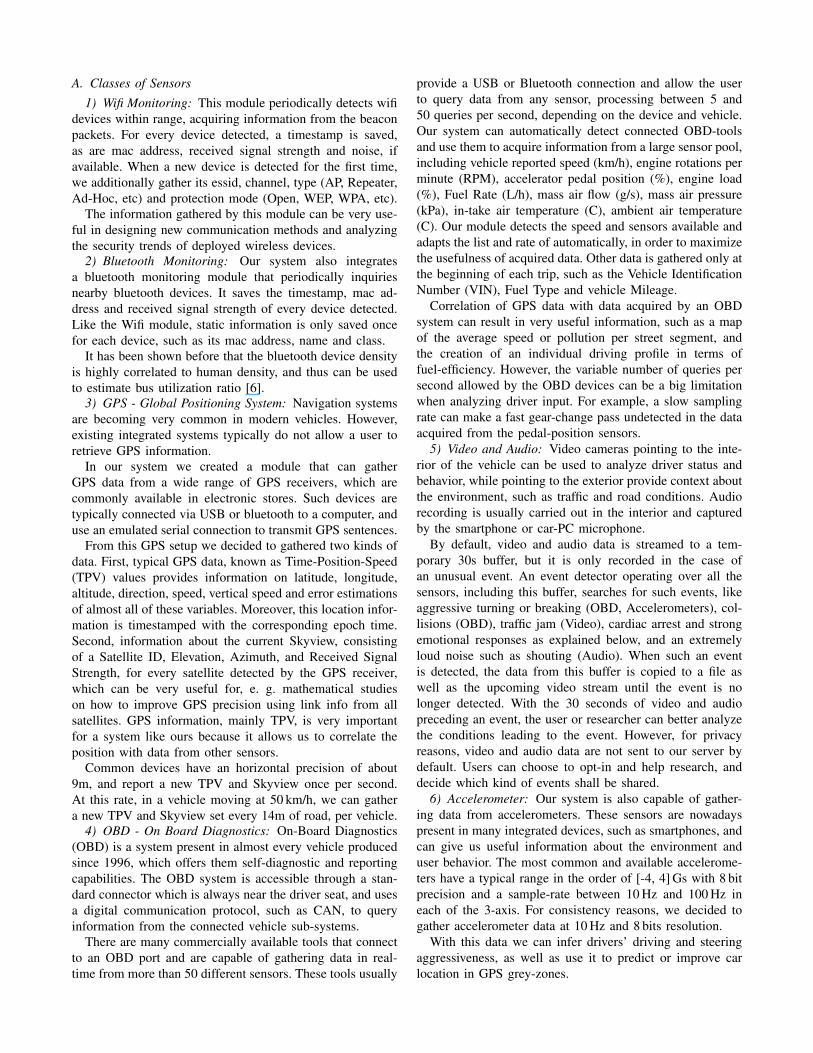
Fig. 5. Fuel consumption map of a single trip in the city of Oporto. Heightrepresents speed.
website by the driver or company, to allow tracking and dataanalysis of their own trips.
Each of the main data tables (Inside the bottom box) getone new line of data for every second, with the exceptionof the WiFiMonitor and BlueToothMonitor table, that dueto their asynchronous and random nature have an unpre-dictable pattern of data. The tables with WiFiNames andBlueToothNames were created to save storage space andbandwidth, saving the repetitive and static information aboutthe networks and devices found. This way, for every already-known network detected we must only save the time, mac-address and received signal strength.
VI. PRELIMINARY RESULTS AND CONCLUSIONS
To illustrate the effectiveness of our system architecturewe conclude this paper with a real-life example, whichis illustrated in Figure 5. We implemented the describedarchitecture in a backend server and a prototype netbook,and did some test drives around the city of Oporto collectingdata from all sensors described except video and audio.From back-end servers it is possible to show the collectedinformation in a user-friendly way by means of colored mapsand graphs that correlate multi-source sensor readings invarious ways. The maps are built on Google Maps or GoogleEarth, which provides a straightforward way to overlay spa-tial data.In this image a trip is shown as a sequence of lines,where the color represents the local fuel consumption (5 smoving average), and the height reflects the vehicle speed.In the map we can see that the fuel consumption in the city’sstreets is very inconsistent, with spikes at every crossroadand traffic light (bottom right), whereas in the highway thepattern is more constant and greener (top right). Since thefuel consumption is directly related to pollution emissions,this map also represents the local pollution emitted by themonitored vehicle.
The graph represented in Figure 6 was plotted from thesame data used in creating the map on Figure 5. It plotsthe vehicle speed against the average fuel-consumption andshows that, for this trip, the monitored vehicle had a higherfuel-efficiency for higher speeds (80 km/h). This is easilyexplained, since the lower speeds were obtained in streetsfull of crossroads and traffic lights. After gathering andmonitoring more trips, drivers can predict which speed is the
Fig. 6. Fuel consumption histogram, for different vehicle speeds.
more environmentally friendly one given a specified placeand time of day, and find a more eco-friendly driving style.
Clearly, this is just one of many examples of how theproposed architecture can serve the purpose of supportingintelligent and sustainable transportation systems. As part ofour ongoing efforts, we plan to leverage the deployment of alarge-scale vehicular network in the city of Porto (the DriveInproject), as well as the existing public bus transportationsystem, to expand these prototypes to hundreds of nodes.
ACKNOWLEDGMENTS
The authors would like to thank Biodevices S.A. (Aveiro,Portugal) for granting us some VitalJackets and for the helpwith its integration.
REFERENCES
[1] F. Calabrese, M. Colonna, P. Lovisolo, D. Parata, and C. Ratti, “Real-time urban monitoring using cell phones: A case study in rome,” IEEETransactions on Intelligent Transportation Systems, vol. 12, no. 1, pp.141–151, Jan-Mar 2011.
[2] S. Santini, B. Ostermaier, and R. Adelmann, “On the use of sensornodes and mobile phones for the assessment of noise pollution levelsin urban environments,” in Proc. of the 6th Int. Conf. on NetworkedSensing Systems (INSS), 2009.
[3] F.-Y. Wang, “Parallel control and management for intelligent trans-portation systems: Concepts, architectures, and applications,” IEEETransactions on Intelligent Transportation Systems, vol. 11, no. 3, pp.630–638, Sep 2010.
[4] B. Hull, V. Bychkovsky, Y. Zhang, K. Chen, M. Goraczko, A. Miu,E. Shih, H. Balakrishnan, and S. Madden, “Cartel: a distributed mobilesensor computing system,” in SenSys ’06: Proceedings of the 4thinternational conference on Embedded networked sensor systems. NewYork, NY, USA: ACM, 2006, pp. 125 – 138.
[5] J. Rodrigues, F. Vieira, T. Vinhoza, J. Barros, and J. Cunha, “Anon-intrusive multi-sensor system for characterizing driver behavior,”in Intelligent Transportation Systems (ITSC), 2010 13th InternationalIEEE Conference on, Sep. 2010, pp. 1620 –1624.
[6] V. Kostakos, T. Camacho, and C. Mantero, “Wireless detection of end-to-end passenger trips on public transport buses,” in Intelligent Trans-portation Systems (ITSC), 2010 13th International IEEE Conferenceon, 2010, pp. 1795 –1800.
[7] G. Underwood, P. Chapman, S. Wright, and D. Crundall, “Angerwhile driving,” Transportation Research Part F: Traffic Psychology andBehaviour, vol. 2, no. 1, pp. 55 – 68, 1999.
[8] J. Healey and R. Picard, “Detecting stress during real-world drivingtasks using physiological sensors,” IEEE Transactions on IntelligentTransportation Systems, vol. 6, no. 2, pp. 156 – 166, Jun 2005.
[9] J. P. S. Cunha, B. Cunha, A. S. Pereira, W. Xavier, N. Ferreira, and L. A.Meireles, “Vital jacket: A wearable wireless vital signs monitor forpatients’ mobility in cardiology and sports,” in Proceedings of the 4thInternational ICST Conference on Pervasive Computing Technologiesfor Healthcare, Munchen, Germany, Mar 2010.