A mixed-integer optimization model for electricity infrastructure development
20
Energy Syst (2013) 4:79–98 DOI 10.1007/s12667-012-0067-8 A mixed-integer optimization model for electricity infrastructure development Todd Levin · Valerie M. Thomas Received: 12 April 2012 / Accepted: 23 July 2012 / Published online: 21 August 2012 © Springer-Verlag 2012 Abstract We formulate a mixed-integer program that can be used to analyze the deci- sion between centralized and decentralized technologies for new energy infrastructure development. The formulation minimizes the cost of meeting both average and peak power demand in each specified demand node. We demonstrate our methodology with a case study of Rwanda, accounting for existing generation and transmission infrastructure. Thirteen ongoing or proposed projects are considered as potential new centralized generation facilities and the decentralized technology is modeled after a small (∼50 W) solar home system. The case study is repeated using population data at four different resolutions while varying demand levels and decentralized technology cost. A tipping point effect is observed, where the optimal infrastructure tips from being primarily centralized to primarily decentralized under certain combinations of the demand and cost parameters. These tipping points are largely consistent across the four data resolutions. Finding a solution within 1 % of optimal was often found to be computationally expensive in formulations with greater than approximately 200 nodes and 800 edges. However, formulations using less dense population data are shown to accurately identify the same tipping points while requiring fewer computa- tional resources. Examples of the minimum cost electricity infrastructure in Rwanda are also shown for several specific combinations of parameters. Keywords Rural electrification · Energy development · Solar home system · Rwanda · Decentralized electricity T. Levin (B ) · V. M. Thomas School of Industrial and Systems Engineering, Georgia Institute of Technology, Atlanta, GA, USA e-mail: [email protected] V. M. Thomas School of Public Policy, Georgia Institute of Technology, Atlanta, GA, USA e-mail: [email protected] 123
Transcript of A mixed-integer optimization model for electricity infrastructure development

Energy Syst (2013) 4:79–98DOI 10.1007/s12667-012-0067-8
A mixed-integer optimization model for electricityinfrastructure development
Todd Levin · Valerie M. Thomas
Received: 12 April 2012 / Accepted: 23 July 2012 / Published online: 21 August 2012© Springer-Verlag 2012
Abstract We formulate a mixed-integer program that can be used to analyze the deci-sion between centralized and decentralized technologies for new energy infrastructuredevelopment. The formulation minimizes the cost of meeting both average and peakpower demand in each specified demand node. We demonstrate our methodologywith a case study of Rwanda, accounting for existing generation and transmissioninfrastructure. Thirteen ongoing or proposed projects are considered as potential newcentralized generation facilities and the decentralized technology is modeled after asmall (∼50 W) solar home system. The case study is repeated using population data atfour different resolutions while varying demand levels and decentralized technologycost. A tipping point effect is observed, where the optimal infrastructure tips frombeing primarily centralized to primarily decentralized under certain combinations ofthe demand and cost parameters. These tipping points are largely consistent acrossthe four data resolutions. Finding a solution within 1 % of optimal was often foundto be computationally expensive in formulations with greater than approximately 200nodes and 800 edges. However, formulations using less dense population data areshown to accurately identify the same tipping points while requiring fewer computa-tional resources. Examples of the minimum cost electricity infrastructure in Rwandaare also shown for several specific combinations of parameters.
Keywords Rural electrification · Energy development · Solar home system ·Rwanda · Decentralized electricity
T. Levin (B) · V. M. ThomasSchool of Industrial and Systems Engineering, Georgia Institute of Technology, Atlanta, GA, USAe-mail: [email protected]
V. M. ThomasSchool of Public Policy, Georgia Institute of Technology, Atlanta, GA, USAe-mail: [email protected]
123

80 T. Levin, V. M. Thomas
1 Introduction
As developing countries continue to industrialize and modernize, their demand forenergy services is growing rapidly. Such countries may have options that were notavailable in the past. Specifically, decentralized electrification technologies are becom-ing increasingly cost competitive with their centralized counterparts. The develop-ment of either a centralized or decentralized infrastructure requires significant upfrontinvestment that may commit a region to a certain development path for years tocome.
Different electricity generation options are often compared individually on a costbasis; however, these analyses do not fully account for the specifics of a given situationin which new generation capacity is required. Such specifics may include populationdistribution, resource availability, geography and the load profiles of new consumers.Additionally, traditional cost analysis often assumes the existence of a sophisticatedelectricity transmission infrastructure or includes a simple variable cost of transmis-sion. This is generally appropriate in developed regions where such infrastructureexists, but in developing countries the required investment in transmission and dis-tribution infrastructure may account for a significant fraction of total system costs.We present a model to inform the decision between centralized and decentralizedinfrastructures that accounts for existing networks and potential new investments thatare currently being considered.
2 Background
The costs of different electricity generation technologies are often compared on thebasis of levelized cost of electricity (LCOE), which incorporates the full lifecyclecosts of a generation technology into a single metric. The literature is replete with dif-ferent methodologies for performing these calculations and comparisons [1–6]. Suchcalculations have also been specifically applied to determine the levelized costs ofdecentralized generation technologies, such as solar photovoltaics, under a variety ofdifferent financial assumptions [7,8]. However, it has been argued that the levelizedcost metric may be inappropriate for comparing intermittent generation technolo-gies with varying dispatch profiles, such as wind or solar [9]. Therefore, analysesbeyond simple levelized cost comparisons are likely necessary to fully evaluate thechoice between generation technologies, particularly when intermittent technologiesare being considered.
In developing countries with low electrification rates, it is important to considerthe cost per household of new connections to a centralized electric grid [10,11]. Thecost of new transmission and distribution infrastructure can also be combined witha levelized cost of generation analysis to identify regions that may be more or lesssuitable for decentralized infrastructures [12,13].
We present a methodology for determining the lowest cost electricity genera-tion and transmission infrastructure that can serve electricity demand in a givenregion. Our work focuses on developing the specific details of such an infrastruc-ture system (transmission line voltages, generation facility locations), as opposed to
123

A mixed-integer optimization model 81
examining the economic feasibility of different options from a broader perspective.In contrast to some earlier studies, we apply our methodology to large-scale, coun-try level planning, involving both centralized and decentralized generation facili-ties and relatively high voltage transmission lines (30+ kV). However, the modelcould easily be used to analyze the development of smaller-scale networks aswell.
A case study of electricity infrastructure development in Rwanda is presented toillustrate an application of the methodology at the country level. The infrastructuredata informing the model are based on existing electricity generation and transmissionfacilities in Rwanda as well as potential or proposed projects. We present sensitivitiesaround a range of different levels of average power demand and costs of decentralizedtechnologies. Additionally, we examine how the generated network is affected bychanges in the resolution of the population data, and analyze the tradeoff betweenmore precise results and faster computation time.
Centralized electricity offers the advantage of a generally lower unit cost of gener-ation; however, centralized facilities also require relatively large generation capacitiesto achieve such an economy of scale. Decentralized generation generally has a greaterunit cost of electricity generation, but offers the flexibility of smaller facilities that canbe located close to demand sites. As such, costly high-voltage transmission networksare not required to deliver decentralized electricity to the end user. Therefore, despitethe generally higher unit cost of decentralized electricity, decentralized systems mayprovide a cheaper overall option in some locations when considering the combinedcosts of generation and transmission.
The case study is primarily meant to illustrate our methodology and provide ahigh-level analysis of the choice between centralized and decentralized electricityinfrastructure development in Rwanda. The results can be used by planners to informhigh-level development strategies and policies. An analysis to be used for specificproject implementation would benefit from more detailed data, specifically regardingthe capacities and costs of transmission lines in Rwanda, as well as explicit modelingof time-dependent grid load.
3 Methodology
We formulate a mixed-integer program (MIP) for planning an electricity generation,transmission and distribution infrastructure. The primary objective is to determinethe lowest-cost combined centralized and decentralized infrastructure that is capableof serving electricity demand in a region. The model does not explicitly model time-dependent demand, but rather finds the minimum-cost infrastructure that ensures thereis sufficient generation and transmission capacity throughout the system to meet bothaverage and peak demand levels. Power generation facilities are characterized by peakgeneration capacity as well as capacity factors that dictate average generation levels.Constraints require that total generation capacity is sufficient to satisfy both peakpower demand and system-wide yearly energy demand. The required transmissioninfrastructure is largely independent of load shape, and is rather dictated primarilyby the peak load level. The binding transmission constraint requires that there is
123

82 T. Levin, V. M. Thomas
sufficient capacity to transmit peak levels of power demand. The locations of central-ized generation facilities are also considered.
The economics of centralized and decentralized options are compared on the basis ofthe present value of the full lifecycle costs of each technology, including overnight cost,financing, operations and maintenance, and fuel. These various cost streams associatedwith the construction and operation of a generation facility are discounted over theplant lifetime to determine the present value of lifetime operation. Our calculationsare applied over a 50 year time horizon, which is the assumed operational lifetimefor centralized technologies and transmission infrastructure. Solar home systems areassumed to have a 25 year lifetime and therefore must be replaced once over a 50 yearhorizon. A real annual discount rate of 5 % is used and the MIP is solved to minimizethe total discounted lifetime cost of meeting system-wide peak and average powerdemand.
3.1 Mixed-integer program
A mixed-integer program is formulated to find the combination of centralized anddecentralized infrastructure that minimizes the total cost of meeting system-wideelectricity demand in a region. The region is modeled as a set of nodes or demandpoints, each of which may be connected to any of its neighbors by a transmis-sion line. The formulation below includes the option of developing either a highor low voltage transmission line on each edge; however, arbitrarily many classesof transmission lines could be included at the cost of additional computationalresources.
3.1.1 Decision variables
Decentralized electricity generation may be implemented at any node without restric-tion, while new centralized generation facilities are restricted to pre-identified projects.The decision variables are described and classified according to their type below. Con-tinuous variables are represented by x while binary variables are represented by y, mis the number of possible edges in the system, n is the number of nodes and r is thenumber of potential new centralized generation facilities.
• x1,1...x1,m: average transmission power level in each edge• x2,1...x2,m: peak transmission power level in each edge• y3,1...y3,m: indicator for a high voltage transmission line on each edge• y4,1...y4,m: indicator for a low voltage transmission on each edge• x5,1...x5,n: average centralized consumption in each node• x6,1...x6,n: peak centralized consumption in each node• y7,1...y7,n: indicator for a local centralized distribution network in each node• x8,1...x8,n: decentralized capacity in each node• y9,1...y9,r: indicator for each centralized generation facility
Additional parameters used in the formulation are outlined below; the index i refersto edges while the index j refers to nodes and k refers to centralized facilities.
123

A mixed-integer optimization model 83
• di : length of edge i in kilometers• Th,Tl : power capacity of high and low voltage transmission lines• Ch, Cl : cost per kilometer of high and low voltage transmission lines• CD : cost of decentralized generation technology, per kW capacity• Ck : present value of lifecycle cost of centralized facility k• CP : cost of connecting one person to the transmission line within a node• R R : reserve requirement for transmission lines, includes the effects of
transmission losses• C FD : capacity factor of decentralized generation technology• C Fk : capacity factor of centralized generation facility k• I j : the set of all edges feeding into node j• O j : the set of all edges feeding out of node j• DA j : average electricity power demand in node j• DPj : peak electricity power demand in node j• TCk : power generation capacity of centralized facility k• Pj : The population of node j
3.1.2 Objective function
The objective of this optimization problem is to minimize the total cost of meetingelectricity demand in a given system. The objective function can be expressed asfollows,
min
⎧⎨
⎩
m∑
i=1
di · Ch · y3,i +m∑
i=1
di · Cl · y4,i +n∑
j=1
CP · Pj · y7, j
+n∑
j=1
CD · x8, j +r∑
k=1
Ck · y9,i
⎫⎬
⎭(1)
Here the first and second terms respectively represent the cost of new high andlow voltage transmission lines. The third term represents the cost of distribution lineinfilling within each demand node that is connected to the centralized grid. The fourthand fifth terms respectively represent the costs of new decentralized and centralizedgeneration facilities. Recurring cost streams are discounted and encapsulated into apresent value equivalent over a 50 year time horizon.
3.1.3 Constraints
The objective function is minimized subject to the following constraints.A first constraint ensures that the flow of power into and out of each node is con-
sistent. That is, the flow of power into a node plus the generation in that node mustbe greater than consumption plus the power flow out; this holds for both average andpeak power. Decentralized generation is not considered to be connected to the grid
123

84 T. Levin, V. M. Thomas
and is therefore not included.
∑
i∈I j
x1,i −∑
i∈O j
x1,i − x5, j +∑
k∈Gen j
C Fk · Tk · y9,k ≥ 0 ∀ j (2)
∑
i∈I j
x2,i −∑
i∈O j
x2,i − x6, j +∑
k∈Gen j
Tk · y9,k ≥ 0 ∀ j (3)
The next constraint ensures that centralized and decentralized consumption in eachnode combine to meet both average and peak demand. The reserve requirement appliesto centralized consumption to ensure proper resiliency in the transmission lines andalso includes the effects of transmission losses. The purpose of the reserve requirementis to provide a buffer of additional generation and transmission capacity to ensure thatservice is still provided in the event that demand marginally exceeds anticipated peaklevels. The reserve requirement can also provide resiliency in the event that a generationfacility goes offline. In developing countries electricity generation is often unreliableand plant outages may be fairly common. This effect can be accounted for by includinga relatively high reserve requirement to ensure that service is provided even if certaininfrastructure components temporarily cease to function. Decentralized solar homesystems include a controller that strictly limits the power being drawn from the system.As the load of each individual system cannot exceed this level, a reserve requirement isnot necessary to ensure resiliency due to unanticipated demand. Decentralized systemsmay also go offline due to malfunction or required maintenance; however, this analysisdoes not consider a backup option for such systems.
1
R R· x5, j + C FD · x8, j ≥ DA j ∀ j (4)
1
R R· x6, j + x8, j ≥ DPj ∀ j (5)
A third constraint requires that a node must be connected to the transmission back-bone by a local distribution network in order for centralized power to be consumedthroughout that node.
x5, j − DA j · y7, j ≤ 0 ∀ j (6)
x6, j − DPj · y7, j ≤ 0 ∀ j (7)
An additional constraint ensures that no more than one transmission line is constructedon each edge.
y3,i + y4,i ≤ 1 ∀i (8)
A final set of constraints ensures that the capacity of each line is greater than theabsolute values of both the average and peak power levels.
|x1,i | − y3,i · Th − y4,i · Tl ≤ 0 ∀i (9)
123

A mixed-integer optimization model 85
|x2,i | − y3,i · Th − y4,i · Tl ≤ 0 ∀i (10)
All variables are non-negative with the exception of x1,i and x2,i where the directionof power flow is defined by their sign.
4 Rwanda case study
Rwanda is a landlocked country in East Africa with a population of approximatelyten million people that has one of the least developed electricity infrastructures ofany country in the world. The country is represented as a set of demand centers, ornodes, which are derived from population data available from The Gridded WorldPopulation Project [14]. In this case study, we utilize population data with a noderesolution of 2.5 arcminutes as our original data set, and consolidate this set as desiredto form geographical representations of population dispersion in Rwanda with noderesolution of 3, 6, 12 and 24 arcminutes. Each node has associated average and peakpower demands, which must each be satisfied through a combination of centralizedand decentralized electricity.
4.1 Electricity services
In rural communities, small quantities of electricity are often first used to replacekerosene lighting with electric lights. Kerosene can be costly and provide poor qualitylight. Additional electricity may be demanded to provide power for a radio, televisionor a cellular telephone.
A case study of rural village energy use in Kenya found that widely used kerosenelamps produced an average output of about 20 lumens, which generally enables onlybasic activities and is not enough for comfortable reading [15]. These lamps canbe replaced by 7 W compact fluorescent bulbs that provide 300 lumens, enough forreading and the illumination of a small room. Additional electricity may be used topower a radio or cellular telephone, which can be accomplished with about 3 W ofpower. This 10 W peak demand level might be considered the minimal practical electricload for a single household in a rural setting. As a household may include five or moreinhabitants, as little as 2 W of power per capita could be sufficient to significantlyaffect quality of life in many un-electrified regions. In 2005 it was estimated that a20 W solar system in Kenya would cost $150–$200 [15].
The growth of small-scale solar electrification has perhaps been most rapid inBangladesh over the past decade, which now has over one million homes powered bysolar systems and is on pace to pass 2.5 million by 2014 [16]. This effort has beenled by Grammen Shakti, an organization that provides individual solar home systemsranging from 10 to 135 W in output capacity. These systems include a battery, allnecessary controllers and cables and CFL bulbs. The systems cost approximately $6–$7 per watt and are designed to provide electricity for 4 h per day. A typical 50 Wsystem provides a 12 V DC power output that can operate four 7 W CFL bulbs and a 17inch black and white television and includes a battery with 80 A h of storage capacity;it is sold in Bangladesh for 29,500 taka ($350) [17]. The battery provides a maximum
123

86 T. Levin, V. M. Thomas
energy storage capacity of 0.96 kWh, which is sufficient to service a 50 W load for19.2 h on a single full charge. In rural settings, a significant portion of energy servicesare consumed in the form of evening lighting after the sun has set. This battery helpsensure that the solar home system can provide a consistent power output after sunsetwhen the photovoltaic panel is no longer able to directly generate electricity.
4.1.1 Average and peak demand
Our model finds the minimum cost infrastructure that satisfies both average and peakpower demand levels. We define the peak factor of any given node to be the ratio of peakpower demand to average power demand. The peak factor of the centralized electricitynetwork in Rwanda was 1.75 in 2003 and this has been projected to drop to 1.67 in2011 [18]. In order to avoid outages, enough generation capacity must be availablein order to serve peak demand. Therefore systems with higher peak factors will incurgreater costs due to lower average utilization. We assume a peak factor of 1.7 for loadsthat are served by new centralized infrastructure as well as for those served by newdecentralized systems. This model does not consider temporal load curve resolutionbeyond the average and peak demand levels as these are the two parameters thatwill primarily influence infrastructure investment decisions. More detailed load curveinformation could be included at the cost of additional computational requirements.Variations in the peak factor over a reasonable range of values have a modest impacton results.
We apply our methodology to understand how the variations in electricity demandinfluence the decision between different generation technologies. Electricity demandof the currently electrified population is based on recent consumption data, whiledemand levels for newly electrified populations will be varied to determine how thesechanges affect the optimal development strategy.
4.1.2 Current infrastructure
As of 2009, Rwanda has approximately 55 MW of available centralized electricitygeneration capacity, spread fairly evenly between hydroelectric and oil thermal plants[19]. There is also a small amount of microhyrdo generation as well as a 250 kWsolar array near the capital, Kigali. The electric grid in Rwanda has two high voltagebackbones, with approximately 285 km of 110 kV and 64 km of 70 kV lines [20]. Thereis also a significant 30 kV network as well as 15 and 6.6 kV distribution lines [20].The current level of generation capacity is not sufficient to adequately serve demandin Rwanda and the shortages have led to dramatic increases in electricity prices andutility scale implementation of diesel generators. Currently only 6 % of the populationhas access to electricity and the Rwandan government has laid out an aggressive targetto increase the electrification rate to 35 % by 2020, with an emphasis placed on ruralareas. As a result, electricity demand per capita is also expected to increase from 30to 100 kWh/year over that time [19]. Combined with an expected 30 % growth inpopulation, total countrywide electricity demand could increase by a factor of four orfive in the next decade.
123

A mixed-integer optimization model 87
Our case study of Rwanda includes nine existing centralized generation facilitieswith a total operating capacity of approximately 55 MW.
4.1.3 Future infrastructure
4.1.3.1 Centralized generation It has been estimated that unutilized power generationresources in Rwanda could amount to 1,200 MW, more than enough to meet increasingdemand [19]. These include significant untapped hydroelectric resources and largemethane gas deposits that are known to exist at the bottom of Lake Kivu on thewestern border of the country. Solar irradiation in Rwanda is relatively high at anaverage of 5.2 kWh/m2 day [20]. Rwanda also has an estimated 170–320 MW ofgeothermal power potential as well as wind resources, but further investigations arenecessary before these technologies are implemented [20].
Methane deposits in Lake Kivu have been discovered which may be able to pro-vide as much as 700 MW of power and discussions have targeted realizing 350 MWof this in the next decade [20]. An initial 25 MW plant has been announced withfuture planned expansions to 100 MW [21]. The additional, targeted but unplanned,capacity of 250 MW is also included in our model at a comparable unit cost. As theproposed large hydroelectric projects at Rusizi and Rusumo would each be sharedbetween three countries, these figures represent the Rwandan share of power andcosts.
Rwanda is geographically situated on the East Africa Rift, a region with significantpotential for electricity generation from underground geothermal heat. It has beenestimated that more than 300 MW of geothermal power could be generated in thewestern part of the country near Lake Kivu. Initial feasibility explorations are nowunderway, and the Rwandan Energy Ministry is targeting 310 MW of new geothermalpower capacity over the next 7 years at a cost of $935 million; however a third-partycost analysis has not been performed. We include an additional 20 % in the cost toaccount for the required feasibility studies and potential optimism in the governmentestimate.
We consider 13 potential new generation facilities with total capacity of approxi-mately 840 MW for future construction. The capacities and costs for these potentialgeneration sites are listed in Table 1 and represent best estimates based on a variety ofinformation sources. Cost calculations for centralized technologies assume a 15 % car-rying charge applied over a 30 year book life and annual operations and maintenancecosts equal to 3 % of the overnight cost. The Lake Kivu project includes the costs ofinfrastructure to extract methane from the lake and it is assumed that no additionalfuel costs will be incurred.
As our model only includes requirements to meet average and peak demand, thetime-dependent output profiles and each generation technology are not explicitly mod-eled. The ability of each generation technology to met peak demand is defined by itsrated generation capacity, while its ability to meet average demand is defined by itscapacity factor. Thermal technologies are assumed to operate at an 85 % capacity factorand hydroelectric technologies at a 40 % capacity factor. These effects are accountedfor through constraints in the MIP formulation.
123

88 T. Levin, V. M. Thomas
Table 1 Potential centralized generation facilities in Rwanda [19–24]
Location Capacity (MW) Overnight cost (M$) Generation type
Lake Kivu I 25 140 Methane thermal
Lake Kivu II 75 185 Methane thermal
Lake Kivu III 250 620 Methane thermal
Mukungwa II 2.5 7.5 Hydroelectric
Mukungwa III 2.2 6.6 Hydroelectric
Nyabarongo 27.5 97.7 Hydroelectric
Rukarara 9.5 20 Hydroelectric
Rubavu 3.2 9.6 Hydroelectric
Rugezi 2.2 6.6 Hydroelectric
Rusizi III 48 150 Hydroelectric
Rusizi IV 68 212 Hydroelectric
Rusumo 20 57 Hydroelectric
Lake Kivu 310 1,120 Geothermal
4.1.3.2 Decentralized generation The decentralized technology considered by themodel is a small, solar home system, which offers peak generation capacity of 50 Wand includes a 12 V battery with 80 A h of storage capacity. The maximum load oneach system is assumed to be equal to the peak generation capacity, or approximately4 A for a 50 W system. This implies that a fully charged battery can provide roughly20 h of uninterrupted power to a system operating at the maximum load level. Solarhome systems are gaining popularity throughout the developing world as a viablealternative to centralized options that are easily scalable to meet peak demand levelsgreater than 50 W and can be implemented relatively quickly.
We analyze sensitivity around the cost of this technology, with scenarios assuminginstalled costs of $5, $6 and $7 per watt. In each scenario the systems are assumedto be financed at 8 % interest over 3 years with annual maintenance costs equal to1 % of the overnight cost and require one system replacement after 25 years. It isassumed that these systems operate at a 16 % capacity factor and are located at demandsites; therefore they do not require distribution infrastructure. For the purposes of thisanalysis, electricity generated from decentralized technologies is assumed to be aperfect substitute for electricity generated from centralized technologies.
4.1.3.3 Transmission and distribution In the case study, the term ‘transmission’ willbe used to refer to lines of 30 kV or greater while ‘distribution’ will be used for linesof <30 kV. The current electricity transmission infrastructure is Rwanda is made upof 30, 70 and 110 kV lines. Our grid extension model only considers adding new 30and 110 kV lines so as to limit computational complexity.
Our model explicitly characterizes the expansion of transmission infrastructure(30 and 110 kV), while the costs of extending distribution infrastructure (<30 kV)to individual demand centers within each node are considered on the basis of a fixedcost per household. An analysis of electric grid expansion in Kenya estimated thecost of connecting households to nearby medium voltage transmission line withinthe same demand node to be $1,246/household [10]. We assume a comparable cost of
123

A mixed-integer optimization model 89
Table 2 Transmission lineparameters
Voltage (kV) Maximum capacity (MW) Overnight cost (per km)
110 100 $150,000
30 7.5 $15,000
$1,250/household in our analysis, or $250/person assuming five people per household.In this analysis, the entire population of a node is considered to be centralized if sucha distribution network is developed.
The capacity and overnight cost of each transmission line class are consistent withvalues used in other similar studies of electric grid expansion in sub-Saharan Africa[10,12] and an empirical study of the costs of transmission infrastructure [25]. Thecosts of transmission lines are further augmented to account for the costs of trans-formers and other transmission infrastructure, which are not explicitly modeled byour methodology. These costs typically account for roughly 60 % of total transmis-sion costs. We do not have access to data that would allow us to account for geographicfactors and terrain features, which may affect the unit cost of each individual trans-mission segment. Therefore a homogenous, average cost of transmission is applied toall potential segments throughout the region.
The present cost of transmission infrastructure is calculated based on the assump-tion of a 15 % carrying charge over a 30 year book life and annual operations andmaintenance costs equal to 1 % of overnight cost. Capacity and cost of transmissionand distribution lines are shown in Table 2.
5 Results
In applying our model to a case study analysis of Rwanda, we seek to understand howthe decision between centralized and decentralized infrastructures is affected by varia-tions in the potential electricity demand of new consumers and the cost of decentralizedgeneration technologies. Sensitivities are analyzed around two key parameters; aver-age per capita electricity consumption for newly electrified populations, and the costof decentralized generation technologies. We also explore the effect of scaling themodel formulation to include more or less detailed population data, in terms of bothresults and computation time. Results are presented for 15 scenarios encompassingcombinations of five different demand levels and three different decentralized genera-tion costs. These 15 scenarios are also executed at four different node resolutions. Allresults were generated by solving the MIP with a target optimality gap of 1 % and amaximum runtime of 25,000 s.
5.1 Electricity development in Rwanda
Figure 1 shows the fraction of the population that would be served by centralizedelectricity infrastructure under each scenario. A node that is served by centralizedinfrastructure may also produce decentralized generation, but this is not observedto occur significantly in our results. A single star denotes a solution that failed to
123

90 T. Levin, V. M. Thomas
Fig. 1 Percent of population served by decentralized electricity infrastructure in the Rwanda case study.* >1 % optimality gap ** >5 % optimality gap
converge within 1 % of optimality in the 25,000 s time limit, while a double stardenotes a scenario that failed to converge within 5 % of optimality.
It can be seen that at a cost of $5 or $6 per watt, Rwanda could be largely served bydecentralized generation for average consumption levels at or below 4 W per capita. Ata cost of $7 per watt Rwanda could be largely served by decentralized generation forconsumption levels at or below 2W/capita. The results for scenarios executed at eachnode resolution are largely consistent, with the exception of two 3′ scenarios. However,neither of these solutions ($5 per watt decentralized cost with 6W/capita consumptionand $7 per watt decentralized cost with 4W/capita consumption) converged to thewithin 1 % of optimality within the time limit. Early termination will generally resultin a partially developed transmission infrastructure. This is likely the cause of thediscrepancy between these scenarios at 3′ resolution and the other resolutions.
These results show that only the capital of Kigali, which contains approximately 7 %of total countrywide population, would be served by centralized infrastructure whenconsumption is below these thresholds. When using population data with 24 arcminuteresolution, the single largest node contains roughly 14 % of the total population,which accounts for the difference that is observed. Other slight differences are presentbetween the scenarios executed with different node resolution, however the same broadtrend generally holds in each case.
It’s also notable that there are very few combinations of parameters that lead toa combined network with significant portions of both centralized and decentralizedelectrification. In each cost scenario there are certain tipping points, where the optimalcountrywide electrification plan shifts from almost an entirely centralized infrastruc-ture to an almost entirely decentralized infrastructure. The tipping point is also gen-erally consistent across scenarios executed at each node resolution. This suggeststhat less detailed population data may be used to identify these tipping points just aseffectively as more detailed population data, while requiring far fewer computationalresources.
Figure 2 shows the present value of total system-wide cost of the combined central-ized and decentralized infrastructure that serves the given demand level. It can be seenthat total costs tend to decrease somewhat as the distance between nodes increases,however the results are fairly consistent. The differences are likely explained by thelower total network length required to serve a set of fewer nodes, combined with thefact that the per household cost of local distribution infrastructure is assumed to bethe same for scenarios executed at each resolution.
123
A mixed-integer optimization model 91
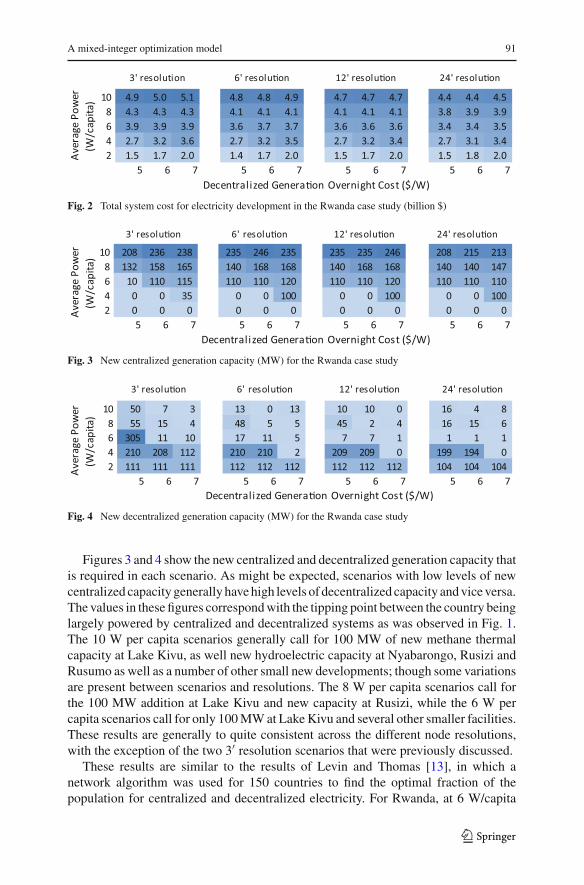
Fig. 2 Total system cost for electricity development in the Rwanda case study (billion $)
Fig. 3 New centralized generation capacity (MW) for the Rwanda case study
Fig. 4 New decentralized generation capacity (MW) for the Rwanda case study
Figures 3 and 4 show the new centralized and decentralized generation capacity thatis required in each scenario. As might be expected, scenarios with low levels of newcentralized capacity generally have high levels of decentralized capacity and vice versa.The values in these figures correspond with the tipping point between the country beinglargely powered by centralized and decentralized systems as was observed in Fig. 1.The 10 W per capita scenarios generally call for 100 MW of new methane thermalcapacity at Lake Kivu, as well new hydroelectric capacity at Nyabarongo, Rusizi andRusumo as well as a number of other small new developments; though some variationsare present between scenarios and resolutions. The 8 W per capita scenarios call forthe 100 MW addition at Lake Kivu and new capacity at Rusizi, while the 6 W percapita scenarios call for only 100 MW at Lake Kivu and several other smaller facilities.These results are generally to quite consistent across the different node resolutions,with the exception of the two 3′ resolution scenarios that were previously discussed.
These results are similar to the results of Levin and Thomas [13], in which anetwork algorithm was used for 150 countries to find the optimal fraction of thepopulation for centralized and decentralized electricity. For Rwanda, at 6 W/capita
123

92 T. Levin, V. M. Thomas
Table 3 Number of nodes, edges, and variables for each resolution in the Rwanda case study
Node resolution (arcminutes) Nodes Edges Binary variables Continuous variables
24 19 51 134 159
12 65 212 502 619
6 224 789 1,815 2,250
3 820 3,057 6,947 8,574
Fig. 5 Run time required to achieve a 1% optimality gap as a function of percent decentralized, for spatialresolution of 3, 6, 9, and 12 arcminutes. All runs were limited to 25,000 s
(50 kWh/person-year) the network algorithm finds 7 % decentralized, and at 8 W/capita(69 kWh/person-year) it finds 3 % decentralized. This study differs from that previousstudy not only in algorithm, but also in having more detailed transmission and cen-tralized generation cost data and in taking into account the existing transmission andgeneration infrastructure.
5.2 Computational requirements
We also analyze the computational resources required to solve the MIP when differentdata resolutions are used. The MIP is formulated in MATLAB and solved using CPLEX12.2 and Concert 2.6 technology on 2.4–2.8 GHz processors.
Table 3 shows the number of nodes, edges and variables present in the MIP for-mulation for each node resolution. Figure 5 shows the runtime of each scenario as afunction of the fraction of population decentralized in the optimal network for thatscenario. All scenarios were executed with a target 1 % optimality gap and a maximumrun time of 25,000 s. It can be seen that scenarios with optimal networks that are pri-marily centralized require more computational resources to solve, as the specifics ofthe entire transmission network must be determined. Formulations using population
123

A mixed-integer optimization model 93
Fig. 6 Electricity system for the Rwanda case study, for decentralized generation cost of $6 per wattand average electricity consumption of 4 W/capita for newly connected consumers. Spatial resolution is6 arcminutes
data with 12 or 24 arcminute resolution were able to determine a solution within 1 %of optimality in a few seconds, where as those with 3 or 6 arcminute resolution oftencould not achieve the same optimality after the maximum allowed 25,000 s.
Figures 6, 7, 8 and 9 depict the minimum-cost infrastructure under various decen-tralized generation cost and average consumption level scenarios. In the figures dashedlines are used to denote new transmission infrastructure, while solid lines denote exist-ing infrastructure.
Figures 6 and 7 illustrate how the model may generate optimal networks that differslightly but are largely consistent when executed with population data at differentresolutions. Figure 6 shows the optimal network under the assumption of $6 per wattdecentralized generation overnight cost and 4 W per capita average power consumptionfor newly electrified populations when executed with 6 arcminute node resolution.No new centralized generation capacity is developed, and the existing transmissionnetwork is expanded to serve only one additional node. Many of the nodes that arecurrently connected by a transmission line do not develop local distribution networksand 86 % of the population is served by decentralized generation. Figure 7 showssimilar results for the same scenario when executed at 12′ node resolution. No newcentralized generation capacity is developed, no extensions are made to the existingtransmission grid and 85 % of the population is served by decentralized generation.
123

94 T. Levin, V. M. Thomas
Fig. 7 Electricity system for the Rwanda case study, for decentralized generation cost of $6 per wattand average electricity consumption of 4 W/capita for newly connected consumers. Spatial resolution is12 arcminutes
Comparison of Figs. 6 and 7 with Figs. 8 and 9 shows how a small increase inaverage power demand for new consumers can cause the optimal network to tip frombeing primarily decentralized to almost entirely centralized. The increase in demandleads to investment in new centralized generation and transmission infrastructure, mostnotably, 100 MW of methane thermal generation capacity at Lake Kivu. Only a smallnumber of nodes, encompassing 1 % of total countrywide population, are served bydecentralized systems. The results are largely consistent when the same scenario isexecuted at 12′ resolution as opposed to 6′ resolution. The same centralized generationfacilities are developed and in this case <1 % of the total population is served bydecentralized generation.
6 Discussion
We have presented a methodology that can be easily implemented to model the deci-sion between centralized and decentralized electricity infrastructure development andhelp understand how this decision is affected by the sensitivity of key parameters.To demonstrate this methodology, we have applied it to a case study of electricityinfrastructure development in Rwanda. We wish to be clear that results specific to theRwandan case should be interpreted in the context of the various assumptions thatwere made.
123

A mixed-integer optimization model 95
Fig. 8 Electricity system for the Rwanda case study, for decentralized generation cost of $6 per wattand average electricity consumption of 6 W/capita for newly connected consumers. Spatial resolution is6 arcminutes
It is shown that in the case of Rwanda, there are few combinations of parametersthat result in optimal networks with significant contributions from both centralizedand decentralized infrastructures. Rather, there appear to be tipping points where theoptimal infrastructure shifts from being largely centralized to largely decentralized.For reasonable cost of decentralized systems, this tipping point appears to occur at anaverage electricity consumption level of approximately 4 W per capita, or 20 W for anaverage five person household. Given a typical solar home system that operates for 4 hper day, this consumption level corresponds to a household system with a peak capac-ity of approximately 120 W. Our results suggest that broadly speaking, higher demandlevels would be more cost-effectively served by centralized infrastructures. However,our model only optimizes the total anticipated lifetime cost of a given countrywideelectricity network, and there are a number of other factors that may influence thedecision between different infrastructures and technologies. Decentralized infrastruc-tures may be preferred despite higher costs for a variety of reasons, including lack of acompetent central authority, ease and speed of installation, improved system reliabilityand increased autonomy and independence. The current rapid penetration of new solarhome systems in Bangladesh is an example of this phenomenon.
We also demonstrate that using population data of different resolutions may affectthe specific details of the optimal network; however, the broad trends of either decen-tralization or centralization generally remain consistent across the considered node
123

96 T. Levin, V. M. Thomas
Fig. 9 Electricity system for the Rwanda case study, for decentralized generation cost of $6 per wattand average electricity consumption of 6 W/capita for newly connected consumers. Spatial resolution is12 arcminutes
resolutions. We also show how the data resolution affects computational time. Ourmethodology may be applied to better understand how changes in key parameters canlead to potential tipping points from primarily centralized to primarily decentralizedinfrastructures.
As rigorous sensitivity analysis requires the formulated MIP to be solved numeroustimes to consider all potential combinations of parameters, it is important to formulatethe MIP so that it may be solved in a reasonable timeframe. We find that a formula-tion with 65 nodes can generally be solved in 10 s or less given our computationalresources. Formulating the MIP with 224 nodes significantly increases the computa-tional requirements, with some scenarios unable to converge to a solution within 1 %of optimal in 25,000 s. However, both formulations identify the same tipping pointsin our case study of Rwanda, and other results are also largely consistent betweenscenarios executed at these resolutions. Therefore, we find that in the case of Rwanda,any potential benefits resulting from increasing data resolution from 12′ to 6′ do notjustify the increased computational requirements.
The number of nodes in the formulation will of course also be affected by the size ofthe region being analyzed. Rwanda is a relatively small country; an analysis of largercountries would have to be formulated with less dense node resolution in order to besolved in a similar timeframe. We recommend that for expedient analysis, the networkshould be limited to approximately 200 nodes. However larger formulations can also
123

A mixed-integer optimization model 97
be analyzed if more computational resources are available or larger optimality gaps aretolerable. Additionally, formulations that allow for more classes of new transmissionlines can be considered; however, this increases the number of binary variables in theMIP and will significantly affect the computational requirements. This tradeoff shouldtherefore be considered when formulating the system that will be analyzed.
We chose to demonstrate our methodology by analyzing the sensitivity of the opti-mal network to changes in two key parameters, decentralized generation cost andaverage new electricity consumption. However, the methodology could also be usedto analyze the effect of changing a number of other parameters, such as cost of trans-mission and distribution infrastructure and the cost or availability of new centralizedgeneration facilities.
Acknowledgments Todd Levin is supported by a Graduate Research Fellowship from the NationalScience Foundation.
References
1. Rosenberg, W.: Deploying IGCC in this decade with 3Party Covenant Financing: volume I. BelferCenter for Science and International Affairs, Kennedy School of Government, Harvard University,Cambridge, Massachusetts, Discussion Paper 2004–2007, May 2005
2. Black and Veatch: 20 percent wind energy penetration in the United States: a technical analysis of theenergy resource, Black and Veatch Report Number 144864, October 2007
3. Katzer, J.: The future of coal: options for a carbon-constrained world. Massachusetts Institute ofTechnology, Cambridge (2007)
4. Lazard Ltd.: Levelized cost of energy analysis—version 2.0, June 20085. Du, Y., Parsons, J.E.: Update on the cost of nuclear power. Center for Energy and Environmental Policy
Research, Massachusetts Institute of Technology, Cambridge, Massachusetts, 09-004, May 20096. Borin, S., Levin, T., Thomas, V.: The Levelized cost of electricity generation technologies: reducing
the role of forecasting for capital and fuel costs, Submitted for review to Applied Energy (2012)7. Branker, K., Pathak, M.J.M., Pearce, J.M.: A review of solar photovoltaic levelized cost of electricity.
Renew. Sustain. Energy Rev. 15(9), 4470–4482 (2011)8. Singh, P.P., Singh, S.: Realistic generation cost of solar photovoltaic electricity. Renew. Energy 35(3),
563–569 (2010)9. Joskow, P.L.: Comparing the costs of intermittent and dispatchable electricity generating technologies.
Am. Econ. Rev. 101(3), 238–241 (2011)10. Parshall, L., Pillai, D., Mohan, S., Sanoh, A., Modi, V.: National electricity planning in settings with
low pre-existing grid coverage: development of a spatial model and case study of Kenya. Energy Policy37(6), 2395–2410 (2009)
11. Zvoleff, A., Kocaman, A.S., Huh, W.T., Modi, V.: The impact of geography on energy infrastructurecosts. Energy Policy 37(10), 4066–4078 (2009)
12. Deichmann, U., Meisner, C., Murray, S., Wheeler, D.: The economics of renewable energy expansionin rural sub-Saharan Africa. Energy Policy 39(1), 215–227 (2011)
13. Levin, T., Thomas, V.M.: Least-cost network evaluation of centralized and decentralized contributionsto global electrification. Energy Policy 41, 286–302 (2012)
14. Columbia University Center for International Earth Science Information Network (CIESIN) and CentroInternacional de Agricultura Tropical (CIAT): Gridded Population of the World Version 3 (GPWv3):Land Area Grids. Socioeconomic Data and Applications Center (SEDAC), Columbia University, Pal-isades (2010)
15. Modi, V., McDade, S., Lallement, D., Saghir, J.: Energy Services for the Millennium DevelopmentGoals, Energy Sector Management Assistance Programme, United Nations Development Programme,UN Millennium Project, and World Bank, New York (2005)
16. Koch, W.: Solar panels power 1 million Bangladesh homes, USA Today, 15 June 2011
123

98 T. Levin, V. M. Thomas
17. Grameen Shakti: Grameen Shakti Solar Home System Price List, 2009. http://www.gshakti.org/index.php?option=com_content&view=article&id=115&itemid=124
18. Lahmeyer International: Analysis and projection of Rwanda’s electricity demand, LI 260160, May2004
19. REMA: Rwanda State of Environment and Outlook Report. Rwanda Environment ManagementAuthority, Kigali (2010)
20. Safari, B.: A review of energy in Rwanda. Renew. Sustain. Energy Rev. 14(1), 524–529 (2010)21. Africa Development Bank: Boosting Rwanda’s Energy Sector—AfDB, Other Lenders Commit Usd
91.25 Million to Kivuwatt Project”, All Africa, Kigali, Rwanda, 26 August 201122. Uwamahoro, Y.: Rural electrification in Rwanda, Kigali, Uganda, 12 July 201023. Rwanda Utilities Regulatory Agency: Power supply overview: Rwanda’s power suppy, Gisenyi, May
200924. Rwanda Development Board: Investment opportunities in Rwanda, December 201125. Dixit, K., Baldick, R.: An empirical study of the economies of scale in AC transmission line construction
costs, unpublished manuscript (2003)
123