A metric suite for measuring service alignment with business agility
8
A Metric Suite for Measuring Service Alignment with Business Agility Ali Rostampour, Ali Kazemi, Amin Zamiri, Hassan Haghighi, Fereidoon Shams Automated Software Engineering Research Group Faculty of Electrical and Computer Engineering, Shahid Beheshti University GC, Tehran, Iran e-mail :{a.rostampour, ali.kazemi, a.zamiri}@mail.sbu.ac.ir { h_haghighi, f_shams }@sbu.ac.ir Abstract—Today enterprises are facing rapid and radical changes in business environments, making business agility a crucial step toward gaining competitive advantages over rivals. Service- oriented architectures (SOA) are touted as the key to business agility. However to deliver business agility with SOA effectively, business services should be designed according to SOA principles that affect business agility, including autonomy, cohesion and structural complexity. In this paper we propose a set of metrics to measure service accordance with these principles. A controlled case study is also provided to validate the applicability and correctness of the proposed metrics. Keywords-Business Agility, Service Oriented Architecture, Structural Complexity, Cohesion, Autonomy. I. INTRODUCTION Globalization, rapid technological changes and increased risk levels are among the environmental issues that today enterprises are facing. Agility in this case provides competitive advantages to succeed in such an environment. In a world where rapid and unpredictable changes occur, maintaining agility is crucial for businesses to survive. Business agility could be defined as the flexibility of a business in response to rapid changes in the business environment. On the other hand, SOA (service oriented architecture) is a promising approach for enterprise application development that supports business operations by a set of well-defined services. SOA has direct business and competitive advantage implications for all organizations. For any business, SOA can lead to increased customer satisfaction, real business agility and faster time to market [1]. When services are deployed in SOA, it is very important to insure the alignment of services with the business goals and strategy. In other words, the effectiveness of services in strategic business operations should be measured. Service evaluation usually begins by analyzing functional and non- functional requirements. Functional requirement evaluation is performed easily using well-defined documents and software test methods, but due to the inherent ambiguity and impreciseness of Non-functional requirements, their evolution is not straightforward. In this case an expert opinion might be used. Therefore introducing metrics to calculate non-functional requirements could be useful for the expert decision making. Service evaluation can be performed during the either modeling or implementation phases; however, since the outcome of the modeling phase is the basis of further developments and by evaluation at the modeling level, development costs could be reduced, service evaluation at this level has a great importance in SOA. The research on the service evaluation at the modeling level is scarce and limited to a few studies which would be covered in the next section. In this paper in order to guarantee service effectiveness towards business agility, a set of metrics to evaluate services at the modeling level are provided from structural complexity, autonomy and cohesion point of views. Moreover, the relationship between these metrics and the business agility is discussed. All the provided metrics can be measured automatically and thus can be used to understand service alignment with enterprise business goals at the modeling level. The rest of the paper is organized as follows. In the next section a summary of related studies is reviewed. A set of preliminary definitions are presented in section 3. Section 4 gives an overview of SOA principles, which are important in business agility, along with some metrics that are useful to measure these principles. In section 5 a small-scale case study is used to examine the proposed metrics. Finally, section 6 is devoted to the conclusion and some directions for future research. II. RELATED WORK Numerous metrics have been proposed in OO (object oriented) [2] [3] and CBD (component based development) paradigms to evaluate objects and components in terms of quality attributes in these paradigms. Considering the differences between the notion of objects and components with the notion of services, these metrics are not applicable in the service oriented paradigm [4]. Hence new metrics are required for service evaluation. In [5] a precise set of metrics for measuring granularity, coupling, cohesion, and business entity convergence of a service model are provided, however some of the metrics are limited to a simple set of quality attributes. For example, service granularity is simply calculated based on the number of service activities only, while in order to provide a comprehensive measurement of this attribute other aspects such as business value, context independency, complexity, etc. should be considered. 978-1-61284-207-3/11/$26.00 c ○2011 IEEE 121
Transcript of A metric suite for measuring service alignment with business agility

A Metric Suite for Measuring Service Alignment with Business Agility
Ali Rostampour, Ali Kazemi, Amin Zamiri, Hassan Haghighi, Fereidoon Shams
Automated Software Engineering Research Group Faculty of Electrical and Computer Engineering, Shahid Beheshti University GC,
Tehran, Iran e-mail :{a.rostampour, ali.kazemi, a.zamiri}@mail.sbu.ac.ir
{ h_haghighi, f_shams }@sbu.ac.ir
Abstract—Today enterprises are facing rapid and radical changes in business environments, making business agility a crucial step toward gaining competitive advantages over rivals. Service-oriented architectures (SOA) are touted as the key to business agility. However to deliver business agility with SOA effectively, business services should be designed according to SOA principles that affect business agility, including autonomy, cohesion and structural complexity. In this paper we propose a set of metrics to measure service accordance with these principles. A controlled case study is also provided to validate the applicability and correctness of the proposed metrics.
Keywords-Business Agility, Service Oriented Architecture, Structural Complexity, Cohesion, Autonomy.
I. INTRODUCTION Globalization, rapid technological changes and increased
risk levels are among the environmental issues that today enterprises are facing. Agility in this case provides competitive advantages to succeed in such an environment. In a world where rapid and unpredictable changes occur, maintaining agility is crucial for businesses to survive. Business agility could be defined as the flexibility of a business in response to rapid changes in the business environment. On the other hand, SOA (service oriented architecture) is a promising approach for enterprise application development that supports business operations by a set of well-defined services. SOA has direct business and competitive advantage implications for all organizations. For any business, SOA can lead to increased customer satisfaction, real business agility and faster time to market [1].
When services are deployed in SOA, it is very important to insure the alignment of services with the business goals and strategy. In other words, the effectiveness of services in strategic business operations should be measured. Service evaluation usually begins by analyzing functional and non-functional requirements. Functional requirement evaluation is performed easily using well-defined documents and software test methods, but due to the inherent ambiguity and impreciseness of Non-functional requirements, their evolution is not straightforward. In this case an expert opinion might be used. Therefore introducing metrics to calculate non-functional requirements could be useful for the expert decision making. Service evaluation can be performed during the either modeling or implementation phases; however, since the
outcome of the modeling phase is the basis of further developments and by evaluation at the modeling level, development costs could be reduced, service evaluation at this level has a great importance in SOA.
The research on the service evaluation at the modeling level is scarce and limited to a few studies which would be covered in the next section. In this paper in order to guarantee service effectiveness towards business agility, a set of metrics to evaluate services at the modeling level are provided from structural complexity, autonomy and cohesion point of views. Moreover, the relationship between these metrics and the business agility is discussed. All the provided metrics can be measured automatically and thus can be used to understand service alignment with enterprise business goals at the modeling level.
The rest of the paper is organized as follows. In the next section a summary of related studies is reviewed. A set of preliminary definitions are presented in section 3. Section 4 gives an overview of SOA principles, which are important in business agility, along with some metrics that are useful to measure these principles. In section 5 a small-scale case study is used to examine the proposed metrics. Finally, section 6 is devoted to the conclusion and some directions for future research.
II. RELATED WORK Numerous metrics have been proposed in OO (object
oriented) [2] [3] and CBD (component based development) paradigms to evaluate objects and components in terms of quality attributes in these paradigms. Considering the differences between the notion of objects and components with the notion of services, these metrics are not applicable in the service oriented paradigm [4]. Hence new metrics are required for service evaluation. In [5] a precise set of metrics for measuring granularity, coupling, cohesion, and business entity convergence of a service model are provided, however some of the metrics are limited to a simple set of quality attributes. For example, service granularity is simply calculated based on the number of service activities only, while in order to provide a comprehensive measurement of this attribute other aspects such as business value, context independency, complexity, etc. should be considered.
978-1-61284-207-3/11/$26.00 c○2011 IEEE 121

In [4] a quality model for service evaluation is proposed that considers different quality attributes at the service design level along with a set of metrics to measure these attributes. Unfortunately, these metrics have been considered and presented so simply such that they are not suitable for precise measurement of quality attributes. For example, the proposed metric for service complexity only takes the number of service operations into account, while measuring the complexity requires more precise definitions.
In [6] and [7], some metrics have been proposed to measure performance and availability which are not applicable at the modeling phase and should be only used at the implementation level. Also, there exist a number of researches proposing metrics to measure some other quality attributes like coupling, cohesion and complexity; however, considering their limited view, these researches are useless for comprehensive service evaluation. Considering the shortcomings of related studies in this field, hereby we propose a novel set of metrics to measure the principles that could be used to determine the degree of service-business agility alignment as one of the most important goals of the enterprise business.
III. PRELIMINARY DEFINITIONS In this section, we present some basic definitions which are
useful throughout the paper.
Definition 1 (Entity-centric business service): A service that encapsulates a specific business entity, such as an invoice or a timesheet [8].
Definition 2 (Task-centric business service): A service that encapsulates business logic specific to a task or business process [8].
Definition 3: A Business Entity (BE) is a triple like BE = (n, A, R), where n is the name of the business entity, A is the set of its attributes and R is the relations between the business entity and other business entities [9].
Definition 4: An elementary business process (EBP) can be defined as EBP = (n, {(BEj, srj)}), where n is the name of the elementary business process, BEj is the jth business entity which semantically relates to the corresponding EBP. srj∈{Create, Read, Update, Delete} is the type of the semantic relationship between EBP and BEj [9].
Definition 5 (CRUD matrix): A CRUD matrix can be defined as M = {sr(EBPi, BEj) | i=1..#row and j=1..#column}, where EBPi is the ith EBP and BEj is the jth BE. Also, #row is the number of EBPs and #column is the number of BEs in the model. Finally, sr(EBPi, BEj) ∈{Create, Read, Update, Delete} is the type of the semantic relationship between EBPi, and BEj [9].
Definition 6: The kth cluster of the CRUD matrix can be defined as Cluster k = {(EBPi, BEj) | i = l1..h1, j = l2..h2}, where 1 ≤l1≤h1 ≤ #row and 1 ≤l2≤h2 ≤ #column [9].
Definition 7: A software service can be defined as S = {n, I, Msg, RS}, where n is the name of the service, I is the set of operations associated with S, Msg is the set of messages corresponding to S, and RS is the set of relationships between S and other services in the service model. In other words, I is
the set of corresponding EBPs, and Msg is the set of corresponding BEs.
Definition 8 (Characteristics of the clusters):
Suppose that k = {(EBPi, BEj) | i = l1..h1, j = l2..h2} and k'= {(EBPi, BEj) | i = l’1..h’1, j = l’2..h’2} are two clusters of CRUD matrix M. Now,
• Non-intersection: for all clusters k and k’, k ∩ k' = {}; this means that clusters k and k’ have nothing in common in their structural and behavioral elements.
• For all k and k' in which l'1 = h1 and l'2 = h2, k ∪ k' = {(EBPi, BEj) | i = l1..h’1, j = l2..h’2}; this means that the union of two clusters is equivalent to merging them.
• Completeness: If M is clustered into n clusters, then ; in other words, the union of all the
clusters constituting the CRUD matrix is equivalent to that matrix.
IV. SOA DESIGN PRINCIPLES
In this section we first define principles to measure the alignment of services with enterprise business goals (As we said earlier, we consider agility as the main objective of the enterprise). After discussing the relationships between these principles and enterprise objectives, some metrics for measuring these principles are provided. Tables I and II below summarize our principles and metrics. Now, we begin illustrating the principles, i.e., structural complexity, cohesion and autonomy and also their associated metrics in detail.
TABLE I. DESIGN PRINCIPLES AND METRICS
Description MetricDesign
Principle Goal
Represents the service complexity by considering the number and complexity of its input and output messages.
SSC Structural Complexity
Business Agility
Indicates the degree of conceptual relationship between service operations based on the service actions performed upon its BEs.
CCM Cohesion
Shows service capability for performing related operations independently. TSA Autonomy
TABLE II. SUMMARY OF METRICS
Description Uses Metric
BE’s complexity based on its attributes BEC SSC
Operations’ complexity based on its actions IFC
Conceptual relationship level between two operationsbased on their shared entities
ERF CCM
Conceptual relationship level between two operations based on their unshared entities
IRF
Service dominance over its BE’s DOM TSA
Service dependency degree on other services in order to perform its operations
DEP
122

A. Structural Complexity To calculate the structural complexity, we consider the
service as a set of elementary business processes that perform a set of predefined operations on business entities, i.e., Create, Read, Update and Delete. Structural Complexity of a service could be defined based on its relationships at the design level, in such a way that simpler relationships have a lower complexity value. Therefore, the complexity of a service could be defined by its operations and messages.
As stated earlier, a service is defined as a cluster over a CRUD matrix. To determine the structural complexity, the complexity of messages (equal to BEs in the CRUD matrix) should be calculated. On the other hand, the complexity of a BE could be determined using the BE’s attributes.
1) Reasons for choosing this principle Having complex services in place, more work to specify,
construct and test every interface on the service is required at the modeling phase. This extra work has a negative impact on agility during changes in the business. Services with simple interfaces, however, are rarely subject to changes since they are related to fewer business entities. They also require less work to adapt to business changes, in contrast to complex services.
2) Business Entity Complexity (BEC) Complexity of a BE is defined as the sum of complexities
of its attributes. We classify the attributes of a BE into two categories; Primitive and Composite. Also, we classify the composite type into Simple and Complex categories. Then, as shown in Table III, in accordance with different structures, the value of complexity for each category is assigned empirically.
TABLE III. COMPLEXITY VALUES FOR DATA TYPE CATEGORIES
complexity Example Data Type
1 Integer, Floating point Primitive
5 Date, String Simple Composite
10 Class Complex Composite
3) Service Interface Complexity (IFC)
Service specifications are extracted from the clusters in the CRUD matrix [10]. In the scope of a cluster, EBPs that access a BE at least once, are interpreted as service operations. EBP input and output messages are determined using the type (Create, Read, Update and Delete) of the relationship between the EBP and its BEs.
To calculate the complexity of the service interface, the complexity of each of its EBPs is considered based on the BE complexity discussed in subsection 2. In other words, the complexity of an EBP is based on the complexity of its BEs as its input and output messages as follows: , ∑ 0, (1)
where i is the service index, j is the EBP index, li and hi define the boundary of the ith service BEs according to the CRUD matrix. Also, M[0, k] is the corresponding complexity of BEk (based on the discussion given in subsection 2) that is given in row 0 and column k of the CRUD matrix. Finally, xjk = 1 if the entry in row i and column j of the CRUD matrix is C, R
or D because in these cases we have only one message which is either input or output; otherwise, xjk = 2. The reason for selecting such values is that creation (C) of a BE by an EBP creates one output message for the related EBP operation. Similarly, reading (R) and deleting (D) of a BE by an EBP define one input message for their corresponding operations. However, an update (U) operation takes one input message and produces one output message. Finally, the complexity of the service interface based on the complexity of its EBPs is defined as follows: ∑ ,∑ ∑ , (2)
The above formula computes the complexity of the ith service, where S is the total number of services. Also, li and hi define the boundary of the EBPs for the ith service according to the CRUD matrix.
B. Entity-Centric Service Cohesion Considering their high reusability capability, entity-centric
approaches have been the focus of many researchers recently. Likewise, the entity-centric business services as the external view of business processes are emphasized in many studies. In this section, some metrics to measure service cohesion from entity-centric point of view are proposed.
1) Reason for choosing this principle Entity-centric services are defined as services that focus on
and encapsulate shared business entities. When a service encapsulates a number of business entities with strong relationships, its reusability is improved [8], since business entities are not usually changed during the course of time, in contrast to business processes. Thus, entity-centric services are more reusable and can be rapidly adapted to business changes; hence, they result in improving business agility. On the other hand, high cohesion prevents change propagation among services. Therefore, it facilitates maintenance and clearly improves business agility. This is due to high clarity, ease of comprehension and concentration on a single functionality in cohesive services.
2) Degree of relationship between operations We propose to calculate the degree of relationship between
operations based on the number of shared entities. To achieve this goal, a graph theory approach is used. Consider G as a graph in which the set of nodes (V) constitutes the service operations. Assume that service S with a set of operations is defined as O = {O1, O2, …, Om}. Each operation Oj of service S accesses a set of business entities represented by set BEj = {BEj,1, BEj,2, …, BEj,n}. There is an edge from Oi to Oj if and only if the BE BE is not empty. Therefore, each edge in graph G represents a relationship between two operations that process at least one shared business entity. Since intersection is a symmetric relation, the resulting graph is an undirected graph. , (3)
Based on the above formula, it is obvious that ERF(i, j) is always between 0 and 1 (0≤ERF(i, j)≤1).
123

Considering the fact that only shared buconsidered in the above metric, we define ancalculates the relationship degree between entities. Similar to the approach of [11], twoare called related if there is at least one sharbehavioral model. Consider the bipartite grapand k are defined as follows:
,
There is an edge between nodes s and there is at least one business process that pand BEs. Therefore, we define IRF (Implicit Rthe amount of implicit Relationship betwentities in proportion to the total number of en,
Where is the number of nodes ERF, IRF is always between 0 and 1 (0≤IRF
Having calculated both ERF and IRF of acan now move on toward a comprehensive mcohesion between two operations of a givemetric called CCF (Comprehensive Cohesioj) between operations i and j of service S isfollowing manner: , ,
Similar to ERF and IRF, the CCF is alsoNow CCM (Comprehensive Cohesion Metrthe sum of connections between all the oservice. ∑ ∑ ,, , 11 , 1
In the above formula, n is the total numbservice S.
C. Autonomy One of the primary considerations at the
decision on how application logic should bservices and also on grouping operations service context is service autonomy [8]. Aureferred to by many names in the literaturcontaining, self-controlling and self-governpoint to the independence of the service in oduties and the level of control on its logic.
Service autonomy has a great impact attributes, such as discoverability, reusabibeing of services that are considered in dependencies are depicted in Figure 1.
usiness entities are nother attribute that unshared business o business entities ed activity in their
ph G , such that m
t in graph when processes both BEt Relation Factor) as
ween two business ntities:
(4)
in graph . Like (i, j) ≤1).
a given service, we measurement of the en service using a on Factor). CCF (i, s calculated in the
, (5)
o between 0 and 1. ric) of a service is operations of that
(6)
er of operations of
e time of making a be divided up into together within a
utonomy has been re, including self-
ning, all of which rder to perform its
on other service ility and stateless
SOA [8]. These
Figure 1: Autonomy relationship to
Considering the definitioprevious sections, autonomy is
A service is autonomous if and delete its internal BEs witservices. To calculate the degbetween 0 and 1 is assigned toand D based on their priomultipliers are listed in Table IV
TABLE IV. CRUD ACTIONS AND
Action
Create (C)
Update (U)
Delete (D)
Read (R)
As shown in the above tabl(C+R+U+D) equals to 1.
1) Reason for Choosing thiAs mentioned earlier, aut
service stateless being. Also, baffect business agility conseqservice performs its duties wother services, it is clear threusability. Such service can bchanges and aligned with the achieve business goals. It also rand changed in order to facilitat
In the following, we introservice autonomy.
2) Dominancy This metric measures the l
internal operations according to∑ ∑ Where hi-li+1 is the number
set containing Create, Read, Upof the actions in SR and finally
o other design principles [8]
n of service provided in the defined as follows:
f it is able to create, read, update thout any assistance from other gree of autonomy, a multiplier o each of the operations C, R, U ority (C>U>R>D) [9]. These V.
D THEIR CORRESPONDING COEFFICIENT
Value
0.4
0.3
0.2
0.1
le, summation of the multipliers
is Principle tonomy affects reusability and ased on [8], these two attributes quently. Since an autonomous
with minimum interaction with at it has high scalability and be rapidly changed by business enterprise business in order to
requires less effort to be aligned te business agility.
oduce two metrics to calculate
level of service control over its o the following formula:
, (7)
r of BEs inside service i, SR is a pdate and Delete, sr refers to one y, Vsr is the value of sr multiplier
124

according to Table IV. , if there is at least one EBP in the service that performs operation sr over the jth BE; otherwise, , .
3) Dependency As discussed previously, low dependency of a service to
other services increases autonomy. This metric calculates the level of service dependency using the following formula:
# 8
Where is the value of the corresponding operation sr multiplier according to Table IV. By calculating the DEP, one could determine the dependency degree of service i to other services.
Finally, considering the DOM and DEP, service autonomy could be defined as follows:
SA i 0 9 Where NBE (i) is the number BEs in the ith service.
D. Comprehensive Evaluation In this subsection a comprehensive method to evaluate
services using the proposed metrics is provided. Considering the fact that a well-defined service should have a high level of autonomy and cohesion, should have a minimal structural complexity and its interface must be simple, the final equation is as follows:
(10)
From our viewpoint each of the above mentioned design principles has the same level of influence over business agility. On the other hand, the tendency of cohesion, autonomy and complexity values are high, high and low respectively. Therefore, coefficients of the above formula are α=β=1 and γ = -1.
V. CASE STADY To show the ability of the proposed metrics to be
automatically measured and provide a step by step overview of the approach, a case study is presented in this section. Using this case study, applicability and usability of the metrics at the modeling level could be further validated. The case study is about a sale scenario described in [12].
The CRUD matrix of this sample scenario, together with related services in colored clusters, is depicted in Figure 2.
Figure 2: Sale scenario CRUD matrix
A. Calculating the structural complexity metric In order to calculate the structural complexity, BE’s
complexity should be determined based on the discussion given in section IV. Complexity calculation of the customer business entity is summarized in Table V.
TABLE V. COMPLEXITY OF CUSTOMER ENTITY
Customer Attributes Data Type Complexity
Customer ID Integer 1 Name String 5
Last name String 5 Address String 5
Phone No. String 5
Complexity of other business entities can be calculated in a similar manner. The final results can be found in row “BE Complexity” of the CRUD matrix; see Figure 2.
Next the complexity of service 2, highlighted with green in Figure 2, is calculated as an example in Table VI (The indexes of BEs and EBPs correspond to the related column and row in the CRUD matrix, respectively; for example, EBP5 corresponds to the 5th EBP in the CRUD matrix, i.e., “Calculate discounts”) followed by the complexity of other services in Table VII.
TABLE VI. DETAILS OF COMPLEXITY CALCULATION FOR SERVICE
Structural Complexity of Service 2
EBP4 Complexity
(BE4complexity *1) = 12
EBP5 Complexity
(BE4complexity *1) + (BE5complexity *1) = 12+17 = 29
EBP6Complexity
(BE4complexity *1) = 12
EBP7 Complexity
(BE4complexity *1) + (BE5complexity *1) = 12+17 = 29
EBP8Complexity
(BE5complexity *1) = 17
Service2 Complexity
12+29+12+29+17 = 99
125
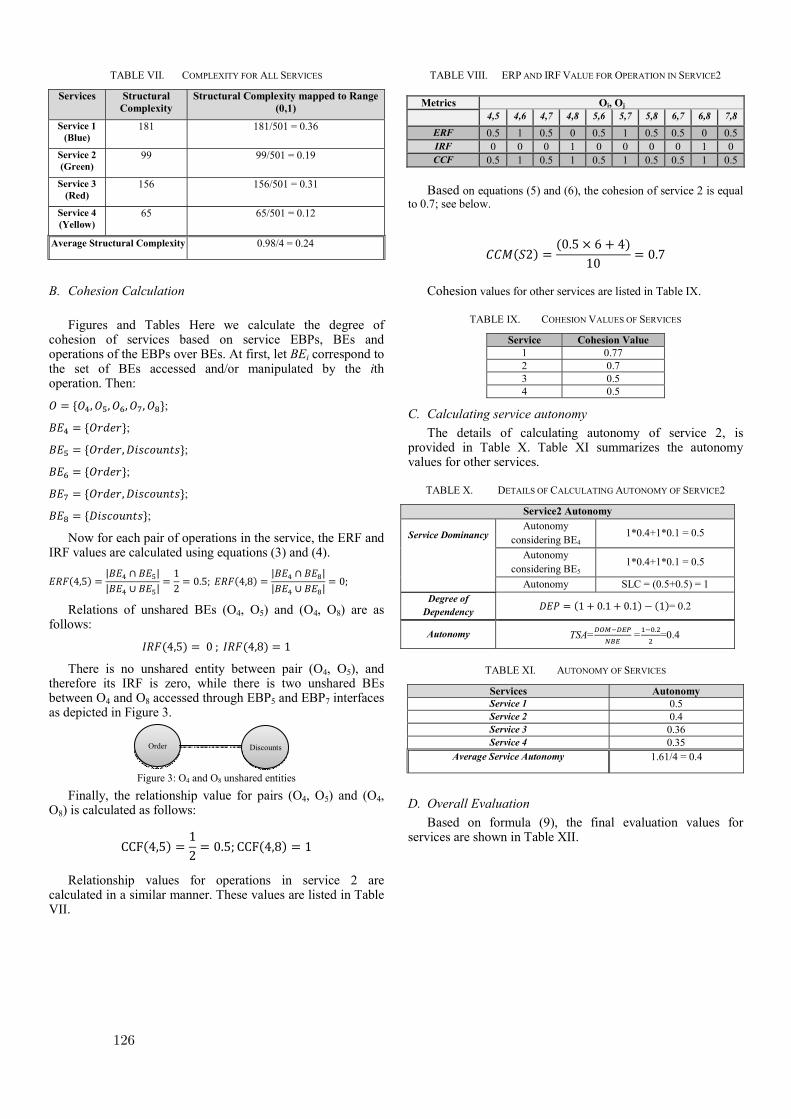
TABLE VII. COMPLEXITY FOR ALL SERVICES
Services Structural Complexity
Structural Complexity mapped to Range (0,1)
Service 1 (Blue)
181 181/501 = 0.36
Service 2 (Green)
99 99/501 = 0.19
Service 3 (Red)
156 156/501 = 0.31
Service 4 (Yellow)
65 65/501 = 0.12
Average Structural Complexity 0.98/4 = 0.24
B. Cohesion Calculation
Figures and Tables Here we calculate the degree of cohesion of services based on service EBPs, BEs and operations of the EBPs over BEs. At first, let BEi correspond to the set of BEs accessed and/or manipulated by the ith operation. Then: , , , , ;
; , ;
; , ;
;
Now for each pair of operations in the service, the ERF and IRF values are calculated using equations (3) and (4). 4,5 | || | 12 0.5; 4,8 | || | 0;
Relations of unshared BEs (O4, O5) and (O4, O8) are as follows: 4,5 0 ; 4,8 1
There is no unshared entity between pair (O4, O5), and therefore its IRF is zero, while there is two unshared BEs between O4 and O8 accessed through EBP5 and EBP7 interfaces as depicted in Figure 3.
Figure 3: O4 and O8 unshared entities
Finally, the relationship value for pairs (O4, O5) and (O4, O8) is calculated as follows: CCF 4,5 12 0.5; CCF 4,8 1
Relationship values for operations in service 2 are calculated in a similar manner. These values are listed in Table VII.
TABLE VIII. ERP AND IRF VALUE FOR OPERATION IN SERVICE2
Based on equations (5) and (6), the cohesion of service 2 is equal
to 0.7; see below.
2 0.5 6 410 0.7
Cohesion values for other services are listed in Table IX.
TABLE IX. COHESION VALUES OF SERVICES
Service Cohesion Value 1 0.77 2 0.7 3 0.5 4 0.5
C. Calculating service autonomy The details of calculating autonomy of service 2, is
provided in Table X. Table XI summarizes the autonomy values for other services.
TABLE X. DETAILS OF CALCULATING AUTONOMY OF SERVICE2
Service2 Autonomy
Service Dominancy
Autonomy considering BE4
1*0.4+1*0.1 = 0.5
Autonomy considering BE5
1*0.4+1*0.1 = 0.5
Autonomy SLC = (0.5+0.5) = 1 Degree of
Dependency 1 0.1 0.1 1 = 0.2
Autonomy TSA= = . =0.4
TABLE XI. AUTONOMY OF SERVICES
Services Autonomy Service 1 0.5 Service 2 0.4 Service 3 0.36 Service 4 0.35
Average Service Autonomy 1.61/4 = 0.4
D. Overall Evaluation Based on formula (9), the final evaluation values for
services are shown in Table XII.
Oi, Oj Metrics 7,8 6,8 6,7 5,8 5,7 5,6 4,8 4,7 4,6 4,5
0.5 0 0.5 0.5 1 0.5 0 0.5 1 0.5 ERF 0 1 0 0 0 0 1 0 0 0 IRF
0.5 1 0.5 0.5 1 0.5 1 0.5 1 0.5 CCF
DiscountsOrder
126

TABLE XII. OVERALL EVALUATION OF SERVICES
Overall evaluationServices
0.91 Service 1
0.91 Service 2
0.55 Service 3
0.73 Service 4
VI. DISCUSSION In this section we demonstrate the obtained values for the
proposed metrics in the previous section clearly show these metrics could be used to measure structural complexity, cohesion and autonomy design principles. In other words, these metrics could ensure service alignment with business agility.
For example, consider service 1 and 3 of the CRUD matrix in Figure 2. Overall evaluations for these services are 0.91 and 0.55, respectively. All operations of service 1 access both Customer and Credit business entities. Also, the second operation of this service accesses business entity Account Receivable Note while none of the other two operations in the same service has an unshared entity with the second operation; hence their IRF is zero. However, since all three operations in service 1 access Customer and Credit, their cohesion is 0.77. In service 3, the second and third operations (like operations in service 1) access both business entities Invoice and Shipping Schedule, but the first operation only has the invoice business entity in common with the second and third services. It is clear that the cohesion of service 3 should be less than the service 1. This is perfectly reflected in the value of the cohesion metric since the cohesion value of service 3 operations is equal to 0.5 and is less than the value of service 1.
Autonomy value of services 1 and 3 are 0.5 and 0.36, respectively.
Service 1 performs create and read actions of Credit BE and also the create action of Account Receivable Note BE. Similarly, service 3 performs create and read actions of Invoice BE and create action of Draft BE. However, service 1 performs three actions, i.e., Create, Read and Update, over Credit BE while service 3 only performs create and read actions of Shipping Schedule. This is why SLC of service 1 is greater than that of service 3. On the other hand, service 1 has only two dependencies to other services in order to read Order and Invoice BEs which is less than service 3 dependencies. This is because service 3 has three dependencies to other services to read Customer, Credit and Order BEs. Therefore, service 1 is more autonomous than service 3 and the obtained values are justifiable.
Since the number of input and output messages for the operations of services 1 and 3 and also the complexity of their corresponding BEs are about the same, their complexity values is also close to each other (Complexities are 0.36 and 0.31 for services 1 and 2, respectively). Using similar logical analysis for other services, it could be shown that the proposed metrics have measured cohesion, structural complexity and autonomy design principles flawlessly.
Our goal in this paper has been to measure the quality of identified services in terms of enterprise business goals, specially the business agility as the focus of the authors. The degrees of alignment with the business agility for services 1 to 4 are 0.91, 0.91, 0.55 and 0.73, respectively. Considering the mentioned reasons for selection of design principles and their effects on the agility, we now analyze these overall values. As mentioned earlier, the tendencies of cohesion, structural complexity and autonomy values are high, low and high, respectively. Cohesion values for services 1 and 2 are 0.77 and 5.3, respectively. Cohesion of a service means that its operations should be related in terms of a domain concept; in other words, they concentrate on a single business functionality. Cohesive services are more reusable because they have a clearer application domain. Also, by increasing clarity and ease of comprehension of identified services, the maintainability of service oriented systems improves, which, according to subsection 4.2.1, has a great impact on the business agility. The impact of autonomy and structural complexity on the business agility could be determined in a similar manner.
Obtained values for cohesion and autonomy of service 1 are greater than that of service 3.Therfore, the alignment of service 1 with the business agility in terms of cohesion and autonomy is greater than that of service 3. On the other hand, the complexity of service 1 is more than service 3 (0.36 for service 1 and 0.31 for service 3). This means that in terms of this design principle, service 3 is more aligned with the business agility in comparison to service 1. Nevertheless, the overall evaluation shows that by considering all three design principles, service 1 is better aligned with business agility than service 3 (0.91 for service 1 and 0.55 for service 3).
VII. CONCLUSION In this paper we proposed a set of metrics to measure
service accordance with SOA design principles that have significant impact on business agility. These principles are service cohesion, structural complexity and autonomy. In this work, services have been considered as a set of operations that perform four actions read, create, update and delete on business entities, and could be identified as clusters in a CRUD matrix of elementary business processes to business entities.
We analyzed the role of the selected design principles in improving the business agility and provided a detailed description of the metrics in relation to these principles. The metrics enable measurement in an automatic manner using the information available at the time of designing services. The effectiveness of this approach was examined in a case study using a sales scenario as the sample. The case study demonstrates the applicability of using these metrics to measure service alignment with business agility at the design level.
In this research we assumed the same level of importance for the role of each design principle according to the business agility.
This initial assumption could be improved by using a different weight for each factor based on its importance. Also,
127

future studies could consider more design principles that have potential impact on business agility.
REFERENCES
[1] Eric, A. M., and MICHAEL, B. 2006.Executive Guide to Service-
Oriented Architecture., Wiley., Canada.
[2] Chidamber, S. R., and Kemerer, C. F. 1994.A Metrics Suite for Object-Oriented Design. vol. 20, no. 6.
[3] Bansiya, J., and Davis, C. G. 2002. A HierarchicalModel for Object-Oriented Design Quality Assessment. vol. 28, no. 1.
[4] Bingu, S., Siho C, Suntae, K., and Sooyong, P. 2008.A Design Quality Model for Service-Oriented Architecture. 15th Asia-Pacific Software Engineering Conference.
[5] Zhou, N., Zhu, Y., and Wang H. 2009.Evaluating Service Identification with Design Metrics on Business Process Decomposition. IEEE International Conference on Services Computing.
[6] Choi, S.W., Her, J.S., and Kim,S.D. 2007. Modeling QoS Attributes and Metrics for Evaluating Services in SOA Considering Consumers’ Perspective as the First Class Requirement. IEEE Asia-Pacific Services Computing Conference.
[7] Salcedo,O.J., Sierra, F.A., and Hernandez, C. 2009. An Approach to Quality of Service Evaluation Using Computational Intelligence.International Conference on New Trends in Information and Service Science.
[8] Erl, T.2005. Service-Oriented Architecture (SOA): Concepts, Technology, and Design. Prentice Hall.
[9] Khoshnevis, S., et al. 2009. ASMEM: A Method for Automating Model Evolution of Service-Oriented Systems. in 3rd International Workshop on a Research Agenda for Maintenance and Evolution of Service-Oriented Systems (MESOA 2009).
[10] Shams, F,. et al. 2009. A Framework for Automatic Transformation of EnterpriseBusiness Model to Service Model.Technical Report. Tehran.
[11] Kumaran, S., Liu, R., and Wu, F. 2008. On the Duality of Information-Centric and Activity-Centric Models of Business Processes.CAISE. pp. 32-47.
[12] Rostampour, A., Kazemi, A., Shams, F.,Zamiri, A., and Jamshidi,P.2010.A Metric for Measuring the Degree of Entity-Centric Service Cohesion. International Conference on Service Oriented Computing and Application (SOCA).IEEE.
[13] Jamshidi, P.,Khoshnevis, S. Teimourzadegan, R., Nikravesh, A., Khoshkbarforoushha, A., and Shams, F.2009. Toward Automatic Transformation of Enterprise. in ICSE’09 Workshop,Vancouver, Canada.
128