A market-power based model of business groups
51
eScholarship provides open access, scholarly publishing services to the University of California and delivers a dynamic research platform to scholars worldwide. University of California Peer Reviewed Title: A market-power based model of business groups Author: Feenstra, Robert C , University of California. Davis Huang, D S Hamilton, G G Publication Date: 08-01-2003 Publication Info: Postprints, Multi-Campus Permalink: http://escholarship.org/uc/item/5fq521qg Additional Info: The published version of this article is available at: (www.elsevier.com/locate/econbase) Keywords: business group, chaebol, vertical integration, horizontal integration Abstract: We propose an model of vertically and horizontally-integrated business groups that allows the number and size of each group to be determined endogenously. We find that more than one configuration of groups can arise in equilibrium: several different types of business groups can occur, each of which are consistent with profit-maximization and are stable. We suggest that the strongly-integrated groups arising in the model characterize the chaebol found in South Korea, whereas the less-integrated groups describe those found in Taiwan. (C) 2002 Elsevier Science B.V. All rights reserved. Supporting material: 1. Appendix[download] Supporting Material Appendix
-
Upload
washington -
Category
Documents
-
view
4 -
download
0
Transcript of A market-power based model of business groups
eScholarship provides open access, scholarly publishingservices to the University of California and delivers a dynamicresearch platform to scholars worldwide.
University of California
Peer Reviewed
Title:A market-power based model of business groups
Author:Feenstra, Robert C, University of California. DavisHuang, D SHamilton, G G
Publication Date:08-01-2003
Publication Info:Postprints, Multi-Campus
Permalink:http://escholarship.org/uc/item/5fq521qg
Additional Info:The published version of this article is available at: (www.elsevier.com/locate/econbase)
Keywords:business group, chaebol, vertical integration, horizontal integration
Abstract:We propose an model of vertically and horizontally-integrated business groups that allows thenumber and size of each group to be determined endogenously. We find that more than oneconfiguration of groups can arise in equilibrium: several different types of business groups canoccur, each of which are consistent with profit-maximization and are stable. We suggest that thestrongly-integrated groups arising in the model characterize the chaebol found in South Korea,whereas the less-integrated groups describe those found in Taiwan. (C) 2002 Elsevier ScienceB.V. All rights reserved.
Supporting material:1. Appendix[download]Supporting MaterialAppendix

Journal of Economic Behavior and Organization, 51, 2003, 459-485.
A Market-Power Based Model of Business Groups
by
Robert C. Feenstra Department of Economics
University of California, Davis, and National Bureau of Economic Research
Deng-Shing Huang
Institute of Economics Academia Sinica
Gary G. Hamilton
Department of Sociology University of Washington, Seattle
Revised, August 2002
Abstract
We propose an model of vertically and horizontally-integrated business groups that
allows the number and size of each group to be determined endogenously. We find that more
than one configuration of groups that can arise in equilibrium: several different types of business
groups can occur, each of which are consistent with profit-maximization and are stable. We
suggest that the strongly-integrated groups arising in the model characterize the chaebol found in
South Korea, whereas the less-integrated groups describe those found in Taiwan.
JEL classification: L22 Keywords: Business group, chaebol, vertical integration, horizontal integration Address for correspondence: Robert Feenstra, Department of Economics, University of California, One Shields Ave., Davis, CA 95616-8578. E-mail: [email protected] Phone: (530)752-7022 Fax: (530)752-9382.

1. Introduction
Business groups are observed in many countries of Europe, Asia and Latin America.
What is surprising about their proliferation is not the contrast with the United States (where such
groups violate antitrust law),1 but the diverse structure of such groups in otherwise similar
economies. For example, South Korea has some of the largest and most vertically-integrated
groups (called chaebol) found anywhere in Asia, whereas the groups in Taiwan are much smaller
and concentrated in upstream sectors, selling intermediate inputs to unaffiliated firms. The
keiretsu in Japan are themselves quite diverse, ranging from six large intermarket or “main bank”
groups, each of which spans a wide range of markets and includes a bank and trading company,
to other non-bank groups that are vertically-integrated within an industry and may include firms
from the “main bank” groups (Ito, 1992, chap. 7).
What accounts for these different group structures across, and even within, economies?
The transactions cost explanation for vertical integration often relies on different industry
characteristics: thus, Williamson (1975,1985) emphasizes the “asset specificity” of investments,
and subsequent empirical work has attempted to measure this in specific industries. This type of
explanation is hard-pressed to explain the very different degrees of vertical integration within the
same industries across Asian countries. Policy-based explanations overcome this limitation,
since policies can be expected to lead to different industrial structure in the same industry, but
have another drawback: even when policies are removed, the structure of business groups can
remain intact for a considerable time (as happened in South Korea). This is consistent with a
1 The Glass-Steagall Act of 1933 prohibits U.S. Federal Reserve member banks from owning stock, so banks cannot act as both lenders and shareholders as occurs in Japan. Furthermore, the Investment Company Act of 1940 prevents one company from taking a managerial role in another unless it actually owns it. In response to these legal restrictions, it is reasonable to view the multi-divisional structure of American conglomerates as the particular form that “industrial groups” take in America, as argued by Chandler (1982).
2
policy-based explanation only if there is path-dependence at work, so that past policies continue
to affect current structure. Path-dependence, in turn, suggests the possibility of multiple
equilibria in the structure of business groups, our focus in this paper.
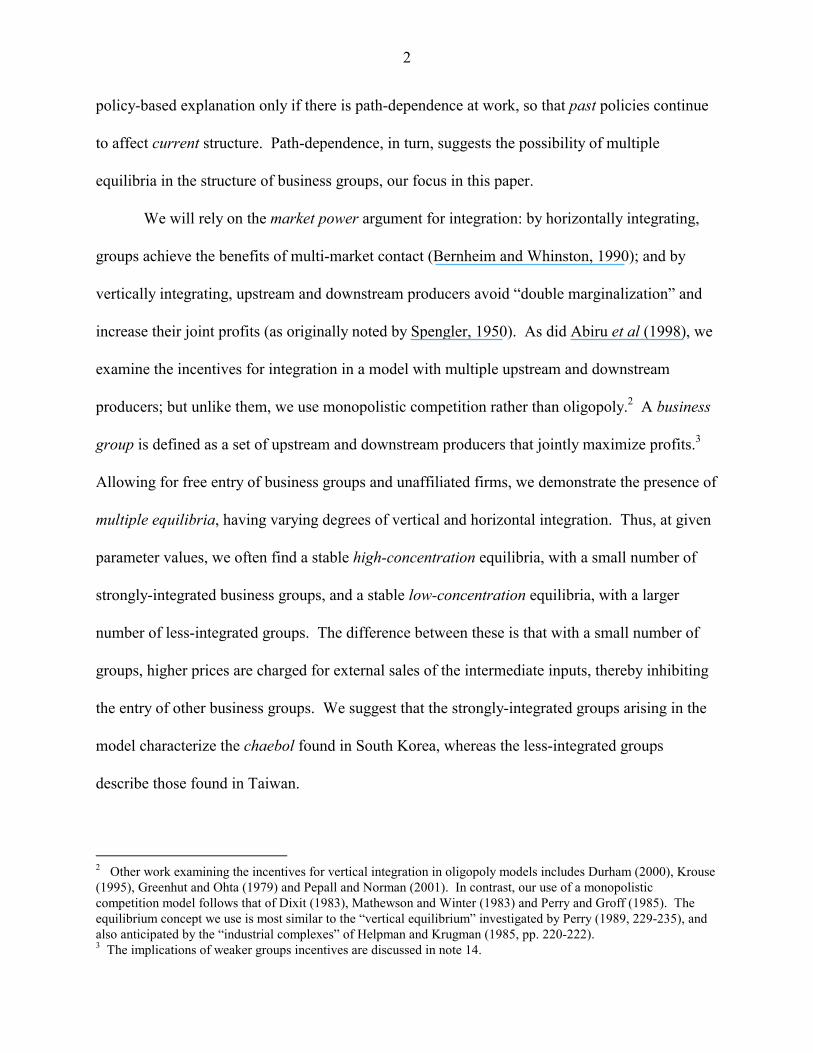
We will rely on the market power argument for integration: by horizontally integrating,
groups achieve the benefits of multi-market contact (Bernheim and Whinston, 1990); and by
vertically integrating, upstream and downstream producers avoid “double marginalization” and
increase their joint profits (as originally noted by Spengler, 1950). As did Abiru et al (1998), we
examine the incentives for integration in a model with multiple upstream and downstream
producers; but unlike them, we use monopolistic competition rather than oligopoly.2 A business
group is defined as a set of upstream and downstream producers that jointly maximize profits.3
Allowing for free entry of business groups and unaffiliated firms, we demonstrate the presence of
multiple equilibria, having varying degrees of vertical and horizontal integration. Thus, at given
parameter values, we often find a stable high-concentration equilibria, with a small number of
strongly-integrated business groups, and a stable low-concentration equilibria, with a larger
number of less-integrated groups. The difference between these is that with a small number of
groups, higher prices are charged for external sales of the intermediate inputs, thereby inhibiting
the entry of other business groups. We suggest that the strongly-integrated groups arising in the
model characterize the chaebol found in South Korea, whereas the less-integrated groups
describe those found in Taiwan.
2 Other work examining the incentives for vertical integration in oligopoly models includes Durham (2000), Krouse (1995), Greenhut and Ohta (1979) and Pepall and Norman (2001). In contrast, our use of a monopolistic competition model follows that of Dixit (1983), Mathewson and Winter (1983) and Perry and Groff (1985). The equilibrium concept we use is most similar to the “vertical equilibrium” investigated by Perry (1989, 229-235), and also anticipated by the “industrial complexes” of Helpman and Krugman (1985, pp. 220-222). 3 The implications of weaker groups incentives are discussed in note 14.

3
In section 2 we briefly discuss the groups of South Korea and Taiwan and motivate the
assumptions of our model that we analyze in sections 3 and 4. In section 5 we compute the
equilibria for a range of parameter values and demonstrate that multiple equilibria with varying
degrees of vertical integration indeed occur. Conclusions are given in section 6.
2. Business Groups in South Korea and Taiwan
A large literature describes the business groups in South Korea4 and Taiwan.5 These two
economies have some basic similarities in their land mass, population density, GDP per capita,
levels of education, and religions. Both countries were occupied by the Japanese for extended
periods prior to and during World War II, and following the Chinese and Korean civil wars, both
embarked upon ambitious programs of industrialization combined with successful land reform in
agriculture. However, the form of industrialization programs in the two countries was quite
different.
In South Korea, extensive government support in the form of low-interest loans and
export subsidies was given to the chaebol, which grew in part from firms associated with the
Japanese zaibatsu. The chaebol rapidly diversified both horizontally and vertically, controlling
the full range of activities from resource processing to international marketing. Despite the
excess capacity that developed, leading to a reversal of policy after the Park regime ended in
1979, Amsden argues that this was a successful case of government intervention. In Taiwan, by
contrast, government support was much more limited and consisted of encouraging the
establishment of upstream industries to supply the essential inputs for independent firms
4 The chaebol are described in Amsden (1989), Biggart (1990) Hamilton and Biggart (1988), Hamilton, Zeile, and Kim (1990), Kim (1991,1993,1997), Orru, Biggart, and Hamilton (1991), Steers et al. (1989) and Zeile (1991). 5 See Chou (1985), Gold (1986), Greenhalgh (1988), Hamilton and Biggart (1988), Hamilton and Kao (1990), Numazaki (1986,1991), and Wade (1990).

4
downstream. Wade also describes this as a case of successful intervention.
The structure of business groups established in the post-war years has proved to be
remarkably stable. Recent evidence is provided by firm-level databases of the largest 44 business
groups in South Korea in 1989 and largest 80 groups in Taiwan in 1994, described in Feenstra
(1997) and Feenstra, Hamilton and Huang (2001). The firm-level sales are aggregated to twenty-
one manufacturing sectors and several non-manufacturing sectors. For South Korea, about one-
half of the sectors have business group sales that account for more than 25% of total sales, and in
several cases the business group sales account for more than 50% of total sales, including
petroleum and coal, electronic products, motor vehicles and shipbuilding. The groups have a
strong presence in both upstream and downstream sectors. Overall, the 44 business groups in
1989 account for 40% of manufacturing output, together with 13% in mining, 32% in utilities,
and 24% in transportation, communication and storage.
In Taiwan, by contrast, the business groups dominate in only a selected number of
upstream sectors. For example, in textiles the business groups account for nearly one-half of
total manufacturing sales. These groups sell downstream to the garment and apparel sector,
where business groups are almost nonexistent. This pattern also occurs with strong group
presence in pulp and paper products, chemical materials, non-metallic minerals, and metal
products. In comparison, business groups have a weak presence in downstream sectors such as
wood products, chemical products, rubber and plastic products, as well as beverages and tobacco.
Overall, the groups account for only 16% of total manufacturing output in 1994, along with small
shares outside of manufacturing.
The vertical integration of each group is measured by the sales between firms in a group,
relative to total sales by that group: the internal sales ratio, which is calculated both with and

5
without sales to trading companies.6 The largest groups for Korea – Samsung, Hyundai, Lucky-
Goldstar, Daewoo, and Sunkyong – have 1989 sales ranging from $8.9 to $26 billion. Their
average internal sales ratio is 27%, or 17.6% with trading companies excluded. These huge
groups are all larger than the top five for Taiwan – Formosa Plastics, Shin Kong, Wei Chuan Ho
Tai, Far Eastern, and Yulon – with average 1994 sales of $5.2 billion. The average internal sales
ratio for the top five in Korea is twice as much as that for Taiwan and three times as much when
trading companies are excluded (and these differences are statistically significant).7
Outside of the top five, Korea has an average internalization ratio of 9.2% for the
remaining groups (or 7.2% without trading companies), which compares with the average
internalization for all groups in Taiwan of 7.0% (or 6.0% without trading companies). These
differences are not statistically significant. Thus, it is the top five groups for Korea that are the
outliers in these comparisons. In addition to their vertical integration, these groups are also
diversified over a broader range of sectors than are smaller groups in Korea or in Taiwan. Thus,
the Herfindahl index at the group level is: 0.72 for the top five groups in Korea, 0.50 for the
remaining 39 groups, 0.56 for the largest five groups in Taiwan, and 0.33 for the remaining 75
groups.8 Not only are the top groups in Korea highly vertically-integrated, but they are also
horizontally diversified over a very wide range of manufacturing and service sectors.
6 The trading companies are engaged in transferring goods between firms within a group, so including them within the internal sales ratio artificially inflates this measure of vertical integration. A fuller description of the trading companies, and their effect on the internalization ratio, is provided in Feenstra (1997). 7 In comparison, Gerlach (1992, 143-149) reports that for the six intermarket groups in Japan, the rate of internal transactions has been variously calculated to be around 10%. For the vertical keiretsu however, internalization is higher. An unpublished report by the Japanese Fair Trade Commission asks groups what they buy from companies in which they have more than 10% equity, even when those companies are not part of the same intermarket group. This leads to internal transactions of 38%, or even higher when overseas affiliates are included. 8 The Herfindahl index is defined as ∑− i
2is1 , where si is the share of total group sales devoted to each of twenty-
two manufacturing sectors, two primary products, three non-manufacturing products, and four service sectors.

6
What accounts for this differing group structure in South Korea and Japan? As noted
above, the differing industrial policies adopted in the two countries were undoubtedly important.
But since the low-interest loans to the chaebol were pursued mainly in the 1970s, this
explanation alone does not explain their similar structure throughout the 1980s and most of the
1990s. Besides such a policy-based explanation, Ghemawat and Khanna (1998) provide three
other reasons for business groups, which we discuss below. Our model will build upon the first
of these – market power. Khanna (2001) concludes that this is the least understood possible
reason for the existence of groups, prompting us to provide the greatest justification for it.
Since business groups typically are selling a range of different products, they benefit from
multi-market collusion, analyzed in a repeated game by Bernheim and Whinston. While our
model will be static, the multi-firm nature of groups will contribute to higher prices and profits.
Thus, for multi-product groups that are horizontally integrated, profits are increased through
strategic choice of prices for final goods, as will occur in our model. In addition, for vertically
integrated groups, we again expect that profits are increased through strategic choice of prices for
intermediate inputs. This process can be understood as follows.
It is well-known that if both the upstream and downstream firms are monopolies, then
integration eliminates the so-called “double marginalization” of prices and raises profits. The
same result holds when the downstream firm is competitive but uses the input in variable
proportions (see the references in Perry, pp. 191-192). A subsequent literature (see Dixit,
Mathewson and Winter, and Perry and Groff) has considered forward integration from a
monopolist to a downstream industry that is monopolistically competitive. They argue that the
benefits of integration can be equivalently achieved through price-based methods of vertical
restraint, or “nonlinear pricing,” such as franchise fees, royalties, and resale price maintenance.

7
Thus, these price-based methods of vertical restraint apparently eliminate the need for vertical-
integration through ownership.
In our model we will suppose that firms within a business group can act in this manner,
effectively selling the intermediate input at marginal cost while covering fixed costs through
transfers between firms. That is, even though the upstream and downstream firms are not fully-
owned by single company, we suppose that their membership within a business group confers the
communication and controls necessary to achieve the same result: marginal-cost pricing for
internal sales. The ability to achieve this outcome, thereby maximizing joint profits, amounts to
our definition of a business group.
In contrast, we do not suppose the group firms can engage in nonlinear pricing for sales
outside of the group, because the optimal type of pricing contract for external sales would be
quite complicated. In our model, business groups not only sell inputs to unaffiliated firms, but
also compete with unaffiliated firms in the downstream market. Thus, even if a group could
extract the full surplus on input sales to an unaffiliated downstream firm (through nonlinear
pricing), it would still normally want to restrict those sales to limit the competition it faces with
that firm in the downstream market. There may be some form of vertical-restraint that would
limit this competition, such as the purchase of an input bringing with it an agreement to limit
sales of the final good, but this is more complex than the situation analyzed by the literature cited
above. Indeed, Dixit (p. 94) concludes his paper with the observation: “Most importantly, it was
assumed that the upstream firm was a monopolist. In most actual contexts there are several such
firms, and strategic interactions among them are important. Questions of whether each
downstream firm will be tied to one upstream firms or can diversity across them make the
analysis difficult.” This is precisely the situation that we will be modeling, with business groups
8
and unaffiliated firms selling in both upstream and downstream markets. This complexity forces
us to ignore price-based methods of vertical restraint for sales outside of a group; instead, we
shall simply assume linear pricing and solve for the optimal markup on outside sales. This
approach is also taken by Pepall and Norman, for much the same reasons.
A second explanation sometimes given for business groups is their use of “related
resources,” interpreted broadly to include all externalities or scale and scope economies between
the activities of the group (Mehra, 1994). This is probably important for the business groups in
Taiwan, given their narrow focus on particular upstream products, and it may also motivate
integration into related industries for the Korean chaebol. It does not appear to provide an
explanation for the wide diversification in the largest groups in Korea, however.
A third explanation often given is that groups might correct for some market failure,
whether in financial markets, or because of transactions costs (Chang and Choi, 1988; Levy,
1991), or in the allocation of entrepreneurial ability (Leff, 1978). Failure of financial markets is
often cited as an explanation for the “main bank” groups in Japan and are undoubtedly
important.9 Financial ties to banks seem to be less important in South Korea and Taiwan, but at
the same time, the groups actively transfer funds between affiliate firms through “affiliate
payment guarantees” on bank loans and the sale of commercial paper from one affiliate firm to
another (Yoo, 1999). For example, in Korea the major firms (churyok kiop) in a business group
guarantee the bank loans made by their subsidiaries (chahoesa) in the group. Because only large-
sized firms enjoy accessibility to bank loans, the major firms in a business group play the role of
9 See Aoki and Patrick (1994), Hoshi, Kashyap and Sharfstein (1990a, 1991), Lincoln, Gerlach and Ahmadjian (1994) and Weinstein and Yafeh (1995, 1998).
9
financial provider for all other affiliates (Yoo 1995, pp. 180-186). 10 Thus, the Korean groups
indeed provide aspects of an “internal” capital market. There is a fundamental reason in our
model for such internal transfers: when the groups sell inputs internally at marginal cost, the
selling firms will not be covering their fixed costs of research and development. Therefore, it
will be necessary for other firms in the group to make a financial transfer to cover these losses.
Naturally, this sets up a principal-agent problem, whereby the transfers made to subsidiary firms
are not necessarily efficient, due to incomplete information.
Thus, even in our market-power model, there is a special reason to expect financial
transfers between firms that will lead to some inefficiency. We are not suggesting here that the
market-power explanation encompasses the financial market failure explanation for groups: on
the contrary, the main bank groups in Japan and conglomerate groups found elsewhere are likely
to diversify into unrelated areas as they seek investment opportunities for internal funds, and this
may well have little to do with market power. Rather, we are arguing that in any model that
stresses market power in vertical sales, we should also expect to see financial transfers to cover
losses, resulting in some inefficiency due to the attendant principal-agent problem within the
group. We shall refer to this inefficiency as “governance costs,” and discuss how it is modeled in
the next section.
Before turning to the model, it is useful to consider what the objective of a group is.
Under the financial market failure explanation, institutions within the group (call them banks)
allocate loans. While the objective of these banks presumably involves some tradeoff between
risk and return, it need not be identical to the objectives of the group firms. There is a substantial
10 Major firms stand out among affiliates in terms of assets and sales, represent main lines of business, and are financially most capable in a business group. For example, Samsung group owns its major firms in life insurance,

10
empirical literature investigating the effect of group membership on profits, particularly through
resolving capital markets imperfections, and results vary across countries.11 Perhaps the most
pessimistic hypothesis, advanced by Weinstein and Yafeh (1998), is that the banks in Japan act
as monopsonists in charging excessive interest rates to group firms, thereby funneling off profits.
Without taking a stand on the generality of this result, it appears that for groups arising due to
financial market imperfections, the bank and group may have conflicting objectives.
Turning to the market-power explanation for groups, this type of conflict need not arise.
For firms within a group that are jointly exercising market power in a downstream market,
Clayton and Jorgenson (2000) have recently shown that the cross-holding of equity will induce
them to internalize the effects of their quantity decision on other firms, thereby raising joint
profits. In other words, the cross-holding of equity will move the group towards maximizing
joint profits. For groups that are selling intermediates, the same objective may apply, subject to
the costs we have noted of making transfers to the upstream firms to cover their losses. We will
adopt joint profit maximization as the objective of a group in our model, in part because it greatly
simplifies the analysis. We recognize, however, that this hypothesis may be more appropriate to
the strong central control exercised by the family-run groups found in Korea (Chang, 1999) than
to the more flexible family firms in Taiwan (Hamilton and Kao; Wong, 1985).
electronics, semiconductor, and heavy industry, and Hyundai group has its counterparts in automobile, construction, and heavy industry. 11 It is known that group membership may offset liquidity constraints otherwise faced by firms: see Hoshi, Kashyap and Sharfstein (1990a, 1991) for Japanese bank-centered groups, and Perotti and Gelfer (2001) for Russian financial groups. However, this does not necessarily mean that profits are increased for the groups. For Japan, studies including Caves and Uekusa (1976) and Weinstein and Yafeh (1995) find that the firms affiliated with groups in Japan are not more profitable than unaffiliated firms. Khanna and Rivkin (2001) use a broader cross-country study and find that group membership raises profits in six countries and lowers it in five, though capital market imperfections are not correlated with the performance of groups. In addition, Khanna and Palepu (2000a) find a non-linear relationship between affiliate profitability and the diversification of Indian groups.
11
3. A Model of Business Groups
We will consider an economy divided into two sectors: an upstream sector producing
intermediate inputs from labor, and a downstream sector using these intermediate inputs (and
additional labor) to produce a final good. The final good could be sold to firms (as a capital
good) or to consumers, but for concreteness, we will consider only the latter case. The
intermediate inputs are not be traded internationally, but the final good is traded. Suppose that
both the sectors are characterized by product differentiation, so that each firm charges a price that
is above its marginal cost of production. As usual under monopolistic competition, we will allow
for the free entry of firms in both the upstream and downstream sectors to the point where profits
are driven to zero. In the same way that we allow for the free entry of individual firms, we will
also allow for the free entry of business groups.
In contrast to conventional treatments of monopolistic competition, we will also allow
groups to produce multiple varieties of inputs and outputs. In particular, there will be an
incentive to produce both upstream and downstream products to take advantage of the
efficiencies from marginal cost pricing of the intermediate input. As discussed above, the
running of a group can be expected to have some costs of bargaining and agency associated with
distributing the group’s profits among affiliate firms. This is very much in the spirit of the
diseconomies of size discussed by Williamson (1975, chap. 7; 1985, chap. 6), and some kind of
diseconomy of firm or group size must be present in any organizational model.12 Modeling these
“governance costs” in any detail would lead us into financial details about the relationship
12 Grossman and Hart (1986) argue that transaction cost theory is deficient when it does not have a well-specified mechanism that would limit the size of firms. They develop a two-firm, two-period model where the interests of the firms differ and the opportunity set under integration can contract; therefore, integration is not always efficient.

12
between groups and banks, a level well beyond the scope of our market-power based model.13
Indeed, we will simply assume that they take the form of a fixed cost α associated with the
running of a business group as well as additional costs associated with each intermediate and
final product produced by the group (over and above the research and development costs that an
unaffiliated firm would incur for such products).
It will be important to specify the sequence of decisions in this model. One possibility is
to consider a three-stage game, where the price and number of final goods for groups, (qbi, Nbi),
i=1,…,G, and the price for unaffiliated downstream firms, qcj, j=1,…,Nc, are determined in the
third stage; the price and number of intermediate inputs, (pbi, Mbi), i=1,…,G, and the price of
unaffiliated upstream firms, pcj, j=1,…,Mc, are determined in the second stage; and the number
of groups and unaffiliated firms G, Mc, and Nc are determined in the first stage to ensure non-
positive profits. This formulation would ensure that when group i sells its intermediate inputs
externally at the price of pbi, it will take into account the effect of this on the final goods price qbj
of all other groups, j≠i, since these are chosen at a later stage. But this formulation leaves out the
possibility that a group can exercise some vertical restraint over its downstream firms, such as
resale price maintenance, and thereby commit to certain prices for final goods. Since resale price
maintenance is a common assumption within models of wholesalers-retailers (see Ordover, et al,
13 Theoretical models of financially interlinked groups include Kim (1999) and Ghatak and Kali (2001). In empirical work, Hoshi, Kashyap and Scharfstein (1990b) investigate firms that left bank-centered groups following deregulation in 1983, suggesting that one reason this may have occurred was due to conflicting objectives of the banks and shareholders, where the banks are too conservative. Using a different focus, Khanna and Palepu (2000b) investigate Indian groups and find that groups with greater internal financial transfers (and therefore less transparency) are less attractive targets for foreign investment
13
1990, 1992, and Chen, 1999, 2001), we will want to give the same degree of control to business
groups and shall incorporate it into our model.
Rather than considering a resale price ceiling or floor, we will instead allow for a pricing
rule, whereby business group i commits to price its final goods at the markup μbi over marginal
cost. Denoting marginal costs by φbi, the final goods prices are then qib = μbi φbi, where μbi is
chosen optimally at the second stage of the game (given the choices of the other groups). There
is now little reason to distinguish the second and third stage, and we will collapse these decisions
into a single stage, where the strategies chosen are )N,,M,p( bibibibi μ for each business group
i=1,…,G, the prices pcj, j=1,…,Mc for upstream unaffiliated firms, and the markups μcj for
downstream unaffiliated firms, j=1,…,Nc. Given these optimal strategies, the number of groups
and unaffiliated firms are determined at a prior stage to ensure non-positive profits.
Making this setup explicit, the business groups i=1,…,G each maximize joint profits,
,]k)1p(x~[M]k)1(y[N xbbibibiybbibibibibi}N,,M,p{max
bibibibiα−−−+−φ−μ=Π
μ (1)
where: Nbi is the number of final goods, produced with fixed costs kyb; ybi is the output of each
final good, produced with marginal cost φbi and sold at the price qib = μi φbi; biM is the number
of intermediate inputs, produced with fixed costs of kxb; bix~ is the quantity sold outside the group
of each intermediate input, at the price pbi and produced with marginal costs of unity; and α is the
level of fixed “governance costs” associated with the running of a business group. These
governance costs may also depend on the size of the group, measured by the numbers of products
14
Nb and Mb; then this will be a reason for the fixed costs kyb and kxb for business groups to exceed
those for unaffiliated firms, as we shall provide for.
In addition to the external sales of inputs at the price pbi, the group will sell its inputs
internally at marginal costs of unity, and we will denote the internal quantity sold by xbi. It is
quite possible that the profits earned by the upstream firms, which is the second bracketed term
on the right of (1), is negative because these inputs are sold internally at marginal cost. Thus, we
would expect some transfer from the downstream to the upstream firms to cover these losses.
Our key simplifying assumption on the “governance costs” is that they don’t depend on the
amount of the transfer, although they can depend on the numbers of upstream and downstream
firms, as noted above. It is this simplifying assumption that allows us to ignore the transfer in the
specification of (1).14
The marginal cost of producing each output variety for the group j=1,…,G is assumed to
be given by the CES function:
⎟⎠⎞
⎜⎝⎛
σ−β−
=
σ−
≠=
σ−β⎟⎟
⎠
⎞
⎜⎜
⎝
⎛++=φ ∑∑
11
M
1i
1ci
G
ji,1i
1bibibjbj
c
ppMMw , (2)
where: w is the wage rate, and labor is a proportion β of marginal costs; Mbj inputs are
purchased internally at the price of unity; Mbi inputs are purchased from the other i=1,…,G, i≠j
groups, at the price of pbi ; and Mc inputs are purchased from unaffiliated upstream firms at the
14 Indeed, given this assumption, we can provide for weaker group incentives, such as Nash bargaining between the upstream and downstream firms over profits (Pepall and Norman). This would still imply the maximization of group profits overall, with the bargaining strength of individual firms then affecting their share of profits.

15
price of pci, i=1,…,Mc. We will set w=1 by choice of numeraire and suppress it in all that
follows. The elasticity of substitution σ is assumed to exceed unity, so that it is meaningful to
think of changes in the number of inputs available from each source.
Turning to the unaffiliated firms, the upstream firms j=1,…, Mc each choose its price to
maximize profits:
xccjcjpmax k)1p(x
cj−− , (3)
where xcj is the output of each intermediate input sold at price pcj and produced with marginal
cost of unity and fixed costs kxc. Similarly, the unaffiliated downstream firms j=1,…, Nc each
choose their markup μcj to maximize profits:
ycccjcjmax k)1(y
cj−φ−μ
μ, (4)
where ycj is the output of each final good produced with marginal cost φc and fixed costs kyc and
sold at price qcj = μcj φc. The marginal cost of producing each output variety is
⎟⎠⎞
⎜⎝⎛
σ−β−
=
σ−
=
σ−⎟⎟
⎠
⎞
⎜⎜
⎝
⎛+=φ ∑∑
11
M
1j
1cj
G
1i
1bibic
c
ppM , (5)
where biM are inputs purchased from i=1,…,G business groups at the price of pbi , and Mc
inputs are purchased from unaffiliated upstream firms j=1,…,Mc at the price of pcj . Recalling
that we have normalized w=1, it is apparent that the marginal costs for a business group in (2) are
16
less than those for an unaffiliated firm in (5) because the business groups are able to purchase
their own inputs at the cost of unity.
Using the cost functions, we can also define the external sales of each intermediate input,
bix~ , which appears in (1). Specifically, we differentiate (2) and (5) with respect to the price pbi,
multiply these by the outputs Nbjybj and and ycj, respectively, and sum these to obtain
⎥⎥⎦
⎤
⎢⎢⎣
⎡⎟⎟⎠
⎞⎜⎜⎝
⎛∂φ∂
+⎟⎟⎠
⎞⎜⎜⎝
⎛∂
φ∂= ∑∑
=≠=
cN
1j bi
ccj
G
ij,1j bi
bjbjbj
bibi p
yp
yNM
1x~ . (6)
The term (1/Mbi) appears because bix~ refers to the external demand for each intermediate input
sold by group i, with Mbi in total. Substituting (6) into (1) gives the complete expression for
profits of a business group.
With profits maximized as in (1), (3) and (4), we will restrict our attention to symmetric
equilibria, where each business group produces the same number Mb of intermediate inputs and
Nb of final goods, sold at prices pb and markups μb respectively. Similarly, unaffiliated upstream
and downstream firms each have the same prices, denoted by pc and qc = μcφc, respectively.
Then we choose the total number of business groups G, as well as the number of upstream and
downstream products from unaffiliated firms, Mc and Nc final goods, such that profits for all
these groups are non-positive. A key question of interest will be whether the solutions for G, Mc
and Nc are unique or not: is there more than one configuration of groups and unaffiliated firms
consistent with equilibrium?
17
The possibility of multiple equilibria will depend on the optimal prices, of course, and we
shall solve for these in the next section. But even before this, it useful to consider the possible
configurations of groups and unaffiliated firms that can arise in equilibrium. This will depend
very much on the level of “governance costs” within the groups. If these costs were zero, then a
group would be more efficient than a like-number of unaffiliated upstream and downstream firms
(due to its internal marginal cost pricing of inputs). Then in a zero-profit equilibrium for groups,
the profits of unaffiliated firms would be negative, and they would never enter. Focusing on this
equilibrium alone would be uninteresting from an organizational point of view. Conversely, if
the governance costs are large, then both upstream and downstream unaffiliated firms, together
with groups, could very well occur in a zero-profit equilibrium. This is probably realistic, but
having all types of firms makes the computation of equilibria intractable. Accordingly, we take a
“middle of the road” approach, assuming that the governance costs are large enough to allow the
possibility that either upstream or downstream unaffiliated firms to enter, but small enough to
prevent entry of both types.
With these assumptions, the equilibria that we consider will have one of three possible
configurations: (1) V-groups - the business groups prevent the entry of unaffiliated producers in
both the upstream and downstream sectors (Mc=Nc=0) and are therefore strongly vertically-
integrated; (2) D-groups - business groups are the only firms in the downstream sector (Nc=0)
and are vertically-integrated upstream, while purchasing inputs from some unaffiliated upstream
firms ( )Mc > 0 ; (3) U-groups - business groups are the only firms in the upstream sector (Mc=0)
and are vertically-integrated downstream, but also compete with some unaffiliated downstream
firms ( )Nc > 0 . We stress that this terminology does not make any presumption about the

18
horizontal integration of the various types of groups; this is something that we will have to
determine in equilibrium. In fact, it will turn out that the largest V-groups are also spread
horizontally over a wide range of products, much like the largest chaebol in Korea.
In order to observe a U-group or D-group equilibrium, we further need to rule out the
possibility that all unaffiliated firms would want to merge with a business group. This is ruled
out by supposing that unaffiliated firms have lower fixed costs associated with each product, but
these costs are automatically increased if that firm is part of a group: that is, we will assume that
kyb > kyc and kxb > kxc, with these inequalities holding strictly when needed to make merger
unprofitable. These extra fixed costs associated with the business group should be interpreted as
governance costs that are additional to the fixed costs of α. The precise specification of fixed
costs that will rule out merger will depend on the equilibrium. Despite the somewhat ad hoc
nature of this assumption, we emphasize that it is made as a compromise between tractability
(preventing all firms from entering) and interest (having the possibility that some unaffiliated
firms will enter and not merge). This still leaves the possibility of mergers across groups. In
order to rule out this activity, we need to appeal to some extra costs associated with governing a
group of increasing size that lie outside the notation of our model. With this list of assumptions,
we can turn to the solution of the model.
4. Optimal Prices and Output
We assume that demand for the differentiated final products arises from a CES demand
system with elasticity η and that the final products are traded internationally. It follows that the
demand for a single output variety from a business group can be written as
19
]*)q(*NqqN[
*)L*wL(qy
11c
N1j
G1j
1bjbj
bibi c η−η−
==η−
η−
++
+=
∑∑ , (7)
where w*L* in the numerator is foreign income, and N* in the denominator is the range of
foreign varieties, sold at the price of q*. Since the intermediate inputs are not traded, trade is
balanced in the final goods sector. Due to trade-balance, the foreign wage and price in (7) are
endogenous, and solving for their equilibrium values the demand expression is simplified as15
]qqN[
Lqy
1c
N1j
G1j
1bjbj
bibi c η−
==η−
η−
∑∑ += . (7’)
This is identical to the expression for demand in a closed economy. That is, making use of the
trade-balance condition, the total (domestic plus foreign) demand for each final product with
trade in (7) is identical to the domestic demand in the absence of trade in (7’): while trade
benefits consumers through increased product variety, it does not affect the pricing decisions of
firms. It follows that the equilibria that we shall compute are equally valid in an open or a closed
economy: the assumption of trade balance has eliminated any difference between these from the
firms’ point of view.
We shall use this demand system to compute optimal markups on final goods and, for
convenience, express these in the symmetric equilibrium (dropping the subscripts distinguishing
each group and unaffiliated firms). Given the CES demand function in (7), the optimal markup
for each unaffiliated downstream firm equals
15 Trade balance in final goods means that home import expenditure equals home exports. Denoting the
denominator of (7) by D, trade balance is expressed as D/1*)q(*LN η− = D/)1cq1
bjqbjN(*L*w cN1j
G1j
η−+η− ∑∑ == .
Using this equality in (7), we immediately obtain (7’).
20
⎟⎟⎠
⎞⎜⎜⎝
⎛−η
=−μ1
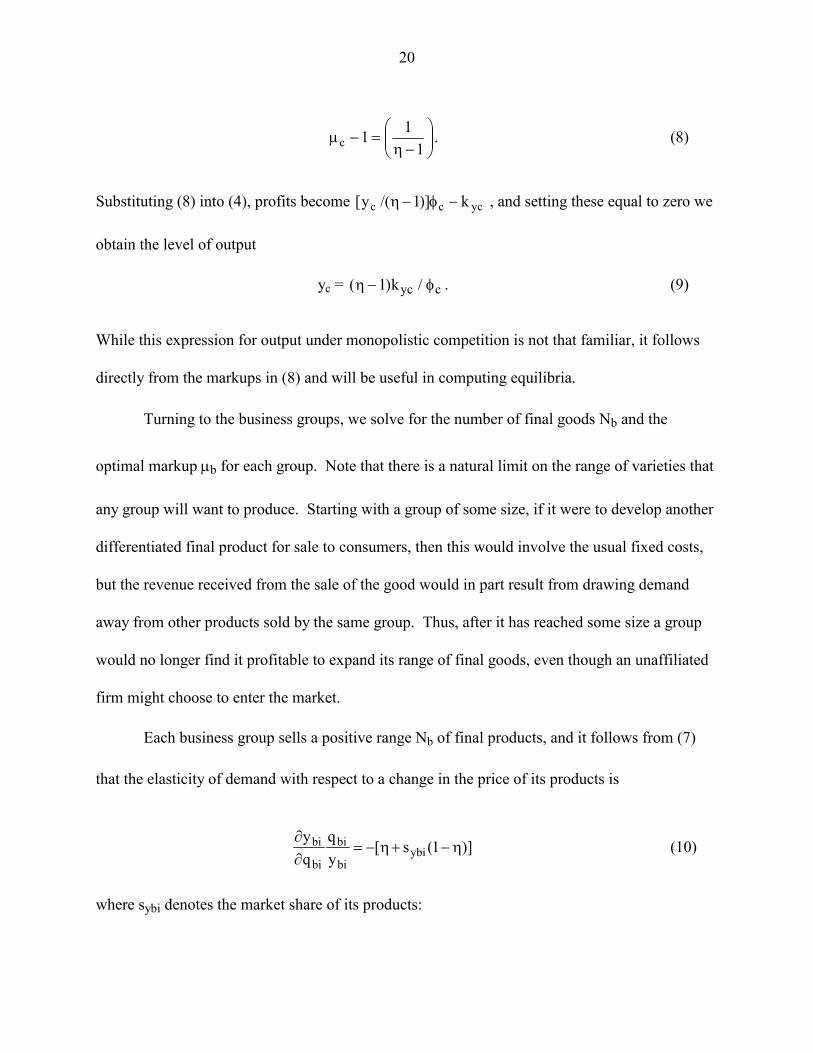
11c . (8)
Substituting (8) into (4), profits become yccc k)]1/(y[ −φ−η , and setting these equal to zero we
obtain the level of output
yc = ( ) /η φ−1 kyc c . (9)
While this expression for output under monopolistic competition is not that familiar, it follows
directly from the markups in (8) and will be useful in computing equilibria.
Turning to the business groups, we solve for the number of final goods Nb and the
optimal markup μb for each group. Note that there is a natural limit on the range of varieties that
any group will want to produce. Starting with a group of some size, if it were to develop another
differentiated final product for sale to consumers, then this would involve the usual fixed costs,
but the revenue received from the sale of the good would in part result from drawing demand
away from other products sold by the same group. Thus, after it has reached some size a group
would no longer find it profitable to expand its range of final goods, even though an unaffiliated
firm might choose to enter the market.
Each business group sells a positive range Nb of final products, and it follows from (7)
that the elasticity of demand with respect to a change in the price of its products is
)]1(s[yq
qy
ybibi
bi
bi
bi η−+η−=∂∂
(10)
where sybi denotes the market share of its products:
21
)qqN(
qNs
1cj
N1j
G1j
1bjbj
1bibi
ybi c η−==
η−
η−
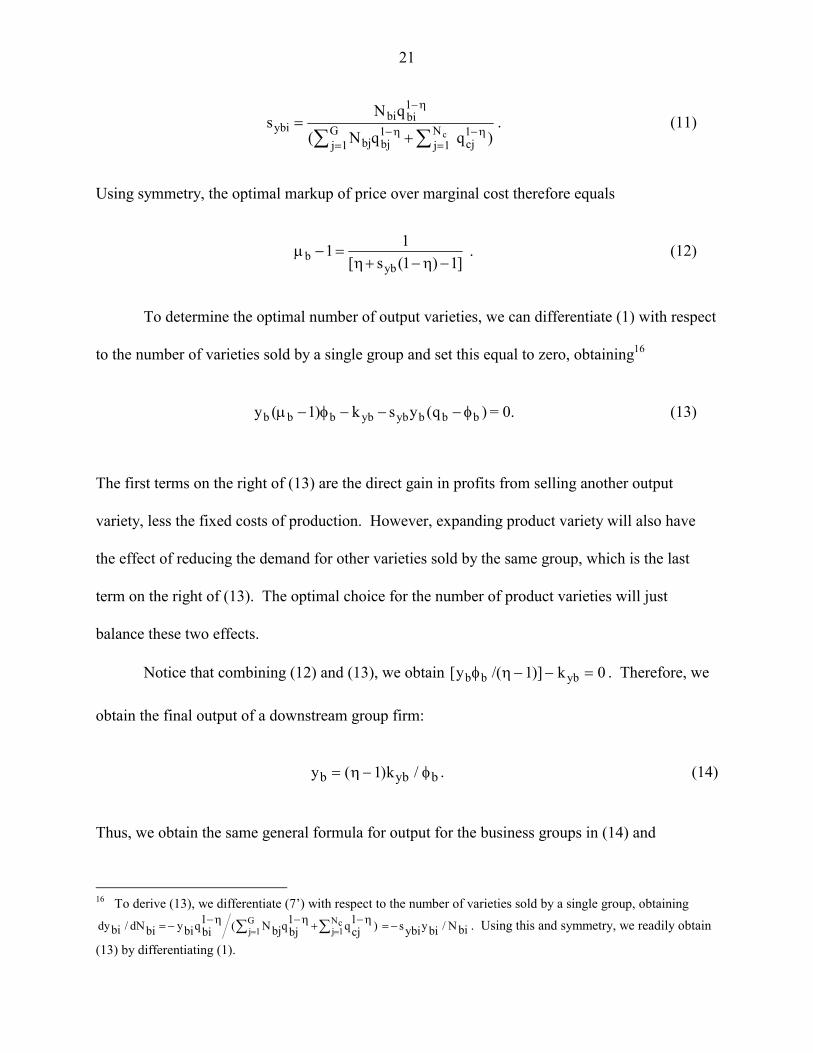
∑∑ += . (11)
Using symmetry, the optimal markup of price over marginal cost therefore equals
]1)1(s[
11yb
b −η−+η=−μ . (12)
To determine the optimal number of output varieties, we can differentiate (1) with respect
to the number of varieties sold by a single group and set this equal to zero, obtaining16
)q(ysk)1(y bbbybybbbb φ−−−φ−μ = 0. (13)
The first terms on the right of (13) are the direct gain in profits from selling another output
variety, less the fixed costs of production. However, expanding product variety will also have
the effect of reducing the demand for other varieties sold by the same group, which is the last
term on the right of (13). The optimal choice for the number of product varieties will just
balance these two effects.
Notice that combining (12) and (13), we obtain 0k)]1/(y[ ybbb =−−ηφ . Therefore, we
obtain the final output of a downstream group firm:
y kb yb b= −( ) /η φ1 . (14)
Thus, we obtain the same general formula for output for the business groups in (14) and
16 To derive (13), we differentiate (7’) with respect to the number of varieties sold by a single group, obtaining
biN/biyybis)1cjq1
bjqbjN(1biqbiybidN/bidy cN
1jG
1j −=η−+η−η−−= ∑∑ == . Using this and symmetry, we readily obtain
(13) by differentiating (1).

22
unaffiliated downstream firms in (9), though with the business group having lower marginal
costs (φb < φc) and higher fixed costs (kyb > kyc), their output is correspondingly higher.
Intuitively, the economies of scale inherent in a vertically-integrated group lead it to produce
longer production runs.
While business groups sell a higher quantity of each final good, it is also the case that
their sales revenue from each final variety exceeds that of an unaffiliated downstream firm. This
can be seen by comparing (9) and (14), obtaining .yk)1(k)1(y ccycybbb φ=−η≥−η=φ With
the markup over marginal costs higher for the group than an unaffiliated firm [compare (8) and
(12)], it immediately follows that ,yqyq ccbb > so that the sales revenue from each downstream
product produced by a business group exceeds that for an unaffiliated downstream firm. This
result has important implications for total variety of final goods in the economy.
To determine downstream variety, we close the model with the full employment
condition. There are several ways to write this, but one that will be convenient is the equality of
national product measured by the value of final goods and total wage income received. The latter
is just L, or the labor supply. The former is the total value of final goods produced by business
groups and any nonaffiliated downstream firms, so that
L GN q y N q yb b b c c c= + . (15)
If there are only business groups in equilibrium, then product variety is GNb= L/qbyb, whereas if
there are only unaffiliated firms, then product variety is Nc= L/qcyc. With ccbb yqyq > as shown
above, it follows immediately that an economy that includes business groups will have lower
variety of final goods than an economy with the same parameters but composed entirely of
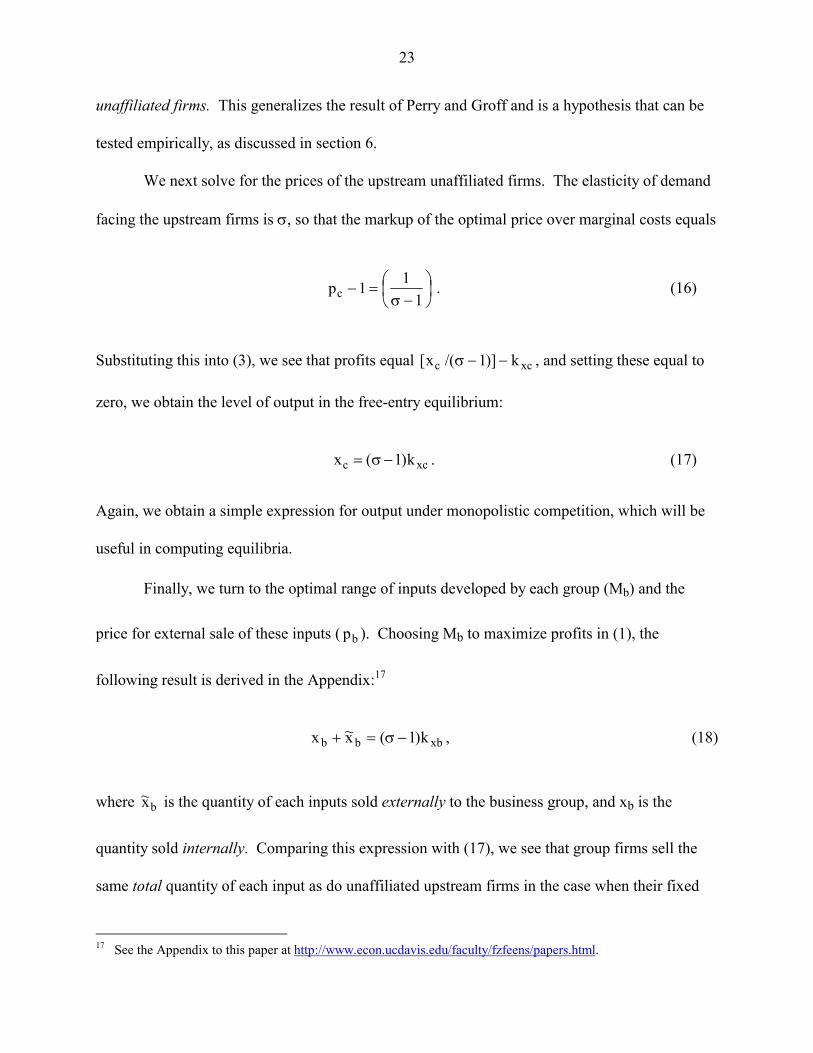
23
unaffiliated firms. This generalizes the result of Perry and Groff and is a hypothesis that can be
tested empirically, as discussed in section 6.
We next solve for the prices of the upstream unaffiliated firms. The elasticity of demand
facing the upstream firms is σ, so that the markup of the optimal price over marginal costs equals
⎟⎠⎞
⎜⎝⎛
−σ=−
111pc . (16)
Substituting this into (3), we see that profits equal xcc k)]1/(x[ −−σ , and setting these equal to
zero, we obtain the level of output in the free-entry equilibrium:
xcc k)1(x −σ= . (17)
Again, we obtain a simple expression for output under monopolistic competition, which will be
useful in computing equilibria.
Finally, we turn to the optimal range of inputs developed by each group (Mb) and the
price for external sale of these inputs ( bp ). Choosing Mb to maximize profits in (1), the
following result is derived in the Appendix:17
xbbb k)1(x~x −σ=+ , (18)
where bx~ is the quantity of each inputs sold externally to the business group, and xb is the
quantity sold internally. Comparing this expression with (17), we see that group firms sell the
same total quantity of each input as do unaffiliated upstream firms in the case when their fixed
17 See the Appendix to this paper at http://www.econ.ucdavis.edu/faculty/fzfeens/papers.html.
24
costs are the same, kxb = kxc. This is a rather remarkable result, considering the fact that group
firms charge different prices for the sales of the intermediate input to firms inside and outside
their own group. Indeed, there is no guarantee that group firms will find it optimal to sell to
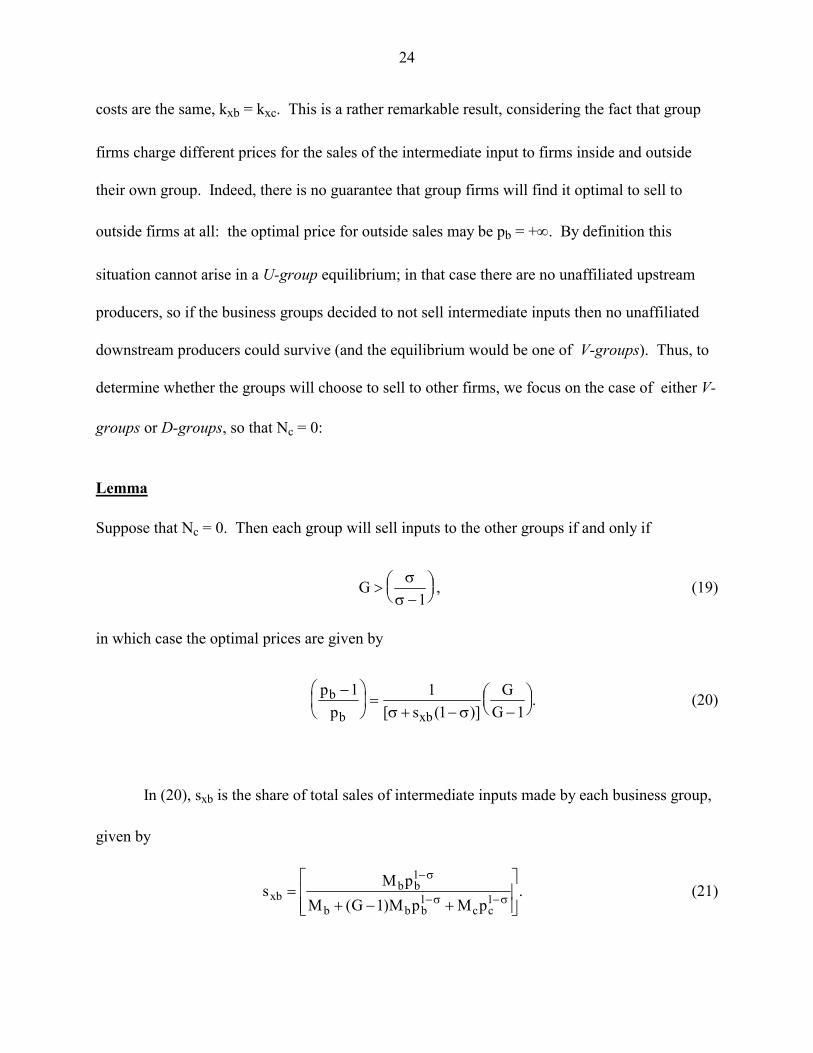
outside firms at all: the optimal price for outside sales may be pb = +∞. By definition this
situation cannot arise in a U-group equilibrium; in that case there are no unaffiliated upstream
producers, so if the business groups decided to not sell intermediate inputs then no unaffiliated
downstream producers could survive (and the equilibrium would be one of V-groups). Thus, to
determine whether the groups will choose to sell to other firms, we focus on the case of either V-
groups or D-groups, so that Nc = 0:
Lemma
Suppose that Nc = 0. Then each group will sell inputs to the other groups if and only if
G >−
⎛⎝⎜
⎞⎠⎟
σσ 1
, (19)
in which case the optimal prices are given by
p
p sG
Gb
b xb
−⎛⎝⎜
⎞⎠⎟ =
+ − −⎛⎝⎜
⎞⎠⎟
1 11 1[ ( )]
.σ σ
(20)
In (20), sxb is the share of total sales of intermediate inputs made by each business group,
given by
.pMpM)1G(M
pMs 1cc
1bbb
1bb
xb⎥⎥⎦
⎤
⎢⎢⎣
⎡
+−+= σ−σ−
σ− (21)

25
The term [σ + sxb(1-σ)] is the elasticity of demand for input varieties from one group. Equation
(20) differs from the standard Lerner formula by the extra term G/(G-1) > 1. This reflects the
fact that when a group sells an input, it will give competing firms a cost advantage, thereby
lowering profits in the final goods market. Accordingly, it will charge a higher price than usual.
If G is too small, so that (19) is violated, then profits will continually increase as pb is raised and
the group optimally chooses pb = +∞. In this situation the groups sell none of their inputs
externally, and 0x~bi = in (6) for i=1,…,G.
With this description of business groups’ pricing and output decisions, it becomes
possible to compute equilibria for the economy. In addition to the equations above, the complete
model consists of a number of business groups G and nonaffiliated firms Mc and Nc, such that
the profits earned by each group are non-positive. In the Appendix, we show how a small
number of (nonlinear) equations characterize equilibria in each of the three configurations: (1)
V-groups - the business groups prevent entry of unaffiliated producers in both the upstream and
downstream sectors; (2) D-groups - business groups are the only firms in the downstream sector,
while purchasing inputs from unaffiliated upstream firms; (3) U-groups - business groups are the
only firms in the upstream sector, but also compete with unaffiliated downstream firms. We
solve these equations from a wide range of starting values in order to check for possible
equilibria. As noted at the end of the previous section, we will chose the fixed governance costs
intentionally to try to rule out the complex case where all types of firms coexist, though we will
still indicate the parameters under which that situation arises.18
18 See note 20, as well as the area of Figure 1 labeled with the question mark.

26
5. Computation of Multiple Equilibria
The above Lemma shows that the prices charged by business groups for the intermediate
inputs depends on the number of groups, or the degree of concentration in the upstream sector.
Furthermore, as we have already argued, the gains from vertical-integration are that intermediate
inputs can be sold at their marginal cost, leading to greater efficiency. But now there is a
circularity in the argument: the incentive to vertically-integrate is strongest when there is a high
degree of concentration in the upstream sector, but this concentration could simply reflect that
presence of a small number of business groups dominating that sector. Conversely, if there were
a large number of business groups (and unaffiliated firms) selling in the upstream market, then
the markups would be correspondingly lower, as would be the incentive to vertically-integrate.
This kind of circular reasoning is precisely what gives rise to multiple equilibria in any economic
model, and ours is no exception. When we solve for the equilibrium number of groups, we
therefore expect to observe both equilibria with a small number of business groups that are
highly integrated and those with a large number of groups (and unaffiliated firms) that are less
integrated.
This equilibria that we find are illustrated by the points in Figures 1 and 2. All these
equilibria are obtained using the parameter values α=0.2, β=0.5, η<5, kxb=kyb=5, L=1000, and
incremental values of σ from unity to 3.5.19 The value for kxc and kyc are set at 5 initially and
adjusted to be lower if needed to prevent unaffiliated firms from merging with business groups.
The line G = σ/(σ-1) is illustrated in Figure 1, and groups will not sell to each other for
19 Initially, we used η=5 for all equilibria. While we found both V-group and U-group equilibria at this value, it was difficult to find D-group equilibria in which the unaffiliated downstream firms had no incentive to enter. To limit this incentive, it was necessary to use lower values for η, especially when the elasticity of substitution for inputs itself was low. Accordingly, all our equilibria are computed with η=5 for σ > 2.65, and η=1.9σ for σ < 2.60.
27
equilibrium points below this line. Multiple equilibria occur if, for a given value of σ, we find
more than one equilibrium.
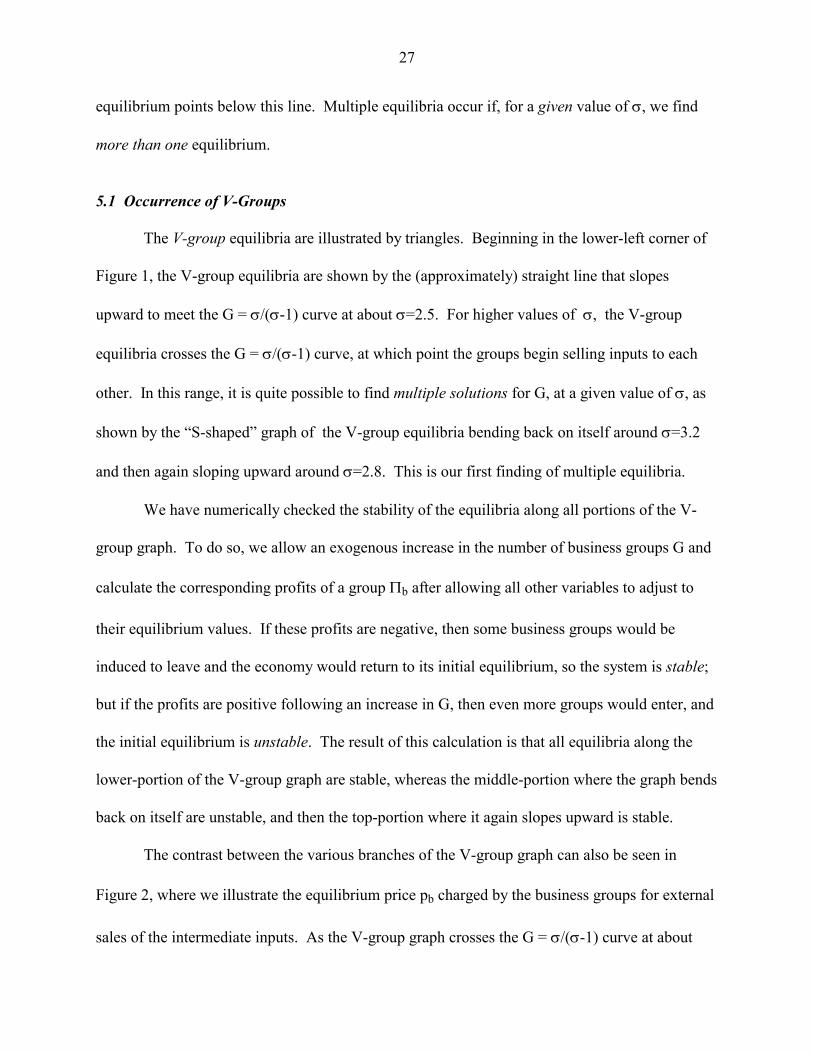
5.1 Occurrence of V-Groups
The V-group equilibria are illustrated by triangles. Beginning in the lower-left corner of
Figure 1, the V-group equilibria are shown by the (approximately) straight line that slopes
upward to meet the G = σ/(σ-1) curve at about σ=2.5. For higher values of σ, the V-group
equilibria crosses the G = σ/(σ-1) curve, at which point the groups begin selling inputs to each
other. In this range, it is quite possible to find multiple solutions for G, at a given value of σ, as
shown by the “S-shaped” graph of the V-group equilibria bending back on itself around σ=3.2
and then again sloping upward around σ=2.8. This is our first finding of multiple equilibria.
We have numerically checked the stability of the equilibria along all portions of the V-
group graph. To do so, we allow an exogenous increase in the number of business groups G and
calculate the corresponding profits of a group Πb after allowing all other variables to adjust to
their equilibrium values. If these profits are negative, then some business groups would be
induced to leave and the economy would return to its initial equilibrium, so the system is stable;
but if the profits are positive following an increase in G, then even more groups would enter, and
the initial equilibrium is unstable. The result of this calculation is that all equilibria along the
lower-portion of the V-group graph are stable, whereas the middle-portion where the graph bends
back on itself are unstable, and then the top-portion where it again slopes upward is stable.
The contrast between the various branches of the V-group graph can also be seen in
Figure 2, where we illustrate the equilibrium price pb charged by the business groups for external
sales of the intermediate inputs. As the V-group graph crosses the G = σ/(σ-1) curve at about
28
σ=2.5, the price charged for the intermediate inputs falls from +∞ to finite levels. It continues to
fall as the V-group graph bends back on itself (along the unstable portion) and then bends
forward again. The stable portion corresponds to either very high or very low prices for the
intermediate input, whereas the unstable branch corresponds to an intermediate price.
The occurrence of these multiple equilibria, with a small and large number of business
groups, respectively, corresponds quite closely to the intuition for multiple equilibria described in
the beginning of this section. We have also checked that at all the V-group equilibria illustrated,
the profits of both upstream and downstream unaffiliated firms are negative when they have fixed
costs of kxc=kyc=5 or slightly less. The point at which unaffiliated firms begin to earn positive
profits occurs at the top-portion of the V-group graph, where it makes a transition to the U-group
equilibria.
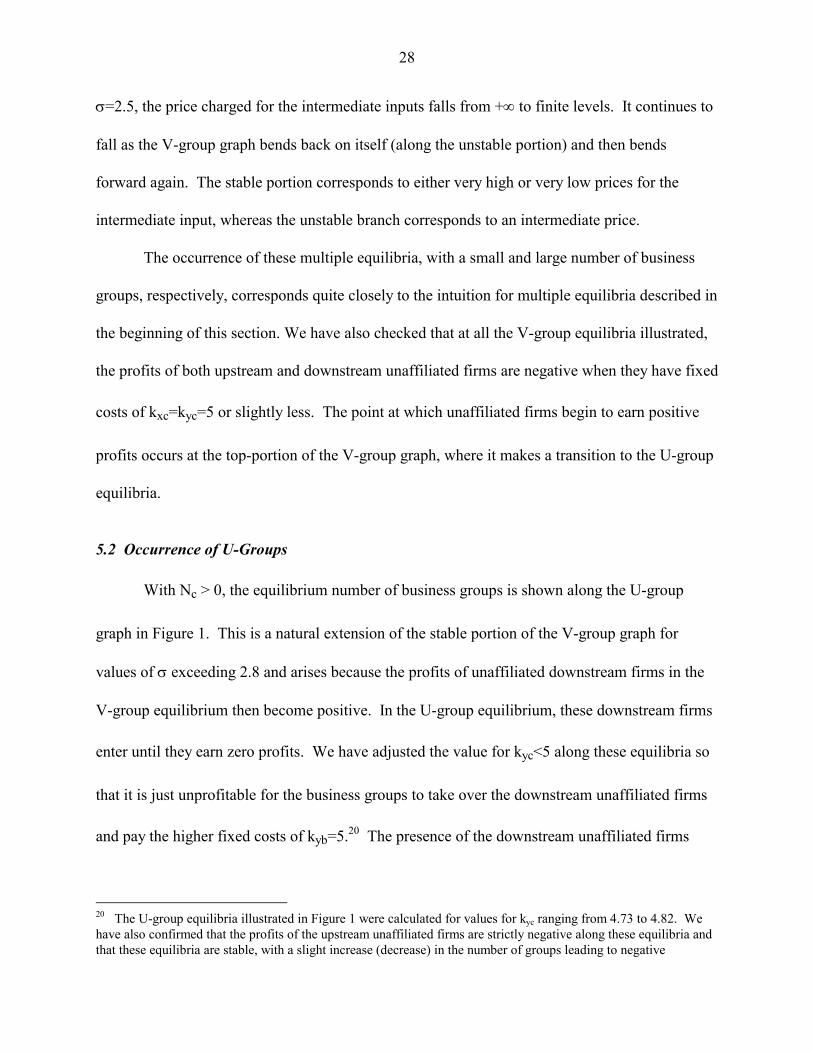
5.2 Occurrence of U-Groups
With Nc > 0, the equilibrium number of business groups is shown along the U-group
graph in Figure 1. This is a natural extension of the stable portion of the V-group graph for
values of σ exceeding 2.8 and arises because the profits of unaffiliated downstream firms in the
V-group equilibrium then become positive. In the U-group equilibrium, these downstream firms
enter until they earn zero profits. We have adjusted the value for kyc<5 along these equilibria so
that it is just unprofitable for the business groups to take over the downstream unaffiliated firms
and pay the higher fixed costs of kyb=5.20 The presence of the downstream unaffiliated firms
20 The U-group equilibria illustrated in Figure 1 were calculated for values for kyc ranging from 4.73 to 4.82. We have also confirmed that the profits of the upstream unaffiliated firms are strictly negative along these equilibria and that these equilibria are stable, with a slight increase (decrease) in the number of groups leading to negative

29
means that the business groups themselves are not strongly vertically-integrated. This is
reflected in a low price for the intermediate input, as shown along the U-group graph in Figure 2.
5.3 Occurrence of D-Groups
As the third form of economic organization, the D-group equilibria with Mc > 0 are
illustrated near the top of Figure 1. Beginning at the left this equilibrium first appears around
σ=1.8, where the other parameter values are the same as used above.21 We choose kxc slightly
less that 5 so that it is unprofitable for business groups to take over the upstream unaffiliated
firms and face the slightly higher fixed costs of kxb=5. For higher values of σ, the number of
groups declines along the D-group graph, and up to the value σ=2.8 we have confirmed that the
D-group equilibria are stable, in the sense that a slight increase (decrease) in the number business
groups will lower (raise) their profits from zero.22 The fact that these equilibria occur at the same
values of σ as some of the V-group configurations is another finding of multiple equilibria.
For σ > 2.8, which we have labeled with a question mark in Figure 1, we find an
alternative equilibria that satisfies all the conditions of stable D-group equilibria except for one:
profits of the downstream unaffiliated firms are positive along this branch, so that they would
want to enter. In these region, therefore, we expect to see business groups coexisting with both
upstream and downstream unaffiliated firms. We have not solved for the complete equilibrium
conditions in this case, and it lies outside the configurations we are focusing on.
(positive) group profits. The U-group equilibria continue to exist for higher values of σ beyond those illustrated in Figure 1. 21 For σ < 1.8, there appear to be equilibria where business groups and both upstream and downstream firms all enter. We did not attempt to compute these equilibria. 22 For 1.8 < σ < 2.8, we actually find multiple D-group equilibria, but only the stable equilibria are graphed.

30
To summarize what are admittedly complex pictures, for a range of values for the
elasticity of substitution σ, there is more than one stable equilibrium structure of business groups.
Thus, for σ between about 1.8 and 2.8, there is either a “high concentration” equilibria shown by
the V-groups in Figure 1, with a small number of large business groups; or a “low concentration”
equilibria shown by the D-groups, with a large number of smaller groups. Alternatively, for σ in
the range from about 2.8 to 3.2, there is either a “high concentration” equilibria again shown by
the V-groups in Figure 1 (with G<4) or a “low concentration” equilibria shown by the U-groups
(with G>12). The finding of multiple equilibria is not very sensitive to the parameters we have
used, which were chosen mainly to rule out the simultaneous occurrence of unaffiliated upstream
and downstream firms, therefore simplifying the computations. We think that the multiplicity of
equilibria is a generic feature of our model and arises from the interaction of price of
intermediates and the number of groups: with a large number of small groups, there is an
incentive to price low, supporting this equilibrium; and with a small number of large groups,
there is an incentive to price high, again supporting the equilibrium.
5.4 Characteristics of the Groups
To gain a further understanding of the various equilibria, we compute some variables of
interest. In Figure 3 we display the total sales of each business groups in the various equilibria,
computed as the sales of intermediate inputs within and outside the group (the former are priced
as marginal cost of unity), plus the sales of final goods. In the equilibria with a small number of
V-groups, the groups are quite large in terms of sales. This is especially true when G < σ/(σ-1),
so that the groups do not sell inputs to each other. We think that these strongly-integrated V-
groups are suggestive of the “top five” groups in South Korea, which have exceptionally high

31
sales, as discussed in section 2. In comparison, the U-groups and D-groups are both quite small
in terms of sales, more like the groups in Taiwan.
In our discussion of the actual groups in South Korea and Taiwan, we stressed that the
“top five” groups in Korea have higher internalization, measured by the ratio of internal sales to
total sales by each group. We have computed the same ratio for the various equilibria and show
this in Figure 4. For σ in the range from 1.8 to 2.8, where both D-groups and V-groups occur,
the V-groups in the “high concentration” equilibria always have higher internal sales ratios.
Similarly, for σ in the range from 2.8 to 3.2, , the V-groups in the “high concentration” equilibria
have higher internal sales ratios than either the (unstable) V-groups or U-groups in the “low
concentration” equilibria. In other words, having a small number of large groups means that
these groups are strongly vertically-integrated.
At the same time, by virtue of their large size, the V-groups in our model are diversified
across a wide range of intermediate and final varieties. This is shown in Figure 5, where we
graph the Herfindahl index of product diversification for a single group, computed over all
intermediate and final varieties.23 As is apparent from this figure, the V-groups are producing the
greatest range of product varieties, and this is true for both intermediate and final goods (similar
figures are obtained if we consider group diversification over inputs and outputs separately).
Thus, the market power that we have built into our model leads not only to vertical integration,
but also to horizontal diversification as groups increase their prices across multiple markets
(Bernheim and Whinston). As we noted at the end of section 2, there may well be other reasons
for horizontal diversification (such as the group acting as a source of capital) that we have left
23 This is defined as ∑− i
2is1 , where si is the share of total group sales devoted to each intermediate or final
product variety.
32
out of our model, but it is noteworthy that that market power alone is enough to explain a
substantial degree of horizontal diversification along with vertical integration.
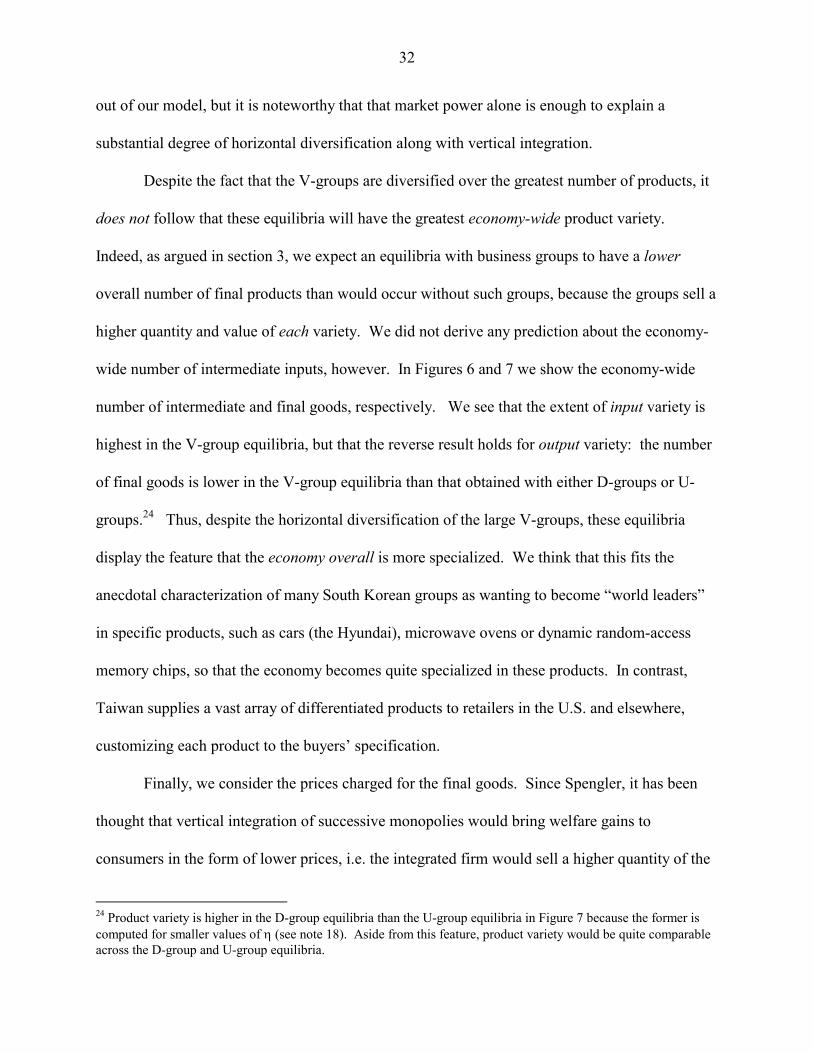
Despite the fact that the V-groups are diversified over the greatest number of products, it
does not follow that these equilibria will have the greatest economy-wide product variety.
Indeed, as argued in section 3, we expect an equilibria with business groups to have a lower
overall number of final products than would occur without such groups, because the groups sell a
higher quantity and value of each variety. We did not derive any prediction about the economy-
wide number of intermediate inputs, however. In Figures 6 and 7 we show the economy-wide
number of intermediate and final goods, respectively. We see that the extent of input variety is
highest in the V-group equilibria, but that the reverse result holds for output variety: the number
of final goods is lower in the V-group equilibria than that obtained with either D-groups or U-
groups.24 Thus, despite the horizontal diversification of the large V-groups, these equilibria
display the feature that the economy overall is more specialized. We think that this fits the
anecdotal characterization of many South Korean groups as wanting to become “world leaders”
in specific products, such as cars (the Hyundai), microwave ovens or dynamic random-access
memory chips, so that the economy becomes quite specialized in these products. In contrast,
Taiwan supplies a vast array of differentiated products to retailers in the U.S. and elsewhere,
customizing each product to the buyers’ specification.
Finally, we consider the prices charged for the final goods. Since Spengler, it has been
thought that vertical integration of successive monopolies would bring welfare gains to
consumers in the form of lower prices, i.e. the integrated firm would sell a higher quantity of the
24 Product variety is higher in the D-group equilibria than the U-group equilibria in Figure 7 because the former is computed for smaller values of η (see note 18). Aside from this feature, product variety would be quite comparable across the D-group and U-group equilibria.

33
final good at a lower price than would the non-integrated industry. This has resulted in the
“Chicago view” that vertical integration and, more generally, vertical controls on downstream
suppliers, are not harmful to the consumer. Rather, public policy should focus on limiting the
exercise of market power through horizontal integration. This reasoning survives an extension to
oligopoly settings (Greenhut and Ohta), though Ordover et al argue that when vertical integration
results in the foreclosure of an upstream firm, then it is possible that the downstream price of the
integrated firm might also rise.
In our model, the vertical integration of the V-groups brings with it a horizontal
integration across product varieties. Thus, the question becomes whether the vertically and
horizontally-integrated V-groups charge higher or lower prices that U-groups or D-groups. It
turns out that the V-groups charge slightly higher prices. This is illustrated in Figure 8, where
we graph the prices of final goods, qb, at various values of σ. Except for a small range around
1.8 < σ < 2, the prices charged by business groups are slightly higher, despite the fact that their
marginal costs are lower than for unaffiliated firms. Thus, by treating the organization or
business group as an equilibrium phenomena, we find that the combined vertical and horizontal
integration of the groups tends to lead to higher prices for final goods.25
6. Conclusions
In this paper we have contrasted the differing groups structures in South Korea and
Taiwan, using this to motivate a market-power based model of business groups. This
25 We confirmed in our calculations that with the rise in prices and fall in product variety due to V-groups, then welfare also falls (holding fixed the range of imported final goods). This result will be sensitive, however, to the CES specification of product variety, which means that unaffiliated firms produce the socially optimal variety. In an alternative “address” specification, Dixit and Mathewson and Winter find that vertical integration will raise welfare, despite the fall in product variety.

34
explanation is different from those such as transaction costs or other market failures (e.g. Chang
and Choi, Levy) most often associated with business groups in developing countries, and
especially Korea. The reason we have taken this alternative approach is that in comparing Korea
and Taiwan, where the groups differ dramatically in structure, it is unclear what features of these
economies might lead to varying transactions costs. One of the authors (Hamilton and Biggart,
Hamilton, Zeile, and Kim, Orrù, Biggart, and Hamilton) has written extensively on the
sociological differences between the two economies, including patterns of inheritance, authority,
etc. But we are not persuaded that these differences provide an adequate foundation for either
transactions costs or for the differing structure of the groups. As an alternative, we have
developed a market-power reason for horizontal and vertical integration, which, as it turns out,
leads to multiple equilibria in the group structure.26 This seems like an appealing result to us
because it gives room for sociological differences as well as past policies to play a role in the
selection of equilibria.
We have found that the structure of business groups can be either strongly vertically-
integrated (V-groups) or more weakly integrated and located primarily in either the upstream (U-
groups) or downstream (D-groups) sectors. To provide some real-world context for these results,
we note that the first of these structures (V-groups) seems to describe the largest chaebol in
South Korea, whereas the second (U-groups) describes the groups in Taiwan. In another paper
(Feenstra, Hamilton and Huang, 2001), we develop this comparison more systematically. Rather
than simply “pick” a particular equilibrium as applying to one country and another equilibrium
for the second, we consider a whole range of elasticities of substitution 1.8 < σ < 6.6. For each
26 Our criticism of the transactions cost approach does not apply to McLaren (2000), however, because he starts in a setting where two countries are ex ante identical in their transactions costs, but still can have differing equilibria. Fung and Friedman (1996) also find multiple equilibria in their evolutionary model of business groups.
35
value of σ, if there are two equilibria, then we assign the one with the smaller number of business
groups to the “high concentration” set and the one with the larger number of groups to the “low
concentration” set (if there is a unique equilibria, then they are in both sets). By this method, the
“high concentration” set include both V-groups and U-groups, whereas the “low concentration”
set includes both U-groups and D-groups. For each of these sets, we re-graph Figures 3-5, but
now measuring observable sales on one axis and horizontal or vertical integration on the other.
Then we systematically compare these graphs (visually, and with simple summary statistics)
obtained from our theoretical model to the actual group data for South Korea and Taiwan. There
is a surprising degree of conformity between the “high concentration” equilibria and the actual
data for Korean chaebol, as well as between the “low concentration” equilibria and the actual
data for Taiwanese groups.
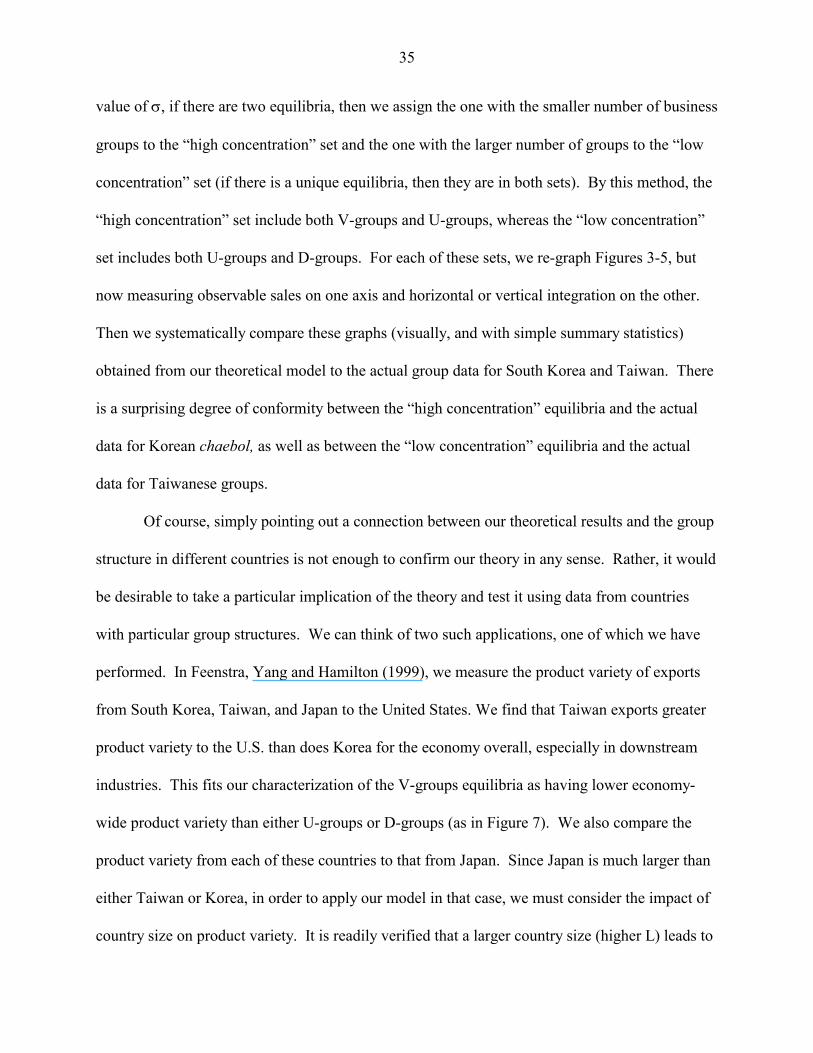
Of course, simply pointing out a connection between our theoretical results and the group
structure in different countries is not enough to confirm our theory in any sense. Rather, it would
be desirable to take a particular implication of the theory and test it using data from countries
with particular group structures. We can think of two such applications, one of which we have
performed. In Feenstra, Yang and Hamilton (1999), we measure the product variety of exports
from South Korea, Taiwan, and Japan to the United States. We find that Taiwan exports greater
product variety to the U.S. than does Korea for the economy overall, especially in downstream
industries. This fits our characterization of the V-groups equilibria as having lower economy-
wide product variety than either U-groups or D-groups (as in Figure 7). We also compare the
product variety from each of these countries to that from Japan. Since Japan is much larger than
either Taiwan or Korea, in order to apply our model in that case, we must consider the impact of
country size on product variety. It is readily verified that a larger country size (higher L) leads to

36
an increase in product variety. Thus, Japan can be expected to have greater product variety than
either Taiwan or South Korea, which we also confirm empirically.
A second application is suggested by the research design of Ghemawat and Khanna, who
argue that the response of business groups to large “competitive shocks” can provide information
on the initial rationale for the groups. One such shock, the Asian financial crisis that hit South
Korea in 1997, led to an unprecedented wave of bankruptcies and restructuring. A very simple
way to capture this in our model might be a reduction in demand (i.e. country size).27 A fall in
demand would shift all the equilibria illustrated in Figure 1. In particular, some of the equilibria
that were formerly multiple might become unique, so this could imply a large change in the
organization of the groups; we might associate this with the bankruptcy of some of the groups.
In other words, the non-linearity evidence in the “S-shape” of Figure 1 suggests that with a
continuous change in market size, we could have a discontinuous change in the equilibrium
number of groups. Furthermore, this seems more likely to happen in the boundary of the stable
and unstable region of V-groups. Our model therefore contains a prediction of which business
groups would be most susceptible to large shocks: it is the intermediate-sized V-groups, as
shown in the unstable region in Figure 1. In contrast, the larger V-groups shown in Figure 1 are
stable, as are the smaller U-groups and D-groups; small shocks should therefore not have a large
change on their structure.
If we accept the characterization of business groups in South Korea as V-groups, our
model therefore predicts that the largest and smallest of these would not be affected by the crisis
as much as the intermediate sized groups. Preliminary evidence from 1997-99 suggests that,

37
indeed, the intermediate-sized groups in South Korea have experienced the greatest difficulty.
Lee (1999) lists 23 groups from the largest 60 chaebol that have gone bankrupt during 1997-98.
None of these are in the top-five ranked chaebol, although his list does not include the recent and
highly-publicized bankruptcy of Daewoo (or the current financial difficulties of Hyundai).
Thirteen of the cases are among the top 6-30 ranked chaebol in 1996, so that one-half of these
have gone bankrupt. The remaining 10 cases are from the next 31-60 ranked chaebol, so that
one-third of these have gone bankrupt. Of these, several of the groups appeared in the list of top
6-30 groups in 1997 or 1998. Thus, there is some indication that bankruptcies are concentrated
among the intermediate-size (top 6-30) chaebol, though Daewoo is a notable exception to this,
and represents the first time that one of the top five chaebol has been allowed to fail.
In Taiwan, by contrast, the financial crisis has been much less severe, and bankruptcies
among the business groups have been few. If we accept the characterization of the groups in that
country as U-groups, these equilibria are entirely stable in Figure 1, so that we do not expect a
temporary shock to have permanent effects. Summing up, we are suggesting that the model
developed here may have some empirical content in terms of predicting which groups experience
financial difficulty in the presence of large shocks, as we investigate in ongoing work (Feenstra,
Hamilton, and Lim, 2002; Feenstra and Hamilton, forthcoming).
27 This has an equivalent effect in the model to an increase in governance costs α and all other fixed costs kij. That
is, whenever α or kij appears in the equilibrium conditions, it appears as (α/L) and (kij /L), so that a fall in L is equivalent to a rise in the governance costs α and these other fixed costs.
38
* The research on this paper has been supported by the Pacific Rim Business and Development
Program (PACBAD) at the Institute of Governmental Affairs, University of California, Davis.
Financial support from the Ford Foundation is gratefully acknowledged. The authors thank
Susana Iranzo for research assistance, as well as seminar participants at the NBER, Notre Dame
University, Stanford University, UCLA, University of Chicago, University of Florida and the
Russell Sage Foundation.
References
Abiru, M., B. Nahata, S. Raychaudhuri, and M. Waterson, 1998, Equilibrium structure in vertical
oligopoly. Journal of Economic Behavior and Organization, 37, 463-480.
Aoki, M. and H. Patrick, 1994, The Japanese main bank system (Oxford University Press,
Oxford and New York).
Amsden, A. H, 1989, South Korea and late industrialization (Oxford University Press, Oxford
and New York).
Bernheim, B. D. and M. Whinston, 1990, Multimarket contact and collusive behavior. Rand
Journal of Economics, 21(1), Spring, 1-26.
Biggart, N. W., 1990, Institutionalized patrimonialism in Korean business. Comparative Social
Research, 12, 113-133.
Caves, R. E. and M. Uekasa, 1976, Industrial organization in Japan (Washington, D.C., The
Brooking Institution).
Chandler, A. D., 1982, The M-Form: Industrial groups, American style. European Economic
Review, 19, 3-23.
Chang, D., 1999, Privately owned social structures: Institutionalization-network contingency in
the Korean chaebol. Ph.D. Dissertation, University of Chicago.
39
Chang, S. J. and U. Choi, 1988, Strategy, structure and performance of Korean business groups:
A transactions cost approach. Journal of Industrial Economics, 38(2), 141-158.
Chen, Y., 1999, Oligopoly price discrimination and resale price maintenance. Rand Journal of
Economics, 30(3), 441-455.
Chen, Y,, 2001, On vertical mergers and their competitive effects. Rand Journal of Economics,
32(4), 667-685.
Chou, T-C, 1985, Industrial organization in the process of economic development: The case of
Taiwan, 1950-1980. Louvain-la-Neuve: Universite Catholique de Louvain, Faculte des
Science Economiques, Sociales et Politiques.
Clayton, M. J., and B. N. Jorgensen, 2000, Cross-holdings and imperfect product markets,
Finance Department Working Paper Series, New York University and Harvard Business
School.
Dixit, A., 1983, Vertical integration in a monopolistically competitive industry, International
Journal of Industrial Organization, 1, 63-78.
Durham, Y., 2000, An experimental examination of double marginalization and vertical
relationships, Journal of Economic Behavior and Organization, 42, 207-229.
Feenstra, R. C., 1997, Business groups in South Korea and Taiwan: A Database and
comparison. Manuscript, Pacific Rim Business and Development Program, Institute of
Governmental Affairs, University of California, Davis.
Feenstra, R. C., and G. G. Hamilton, forthcoming, Emergent economies, divergent paths:
Business groups and economic organization in South Korea and Taiwan (Cambridge
University Press, Cambridge and New York).

40
Feenstra, R. C., G. G. Hamilton and D-S. Huang, 2001, The organization of the Taiwanese and
South Korean economies: A comparative equilibrium analysis. In: J. E. Rauch and A.
Casella, (Eds.), Networks and markets. Russell Sage, New York, 86-142.
Feenstra, R. C., G. G. Hamilton and E. M. Lim, 2002, Chaebols and catastrophe: A new view of
the Korean business groups and their role in the financial crisis, Asian Economic Papers,
1(2), forthcoming.
Feenstra, R. C., T-H. Yang, and G. G. Hamilton, 1999, Business groups and product variety in
trade: Evidence from South Korea, Taiwan and Japan, Journal of International
Economics, 48, June, 71-100.
Fung, K.C. and D. Friedman, 1996, International trade and the internal organization of firms: An
evolutionary approach, Journal of International Economics, 41(1/2), August, 113-137.
Gerlach, M., 1992, Alliance capitalism: The Strategic organization of Japanese business
(University of California Press, Berkeley).
Ghemawat, P. and T. Khanna, 1998, The nature of diversified business groups: A research design
and two case studies, Journal of Industrial Economics, 46(1), March, 35-61.
Ghatak, M. and R. Kali, 2001, Financially interlinked business groups, Journal of Economics and
Management Strategy, forthcoming.
Gold, T. B, 1986, State and society in the Taiwan miracle (M.E. Sharpe, Armonk, New York).
Greenhalgh, S., 1988, Families and networks in Taiwan's economic development. In: E.
Winckler and S. Greenhalgh, eds.). Contending approaches to the political economy of
Taiwan, M.E. Sharpe, Armonk, New York, 224-245.
Greenhut, M.L. and H. Ohta, 1979, Vertical integration of successive oligopolies, American
Economic Review, 69(1), 137-141.

41
Grossman, S. J. and O. D. Hart, 1986, Costs and benefits of ownership: A theory of vertical and
lateral integration, Journal of Political Economy, 94(4), August, 691-719.
Hamilton, G. G., and N. W. Biggart, 1988, Market, culture, and authority: A comparative
analysis of management and organization in the far east, American Journal of Sociology,
Special Issue on Economic Sociology, 94, S52-S94.
Hamilton, G. G. and C-S. Kao, 1990, The institutional foundations of Chinese business: The
family firm in Taiwan, Comparative Social Research ,12, 95-112.
Hamilton, G. G., W. Zeile and W-J. Kim,, 1990, The network structures of east Asian
economies. In: S.R. Clegg and S.G. Redding (Eds.), Capitalism in contrasting cultures. de
Gruyter, Berlin.
Helpman, E. and P. R. Krugman, 1985, Market structure and foreign trade (MIT Press:
Cambridge).
Hoshi, T., A. Kashyap, and D. Sharfstein, 1990a, The role of banks in reducing the costs of
financial distress in Japan, Journal of Financial Economics, 27, 67-88.
Hoshi, T., A. Kashyap, and D. Sharfstein, 1990b, Bank monitoring and investment: Evidence
from the changing structure of Japanese corporate banking relationships. In: R. Glenn
Hubbard, (Ed.), Asymmetric information, corporate finance, and investment. Univ. of
Chicago Press and NBER, Chicago, 105-126.
Hoshi, T., A. Kashyap, and D. Sharfstein, 1991, Corporate structure, liquidity, and investment:
Evidence from Japanese industrial groups, Quarterly Journal of Economics, 106(1),
February, 33-60.
Ito, T., 1994, The Japanese economy (MIT Press, Cambridge).
42
Khanna, T., 2000, Business groups and social welfare in emerging markets: Existing evidence
and unanswered questions, European Economic Review, 44(4-6), 748-761.
Khanna, T. and Krishna P., 2000a, Is group affiliation profitable in emerging markets: An
analysis of Indian diversified business groups, Journal of Finance, 55(2), 867-891.
Khanna, T. and Krishna P., 2000b, Emerging market business groups, foreign investors and
corporate governance. In: R. Morck, (Ed.), Concentrated corporate ownership. Univ. of
Chicago Press and NBER, Chicago, 265-294.
Khanna, T. and J. W. Rivkin, 2001, Estimating the performance effects of business groups in
emerging markets, Strategic Management Journal, 22, 45-74.
Kim, E. M., 1991, The industrial organization and growth of the Korean chaebol: Integrating
development and organizational theories. In: G. G. Hamilton, (Ed.), Business networks
and economic development in East and Southeast Asia. Center of Asian Studies,
University of Hong Kong, Hong Kong, 272-299.
Kim, E. M., 1993, Contradictions and limits of a developmental state: With illustrations from the
South Korean case, Social Problems, May.
Kim, E. M., 1997, Big business, strong state: Collusion and conflict in Korean development,
1960-1990. Berkeley: University of California.
Kim, S-J., 1999, Bailout and conglomeration, International Monetary Fund, Washington, D.C.,
mimeo.
Krouse, C. G., 1995, Japanese microelectronics: Creating competitive advantage by vertical
interaction, Journal of Economic Behavior and Organization, 28, 49-61.
Lee, K., 1999, Corporate governance and growth in the Korean chaebols: A Microeconomic
foundation for the 1997 Crisis, Seoul National Univ., manuscript.

43
Leff, N. H., 1978, Industrial organization and entrepreneurship in the developing countries: The
economic groups, Economic Development and Cultural Change, 661-675.
Levy, B., 1991, Transactions costs, the size of firms and industrial policy, Journal of
Development Economics, 34, 1991, 151-178.
Lincoln, J. R., M. L. Gerlach and C. L. Ahmadjian, 1994, Keiretsu networks and corporate
performance in Japan, Haas School of Business, University of California at Berkeley,
manuscript.
McClaren, J., 2000, ‘Globalization’ and vertical structure, American Economic Review, 90(5),
December, 1239-1254.
Mathewson, G.F. and R.A. Winter, 1983, Vertical integration by contractual restraints in spatial
markets, Journal of Business, 56, October, 497-517.
Mehra, A., 1994, Strategic groups: A resource-based approach, Journal of Socio-Economics,
23(4), Winter, 425-439.
Numazaki, I., 1986, Networks of Taiwanese big business: A preliminary analysis, Modern
China, 12, 487-534.
Numazaki, I., 1991, The role of personal networks in the making of Taiwan's guanxiqiye (related
enterprises). In: G. G. Hamilton, (Ed.), Business networks and economic development in
East and Southeast Asia, Center of Asian Studies, University of Hong Kong, Hong Kong,
77-93.
Ordover, J. A., Garth Saloner and Steven C. Salop, 1990, Equilibrium vertical foreclosure,
American Economic Review, 80(1), March, 127-142.
Ordover, J. A., Garth Saloner and Steven C. Salop, 1992, Equilibrium vertical foreclosure:
Reply, American Economic Review, 82(3), June, 698-703.
44
Orru, M., N. W. Biggart, and G. G. Hamilton,, 1991, Organizational isomorphism in east Asia:
Broadening the new institutionalism. In: W. W. Powell and P. J. DiMaggio, (Eds.), The
new institutionalism in organizational analysis, Univ. of Chicago Press, Chicago.
Pepall, L. and G. Norman, 2001, Product differentiation and upstream-downstream relations,
Journal of Economics and Management Strategy, 10(2), 201-234.
Perotti, E. C. and S. Gelfer, 2001, Red barons or robber barons: Governance and financing in
Russian financial-industrial groups, European Economic Review, forthcoming.
Perry, M. K., 1989, Vertical integration: Determinants and effects. In: R. Schmalansee and R.
Willig, (Eds.), Handbook of industrial organization, volume 1, North-Holland,
Amsterdam, 185-255.
Perry, M. K. and R. H. Groff, 1985, Resale price maintenance and forward integration into a
monopolistically competitive industry, Quarterly Journal of Economics, 100, 1293-1311.
Spengler, J. J., 1950, Vertical integration and antitrust policy, Journal of Political Economy,
58(4), 347-352.
Steers, R. M., K. S. Yoo and G. Ungson, 1989, The chaebol: Korea's new industrial might
(Harper and Row, New York).
Wade, R., 1990, Governing the market: Economic theory and the role of government in east
Asian industrialization (Princeton University Press, Princeton).
Weinstein, D. E. and Y. Yafeh, 1995, Japan’s corporate groups: Collusive or competitive? An
empirical investigation of keiretsu behavior, Journal of Industrial Economics, 43, 359-
376.
45
Weinstein, D. E. and Y. Yafeh, 1998, On the costs of a bank-centered financial system: Evidence
from the changing main bank relations in Japan, Journal of Finance, 53(2), April, 635-
672.
Williamson, O. E., 1975, Markets and hierarchies (The Free Press, New York).
Williamson, O. E., 1985, The economic institutions of capitalism (The Free Press, New York).
Wong, S-L., 1985, The Chinese family firm: A model, British Journal of Sociology, 36, 58-72.
Yoo, I-H., 1995, Gyungje gaehyuk gwa chaebol (economic reform and chaebol).
Chayuchiseongsa, Seoul (in Korean).
Yoo, S. Min, 1999, Corporate restructuring in Korea, and the Asian economic crisis: One year
later, Joint U.S.-Korea Academic Studies, 9, 131-200.
Zeile, W., 1991, Industrial policy and organizational efficiency: The Korean chaebol examined.
In: G. G. Hamilton, (Ed.), Business networks and economics development in East and
Southeast Asia, Center of Asian Studies, Hong Kong, 300-329.

46
Figure 1: Number of Business Groups
02468
10121416182022
1 1.2 1.4 1.6 1.8 2 2.2 2.4 2.6 2.8 3 3.2 3.4
Elasticity of Substitution, σ
Num
ber o
f Gro
ups,
G
V-group (stable)
D-group
U-group
V-group (unstable)
?
G=σ/(σ−1)
Figure 2: Price of Intermediate Input
0123456789
10
1.5 1.7 1.9 2.1 2.3 2.5 2.7 2.9 3.1 3.3 3.5
Elasticity of Substitution, σ
Pric
e of
Inpu
t, Pb V-group
(stable)
D-group
U-group
V-group(unstable)
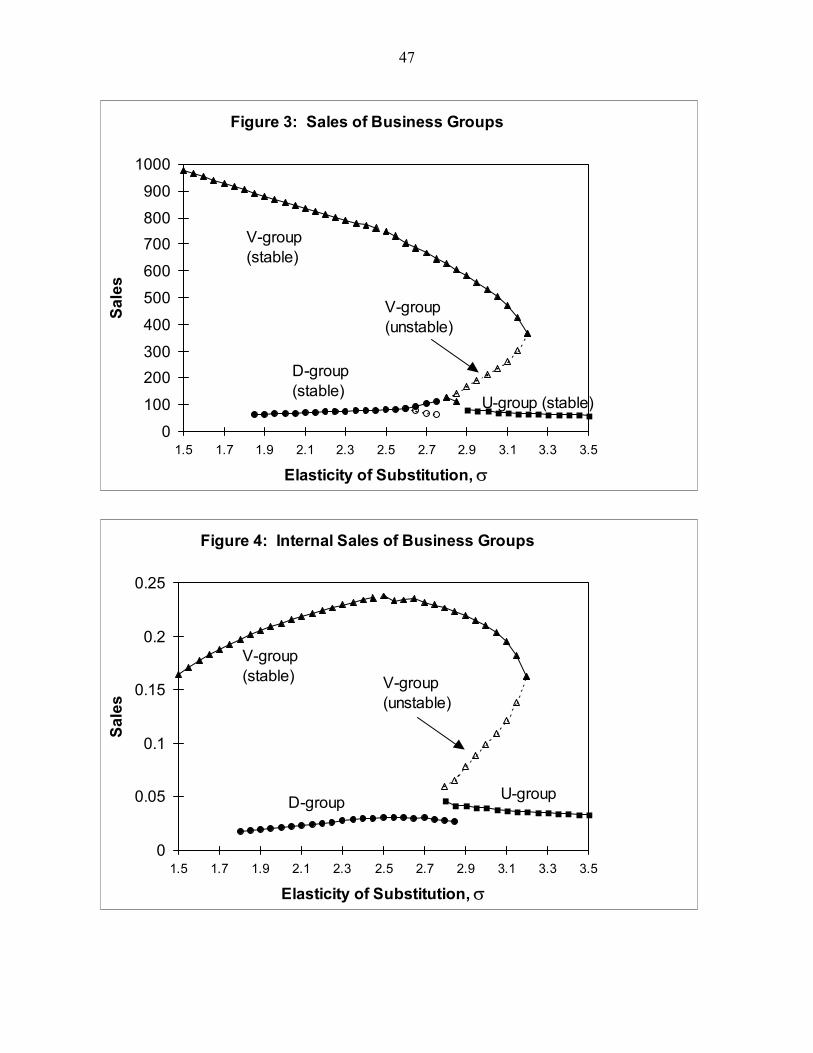
47
Figure 3: Sales of Business Groups
0
100
200300
400
500
600
700800
900
1000
1.5 1.7 1.9 2.1 2.3 2.5 2.7 2.9 3.1 3.3 3.5
Elasticity of Substitution, σ
Sale
s
V-group(stable)
D-group(stable)
U-group (stable)
V-group(unstable)
Figure 4: Internal Sales of Business Groups
0
0.05
0.1
0.15
0.2
0.25
1.5 1.7 1.9 2.1 2.3 2.5 2.7 2.9 3.1 3.3 3.5
Elasticity of Substitution, σ
Sale
s
V-group(stable)
D-group U-group
V-group(unstable)
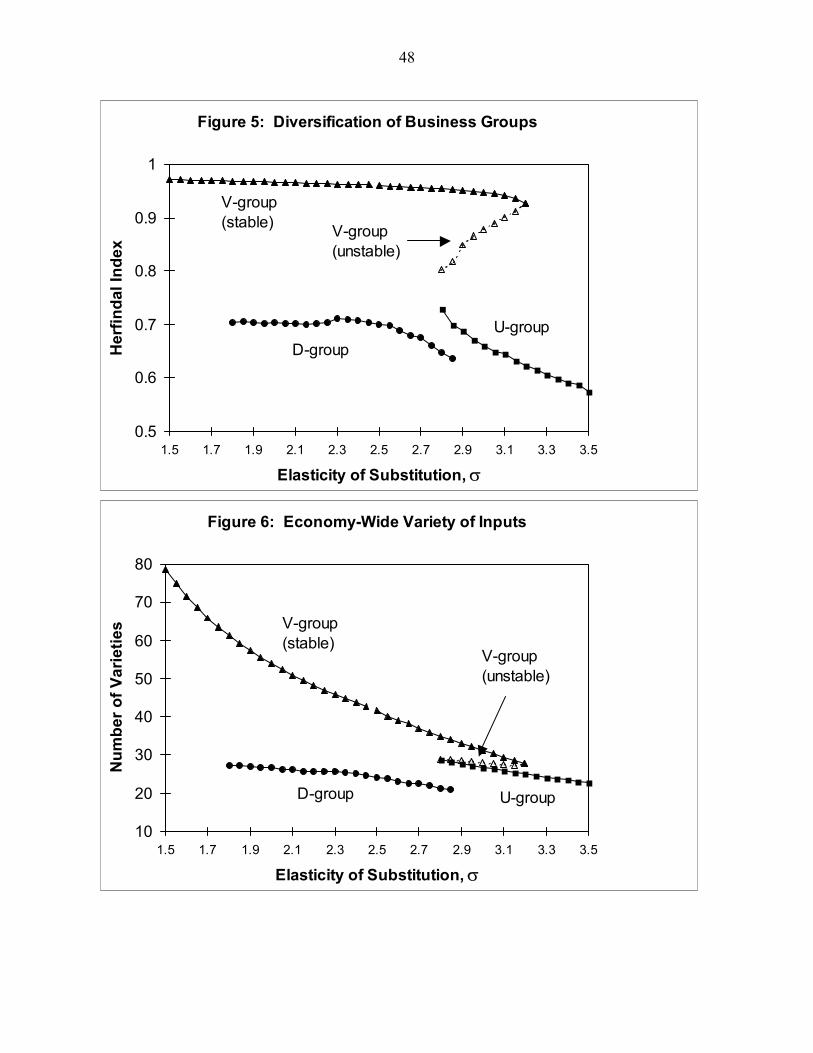
48
Figure 5: Diversification of Business Groups
0.5
0.6
0.7
0.8
0.9
1
1.5 1.7 1.9 2.1 2.3 2.5 2.7 2.9 3.1 3.3 3.5
Elasticity of Substitution, σ
Her
finda
l Ind
ex
V-group(stable)
D-groupU-group
V-group(unstable)
Figure 6: Economy-Wide Variety of Inputs
10
20
30
40
50
60
70
80
1.5 1.7 1.9 2.1 2.3 2.5 2.7 2.9 3.1 3.3 3.5
Elasticity of Substitution, σ
Num
ber o
f Var
ietie
s V-group(stable)
D-group U-group
V-group(unstable)
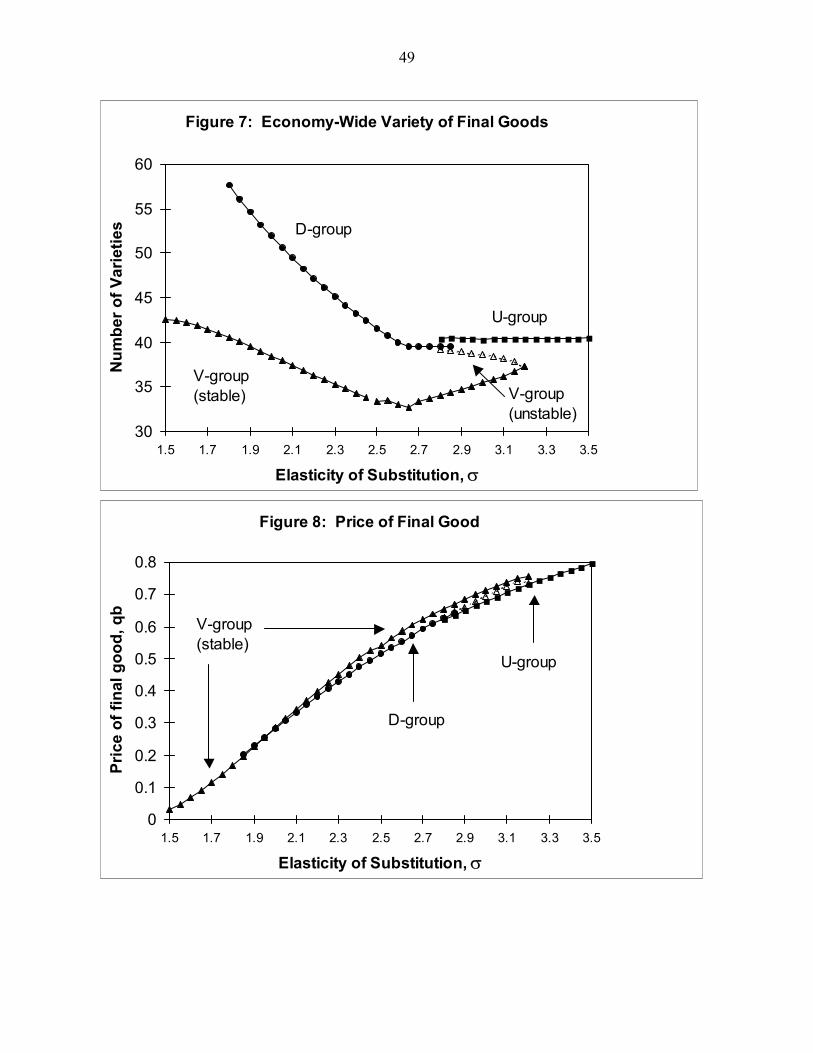
49
Figure 7: Economy-Wide Variety of Final Goods
30
35
40
45
50
55
60
1.5 1.7 1.9 2.1 2.3 2.5 2.7 2.9 3.1 3.3 3.5
Elasticity of Substitution, σ
Num
ber o
f Var
ietie
s
V-group(stable)
D-group
U-group
V-group(unstable)
Figure 8: Price of Final Good
0
0.1
0.2
0.3
0.4
0.5
0.6
0.7
0.8
1.5 1.7 1.9 2.1 2.3 2.5 2.7 2.9 3.1 3.3 3.5
Elasticity of Substitution, σ
Pric
e of
fina
l goo
d, q
b
V-group(stable)
D-group
U-group