A long-term association between global temperature and biodiversity, origination and extinction in...
7
A long-term association between global temperature and biodiversity, origination and extinction in the fossil record Peter J. Mayhew 1, * , Gareth B. Jenkins 1 and Timothy G. Benton 2 1 Department of Biology, University of York, York YO10 5YW, UK 2 Institute of Integrative and Comparative Biology, Faculty of Biological Sciences, University of Leeds, Leeds LS2 9JT, UK The past relationship between global temperature and levels of biological diversity is of increasing concern due to anthropogenic climate warming. However, no consistent link between these variables has yet been demonstrated. We analysed the fossil record for the last 520 Myr against estimates of low latitude sea surface temperature for the same period. We found that global biodiversity (the richness of families and genera) is related to temperature and has been relatively low during warm ‘greenhouse’ phases, while during the same phases extinction and origination rates of taxonomic lineages have been relatively high. These findings are consistent for terrestrial and marine environments and are robust to a number of alternative assumptions and potential biases. Our results provide the first clear evidence that global climate may explain substantial variation in the fossil record in a simple and consistent manner. Our findings may have implications for extinction and biodiversity change under future climate warming. Keywords: fossil record; global biodiversity; global climate change; global temperature; macroevolution; mass extinction 1. INTRODUCTION The possibility that anthropogenic climate change could cause much extinction ( Thomas et al. 2004; Lovejoy & Hannah 2005; Pounds et al. 2006; Botkin et al. 2007) has placed new emphasis on studies of the relationship between global temperature and levels of biological diversity (Crowley & North 1988; Alroy et al. 2000; Culver & Rawson 2000; Barnosky et al. 2003, 2004; Wilf et al. 2003; Prothero 2004; Gibbs et al. 2006). Past analyses of this relationship have shown that past climate variation is sometimes associated with variation in biodiversity and taxonomic rate, but effects vary consider- ably, and no consistent relationship has emerged (see above refs). However, most studies have been confined to relatively short geological periods, limited geographical extents and/or few taxonomic groups. In recent years, palaeoclimate datasets have been developed ( Veizer et al. 2000; Royer et al. 2004) that, together with biodiversity compilations from the fossil record (Benton 1993; Sepkoski 2002), allows this relationship to be tackled at a much broader scale than has been possible before. The explanation of patterns in global biodiversity and taxonomic rates in the fossil record is one of the major challenges in evolutionary biology. Previous research has focused mainly on identifying (i) main trends and their consistency with alternative models of cladogenesis ( Levinton 1979; Sepkoski 1984; Benton 1995, 1997; Courtillot & Gaudemer 1996) and (ii) potential causes of periods of major biodiversity turnover known as mass extinction events ( Raup & Sepkoski 1982; Crowley & North 1988; Erwin 1990; Wignall & Twitchett 1996; Pope et al. 1998; Sheehan 2001; Joachimski & Buggisch 2002; White 2002; Benton & Twitchett 2003; Wignall 2005; Twitchett 2006). Only rarely have studies attempted to find statistical associations between the major global patterns and environmental variables throughout the Phanerozoic ( Rothman 2001; Cornette et al. 2002). We tested for the first time whether a major climate measure, temperature, is statistically linked with variation in global biodiversity and taxonomic rates over the Phanerozoic. Our results show, robustly, that biodiversity and evolutionary processes are indeed linked to global temperature in a consistent manner over the Phanerozoic fossil record. 2. MATERIAL AND METHODS The temperature data are based on low latitude sea surface oxygen isotope ratios corrected for variation in seawater pH ( Royer et al. 2004). These data are built on earlier estimates ( Veizer et al. 2000), providing a better fit to first-order tests such as known glacial periods (see Veizer et al. 2000; Royer et al. 2004). The major features of these data, in terms of ‘icehouse’ and ‘greenhouse’ climatic phases in Earth history, are widely supported and non-contentious ( Huber et al. 2000). We conducted a sensitivity analysis on the temperature data, using predictions generated by two alternative assumptions about seawater calcium ( Royer et al. 2004), corresponding to the upper and lower orange bands of fig. 4 in Royer et al. (2004). Data on the distribution of families across geological strata (Benton 1993) represent the most recent compilation of global diversity covering both land and sea. The data were compiled under two different assumptions about the timing of fossil appearances for those families where dating was not to stage level (e.g. epoch); the ‘maximum’ assumption assumes that the lifespan of each family was from the first Proc. R. Soc. B (2008) 275, 47–53 doi:10.1098/rspb.2007.1302 Published online 24 October 2007 Electronic supplementary material is available at http://dx.doi.org/10. 1098/rspb.2007.1302 or via http://www.journals.royalsoc.ac.uk. * Author for correspondence ([email protected]). Received 21 September 2007 Accepted 2 October 2007 47 This journal is q 2007 The Royal Society
Transcript of A long-term association between global temperature and biodiversity, origination and extinction in...
Proc. R. Soc. B (2008) 275, 47–53
doi:10.1098/rspb.2007.1302
A long-term association between globaltemperature and biodiversity, origination
and extinction in the fossil recordPeter J. Mayhew1,*, Gareth B. Jenkins1 and Timothy G. Benton2
1Department of Biology, University of York, York YO10 5YW, UK2Institute of Integrative and Comparative Biology, Faculty of Biological Sciences, University of Leeds, Leeds LS2 9JT, UK
Published online 24 October 2007
Electron1098/rsp
*Autho
ReceivedAccepted
The past relationship between global temperature and levels of biological diversity is of increasing concern
due to anthropogenic climate warming. However, no consistent link between these variables has yet been
demonstrated. We analysed the fossil record for the last 520 Myr against estimates of low latitude sea
surface temperature for the same period. We found that global biodiversity (the richness of families and
genera) is related to temperature and has been relatively low during warm ‘greenhouse’ phases, while
during the same phases extinction and origination rates of taxonomic lineages have been relatively high.
These findings are consistent for terrestrial and marine environments and are robust to a number of
alternative assumptions and potential biases. Our results provide the first clear evidence that global climate
may explain substantial variation in the fossil record in a simple and consistent manner. Our findings may
have implications for extinction and biodiversity change under future climate warming.
Keywords: fossil record; global biodiversity; global climate change; global temperature; macroevolution;
mass extinction
1. INTRODUCTIONThe possibility that anthropogenic climate change could
cause much extinction (Thomas et al. 2004; Lovejoy &
Hannah 2005; Pounds et al. 2006; Botkin et al. 2007) has
placed new emphasis on studies of the relationship
between global temperature and levels of biological
diversity (Crowley & North 1988; Alroy et al. 2000;
Culver & Rawson 2000; Barnosky et al. 2003, 2004; Wilf
et al. 2003; Prothero 2004; Gibbs et al. 2006). Past
analyses of this relationship have shown that past climate
variation is sometimes associated with variation in
biodiversity and taxonomic rate, but effects vary consider-
ably, and no consistent relationship has emerged (see
above refs). However, most studies have been confined to
relatively short geological periods, limited geographical
extents and/or few taxonomic groups. In recent years,
palaeoclimate datasets have been developed (Veizer et al.
2000; Royer et al. 2004) that, together with biodiversity
compilations from the fossil record (Benton 1993;
Sepkoski 2002), allows this relationship to be tackled at
a much broader scale than has been possible before.
The explanation of patterns in global biodiversity and
taxonomic rates in the fossil record is one of the major
challenges in evolutionary biology. Previous research has
focused mainly on identifying (i) main trends and their
consistency with alternative models of cladogenesis
(Levinton 1979; Sepkoski 1984; Benton 1995, 1997;
Courtillot & Gaudemer 1996) and (ii) potential causes of
periods of major biodiversity turnover known as mass
extinction events (Raup & Sepkoski 1982; Crowley &
ic supplementary material is available at http://dx.doi.org/10.b.2007.1302 or via http://www.journals.royalsoc.ac.uk.
r for correspondence ([email protected]).
21 September 20072 October 2007
47
North 1988; Erwin 1990; Wignall & Twitchett 1996; Pope
et al. 1998; Sheehan 2001; Joachimski & Buggisch 2002;
White 2002; Benton & Twitchett 2003; Wignall 2005;
Twitchett 2006). Only rarely have studies attempted to
find statistical associations between the major global
patterns and environmental variables throughout the
Phanerozoic (Rothman 2001; Cornette et al. 2002).
We tested for the first time whether a major climate
measure, temperature, is statistically linked with variation in
global biodiversity and taxonomic rates over the Phanerozoic.
Our results show, robustly, that biodiversity and evolutionary
processes are indeed linked to global temperature in a
consistent manner over the Phanerozoic fossil record.
2. MATERIAL AND METHODSThe temperature data are based on low latitude sea surface
oxygen isotope ratios corrected for variation in seawater pH
(Royer et al. 2004). These data are built on earlier estimates
(Veizer et al. 2000), providing a better fit to first-order tests
such as known glacial periods (see Veizer et al. 2000; Royer et al.
2004). The major features of these data, in terms of ‘icehouse’
and ‘greenhouse’ climatic phases in Earth history, are widely
supported and non-contentious (Huber et al. 2000). We
conducted a sensitivity analysis on the temperature data, using
predictions generated by two alternative assumptions about
seawater calcium (Royer et al. 2004), corresponding to the
upper and lower orange bands of fig. 4 in Royer et al. (2004).
Data on the distribution of families across geological strata
(Benton 1993) represent the most recent compilation of
global diversity covering both land and sea. The data were
compiled under two different assumptions about the timing
of fossil appearances for those families where dating was not
to stage level (e.g. epoch); the ‘maximum’ assumption
assumes that the lifespan of each family was from the first
This journal is q 2007 The Royal Society
48 P. J. Mayhew et al. Temperature and biodiversity
stage of the interval of first appearance until last stage of the
interval of last appearance. The ‘minimum’ assumption is
that the lifespan of a family was from the last stage of the
interval of first appearance until the first stage of the interval
of last appearance (Benton 1993, 1995). Data on marine
genera of animals and protists (Sepkoski 2002) were
compiled at stage resolution to provide maximum taxonomic
inclusivity and greatest stratum comparability with Benton
(1993). Three of the four major datasets we have used (the
temperature, CO2 and global family datasets) apply the same
time scale (Harland et al. 1990). Therefore to maximize
comparability among the different datasets and to reduce
total rescaling error, because strata used in different scales are
not always exactly equivalent, we rescaled the more recent
genus level marine dataset to the same time scale. Taxonomic
rates were recalculated using the new assumed time scale.
We included estimated atmospheric CO2 concentrations
(Berner & Kothavala 2001) as an explanatory variable in some
analyses because previous analyses have shown that this may
correlate with both taxonomic richness and rates (Rothman
2001; Cornette et al. 2002), and because CO2 levels and
temperature are often good predictors of each other (Royer
et al. 2004). Estimates of CO2 levels over the Phanerozoic in
recent years have often been discordant (Berner & Kothavala
2001; Rothman 2002). We used those from the GEOCARB III
model primarily because those data were assumed in deriving
the temperature estimates we used (Royer et al. 2004). The
data have also been used in previous studies on macroevolu-
tion (Cornette et al. 2002), show good convergence with other
models that track carbon exchange, match well with other
proxies (Royer et al. 2004) and correlate well with temperature
(Royer et al. 2004), so are likely to provide a rigorous test of the
effects of temperature itself.
We first used traditional measures of taxonomic diversity
and rates as our response variables; total richness and the per-
taxon rate (Foote 2000a). However, such measures may be
susceptible to a number of biases that may obscure the true
biological signal (Foote 2000a). We therefore used taxo-
nomic rate measures that are independent of singletons: the
standing richness of boundary crossing taxa (Foote 2000b),
as well as the estimated per capita origination rate ‘p’ and
extinction rate ‘q’ (Foote 2000a). Such measures are
potentially more robust to variation in interval length and
preservation rate, at least as long as this variation is small.
Second, we included several control variables in our analysis
to represent variation in preservation rate: numbers of
sedimentary formations at epoch level were taken from
columns 3 and 4 of appendix 2 of Peters & Foote (2001).
Stage level data for marine formations (same original source)
were obtained from Peters & Foote (2002). Data from the
Correlation of Stratigraphic Units of North America used in
Peters (2005) were obtained courtesy of the author. Finally,
data on estimated marine genus preservation frequency in
Foote (2005; from the pulsed/pulsed model) were obtained
courtesy of the author. All these datasets were rescaled, as
above for the Sepkoski data. The temperature and CO2 data
consist of estimates at 10 Myr intervals and to provide
richness and rate data at the same intervals we used the
diversity and taxonomic rates of the geological interval into
which each 10 Myr point fell.
Time series (see electronic supplementary material for
dataset and explanatory text) were transformed (log or square
root), as appropriate, and detrended to remove long-term
patterns (see table 1 in the electronic supplementary
Proc. R. Soc. B (2008)
material). The detrending methodology was to fit linear and
cubic polynomials, and splines increasing in flexibility to
follow the patterns in the data (i.e. of increasing degrees of
freedom, d.f.; Fewster et al. 2000; see figure 1 and table 1 in
the electronic supplementary material). The specific detren-
der used was chosen to: make the series stationary; reduce the
influence of outliers; make the distribution symmetrical; and
maximize the signal-to-noise ratio. Low d.f. smoothers fit the
trend and as the d.f. increase the smoothers pick up more of
the shorter-term patterns in the data. Comparison between
the fits, using autocorrelation or spectral analysis (see figure 2
in the electronic supplementary material), typically shows a
pattern dominated by the trend (i.e. autocorrelation decays
away very slowly), whereas very high d.f. smoothers take out
all but noise around the pattern (so there are no patterns in
the autocorrelation function). The appropriate smoother is
one that maximizes the underlying signal. In the majority of
cases, the detrender was a 5 d.f. spline (see figure 2 and
table 2 in the electronic supplementary material). Detrended
time series were then mean standardized.
Pearson correlation was used between the detrended
diversity series and the temperature series. Generalized linear
models were fitted with the diversity series as the dependent
variable. The latter method allowed statistical controlling for
covariates, and therefore tested whether the covariates (e.g.
preservation rates or CO2) could explain the patterns in the
series. As points in a time series are serially autocorrelated, all
significance was established using bootstrapping of the appro-
priate statistic (the correlation, the difference between lagged
and unlagged correlation). We tested for associations between
diversity or taxonomic rates and temperature during the same
time step. Autocorrelation and spectral analysis sometimes
suggested lagged associations, diversity or taxonomic rates
lagging behind temperature, so we also tested for such responses,
normally using a lag of 10 Myr between the time series.
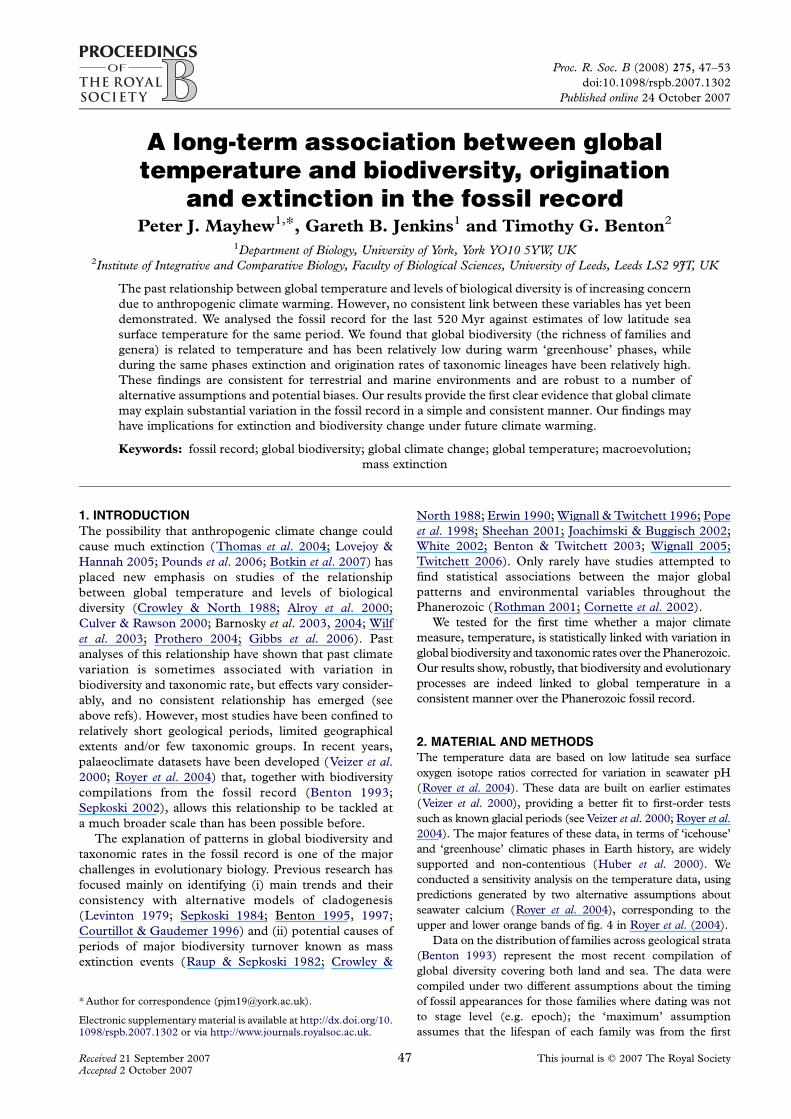
3. RESULTSThe standing diversity of fossil families was significantly
negatively associated with temperature using both maxi-
mum and minimum dating assumptions (table 1; figure 1).
The correlation was significantly stronger at a lag of one
time step (10 Myr) using maximum dating estimates, but
not when using minimum dates (table 1). When the data
were split into marine and terrestrial families, all
relationships remained negative, but only some attained
statistical significance. For example, for marine families,
the correlation was also significant, though lagged results
were not significantly stronger than unlagged; and for
marine genera, the relationship was also negative, but not
significant. For terrestrial families, all trends remained
negative but only one correlation was significant: that
using the maximum dating assumption, and at a 10 Myr
lag (with a much shorter fossil record the statistical power
is weaker).
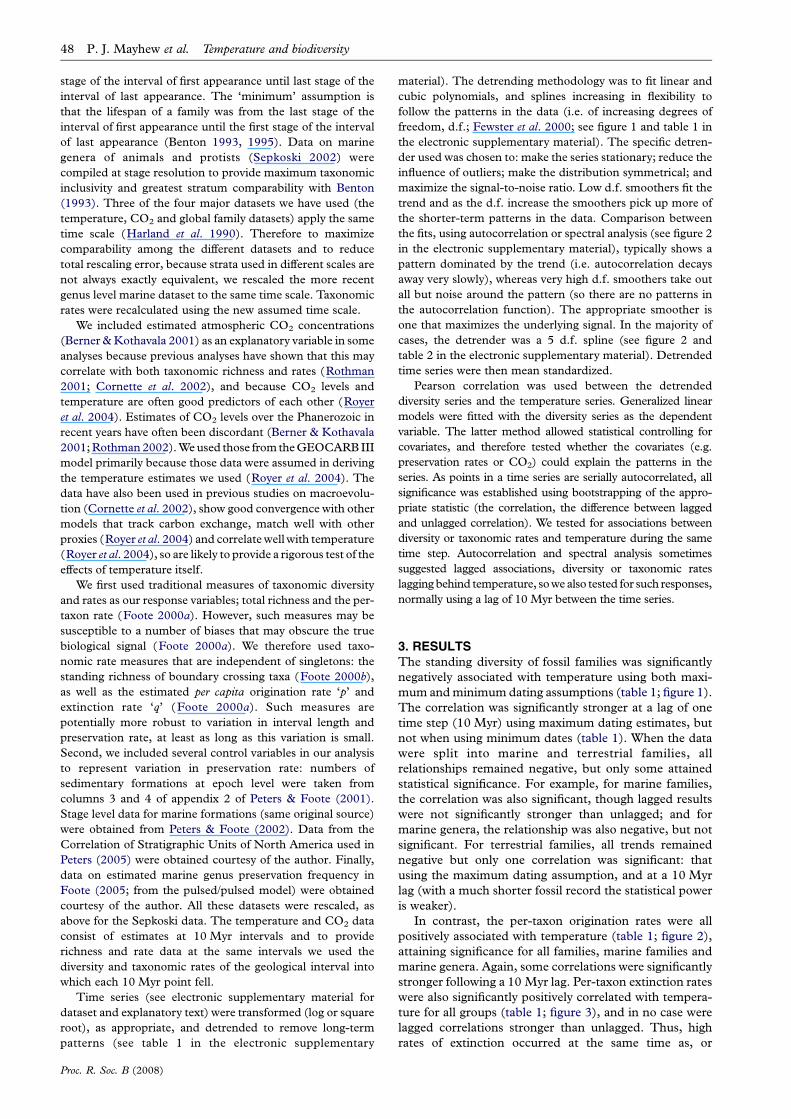
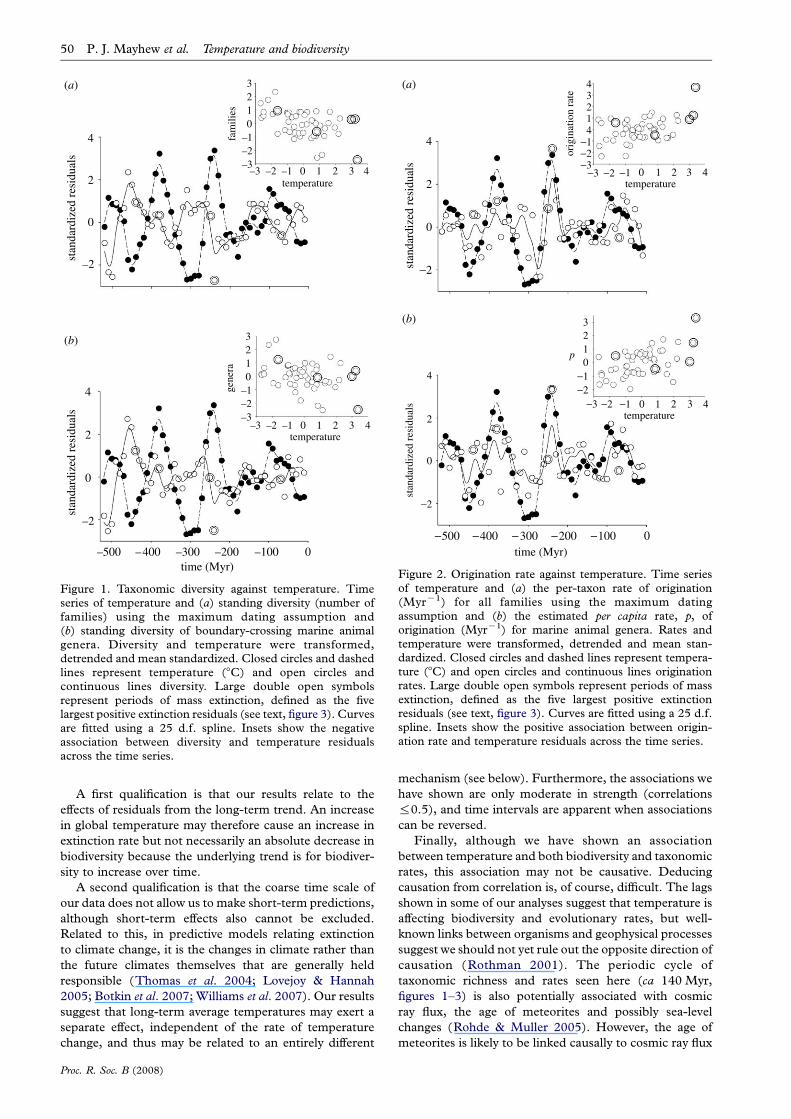
In contrast, the per-taxon origination rates were all
positively associated with temperature (table 1; figure 2),
attaining significance for all families, marine families and
marine genera. Again, some correlations were significantly
stronger following a 10 Myr lag. Per-taxon extinction rates
were also significantly positively correlated with tempera-
ture for all groups (table 1; figure 3), and in no case were
lagged correlations stronger than unlagged. Thus, high
rates of extinction occurred at the same time as, or
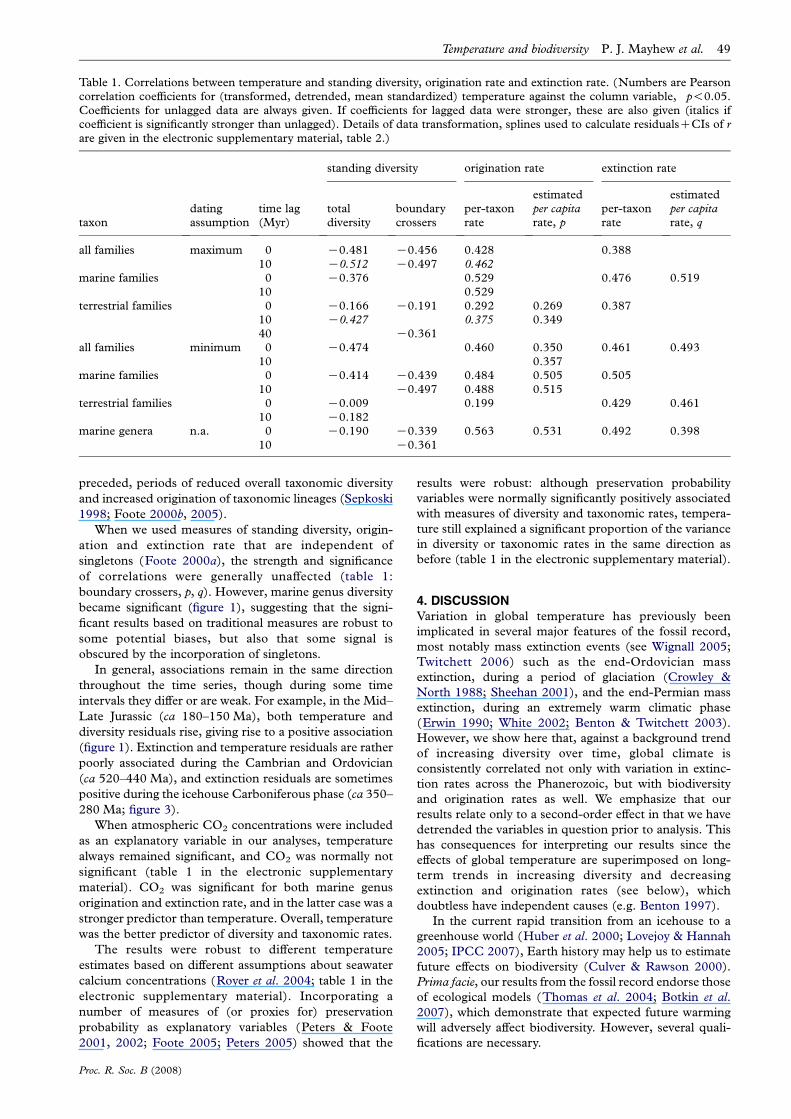
Table 1. Correlations between temperature and standing diversity, origination rate and extinction rate. (Numbers are Pearsoncorrelation coefficients for (transformed, detrended, mean standardized) temperature against the column variable, �p!0.05.Coefficients for unlagged data are always given. If coefficients for lagged data were stronger, these are also given (italics ifcoefficient is significantly stronger than unlagged). Details of data transformation, splines used to calculate residualsCCIs of rare given in the electronic supplementary material, table 2.)
standing diversity origination rate extinction rate
taxondatingassumption
time lag(Myr)
totaldiversity
boundarycrossers
per-taxonrate
estimatedper capitarate, p
per-taxonrate
estimatedper capitarate, q
all families maximum 0 K0.481� K0.456� 0.428� 0.388�
10 K0.512� K0.497� 0.462�
marine families 0 K0.376� 0.529� 0.476� 0.519�
10 0.529�
terrestrial families 0 K0.166 K0.191 0.292 0.269 0.387�
10 K0.427� 0.375 0.34940 K0.361�
all families minimum 0 K0.474� 0.460� 0.350� 0.461� 0.493�
10 0.357�
marine families 0 K0.414� K0.439� 0.484� 0.505� 0.505�
10 K0.497� 0.488� 0.515�
terrestrial families 0 K0.009 0.199 0.429� 0.461�
10 K0.182marine genera n.a. 0 K0.190 K0.339� 0.563� 0.531� 0.492� 0.398�
10 K0.361�
Temperature and biodiversity P. J. Mayhew et al. 49
preceded, periods of reduced overall taxonomic diversity
and increased origination of taxonomic lineages (Sepkoski
1998; Foote 2000b, 2005).
When we used measures of standing diversity, origin-
ation and extinction rate that are independent of
singletons (Foote 2000a), the strength and significance
of correlations were generally unaffected (table 1:
boundary crossers, p, q). However, marine genus diversity
became significant (figure 1), suggesting that the signi-
ficant results based on traditional measures are robust to
some potential biases, but also that some signal is
obscured by the incorporation of singletons.
In general, associations remain in the same direction
throughout the time series, though during some time
intervals they differ or are weak. For example, in the Mid–
Late Jurassic (ca 180–150 Ma), both temperature and
diversity residuals rise, giving rise to a positive association
(figure 1). Extinction and temperature residuals are rather
poorly associated during the Cambrian and Ordovician
(ca 520–440 Ma), and extinction residuals are sometimes
positive during the icehouse Carboniferous phase (ca 350–
280 Ma; figure 3).
When atmospheric CO2 concentrations were included
as an explanatory variable in our analyses, temperature
always remained significant, and CO2 was normally not
significant (table 1 in the electronic supplementary
material). CO2 was significant for both marine genus
origination and extinction rate, and in the latter case was a
stronger predictor than temperature. Overall, temperature
was the better predictor of diversity and taxonomic rates.
The results were robust to different temperature
estimates based on different assumptions about seawater
calcium concentrations (Royer et al. 2004; table 1 in the
electronic supplementary material). Incorporating a
number of measures of (or proxies for) preservation
probability as explanatory variables (Peters & Foote
2001, 2002; Foote 2005; Peters 2005) showed that the
Proc. R. Soc. B (2008)
results were robust: although preservation probability
variables were normally significantly positively associated
with measures of diversity and taxonomic rates, tempera-
ture still explained a significant proportion of the variance
in diversity or taxonomic rates in the same direction as
before (table 1 in the electronic supplementary material).
4. DISCUSSIONVariation in global temperature has previously been
implicated in several major features of the fossil record,
most notably mass extinction events (see Wignall 2005;
Twitchett 2006) such as the end-Ordovician mass
extinction, during a period of glaciation (Crowley &
North 1988; Sheehan 2001), and the end-Permian mass
extinction, during an extremely warm climatic phase
(Erwin 1990; White 2002; Benton & Twitchett 2003).
However, we show here that, against a background trend
of increasing diversity over time, global climate is
consistently correlated not only with variation in extinc-
tion rates across the Phanerozoic, but with biodiversity
and origination rates as well. We emphasize that our
results relate only to a second-order effect in that we have
detrended the variables in question prior to analysis. This
has consequences for interpreting our results since the
effects of global temperature are superimposed on long-
term trends in increasing diversity and decreasing
extinction and origination rates (see below), which
doubtless have independent causes (e.g. Benton 1997).
In the current rapid transition from an icehouse to a
greenhouse world (Huber et al. 2000; Lovejoy & Hannah
2005; IPCC 2007), Earth history may help us to estimate
future effects on biodiversity (Culver & Rawson 2000).
Prima facie, our results from the fossil record endorse those
of ecological models (Thomas et al. 2004; Botkin et al.
2007), which demonstrate that expected future warming
will adversely affect biodiversity. However, several quali-
fications are necessary.
4
2
0
−2
−500 −400 −300 −200 −100 0time (Myr)
stan
dard
ized
res
idua
ls
43214
−2−1
−3−3 −2 −1 0 321 4
orig
inat
ion
rate
temperature
3210
−1−2
−3
−2
−2 −1 0 1 2 3 4temperature2
4
0
stan
dard
ized
res
idua
ls
p
(a)
(b)
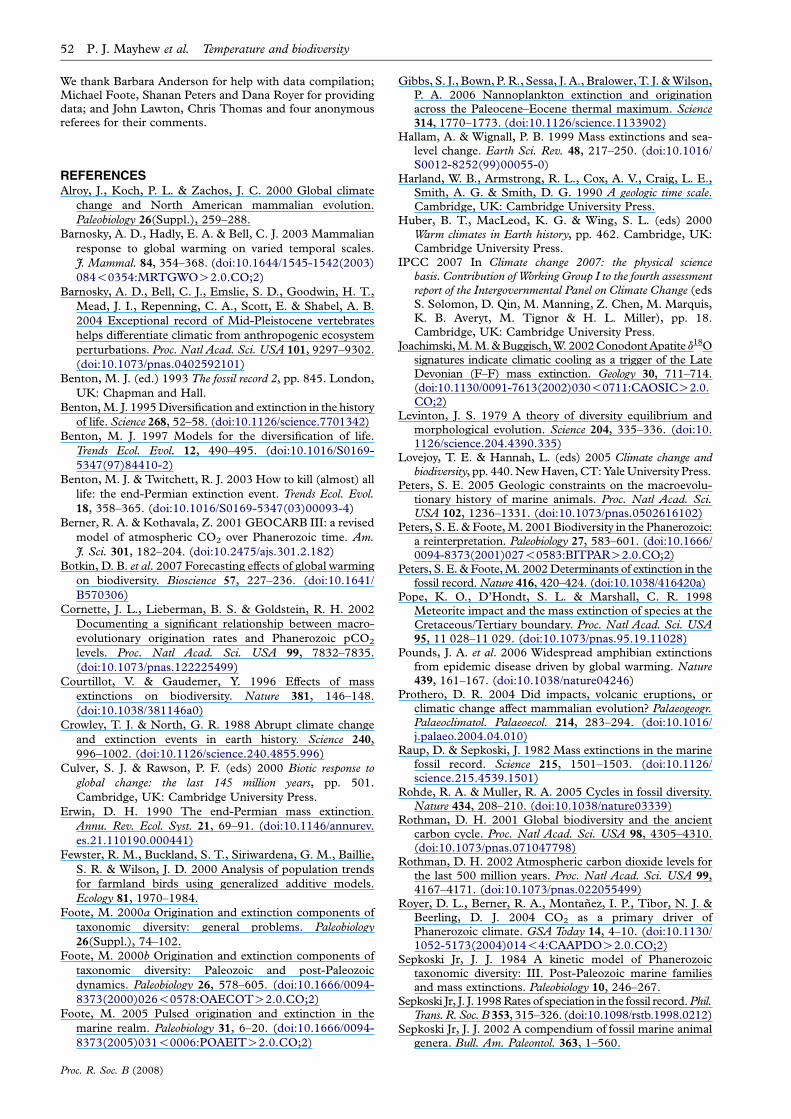
Figure 2. Origination rate against temperature. Time seriesof temperature and (a) the per-taxon rate of origination(MyrK1) for all families using the maximum datingassumption and (b) the estimated per capita rate, p, oforigination (MyrK1) for marine animal genera. Rates andtemperature were transformed, detrended and mean stan-dardized. Closed circles and dashed lines represent tempera-ture (8C) and open circles and continuous lines originationrates. Large double open symbols represent periods of massextinction, defined as the five largest positive extinctionresiduals (see text, figure 3). Curves are fitted using a 25 d.f.spline. Insets show the positive association between origin-ation rate and temperature residuals across the time series.
3210
–1–2–3
–3 –2 –1 0 4temperature
fam
ilies
4
2
0
–2
3210
–1–2–3
–3 –2 –1 0temperature
gene
ra
4
2
0
–2
–500 –400 –300 –200 –100 0time (Myr)
stan
dard
ized
res
idua
lsst
anda
rdiz
ed r
esid
uals
(a)
(b)
321
4321
Figure 1. Taxonomic diversity against temperature. Timeseries of temperature and (a) standing diversity (number offamilies) using the maximum dating assumption and(b) standing diversity of boundary-crossing marine animalgenera. Diversity and temperature were transformed,detrended and mean standardized. Closed circles and dashedlines represent temperature (8C) and open circles andcontinuous lines diversity. Large double open symbolsrepresent periods of mass extinction, defined as the fivelargest positive extinction residuals (see text, figure 3). Curvesare fitted using a 25 d.f. spline. Insets show the negativeassociation between diversity and temperature residualsacross the time series.
50 P. J. Mayhew et al. Temperature and biodiversity
A first qualification is that our results relate to the
effects of residuals from the long-term trend. An increase
in global temperature may therefore cause an increase in
extinction rate but not necessarily an absolute decrease in
biodiversity because the underlying trend is for biodiver-
sity to increase over time.
A second qualification is that the coarse time scale of
our data does not allow us to make short-term predictions,
although short-term effects also cannot be excluded.
Related to this, in predictive models relating extinction
to climate change, it is the changes in climate rather than
the future climates themselves that are generally held
responsible (Thomas et al. 2004; Lovejoy & Hannah
2005; Botkin et al. 2007; Williams et al. 2007). Our results
suggest that long-term average temperatures may exert a
separate effect, independent of the rate of temperature
change, and thus may be related to an entirely different
Proc. R. Soc. B (2008)
mechanism (see below). Furthermore, the associations we
have shown are only moderate in strength (correlations
%0.5), and time intervals are apparent when associations
can be reversed.
Finally, although we have shown an association
between temperature and both biodiversity and taxonomic
rates, this association may not be causative. Deducing
causation from correlation is, of course, difficult. The lags
shown in some of our analyses suggest that temperature is
affecting biodiversity and evolutionary rates, but well-
known links between organisms and geophysical processes
suggest we should not yet rule out the opposite direction of
causation (Rothman 2001). The periodic cycle of
taxonomic richness and rates seen here (ca 140 Myr,
figures 1–3) is also potentially associated with cosmic
ray flux, the age of meteorites and possibly sea-level
changes (Rohde & Muller 2005). However, the age of
meteorites is likely to be linked causally to cosmic ray flux
−500 −400 −300 −200 −100 0time (Myr)
4
−2
0
2
stan
dard
ized
res
idua
ls
4
−2
0
2
stan
dard
ized
res
idua
ls2
1
0
−1
−2
extin
ctio
n ra
te
32
1
0
−1
−2
q
−3 −2 −1 0 1temperature
(a)
(b)
432
−3 −2 −1 0 1temperature
432
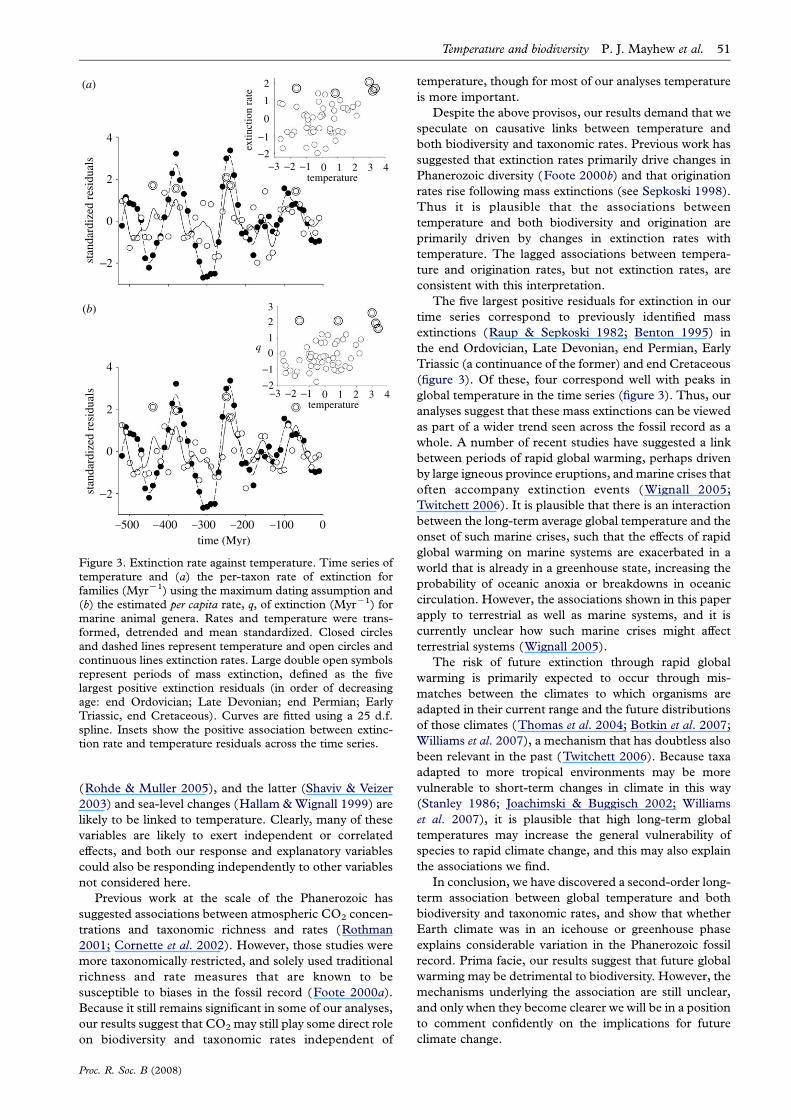
Figure 3. Extinction rate against temperature. Time series oftemperature and (a) the per-taxon rate of extinction forfamilies (MyrK1) using the maximum dating assumption and(b) the estimated per capita rate, q, of extinction (MyrK1) formarine animal genera. Rates and temperature were trans-formed, detrended and mean standardized. Closed circlesand dashed lines represent temperature and open circles andcontinuous lines extinction rates. Large double open symbolsrepresent periods of mass extinction, defined as the fivelargest positive extinction residuals (in order of decreasingage: end Ordovician; Late Devonian; end Permian; EarlyTriassic, end Cretaceous). Curves are fitted using a 25 d.f.spline. Insets show the positive association between extinc-tion rate and temperature residuals across the time series.
Temperature and biodiversity P. J. Mayhew et al. 51
(Rohde & Muller 2005), and the latter (Shaviv & Veizer
2003) and sea-level changes (Hallam & Wignall 1999) are
likely to be linked to temperature. Clearly, many of these
variables are likely to exert independent or correlated
effects, and both our response and explanatory variables
could also be responding independently to other variables
not considered here.
Previous work at the scale of the Phanerozoic has
suggested associations between atmospheric CO2 concen-
trations and taxonomic richness and rates (Rothman
2001; Cornette et al. 2002). However, those studies were
more taxonomically restricted, and solely used traditional
richness and rate measures that are known to be
susceptible to biases in the fossil record (Foote 2000a).
Because it still remains significant in some of our analyses,
our results suggest that CO2 may still play some direct role
on biodiversity and taxonomic rates independent of
Proc. R. Soc. B (2008)
temperature, though for most of our analyses temperature
is more important.
Despite the above provisos, our results demand that we
speculate on causative links between temperature and
both biodiversity and taxonomic rates. Previous work has
suggested that extinction rates primarily drive changes in
Phanerozoic diversity (Foote 2000b) and that origination
rates rise following mass extinctions (see Sepkoski 1998).
Thus it is plausible that the associations between
temperature and both biodiversity and origination are
primarily driven by changes in extinction rates with
temperature. The lagged associations between tempera-
ture and origination rates, but not extinction rates, are
consistent with this interpretation.
The five largest positive residuals for extinction in our
time series correspond to previously identified mass
extinctions (Raup & Sepkoski 1982; Benton 1995) in
the end Ordovician, Late Devonian, end Permian, Early
Triassic (a continuance of the former) and end Cretaceous
(figure 3). Of these, four correspond well with peaks in
global temperature in the time series (figure 3). Thus, our
analyses suggest that these mass extinctions can be viewed
as part of a wider trend seen across the fossil record as a
whole. A number of recent studies have suggested a link
between periods of rapid global warming, perhaps driven
by large igneous province eruptions, and marine crises that
often accompany extinction events (Wignall 2005;
Twitchett 2006). It is plausible that there is an interaction
between the long-term average global temperature and the
onset of such marine crises, such that the effects of rapid
global warming on marine systems are exacerbated in a
world that is already in a greenhouse state, increasing the
probability of oceanic anoxia or breakdowns in oceanic
circulation. However, the associations shown in this paper
apply to terrestrial as well as marine systems, and it is
currently unclear how such marine crises might affect
terrestrial systems (Wignall 2005).
The risk of future extinction through rapid global
warming is primarily expected to occur through mis-
matches between the climates to which organisms are
adapted in their current range and the future distributions
of those climates (Thomas et al. 2004; Botkin et al. 2007;
Williams et al. 2007), a mechanism that has doubtless also
been relevant in the past (Twitchett 2006). Because taxa
adapted to more tropical environments may be more
vulnerable to short-term changes in climate in this way
(Stanley 1986; Joachimski & Buggisch 2002; Williams
et al. 2007), it is plausible that high long-term global
temperatures may increase the general vulnerability of
species to rapid climate change, and this may also explain
the associations we find.
In conclusion, we have discovered a second-order long-
term association between global temperature and both
biodiversity and taxonomic rates, and show that whether
Earth climate was in an icehouse or greenhouse phase
explains considerable variation in the Phanerozoic fossil
record. Prima facie, our results suggest that future global
warming may be detrimental to biodiversity. However, the
mechanisms underlying the association are still unclear,
and only when they become clearer we will be in a position
to comment confidently on the implications for future
climate change.
52 P. J. Mayhew et al. Temperature and biodiversity
We thank Barbara Anderson for help with data compilation;Michael Foote, Shanan Peters and Dana Royer for providingdata; and John Lawton, Chris Thomas and four anonymousreferees for their comments.
REFERENCESAlroy, J., Koch, P. L. & Zachos, J. C. 2000 Global climate
change and North American mammalian evolution.
Paleobiology 26(Suppl.), 259–288.
Barnosky, A. D., Hadly, E. A. & Bell, C. J. 2003 Mammalian
response to global warming on varied temporal scales.
J. Mammal. 84, 354–368. (doi:10.1644/1545-1542(2003)
084!0354:MRTGWOO2.0.CO;2)
Barnosky, A. D., Bell, C. J., Emslie, S. D., Goodwin, H. T.,
Mead, J. I., Repenning, C. A., Scott, E. & Shabel, A. B.
2004 Exceptional record of Mid-Pleistocene vertebrates
helps differentiate climatic from anthropogenic ecosystem
perturbations. Proc. Natl Acad. Sci. USA 101, 9297–9302.
(doi:10.1073/pnas.0402592101)
Benton, M. J. (ed.) 1993 The fossil record 2, pp. 845. London,
UK: Chapman and Hall.
Benton, M. J. 1995 Diversification and extinction in the history
of life. Science 268, 52–58. (doi:10.1126/science.7701342)
Benton, M. J. 1997 Models for the diversification of life.
Trends Ecol. Evol. 12, 490–495. (doi:10.1016/S0169-
5347(97)84410-2)
Benton, M. J. & Twitchett, R. J. 2003 How to kill (almost) all
life: the end-Permian extinction event. Trends Ecol. Evol.
18, 358–365. (doi:10.1016/S0169-5347(03)00093-4)
Berner, R. A. & Kothavala, Z. 2001 GEOCARB III: a revised
model of atmospheric CO2 over Phanerozoic time. Am.
J. Sci. 301, 182–204. (doi:10.2475/ajs.301.2.182)
Botkin, D. B. et al. 2007 Forecasting effects of global warming
on biodiversity. Bioscience 57, 227–236. (doi:10.1641/
B570306)
Cornette, J. L., Lieberman, B. S. & Goldstein, R. H. 2002
Documenting a significant relationship between macro-
evolutionary origination rates and Phanerozoic pCO2
levels. Proc. Natl Acad. Sci. USA 99, 7832–7835.
(doi:10.1073/pnas.122225499)
Courtillot, V. & Gaudemer, Y. 1996 Effects of mass
extinctions on biodiversity. Nature 381, 146–148.
(doi:10.1038/381146a0)
Crowley, T. J. & North, G. R. 1988 Abrupt climate change
and extinction events in earth history. Science 240,
996–1002. (doi:10.1126/science.240.4855.996)
Culver, S. J. & Rawson, P. F. (eds) 2000 Biotic response to
global change: the last 145 million years, pp. 501.
Cambridge, UK: Cambridge University Press.
Erwin, D. H. 1990 The end-Permian mass extinction.
Annu. Rev. Ecol. Syst. 21, 69–91. (doi:10.1146/annurev.
es.21.110190.000441)
Fewster, R. M., Buckland, S. T., Siriwardena, G. M., Baillie,
S. R. & Wilson, J. D. 2000 Analysis of population trends
for farmland birds using generalized additive models.
Ecology 81, 1970–1984.
Foote, M. 2000a Origination and extinction components of
taxonomic diversity: general problems. Paleobiology
26(Suppl.), 74–102.
Foote, M. 2000b Origination and extinction components of
taxonomic diversity: Paleozoic and post-Paleozoic
dynamics. Paleobiology 26, 578–605. (doi:10.1666/0094-
8373(2000)026!0578:OAECOTO2.0.CO;2)
Foote, M. 2005 Pulsed origination and extinction in the
marine realm. Paleobiology 31, 6–20. (doi:10.1666/0094-
8373(2005)031!0006:POAEITO2.0.CO;2)
Proc. R. Soc. B (2008)
Gibbs, S. J., Bown, P. R., Sessa, J. A., Bralower, T. J. & Wilson,P. A. 2006 Nannoplankton extinction and originationacross the Paleocene–Eocene thermal maximum. Science314, 1770–1773. (doi:10.1126/science.1133902)
Hallam, A. & Wignall, P. B. 1999 Mass extinctions and sea-level change. Earth Sci. Rev. 48, 217–250. (doi:10.1016/S0012-8252(99)00055-0)
Harland, W. B., Armstrong, R. L., Cox, A. V., Craig, L. E.,Smith, A. G. & Smith, D. G. 1990 A geologic time scale.Cambridge, UK: Cambridge University Press.
Huber, B. T., MacLeod, K. G. & Wing, S. L. (eds) 2000Warm climates in Earth history, pp. 462. Cambridge, UK:Cambridge University Press.
IPCC 2007 In Climate change 2007: the physical sciencebasis. Contribution of Working Group I to the fourth assessmentreport of the Intergovernmental Panel on Climate Change (edsS. Solomon, D. Qin, M. Manning, Z. Chen, M. Marquis,K. B. Averyt, M. Tignor & H. L. Miller), pp. 18.Cambridge, UK: Cambridge University Press.
Joachimski, M. M. & Buggisch, W. 2002 Conodont Apatite d18Osignatures indicate climatic cooling as a trigger of the LateDevonian (F–F) mass extinction. Geology 30, 711–714.(doi:10.1130/0091-7613(2002)030!0711:CAOSICO2.0.CO;2)
Levinton, J. S. 1979 A theory of diversity equilibrium andmorphological evolution. Science 204, 335–336. (doi:10.1126/science.204.4390.335)
Lovejoy, T. E. & Hannah, L. (eds) 2005 Climate change andbiodiversity, pp. 440. New Haven, CT: Yale University Press.
Peters, S. E. 2005 Geologic constraints on the macroevolu-tionary history of marine animals. Proc. Natl Acad. Sci.USA 102, 1236–1331. (doi:10.1073/pnas.0502616102)
Peters, S. E. & Foote, M. 2001 Biodiversity in the Phanerozoic:a reinterpretation. Paleobiology 27, 583–601. (doi:10.1666/0094-8373(2001)027!0583:BITPARO2.0.CO;2)
Peters, S. E. & Foote, M. 2002 Determinants of extinction in thefossil record. Nature 416, 420–424. (doi:10.1038/416420a)
Pope, K. O., D’Hondt, S. L. & Marshall, C. R. 1998Meteorite impact and the mass extinction of species at theCretaceous/Tertiary boundary. Proc. Natl Acad. Sci. USA95, 11 028–11 029. (doi:10.1073/pnas.95.19.11028)
Pounds, J. A. et al. 2006 Widespread amphibian extinctionsfrom epidemic disease driven by global warming. Nature439, 161–167. (doi:10.1038/nature04246)
Prothero, D. R. 2004 Did impacts, volcanic eruptions, orclimatic change affect mammalian evolution? Palaeogeogr.Palaeoclimatol. Palaeoecol. 214, 283–294. (doi:10.1016/j.palaeo.2004.04.010)
Raup, D. & Sepkoski, J. 1982 Mass extinctions in the marinefossil record. Science 215, 1501–1503. (doi:10.1126/science.215.4539.1501)
Rohde, R. A. & Muller, R. A. 2005 Cycles in fossil diversity.Nature 434, 208–210. (doi:10.1038/nature03339)
Rothman, D. H. 2001 Global biodiversity and the ancientcarbon cycle. Proc. Natl Acad. Sci. USA 98, 4305–4310.(doi:10.1073/pnas.071047798)
Rothman, D. H. 2002 Atmospheric carbon dioxide levels forthe last 500 million years. Proc. Natl Acad. Sci. USA 99,4167–4171. (doi:10.1073/pnas.022055499)
Royer, D. L., Berner, R. A., Montanez, I. P., Tibor, N. J. &Beerling, D. J. 2004 CO2 as a primary driver ofPhanerozoic climate. GSA Today 14, 4–10. (doi:10.1130/1052-5173(2004)014!4:CAAPDOO2.0.CO;2)
Sepkoski Jr, J. J. 1984 A kinetic model of Phanerozoictaxonomic diversity: III. Post-Paleozoic marine familiesand mass extinctions. Paleobiology 10, 246–267.
Sepkoski Jr, J. J. 1998 Rates of speciation in the fossil record.Phil.Trans.R. Soc.B 353, 315–326. (doi:10.1098/rstb.1998.0212)
Sepkoski Jr, J. J. 2002 A compendium of fossil marine animalgenera. Bull. Am. Paleontol. 363, 1–560.
Temperature and biodiversity P. J. Mayhew et al. 53
Shaviv, N. J. & Veizer, J. 2003 Celestial driver of Phanerozoicclimate? GSA Today 13, 4–10. (doi:10.1130/1052-5173(2003)013!0004:CDOPCO2.0.CO;2)
Sheehan, P. M. 2001 The Late Ordovician mass extinction.Annu. Rev. Earth Plan. Sci. 29, 331–364. (doi:10.1146/annurev.earth.29.1.331)
Stanley, S. M. 1986 Extinction. New York, NY: ScientificAmerican Library.
Thomas, C. D. et al. 2004 Extinction risk from climatechange. Nature 427, 145–148. (doi:10.1038/nature02121)
Twitchett, R. J. 2006 The palaeoclimatology, palaeoecology,and palaeoenvironmental analysis of mass extinctionevents. Palaeogeogr. Palaeoclimatol. Palaeoecol. 232,190–213. (doi:10.1016/j.palaeo.2005.05.019)
Veizer, J., Godderis, Y. & Francois, L. M. 2000 Evidence fordecoupling of atmospheric CO2 and global climate duringthe Phanerozoic eon. Nature 408, 698–701. (doi:10.1038/35047044)
Proc. R. Soc. B (2008)
White, R. V. 2002 Earth’s biggest ‘whodunnit’: unravelling
the clues in the case of the end-Permian mass extinction.
Phil. Trans. R. Soc. A 360, 2963–2985. (doi:10.1098/rsta.
2002.1097)
Wignall, P. 2005 The link between large igneous province
eruptions and mass extinctions. Elements 1, 293–297.
Wignall, P. B. & Twitchett, R. J. 1996 Oceanic anoxia and the
end-Permian mass extinction. Science 272, 1155–1158.
(doi:10.1126/science.272.5265.1155)
Wilf, P., Johnson, K. R. & Huber, B. T. 2003 Correlated
terrestrial and marine evidence for global climate changes
before mass extinction at the Cretaceous–Paleogene
boundary. Proc. Natl Acad. Sci. USA 100, 599–604.
(doi:10.1073/pnas.0234701100)
Williams, J. W., Jackson, S. T. & Kutzbach, J. E. 2007
Projected distributions of novel and disappearing climates
by 2100 AD. Proc. Natl Acad. Sci. USA 104, 5738–5742.
(doi:10.1073/pnas.0606292104)