Capsular Transformation of a Multidrug‐Resistant Streptococcus pneumoniae In Vivo
Upload
khangminh22Category
view
2download
0
Article
A Liver Capsular Network
of Monocyte-DerivedMacrophages Restricts Hepatic Dissemination ofIntraperitoneal Bacteria by Neutrophil RecruitmentGraphical Abstract
Highlights
d A distinct subset of resident macrophages (LCMs) occupies
the hepatic capsule
d LCMs are replenished from blood monocytes in the
steady state
d LCMs recruit neutrophils in response to bacteria reaching the
liver capsule
d LCM depletion decreases neutrophil recruitment and
increases liver pathogen load
Sierro et al., 2017, Immunity 47, 374–388August 15, 2017 ª 2017 Elsevier Inc.http://dx.doi.org/10.1016/j.immuni.2017.07.018
Authors
Frederic Sierro, Maximilien Evrard,
Simone Rizzetto, ..., Lai Guan Ng,
David G. Bowen, Patrick Bertolino
[email protected] (F.S.),[email protected] (D.G.B.),[email protected] (P.B.)
In Brief
The hepatic sinusoids harbor a well-
characterized resident macrophage
population, Kupffer cells. Sierro et al.
report an additional liver-resident
macrophage population occupying the
hepatic capsule, phenotypically and
developmentally distinct from Kupffer
cells, which plays a role in
immunosurveillance by sensing
peritoneal pathogens and recruiting
neutrophils to control intrahepatic
bacterial dissemination.

Immunity
Article
A Liver Capsular Network of Monocyte-DerivedMacrophages Restricts Hepatic Dissemination ofIntraperitoneal Bacteria by Neutrophil RecruitmentFrederic Sierro,1,12,* Maximilien Evrard,2 Simone Rizzetto,3 Michelle Melino,4 Andrew J. Mitchell,5 Manuela Florido,6
Lynette Beattie,7 Shaun B. Walters,6 Szun Szun Tay,1 Bo Lu,1,8 Lauren E. Holz,7 Ben Roediger,6 Yik Chun Wong,1
Alessandra Warren,9 William Ritchie,6 Claire McGuffog,1 Wolfgang Weninger,6 David G. Le Couteur,9 Florent Ginhoux,2
Warwick J. Britton,6 William R. Heath,7 Bernadette M. Saunders,6,10 Geoffrey W. McCaughan,1 Fabio Luciani,3
Kelli P.A. MacDonald,4 Lai Guan Ng,2 David G. Bowen,1,11,* and Patrick Bertolino1,11,13,*1Centenary Institute and AW Morrow Gastroenterology and Liver Centre, University of Sydney and Royal Prince Alfred Hospital, Sydney,
NSW, Australia2Singapore Immunology Network (SIgN), Agency for Science, Technology and Research (A*STAR), Biopolis, Singapore, Singapore3Systems Immunology, Viral Immunology Systems Program, the Kirby Institute, UNSW, Sydney, NSW, Australia4Antigen Presentation and Immunoregulation Laboratory, QIMR Berghofer Medical Research Institute, Brisbane, QLD, Australia5Department of Chemical & Biomolecular Engineering, Materials Characterization and Fabrication Platform, University of Melbourne,
Melbourne, VIC, Australia6Centenary Institute and the University of Sydney, Newtown, NSW, Australia7Department of Microbiology and Immunology at Peter Doherty Institute for Infection and Immunity and the ARC Centre of Excellence in
Advanced Molecular Imaging at the University of Melbourne, Melbourne, VIC, Australia8Immunology Research Centre, St. Vincent’s Hospital, Melbourne, VIC, Australia9CERA and ANZAC Research Institute, Concord RG Hospital and University of Sydney, Sydney, NSW, Australia10School of Life Sciences, Faculty of Science, University of Technology Sydney, Sydney, NSW 2007, Australia11These authors contributed equally12Present address: Human Health, Australian Nuclear Science and Technology Organisation, Lucas Heights, NSW, Australia13Lead Contact
*Correspondence: [email protected] (F.S.), [email protected] (D.G.B.), [email protected] (P.B.)
http://dx.doi.org/10.1016/j.immuni.2017.07.018
SUMMARY
The liver is positioned at the interface between tworoutes traversed by pathogens in disseminatinginfection. Whereas blood-borne pathogens are effi-ciently cleared in hepatic sinusoids by Kupffer cells(KCs), it is unknown how the liver prevents dissemi-nation of peritoneal pathogens accessing its outermembrane. We report here that the hepatic capsuleharbors a contiguous cellular network of liver-resi-dent macrophages phenotypically distinct fromKCs. These liver capsular macrophages (LCMs)were replenished in the steady state from bloodmonocytes, unlike KCs that are embryonicallyderived and self-renewing. LCM numbers increasedafter weaning in a microbiota-dependent process.LCMs sensed peritoneal bacteria and promotedneutrophil recruitment to the capsule, and theirspecific ablation resulted in decreased neutrophilrecruitment and increased intrahepatic bacterialburden. Thus, the liver contains two separate andnon-overlapping niches occupied by distinct resi-dent macrophage populations mediating immuno-surveillance at these two pathogen entry points tothe liver.
374 Immunity 47, 374–388, August 15, 2017 ª 2017 Elsevier Inc.
INTRODUCTION
The ontogeny and function of resident myeloid populations
within solid organs has been an area of intense research over
recent years (Ginhoux and Guilliams, 2016). In the liver, Kupffer
cells (KCs) are the best characterized and represent one of the
largest subsets of tissue-resident macrophages. Like most tis-
sue-resident macrophages, they are highly phagocytic and
largely originate from the differentiation of local precursors that
seed the liver during embryogenesis (Bouwens et al., 1984).
Most KCs aremaintained by self-renewal in the adult and require
little input from bone marrow-derived precursors, although a
minor proportion of KCs can be derived from circulating blood
precursors after birth (Scott et al., 2016). Regardless of their
origin, steady-state KCs can be considered a homogeneous
liver-resident macrophage population with a specific transcrip-
tional program defined by their unique niche within the hepatic
sinusoids (Beattie et al., 2016). This location underscores the
important role of KCs in clearing blood-borne pathogens and
cellular debris (Beattie et al., 2016). However, in the setting of
inflammation, different macrophages may be recruited to the
liver via other pathways: monocyte-derived inflammatory mac-
rophages invade the liver following injury, while pro-repair
mature peritoneal macrophages can access the liver via the peri-
toneum during the recovery phase (Wang and Kubes, 2016).
Almost 30 years ago, a population of MHC class II-expressing
cells was observed in the hepatic capsule (Prickett et al., 1988).

0
2×10⁴
4×10⁴
6×10⁴
8×10⁴
0
2×10⁴
4×10⁴
6×10⁴
8×10⁴
0
100
200
300
100
200
300
400
**
0
100
200
300
400
0
100
200
300 *
0
100
200
300
A MHCII CD11c CD103
Cap
sule
P
aren
chym
a C
apsu
le
Par
ench
yma
CSF1R
Ly6C
CD14
CD11b
Tim4 CX3CR1CD64
CD45
F4/80
C
Control Ig Anti-CSF-1R F4/80 F4/80
Csf2rb-/-
F4/80 F4/80
WT Csf2rb-/- C
apsu
le
E
Den
sity
of F
4/80
+
cells
with
den
drite
s
(cel
ls/m
m2 )
Den
sity
of F
4/80
+
cells
with
den
drite
s
(cel
ls/m
m2 )
F4/80 F4/80
Flt3l-/- WT
Cap
sule
F4/80 F4/80
Den
sity
of F
4/80
+
cells
with
den
drite
s
(cel
ls/m
m2 )
Den
sity
of A
b+ c
ells
with
D
endr
ites
(cel
ls/m
m2 )
F4/80 CD45
Sin
gle
dose
M
ultip
le d
ose
Control Ab M279 Ab
Control Ab M279 Ab
Spleen
cDC1 cDC2
Den
sity
of F
4/80
+
cells
with
den
drite
s
(cel
ls/m
m2 )
Tota
l cel
l num
ber
WT Flt3l-/-
Hepatic cap.cells
Tota
l cel
l num
ber
*Liver
cDC1 cDC2
B
D
F
WT
*
*
0
2×10⁴
4×10⁴
6×10⁴
0
2×10⁴
4×10⁴
6×10⁴
8×10⁴*
CD
11c
4miT46DCCD11b
CD45+MHCII+ cells
F4/80
CX
3CR
1
CD
11c
Ly6C
cDC1s cDC2s MFs
Non-KC MFs
KCs
Figure 1. A Myeloid Cell Subset Expressing Macrophage Markers and Distinct from KCs Is Located within the Capsule of the Adult
Mouse Liver
(A) Cells (red) were stained in vivo by injecting PE-conjugated mAbs into C57BL/6 (WT) mice. Collagen fibers (blue) were detected using second harmonic
generation signals (SHG). Images represent 2PM maximal intensity projection of the hepatic capsule (top, 10 mm thickness centered on collagen fibers) and of
deeper parenchymal liver tissue containing KCs (bottom, 10 mm thickness). Bar, 50 mm.
(B) Densities of F4/80+ and CD45+ cells displaying dendrites in the liver capsules of WT mice.
(C) Flow cytometric analysis of WT liver leucocytes gated on live CD45+ MHCII+ cells.
(D) Top: 2PM images comparing the liver capsules of WT or Flt3l�/� mice stained in vivo for F4/80. F4/80+ cells densities in the liver capsule of the two lines are
quantified in the rightmost middle panel. Leftmost middle and lower panels: Flow cytometry quantitation of cDC1 and cDC2 subsets in the livers and spleens of
WT or Flt3l�/� mice.
(legend continued on next page)
Immunity 47, 374–388, August 15, 2017 375

These cells have dendritic morphology and have been initially
classified as dendritic cells (DCs) but not characterized further.
Hepatic capsular cells with dendritic processes have also been
noted in subsequent studies, in which they were variously cate-
gorized as KCs (Aoyama et al., 2010), fibroblasts or hepatic stel-
late cells (Lee et al., 2010), or myeloid DCs (Heymann et al.,
2015). More recently, a study of various hepatic myeloid cell
subsets also highlights the presence of cells with dendritic
morphology in the hepatic capsule, which the authors suggested
were dendritic cells (David et al., 2016).
In this study, we provide evidence that these MHC class II-ex-
pressing cells in the liver capsule are a macrophage population
that is developmentally and phenotypically distinct from KCs.
We also provide data supporting a role for this contiguous
cellular network of liver capsular macrophages in defending
the liver from infections traversing the peritoneal cavity.
RESULTS
Hepatic Capsular Cells with Dendritic MorphologyExpressMacrophageMarkers but Are Distinct fromKCsTo further characterize MHC class II+ cells with dendritic
morphology in the liver capsule, we used two-photonmicroscopy
(2PM) together with in vivo labeling. Tissue structures were
resolved to a depth of 50–80 mm to include the collagen fiber-
containing capsule (0 to 15 mm depth) as well as deeper paren-
chymal tissue containing KCs. In vivo-labeled CD45+ andMHCII+
cells exhibited distinct morphologies in the capsule and paren-
chyma.MHCII+ cells in the capsule displayed very long dendrites,
while those in the parenchyma were of more uniform size and
shape and did not possess extensive dendrites (Figure 1A).
MHCII+ capsular cells expressed F4/80, with staining faint at
10 min but clearly detected at 60 min after antibody injection,
suggesting that the antibody does not easily access the liver
capsule (Figure S1A). In contrast, KCs in the sinusoids stained
with anti-F4/80 as soon as 10 min after antibody injection (Fig-
ure S1A). This staining delay might explain why a recent study
concluded that capsular cells did not express F4/80 (David
et al., 2016). Similar densities of CD45+ and F4/80+ capsular cells
were detected in the capsule (Figure 1B), and in vivo labeling
confirmed co-expression of MHCII, CD45, and F4/80 by most
capsular cells (Figures S1B and S1C). Capsular cells exhibited
low expression of CD11c and expressed the key macrophage
markers CD64, CSF-1R, and CD14 (Figure 1A) but lacked
CD103 expression (Figure 1A). Most CD45+ capsular cells co-ex-
pressed CD64 (Figure S1D), suggesting that they were macro-
phages rather than DCs.We estimate that the entire adult mouse
liver capsule contains 300,000 CD45+F4/80+CD64+ cells, based
on their densities (Figure 1B) and the approximate total surface
area of the capsule.
While parenchymal KCs expressed the prototypical KC
marker Tim4 (Zigmond et al., 2014), capsular cells did not
(Figure 1A). Unlike KCs, capsular cells were CX3CR1hi (Fig-
(E) 2PM images and quantitation of hepatic capsular F4/80+ cells in liver capsule
(F) 2PM images and quantitation of hepatic capsular F4/80+ cells in liver capsule
multiple antibody doses (twice weekly for 3 weeks); bottom: single dose.
Images are representative of at least three animals, and bars represent mean ± SE
more than three individual mice (pooled from at least two independent experime
376 Immunity 47, 374–388, August 15, 2017
ure 1A). Consistent with CX3CR1 expression and confirming
findings in a recent study (David et al., 2016), the liver capsule
of Cx3cr1-GFP mice contains reporter+ cells with dendrites (Fig-
ure S1F). However, most GFP+ liver capsular cells co-expressed
F4/80 and the key macrophage marker CD64 (Figure S1F),
providing further evidence that they were not DCs but rather rep-
resented a macrophage subset distinct from KCs.
Further flow cytometric analysis of cell suspensions isolated
from the liver confirmed the presence of distinct liver macro-
phage subsets with mutually exclusive expression of Tim4 and
CX3CR1 and low expression of CD11c (Figure 1C). Cells with a
similar phenotype were not detected in the blood (Figure S1E),
suggesting that they were liver resident.
Hepatic Capsular Cells Are Dependent on CSF-1RSignaling but Not Flt3LThe density of liver capsular cells was assessed in mice deficient
for Flt3L, a growth factor critical for the differentiation of conven-
tional DCs (cDCs) from hematopoietic stem cells but dispensable
for the development of monocytes and macrophages (Liu et al.,
2009). The density of F4/80+ cells in the hepatic capsule was not
reduced in Flt3l�/�mice compared towild-type controls, whereas
cDCs (including CD103+CD11b� cDC1 and CD103�CD11b+
cDC2subsets)weredecreased inboth liverandspleen (Figure1D).
In addition, GFP+ cell density in the liver capsules of Cx3cr1-GFP
Flt3l�/� mice was not affected by Flt3L deficiency (Figure S2A).
Likewise, the b subunit of the GM-CSF receptor that promotes
the survival and homeostasis of CD103+CD11b+ DCs in non-
lymphoid tissues in the steady state without affecting most tissue
macrophage populations (Greter et al., 2012a) was dispensable
for the differentiation of hepatic capsular myeloid cells as as-
sessed by similar densities in wild-type and Csf2rb�/� mice
(Figure 1E). Although CSF-1R is expressed by several myeloid
cells including DCs, CSF-1R signaling is critical for the differentia-
tion and maintenance of macrophages in several tissues (Greter
et al., 2012b; MacDonald et al., 2010). Blockade of CSF-1R
signaling using multiple doses of the mAb M279 (Greter et al.,
2012b; MacDonald et al., 2010) resulted in the depletion of most
hepatic F4/80+ capsular cells (Figure 1F, top). A single dose of
M279 was sufficient to deplete most hepatic capsular cells, sug-
gesting that they were highly dependent on this factor (Figure 1F,
bottom). M279 treatment of Cx3cr1-GFP mice resulted also in
complete depletion of GFP+ liver capsular cells (Figure S2B).
Transcriptomic Profiling of Hepatic Capsular CellsIdentifies Them as a Macrophage SubsetIn order to purify hepatic capsular cells and to avoid inadvertent
activation by antibody binding during isolation, we sought to
identify a suitable fluorescent myeloid cell reporter that could
identify the F4/80+ population in the capsule (Figures 2A
and 2B). In most reporters assessed, capsular F4/80+ cells ex-
pressed the fluorescent protein (Figure S3A) but these lines
were unsuitable for identification of hepatic capsular cells for
s of WT or Csf2rb�/� mice.
s of WT mice treated with control Ig or anti-CSF-1R blocking Ab (M279). Top:
M numbers obtained from averaging counts from at least five random areas in
nts). See also Figures S1 and S2.

0 103 104 105
0102
103
104
105
0 103 104 105
0102
103
104
105
0 103 104 105
0
103
104
105
0 102 103 104 105
0103
104
105
Cd207-EGFP
CD
11c
CD64 Tim4 CD11b
Cd207-EGFP CD45+MHCII+ cells
F4/80
CX
3CR
1
CD
11c
Ly6C
Non-KC MFs
KCs
GFP+ cells
B
F
A Reporter mouse lines Itgax-YFP MacGreen Lyz2-GFP CD207-EGFP Cx3cr1-GFP
Cap
sule
P
aren
chym
a
Langerin E
C
D
Lin- GFP+
Lin-
Populations
Itgax
-YFP
MacGree
n
LysM
-GFP
Cx3cr1
gfp/+
CD207-G
FP0
50
100
Itgax
-YFP
MacGree
n
LySM-G
FP
Cx3cr1
gfp/+
CD207-G
FP0
100
200
300 **
Den
sity
of r
epor
ter p
os
caps
ular
cel
ls w
ith
dend
rites
(cel
ls/m
m2 )
*
Rep
orte
r pos
cel
ls a
mon
g
F4/8
0+ c
apsu
lar c
ells
(%)
Lyz2
-GFP
Itgax
-YFP
MacGree
n
Cx3cr1
gfp/+
Cd207
-GFP
Lyz2
-GFP
Itgax
-YFP
MacGree
n
Cx3cr1
gfp/+
Cd207
-GFP
50
40
30
20
10
0
-10
-20
-30
-40
40 30 20 10 0 -10 -20 -30 -40
50
40
30
20
10
0
-10
-20
-30
-40
50
40
30
20
10
0
-10
-20
-30
-40
50
40
30
20
10
0
-10
-20
-30
-40
50
40
30
20
10
0
-10
-20
-30
-40
50
40
30
20
10
0
-10
-20
-30
-40
50
40
30
20
10
0
-10
-20
-30
-40
50
40
30
20
10
0
-10
-20
-30
-40
50
40
30
20
10
0
-10
-20
-30
-40
50
40
30
20
10
0
-10
-20
-30
-40
50
40
30
20
10
0
-10
-20
-30
-40
50
40
30
20
10
0
-10
-20
-30
-40
50
40
30
20
10
0
-10
-20
-30
-40
50
40
30
20
10
0
-10
-20
-30
-40
40 30 20 10 0 -10 -20 -30 -40 40 30 20 10 0 -10 -20 -30 -40
40 30 20 10 0 -10 -20 -30 -40
40 30 20 10 0 -10 -20 -30 -40
40 30 20 10 0 -10 -20 -30 -40
40 30 20 10 0 -10 -20 -30 -40
40 30 20 10 0 -10 -20 -30 -40
40 30 20 10 0 -10 -20 -30 -40
40 30 20 10 0 -10 -20 -30 -40
40 30 20 10 0 -10 -20 -30 -40
40 30 20 10 0 -10 -20 -30 -40
40 30 20 10 0 -10 -20 -30 -40
40 30 20 10 0 -10 -20 -30 -40
Figure 2. Expression of Langerin in the Liver
Is Largely Restricted to Capsular Cells
(A) 2PM maximal intensity projection images of
GFP+ or YFP+ cells in the hepatic capsule (top) and
parenchymal liver tissue 10 mm deeper (bottom) of
various myeloid reporter mice. Collagen fibers are
blue. Bar, 50 mm.
(B) Left: densities of GFP+ or YFP+ cells with den-
dritic morphology in the liver capsule; Right: per-
centages of cells expressing the reporter protein
among liver capsular F4/80+ cells. Bars represent
mean ± SEM of cell numbers obtained from aver-
aging counts from at least five random areas per
animal in at least three individual mice (pooled from
at least two independent experiments).
(C)Representative cross-section imageof aCd207-
EGFPmouse liver showingGFPhi cells (green) in the
hepatic capsule (dashed line). The image is a
mosaic reconstitution of high-resolution adjacent
fields generated using the epifluorescence micro-
scope. Stitching has been applied following data
acquisition to generate the image. The variation in
background color observed in some areas of the
image corresponds to stitched areas. Bar, 50 mm.
(D) Flow cytometric analysis of liver leucocytes
from Cd207-EGFP mice.
(E) In vivo staining of hepatic capsular cells with
anti-langerin antibody. Bar, 50 mm.
(F) CyTOF analysis of liver leukocytes (represen-
tative of two independent experiments). The top
diagram on the left is a schematic representation
of the major GFP+ expressing populations (in red)
among reference populations identified based on
the expression of the indicated surface markers
(right panel). Each population has been assigned a
roman numeral: I, macrophages; II, CD103+ DCs;
III, DCs; IV, CD301b+ mononuclear phagocytes; V,
neutrophils; VI, eosinophils; VII, monocytes and
other CD11b-expressing cells. The middle and
bottom plots on the left show the location of gated
CD45+ GFP+ cells (middle) on a tSNE map of
lineage-neg liver non-parenchymal cells (bottom).
GFP expression is coded by the color palette.
See also Figure S3.
sorting because KCs and/or other myeloid cells were also
reporter positive (Figures 2A and S3B). However, in Cd207-
EGFP reporter mice, in which Langerhans cells (LCs) and
other DC subsets are GFP+, high GFP expression was suffi-
ciently restricted to hepatic capsular cells (Figures 2A and 2C).
GFPhi cells were Tim4�CD64+CD8�CD24�CD11cneg to loF4/80+
CD11bloMHCIIhiCX3CR1hiLy6Clo, further distinguishing them
from monocytes, KCs, and DCs within the liver (Figure 2D).
Expression of langerin (CD207) was also detected in some
hepatic capsular cells after in vivo labeling with an anti-langerin
antibody (Figure 2E). To determine the extent of heterogeneity
within the GFPhi population in liver capsular cells isolated from
Cd207-EGFPmice, we performed CyTOF analysis of 21 different
Im
markers. Unbiased analysis placed the
majority of GFPhi cells within a macro-
phage cluster, whereas GFPlo/int cells
clustered with CD103+ DCs (Figure 2F).
Further analysis restricted to MHCII+-
CD64+F4/80+ cells revealed that GFPhi cells were contained
within a CX3CR1+Tim4� macrophage cluster and were distinct
from CX3CR1�Tim4+ KCs (Figure S3C).
These results together with imaging analysis suggest that F4/
80+ capsular cells form a homogeneous macrophage subset
distinct from KCs but with variable langerin expression and indi-
cated that sorting GFPhi liver cells from Cd207-EGFP mice, with
CD103 as an exclusion marker, would isolate an appropriate
population of hepatic capsular cells for gene expression
profiling. Their mRNA expression profile was compared to
unaffiliated published sets of several steady-state tissue macro-
phages, DCs from tissues and lymphoid tissues, blood mono-
cytes (ImmGen Consortium database), dermal DCs and dermal
munity 47, 374–388, August 15, 2017 377

macrophages (Tamoutounour et al., 2013), and steady-state
KCs (Zigmond et al., 2014). Hepatic DCs (CD103+GFPint) and
skin LCs (CD103�GFPhi) were also isolated and sorted in the
same experiment as internal controls.
Hierarchical clustering that considered the ‘‘core DC’’ and
‘‘core macrophage’’ gene expression signatures as defined by
the Immgen Consortium placed hepatic capsular cells within a
group containing macrophages rather than DCs (Figure S4A;
Gautier and Yvan-Charvet, 2014;Miller et al., 2012). Accordingly,
principal component analysis (PCA) (Figure S4B) and hierarchi-
cal clustering analysis (Figure 3A) indicated that hepatic capsular
cells were more closely related to macrophages than to DCs.
Hepatic capsular cells did not express genes reported to be
specifically associated with KCs, DCs, or the two MHCII�F4/80hi and MHCII+F4/80lo peritoneal macrophage subsets (Fig-
ure 3B). Consistent with their phenotype determined by imaging
(Figure 1A), flow cytometry (Figure 1C), and CyTOF (Figures 2F
and S3C), hepatic capsular cells also expressed Cx3cr1, a
gene not expressed by KCs or peritoneal macrophages (Fig-
ure 3B). Cd207-EGFP+ hepatic capsular cells clustered more
closely with liver CD11b+ DCs than with other DC subsets (Fig-
ures 3A and S4A), but this clustering was likely affected by the
liver CD11b+ DC dataset being influenced by cross-contamina-
tion between CD11b+ DCs and CD11b+ macrophages as previ-
ously noted for datasets contained in the Immgen database
(Gautier et al., 2012; Miller et al., 2012; Guilliams et al., 2016).
PCA analysis considering macrophage transcriptomes re-
vealed a distinct hepatic capsular cell program that clustered
closer to the transcriptomes of dermal or gut macrophages
than to those of embryonically derived macrophages such as
KCs (Figure 3C). This relationship was further supported by hier-
archical clustering analysis restricted to gene sets specifically
enriched in prototypical embryo-derived macrophages (KCs,
lung, spleen, peritoneal cavity, microglia) and in prototypical
steady-state monocyte-derivedmacrophages (dermis, intestine)
(Figures S4C and S4D). Functional annotation clustering analysis
also identified a variety of differentially enriched processes dis-
tinguishing hepatic capsular cells and KCs (Figures 3D and S4E).
The above data identifiedCd207-EGFPhi F4/80+ capsular cells
as a distinct macrophage subset morphologically, anatomically,
and phenotypically different from KCs, leading us to name them
‘‘liver capsular macrophages’’ (LCMs).
LCMs in Adult Livers Are Bone Marrow Derived and CanBe Replenished from Circulating MonocytesTo determine whether LCMs could be replenished from adult
bone marrow (BM), C57BL/6 mice were irradiated and reconsti-
tuted with BM cells from Itgax-YFP mice, in which LCMs ex-
pressed the YFP reporter (Figures 2A, 2B, S3A, and S3B).
8 weeks post-reconstitution, LCMs of donor origin were present
in the liver capsule at densities similar to non-irradiated Itgax-
YFP mice, suggesting that LCMs were radiosensitive and could
be replenished by BM-derived cells (Figure 4A). As irradiation
induces systemic changes, LCM replenishment was examined
after transplantation in non-irradiated recipients. Livers from
Itgax-YFP mice were transplanted into B6.tdTomato recipient
mice. Recipient-derived Tomato+ LCMs but not KCs were de-
tected in the livers of transplanted animals as early as 5 days
after transplantation (Figure 4B).
378 Immunity 47, 374–388, August 15, 2017
In addition to the transplantation approach, which is associ-
ated with inflammation that might alter maintenance and/or
development of LCMs or their precursors, LCMs were also
examined by parabiosis. We analyzed CD45.1+ congenic and
CD45.2+ Cx3cr1-GFP parabionts (Figure 4C) for chimerism in
blood and lung by flow cytometry and in the liver capsule by
2PM. Consistent with previous reports (Guilliams et al., 2013),
relatively long-lived peripheral blood T cells from each animal
were evenly distributed in the blood of the parabionts, while alve-
olar macrophages that self-renew in situ independently of blood
precursors (Guilliams et al., 2013) were not exchanged (Fig-
ure 4C). Approximately 20% of Ly-6Chi and 40% of Ly-6Clo
bloodmonocyteswere exchanged betweenpartners (Figure 4C):
this lower percentage of chimerism and incomplete exchange of
blood monocytes, but not T cells, has been reported in previous
studies and attributed to a precursor half-life that is too short to
allow cells to reach the opposite parabiont (Liu et al., 2007). The
percentage of non-host chimerism for LCMs was approximately
half that observed for Ly6Chi blood monocytes (Figure 4C).
These results show that LCMs can be replenished from bone-
marrow-derived cells in the absence of irradiation or ischemia re-
perfusion-induced inflammation.
To evaluate whether LCMs could be derived from blood
monocytes, CD45.1+ WT mice were joined by parabiosis to
CD45.2+ Cx3cr1-GFP mice lacking CCR2 (Serbina and Pamer,
2006). Consistent with previous reports (Hashimoto et al.,
2013), CCR2-deficient monocytes that exhibit defects in
bone marrow exit were outcompeted by WT monocytes,
which made up >90% of circulating monocytes in both para-
bionts (Figure 4D, bottom). When compared to WT/WT para-
bionts, in the Ccr2�/�/WT setting, the density of WT LCMs
doubled in the liver capsule of the Ccr2�/� parabionts, while
Ccr2�/� LCMs could not be detected in the liver capsule of
WT parabionts (Figure 4D), suggesting that circulating mono-
cytes were LCM precursors. To demonstrate that LCMs can
derive directly from circulating monocytes, sorted GFP+ cells
from MacGreen (Csf1r-EGFP) mice that were enriched in
monocytes were adoptively transferred into syngeneic mice
pre-treated with a single dose of M279 antibody. 9 days after
adoptive transfer of sorted monocytes, GFP+ LCMs were de-
tected in the liver capsules of recipient mice (Figure 4E). In
contrast, sorted MacGreen peritoneal macrophages trans-
ferred into M279-treated recipients did not give rise to LCMs
(Figure 4E), suggesting that although these cells are recruited
to the liver after inflammation (Wang and Kubes, 2016), they
did not contribute to the LCM pool in the absence of
inflammation.
LCM Accumulation Accelerates at Weaning andCoincides with Establishment of the MicrobiotaLCM numbers were assessed during the postnatal period using
MacGreen mice. LCMs were almost absent during the first days
after birth; their accumulation accelerated after weaning at
3–5 weeks, and numbers remained relatively stable in adult ani-
mals (Figure 5A). To examine whether LCM development was
influenced by the microbiota as shown for gut-resident macro-
phages (Bain et al., 2014), we compared LCM densities
in germ- and specific-pathogen-free mice. LCMs were present
in adult germ-free mice (Figure 5B), but at lower density than in

B
pDCs Mono. LC Tissue MFs Lymphoid Tissue DCs LC
Skin LCs*
organ DCs & “CD11b+ DCs”
Dendritic cells Macrophages
C D
KC enriched functions
Hepatic capsular cell
enriched functions
A
Fcgr1 Mafb
Cx3cr1 Itgam
Siglec1 Clec4f Vsig4 Timd4 Gata6
Clec7a Tgfb2 Arg1 Fn1
Ccr7 Zbtb46
Itgax
KCs
Hepatic capsular
cells*
MHCII-F4/80hi
PC MFs
MHCII+
F4/80lo
PC MFs
Genes associated with Macrophages Genes associated with KCsGenes associated with PC MFs Genes associated with DCs
CD103+
CD207lo
Liver DCs
Gut MFs Splenic MFs Lymph node MFs Bone Marrow MFs Microglia Hepatic capsular cells*
Liver DCs* Hepatic Capsular cells*
-4 -2 0 2 4 6Fold change
Transport
Oxidation reduction process
Positive regulation of IkappaB kinase NFkappaB signaling
Metabolic pathways
Lysosome
Signal transduction
G protein coupled receptor signaling pathway
Hematopoietic cell lineage
Cytokine - cytokine receptor interaction
Figure 3. Genomic Expression Profile of Liver Capsular Cells Reveals a Distinct Macrophage Program
Hepatic capsular cells (CD103�GFPhi), liver DCs (CD103+GFPint), and epidermal LCs (CD103�GFPhi) were sorted from Cd207-EGFP mice. Gene expression of
the three cell subsets from three experimental replicates per subset was analyzed by microarray from purified mRNA and gene datasets compared to those of
plasmacytoid DCs (DCs), monocytes, LCs, various DCs,macrophages from the Immgen Consortium (GEO: GSE15907), dermal macrophages (GEO: GSE49358),
and steady-state KCs (GEO: GSE55606); asterisks after the subset name correspond to gene datasets generated in the current study.
(A) Hierarchical clustering based on transcriptome data.
(B) Heatmaps of relative expression of genes reported to be specifically expressed in KCs, peritoneal macrophages, and DCs.
(C) Principal component analysis based on macrophage transcriptomes.
(D) Functional enrichment analysis of the top gene-ontology processes that were enriched in hepatic capsular cells versus embryo-derived KCs.
See also Figure S4.
age-matched specific-pathogen-free mice (Figure 5B). Treat-
ment with antibiotics for 2 weeks from before weaning also led
to a decrease in LCM density (Figure 5C). Therefore, while not
essential, the microbiota could promote the development or
expansion of LCMs. This appeared to be independent of TLR
signaling, as adult mice lackingMyD88 or TLR4 contained similar
LCM densities as WT animals (Figure 5D).
Increased numbers of LCMs at weaning could have resulted
from increased precursor recruitment, enhanced proliferation of
local precursors, and/or increased proliferation of differentiated
Immunity 47, 374–388, August 15, 2017 379
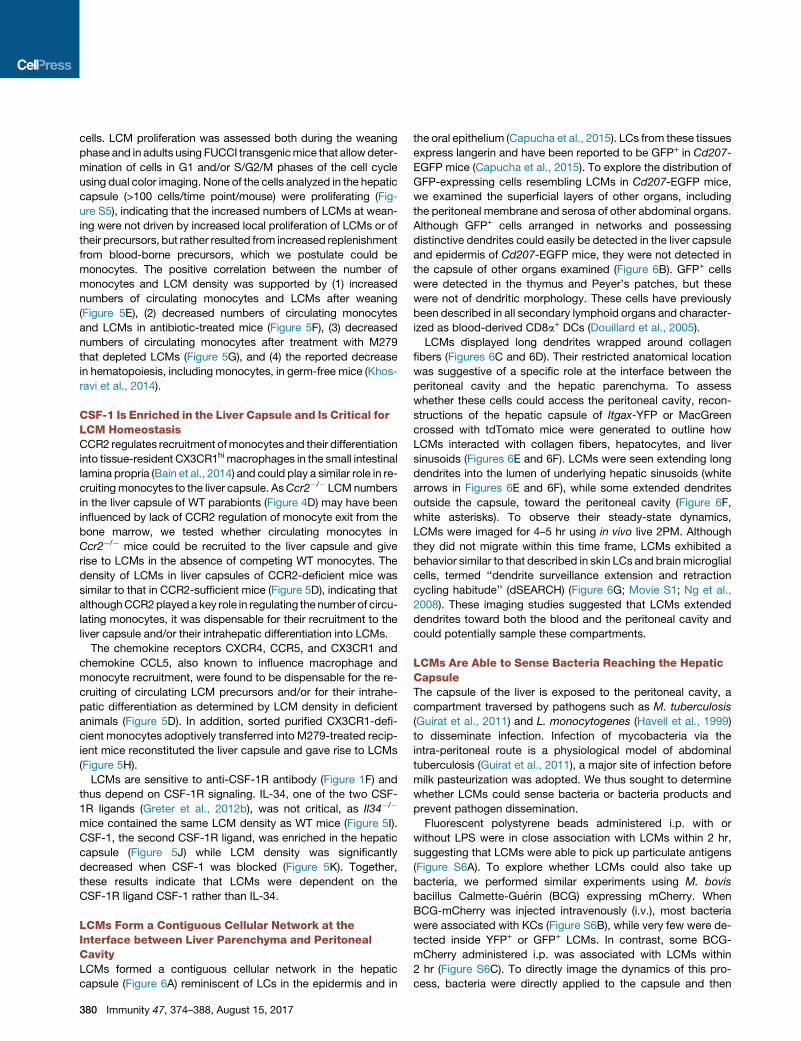
cells. LCM proliferation was assessed both during the weaning
phase and in adults using FUCCI transgenicmice that allowdeter-
mination of cells in G1 and/or S/G2/M phases of the cell cycle
using dual color imaging. None of the cells analyzed in the hepatic
capsule (>100 cells/time point/mouse) were proliferating (Fig-
ure S5), indicating that the increased numbers of LCMs at wean-
ing were not driven by increased local proliferation of LCMs or of
their precursors, but rather resulted from increased replenishment
from blood-borne precursors, which we postulate could be
monocytes. The positive correlation between the number of
monocytes and LCM density was supported by (1) increased
numbers of circulating monocytes and LCMs after weaning
(Figure 5E), (2) decreased numbers of circulating monocytes
and LCMs in antibiotic-treated mice (Figure 5F), (3) decreased
numbers of circulating monocytes after treatment with M279
that depleted LCMs (Figure 5G), and (4) the reported decrease
in hematopoiesis, including monocytes, in germ-free mice (Khos-
ravi et al., 2014).
CSF-1 Is Enriched in the Liver Capsule and Is Critical forLCM HomeostasisCCR2 regulates recruitment ofmonocytes and their differentiation
into tissue-resident CX3CR1hi macrophages in the small intestinal
lamina propria (Bain et al., 2014) and could play a similar role in re-
cruitingmonocytes to the liver capsule. AsCcr2�/� LCMnumbers
in the liver capsule of WT parabionts (Figure 4D) may have been
influenced by lack of CCR2 regulation of monocyte exit from the
bone marrow, we tested whether circulating monocytes in
Ccr2�/� mice could be recruited to the liver capsule and give
rise to LCMs in the absence of competing WT monocytes. The
density of LCMs in liver capsules of CCR2-deficient mice was
similar to that in CCR2-sufficient mice (Figure 5D), indicating that
althoughCCR2playeda key role in regulating the number of circu-
lating monocytes, it was dispensable for their recruitment to the
liver capsule and/or their intrahepatic differentiation into LCMs.
The chemokine receptors CXCR4, CCR5, and CX3CR1 and
chemokine CCL5, also known to influence macrophage and
monocyte recruitment, were found to be dispensable for the re-
cruiting of circulating LCM precursors and/or for their intrahe-
patic differentiation as determined by LCM density in deficient
animals (Figure 5D). In addition, sorted purified CX3CR1-defi-
cient monocytes adoptively transferred into M279-treated recip-
ient mice reconstituted the liver capsule and gave rise to LCMs
(Figure 5H).
LCMs are sensitive to anti-CSF-1R antibody (Figure 1F) and
thus depend on CSF-1R signaling. IL-34, one of the two CSF-
1R ligands (Greter et al., 2012b), was not critical, as Il34�/�
mice contained the same LCM density as WT mice (Figure 5I).
CSF-1, the second CSF-1R ligand, was enriched in the hepatic
capsule (Figure 5J) while LCM density was significantly
decreased when CSF-1 was blocked (Figure 5K). Together,
these results indicate that LCMs were dependent on the
CSF-1R ligand CSF-1 rather than IL-34.
LCMs Form a Contiguous Cellular Network at theInterface between Liver Parenchyma and PeritonealCavityLCMs formed a contiguous cellular network in the hepatic
capsule (Figure 6A) reminiscent of LCs in the epidermis and in
380 Immunity 47, 374–388, August 15, 2017
the oral epithelium (Capucha et al., 2015). LCs from these tissues
express langerin and have been reported to be GFP+ in Cd207-
EGFP mice (Capucha et al., 2015). To explore the distribution of
GFP-expressing cells resembling LCMs in Cd207-EGFP mice,
we examined the superficial layers of other organs, including
the peritoneal membrane and serosa of other abdominal organs.
Although GFP+ cells arranged in networks and possessing
distinctive dendrites could easily be detected in the liver capsule
and epidermis of Cd207-EGFP mice, they were not detected in
the capsule of other organs examined (Figure 6B). GFP+ cells
were detected in the thymus and Peyer’s patches, but these
were not of dendritic morphology. These cells have previously
been described in all secondary lymphoid organs and character-
ized as blood-derived CD8a+ DCs (Douillard et al., 2005).
LCMs displayed long dendrites wrapped around collagen
fibers (Figures 6C and 6D). Their restricted anatomical location
was suggestive of a specific role at the interface between the
peritoneal cavity and the hepatic parenchyma. To assess
whether these cells could access the peritoneal cavity, recon-
structions of the hepatic capsule of Itgax-YFP or MacGreen
crossed with tdTomato mice were generated to outline how
LCMs interacted with collagen fibers, hepatocytes, and liver
sinusoids (Figures 6E and 6F). LCMs were seen extending long
dendrites into the lumen of underlying hepatic sinusoids (white
arrows in Figures 6E and 6F), while some extended dendrites
outside the capsule, toward the peritoneal cavity (Figure 6F,
white asterisks). To observe their steady-state dynamics,
LCMs were imaged for 4–5 hr using in vivo live 2PM. Although
they did not migrate within this time frame, LCMs exhibited a
behavior similar to that described in skin LCs and brainmicroglial
cells, termed ‘‘dendrite surveillance extension and retraction
cycling habitude’’ (dSEARCH) (Figure 6G; Movie S1; Ng et al.,
2008). These imaging studies suggested that LCMs extended
dendrites toward both the blood and the peritoneal cavity and
could potentially sample these compartments.
LCMs Are Able to Sense Bacteria Reaching the HepaticCapsuleThe capsule of the liver is exposed to the peritoneal cavity, a
compartment traversed by pathogens such as M. tuberculosis
(Guirat et al., 2011) and L. monocytogenes (Havell et al., 1999)
to disseminate infection. Infection of mycobacteria via the
intra-peritoneal route is a physiological model of abdominal
tuberculosis (Guirat et al., 2011), a major site of infection before
milk pasteurization was adopted. We thus sought to determine
whether LCMs could sense bacteria or bacteria products and
prevent pathogen dissemination.
Fluorescent polystyrene beads administered i.p. with or
without LPS were in close association with LCMs within 2 hr,
suggesting that LCMs were able to pick up particulate antigens
(Figure S6A). To explore whether LCMs could also take up
bacteria, we performed similar experiments using M. bovis
bacillus Calmette-Guerin (BCG) expressing mCherry. When
BCG-mCherry was injected intravenously (i.v.), most bacteria
were associated with KCs (Figure S6B), while very few were de-
tected inside YFP+ or GFP+ LCMs. In contrast, some BCG-
mCherry administered i.p. was associated with LCMs within
2 hr (Figure S6C). To directly image the dynamics of this pro-
cess, bacteria were directly applied to the capsule and then

Figure 4. LCMs Are Derived from Monocytes and Are Continuously Replenished in the Steady State(A) WT mice were irradiated and reconstituted with Itgax-YFP bone marrow. Representative images depict YFP+ cells in the hepatic capsule and skin. Graph
represents the mean ± SEM of total counts of YFP+ cells in the liver capsule before (non-irradiated age-matched controls) and after reconstitution in eight animals
analyzed in two independent experiments.
(B) Itgax-YFP livers were transplanted into tdTomato recipients. Representative images of the liver capsule and parenchyma 5 days after transplantation (n = 5
animals analyzed in two independent experiments).
(legend continued on next page)
Immunity 47, 374–388, August 15, 2017 381

immediately imaged by 2PM intravital microscopy. LCM den-
drites were seen extending toward bacteria (Figure 7A; Movie
S2), suggesting that LCMs sensed peritoneal bacteria accessing
the liver capsule.
Increased Hepatic Dissemination of PeritonealPathogens in the Absence of LCMsTo assess the potential for LCMs to inhibit dissemination of perito-
neal pathogensbreaching the liver capsule,wedepleted this pop-
ulation by administering a single dose of anti-CSF-1R (M279) anti-
body,which completely ablatedLCMsbetween2 and 5days after
treatment (Figure 1F) but did not have an effect on the numbers of
KCs or peritoneal macrophages (Figure 7B). 3 days after injection
with anti-CSF-1R or control antibody, mice were infected i.p. with
BCG or L. monocytogenes. 6 hr after bacterial injection, the livers
of M279-treated mice contained approximately 10 times more
BCG than the livers from mice treated with control antibody (Fig-
ure 7C). Similar results were obtained after infection with Listeria
(Figure 7C). M279 treatment did not result in increased numbers
of bacteria in the peritoneal cavity at the same time point (Fig-
ure S6D). These results confirm a role of LCMs in preventing peri-
toneal bacteria dissemination in the liver.
LCMs Prevent Bacterial Dissemination by RecruitingNeutrophilsTo assess whether LCMs directly eliminate peritoneal pathogens
or recruit other phagocytic cells, we investigated whether the
bacteria were mostly associated with LCMs or other cell sub-
sets. Both monocytes and neutrophils were recruited to the
capsule (Figure 7D) after intraperitoneal BCG-mCherry injection.
Although some LCMs interacted with BCG, some bacteria were
clearly associated with neutrophils but very rarely with mono-
cytes (Figure 7E). After exposure of the liver capsule to LPS or
live bacteria, circulating neutrophils were recruited from the he-
patic sinusoids and reached the liver capsule by crawling along
LCM dendrites (Figure 7E; Movies S3 and S4). Once in the
capsular region, recruited neutrophils remained localized around
LCMs (Movies S3 and S4). LCMdepletion with anti-CSF-1R anti-
body did not decrease circulating neutrophils (Figure 7F) but re-
sulted in reduced neutrophil numbers in the hepatic capsule (Fig-
ure 7G), indicating that LCMs promoted neutrophil recruitment.
Collectively, these observations indicate that LCMs, likely
through recruitment of neutrophils, play a role in preventing
dissemination of peritoneal pathogens breaching the liver
capsule.
DISCUSSION
We have identified a distinct subset of resident macrophages
that coexists with KCs in the uninjured liver. These cells are
(C and D) CD45.1+ mice were parabiotically joined to (C) congenic CD45.2+ Cx
parabiont were identified by in vivo anti-CD45.1-PE labeling (red) or GFP (green); m
Graphs show the degree of non-host chimerism in the different parabionts. The pr
calculated by flow cytometry while the frequency of KCs and LCMs was calculate
per group.
(E) WT recipient mice were treated with a single dose of M279 antibody to deplete
mice adoptively transferred 7 days later. 2PM maximal intensity projection image
See also Figure S5.
382 Immunity 47, 374–388, August 15, 2017
located in the hepatic capsule, just under a layer of mesothelial
cells where they seem to form a defensive line against pathogens
within the peritoneal cavity.
MHCIIhi capsular cells have been observed in previous studies
(Prickett et al., 1988) but were misclassified as KCs (Aoyama
et al., 2010), fibroblasts, or hepatic stellate cells (Lee et al.,
2010). A recent study (David et al., 2016) reported GFP+ cells
with dendrites in the liver capsules of Cx3cr1-GFP reporter
mice, assessing them to be F4/80 negative and classifying
them as DCs via transcriptomic analysis of sorted GFP+F4/80�
cells. While we do not exclude the presence of Cx3cr1-GFP+
DCs within the liver parenchyma, our study shows that GFP+
cells in the liver capsule of Cx3cr1-GFP mice expressed F4/80,
as well as CD64 and CSF1R, macrophage markers that were
not assessed in the study of David et al. (2016), and further
were Flt3L independent. Differences in assessment of F4/80
expression between the current study and that of David et al.
(2016) may be related to lower F4/80 expression in LCMs
compared to KCs, as suggested by CYTOF analysis, and/or
slower access of intravenously administered antibody to
the matrix-rich capsule than to the hepatic sinusoids. As F4/
80+CX3CR1-GFP+ capsular cells would have been excluded
from assessment via the sort strategy performed by David
et al. (2016), the transcriptomic analysis performed in that study
likely characterized a population of Cx3cr1-GFP+ F4/80neg
cells enriched in liver DCs and monocytes that did not contain
hepatic capsular cells. In contrast, the current phenotypical,
transcriptomic, and ontogenetic analyses consistently demon-
strate hepatic capsular cells to be macrophages.
Our results suggest that LCMs are derived from circulating
monocytes. The dependence of LCMs on CSF-1R suggests
that signaling via this pathway is critical for their recruitment
and/or maintenance. As the number of circulating monocytes
is dependent on CSF-1R signaling, it is difficult to exclude regu-
lation of LCMs by CSF-1 via control of the number of circulating
precursors. However, the concentration of CSF-1 detected in the
hepatic capsule favors a model in which local CSF-1:CSF-1R in-
teractions play a role in the recruitment of LCM precursors and/
or maintenance of LCMs in the liver capsule.
A recent study demonstrated that during liver injury, peritoneal
macrophages expressing GATA-6 can migrate via the hepatic
capsule to repair damaged liver tissue (Wang and Kubes,
2016), raising the possibility that LCMs could also be derived
fromperitoneal macrophages. However, several arguments sug-
gest that this is unlikely, at least in the steady state. First, tran-
scriptomic analysis of LCMs indicates that they do not express
Gata6 and other genes expressed by peritoneal macrophages.
Second, in contrast to monocyte transfer, transfer of peritoneal
macrophages under the same conditions did not give rise to
LCMs. While our results suggest that peritoneal macrophages
3cr1-GFP mice or (D) CD45.2+ Cx3cr1-GFP Ccr2�/� mice. LCMs from each
ultiphoton images are representative of the hepatic capsule in each parabiont.
oportion of CD45.1+ blood monocytes, T cells, and alveolar macrophages was
d by 2PM. Bar graphs represent mean ± SEM of at least three individual mice
LCMs andGFP+ sortedmonocytes or peritoneal macrophages fromMacGreen
s of the hepatic capsule were obtained 9 days after cell transfer. Bars, 20 mm.

Day 22 Day 4 Day 28 A C
apsu
le
Den
sity
of r
epor
ter p
os
LCM
s (c
ells
/mm
2 )
400
300
200
100
0 0 50 100 200 400 Time after birth (days)
Weaning
Den
sity
of F
4/80
+
LCM
s (c
ells
/mm
2 )
Germ FreeSPF housing
*400
300
200
100
0
SPF Germ free
Cap
sule
SPF housing Germ free B
Den
sity
of F
4/80
+
LCM
s (c
ells
/mm
2 )
D 400
300
200
100
0
Den
sity
of F
4/80
+
LCM
s (c
ells
/mm
2 )300
200
100
0
CSF-1 WTIl34-/-
Den
sity
of F
4/80
+
LCM
s (c
ells
/mm
2 )
300
200
100
0
*106
5 x10⁵
0
Blo
od m
onoc
ytes
co
unts
(cel
ls/m
l)
Pre- injection (day 0)
Anti- CSF-1R (day 4)
*
Control Ig G KJIH
0
0
0
0*
300
200
100
0
Den
sity
of F
4/80
+
LCM
s (c
ells
/mm
2 )
SPF Antibiotics
Antibiotics
Cap
sule
SPF housingC
2 4 6
Blo
od m
onoc
ytes
co
unts
(cel
ls/m
l)
2 4 60
5
6
*
106
5 x10⁵
0
Time after birth (weeks)
E F Water Antibiotics
106
5 x10⁵
0
*
Blo
od m
onoc
ytes
co
unts
(cel
ls/m
l)
WTCcr2
-/-
Cx3cr1
-/-
Ccr5-/-
Ccl5-/-
Tlr4-/-
Myd88
-/-
Figure 5. LCMs Accumulate after Weaning and Their Recruitment and/or Maintenance Depends on CSF-1
(A) Left: representative 2PMmaximal intensity projection images of LCMs in MacGreen mice. Right: kinetics of LCM accumulation in the liver capsule after birth.
Graph represents pooled data from at least three animals (from at least two independent litters) per time point. Bar, 50 mm.
(B and C) 2PM images (left) and quantitation (right) of F4/80+ in vivo labeled LCMs from (B) 8-week-oldWTmice housed in SPF or germ-free conditions and (C) 5-
week-old untreatedWTmice housed in SPF conditions or treated with antibiotics for 2 weeks from the day of weaning. Graph represents counts from at least four
animals per group pooled from two independent litters. Bar, 50 mm.
(D) Density of LCMs in WT mice and mice deficient for CCR2, CX3CR1, CCR5, CCL5, TLR4, or MyD88.
(E–G) Bloodmonocyte counts: (E) at different ages before and after weaning; (F) at 5 weeks of age after 2 weeks of antibiotic treatment; (G) after treatment of adult
mice with a single dose of M279.
(H) WT recipient mice were treated with a single dose of M279 antibody to deplete LCMs and injected i.v. 7 days later with GFP+ sorted monocytes from Cx3cr1-
GFPgfp/gfp mice. 2PM maximal intensity projection images of the hepatic capsule were obtained 9 days after cell transfer. Bar, 20 mm.
(I) Density of LCMs in WT and IL-34-deficient mice.
(J) Immunostaining for CSF-1 (red) in the liver. Bar, 50 mm.
(K) Density of LCMs in mice treated with anti-CSF-1 or isotype control antibody (*p = 0.029, Mann Whitney test, n = 4).
In all graphs, bars represent mean ± SEM of at least three individual mice per group.
do not differentiate into LCMs in the uninflamed liver, it is
tempting to speculate that they potentially use LCMs as gate-
ways when they migrate via the hepatic capsule to repair
damaged liver tissue (Wang and Kubes, 2016).
Recent studies suggest that the origin, distribution, specific
tissue location, and functional specialization of macrophages is
imparted by micro-environmental cues that shape the epigenetic
chromatin landscape of macrophages or their precursors rather
than by an imprinted precursor program (Lavin et al., 2014;
Mass et al., 2016). LCMs occupy a separate liver niche to KCs,
and it is thus not unexpected that they have a different transcrip-
tomic signature to the embryonically derived and monocyte-
derived KCs recently described by Scott et al. (2016). Whole-tran-
scriptome analysis demonstrated that LCMs were more closely
Immunity 47, 374–388, August 15, 2017 383

Stomach Small Int. serosaBladder Diaphragm Thymus
PeritoneumKidney asores.tnIegraL.acirepv.rtraeHLarge Int. mucosa
Skin (ear) Liver Lung Spleen Peyer’s Patch serosaB
GFP (LCMs) Collagen (SHG)
H
M
col
col
D
GFP Collagen (SHG)
GFP (LCMs) Collagen(SHG)
A
C
E F
G
YFP (LCM) Collagen (SHG) mTom (Hep. + other cells)
LCM
MHCII GFP (Hepatocytes) mTom (Other cells incl. sinusoids)
llt=0 t=15 min t=30 min
Figure 6. LCMs Form a Contiguous Network within the Liver Capsule and Scan Their Environment by Extending Dendrites
(A) 1 mm2 mosaic maximal intensity projection of the liver capsule from a Cx3cr1-GFP mouse. Bar, 100 mm.
(B) 2PM maximal intensity projection images (>50 mm thickness) at the surface of various organs from Cd207-EGFP mice. Collagen is blue. Bar, 50 mm.
(C) High-resolution maximal intensity projection image of GFP+ cells in the liver capsule of a Cd207-EGFP mouse. Bar, 50 mm.
(D) Electron microscopy image of WT mouse liver capsule, depicting an LCM interacting with collagen fibers (col). Abbreviations: M, mesothelial cells; H,
hepatocytes. Bar, 5 mm.
(E) Representative cross-section of a Itgax-YFP3 tdTomato mouse liver showing a YFP+ LCM (yellow) extending a long dendrite between hepatocytes (gray) and
into the lumen of the nearest sinusoid (white arrow). Bar, 5 mm.
(F) Section of the liver capsule of an Alb-cre 3 tdTomato mouse stained with anti-MHCII antibody showing an MHCII+ LCM (yellow) extending a long dendrite
between hepatocytes (green) into the lumen of the nearest sinusoid (arrow) and projections toward the outer part of the capsule toward the peritoneal cavity (white
stars). Bar, 50 mm.
(G) Dynamics of LCMs in a Itgax-YFPmouse liver depicted by overlaying a series of 2P-IVM time lapse images at t = 0, 15min, and 30min reveals typical scanning
behavior. Bar, 50 mm.
See also Movie S1.
384 Immunity 47, 374–388, August 15, 2017

Figure 7. LCMs Sense Bacteria and Control
Hepatic Ingress of Bacteria from the Perito-
neal Cavity via Recruitment of Neutrophils
(A) Representative 2P-IVM time-lapse images of
an LCM (green) in a Itgax-YFP mouse liver capsule
exposed to mCherry-labeled BCG (purple) ex-
tending dendrites toward bacteria. Times repre-
sent exposure time to bacteria. Bars, 20 mm.
(B) Following treatment with M279 or isotype
control antibody 3 days prior, KCs were enumer-
ated by in vivo labeling using anti-F4/80-PE anti-
body and 2PM analysis at parenchymal depth.
Peritoneal cavity macrophages were enumerated
by flow cytometry. Bar graphs represent mean ±
SEM of at least three individual mice per group in
at least two independent experiments.
(C) Bacterial loads (CFU) of liver tissue harvested
after 6 hr, frommice injected i.p. with 23 105 cfu of
BCG-mCherry or Listeria. Mice were treated with
M279 or isotype control antibody 3 days prior. Bar
graphs represent mean ± SEM of at least four in-
dividual mice per group in at least two indepen-
dent experiments.
(D) Representative maximal intensity projection
mosaic of the liver capsule from a Itgax-YFPmouse
(LCM yellow) injected i.p. with LPS 6 hr prior
showing that most neutrophils were in close prox-
imity to LCMs. Neutrophils (red) were stained by
in vivo labeling using PE-conjugated anti-Ly6G
antibody. Bar, 100 mm.
(E) Top: Representative 2PM time-lapse images of
a cross-section of aMacGreenmouse liver capsule
exposed to LPS (10 mg/mL) showing three different
neutrophils extravasating at the samepoint of entry
in the liver capsule. Bottom left: Still 2PM image of a
MacGreen mouse liver capsule exposed to BCG-
mCherry. Lines represent tracks from neutrophils
that extravasated into thecapsular spacewithin the
time frame of imaging. Bottom right: Representa-
tive 2PM image of a MacBlue3MacGreen mouse
4 hr after i.p. injection with 2 3 105 cfu of BCG-
mCherry and 1 hr after i.v. injection with anti-Ly6G;
arrows indicate neutrophils containing bacteria.
Bars, 25 mm for both upper and lower panels.
(F) Blood neutrophil counts assessed by flow cy-
tometry 3 days after treatment with M279 or iso-
type control antibody.
(G) Representative images (left) and density (right)
of neutrophils in the hepatic capsule of WT
mice 3 days after treatment with M279 or isotype
control antibody and 6 hr after i.p. injection with
LPS or 2 3 105 cfu of BCG. Bar, 25 mm.
In (F) and (G), bar graphs represent mean ± SEM
of at least three individual mice per group in at
least two independent experiments. See also
Movies S2, S3, and S4 and Figure S7.
related to monocyte-derived tissue macrophages described
in the steady-state adult gut or skin. The intestine contains
mostlymonocyte-derivedmacrophages, while skin and pancreas
contain distinct niches harboring phenotypically distinct macro-
phage subsets (Calderon et al., 2015; Tamoutounour et al.,
2013). The different niches in the skin and pancreas are occupied
bymacrophages of distinct ontogeny, similar to our findings in the
liver. The skin contains prototypical embryonically derived tissue
macrophages (LCs) in the epidermis andmonocyte-derivedmac-
rophages in the dermis. The pancreas has three separate niches:
the islets of Langerhans contain a monocyte-derived subset,
while the interacinar stroma contains both monocyte-derived
and embryonically derived macrophages (Calderon et al., 2015).
It is unclear whether continuous differentiation of monocyte-
derived tissue-residentmacrophages is restricted to these organs
or whether it occurs in other tissues.
KCs have previously been considered to be the only liver-resi-
dent macrophages in the liver. They are positioned to clear
Immunity 47, 374–388, August 15, 2017 385

blood-borne pathogens in the lumen of the hepatic sinusoids.
The location of LCMs at the interface between blood and perito-
neal cavity and their ability to interact with bacteria accessing the
liver capsule raised the possibility of a similar role at the liver
surface. Pathogens such as M. tuberculosis (Guirat et al.,
2011), Listeria (Havell et al., 1999), C. albicans, and Chlamydia
traverse the peritoneal cavity to spread systemically (M€uller-
Schoop et al., 1978) from the gut or the fimbriated ends of the fal-
lopian tubes in females. Our findings that LCM dendrites could
reach both blood and peritoneal cavity and capture beads or
bacteria applied to the capsule or present in the peritoneal cavity
suggest that LCMs sense and/or sample particulate peritoneal
antigens or bacteria reaching the liver capsule. LCMs were
indeed closely associated with i.p. injected BCG and were able
to extend dendrites toward the bacteria. Consistent with a role
of LCMs in preventing the dissemination of bacteria from the
peritoneal cavity into the liver, selective LCM depletion led to
higher bacterial counts in the liver without affecting counts in
the peritoneal cavity. Our data suggest that this protective im-
mune role of LCMs is mediated by neutrophils that are recruited
to the liver capsule after LPS treatment and exposure to BCG,
extravasating in close proximity to LCMs. A role for LCMs in
the recruitment of neutrophils to the liver capsule was supported
by transcriptomic analysis demonstrating their expression of a
number of factors, including CXCL1, CXCL2, CCL2, CCL3, and
CCL4 that have potential to serve as neutrophil chemoattrac-
tants. Specific depletion of LCMs was associated with reduced
capsular neutrophil recruitment and higher hepatic bacterial
counts. These results suggest that LCMs are physiological sen-
sors of peritoneal pathogens that play a role in preventing bacte-
rial dissemination into the liver by rapidly recruiting neutrophils to
the hepatic capsule. Of note, neutrophils have been reported to
be critical in controlling liver infection after i.p. injection of Listeria
(Conlan and North, 1994) and immune-competent mice die
within a few days from this infection when neutrophils are
depleted (Rogers and Unanue, 1993).
Although infection via the peritoneum would affect other or-
gans, it is unclear whether cells similar to those described in
the liver prevent bacterial dissemination to these other tissues.
It is also unknown whether LCMs interact or cooperate with peri-
toneal macrophages to eliminate peritoneal pathogens.
In conclusion, LCMs constitute a unique monocyte-derived
macrophage subset that is ontogenetically and phenotypically
distinct from KCs, forming a capsular network in the normal adult
liver that is not detected in the capsule of other organs. This
macrophage subset appears to play a role in immunosurveillance
at the interface between the peritoneal cavity and the liver, medi-
ating neutrophil recruitment in the presence of peritoneal bacteria,
with associated control of intrahepatic bacterial loads.
STAR+METHODS
Detailed methods are provided in the online version of this paper
and include the following:
d KEY RESOURCES TABLE
d CONTACT FOR REAGENT AND RESOURCE SHARING
d EXPERIMENTAL MODEL AND SUBJECT DETAILS
386 I
B Mice
mmunity 47, 374–388, August 15, 2017
d METHOD DETAILS
B Antibiotic treatment
B Bacterial cultures
B Bacterial infections
B Liver transplantation
B Parabiosis
B BM chimeras
B CSF-1R monoclonal antibody treatment
B Purification ofmonocytes and peritoneal macrophages
for adoptive transfer
B Surgery for intravital multiphoton imaging
B Multiphoton imaging
B Isolation of liver myeloid cells and flow cytometry
B Epifluorescence Analysis of Liver Sections
B Electron microscopy
B Cell isolation and sorting for transcriptomic microarray
analysis
B Pre-processing and data analysis
B Mass cytometry sample preparation and analysis
B Mass cytometry data analysis
d QUANTIFICATION AND STATISTICAL ANALYSIS
d DATA AND SOFTWARE AVAILABILITY
SUPPLEMENTAL INFORMATION
Supplemental Information includes six figures and four movies and can be
found with this article online at http://dx.doi.org/10.1016/j.immuni.2017.
07.018.
AUTHOR CONTRIBUTIONS
Conceptualization, F.S., P.B., and D.G.B.; Methodology, F.S., K.P.A.M.,
L.G.N., B.R., and B.L.; Software, S.R., W.R., F.L., and A.J.M.; Formal Analysis,
F.S., M.E., S.R., W.R., M.M., K.P.A.M., and L.E.H.; Investigation, F.S., M.E.,
L.B., S.B.W., B.L., A.W., M.M., K.P.A.M., M.F., A.J.M., L.E.H., and S.S.T.; Re-
sources, M.E., K.P.A.M., W.W., B.M.S., L.G.N., F.G., W.J.B., andW.R.H.; Data
Curation, F.S., S.R., W.R., C.M., and M.M.; Writing – Original Draft, F.S. and
P.B.; Writing – Review & Editing, D.G.B., M.E., K.P.A.M., Y.C.W., S.S.T.,
B.R., D.G.L., B.M.S., and L.G.N.; Supervision, P.B. and D.G.B.; Project Admin-
istration, P.B.; Funding Acquisition, P.B., D.G.B., and G.W.M.
ACKNOWLEDGMENTS
We would like to thank Prof. L. Guidotti and Dr. M. Iannacone for sharing their
technical expertise in 2PM liver imaging, Prof. B. Malissen for Cd207-EGFP
mice, Dr. Matthew Sweet for Mac-Blue mice, and Dr. H. Wu for TLR4- and
MyD88-deficient mice. We would also like to thank the Centenary Institute An-
imal Facility and Advanced Cytometry Facility for technical support. This work
was supported by the NHMRC Australia (project grants APP1108565 and
APP1086451) and by SIgN, A*STAR, Singapore.
Received: August 6, 2016
Revised: March 3, 2017
Accepted: July 23, 2017
Published: August 15, 2017
REFERENCES
Aoyama, T., Inokuchi, S., Brenner, D.A., and Seki, E. (2010). CX3CL1-CX3CR1
interaction prevents carbon tetrachloride-induced liver inflammation and
fibrosis in mice. Hepatology 52, 1390–1400.
Bain, C.C., Bravo-Blas, A., Scott, C.L., Perdiguero, E.G., Geissmann, F., Henri,
S., Malissen, B., Osborne, L.C., Artis, D., and Mowat, A.M. (2014). Constant

replenishment from circulating monocytes maintains the macrophage pool in
the intestine of adult mice. Nat. Immunol. 15, 929–937.
Beattie, L., Sawtell, A., Mann, J., Frame, T.C., Teal, B., de Labastida Rivera, F.,
Brown, N.,Walwyn-Brown, K., Moore, J.W., MacDonald, S., et al. (2016). Bone
marrow-derived and resident livermacrophages display unique transcriptomic
signatures but similar biological functions. J. Hepatol. 65, 758–768.
Boring, L., Gosling, J., Chensue, S.W., Kunkel, S.L., Farese, R.V., Jr.,
Broxmeyer, H.E., and Charo, I.F. (1997). Impaired monocyte migration and
reduced type 1 (Th1) cytokine responses in C-C chemokine receptor 2
knockout mice. J. Clin. Invest. 100, 2552–2561.
Bouwens, L., Baekeland, M., and Wisse, E. (1984). Importance of local prolif-
eration in the expanding Kupffer cell population of rat liver after zymosan stim-
ulation and partial hepatectomy. Hepatology 4, 213–219.
Calderon, B., Carrero, J.A., Ferris, S.T., Sojka, D.K., Moore, L., Epelman, S.,
Murphy, K.M., Yokoyama, W.M., Randolph, G.J., and Unanue, E.R. (2015).
The pancreas anatomy conditions the origin and properties of resident macro-
phages. J. Exp. Med. 212, 1497–1512.
Capucha, T., Mizraji, G., Segev, H., Blecher-Gonen, R., Winter, D., Khalaileh,
A., Tabib, Y., Attal, T., Nassar, M., Zelentsova, K., et al. (2015). Distinct murine
mucosal Langerhans cell subsets develop from pre-dendritic cells and mono-
cytes. Immunity 43, 369–381.
Conlan, J.W., and North, R.J. (1994). Neutrophils are essential for early anti-
Listeria defense in the liver, but not in the spleen or peritoneal cavity, as re-
vealed by a granulocyte-depleting monoclonal antibody. J. Exp. Med. 179,
259–268.
David, B.A., Rezende, R.M., Antunes, M.M., Santos, M.M., Freitas Lopes,
M.A., Diniz, A.B., Sousa Pereira, R.V., Marchesi, S.C., Alvarenga, D.M.,
Nakagaki, B.N., et al. (2016). Combination of mass cytometry and imaging
analysis reveals origin, location, and functional repopulation of liver myeloid
cells in mice. Gastroenterology 151, 1176–1191.
Douillard, P., Stoitzner, P., Tripp, C.H., Clair-Moninot, V., Aıt-Yahia, S.,
McLellan, A.D., Eggert, A., Romani, N., and Saeland, S. (2005). Mouse
lymphoid tissue contains distinct subsets of langerin/CD207 dendritic cells,
only one of which represents epidermal-derived Langerhans cells. J. Invest.
Dermatol. 125, 983–994.
Faust, N., Varas, F., Kelly, L.M., Heck, S., and Graf, T. (2000). Insertion of
enhanced green fluorescent protein into the lysozyme gene creates mice
with green fluorescent granulocytes and macrophages. Blood 96, 719–726.
Forster, R., Mattis, A.E., Kremmer, E.,Wolf, E., Brem, G., and Lipp,M. (1996). A
putative chemokine receptor, BLR1, directs B cell migration to defined
lymphoid organs and specific anatomic compartments of the spleen. Cell
87, 1037–1047.
Gautier, E.L., and Yvan-Charvet, L. (2014). Understanding macrophage diver-
sity at the ontogenic and transcriptomic levels. Immunol. Rev. 262, 85–95.
Gautier, E.L., Shay, T., Miller, J., Greter, M., Jakubzick, C., Ivanov, S., Helft, J.,
Chow, A., Elpek, K.G., Gordonov, S., et al.; Immunological Genome
Consortium (2012). Gene-expression profiles and transcriptional regulatory
pathways that underlie the identity and diversity of mouse tissue macro-
phages. Nat. Immunol. 13, 1118–1128.
Ginhoux, F., and Guilliams, M. (2016). Tissue-resident macrophage ontogeny
and homeostasis. Immunity 44, 439–449.
Greter, M., Helft, J., Chow, A., Hashimoto, D., Mortha, A., Agudo-Cantero, J.,
Bogunovic, M., Gautier, E.L., Miller, J., Leboeuf, M., et al. (2012a). GM-CSF
controls nonlymphoid tissue dendritic cell homeostasis but is dispensable
for the differentiation of inflammatory dendritic cells. Immunity 36, 1031–1046.
Greter, M., Lelios, I., Pelczar, P., Hoeffel, G., Price, J., Leboeuf, M., K€undig,
T.M., Frei, K., Ginhoux, F., Merad, M., and Becher, B. (2012b). Stroma-derived
interleukin-34 controls the development and maintenance of langerhans cells
and the maintenance of microglia. Immunity 37, 1050–1060.
Guilliams, M., De Kleer, I., Henri, S., Post, S., Vanhoutte, L., De Prijck, S.,
Deswarte, K., Malissen, B., Hammad, H., and Lambrecht, B.N. (2013).
Alveolar macrophages develop from fetal monocytes that differentiate into
long-lived cells in the first week of life via GM-CSF. J. Exp. Med. 210,
1977–1992.
Guilliams,M., Dutertre, C.A., Scott, C.L., McGovern, N., Sichien, D., Chakarov,
S., Van Gassen, S., Chen, J., Poidinger, M., De Prijck, S., et al. (2016).
Unsupervised high-dimensional analysis aligns dendritic cells across tissues
and species. Immunity 45, 669–684.
Guirat, A., Koubaa, M., Mzali, R., Abid, B., Ellouz, S., Affes, N., Ben Jemaa, M.,
Frikha, F., Ben Amar, M., and Beyrouti, M.I. (2011). Peritoneal tuberculosis.
Clin. Res. Hepatol. Gastroenterol. 35, 60–69.
Hashimoto, D., Chow, A., Noizat, C., Teo, P., Beasley, M.B., Leboeuf, M.,
Becker, C.D., See, P., Price, J., Lucas, D., et al. (2013). Tissue-resident mac-
rophages self-maintain locally throughout adult life with minimal contribution
from circulating monocytes. Immunity 38, 792–804.
Havell, E.A., Beretich, G.R., Jr., and Carter, P.B. (1999). The mucosal phase of
Listeria infection. Immunobiology 201, 164–177.
Heymann, F., Peusquens, J., Ludwig-Portugall, I., Kohlhepp, M., Ergen, C.,
Niemietz, P., Martin, C., van Rooijen, N., Ochando, J.C., Randolph, G.J.,
et al. (2015). Liver inflammation abrogates immunological tolerance induced
by Kupffer cells. Hepatology 62, 279–291.
Jung, S., Aliberti, J., Graemmel, P., Sunshine, M.J., Kreutzberg, G.W., Sher, A.,
and Littman, D.R. (2000). Analysis of fractalkine receptor CX(3)CR1 function by
targeted deletion and green fluorescent protein reporter gene insertion. Mol.
Cell. Biol. 20, 4106–4114.
Kissenpfennig, A., Henri, S., Dubois, B., Laplace-Builhe, C., Perrin, P., Romani,
N., Tripp, C.H., Douillard, P., Leserman, L., Kaiserlian, D., et al. (2005).
Dynamics and function of Langerhans cells in vivo: dermal dendritic cells colo-
nize lymph node areas distinct from slower migrating Langerhans cells.
Immunity 22, 643–654.
Khosravi, A., Yanez, A., Price, J.G., Chow, A., Merad,M., Goodridge, H.S., and
Mazmanian, S.K. (2014). Gut microbiota promote hematopoiesis to control
bacterial infection. Cell Host Microbe 15, 374–381.
Lavin, Y., Winter, D., Blecher-Gonen, R., David, E., Keren-Shaul, H., Merad,
M., Jung, S., and Amit, I. (2014). Tissue-resident macrophage enhancer land-
scapes are shaped by the local microenvironment. Cell 159, 1312–1326.
Lee, W.Y., Moriarty, T.J., Wong, C.H., Zhou, H., Strieter, R.M., van Rooijen, N.,
Chaconas, G., and Kubes, P. (2010). An intravascular immune response to
Borrelia burgdorferi involves Kupffer cells and iNKT cells. Nat. Immunol. 11,
295–302.
Lindquist, R.L., Shakhar, G., Dudziak, D., Wardemann, H., Eisenreich, T.,
Dustin, M.L., and Nussenzweig, M.C. (2004). Visualizing dendritic cell net-
works in vivo. Nat. Immunol. 5, 1243–1250.
Liu, K., Waskow, C., Liu, X., Yao, K., Hoh, J., and Nussenzweig, M. (2007).
Origin of dendritic cells in peripheral lymphoid organs of mice. Nat.
Immunol. 8, 578–583.
Liu, K., Victora, G.D., Schwickert, T.A., Guermonprez, P., Meredith, M.M., Yao,
K., Chu, F.F., Randolph, G.J., Rudensky, A.Y., and Nussenzweig, M. (2009).
In vivo analysis of dendritic cell development and homeostasis. Science
324, 392–397.
MacDonald, K.P., Palmer, J.S., Cronau, S., Seppanen, E., Olver, S., Raffelt,
N.C., Kuns, R., Pettit, A.R., Clouston, A., Wainwright, B., et al. (2010). An anti-
body against the colony-stimulating factor 1 receptor depletes the resident
subset of monocytes and tissue- and tumor-associated macrophages but
does not inhibit inflammation. Blood 116, 3955–3963.
Makino, Y., Cook, D.N., Smithies, O., Hwang, O.Y., Neilson, E.G., Turka, L.A.,
Sato, H., Wells, A.D., and Danoff, T.M. (2002). Impaired T cell function in
RANTES-deficient mice. Clin. Immunol. 102, 302–309.
Mass, E., Ballesteros, I., Farlik, M., Halbritter, F., G€unther, P., Crozet, L.,
Jacome-Galarza, C.E., H€andler, K., Klughammer, J., Kobayashi, Y., et al.
(2016). Specification of tissue-resident macrophages during organogenesis.
Science 353, aaf4238.
McKenna, H.J., Stocking, K.L., Miller, R.E., Brasel, K., De Smedt, T.,
Maraskovsky, E., Maliszewski, C.R., Lynch, D.H., Smith, J., Pulendran, B.,
et al. (2000). Mice lacking flt3 ligand have deficient hematopoiesis affecting he-
matopoietic progenitor cells, dendritic cells, and natural killer cells. Blood 95,
3489–3497.
Immunity 47, 374–388, August 15, 2017 387

Miller, J.C., Brown, B.D., Shay, T., Gautier, E.L., Jojic, V., Cohain, A., Pandey,
G., Leboeuf, M., Elpek, K.G., Helft, J., et al.; Immunological Genome
Consortium (2012). Deciphering the transcriptional network of the dendritic
cell lineage. Nat. Immunol. 13, 888–899.
M€uller-Schoop, J.W., Wang, S.P., Munzinger, J., Schl€apfer, H.U., Knoblauch,
M., and Tammann, R.W. (1978). Chlamydia trachomatis as possible cause of
peritonitis and perihepatitis in young women. BMJ 1, 1022–1024.
Muzumdar, M.D., Tasic, B., Miyamichi, K., Li, L., and Luo, L. (2007). A global
double-fluorescent Cre reporter mouse. Genesis 45, 593–605.
Ng, L.G., Hsu, A., Mandell, M.A., Roediger, B., Hoeller, C., Mrass, P.,
Iparraguirre, A., Cavanagh, L.L., Triccas, J.A., Beverley, S.M., et al. (2008).
Migratory dermal dendritic cells act as rapid sensors of protozoan parasites.
PLoS Pathog. 4, e1000222.
Ovchinnikov, D.A., van Zuylen, W.J., DeBats, C.E., Alexander, K.A., Kellie, S.,
and Hume, D.A. (2008). Expression of Gal4-dependent transgenes in cells of
the mononuclear phagocyte system labeled with enhanced cyan fluorescent
protein using Csf1r-Gal4VP16/UAS-ECFP double-transgenic mice.
J. Leukoc. Biol. 83, 430–433.
Poltorak, A., He, X., Smirnova, I., Liu, M.Y., Van Huffel, C., Du, X., Birdwell, D.,
Alejos, E., Silva, M., Galanos, C., et al. (1998). Defective LPS signaling in
C3H/HeJ and C57BL/10ScCr mice: mutations in Tlr4 gene. Science 282,
2085–2088.
Prickett, T.C., McKenzie, J.L., and Hart, D.N. (1988). Characterization of inter-
stitial dendritic cells in human liver. Transplantation 46, 754–761.
Reich, M., Liefeld, T., Gould, J., Lerner, J., Tamayo, P., and Mesirov, J.P.
(2006). GenePattern 2.0. Nat. Genet. 38, 500–501.
Robb, L., Drinkwater, C.C., Metcalf, D., Li, R., Kontgen, F., Nicola, N.A., and
Begley, C.G. (1995). Hematopoietic and lung abnormalities in mice with a
null mutation of the common beta subunit of the receptors for granulocyte-
macrophage colony-stimulating factor and interleukins 3 and 5. Proc. Natl.
Acad. Sci. USA 92, 9565–9569.
Rogers, H.W., and Unanue, E.R. (1993). Neutrophils are involved in acute,
nonspecific resistance to Listeria monocytogenes in mice. Infect. Immun. 61,
5090–5096.
388 Immunity 47, 374–388, August 15, 2017
Saederup, N., Cardona, A.E., Croft, K., Mizutani, M., Cotleur, A.C., Tsou, C.L.,
Ransohoff, R.M., and Charo, I.F. (2010). Selective chemokine receptor usage
by central nervous system myeloid cells in CCR2-red fluorescent protein
knock-in mice. PLoS ONE 5, e13693.
Sakaue-Sawano, A., Kurokawa, H., Morimura, T., Hanyu, A., Hama, H.,
Osawa, H., Kashiwagi, S., Fukami, K., Miyata, T., Miyoshi, H., et al. (2008).
Visualizing spatiotemporal dynamics of multicellular cell-cycle progression.
Cell 132, 487–498.
Sasmono, R.T., Oceandy, D., Pollard, J.W., Tong, W., Pavli, P., Wainwright,
B.J., Ostrowski, M.C., Himes, S.R., and Hume, D.A. (2003). Amacrophage col-
ony-stimulating factor receptor-green fluorescent protein transgene is ex-
pressed throughout the mononuclear phagocyte system of the mouse.
Blood 101, 1155–1163.
Scott, C.L., Zheng, F., De Baetselier, P., Martens, L., Saeys, Y., De Prijck, S.,
Lippens, S., Abels, C., Schoonooghe, S., Raes, G., et al. (2016). Bonemarrow-
derived monocytes give rise to self-renewing and fully differentiated Kupffer
cells. Nat. Commun. 7, 10321.
Serbina, N.V., and Pamer, E.G. (2006). Monocyte emigration from bone
marrow during bacterial infection requires signals mediated by chemokine re-
ceptor CCR2. Nat. Immunol. 7, 311–317.
Tamoutounour, S., Guilliams, M., Montanana Sanchis, F., Liu, H., Terhorst, D.,
Malosse, C., Pollet, E., Ardouin, L., Luche, H., Sanchez, C., et al. (2013).
Origins and functional specialization of macrophages and of conventional
and monocyte-derived dendritic cells in mouse skin. Immunity 39, 925–938.
Wang, J., and Kubes, P. (2016). A reservoir of mature cavity macrophages that
can rapidly invade visceral organs to affect tissue repair. Cell 165, 668–678.
Yamamoto, M., Sato, S., Hemmi, H., Hoshino, K., Kaisho, T., Sanjo, H.,
Takeuchi, O., Sugiyama, M., Okabe, M., Takeda, K., and Akira, S. (2003).
Role of adaptor TRIF in the MyD88-independent toll-like receptor signaling
pathway. Science 301, 640–643.
Zigmond, E., Samia-Grinberg, S., Pasmanik-Chor, M., Brazowski, E., Shibolet,
O., Halpern, Z., and Varol, C. (2014). Infiltrating monocyte-derived macro-
phages and resident kupffer cells display different ontogeny and functions in
acute liver injury. J. Immunol. 193, 344–353.

STAR+METHODS
KEY RESOURCES TABLE
REAGENT or RESOURCE SOURCE IDENTIFIER
Antibodies
Anti-CD19 conjugate BD PharMingen 1D3; RRID:AB_395050 for flow cytometry
Anti-CD3 conjugate BD PharMingen 145-2C11; RRID:AB_312673 for flow cytometry
Anti-NK1.1 conjugate ebioscience PK136; RRID:AB_466051 for flow cytometry
Anti-CD45 conjugates BD PharMingen 30-F11; RRID: AB_394003 for flow cytometry;
RRID: AB_394611 for in vivo labeling
Anti-CD11b conjugates BioLegend M1/70; RRID: AB_2566568 for flow cytometry;
RRID: AB_312791 for in vivo labeling
Anti-Ly6G conjugate BioLegend 1A8; RRID: AB_1186104 for in vivo labeling
Anti-Ly6C conjugates BioLegend HK1.4; RRID: AB_2562353 for flow cytometry;
RRID: AB_1186132 for in vivo labeling
Anti-CD64 conjugates BioLegend X54-5/7.1.1; RRID: AB_2566561 for flow cytometry;
RRID: AB_647241 for in vivo labeling
Anti-F4/80 conjugates BioLegend BM8; RRID: AB_893478 for flow cytometry;
RRID: AB_893486 for in vivo labeling
Anti-CD11c conjugates BioLegend N418; RRID: AB_830649 for flow cytometry;
RRID: AB_313776 for in vivo labeling
Anti-CD103 conjugates BD PharMingen M290; RRID: AB_396732 for both flow cytometry
and in vivo labeling
Anti-Tim4 conjugates BD PharMingen RMT4-54; RRID: AB_2201843 for both flow cytometry
and in vivo labeling
Anti-CX3CR1 conjugates BioLegend SA011F1; RRID: AB_2565697 for flow cytometry;
RRID: AB_2564315 for in vivo labeling
Anti-Langerin conjugate ebioscience eBioRMUL.2; RRID: AB_494070 for in vivo labeling
Anti-IA/IE conjugates BioLegend M5/114.15.2; RRID: AB_493527 for flow cytometry;
RRID: AB_313323 for in vivo labeling
Anti-CD115 conjugate BioLegend AFS98; RRID: AB_1937253 for in vivo labeling
Anti-CD11c conjugated to 142 Nd In-house N418
Anti-CD64 conjugated to 143 Nd In-house X54-5/7.1
Anti-CD16/32 conjugated to 144 Nd Fluidigm 93
Anti-F4/80 conjugated to 146 Nd Fluidigm BM8
Anti-CD45 conjugated to 147 Sm In-house 30-F11
Anti-CD11b conjugated to 148 Nd In-house M1/70
Anti-CD19 conjugated to 149 Sm In-house 6D5
Anti-CD3e conjugated to 152 Sm In-house 145-2C11
Anti-CD335 conjugated to 153 Eu Fluidigm 29A1.4
Anti-NK1.1 conjugated to 158 Gd In-house PK136
Anti-B220 conjugated to 159 Tb In-house RA3-6B2
Anti-CD103-FITC Biolegend 2E7; RRID: AB_10709438
Anti-Siglec-F conjugated to 162 Dy In-house E50-2440
Anti-CD301 conjugated to 164 Dy In-house LOM14
Anti-CD326 conjugated to 165 Ho Fluidigm G8.8
Anti-TIM4 conjugated to 166 Er In-house RMT4-54
Anti-CX3CR1 conjugated to 170 Er In-house SA011F11
Anti-IA/IE conjugated to 174 Yb In-house M5/114.15.2
Anti-Ly6C conjugated to 175 Lu In-house HK1.4
Anti-Ly6G conjugated to 176 Yb In-house 1A8
(Continued on next page)
Immunity 47, 374–388.e1–e6, August 15, 2017 e1

Continued
REAGENT or RESOURCE SOURCE IDENTIFIER
Anti-FITC conjugated to 160 Gd In-house FIT-22
Anti-GFP conjugated to 169 Tm Fluidigm FM264G
GoInVivo Purified Rat IgG1, k Isotype Ctrl BioLegend RTK2071
Purified NA/LE Rat Anti-Mouse CSF-1 BD PharMingen 5A1; RRID: AB_396901
Purified Rat Anti-Mouse CSF-1R Amgen M279
Chemicals, Peptides, and Recombinant Proteins
DAPI Biolegend 422801
LPS from E.Coli Sigma L4130
Collagenase IV from Clostridium
histolyticum
Sigma C5138
DNase I Roche Cat#04716728001
Critical Commercial Assays
Ovation Pico WTA System V2 NuGEN 3302
RNeasy Mini Kit QIAGEN 74104
Deposited Data
Raw and analyzed data This paper ArrayExpress: E-MTAB-5932
Experimental Models: Organisms/Strains
C57BL/6 Australian BioResources
B6-SJL Australian BioResources Ptprca Pepcb/BoyJ
Flt3l�/� McKenna et al., 2000 C57BL/6-Flt3Ltm1Imx/ Flt3Ltm1Imx; RRID: MGI:3656072
Csf2rb�/� Robb et al., 1995 Csf2rbtm1Cgb/ Csf2rbtm1Cgb; RRID: MGI:3723079
Ccr2�/� Boring et al., 1997 B6.129S4-Ccr2tm1Ifc/J
Tlr4�/� Poltorak et al., 1998 Tlr4lps-del/ Tlr4lps-del; RRID: MGI:3588730
Myd88�/� Yamamoto et al., 2003 Myd88�/�
Ccl5�/� Makino et al., 2002 Ccl5tm1Hso/Ccl5tm1Hso; RRID: MGI:2660697
Il-34�/� Greter et al., 2012b Il34LacZ/LacZ
Cxcr5�/� Forster et al., 1996 Cxcr5tm1Lipp/ Cxcr5tm1Lipp; RRID: MGI:2658681
Itgax-EYFP Lindquist et al., 2004 Itgax (CD11c) EYFP
MacGreen Sasmono et al., 2003 B6N.Cg-Tg(Csf1r-EGFP)1Hume; RRID:
IMSR_JAX:018549
ROSAmT/mG Muzumdar et al., 2007 B6.129(Cg)Gt(ROSA)26Sortm4
(ACTB_tdTomato,_EGFP)Luo/J
Lyz2-EGFP Faust et al., 2000 B6.129(Cg)-Lyz2tm1.1Graf; RRID: MMRRC_012039-MU
Cx3cr1-EGFP Jung et al., 2000 Cx3cr1tm1Litt/ Cx3cr1tm1Litt; RRID: MGI: 4834191
Cd207-EGFP Kissenpfennig et al., 2005 B6.129S2-Cd207tm2Mal/J; RRID: IMSR_JAX:016939
Ccr2-RFP Saederup et al., 2010 B6.129(Cg)-Ccr2tm2.1Ifc/J; RRID: IMSR_JAX:017586
Fucci-G1-#639 and FucciS/G2/M-#474 Sakaue-Sawano et al., 2008 B6.Cg-Tg(FucciS/G2/M)#474BsiTg(FucciG1)#639Bsi/Rbrc
MacBlue Ovchinnikov et al., 2008 Tg(Csf1r*-GAL4/VP16,UAS-ECFP)1Hume;
RRID: IMSR_JAX:026051
Software and Algorithms
GenePattern Broad Institute N/A
GraphPad Prism 6 GraphPad Software Inc http://www.graphpad.com/scientific-software/prism/
FlowJo 2 (v9.8) FlowJo https://www.flowjo.com/solutions/flowjo
IMARIS software (v7.6) Bitplane N/A
CONTACT FOR REAGENT AND RESOURCE SHARING
Further information and requests for resources and reagents should be directed to Lead Contact, Patrick Bertolino (p.bertolino@
centenary.org.au).
e2 Immunity 47, 374–388.e1–e6, August 15, 2017

EXPERIMENTAL MODEL AND SUBJECT DETAILS
MiceAll experimental procedures involving mice were carried out according to protocols approved by relevant institutional Animal Ethics
Committees andwere performed according to relevant national guidelines for husbandry and experimentation on laboratory animals.
All mice except germ free animals were housed in the animal facilities of the Centenary Institute, Biological Resource Centre (BRC),
A*STAR, or QIMR Berghofer Medical Research Institute under specific pathogen-free conditions. Cd207-EGFP mice were kindly
provided by Prof B Malissen, Mac-Blue mice by Dr Matthew Sweet and both TLR4 and MyD88 deficient mice by Dr H Wu. Germ
free mice were housed in sterile isolators and provided by the WEHI (Melbourne, Australia). The mouse lines used are listed in the
KEY RESOURCES TABLE and procedures are described below.
METHOD DETAILS
Antibiotic treatmentOnweaning day, 3weeks oldmicewere treatedwith the following antibiotics ad libitum in drinking water for 2weeks: ampicillin (1g/L),
vancomycin (0.5g/L), neomycin (1g/L) and metronidazole (1g/L).
Bacterial culturesmCherry-expressingMycobacterium bovis bacillus Calmette–Guerin (BCG)-Pasteur were cultured in Middlebrook 7H9 broth (Difco,
Detroit, MI) supplemented with 0.5% glycerol, 0.05% Tween 80 and 10% albumin-dextrose-catalase enrichment (Difco, Detroit, MI)
in the presence of 50mg/ml kanamycin, at 37�C. Mid-logarithmically grown, single bacterial cell cultures were sonicated for 10 s, and
concentration was determined by measuring OD at 600 nm. L. monocytogenes (EGD strain) was grown until exponential phase in
tryptic soy broth (Difco, Detroit, MI). Bacterial stocks were frozen in 20% (v/v) glycerol and stored at �80�C.
Bacterial infectionsC57BL/6 mice pretreated 3 days prior with anti-CSF-1R (M279) mAb or isotype control antibody were injected i.p. with 2e5 CFU of
either BCG or Listeria. The numbers of viable bacteria in the liver and peritoneal cavity were determined by plating serial dilutions of
organ homogenates and peritoneal lavage on tryptic soy agar plates (Difco, Detroit, MI) for Listeria or on oleic acid-albumin-dextrose-
catalase (OADC)-enriched Middlebrook 7H10 agar (Difco, Detroit, MI) for BCG. Enumeration of bacterial colonies was performed af-
ter incubation at 37�C for 24h-48h (Listeria) or 2-3 weeks (BCG).
Liver transplantationItgax-YFP donor livers were dissected from surrounding tissues and a stent placed in the bile duct. Cholecystectomywas performed.
Livers were perfused via the portal vein with University of Wisconsin solution, then excised. Donor livers were kept at 4�C while
awaiting engraftment. Following excision of recipient TdTomato livers, Itgax-YFP donor livers were placed orthotopically and the in-
frahepatic vena cava and portal vein anastamosed using the cuff technique; the suprahepatic inferior vena cava was anastamosed.
The common bile duct was anastomosed over the stent; hepatic re-arterialization was not performed. Anhepatic times were less
than 25 min.
ParabiosisFemale mice were anesthetized using 2.5% avertin (15 mL/kg), shaved at the corresponding lateral sides of the body, and then sur-
gically joined. Briefly, for each mouse, matching skin incisions were made from the olecranon to the knee joint. The subcutaneous
fascia was then dissected to create about 1/2 cm of free skin. The matching olecranon and knee joints were attached to each other
by a single 2-0 silk suture and tie, and the dorsal and ventral skins were approximated by staples or continuous suture. After surgery,
the mice were treated with Baytril (0.05-2mg/kg s.c.) and buprenorphine (5-20 mg/kg s.c.) for 3 days and allowed to recover for
8 weeks. Mice were analyzed after 8 weeks.
BM chimerasTibias, femurs, and humeruses from Itgax-GFP BM donor mice were flushed with RPMI 1640 (GIBCO) supplemented with 10% fetal
calf serum (GIBCO BRL), 2 mmol L-glutamine (JRH Biosciences, Lenexa, KS), and 50 mmol 2-mercaptoethanol (Sigma). Bone
marrow cells were washed 3 times before being counted, and 5 3 106 cells were injected intravenously into 7–8-week-old
C57BL/6 mice that had been lethally irradiated at 950 R. BM chimeric mice were analyzed at 8 weeks post-reconstitution.
CSF-1R monoclonal antibody treatmentFor single dose treatment, mice were injected IP with 400 mg of either anti–CSF-1R Ab (M279; Amgen) or rat IgG control Ab. For
multiple dose treatment, mice were injected IP with 400 mg of either anti–CSF-1R Ab (M279; Amgen) or rat IgG control Ab twice
per week for 3 weeks.
Immunity 47, 374–388.e1–e6, August 15, 2017 e3

Purification of monocytes and peritoneal macrophages for adoptive transferCells from peripheral blood, bone marrow and spleen of MacGreen mice were pooled. Monocytes were first enriched for with anti-
CD11b conjugated MACS beads (Miltenyi), then flow sorted for GFP expression within a FSC/SSC gate appropriate for monocytes.
The sorted population contained approximately 40% monocytes and 4% macrophages. The remaining populations were CD11b
negative and contained around 9% neutrophils, 8% dendritic cells, with the remainder likely B cells. CX3CR1gfp/gfp monocytes
were enriched via the same sorting strategy, which led to GFP+ monocyte purity of > 90%.
To purify peritoneal MacGreen macrophages, cells were first enriched using anti-CD11b conjugated MACS beads (Mylteni), then
flow sorted for GFP expression by selecting leucocytes according to their size and excluding doublets. Granulocytes, B cells and
eosinophils were excluded using anti-CD19 and Ly6G antibodies. A cell mixture containing both large (LPM) and small peritoneal
macrophages (SPM) was used for transfer.
0.53 106 monocytes or peritoneal macrophages were adoptively transferred i.v. into C57BL/6 mice pre-treated, 7 days prior, with
400 mg of anti–CSF-1R Ab (M279; Amgen). Livers were harvested at 9 days after monocyte transfer to image the hepatic capsule
using 2PM.
Surgery for intravital multiphoton imagingMice were anesthetized by IP injection of ketamine/xylazine (80mg/10mg/kg). The abdomen and left flank were then shaved. The
peritoneal cavity was accessed via midline and left subcostal incisions. The falciform ligament was resected and mice placed in a
left lateral recumbent position. The left lobe was gently exteriorized onto a glass coverslip attached to a custom-made imaging stage.
The liver was covered with a small sheet of plastic wrap to limit motion artifacts. Abdominal organs and the incision were then packed
with moist gauze, and the imaging platform sealed to prevent dehydration, leaving a small window on the upper right flank for further
subcutaneous half-dose anesthetics injections as required.
In some experiments, following the surgery described above, the left liver lobe was exteriorized onto a glass coverslip with a pre-
viously deposited 20ml drop of PBS containing either an indicated concentration of LPS, 1 3 106 mCherry-BCG or Crimson-conju-
gated 200nm FluoSpheres carboxylate–modified microspheres (Invitrogen).
Multiphoton imagingIn most experiments used for multiphoton imaging analysis, cells were labeled in vivo by injecting relevant fluorochrome-conjugated
antibodies intravenously via the tail vein. Some large high-resolution multi-photon images were generated by stitching several fields
together following acquisition using the stitching function of the ImSpector software.
For live intravital imaging, animal were maintained at 35�C in a blacked-out environmental chamber with controlled heated air.
Maintenance of a core body temperature within a narrow 37 ± 1�C range was monitored using a rectal probe. Live animals prepared
as described above or tissue explants were imaged via multiphoton laser scanning microscopy, using a Nikon Ti-U inverted fluores-
cencemicroscopewith a 25x Nikonwater immersion objective (1.1 NA,WD 2mm) and a dedicated single-beam LaVision TriM Scope
I (LaVision Biotec: Germany) controlled by Imspector software (LaVision). The microscope was outfitted with one Ti:Sapphire laser
(MaiTai DeepSee: Spectra-physics) and one Synchronously Pumped Optical Parametric Oscillator (OPO) pumped by a Chameleon
Ultra II Ti:Sapphire laser (Coherent). Emission wavelengths were collected with ultrasensitive photomultiplier tubes (GaSP Hama-
matsu) for 412-472 nm (CFP, second harmonic signal), 490-520 nm (GFP), 500-550 nm (YFP), 573-633 nm (TdTomato, PE) and
650-673 nm (Alexa647). Image stacks of up to 60 optical sections with 1 to 3 mm z-spacing were acquired. The DeepSee laser
was tuned to 830 or 940 nm and OPO was tuned to 1080nm. Parfocal alignment of lasers was adjusted using fluorescent beads
before each experimental session. Each xy-plane spanned 512 pixels in each dimension with a minimal resolution of 0.86 mm per
pixel. Imaris software (Bitplane) was used for 3D rendering and analysis of image stacks.
Isolation of liver myeloid cells and flow cytometryIsolation and detection of liver immune cells together with hepatocytes and other cell types was performed via liver perfusion. Livers
were exposed and retrograde perfusion performed in situ with 1mg/ml collagenase type IV (Sigma). Livers were then excised and
minced, followed by further enzymatic digestion for 30min at 37�C in HBSS containing 1mg/ml collagenase type IV and 1 mg/ml
DNase type I (Roche), and dissociation through a 100 mm-pore cell strainer (BD). After washing homogenates, hepatocytes and
debris were removed via Percoll gradient. Recovered cells were incubated with anti-CD16/CD32 antibody (2.4G2; BD Biosciences)
prior to staining to reduce non-specific FcR mediated staining. Samples were then stained with antibodies following standard pro-
cedures, washed twice and stained with DAPI (0.1 mg/ml) before acquisition on a 5 lasers Fortessa� flow cytometer (Becton
Dickinson). Analysis was carried out using FlowJo� software. The fluorochrome-conjugated antibodies (purchased from BD,
eBioscience, BioLegend, AbD Serotec, or R&D Systems) against cell surface molecules used are listed in the KEY
RESOURCES TABLE.
Epifluorescence Analysis of Liver SectionsLivers were perfused in situwith PBS followed by 10% formalin before excision. Livers were further incubated in 10% formalin, 10%,
then 30% sucrose in PBS buffer, before freezing in O.C.T. (TissueTek) in liquid nitrogen. 8-12 mm sections were cut on a cryostat
(Leica) at �13 to �15�C, before staining. MHC-II+ and F4/80+ or CSF-1 expression was detected using rat-anti-IA/IE (M5/114.5.2)
and rat-anti F4/80 (CI:A3-1) or anti-CSF-1 (5a1) respectively, followed by AlexaFluor647-conjugated anti-rat IgG (Invitrogen). Images
e4 Immunity 47, 374–388.e1–e6, August 15, 2017

were acquired using the epifluorescence Deltavision microscope. To generate a high-resolution mosaic image of the liver tissue,
stitching has been applied following data acquisition using the Stiching function of the Softworx software.
Electron microscopyLivers were exposed and retrograde perfusion performed in situ with a 23-gauge needle at a rate of 3 to 4 mL/min with phosphate-
buffered saline and fixative [1% glutaraldehyde, 4% paraformaldehyde, 2 mmol/L CaCl2, 2%(w/v) sucrose 0.1 mol/L cacodylate
buffer pH 7.4]. The livers were then removed, cut into small pieces and fixed in the same fixative for 1 hour at 4�C. Fixed tissue
was embedded in Spurr’s and LR White resin. Ultrathin (70-90 nm) sections were cut and collected on formvar-coated nickel slot
grids (ProSciTech, Australia). Fields of interest were photographed using a Hitachi H7100FA Transmission Microscope.
Cell isolation and sorting for transcriptomic microarray analysisEpidermal LCs fromCd207-EGFPmice were obtained from ears. Ear skin obtained from ears split into dorsal and ventral halves were
separated into epidermal and dermal sheets were treated with 5 U/mL dispase (Sigma-Aldrich), then digested with 2 mg/mL colla-
genase IV (Sigma-Aldrich) followed by filtration through an 80 mm stainless steel mesh. Liver cells (obtained as described above for
flow cytometry) and epidermal immune cell suspensions fromCd207-EGFPmicewere prepared and stained for flow cytometric anal-
ysis with cell populations identified as follows: LCMs (DAPI�CD103negGFPhi), liver CD103+ dendritic cells (DAPI�CD103hiGFPint), skin
LCs (DAPI-GFPhi). Cells were sorted directly into 500mm of Trizol� reagent (a minimum of 10,000 cells for each type depending on
experiment) using an Influx� sorter (BD). RNA was extracted following Trizol� manufacturer’s guidelines. RNA quality and quantity
was assessed using a Bioanalyser 2100 instrument (Agilent). cDNA was prepared and amplified using the Ovation RNA-Seq System
V2 kit (NuGen). Samples were then hybridized to Affymetrix Gene Arrays 1.0ST.
Pre-processing and data analysisRaw microarray data were downloaded from GEO from the following studies (GSE55606, GSE15907, GSE49358, GSE75225).
Unaffiliated downloaded or in house generated files in CEL format were integrated and normalized with Robust-Multi Array (RMA)
using themodule Expression File Creator of Gene Pattern (Reich et al., 2006). Combat module of Gene Pattern was utilized to remove
the undesired variation due to the different gender between some samples. From the resulting expression matrix, probes with un-
known gene symbol were excluded as per ImmGen guidelines. Furthermore, probes with a coefficient of variation (CV) within repli-
cates above 0.5 in at least one set of replicate were removed. Differentially expressed genes were detected using Comparative
Marker Selection module of Gene Pattern.
For PCA analysis only probes with CV above the 80th percentile were considered. Distances for hierarchical clustering were calcu-
lated as the Pearson’s correlation coefficient considering genes with CV above 95th percentile.
To identify enriched gene ontologies, pathways and processes, we used the Functional Annotation Clustering tool in DAVID.
Mass cytometry sample preparation and analysisSingle cell suspensions of liver mononuclear cells were centrifuged at 350xg at 4�C for 5 min and the supernatant removed by aspi-
ration. Cells were resuspended in 1mL CyTOF staining buffer (CFB – PBS containing 0.1% BSA, 2mM EDTA and 0.05% sodium
azide) and washed in CFB a second time. Primary antibody staining was performed using the antibodies listed in the KEY
RESOURCES TABLE and diluted in CFB, for 40 min on ice. A mixture of pre-conjugated (Fluidigm) and in house conjugated (using
Maxpar X8 labeling kits – Fluidigm) was used. Following primary antibody staining, cells were washed as described previously using
1mLCFB and resuspended in 0.5mL of a 1/4000 dilution of cisplatin viability reagent (Cell-ID Cisplatin – Fluidigm, Ca) in PBS for 5min
at room temperature. Cisplatin staining was terminated by addition of 1mL of CFB and cells were washed twice by centrifugation.
Secondary antibody staining was then performed using the antibodies listed in the KEY RESOURCES TABLE for 20 min on ice,
and cells were then washed twice with 1mL CFB. Next, cells were resuspended in 400 mL of 4% paraformaldehyde in PBS (PFA)
and fixed at room temperature (RT) for 20 min, then washed twice by centrifugation with 1mL CFB. Cell pellets were resuspended
in 1mL permeabilization buffer (PB - Ebioscience), pelleted (900xg, 10 min, RT) and the supernatant aspirated. Following a second
wash in PB, cells were stained with anti-GFP antibody diluted in PB (40min, RT). Cells were then washed twice with 1mL PB. Fixation
and nuclear staining was performed in 400 mL of 4%paraformaldehyde containing 0.1 mMcell-ID� Intercalator-Ir (Fluidigm) at 4�C for
48 hours. On the day of sample acquisition, cell suspensions were washed twice by centrifugation in distilled water (1mL, 900xg,
10 min, RT) and resuspended in water containing a 1/10 dilution of EQ-beads (fluidigm) at a concentration of �1x10⁶ cells/mL.
Data was acquired on a Helios mass cytometer (Fluidigm), and post-acquisition signal normalization was performed using Helios
control software (Fluidigm).
Mass cytometry data analysisInitial gating for Figure 2F was performed using FlowJo v10.2 (Treestar). CD45+, GFPhi cells were mapped onto Lin- (CD3-, CD19-,
B220-, NK1.1-, CD335-) liver cells using t-Distributed Stochastic Neighbor Embedding (tSNE). Dimensionality reduction was per-
formed using tSNE on all CD45+, GFPhi cells and 10% of Lin- by Cytobank. Siglec-F, CD301, TIM4, CD103, CX3CR1, Ly6C,
CD11c, CD64, CD16/32, F4/80, CD11b, IA/IE and Ly6G were used as clustering parameters, with iterations = 2000, perplexity =
100, and theta = 0.5. For unbiased identification of macrophage subsets expressing GFP (Suppl. Figure S2C), macrophages
(Lin-, Ly6G-, Siglec-F-, MHC-II+, CD11b+, Ly6Clo, F4/80int/hi, CD64hi) were manually gated using FlowJo and dimensionality reduction
Immunity 47, 374–388.e1–e6, August 15, 2017 e5

was performed by tSNE (clustering parameters: CD301, TIM4, CD103, CX3CR1, CD16/32; iterations = 1000, perplexity = 30,
theta = 0.5).
QUANTIFICATION AND STATISTICAL ANALYSIS
Results are expressed as mean ± SEM. All statistical analyses were performed in Prism 5 (GraphPad Software). Statistical analysis
was performed using a Mann-Whitney test.
DATA AND SOFTWARE AVAILABILITY
The microarray data was uploaded onto the ArrayExpress database. The accession number is ArrayExpress: E-MTAB-5932.
e6 Immunity 47, 374–388.e1–e6, August 15, 2017
Copyright © 2022 FDOKUMEN