A LITERATURE REVIEW OF PUBLIC FOOD DISTRIBUTION ...
69
WORKING PAPER NO. 1 A LITERATURE REVIEW OF PUBLIC FOOD DISTRIBUTION IN BANGLADESH JEFFREY ALWANG INTERNATIONAL FOOD POLICY RESEARCH INsrlTUTE ' ...
-
Upload
khangminh22 -
Category
Documents
-
view
2 -
download
0
Transcript of A LITERATURE REVIEW OF PUBLIC FOOD DISTRIBUTION ...

WORKING PAPER NO. 1
A LITERATURE REVIEWOF PUBLIC FOODDISTRIBUTION INBANGLADESH
JEFFREY ALWANG
INTERNATIONAL FOOD POLICY RESEARCH INsrlTUTE '
...

...
Working papers of the Intematlonal Food Policy Research Institute encompass awld~ range of subjects drawn from Its research programs. The paper~rlmarJly
data analyses, historical descrlpflons, or case studles-contaln Information that IFPRIbelieves may be of Interest to others. Working papers undergo Informal review butdo not necessarily present flnal research results.

THE PUBLIC FOOD DISTRIBUTION SYSTEM IN BANGLADESH:
A REVIEW OF PAST IMPACT STUDIES AND A PLAN FOR FURTHER ANALYSIS
Jeffrey Alwang
Working Papers on Food Policy in Bangladesh, No.1
International Food Policy Research InstituteWashington, D.C.
September 1991
CONTENTS
Foreword • . . • • • • • . • • • . . . . • . v
1. Introduction . . . • • ..... . • 1
2. An Overview of the Public Food Distribution System ••... 2
3. Literature Review. . • • . . . . • . . . . • . . .. .. 9
4. The IFPRI Plan for Studying Nutrition and Consumption . 25
5. Design of a Field Study . • • • • • • • • . • 38
6. Conclusion .•••. 58
Bibliography • . • •• •• .••• 59
- iii -

TABLES
1. Publ;c Food O;str;but;on System offtake and totalavan abn Hy of rice and wheat, 1979-89 .•....•..•. 3
2. Structure of Publ;c Food O;str;but;on System (PFOS) offtake,1973-84 . . . . . . . . . . . . . . . . . . . . . . . . 4
3. Comparison of results from nat;onal nutr;tion surveysfor rural Bangladesh. . . . . . . . . . . . . . . . • . 18
4. Compar;son of nutr;tional status ;nd;cators, by gender,for rural Bangladesh . . . . . . • • . . . . . • . . • 20
5. Nutrit;onal status from the Helen Keller Internat;onalxerophthalm;a prevalence survey, by d;v;s;on .. . . . 20
6. Summary of the find;ngs from m;cro-level stud;es ofnutr;tional status ;n Bangladesh . . . . 23
7. Criter;a for 10 sample v;llages
- iv -
47
..

FOREWORD
In early 1989, the International Food Policy Research Instituteentered into a contract with the U.S. Agency for InternationalDevelopment (USAID), Dhaka (under Contract No. 388-0027-C-00-9026-00) toconduct research on food policies and to extend technical assistance tothe Ministry of Food, Government of Bangladesh. The Bangladesh FoodPolicy Project is the basis for a tripartite collaboration betweenIFPRI, the Government of Bangladesh, and USAID, Dhaka. This projectconsists of four subprojects and a large number of well-defined researchtopics. The subprojects together constitute a comprehensive approachfor addressing the food policy problems of Bangladesh. The subprojectsinclude the following studies: a price stabilization frameworkencompassing public and private marketing, evaluation of the effects oftargeted distribution of fQodgrains on consumption and nutrition,diversification of agriculture as a source of sustained growth ofproduction, and capacity bUilding in food policy analysis.
Since the project includes a nutrition and consumption component,we thought it necessary to survey past studies on this component beforedesigning a work plan. Jeffrey Alwang, currently working as anassistant professpr at the Virginia Polytechnic Institut~ and StateUniversity, was hired as a consultant to visit Bangladesh and prepare areport. This report reviews existing literature on nutrition issues inBangladesh, examines ongoing research on nutrition policies in variousorganizations, and formulates an approach for research on nutrition andconsumption issues under the project.
The report by Alwang provides a starting point and an inventory ofwhat has been studi ed and what needs to be done. It is the fi rstworking paper in a series of papp,rs under the Bangladesh Food PolicyProject. We believe that this documentation will enrich the stock ofinformation on food policy in Bangladesh.
Ra i sudtH n Ahmed
Series Editor and Project Director,Bangladesh Food Policy Project
- v -

1. INTRODUCTION
Bangladesh is an extremely poor country, with large numbers offamilies living below the poverty level and high rates of malnutrition.There have been numerous studies of nutrition at the national, regional,and local levels, and many programs have been designed to alleviatemalnutrUion. Some of these programs are part of the Public FoodDistribution System (PFDS). It is an important element of the foodeconomy of Bangladesh, ostensibly designed to improve access to andconsumption of foodgrains by certain target groups. In addition, somecomponents of the system are used to moderate fl uctuat ions in foodprices.
Given the large quantities of grains moving through the PFDS, itseffectiveness is an important concern. The U.S. Agency forInternational Development (USAID) contracted with the International FoodPolicy Research Institute (IFPRI) for a three-year study of the PFOS,which is currently under way. The explicit goals of the study are toproduce a flexible model to determine the optimal stock of grains and toprovide policymakers with a tool to evaluate stock levels on a real-timebasis; to develop a system to intervene in local food markets usingprices rather than quantities as the targeting mechanism; and to providea detailed study of the effects of the various PFDS programs on theconsumption and nutrition of the rural poor.
This paper presents the plan of work for achieving the third goal.Chapter 2 describes the various PFDS delivery programs; chapter 3 thenreviews a number of past studies of PFDS effectiveness and ofnutritional status in Bangladash. An outline of the plan of work forthe IFPRI consumption/nutrition team is presented in Chapter 4. Amajorcomponent of that plan is a field study to measure the impact of thePFDS. Chapter 5 then provides details on the design of the field study.Some conclusions are presented in Chapter 6.

2. AN OVERVIEW OF THE PUBLIC FOOD DISTRIBUTION SYSTEM
Since its inception in 1943, the PFDS has provided foodgrains tocertain target groups at reduced or zero cost. In 1986 there were eightmonetized and four nonmonetized programs under the PFDS. The monetizedprograms included: Statutory Rationing, covering six urban centers;Essential Priorities, aimed at the armed forces, police, and other"essentia1" forces; Other Pri ori ties, coveri ng government employeesoutside of the Statutory Rationing areas; Large Employers, providingfood subsidies for targeted people working for employers of more than 10employees; Modified Rationing, providing subsidies for the poor outsidethe Statutory Rationing areas; Flour Mills, allotting wheat todesignated mills at subsidized rates; Open Market Sales, through whichthe government releases its stocks directly into the rice and wheatmarkets to mediate any sharp increases in market prices (it is thegovernment's principal means of influencing market prices); and MarketOperations. The nonmonetized channels included Food for Work, providingwheat in exchange for labor in mostly rural areas; Canal Digging;Vulnerable Group Feeding, now called Vulnerable Group Development,providing grains for mothers and children in certain designated groups;and Gratuitous Relief, providing free grains in emergencies.
Tables 1 and 2 present a picture of the size of the PFDS relativeto the total availability of foodgrains in Bangladesh and of therelative importance of each program. As a whole the PFDS issignificant: it accounted for 10-17 percent of the total offtake from1979/80 to 1984/85 and currently accounts for roughly 15 percent(Ministry of Food. 1986). The quantity delivered through the PFDSreached 2.49 million metric tons in 1988 (World Food Programme 1989).'The nonmonetized channels grew steadily in importance after 1983/84: in1988/89, 56 percent of public distribution went through these programs,with Food for Work and Vulnerable Group Development receiving 44.5percent of the total PFDS offtake (World Food Programme 1989).
As a result of a continuing effort to reduce the subsidies in themonetized programs, the importance of the Statutory Rationing andModified Rationing channels (the most important subsidized monetizedones) has declined since the 1960s (Ministry of Food 1986). AMinistry
, Throughout this report "tons" refers to metrIc tons.
II"

- 3 -
Table I--Public Food Distribution System offtake and totalavailability of rice and wheat, 1979-89
Public rood Diltr1butiOD By.teaofftlk. total Availability
'.ar 110. Wh.at 110. Wheat
(1,000 metric tons)
1979/80 702 1,738 14,326 14,2461980/81 515 1,031 13,919 14,3191981182 770 1,297 16,042 15,2591982/83 496 1,441 12,718 15,6631983/84 504 1,548 15,750 15,7961984/85 407 2,173 16,958 16,5881985/86 373 1,168 n.a. n.a.1986/87 495 1,624 n.a. n.a.1987/88 464 2,031 n.a. n.a.1988/89(p) 596 2,195 n.a. n.a.
Source: For Public Food Distribution System: World Food Prograllllle, "Bangladesh Foodgrain Forecast,4/89" (Dhaka, April 10, 1989, Mhneographed); for total availability: Ministry of Food,"Report on the Existing System of Public Food Distribut1~n In Bangladesh and Proposal forRestructuring," paper prepared by BECON Consultants, Dhal a, 1986, Mhneographed.
Note: n.a. indicates that the data were not available.(p) Indicates data is a projection.
of Food report noted that reduction in the subsidies would not adverselyaffect the total consumption of foodgrains. 2
Partly because of the well-documented failure of the ModifiedRationing channel to provide consistent supplies (Ministry of Food 1986;Institute of Nutrition and Food Science 1979, 1980), and partly becauseof 1arge quant ities est imated to have 1eaked out of the system, theprogram was discontinued in 1989 and was replaced wi th a new RuralRationing scheme.
The Statutory Rationing Program, which the government initiated indensely populated cities, is now operating in Dhaka, Narayanganj,Chittagong, Rangmate, Khulna, and Rajshahi. Since 1974, employees ofgovernment, semi-government, and autonomous bodies have been eligiblefor a ration card. The weekly quota for cardholders is 500 grams ofrice, 1,500 grams of wheat, and 200 grams of sugar. The ratio of riceto wheat has changed over the years, with wheat steadily gaining a
2 A7.7 percent cut in the distribution of rations resulted in less than a 1 percent declinein the per capita consumption of food grains. Howevtr, this aggregate conceals distributionaleffects. More vulnerable groups would have had to be protected from these subsidy cuts.

- 4 -
Table 2--Structure of Public Food Distribution System (PFDS)offtake, 1973-84
1973/,.· 1976/77· 1910/81·ftm" 1975/76 1979/80 1983/..
(percent of total PFDS offtake) l".
Essential Priorities 5.3 5.5 5.0
Other Prioritips 12.7 19.5 19.6
Large Employers 5.1 4.3 3.1
Flour Mills 8.2 10.0 6.6
Open Market Sales/Market Operations 0.5 2.6 5.1
Statutory Rationing 24.5 32.1 15.5
Modified Rationing 34.5 18.4 18.7
Food for Work 2.6 13.9 20.0
Vulnerable Group Feeding 6.5 2.7 4.9
Other 4.0
Source: Ministry of Food, "Report on the Exist ing System of Public Food Distribut ion in Bangladeshand Proposal for Restructuring," report prepared by BECaN Consultants, Dhaka, 1986.
Note: The ellipses indicate ne9ligible amount, if any.
greater share. The number of eligible cardholders has declined: in1980, 67 percent of the urban population had cards, while in 1985, 49percent were eligible (EUREKA 1986). In addition, the StatutoryRationing subsidy decreased though the 1980s; currently for wheat, itstands at 6 percent of the Open Market Sales initial price, and isexpected to fall to zero within the next few months.
Under the Other Priorities Program, offtake increased in the early1980s to the point where 5.1 million people withdrew 387,000 tons in1984/85. Other Priorities prices are expet:ted to equal Open MarketSales initial prices in non-Statutory Rationi.1g areas within the nextfew months.
For both the Other Priorities and Statutory Rationing programs itis expected that cardholders will continue to hold cards, although notnecessarily to draw rations, even as the subsidies disappear. Thepossession of cards may help guarantee access to foodgrains during timesof local shortages.

- 5 -
The Modified Rationing Program, begun in 1949, was operated inareas without the Statutory Rationing Program. Eligib'llity wasrestricted to the poorest families, determined by the rolls of chowkfdar(tax collector). People who paid less than 10 taka (Tk) per year intaxes were eligible. Cardholders could acquire allotted rations ofwheat and rice at subsidized prices. The Modified Rationing Program wasdiscontinued in 1989 and was replaced by the Rural Rationing system,which was to be designed to avoid many of the well-documented problemswith the Modified Rationing Program (see the specific study descriptionsbelow).
The Essential Priorities Program is the only monetized channel(except for the new Rural Rationing Program) from which the subsidieshave not been eliminated. The subsidy has tended to be very large: in1985, Essential Priorities, prices averaged Tk 48 per maund3 and Tk 58per maund, respectively, for wheat and rice, while the StatutoryRationing prices for the same goods were Tk 167 and Tk 262 per maund.Offtake from the Essential Priorities Program has been constant,averaging about 4.5 percent of the total PFDS offtake.
Under the Flour Mills Program, automatic and compact flour mills(chakkis) are provided allocations of wheat that they mill and sell toany customer. The millers usually sell the flour to dealers in thelocal bazaars who in turn pass some price savings on to consumers (BECON1986). The flour mill operators are charged the price under the OpenMarket Sales Program, which traditionally was higher than the StatutoryRationing price but no longer is since the elimination of the StatutoryRationing subsidies.
In the BECON Consultants' report (1988) on the Modified RationingProgram, the authors urged the "chakkization" of all Modified Rationingwheat. They felt the chakkf operators were a better means of ensuringlocal distribution of the flour and that the chakkf system wasbeneficial to poorer consumers, who often needed credit or hadsufficient funds for only a small purchase. Modified Rationing dealersrarely extended credit and were unlikely to sell the extremely smallquantities the poor desired.
Open Market Sales are initiated thrqugh grain dealers when retailmarket prices for rice and wheat are higher than 15 percent above theofficially announced procurement prices in Statutory Rationing areas andare higher than 10 percent above the officially announced procurementprices in non-Statutory Rationing areas. As retail prices rise abovethe Open Market Sales initial prices, Open Market Sales stocks arereleased at a price equal to the initial Open Market Sales price plus 50percent of the excess of the market price over the initial Open Market
3 One maund is approximately 36.4 kilograms.
•

- 6 -
Sales price. Open Market Sales does not, then, have a fixed ceilingprice: the price follows the market price as it moves upward.
The Open Market Sales Program was started in 1979/80 to halt theprice rises attributable to consumer apprehension over a foodgrainshortfall. It was originally intended for use during the brief periodsbefore the aman and boro/aus harvests when prices rose. Many authors(Ministry of Food 1986; BECON 1988) have noted its potentialeffectiveness as a price stabilizer and have urged its more frequentuse. As Table 2 shows, the program has been applied more frequently inrecent years.
The Modified Rationing Program operated only rarely when themarket price suddenly rose. Under this program, foodgrains were soldthrough shops at Statutory Rationing program prices, and no ration cardwas needed to make purchases. During 1984/85, 8,000 tons weredistributed; since 1987/88, virtually no grain has moved through thischannel (World Food Programme 1989).
Under the large Employer Program, workers are allotted 31.25kilograms of wheat per month. They are able to obtain rice when itoccasionally becomes avail ab1 e. A total of 242,000 workers wereeligible for this program in 1984/85. In that year, 63,000 tons weredrawn (EUREKA 1986), for an average allotment of 5 kilograms per weekper worker. Thus, those eligible either did not participate regularlyor were not allocated their statutory amount. No studies of leakagefrom this program are known to have been conducted.
Under the Gratuitous Relief Program, assistance is distributed adhoc in cases of natural calamities, with households receiving a specialfree allotment of grains for a short period. The volume distributeddepends critically on the perceived extent of the damage caused by thecalamity. In 1984/85, a year of heavy flooding but questionable damageto agriculture, 100,000 tons of grains were distributed to selectedareas.
The Food for Work Program, introduced in 1973, is designed toprovide work for poor househo1d.s during the periods of slack employmentthat followed the end of the aman harvest in February. Additional goalsinclude the development of rural infrastructure and the promotion ofrural institutions and their ability to plan and administer. Food forWork projects include rural road (footpath) construction, embankment andother flood control projects, and construction of helicopter pads. Theprogram tends toward self-targeting of poor families because workers arepaid in wheat at a rate of 80 percent of the average agricUltural wagerate. Official wages are 52.57 seers of wheat per 1,000 cubic feet ofearth moved (1 seer is 0.93 kilogram) (Institute of Nutrition and FoodScience 1981); in practice, lower rates of pay have been common.

- 7 -
Administration of the Food for \lork Program was designed, in part,to improve the planning capabil ity of local governments. ProjectImplementation Committees of upazila and union officials were set up toplan and design the Food for Work schemes and to administer the projectsto completion. There has been some criticism of the upazila- and unionlevel planning arrangements, since a large proportion of the Food forWork projects have produced structures that are unusable for one reasonor another (CARE International 1988).
The Canal Digging Program, which presently is not in operation,was simi1ar to the Food for Work Program in that grain was paid toworkers for digging canals.
The Vulnerable Group Feeding Program (now called Vulnerable GroupDevelopment) is designed to provide distressed families--those withyoung children and pregnant and lactating women--with supplementary foodfor a two-year period. The objectives are as follows: incometransfer's, creation of income-generating activities, increased incomeearning capacity, and communication of basic health and food-relatedinformation to its recipients (World Food Programme 1988). Eligiblehouseholds are entitled to 32 kilograms of wheat per. month, although inpractice they receive 66 percent of this amount on average (World FoodProgramme 1988). Eligibility is determined by upazila ProjectImplementation Committees, with beneficiary cards distriboted to eachupazila by the Ministry of Relief and Rehabilitation and the Directorateof Relief and Rehabilitation. The cards are distributed based on astress rating compiled by the World Food Programme. Upazilas are putinto four categories--most distressed, moderately distressed, slightlydistressed, and average or least distressed--with the cards going to 6.5percent, 4.0 percent, 2.5 percent, and 1.5 percent of the population inthese categori es, respect ive1y. The government recorded a total of455,000 beneficiary famil ies in 1986/87, with 170,000 tons of wheatallocated to the program (World Food Programme 1988).
During emergencies, such as periods of heavy flooding, the numberof beneficiaries of the Vulnerable Group Development Program can beincreased temporarily. In September and October of 1988,1,564,112fdmilies received 148,390 tons of emergency wheat. The program can beexpanded quickly in an emergency, since the Ministry of Food generallyhas sufficient stocks in local supply depots; however, donors mustpromise to replenish the stocks. At the national level, the directorgeneral of foud controls the orders to move and release grain. Regionaland district controllers can also issue orders, but in general these areslow to arrive.
In summary, the quantities of grains moving through thenonmonetized channels of the PFDS have increased in recent years, mostlyat the expense of the Statutory Rationing and Modified Rationingchannels. The share of wheat in PFDS offtake has increased steadily

•
- 8 -
over the last decades, while the share of rice has decl ined. Thereasons are a desire to make the channels more self-targeting and theupsurge in distribution through the Vulnerable Group Development andFood for Work programs, which only deliver wheat. Bangladesh hascompleted the elimination of the subsidies from the Statutory Rationingand Other Priorities programs, as urged by various studies. The leakyModified Rationing system was discontinued and will be replaced by a newRural Rationing Program•

3. LITERATURE REVIEW
This chapter reviews the findings of various studies on PFDSeffectiveness and outcomes and on nutritional status in Bangladesh.
THE PUBLIC FOOD DISTRIBUTION SYSTEM
Foodgrain interventions are common throughout the world. Oneoften-used intervention is the consumer price subsidy, either general ortargeted 1 which has been effective in increasing the food consumption ofthe POO" , In Egypt, food subsidies accounted for 12.7 percent of thefood expenditures of the bottom income quartile in urban areas and 18percent in rural areas (Alderman and Von Braun 1984). In Sri Lanka 20percent of the tota1 cal ori e consumption of 1ow-i ncome fami 1ies wasattributed to a food ration. Similar results were found in Pakistan andin Kera1a, India (Alderman, Chaudhry, and Garcia 1988; Kumar 1979).
Little research has been conducted on the link between the pricesubsidies and increased intake of nutrients (although presumablyincreases in food intake will lead to increases in nutrient intake) andchanges in the intrahousehold distribution of nutrients. rhere is alsovery little information linking subsidy schemes empirically tomeasurable individual nutritional outcomes. Similar problems exist indetermining whether positive nutrit10nal outcomes have occurred amongthe beneficiaries of supplementary feeding programs.
Beaton and Ghassemi (1982) conducted a broad review of thenutritional consequences of supplementary feeding programs and generallyfound no measurable (anthropometric) benefits even though many of theprograms were linked to a fairly large proportion of householdconsumption of nutrients. Kumar (1979) found an association between thelevel of a family's intake of calories (induced by a food subsidy) andgrowth among children. However, many other studies of food subsidiesfound no measurable anthropometric benefit (Kennedy and Alderman 1987).
In the case of Bangladesh specifically, numerous evaluations ofthe PFDS have been conducted over the years, and the system has beenmodified following many of the recommendations of these studies.However, there are still formidable gaps in knowledge about the program,as this literature review highlights. Some of the studies have lookedat the entire PFDS, while others have focused on individual programsunder it.

- 10 -
The evaluations fall into two broad categories, although some ofthe studies encompass both. One is process evaluations, which seek todetermine how the system is running in terms of leakage, targeting, andforms of payment. These evaluations address how much grain is actuallydelivered to 1ntended recipients. The other category looks at outcomeson how the program affects the welfare of its beneficiaries. In theevaluations of the Food for Work program, the outcomes include theviability of the project and its impact on the community.
Brundin (1979) evaluated the Food for Work processes for USAID in1979. He found high rates of leakage yet could not estimate the amountof wheat actually reaching workers. He claimed that as much as 30percent of Food for Work wheat might have been misappropriated.
An evaluation of the Food for Work program by the Institute ofNutrition and Food Science (1981) reported serious problems withadministration of the projects. The study, conducted on a random sampleof 2,308 workers from 42 Food for Work sites, found severe underpaymentsto workers, commissions commonly demanded for the privilege of working,irregular payments to workers, and overestimates of the total employmentgenerated. Workers received 76.6 percent of the wage due them. At thesame time, in many cases teams working exceptionally hard received dailywages exceeding the agricultural wage. Fourteen percent of the workersreported paying a'"commission" to an "agent." The study concluded bynoting that very few workers knew what rate was due them, whether theyhad to pay commissions, or that they were to be paid extra foradditional work.
During the period 1981 to 1983, the Bangladesh Institute ofDevelopment Studies (BIDS) and IFPRI conducted an evaluation of theeffects of the Food for Work Program. There were two parts: a shortrun evaluation conducted while Food for Work projects were underway, anda long-run evaluation of the effects of the improved infrastructure onthe project sites. s
The short-run study involved a household survey at five projectand five Icomparab1e" nonproject sites (controls). A total of 246project and 245 control households that expressed a willi ngness toparticipate in Food for WOf'k (1 abor-se111 ng) were surveyed. Thefollowing questions were asked: who participates in the Food for WorkProgram?; what factors affect participation?; and what factors affectthe intensity of participation?
4 Allotments averaged 40.27 seers per 1,000 cub1c feet, wh1le the off1c1al rate was 52.57.
I By accept1ng that 1nfrastructure 1s a key 1ngred1p.nt of economic development, 1t becomesnecessary to evaluate whether the Food for Work program produces useful infrastructure.

- 11 -
The results showed that the Food for Work participants wereoverwhelmingly poor. Thus the program is effectively self-targeting.Household employment was greater for Food for Work households, and Foodfor Work employment tended to substitute for home production. Ameasurable gain in income was attributed to the Food for Work wages(Osmani and Chowdhury 1983). On the other hand, few differences inconsumption were found between the control and project households;however, the authors did not adequately control for di fferences inincome among groups nor for the effects of selectivity (why householdsparticipated).6 Those who participated more intensively consumed moregrain than did casual participants. The performance of Food for Workparticipants in repaying the loans was better than that of the controlgroups (Osmani and Chowdhury 1983).
The share of wheat in consumption was very high for both thecontrol and participating households. The project resulted in lowerlocal wheat prices relative to rice, a shift that encouraged theconsumption of wheat. The nutrition effect of this price change may behigh since both Pitt (1983) and Ahmed (1979) showed that subsidies onwheat prices may go the farthest toward improving the nutrient intake ofthe poor.
Analysis of the long-run impact in terms of infrastructuralimprovements and of nutrition is ongoing. Four project sites have beenselected (representing four types of projects); each site contains twopairings of villages--one pair consisting of a project and controlvillage with good infrastructural development and one pair with poor-for a total of 16 villages. Forty households were surveyed within eachof the 16 villages. For the nutrition study, two project sites (eightvillages) were selected.
The longer run effects attributable to the Food for Work Programincluded increased value of agricultural production, slight increases incropping intensity, and higher yields. These effects were noticeablyless for the smaller farms. Income was higher in the project areas, butagri cul tura1 wages were lower. The control areas showed much moreincome from home activities. The rates of investment were higher in theproject sites. .
.. On the other hand, there were few di fferences in consumpt ionbetween the control and project sites. Whereas the short-run indicatorof nutritional status (weight/height) was significantly higher in theproject group, the long-run indicator (height/age) was not affected(Ahmed et al. 1985). This evaluation specifically measured the effectsof infrastructure by comparing developed versus underdeveloped sites.
e The authors speculated that the low income elasticity of food demand may be attributable tothe lumpiness of Food for Work payments. More sustained payments over time might improve foodconsumption (Osmani and Chowdhury 1983).

- 12 -
CARE International (1988) eva1ua~ed its Food for Work projects aspart of its normal auditing p,"ocedures. It randomly visited upazila7
sites to compare outcomes w,Jth submitted records to assess thei raccuracy. CARE found numerous irregularities, including underpayment ofworkers, overreporting of work, unserviceable schemes, and payments incash. In 1988 only 28.6 percent of the total programmed Food for Workbudget resulted in economically viable construction schemes. 8 Thus theFood for Work Program in general has not produced viable infrastructure.
On average the project commi ttee planned to pay workers 8-10percent less than the fixed rate. On occasions where Food for Workwheat was sold and workers were paid in cash,9 the rates were found tobe 76.4 percent of the offi cia1 scc:d e. Rates of pay tended to be muchcloser to the official rates when the Project Implementation Committeesused signboards to post the rate.
A1987 Helen Keller International study evaluated the coverage andeffectiveness of both the Vulnerable Group Development and Food for WorkPrograms (Darton-Hill 1987). Of the 260 households interviewed, 130participated in the Vulnerable Group Development Program and 130 in theFood for Work Program. The study conc1 uded that both programs wereexceptionally well targeted; the average participant in the firstprogram had energy intakes below 50 percent of their reqUired dailyallotment. However, there must have been leakage, since participantsreceived only 54 percent of the intended Vulnerable Group Developmentration.
Both the Vulnerable Group Development and Food for Work rationsaccounted for substantial proportions of the total household income forthese households. Although these proportions were not measuredprecisely, nor was the income displared by the Food for Work Programexamined, it was inferred that the nutritional consequences of theseprograms were significant.
In 1989 the World Food Programme analyzed both programs (WorldFood Programme 1989). The results showed that both were well-targeted.The Vulnerable Group Development effort covered roughly 455,000 womenper year; the averaJe weekly nonprogram income of the participants wasTk 17. Sixty-one parcent were heads of households, and 20 percent weremarried b~t had husbands who were unable to work. Eighty-eight percentof the Vulnerable Group Development participants were landless, and only8.7 percent could write their names. The beneficiaries reported
7 A total of 315 upazilas in 44 districts had active Food for Work projects.
8 The rates of performance were significantly poorer in 1988 than in 1987, with large decreasesin economically viable schemes and increases in the rates of overreported work.
• Workers were paid fully or partially in cash in 30 percent of the 1988 projects.

- 13 -
spending 91 percent of their total expenditures on food (World FoodProgramme 1986).
A random survey of 1,000 Vulnerable Development Group recipientsshowed that average allotments of wheat were 20.71 kilograms, or 66percent of the ration entitlement.'o No respondent reported receivinga full ration. The availability and distribution of wheat wasirregular: only 73 percent reported receiving a regular ration.
The rations under the Vulnerable Group Development Programdisplaced market purchases of both wheat and rice: households bought 24percent less wheat and 17 percent less rice after entry into theprogram. Of the participants, 12.9 percent reported selling some or allof their rations. The program thus might exert some downward pressureon prices by decreasing demand and increasing supply. However, giventhe small quantities this group would normally buy and the small amountssold, it is not likely this pressure would be significant.
The study concluded that the Vulnerable Group Development Programtransferred significant income to its small group of recipients but didlittle to enhance their long-term ability to earn income (World FoodProgramme 1986).'1 In 1ater years, projects designed to enhanceincome-earning potential were added, including savings schemes, women'straining centers, and poultry-raising projects (World Food Programme1988a, 1988b).
These studies of the two large nonmonetized channels indicatedthat they have been well targeted but extremely leaky. Estimates of the1eakage from the Food for Work Program range from 50 percent to 10percent, the smaller figure does not include the losses from mismanagedprojects but only the underpayments to workers. Because programparticipation (why people participate) has not been adequatelyaddressed, it is difficult to conclude that the programs have raised theconsumption of p~rticipants. Little can be said conclusively about theultimate effects of these programs on the intended beneficiaries.Although the programs seem to raise participants' income, the studiesdid not take into account displaced income in general.
In 1979 and 1980 the Institute of Nutrition and Food Scienceconducted a study of the Statutory Rationing, Modified Rationing, and
10 The upazila Project Implementation Committees were queried about why full rations were notdelivered to the participants. Several reas~ns were noted. Some rations were transferred to needywomen who held no card. Many times the local supply depot did not provide the committee with itsfull allotment. The study speculated that since the government paid no handling costs, the localsupply depots diverted grain to cover these costs (World Food Programme 1986).
11 Only 3.4 percent of respondents felt the program enhanced their abi1ity to earn income(World Food Programme 1988b).

- 14 -
Gratuitous Relief components of the PFDS. Th~ study examined thedeterminants of participation, the amount of rations received, and theration's share in a household's total grain intake (Institute ofNutrition and Food Science 1979; 1980).
The rations were very small, on average only 10 percent of theofficial quantity specified for urban rations. In addition, only 2.47.4 percent of the total household income of participants could betraced to the program. Even with these smaller amounts manybeneficiaries (25 percent) drew less than the full ration. The ruralhouseholds were thus very dependent on the open market for meeting theircereal needs.
Only one-quarter to one-third of eligible users drew rations inanyone month. Many reasons were given for nonparticipation: news ofavailable grain did not reach many remote rural areas; the quotas(rations) were too small to make it worthwhile going to the shops; mealswere taken at work; and the supply of rations was extremely irregular.On many occasions people who intended to purchase rations found no grainwhen they reached the shops.
The urban Statutory Rationing system benefited its participants toa much greater extent, providing 55-62 percent of the cereals purchasedby middle-class consumers, representing an increment in income of 19.6percent.
In 1985 and 1986 the Ministry of Food contracted with BECONConsultants to analyze the effectiveness of the PFDS (BECaN 1986). Thestudy did not explicitly examine nutritional outcomes, focusing insteadon coverage and delivery of foodgrains. Only 3.6 percent of theeligible rural poor in 1978/79 were able to draw their full ModifiedRationing quota. Generally the government treated this program as aresidual effort and was unable to del iver significant quantities ofgrains. Because it was treated as residual, it was by far the mostvariable PFDS channel. On average the program did not deliversignificant quantities of grain to its beneficiaries (only 50 percent ofeligible households, or Class A, the poorest, possessed a ration card);less than 2.2 percent of the grain consumption of Modified Rationinghouseholds came from ration shops. The inference is that the ModifiedRationing program had little if any impact on the nutritional status ofthe poor.
The 1986 report for the Ministry of Food, prepared by BECaN,included an economic model to show that the PFDS could be used tomoderate some of the wild fluctuations in consumer and producer prices.In years of bad production, although market prices may risedramatically, the increased offtake of rations ~hou1d lead to only

- 15 -
slight declines in food consumption. 12 Decreases in the ration quotaswoul d 1ead to 1arge rises in market pri ces, as consumers soughtalternative grain sources.
The study showed that the Statutory Rationing program created a7.05 percent income transfer (to middle-class urban consumers) in1973/74; this subsidy fell to 3.21 percent in 1984/85. 13 The reviewadvocated abolition of the Statutory Rationing effort, even though itwas much more effective in reaching the urban middle classes than wasthe Modified Rationing system in reaching the rural poor. It noted thatthe Food for Work and Vulnerable Group Development Schemes wereeffectively targeted, with the beneficiaries of these programs generallybeing among the most needy.
The authors of the BECON study were able to show that in theaggregate the PFDS contributed effectively to overall food security.However, they stated that a disaggreg~ted analysis would show largevariations in coverage. The effective channels were Open Market Sales,Vulnerable Group Development, and Food for Work, whereas ModifiedRationing was extremely ineffective. The Statutory Rationing Programreached people of dubious need. The authors urged the use of a faminemap to better target interventions by geographical area. In addition,they pressed for more effective use of the Open Market Sales channel tomitigate seasonal and geographical swings in retail prices.,
BECON produced another report in 1988, an evaluation of theModified Rationing Program (BECON 1988). In it the authors advocatedwholesome reform of this system. They showed that the subsidy itprovided was small, with rice under the program priced at more than 90percent of the market price and wheat at more than 95 percent. TotalModified Rationing grain amounted to about 2 percent of the foodgrainconsumption of the participants. Only 3.8 percent of the landless poorreceived any ration in 1986/87. Once again, the cardholders were needy;an analysis of the distribution priorlty list showed that only poorerhouseholds held cards.
The leakage from the Modified Rationing Program was a key elementin its ineffectiveness; the authors estimated that up to four-fifths ofthe wheat and three-fifths of the rice allotted to Modified Rationingdealers leaked from the system. The proceeds of this leakage wereoften seen as political entitlements used to secure advantages in localelections (BECON 1988).
'2 It was assumed that imports would increase to maintain the availability of the rations.
'3 These figures are quite different from those of the Institute of Nutrition and Food Sciencestudies. Based on evaluations of the methodologies it can be concluded that the BECON (1988) figuresare more likely to be reliable.

- 16 -
The report ended with the following recommendations. All ModffiedRationing wheat should move through the very effective chakki system,under which wheat was sold to local millers at a reduced price. Wheatdeliveries through Modified Rationing should be suspended. If theModified Rationing shops were to be continued, then the authors calledfor more of them; many cardholders did not participate because of thelong distances they had to travel to draw their rations. Finally, theyrecommended better regional targeting of the Modified Rationingdistribution so that distress-prone regions receive larger allotments.
At about the same time EUREKA (Bangladesh) Ltd. undertook a studyof the subsidies in the PFDS system overall (EUREKA 1986). The authorstried to track the losses of grains in different parts of the system(transportation and storage). They found that the h1ghest percentage oflosses occurred at the port of entry into the country and that the totalaverage loss up to the local supply depots was 3.81 percent. The studyalso showed that the Food for Work and Vulnerable Group Developmentprograms were well targeted; the Modified Rationing channel was alsowell targeted but very thin in its coverage and not very effective. Alarge percentage (31.8 percent) of poor rural households had no accessto the PFDSj most of the others had access only to the ModifiedRationing system. Participation in that program was very sporadic.Another finding was that the urban middle classes benefited the mostfrom the PFDS.
Other eva1uations of the PFDS abound. Some have exami ned theimpact of the system on producer prices and hence on productionincentives (Nelson 1979}14 and its impact on the government budget(Ahmed 1979). However, no study has comprehensively examined thenutritional impact of the PFDS.
There is clearly a large gap in knowledge. The PFDS could accountfor a significant part of the income of a small group of well-targetedindividuals. However, problems in the system's operations prevent thisoutcome. The extent of poverty in Bangladesh makes it extremelyunlikely that any expansion of the PFDS programs will make anything buta small dent in the level of poverty. The Ministry of Food estimatedthat 44 million out of the total population of 110 million arevulnerable (in Ministry terms belonging to class A) .16 By using
14 The outcome was a very small disincentive effect that can be ignored. However, seasonaldimensions were not investigated.
11 Using the World Food Programme's estimate that 2.495 million tons in 1987/88 went throughthe PFOS, and subtracting all nontargeted aid (Statutory Rationing, Essential Priorities, OtherPriorities, Large Employers, Open Market Sales, Market Operations, and Flour Mill programs), 1.425million tons are left for the targeted groups. Assuming no leakage, the allotment would be 0.089kilogram per needy person per day. Recipients under the individual programs do much better than thisamount; family members participating in the Vulnerable Group Development program receive an averageallotment of 146 grams per day (using 20.7 kilograms per month and an average recipient family of4.8 people).

~ 17 ~
estimates of 2 million beneficiaries for the Vulnerable GroupDevelopment Program, 4.6 million for Food for Work, and 3.5 million forRural Rationing, the number of beneficiaries is 10.1 million, or lessthan 25 percent of the truly needy. This figure is surely anoverestimate, since many Food for Work workers may also belong to eitherof the other two programs. Thus the PFDS must be considered as a small,but important, component of foo~ policy and, more broadly, ofdevelopment policy.
Much of the budgetary subsidy from the PFDS was directed towardurban consumers, who were generally 1ess needy than other potentia1beneficiaries. This urban bias was widely documented, and thegovernment reacted by reducing and eventually eliminating most of themiddle~class subsidies.
Much less is known about the effectiveness of the rural channels.They appear to be very well targeted. Both the Vulnerable GroupDevelopment and the Food for Work programs, however, have high rates ofleakage. The sources of this leakage were almost always traceable tolocal problems: either the local godowns did not release theappropriate amount of grain or the union officials and ProjectImplementation Committees did not run the projects effectively (WorldFood Programme 1988a; CARE International 1988). In addition, most Foodfor Work projects did not produce viable infrastructure.
The focus of many of these studies on quantities delivered shedlight on the divergence between the published ration amounts and thoseactually. delivered. However, because the analytical frameworks have notincluded the determinants of program participation, very little can besaid about the net eff't-cts of the program, and virtually nothing isknown about its effect un individual nutrition.
NATIONAL STUDIES OF NUTRITIONAL STATUS
Five nationwide nutritional surveys have been conducted inBangladesh: the Nutrition Survey of East Pakistan (l962-64), theNational Nutrition Surveys of 1975/76 and 1981/82 (conducted by theInstitute of Nutrition and Food Science of the University of Dhaka); theHelen Keller International Survey of 1982/83; and the Nutrition Moduleof the Household Expenditure Survey (conducted by the Bangladesh Bureauof Statistics) of 1985/86. Comparison of the results of these surveysmay be found in Bangladesh Bureau of Statistics 1987 and Chowdhury 1989.Table 3 contains a summary of the results from the last four of thesurveys.

- 18 -
Table 3--Comparison of results from national nutrition surveys for ruralBangladesh
IDItitute of IfIltrition Belen hlltr IUlIlacltlh lurllllID4 'ood 8ailDClt IntematioDal, of ltati.tia.,
Indiaator 1.175/76 1911112 1912/13 1915116
Stunting (percent) 73.7 57.3 42.0 57.6
Wasting (percent) 21.6 20.0 6.0 8.2
Sample size 430 510 4,44~1 1,500
Age range (months) 0-59 0-59 3-71 6-71
Reference Standard Harvard Harvard National Center for National Center forHealth Statistics Health Statistics
Source: Omar Haider Chowdhury, "Analytical Bibliography on Rural Development: Studies onNutrition," Bangladesh Institute of Development Studies, Dhaka, 1989, mimeographed:Bangladesh Bureau of Statistics, Report on the Child Nutrition Status Module. BangladeshHousehold Expenditure Study. 1985-86 (Dhaka: BBS, 1987).
The studies produced very different estimates of the prevalence ofmalnutrition, although in all cases the estimated rates were highcompared with other countries. 18 The rates of wasting for the firsttwo studies seem extremely high, even considering that the first studyoccurred immediately after the 1974 famine. Moreover, the 1argevariation in the proportion of stunted children across the studies makescomparisons difficult.
Some of the differences may be explained by sampling error, use ofdifferent reference standards, a~ " most likely, nonsampling error. Thesample sizes of the first two studies were extremely small; thislimitation, combined with their unreasonably high rates of wasting,discount their findings. Very little of the differences can beattributed to the use of different standards, however, since the age andheight-specific means of both standards are Virtually identical. 1 Thedifferent age groupings contained in each study make the resultsdifficult to interpret; the studies with higher proportions ofvulnerable children (6-24 months) may be expected to have higher ratesof wasting. However, the same phenomenon should lead to a highermeasured rate of stunting in the two latter studies, which was not thecase.
18 See Kumar 1987 for a comparison with countries in Sub-Saharan Africa.
17 All studies used less than 90 percent height for age and 80 percent weight for height asthe stunting and wasting cutoffs, respectively. Therefore similar means would have to lead to nearlyidentical prevalences.

- 19 -
The differences in the rates of wasting between the Helen KellerInternational and the Bangladesh Bureau of Statistics surveys can inpart be explained by their timing. The former was conducted during theDecember-April post-aman harvest period, during which time the rates ofwast ing usually fall. The IBangl adesh Bureau of Statistics survey wasconducted four times during the year. When the results were broken downby season, the January and February round produced a wasting rate of 4.1percent and the April round, 9.1 percent. Thus the overall rates arefairly close, with the Heltm Keller Institute on average showing ahigher rate of wasting (Chowdhury 1989).
The 1arge observed d'j fference in the prevalence of stunt ingreported by the st.udies is much more difficult to explain. They cannotbe attributed solely to ch,anges in population incidence, and someevaluation of the confidence intervals is necessary. Nevertheless, itdoes appear that chronic malnutrition is increasing in rural Bangladesh.
Chowdhury (1989) used the results of the 1975/76 and 1985/86studies to conclude that the severity of malnutrition among ruralchildren has decreased. There does not, however, seem to be enoughevidence to support this conclusion given the reservations expressedearlier. The lack of evidence points to a need to continue standardizedsurvey instrument and sample design so that these types of comparisonscan be made. On the other hand, there is concrete evidence that percapita consumption of nutrients increased slightly in the past decade(Chowdhury 1989), although in,equa11 ty also increased.
The Bangladesh Bureau of Statistics study presented someinformation on an issue of continuing interest in Bangladesh: genderbias. Table 4 presents a summary of the different indicators for therural areas by gender. Although no information is presented in theBureau's report on the statistical significance of the differences, thegeneral picture is that girls are worse off than boys. This findingconfirms some of the observations on intrafamily food and resourcedistribution by Chen, Huq, clOd D'Souza (1981) and the results ofnutrient adequacy studies (see Chowdhury 1989 for a review of dietaryassessment studies).
The report of the Bangladesh Bureau of Statistics study (1987)also compared mean indicator values by age group, sample season, incomegroup, expenditure group, food and medical expenditure group, maternaleducation, maternal hand cleaning, toilet and water source type,breastfeeding, and morbidity. The results were consistent with priorexpectations. The higher income and expenditure households generallyhad lower rates of malnutrition. 18 Mother's education, tubewell
1. As measured by the mean prevalence of wasted and stunted children.

'I
- 20 -
Table 4~-Comparison of nutritional status indicators, by gender, forrural Bangladesh
%DeIlcator Ial. ,.ul.Weight/age (means) 71.8 72.4Height/age (means) 89.0 88.6Weight/height (means) 89.9 89.4Stunting (percent) 54.8 57.6Wasting (percent) 6.8 9.8
Source: Bangladesh Bureau of Statistics, "Report on the Child Nutrition Status Module, BangladeshHousehold Expenditure Study, 1985-86" BAS, Dhaka, 1987, mimeographed.
water,19 length of breastfeeding, and absence of morbidity were allpositively correlated with nutritional status.
The analysis of the survey data ended there and was thus extremelylimited. Only point estimates were presented so that the statisticalsignificance of the differences is unknown. Further, no multivariateanalysis was conducted so that there was no statistical control.
The corresponding analysis of the Helen Keller Internationalsurvey data was also incomplete. It included a comparison ofnutritional status across geographical areas but aggregatf.'d at thedivision level. 20 These results are presented in Table 5. The ratesof malnutrition were highest near weaning age, and, contrary to theBangladesh Bureau of Statistics analysis, there was no evidenc~ ofgender differentials in nutritional status.
Table 5~-Nutritional status from the Helen Keller Internationalxerophthalmia prevalence survey, by division
lIVer. lIalDutdtlOD lfo4.ratt lIalDutdtiOD lorul (OYIr 1',0(1... t:bu 12.S (u.s-u.o Clatilllttr.)DividOD catilllt.r.) Clat1ut.r.)
Dhaka 10 37 53Chittagong 10 38 52Khulna 13 47 40Rajshahi 7 37 56
TOTAL 10 40 51
Source: Helen Keller International, "Bangladesh Nutritional Blindness Study 1982-83, Key Results,"Helen Keller International and the Institute of Public Health and Nutrition, Dhaka, 1985,mimeographed.
1. As opposed to surface water or unprotected open wells.
20 Helen Keller International 1983 contains some district-level disaggregations.
I

- 21 -
Several other points must be made about the resul ts of thesenational surveys. First, standardization of the survey and samplemethodologies is needed. Because the study results are incompatible, nodynamic national comparison of nutritional status in Bangladesh emerges.Second, the two surveys having sample sizes adequate for causal analysisoffer a wealth of information that has not been sufficientlyanalyzed. 21 Finally, none of the survey results was sufficientlydisaggregated geographically to permit examination of different subareas of the country.
MICRO STUDIES OF NUTRITIONAL STATUS IN BANGLADESH
There have been numerous attempts to measure nutritional status inspecific areas and project sites. These studies have used indicatorssuch as mortality rates, dietary intake, and anthropometry. Many haveevaluated the effectiveness of nutritional interventions in certainareas. Some of these studies and their findings are reviewed below.
An important and widely used indicator of nutritional status isthe infant mortal i ty rate. 22 There have been several studi es of theinfant mortality rate in Bangladesh. The World Bank (1919) estimated itto be 140; the International Statistics Institute (1979) estimated therate at 150, saying that 45 more die in the second year. Otherestimates range from 110 (United Nations International Children's Fund1918) to 186 (ICED 1977). The higher end of the range of estimates isfound in rural areas (ICED 1971; Islam et al. 1986). All theseestimates are extremely high when compared with other developingcountri es. 23
The World Bank (1981) estimated the child mortality rate24 .at 19in 1919, a marked improvement from 1960, when it stood at 25. Rahman etal. (1984), who measured the death rate attributable to malnutrition inrural Bangladesh, found an extremely high correlation between size ofthe landholding and rates of death: landless children died because ofmalnutrition at a rate of 50 per 10,000, while children from familieswith more than 1 acre died at a rate of 9.5 per 10,000.
21 Particularly the Bangladesh Bureau of Statistics survey, which contains observations fromthe Household Expenditure Survey for every household where anthropometric measurements were taken.
22 Defined as the number of children who die between the ages of 1 and 5 years per 1,000 livebirths.
23 According to the United Nations Children's Fund a country with a rate over 100 has "veryhigh infant marta llty." In 19B1 seven countries had rates above 150 (UNICEF 1984).
24 Defined as the number of deaths between 1 and 5 years per 1,000 1-year-olds.

- 22 -
There have been no studies of household conditions using mortalitydata as an indicator, mainly because generating precise estimates withthese data requires prohibitively large sample sizes. However, themortality studies do confirm that the rural areas are worse off and thatlandless households are particularly vulnerable.
Studies of birth weight are also grim for rural Bangladesh. TheWorld Health Organization (1980) estimated that the weight in 50 percentof the births in rural areas were below 2,500 grams, which is usuallytaken to be the cutoff for malnutrition. There was no investigation ofthe causes of the low birth weights, but the authors speculated thatmaternal nutrition and education were key factors.
There have been numerous studies of nutritional status in MatlabThana in the Comilla District, the f~eld station of the InternationalCentre for Diarrheal Disease Research, Bangladesh. They shoW highprevalences of malnutrition, gender biases in intrafamily fooddistribution (Chen, Huq, and D'Souza 1981), high seasonal variations innutritional status (Chen, Chowdhury, and Huffman 1979), an associationbetween landlessness and malnutrition (Chen, Chowdhury, and Huffman,1979), and the unimportance of mother's education as a cause ofmalnutrition when income levels are very low (Chowdhury 1988). Manyinvestigations of the relationship between diarrhea, feeding habits,malnutrition, and death rates have resulted from the center's efforts.Additional studies have examined the relationship between nutritionalstatus and physiological changes such as menarche in young women(malnutrition delays menarche, according to Chowdhury, Huffman, andCurlin 1977) and postpartum amenorrhea (Huffman, Chowdhury, and Sykes1980; Huffman, Chowdhury, and Mosley 1978), and the rel ationship betweei)malnutrition and mo)'tality (Chen, Chowdhury, and Huffman 1978).
Nutritional anthropometry has been widely used to measure theeffectiveness of nutrition interventions in Bangladesh. In general, thestudies have reported positive nutritional effects. Kielman, Ajello,and Kielman (1980) conducted an evaluation of a UNICEF project inCompaniganj Thana, Noakhali District. The project was designed to studythe effect of a subsidized food supplement on child growth and mortalityduri ng fami nes. The authors concluded that the intervent ion had asignificant positive effect on growth but that a better design wouldhave led to greater effectiveness.
Some results from other intervention evaluations are presented inTable 6. These studies, which have all been summarized elsewhere, painta generally grim picture of nutritional status in Bangladesh. As noted,it is difficult to make cross-study comparisons, since the projectsinvolved different interventions, age groupings were not equal, and thestandardization, measurement techniques, and sample designs varied.However, these interventions generally seem to have worked in terms ofimproving nutritional status.

- 23 -
Table 6--Summary of the findings from micro-level studies of nutritionalstatus in Bangladesh
Iro:feaf: I.u IDdiaatori
River Project 1979 Height/age, Weight/age,Weight/height, MUAC
Concern Mlrpur 1979 Height/age, Weight/age,Camp Weight/height, MUAC
Muylarchar 1978/79 Dietary adequacy
Malnutrition lower In projectarea than in rest ofBangladesh. Still bad.
Fewer well-nourished people;no significant difference insevere malnourishmentcompared with ruralBangladesh
General Inadequacy of calorieIntake for preschoolers; noIntrafamlly bias; incomeImportant
Sources: Data on River Project and Concern MI rpur Camp are from Save the Children Fund(United Kingdom), "Bangladesh: River Project, Nutrition Survey Report 1," Dhaka,September 1979, mimeographed; data on Muylar-char are from Raflqul H. Chowdhury,"Determinants of Dietary Intake and Dietary Adequacy for Pre-school Children inBangladesh," Food and Nutrition Bulletin, 6(4), 1984.
•-.
SUMMARY AND CONCLUSIONS
The broad picture that results from these studies is thatmalnutrition is extremely prevalent and that the PFDS, although designedin part to alleviate malnutrition, has had only limited success inreaching this goal. This review also shows the broad gaps in knowledge.Filling the gap is a precondition for effective policy design.
Some immediate conclusions result from the literature review.
The programs designed to alleviate rural hunger are smallrelative to their pool of intended beneficiaries. TheVulnerable Group Development, Food for Work, and RuralRationing programs cannot be relied on to relieve more thana relatively small percentage of the households that sufferfrom hunger.
• The Vulnerable Group Development and Food for Work programsare well targeted but extremely leaky. Estimates of howmuch grain is delivered through these channels cannot bemade on the basis of the amount of grain that enters thesystem. Instead, beneficiaries must be surveyed and theresults aggregated. The Food for Work Program maynot in general produce economically viable infrastructure.

- 24 -
• The Statutory Rationing and Other Priorities programs havebeen effectively reformed so that they no longer providesubsidies to the middle class.
• No broad dynamic picture of malnutrition emerges from theliterature, and what does emerge cannot be effectively tiedto the coverage of the PFDS. Thus the overall impact of thePFDS on malnutrition is unknown. Declines in the infant andchild mortality rates since the 1960s cannot be attributedto any program without further analysis.
• While nutritional anthropometry has been used extensively toevaluate the effectiveness of nutrition interventions, ithas not been widely used to measure the impact of the PFDS.The study that included nutritional anthropometry (Ahmed etal. 1985) provided evidence that infra~~ructure did lead tobetter short-run nutritional indicators but that there was1ittle evidence that participation in the Food for Workprogram had any positive nutritional impact.
• None of the explicit nutrition studies focused on theeffects of the PFDS. The Bangladesh Bureau of StatisticsHousehold Expenditure Survey could be used to conduct suchan analysis, but this study has not yet been done.
The studies of the PFDS have not adequately focused on consumptionand nutrition outcomes, and the nutrition studies have not covered therole of the PFOSt More work is needed to determine how the PFDS is tiedto improved nutrition and consumption.

4. THE IFPRI PLAN FOR STUDYING NUTRITION AND CONSUMPTION
This section describes the propo~~l underlying IFPRI's work plan.Several questions are being addressed by the IFPRI study. What effectdoes the PFDS have on the intake of nutrients at the household level,and do changes in the nutrient consumption of households affectobservable indicators of nutritional status? How does nutritionalstatus affect labor supply and productivity? How does the PFDS enhanceor hinder the achievement of broader development goals? Satisfactoryanswers to these questions in turn necessitate investigation of a numberof subissues, including: the determinants of participation in the PFDSand how these affect normal relationships; how PFDS coverage affects theintense seasonal swings in consumption observed in Bangladesh; and howPFDS grain transfers affect market prices and producer incentives.Finally, an evaluation. of the PFDS use in developed versus lessdeveloped regions is needed.
This chapter is organized as follows. The use of nutritionalanthropometry as a broad development indicator is discussed first. Thedata are available from the Nutrition Module of the 1985/86 HouseholdExpenditure Survey conducted by the Bangladesh Bureau of Statistics.The institutional framework in which the analysis is being conducted isidentified. Next, a possible early warning system using easilycollected indicators is outlined.
NUTRITIONAL STATUS AS A BROAD DEVELOPMENT INDICATOR
The PFDS is the result of a desire to protect the most vulnerablesectors of Bangladesh society from fluctuations in real purchasing powerand to increase their mean levels of grain consumption. At the sametime, economic development, if it is broadly based, can achieve the sameends over a longer period with fewer costs. Thus an importantconsideration is to determine the role and effectiveness of the PFDS,the rel ationshi p between PFDS and the country's economic developmentgoals. One way is to compare indicators of development, one of whichcan be nutritional status, over different regions of the country overtime.
The Nutrition Module of the Household Expenditure Survey providesa good opportunity to use nutritional anthropometry along with otherhousehold-level measures of economic status as indicators ofdevelopment. The most recent version of the module contained 240primary sampl ing units, each containing 16 households, and a total

- 26 -
sample size of 3,283 children from 6-71-months old. The survey wasconducted four times during 1985/86 (September/October, January/February, April, and July), covering the approximat~ range ofseasonality in Bangladesh.
The information sought by the Nutrition Module includes:anthropometry (height, weight, and arm circumference) for all children;individual characteristics (age, gender, relationship to household head,birth order, breastfeeding history, and illness history); parentalcharacteristics (education, literacy, employment, and ownership ofassets), which come in part from the expenditure survey; and householdcharacteristics (source of drinking water, sanitation, and number ofhousehold members).
Two questions must be answered before the validity of these datais accepted. First, were the children's ages measured accurately?Inaccuracy in ages was mentioned overwhelmingly as an endemic problemin Bangladesh. A source at the International Center for DiarrhealDisease, Bangladesh, was skeptical of any age data not collected usingdetailed demographic surveillance. A quick look at age clustering(around 6 and 12 month intervals) will address this issue. Someclustering should be expected, but extremes should raise suspicions.
Second, how dil igent were the survey enumerators? The USAIDeconomi c statistics advi sor attached to the stat1stics bureau wasuncertain about the quality of data collection in Bangladesh. He was,however, very enthusiastic about the Nutrition Module, and since theHousehold Expenditure Survey was conducted simultaneously, his doubtsabout whether the households were really contacted were assuaged.However, outlier inspection and consistency checks are necessary.
If the quality of the anthropometric data is accepted, what newinformation can be 'obtained by using them? UNICEF, the chief source offunding for the Nutrition Module (funding that is to continue through1992) has expressed an interest in seeing more causal analysis of thedata. At the same time, it expressed concern about the StatisticalBureau's ability to conduct the'analysis, about obtaining free access tothe raw data, and about the slow turnover of data. Arepresentative ofUNICEF has suggested that IFPRI provide technical assistance to help thebureau deal with these problems.
An interview with the Director of the Statistics Division of theBangl adesh Bureau of Statist ics suggested that the bureau woul d beamenable to this kind of arrangement. If in-house access to the rawdata on a personal computer is permitted, as is likely to be the case,then IFPRI could provide technical support and suggestions for themodeling. It is recommended that IFPRI do so.

- 27 -
The proposal to use the data of the Bangladesh Bureau ofstatistics falls naturally into two parts. Presuming that access to thedata is limited to requests for different summary statistics atdifferent levels of aggregation (this access is guaranteed, with certaindelays and with adequate funding), then the following plan can be madeoperational. If access to the raw data (with the household identifiersdeleted) is granted, then a complete household-level analysis ispossible, using indicators of nutritional status linked to the fullHousehold Expenditure Survey. (The analysis would proceed along thelines proposed for the field study in the following chapter.)
Oi saggregation of the data into geograph ica1 un its beyond therural/urban breakdown presented in the bureau's wri te-up (Bangl adeshBureau of Statistics 1987) is necessary. The analysis should beconducted at the district level. If district-level aggregation provesimpossible, some other broad geographical disaggregation is needed.
To match these nutrition data with regional indicators of economicdevelopment, additional data should be assembled at a similar level ofaggregation. These data should include measures of PFOS effectivenessand coverage, such as the number of ration cards per capita, compositionof the rations, and per capita delivery of foodgrains from monetized andnonmonetized channels. These data are all available at the upazilalevel from the World Food Programme and the Ministry of Food. Measuresof infrastructural improvements should be made, including road coverage(With some measure of qual ity), percent of households served withelectricity, water, and schools, and health centers per capita.Indicators of agricultural performance such as use of inputs, yields,and total acreage planted should also be included. All these data canbe collected easily and should match the same level of aggregation asthe Nutrition Module.
These databases, when combined, will provide the followinginformation over time:
• Which divisions are improving with respect to nutritionalstatus and other standards of living and which are fallingbehind,
• Measures of infrastructure and PFOS performance that can bematched in a causal analysis with the variables mentioned inthe first bulleted point, and
• Causal investigations regarding the relationship betweendetermining variables and nutritional outcomes.
Much of the analysis of the coverage of the PFDS and its effect onnutritional outcomes can only be conducted after a period of timepas~es. At this point the aggregate analysis can be used to measure the

- 28 -
effectiveness of targeting: are the areas that are nutritionally theworst off receiving the most food?
IFPRI'S ROLE WITH NUTRITION STATUS DATA
Before the statistical bureau's data set (and future datacollection with the Nutrition Module) is dismissed, an attempt should bemade to verify its usefulness. If the data are of reasonable quality,then IFPRI could take a lead role in producing descriptive statisticsand slowly working to improve the analytical skills of the bureau. Ifthe data are not reasonable, then IFPRI should consider ways to improvethe techniques for collection and accuracy for the next round of thesurvey.
The collection of additional secondary data will be an easy andeffective way to begin. The two ministries involved in collecting thesedata (Food and Agriculture) should be brought into the process. Thepossibilities for merging and analyzing the data may foster a desire toimprove and coordinate their collection.
If IFPRI can work with analysts in the bureau to link theNutrition Module data w·ith the data from the Household ExpenditureSurvey, then an analysis of expenditure behavior and nutrition outcomescan be conducted. The data set from the 1985/86 round of the survey isrumored to be good (better than the round used by Pitt to estimatenutrient elasticities), containing both consumption and recall data.
IFPRI currently possesses a copy of the survey instrument. At aminimum the survey can provide detailed data on household expenditures,household characteristics and demographics, income sources, and laboractivities.
MONITORING STRESS THROUGH NUTRITIONAL SURVEILLANCE
Concurrent with its efforts to evaluate the nutrition/consumptioneffects of the PFOS, IFPRI was asked to help construct a mechanism formonitoring nutritional status in rural areas. The goal is to providemore information to policymakers so that nutritional interventions toalleviate short-term fluctuations in nutritional status'can be designed.In addition, 'information is needed that permits monitoring the progressof different areas in recovering from a disaster.
This section looks first at the complexity of poverty, famine, andconsumption and their link to measurable pol icy variables. Thisdescription suggests two ways to approach a monitoring system. First,data on easily collected variables that are in some way linked tochanges in poverty and household consumption can be analy~ed to

- 29 -
establish a predictive model. However, as will be seen, this type ofsystem is of only 1imi ted useful ness and accuracy because of thecountry's complexity. Therefore, a more ambitious, household-levelmonitoring plan is proposed that would overcome many of the problems ofthe more centralized system.
Another factor argues for a household monitoring system. Thesystem should not be overly sensitive so that every downturn leads to anintervention. At the same time, a degree of specificity is needed thatpermits the planning of proper interventions. In some cases the problemis not shortages of foods in the market; rather, it is a decline in theentitlements of the poorest people. Shipments of grain at wholesaleprices into the affected area will not solve this problem. Instead, aprogram to generate income may be needed. The more 1imited system wouldprobably be more sensitive and certainly less specific than thehousehold monitoring system.
Nutritional anthropometry is of limited use in an early warningsystem, since the results of changes in nutrient intake appear slowly.The anthropometric data are also not very specific, so that downturns inanthropometry may not be associated with short-run changes in theavailability of household food. Given these limitations, to forecastdownturns requires leading indicators rather than anthropometry. InBangl adesh, there are two major causes of downturns: floods anddroughts. Neither of these is either a necessary nor a sufficientcondition for increased hunger and destitution.
LEADING INDICATORS
Rising rural landlessness in Bangladesh has led to increaseddependence on market wages as a source of earnings (Rahman 1986). Todaya large majority of households depend on exchanges for their food needs,a trend that is increasing over time (Murshid 1987). Thi s increaseddependence on exchanges leaves many small farmers extremely vulnerable,especially to seasonal swings in food prices and earnings. Thesefarmers tend to sell any gross surplus during the peak sale(postharvest) periods and buy later when grains are scarce and pricesare high. 26 Concurrent with high grain prices may be slack periods ofdemand for labor that means fewer wage earnings.
21 This pattern was suggested by Ahmed (1981), Murshid (1987), Muqtada (1981), Rahman (1986),Ralwnan and Islam (1987), and Quasem (1987), among others. The reasons behind this phenomenon(selling at low prices and later repurchasing at high prices) include a lack of storage facilities,the difficulty of storing high-moisture boro rice, and short-run liquidity constraints. This patternhas the strongest adverse impact on small farmers.

- 30 -
Because the majority of people are so close to extreme poverty andmany crops have poor storage qualities, formal saving during the goodmonths is difficult. When downturns occur, small declines in employmentmay have a 1arge effect because so many small farmers depend onsecondary employment to make ends meet. These farmers survive bydrawing on informal household reserves, by borrowing, and perhaps byselling assets.
There is a well-documented seasonality in prices and acorresponding seasonality in consumption. Expectations about prices arealso very important to consumption decisions: events such as a seriousflood may cause hoarding and delays in transportation that lead to priceincreases. If food prices fallout of line with their seasonal norm,the resulting expectations of high prices may precipitate a famine(Muqtada 1981). During the famine of 1974 the initial trend in priceswas markedly upward, but they crashed subsequently after the loss ofexchange entitlements.
Short-run speculative deviations must be separated from long-termtrends that may indicate stress. Speculative grain sellers or consumerscan cause short-run peaks and valleys in prices. Consumers may react totheir expectations of high prices by purchasing larger quantities as ahedge. Their resulting stocks at home will depress future demand andlead to a precipitous fall in prices.
Studies of famines in Bangladesh have led to the conclusion (seeMuqtada 1981; Currey 1978; and Ravall ion 1987) that the followi ngfactors are evident during or prior to a period of famine. Earnings forsome groups decline relative to the purchase prices of goods,particularly grains. Wages may fall until, at some "subsistence wage,"unemployment results, leading to a failure of employment entitlements.Thus, although wages may be stable (albeit low), decreases in exchangeentitlements may be manifested as lower earnings caused by unemployment,a situation that is not easily measured. Generally food prices riseduring the initial periods. Increased consumption of inferiorsubstitutes ("famine foods") is also observed (Currey 1978). Sales ofassets increase. 28
In addition, the following phenomena have been identified. Thetraditional support network within the extended family breaks down(Currey 1978). The use of institutional and noninstitutional forms ofcredit increases: as exchange entitlements fall, many people rely onborrowing to sustain themselves. This borrowing is difficult to
28 These include non land productive assets and land, although selling land is difficult inBangladesh (Muqtada 1981). Currey (1978) observed marked increases in land sales and land mortgagesduring the 1974 famine. Several authors stress a focus on these secondary markets as indicators ofproblems (Muqtada 1981; Murshfd 1987; Rahman 1986).
- 31 -
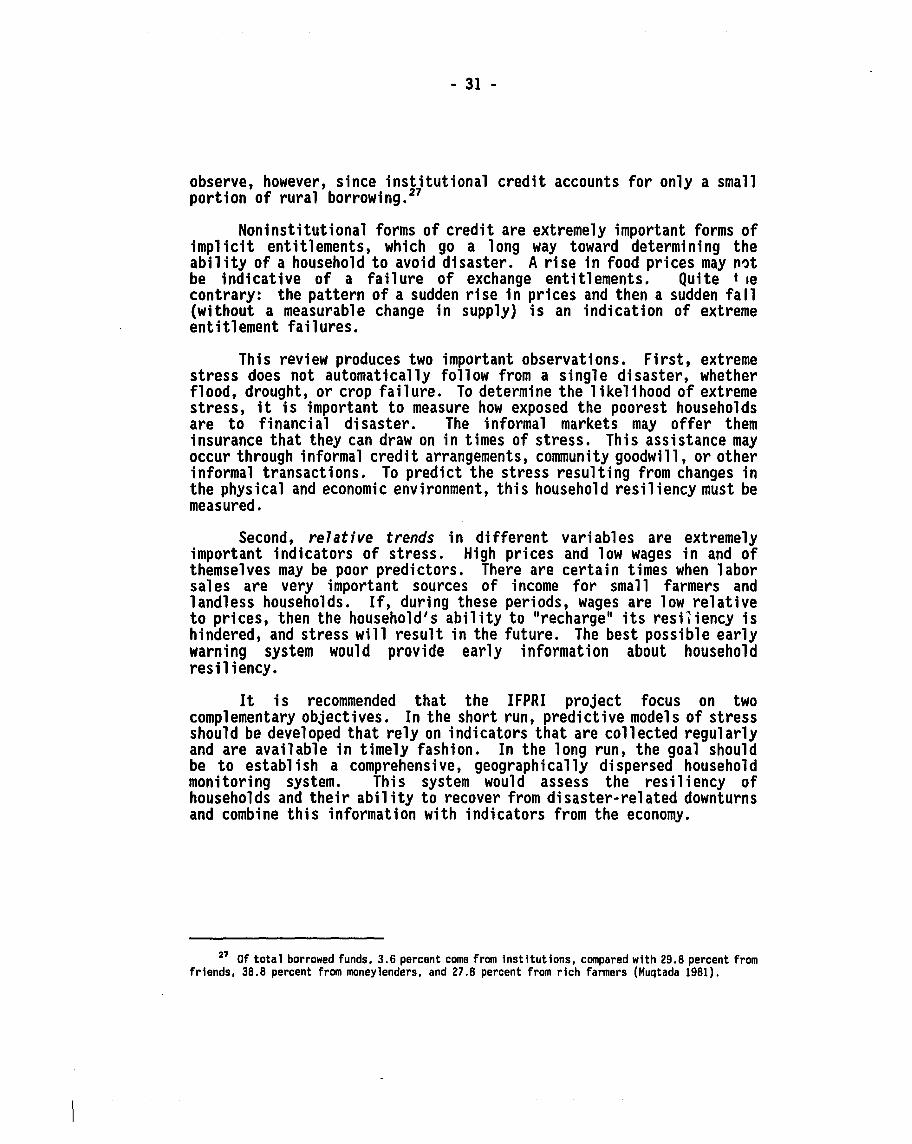
observe, however, since institutional credit accounts for only a smallportion of rural borrowing. 27
Noninstitutional forms of credit are extremely important forms ofimplicit entitlements, which go a long way toward determining theability of a household to avoid disaster. Arise in food prices may n~t
be indicative of a fail ure of exchange enti t1 ements. Qui te t Iecontrary: the pattern of a sudden rise in prices and then a sudden fall(without a measurable change in supply) is an indication of extremeentitlement failures.
This review produces two important observations. First, extremestress does not automatically follow from a single disaster, whetherflood, drought, or crop failure. To determine the likelihood of extremestress, it is important to measure how exposed the poorest householdsare to financial disaster. The informal markets may offer theminsurance that they can draw on in times of stress. This assistance mayoccur through informal credit arrangements, community goodwill, or otherinformal transactions. To predict the stress resulting from changes inthe physical and economic environment, this household resiliency must bemeasured.
Second, relative trends in different variables are extremelyimportant indicators of stress. High prices and low wages in and ofthemselves may be poor predictors. There are certain times when laborsales are very important sources of income for small farmers andlandless households. If, during these periods, wages are low relativeto prices, then the household's ability to "recharge" its resiliency ishindered, and stress will result in the future. The best possible earlywarning system would provide early information about householdres i1iency.
It is recommended that the IFPRI project focus on twocomplementary objectives. In the short run, predictive models of stressshould be developed that rely on indicators that are collected regularlyand are available in timely fashion. In the long run, the goal shouldbe to estab1 ish a comprehensive, geographically dispersed householdmonitoring system. This system would assess the resiliency ofhouseholds and their ability to recover from disaster-related downturnsand combine this information with indicators from the economy.
27 Of total borrowed funds, 3.6 percent come from institutions, compared with 29.8 percent fromfriends, 38.8 percent from moneylenders, and 27.8 percent from rich farmers (Muqtada 1981).

- 32 -
SHORT-TERM PREDICTIVE MODEL
Astylized model for early warning should have the following form:
(1)where
Yt = outcome of interest (possibly unacceptable rates ofmalnutrition, increased poverty, hunger, or householdstress) at time period t,
Et_, = earnings in the previous period,Pt-, = market prices (food) in the previous period,~_, = resiliency in the previous period, andSt_' = seasonal component of the previ ous peri od.
The entire functional relationship is conditioned on the latter twovariables. The relationship is specific to geographical areas; theconcepts are all defined on an aggregate (area-wide) level.
To make equation (1) operational, the concepts must be defined.Measurement of Et-, and ~_, on a timely basis is impossible withoutconducting a detailed household survey. This approach is advocated forthe long-run project, but in the short run, proxy variables have to bedefined and used. Two criteria should be considered when selectingthese proxies: similarity to the underlying concept and ease andtimeliness of measurement.
Prices (~_,) can easily be measured on a geographical basis. TheDivision of Marketing of ,the Ministry of Agriculture has a monthlyreport of wholesale grain prices from 56 agricultural stations aroundthe country. This data series exists for a long historical period, andcurrent prices are available immediately after the end of a month. Theaccuracy of these data is reportedly very good.
Earnings are the product of hours worked times wages. Both wagesand hours are determined in a large part by the seasonality of cropcycles. Demand for labor is high during periods of sowing andharvesting, while supply varies in a similar fashion (as home demandsand contracts change). Prior to periods of potential stress, the supplyof labor can only shift outward, because more people are clamoring forwork. Wages may fail to be a good proxy for earnings when high levelsof unemployment exist; this phenomenon is most likely during periods ofstress.
An unresolved question in Bangladesh is the existence ornonexistence of surplus labor and high rates of unemployment. Muqtada(1975) found virtually no excess labor during peak periods ofagricultural labor demand. He noted that on average there is surpluslabor but that it disappears during brief periods of peak demand. Islam

...
- 33 -
and Rahman (1978) contend that Muqtada's analysis was fatally flawed,and that there is a 10 percent surplus even during peak periods. Rahman(1986) found that only very small holders were fully employed during thepeak (demand) period; otherwise a very large surplus existed.
Ah~t!d provided a plausible explanation by showing substantial"vol untary" unemployment and underemployment. He noted that duri ng peakperiods virtually everyone wishing to work is employed. The overallimpression is an extremely inelastic supply of labor during a one or twomonth peak period followed by an elastic supply for the time remaining.
This issue is important for the following reasons. Data onagricultural wages are available on the same basis as the price datathrough the Department of Marketing. If unemployment is nonexistent,then wages will provide information about household earnings. Duringperiods of high unemployment, however, wages provide little information.If unemployment is high, it is presumed that the wage gravitates to afloor represented by subsistence; a man will not supply any labor belowa subsistence wage. Thus in times of high unemployment, agriculturalwages say nothing about household earnings.
There are alternatives to wages as a proxy for earnings. Thegeneration of wealth in all rural sectors is extremely dependent onagriculture. Labor sales, crop sales, input purchases, and secondarymarkets are all driven by the cycles and success of agriculturalproduction.
Land prices are available through the 485 field offices of theBangladesh Bureau of Statistics. However, there is at least a two monthdelay for processing, and there is some question about the quality ofthe data. Crop acreage is estimated by the Statistical, Bureau in itssurvey of "prices paid and received by farmers." The bureau's fieldagents count the number of plots (in a prespecified area) planted witheach crop. The Bangladesh Agricultural Development Council (BADC)collects data on the use of inputs (seeds for high-yielding varietiesand fertilizers).
As a measure of total grain availability, the World Food Programmeproduces a monthly tab1e of storage capaci ty for foodgra ins at thedistrict level and the position of stocks. This information isavailable 15 days from the end of the month.
WORK PLAN FOR AGGREGATE DATA
Collection of historical data will be important to assist inestimating trends. For this, a mechanism to organize and recordincoming data will need to be established, standardizing the dataaccording to geographical area. For example, if 56 rural prices and
...

• 34 •
wages are available on a monthly basis (from the Directorate ofMarketing), then other data should be matched to provide roughgeographical congruence. Average monthly prices, wages, and wage/priceratios should be computed for all areas for the historical period. Atthe outset, it should be understood what the analysis limitations ofsuch data will be. This type of surveillance system, aS,envisaged, isnot amenable to econometric estimation. It is also not intended toserve as a trigger for policy action. It can be used to evaluateincoming information in a historical context to identify potentialproblems. More information would be required prior to action.
In addition to data on rural prices and wages, data on land prices(land sales are not available), use of inputs, and formal loansrequested and accepted may also be collected and monthly means computed.The World Food Programme data on stocks should also be incorporated andmonthly means produced. In addition, data on the weather, includingrainfall and soil moisture, should be collected. This type ofinformation is probably easy to find.
"Normal" use of agricultural 1abor by geographical area shouldalso be computed. This task can be accomplished by using a croppingcalendar to determine when agricultural tasks are performed for eachcrop and how much labor is used per acre, and multiplying by acreage ofthat crop to obtain total use of labor by crop. These data will providea monthly profile of the use of agricultural labor by region.
When compiled and graphed, this information will be useful in andof itself. Current levels and trends can be compared with historicalones to see if there is a substantial deviation. The schedule of laboruse can be compared with the wage schedule to identify "normal" demand.A labor supply schedule can then be approximated that will helpdetermine the point in each region when the labor supply becomes highlyelastic and hence where unemployment is likely to become important.
The next step might be to determine what the different trendsmean. Known periods of stress must be identified to see which anomaliessurface in the data trends. The sensitivity and specificity of thevariables in predicting stress periods should be assessed. It isimportant to trace patterns of recovery from known floods and droughts.If the floods did not cause major stress, then how the variables behavedmust be determined so that similar patterns can be identified in thefuture.
A NOTE ON AN ALTERNATIVE SURVEILLANCE SYSTEM
UNICEF, in conjunction with the International Centre for DiarrhealDisease Research, Bangladesh, and various nongovernmental organizations,is currently involved in establishing an informal surveillance system to

- 35 -
provide anthropometry and subjective assessments in the different areaswhere the agencies are involved in field work. The intent of thissystem is to provide standardized information about the nutritionalsituation in each region and eventually to compare current withhistorical trends. It is hoped that the anthropometry, when combinedinformally with the additional information, will provide informationabout which areas are improving and which ones may be undergoing stress.
One of the true benefits of this system is that each of thenongovernmental organizations has a demographic surveillance project, sothat the ages of the children are known with certainty. It might beargued that when comparing changes, age bias is less important, but thisconsistency is still beneficial when using anthropometry.
It is recommended that IFPRI not get involved in this system. Thequality of the data will vary greatly across nongovernmentalorganizations that are also located randomly, and very little (if any)standardized socioeconomic information will be collected. It isappropriate for USAID to continue its support of the system. Thissystem may be well suited for its short-run needs, and the funding isminimal. However, it is strongly urged that USAID evaluate thehistorical specificity of disaster predictions made by many of thenongovernmental organizations. Anthropometry may not increase thisspecificity.
LONG-TERM SURVEILLANCE PROJECT
The preceding section presented the following picture. First,household stress is not something that can be measured on an abstractbasis from Dhaka. The predictive models outlined above may haveexceptional sensitivity but very poor specificity. The quality of thedata is suspect, particularly during periods of natural disasters. Thereliability and timeliness of the wage and price data are not known withcertainty. Because of the dynamics of labor supply and demand,measurable wages at many times may be a poor proxy for actual earnings.Given these problems it is proposed that a determinatlon be made whenagricultural wages are a good proxy for earnings. When the wage/earninglinkage breaks down, alternative measures of income are needed, althoughthey are extremely difficult to determine and quantify.
Information on household resil iency is needed for an accuratemeasure of stress. The short-term system described here is the bestthat tan be provided using currently available data. The potentialseriousness of the effects of floods and droughts is determined in largepart by thle ability of households to maintain their exchangeentitlements by selling labor, borrowing, and other means. Thishousehold resiliency can only be measured by household surveys, whichwill also provide the longer-term ability to assess stress. The

- 36 -
following describes a system that will produce reliable indications ofhousehold resiliency and, hence, of stress.
The Bangladesh Agricultural Research Council is forming a networkof research stations to investigate farm management practices, theadoption of agricultural technology, and other aspects of the changingfarm in Bangladesh. Included on the agenda for these stations will beongoing surveys of nearby farm and nonfarm households to assess theimpact of environmental and socioeconomic variables on householdresiliency and on decisions about consumption, production, and laborsupply and demand. There are currently 23 sites; the strategic planproposes one site for every agro-ecological zone in the country.
The research council is assembling a data analysis/research teamin Dhaka, where the data from the different sites will be centralized.The idea is to construct a network for analyzing the effects of changeson agricultural production practices, to organize the data analysisefficiently, and to produce relevant policy information.
Anthropometric data can be collected along with socioeconomic/farmdata at less frequent intervals. The resulting database and networkwould have a number of applications:
• Examination of the relationship of human nutrition with theother aspects of farm household behavior and decisionmaking,including labor supply, farm production, and timeallocation, are possible. The effects of commodity pricesand PFDS interventions on behavior and nutrition could beevaluated in a dynamic context. There are numerous benefitsto having panel data for these types of analysis.
• The geographical diversity of the proposed sites wouldprovide a perfect opportunity for early warning andrehabilitation surveillance. Prior to and after floods, theoverall resiliency of these households can be assessed on areal-time basis, providing a picture of vulnerability andrecovery. The effects of other disasters, such as drought,could be monitored on an ongoing basis in all areas of thecountry.
• Geographical diversity would also permit the analysis ofdecisions on production, labor supply, and other householdmatters for different regions. Some of these regions willpresumably be progressing economically at a more rapid pacethan others. Having these data will provide answers toquestions such as the following: how occupations in ruralindustri es change as growth progresses, how 1abor makesdec is ions, how 1abor markets are afr~cted, and how foodpolicy interacts with the changes that occur. The relations
"

•
- 37 -
and behavior of the landless and of farmers (prosperous andpoor) can be compared in the two broad types of regions.
IFPRI'S ROLE
The network described above is far from reality. USAID and IFPRIshould, however, realize the potential benefits of this system and makea long-term commitment to encourage and support its formation. IFPRI'sinvolvement should take the following forms:
Provide or seek financial support for the inclusion ofanthropometry in the data collection.
• Provide technical support for the data analysis. Ifnutritional anthropometry is to be collected, then IFPRIshould ensure that the appropriate analytical model sandtechniques are in place. This assistance will alsoencourage the collection of appropriate variables.
• Work to construct the institutional framework to ensure useof the information from the analyses. This framework wouldinclude liaison with the Food Ministry (via the FoodPlanning and Monitoring Unit), the Bangladesh Bureau ofStatistics, and the Bangladesh Agricultural Research Councilnetwork so that nutritional considerations are built intoplanning and policy discussions.
• Encourage the inclusion of landless laborers and smallfarmers in the household survey panels.
SUMMARY
This chapter outlined two parts of the IFPRI project. It proposesthe use of the Statistical Bureau's Nutrition Module and the HouseholdExpenditure Survey to provide a broad picture on economic developmentand nutritional status. Two level s of analysis are suggested, dependingon the availability of raw data. In addition, it proposes a system formonitoring nutritional status during periods of stress. Once again, tworoutes of analysis are indicated. A limited plan would emphasizecollection and centralization of data and analysis of the relationshipsbetween data trends and household/regional stress. The more ambitiouslong-term plan recommends that IFPRI promote the formation of a systemto measure household res 11 iency so that the effects of di sasters onstress can be predicted reliably.

5. DESIGN OF AFIELD STUDY
The review of the studies of the PFDS and nutritional status inBangladesh showed thtt if the PFDS' effectiveness in improving theconsumption of the rural poor is to be evaluated comprehensively, someunanswered questions must be addressed. The majority relate to theeffect of participation in the PFDS on households. Amicrolevel fieldstudy of household behavior is recommended to answer the questions.
This chapter looks at the design of a field study. It firstpresents a conceptual model that outlines the variables and forms ofanalysis that economic theory requires. Second, it discusses the issuesand data requirements involved in the study. Discussions of the sampledesign and sample size are next, followed by a look at the variables andtypes of analysis needed. Finally, some supplementary analysis isdiscussed.
CONCEPTUAL MODEL
Economic theory says that consumption of foods is a function ofrelative prices, income, assets, and the demographic characteristics ofhouseholds. A reduced form demand equation for, say, aggregate foodwould be expressed as follows: 28
(2)where
qik = f(P, Mk , Ak ; Ck )
qik == quantity of good i consumed by household k,P == vector of the prices the household faces,Mk == income of the household,Ak == its assets, andCk == vector of demographic characteristics.
The theory of the farm household (see Strauss et al. 1986) exten~s
this expression: Mk is endogenous, and changes in food prices affectfarm profits. A recursive farm. household mode1 29 would produce areduced-form demand equation as follows:
28 Note that income is assumed to be exogenous. This assumption is inappropriate inBangladesh, where "income," if properly defined to include transfers from the PFOS and borrowing,is a choice variable.
28 The model assumes that the separability condit ions are met (see Strauss et a1. 1986,chapters 1 and 2).

- 39 -
(3)
where Prk is farm profits (. Sk*P., where Sk is a vector of marketedsurpluses and p. is its corresponding price vector) and Mnfk is nonfarmincome. Thus, there is an added price effect: changes in the prices offarm-produced and marketed goods have the same substitution and incomeeffects as posited by normal demand theory, as well as an added profiteffect. This profit effect should include the effect of changes inprices on marketing decisions, as well as their effect on profits.
By assuming that households maximize utility with respect to thenutritional status of their members, equation 2 can be rewritten in anumber of ways. First, the dependent variable can be specified as thehousehold consumption of specific nutrients. The resulting price andincome parameters will provide information about nutrient elasticities,or the percentage change ina household's consumpt ion of nutri entsproduced by a 1 percent change in prices or income. Second, thedependent variable can be specified as individual consumption ornutrient intakes; the resulting estimates will show how exogenous shiftsaffect individual intakes of nutrients. Finally, individualanthropometric outcomes can repl ace qik so as to show how exogenouschanges affect them. In all of these cases the vector of demographichousehold characteristics should be expanded to include the variablesaffecting household growth technologies, that is, how households convertnutrients into observable anthropometric outcomes. This growthtechnology would include all variables affecting how householdsdistribute food among their members, those affecting disease andinfections, and anything that influences how nutrients are used toproduce growth.
An additional estimable set of equations relates to the growthtechnology itself--how the nutrients consumed affect growth. In allcases careful attention should be given to which variables are subjectto household choice and which are not. The following equations can beestimated:
qik = f(P, Prk, Mnfk , Mpfk, Ak; Ck)
nmk = f(P, Prk, Mn!k' Mpfkt Ak, NTk; Ck)
nmlk = f(P, Prk, Mnfk, Mpfk , Ak, NTk; Ck)
glk = f(P, Prk, M"fk' Mpfk , Ak, NTk; Ck), and
glk • g(N" NTk, NTI)
(4)
(5)
(6)
(7)
(8)
(9)

- 40 -
where
glk
• amount of nutrient mconsumed by household k,• respectively, the quantity of good i and nutrient m
consumed by individual 1, a member of household k,• growth (height change and weight change) of individual
1, a member of household k,• income from public food distribution received by
household k (an endogenous under variable),III generic nutritional-status technology shifters for
household k (water source and latrine, which might bemodeled as endogenous), and
• vector of nutrients consumed by individual 1.
There are a number of missing equations, such as the determinants ofPFDS participation and of household income. 3o Further, suitableinstruments must be identified for nutrient consumption in equation 9,although these equations represent the general format of the models thatwill be used to answer the previous questions.
Given this background, the natural question is how the PFDSaffects these relationships and, ultimately, child nutrition. There arefour plausible ways:
• It can change household income and the source of income;
• It can change relative prices;
• Participation in the PFDS can interact with the vector ofdemographic attributes, the result being an extra-incomeeffect; and
• Participation can change the nutrition technology of thehousehold through its effect on the intrahouseholddistribution of resources or by changing th~ efficiency ofgrowth production (use of nutrients).
The 1atter two items acknowl edge that the programs can havedifferent effects than those produced by normal price and incomeshifters. The food received through any of the PFDS channels may beviewed differently from normally purchased foods because of differencesin quality or simply because program participation affects the wayfamilies behave. In the case of the Food for Work Program, anotherpossibility is that the lumpiness of the payments makes people treat theincome differently. The marginal propensity to consume from PFDS income
30 Given the discussion of household resiliency in the previous chapter, "income" could includeborrowing, dissaving, and so forth.

--.II
- 41 •
ma,Y be different from that of normal income, something that has pol icyrelevance and is easily tested.
All these factors make it worthwh i1e to exami ne not only howrelative prices change, but also how participation in the program (whichis a choice variable) affects consumption, the allocation of food, and,eventually, nutritional outcomes. Whether the PFDS increases income orchanges relative prices depends on the type of the program and the sizeof the quota.
If the ration quota is inframarginal, that is, less than theamount that a family normally consumes ina given peri od, then theration price has no effect on prices. In both the monetized andnonmonetized programs, theory says that the transfer is a pure incomeshift: in the nonmonetized channels the income shift is equal to theprice of the good times the quantity, while in the monetized case it isequal to the quantity provided times the difference between the marketand ration prices. In both cases it is interesting to see whetherhouseholds treat this income differently from other income (the lattertwo questions above).
If the household was consuming less than the quota before the PFDS(extramarginal effects), then the relative price of the good in questionis changed. In the nonmonet ized case the pri ce of that good is nolonger relevant for consumption decisions, except that it (the marketprice) determines the amount of the subsidized good sold (and the incomefrom the sale), that is, the leakage. In the rationing case the pricethat should enter the demand (for commodities or nutrients) is theration price of the good. In both cases added income is calculated asbefore.
If the quantity is extramarginal, then in the rationing case therelative price of the good in question changes. For these extramargina1households it is necessary to determine whether the ration price affectsthe amount of agricultural surplus the household sells (assuming, ofcourse, it is a producer). If PFDS grains substitute for home-producedgrains, then rationing will increase the marketed surplus, independentof the change in the selling price induced by the quantities availablethrough the PFDS. In addition, the PFDS will increase the aggregatesupply of grains (assuming, as is the case, that PFDS grains are mostlyobtained through donors at concessionary prices), a shift that willcause some decrease in market prices. In sum, the effect of the PFDS onproduction decisions must be measured.
The studies mentioned earlier lead to the conclusion that, in thecase of ration shops (the Rural Rationing Program), the quantitiesallotted are likely to be all inframarginal. Thus, the focus should beon income shifts and production decisions (resulting from the changes inexpected farm prices). In the case of the Vulnerable Group Development

- 42 -
and the Food for Work Programs, the amounts of wheat provided are almostsurely extramarginal, and the focus should al so be on the incomeprovided by the foods, since no purchase price is changed.
SUMMARY OF THE MODEL AND THE LITERATURE
The literature review and the conceptual model raise severalquestions that have to be answered in a review of the impact of the PFDSon nutrition. The answers may have broad policy implications and willhelp focus the discussion: how can the PFDS be altered to improve thenutritional impact, and how do nutrition and the PFDS enter into thebroader development picture?
In the context of the above issues the following questions are ofinterest:
• What determines the decision to participate in the PFDS?Specifically, the focus would b~l on the Rural Rationingprogram and the nonmonetized channels (Food for Work andVulnerable Group Development):
What characteri st ics of the sY:ltem's design affectparticipation?What kinds of individuals are most likely toparticipate? This information will permitconstruction of a profile of participants and thedrawing of inferences about total program coverage andeffectiveness.What factors affect the frequency and intensity ofparticipation?How do seasonal factors affect participation?
• How dOes added income from the PFDS channels affect theintake of nutrients by households and individuals?
How large an effect does the PFDS have on householdincome at various times of the year?Is PFDS "income" treated differently?
• How does the PFDS affect nutritiQnal status?Does PFDS grain contribute to the consumption ofnutrients during the lean season so as to improveanthropometric indicators? Is less seasonality,holding income constant, better?Is the measured nutritional status of PFDS householdshigher than it woul d be if they were notparticipating?Has the nutrition effect of increased grainconsumption by these households been masked byproblems with the technology of nutrition production?

- 43 -
Interesting policy-related information would resultfrom an examination of the effect of sanitary watersources and latrines on nutritional status. If theseconditions were found to be important or to interactwi th nutri ent intake, then a poli cy woul d be toincrease their coverage. Food for Work is a plausibleinstrument to attain this objective.
• How do PFDS-induced changes in prices affect decisions onthe production and sale of PFDS grains and marketedsurpluses?
Does PFDS grain inhibit local production?Do changes in market prices affect the consumption ofnutrients?
• Does the PFDS effectively reduce the huge seasonal swings infood consumption observed in Bangladesh? How can thisaspect of the program be enhanced? Do the effects ofseasonal ity diminish as more growth in agriculture andemployment occurs? That is, are the seasonal consequencesdependent to a large degree on the overall level of poverty?
• Does nutritional status affect decisions on the supply oflabor and wages received? Are better nourished workers moreproductive, and do they tend toward different occupations?
On a broader scale, the relationship between food policy,r~trltional status, and economic growth must be examined. First, arepeople in areas that experience more economic growth better offnutritionally? Does the PFDS become less important to income acrossareas (as reflected through declining rates of participation even amongthe worse off)? How does the nutrition and labor supply relationshipdeter'mine employment patterns and occupations across areas of low andhigh growth?
To answer the questions raised above, a microlevel study offarm/household behavior is necessary. The study would be aimed atassessing the effects of the new Rural Rationing Program and thenonmonetized relief channels.
SAMPLE DESIGN AND SAMPLE UNIVERSE
This study can be designed in one of two broad ways--it can benationally representative or not. For a nationally representativesample, a two-stage sampling procedure might be used. In the firststage a number of cl usters are chosen at random from a nationaluniverse. These clusters might be, for example, upazilas or unions. Inthe second stage the sampling universe would be defined as all
- 44 -
inhabitants of these clusters. A random sample of these would then bedrawn for each cluster. The results could be aggregated at a nationallevel and would be representative of the nation.
Alternatively, during the second stage the universe might bedefined as all members of a certain group, such as participants in aPFDS program. This approach was followed in the World Food Programme'sstudy of the Vulnerable Group Feeding Program. The results can then beaggregated to be nationally representative of all participants in thatprogram.
For nonnationally representative samples, particular villages orareas could be identified on the basis of a particular characteristic.For example, flood proneness might be assessed, with one village chosenfor being flood prone and another not. The IFPRI-Bangladesh Instituteof Development Studies assessments of the Food for Work program wereconducted in villages selected for being low versus high technology andfor having developed versus underdeveloped infrastructure. In thepresent study, during the first stage, lists of flood- and nonfloodprone cl usters coul d be drawn up and the sampl e cl usters chosen atrandom from those lists. At the second stage, the universe would thenbe all village inhabitants or some subset of them. The results wouldnot be nationally representative if the number of clusters chosen wassmall, but the random selection at the second stage would mean that theresults would be representative of each broad type of village.
The following discussion of these methods is confined to theeffects which the sampl ing has upon the abil ity to draw inferencesconcerning specific populations and the nation as a whole. 31 To drawinferences about the national population, a national probability sample,either simple random or cluster, is needed. The National NutritionSurveys and the Household Expenditure Survey of Bangladesh32 usednational probability samples to draw inferences about Bangladesh. Ifthe intent is to draw inferences about a national population of programparticipants, the first stage of the cluster selection must occurrandomly from a national list.
In the second case, inferences cannot be made about the nationalpopulation. If the villages are selected at random from a comprehensive
31 Different methods, including one- versus two-stage sampling, can be justified on a numberof grounds, including cost.
32 It has been determined that the Household Expenditure Survey is not nationallyrepresentative, since many of the more inaccessible districts are not included. There is doubt aboutwhether this exclusion occurred by chance.

- 45 -
list of villages belonging to a certain type, then inferences can bemade only about the national population of these village types. 33
This discussion is particularly relevant to the IFPRI study, whichhas two conflicting goals. The first is to draw inferences about theeffectiveness of the three major PFDS programs (Rural Rationing, Foodfor Work, and Vulnerable Group Development), including an evaluation ofthe amount of grains received relative to the amounts programmed. Thiscomponent calls for a random selection from a national list of clustersand a universe at the second stage that includes all participants in thethree programs. At the same time, the IFPRI project should includenonparticipants as well as participants. 34 Given the extremely smallcoverage of the PFDS programs, an economically viable sample size mightnot include any or enough participant households. 35 Oversampling ofthe participant groups is necessary.
The next issue is the national representativeness of the sample,which is basically a matter of cost versus inference. The study goalsinclude the examination of a number of factors related to nutrition andconsumption: the effects of seasonality; effectiveness (coverage andadequacy) of the PFDS; comparison of high development versus lowdeve1opment areas; and opt i rna1 deli very of PFDS serv ices. Exami n1ngthese factors requires intensive household interviews that includevarious degrees of recall, weighing and measuring of household members,and careful elicitation of the sources of income.
If the first stage (selection of clusters) is designed to ensureadequate- variation in these factors while still retaining nationalrepresentativeness and conducting intensive household interviews, thenthe sample size will have to be very large and the cost of the surveyprohibitively high. It is recommended that the first stage focus onachieving adequate variation in these factors and not on nationalrepresentativeness.
If the leakage, coverage, and adequacy of the Rural Rationingshops is an important concern,36 then a national probabi1 ity samplecould be designed to look specifically at these issues. It could beconducted in a manner similar to that of the World Food Programme's
33 Assuming that n, the number of villages chosen from the total village universe, issufficiently large.
34 It is difficult to evaluate the determinants of participation without the knowledge ofpeople who do not participate, as well as those that do.
35 The universe will be all households, not just participants.
31 The results of this survey will suggest the probable magnitudes of these problems and mayhelp determine whether another sample is needed.

- 46 -
survey of the Vulnerable Group Development program. Both the VulnerableGroup Development and the Food for Work programs have been adequatelystudied in this regard; they are very leaky, and the problems occurmostly at the local level. There is no need to design an additionalstudy to determine with more accuracy the amount of leakage from the twoprograms. The universe (after the villages are chosen) will include allhouseholds, although an oversampling of PFDS participant households isnecessary.
Two broad village types may be studied: those with and withoutpermanent Rural Rationing shops. This approach will permit aninvestigation of the effects of shop placement on rates of participationand of the calculated benefits. There are certainly beneficiaries invillages without the shops (the shops are intended to serve more thanone village); examining rates of participation among people outside thevillage will provide information about the merits of establishingadditional ones.
It is expected that flood-prone villages will exhibit moreseasonal variations in consumption, employment, and nutritional statusand, in addition, will have higher coverage by the nonmonetized reliefchannels, mainly the Vulnerable Group Development and Food for Workprograms. Therefore flood-proneness would be used to identify highlyseasonal villages. For each broad type of village, one will be selectedthat 'is flood-prone and the other not. The villages can be identifiedby using the World Food Programme's stress map. Nonmonetized relief isallocated according to this stress map, with the more stress-prone areasreceiving higher per capita allotments of Vulnerable Group Developmentrations and Food for Work services.
Two areas should be selected based on the levels of certaindevelopment indicators: one area that seems to be progressing andanother without much growth. Selection of these areas will be difficultsince many of the economic statistics from the interior are suspect.One criterion for selection could be productive infrastructure: if onearea can be located with a high concentration of surfaced roads or ahigh index of infrastructure, it can be compared with a backward areawhose infrastructure is much more poorly developed. Similarly,developed villages can be identified as those close to a major road.
Finally, two large market centers of fewer than 50,000 peoplewould be selected from a list. Inclusion of these market villages willpermit a comparison of the labor linkages between rural developed andunderdeveloped and urban areas and the changing role of the PFDS asurbanization increases. Thus, there will be 10 major survey villagesselected on the basis of the characteristics presented in Table 7.

- 47 -
Table 7- M Criteria for 10 sample villages
Villages
Villages with ration shopsFlood proneNot flood prone
Villages without ration shopsFlood proneNot flood prone
Large market villages
High
xx
xx
x
Iqopoliq Pr0qr'"Low
xx
xx
x
The data collection must be designed with seasonality in mind, andthe information on labor supply and agricultural production should becrop-specific. The surveys would be conducted following the three majorcroop harvests corresponding to distinct seasonal periods: during theSeptember-October lean season (which precedes the aman harvest), afterthe aman harvest, and following the boro harvest. Nutritional surveyshave shown that the September-October period usually produces the worstanthropometry, the January-February (post-aman) period the best, withthe May-June (post-boro) months being a swing period. Thus, thecropping periods correspond roughly to the seasonality of consumption.The universe for the study would be all households in the village.Lists can be obtained at union headquarters.
SAMPLE SIZE
In rural areas the share of beneficiaries of the Vulnerable GroupDevelopment, Food for Work, and Rural Rationing programs in thepopulation is approximately 2.5 percent, 5.0 percent, and 4.0 iercentrespectively.37 A random sample of all village households 8 thatwould guarantee an adequate proportion of each household type would haveto be very large. If the four variables were used to stratify thesample (non-PFDS, Vulnerable Group Development, Food for Work, and RuralRationing households), the entire sample population would still beprohibitively large. Thus it was decided to oversample participanthouseholds in the three PFDS channels.
37 Assuming 89 million rural residents. there are 2.2, 4.5, and 3.5 million beneficiaries inthe Vulnerable Group Development. Food for Work. and Rural Rationing programs. respectively.
31 Villages will be preselected according to the previously mentioned criteria.
r-

- 48 -
Determining the sample size for a complicated design is notstraightforward. Cochran (1964) gives the following broad guidelines:the stratum sample proportion should be larger if the stratum is larger,the stratum is more variable internally, or sampling is cheaper in thestratum. The third guideline can be eliminated. In terms of internalvariability and size, the non-PFDS households should make up the largeststratum, followed by participants in the Food for Work, Rural Rationing,and Vulnerable Group Development programs. 39
Based on the above concepts, the stratum sample sizes are selectedin the followi'ng way. Household food consumption is thought to be themost important variable, and the criterion used is to have an estimateof mean household grain consumption within 5 percent of the populationmean with 95 percent certainty.
Since there is very little information about the standarddeviations in the population, the following assumptions are made: fornon-PFDS, Food for Work, Vulnerable Group Developments, and RuralRationing households, respectively, the per capita grain intakes are500, 450, 350, and 350 grams Ber day, with coefficients of variation of0.4, 0.33, 0.285, and 0.285. 4
Based on these criteria and assumptions, the optimal sample sizesare 256, 177, 130, and 130~ for non-PFDS, Food for Work, VulnerableGroup Development, and Rural Rationing households, respectively. To beconservative, these numbers are increased to 300, 200, 150, and 150.Given 10 villages, 80 households should be sampled from each.
There may be two main questionnaires. The first relates to thehousehold's assets and liabilities, agricultural production, use ofinputs, and crop sales, with the agricultural data referring to theprevious ~rop cycle. The second questionnaire focuses on consumption(and expenditures), income (including relief and other forms of PFDS),credit, and anthropometry and health. In addition to these items,permanent household characteristics may be measured, such as sanitaryfacilities, water, distance to markets, roads, ration shops, householdsize, ages, adult educational attainment, and literacy.
31 Here internal variability corresponds directly to stratum size.
40 The IFPRI/Bangladesh Institute of Development Studies document has a coefficient ofvariation for per capita grain consumption of 0.4 for the entire sample.
41 Computed using the simple formula n = (ts/d)2 from Cochran (1964). If household means areused with the same coefficient of variation, the stratum samples will be slightly smaller if theaverage household is thought to consist of two adults and three children who consume an adulteqUivalent grain value of 0.66.
- 49 .
A final, smaller questionnaire would measure communitycharacterist ics, incl udi ng permanent ones (i nfrastructure) and thosethat change (commodity prices and agricultural wages).
The following sections discuss the variables to be collected andtheir measurement. The variables are related to the conceptualframework and the models to be estimated. Adiscussion of the overallsurvey framework follows.
DETERMINANTS OF PROGRAM PARTICIPATION AND INTENSITY OF USE
The first question raised was the extent of program participationand its determinants. The variables hypothesized to affe~t a decisionto participate and the frequency of participation are
• Individual 1~: education (husband and wife), literacy(husband and wi fe) , occupat ions, and ages of householdmembers;
• Hoysehold level: landholding, household size, total incomeand sources of income, lagged participation, possession ofration (or Vulnerable Group Development) card, distance toration shop, distance to Food for Work and Vulnerable GroupDevelopment sites, and migration status;
• Commynity level: grain prices (ration prices and marketprices·-subsidy), wages, existence of permanent ration shop,ration quota (wheat/rice in the quota), regular availabilityof ration quantities, infrastructure (permanent grainmarket, and access to roads), and recent flooding. For thenonmonetized channels quotas and composition of relief arealso relevant.
These variables are easily identified and collected, except forthe regular availability of ration quantities. Several earlier studiesmentioned nonavailability as a reason for the frequent nonparticipation.These questions should be asked of participants: are rationsdistributed regularly? and do you sometimes visit a ration shop and findno grain? Variations of these questions (with more detail, such as howfrequently do you visit a Rural Rationing shop and find no grain?)should be considered in consultation with Food Planning and MonitoringUnit personnel.
Probit analysis of these decisions is needed. Participation inthe program (yes/no) would be the dependent variable, with the othervariables, or ~ome subset of them, the independent variables.Sequential testing is needed to see whether the seasonal regimes are
different or can be explained by dummy variables. Similar sequential

· 50 •
testing should be conducted for the decisionmaking patterns across thedifferent villages sampled. Are participation decisions made in similarways across varying community and economic characteristics?
The resulting information will provide a profile of users acrossproject areas. It should indicate which factors significantly affectthe probability of participation. These will include individual andeasily manipulated program characteristics.
Intensity of use of the Rural Rationing and Food for Work programscan be split into two categories: used intensively or usedsporadically. Then a bivariate probit problem can be set up. In thefirst stage the household decides to participate, whereas in the secondstage the household decides to use the programs intensively orsporadically.
A final issue that can be identified is bias in the distributionof the Rural Rationing and Vulnerable Group Development cards. Thispoint has not been addressed in previous studies, so that it may not bea matter of contention. However, an analysis of who receives cards(comparing them with people with similar incomes who do not receivethem) is possible. Some thought needs to be put into identifyingpossible explanatory variables.
CONSUMPTION, EXPENDITURES, AND LABOR SUPPLY
The first issue that should be addressed is the measurement ofconsumption. There is some evidence that measuring expenditures createsa bias in the resulting estimates of elasticity because wealthierfamilies have more leakage from their expenditures than do poorer ones.Some of this bias is eliminated by explicitly asking the quantitiesconsumed.
Both expenditures and quantity recall should be measured. Toframe the questions properly, an early visit should be made to eachhousehold, possibly to record household characteristics or decisionsabout farm production. Subsequently, the expenditure question can beframed, "since my last visit, how much have you spent on XXX outside theration shops?" The expenditure data should be combined with quantitiesconsumed from home production and their approximate value. The pricepaid per unit can also be solicited. Atwo-week interval between visitsis appropriate. If the period is longer, a question should be askedrelating to usual purchases of the good in question, for example, "howoften do you usually purchase this commodity?" To measure leakage thenumber of meals fed to nonhouseho1d members over the same timeframe asthe expenditure portion should be asked. Finally, expenditures on allnonfood goods should be recorded, along with frequency of purchase.

- 51 -
Twenty-four-hour recall of household consumption by quantityshould be collected. The International Centre for Diarrheal DiseaseResearch, Bangladesh, can provide gU1dance on the best recallmethodology (that is, whether weights or quantities are betterremembered). The information so'licited should include the source of thegrain in question (Rural Rationing, Vulnerable Group Development, Foodfor Work, or home produced). Meals consumed outside the home shouldalso be covered. If individual consumption is desired (equations 5 and7), then the in3trument should be designed to elicit 24-hour recall ofindividual consumption. Considerable detail is needed on qualitiesconsumed, including grades of rice and other grains consumed. Becausethe errors inherent in individual recall are enormous, training ofenumerators and the questionnaire's design are critical.
Next, a detailed description of participation in the PFDS shouldbe obtained, including quantities acquired and use of these quantities.The i~entity of the person who normally receives the goods should besolicited. Questions specifically related to ration quotas, VulnerableGroup Development quotas, and Food for Work quotas (days worked, averagehours per day, and payments received) should be used to gauge the amountthat people draw relative to the official amounts. The reasons fordrawing less than the full quotas should be investigated. These datawill be essential in determining program leakage.
Information on labor and employment, along with hours and wages,coveri ng the time between vi sits and the previ ous month shoul d berecorded for all economically active members. Information on wives'employment, including sales of home produced goods, is needed.
Other inceme sources, such as rent, borrowing, sales of goods, andremittances from Dhaka and abroad, should be obtained. The BangladeshAgricultural Research Council may be able to assist with questionsre9arding sources of nonfarm income.
NUTRITION AND HEALTH INFORMATION
Anthropometry (height and weight) should be collected for allchildren under six years old. In addition, their illness andimmunization history should be recorded, along with the incidence andseverity of diarrhea (the International Centre on Diarrheal DiseaseResearch, Bangladesh, should be consulted on the design of this part ofthe questionnaire). Breastfeeding history might be included. Duringone survey round the weight and height of all family members should berecorded. This information, along with data on wages and farmproduction, will allow the effects of nutritional status on wages andproductivity to be tested. Information on doctor's visits and relatedexpenditures should be recorded for all family members for the pastmonth and year.

- 52 -
FARM PRODUCTION AND USE OF INPUTS
This portion of the survey should ask questions relating to thelast major crop season. Use of inputs, including seeds, fertilizer,fuel, and pump repair costs, hired labor, exchange labor, own-labor, andall family labor, should be measul'ed, along with land under crops,including land rented in and rented out (and rental fees/receipts).Loans received and repaid should be recorded.
Crop yields, as well as quantities sold, quantities paid in kind,and quantities given away, should be covered. Any losses resulting fromflood damage or cyclones are important.
ADDITIONAL ISSUES
It is recommended that the farm production survey, along with thehousehold roster be completed during the first round (which should beSeptember-October of the year42
). Two weeks 1ater the survey teamwould return and complete the consumption, labor supply, andanthropometry components of the survey. A simil ar pattern should befollowed during the other two survey rounds.
The survey on market prices should be conducted during both visitsby collecting the prices of key consumption goods from a local retailoutlet. 43
If each survey team has two members and each questionnaire is keptto an hour, then four teams of two interviewers each can complete thesurvey of a village in a week per round. In each two-month interviewperiod a four-person team can cover four villages. Two four-team squadsand one two-team squad will be needed.
One supervisor per four-person team is important. Thus a minimumof 23 individuals is needed. If money becomes a constraint, then it isadvisable first to reduce the numbers of households per village and thenthe number of villages. Supervision is absolutely necessary to maintainenumerator quality.
42 In this case the farm production survey would refer to the previous aus paddy and juteharvests.
43 A list of these goods can be obtained by looking at food budget shares in the consumptiondata from the Household Expenditure Survey (Bangladesh Bureau of Statistics 1987).

- 53 -
FURTHER INFORMATION
Some additional information is needed to meet the data needs. Ascurrently drawn up, the teams will be conducting the questionnaires forsix months out of the year. The remaining six months are unprogrammed.Some time could be spent on entering the data, but a substantial portionwould still have time not accounted for. There are three possibilities:
• Their time could be spent conducting large sample interviewsof occupations and labor use within the study areas. Thisinformation would provide a detailed picture of howoccupation patterns vary seasonally across the designcriteria and as development progresses.
• Their time could be spent conducting a national probabilitysample to determine the extent of the leakage in the RuralRationing, Vulnerable Group Development, and Food for Workprograms and its determinants.
• Additional rounds could be added to the current survey.These rounds would examine consumption, income, and laborbehavior, as well as some small-scale agricultural activity.A set of additional rounds that almost certainly should beadded would straddle the Food for Work season. In the firstvisit anthropometric measurements of all children should betaken; on the second visit, after the Food for Work Programend:;, anthropometry shoul donee again be measured. Theappropriate questions on consumption, labor, and incomewould also be asked. It is recommended that free enumeratortime be used for the third option.
A number of additional issues have not been fully developed inputting this document together:
• Gender of the respondent--should one questionnaire bedesigned for men and another for women?
• Timing--when will men be home to answer questions?
• Ages of children--a lot of time should be spent discoveringhow best to elicit accurate responses.
• Intrafamily allocation of nutrients--these can be examinedclosely using the IFPRI/BIDS Food for Work data base.
• Food for Work--the survey rounds have to be timed correctlyto measure income from this program.
- 54 -
• Questionnaire design·-the IFPRI/Pakistan instrument seemsvery well designed.
• Supervision, transport, and logistics.
• Location of actual areas--there will be two Rural Rationingshops in every union, so that the study can be located inany area where the other criteria are ~ ..!t.
SUPPLEMENTARY ANALYSES
The large number of household surveys conducted in Bangladesh inthe past afford a unique opportunity to confirm the results of thissurvey in di fferent areas and di fferent times. The abil ity to usealternative studies depends on the availability/compatibility of thedependent and independent variables, the timing of the data collection(do the seasonal periods correspond?), data quality, and the willingnessof the proprietor of the data to allow supplementary analysis. Two datasets are recommended for supplementary analysis: the IFPRI/Bang1adeshInstitute of Development Studies (BIOS) study of the Food for Workprogram and the Currey data from Chilmari.
The IFPRI/BIDS Food for Work Stydy
Both the short- and long-run versions were described in detail inthe section on the literature review. The short-run data base can beused to estimate calorie and food (wheat and rice) consumption at thehousehold level as a function of income, demographic characteristics,and the contribution of the PFDS to income. Price data from a secondarysource should be incorporated. Careful attention should be paid duringestimation to the endogeneity of the decision to participate in the Foodfor Work Program. -O.H. Chowdhury at the BIOS has expressed an interestin being involved in the further analysis of these data; he isparticularly interested in examining the effects of improvements inhousehold sanitation on nutritional status.
Chowdhury also expressed interest in revisiting the villages inquestion to see what effect the seven years of infrastructure has had.It might be possible to conduct a scaled-down version of the earlierstudy, which looked exclusively at sources of income and employment,participation in the Rural Rationing Program, and nutritional status(anthropometry).
The long-run data base can be exploited to estimate individualnutrients and anthropometry-dependent equations. If individualconsumption is not measured during the field study, this step willprovide a 1ink between household and individual consumption.

,
. 55 -
Endogeneity should be carefully controlled for. Shubh Kumar at IFPRI isthe contact person for this purpose.
Bangladesh Agricyltyral Research Coyncil/Winrock Qiti
These data are derived from an ongoing intensive household surveyof Chilmari, Rangpur Division, in northern Bangladesh. The village islocated at the confluence of the Tista and Bramaputra rivers and is oneof the most disaster-prone areas in the world. Currently 168 householdsare being surveyed twice weekly. The data series extends back fouryears, with the first year containing a sample of 30 households.
The variables collected include employment (hours, wages, and formof remuneration) for all economically active members; income and credit(including detailed farm production and input information, and creditsources); and food transfers (from the PFDS). Detailed householdconsumption data, based on a half week reca11, along wi th vis i tors'meals and when members ate away from home are all available. Individualhealth and morbidity are included. Household characteristics andcommunity level information such as market prices are also available.
These data could be used to estimate the effects of income andparticipation in the PFDS, including the Vulnerable Group Development,Gratuitous Relief, and Food for Work programs, on food and nutrientconsumption at the household level. Shares of PFDS income in totalhousehold income in any seasonal period are readily available from thisdata base.
Bruce Currey, project manager, indicated that retrospectiveanalysis of this data is possible. He indicated that, prospectively, hewould like to add an anthropometry component to the data collection andneeds help doing so. Discussions with him could lead to IFPRI'sanalyzing his past data or contracting for someone to do so, and at thesame time provide support for anthropometry. If IFPRI were Willing toprovide technical and some financial support, use of the data base mightbe arranged.
These three sources of data can be exploited independently of thefield study. Pursuit of these analyses will require varying degrees ofsupervision or collaboration. Quality control and standard diagnosticsare necessary.
The output of these collaborative projects should be tables of thefollowing types:
• Share of the PFDS in total househo1d income for PFDSparticipants, by season, for each study.
• Share of total household food expenditures.

- 56 -
• Elasticity of the calorie intake by households with respectto income. Is PFDS income treated differently? Standardfunctional form and independent variables should beencouraged.
• Individual calorie elasticities for each study whereavailable. Is PFDS income treated differently?
• Income and PFDS coefficients for anthropometry-dependentequations, for each study where available.
Other Data Sets
Because of the large number of studies of Bangladesh, there arenumerous data sets that might, on the surface, seem appealing. Thefollowing sets were examined and rejected:
• Bangladesh Rural Action Committee's data set is notsuggested for the supplementary analysis. Although large,with some 2,000 households, it contains no measurement ofincome, insufficient detail on household consumption, andincomplete market prices.
• World Food Programme's studies of the Food for Work andVulnerable Groups Development programs provide very littleinformation on income.
• Save the Children (United States) data set supported adetailed control group study of women's empowerment. Itdoes not have any details on income, and the income data arefrom the 1986 census; the nutrition data are current.
• Helen Keller International data set has a large sample andoffers good health and nutrition data, but contains verylittle socioeconomic data relating to sources of income.
SUMMARY
A comprehensive field survey methodology is proposed here toinvestigate the links D~tween food policy, household production,consumption, and labor supp')y issues. The study would fecus on thedeterminants of participation in the PFDS and the effects of the PFDS onconsumption and, ultimately, on child nutrition. Questions relating tothe optimal pl acement of PFDS services, the effects of varying thecomposition of PFDS foods, whether grain transfers are more effectivethan income transfers in increasing nutritional status, and effects onseasonality will be addressed. Estimates of program leakages will be

- 57 -
made by comparing implied quotas, Vulnerable Group Development rations,and Food for Work wages with the official program numbers.
There is an inherent conflict in the goals of the IFPRI study, asnoted. If nat iona1 representat iveness is des ired, then a focus onspecific programs and their impact cannot be achieved within areasonable sample size. Thus the first stage of the sampling involvesselection of a stratification based on the key conditions of programeffectiveness. However, national representativeness is lost in theprocess. The comparisons between published and actual Vulnerable GroupDevelopment, Food for Work, and Rural Rationing rations will not berepresentative of the nation as a whole. However, these types ofcomparisons have already been made for the first two programs, and anadditional study is proposed to evaluate the administration of RuralRationing.
An additional choice has to be made regarding the measurement ofintrahouseho1d distribution patterns. Although it is clear they areimportant determinants of nutritional status, measurement is expensiveand fraught wi th errors. Part of the prob1em can be addressed bymeasuring individual nutritional status. However, a choice has to bemade whether to collect data on individual consumption of nutrients ornot.

6. CONCLUSIONS
This paper provides a review of a number of studies of PFDSeffectiveness and nutritional status in Bangladesh. It then outlines aplan of work for the IFPRI consumption/nutrition study in Bangladesh.A key part of the work plan is a field study, discussed in detail inChapter 5.
Chapter 3 showed that nutr'itional status is generally very poor,especially in rural Bangladesh. Since malnutrition is so closely linkedto poverty and inadequate food consumption, the PFDS can be an importantmeans of addressing the problem. Several of the PFDS programs weredesigned expressly to improve nutritional status among vulnerablegroups. These channels have been studied in detail and have been shownto be poorly administered and very leaky. Further, no study hasconclusively found a link between program participation and improvednutritional status.
The IFPRI study is designed to investigate these links. Chapter4 presents the work plan for the IFPRI project. It shows that the goalof monitoring nutritional status using economic variables that arereadily collected and available in Dhaka can have only limited success.Participation in an intensive household monitoring project is advocated.
Chapter 5 outl ines a field study designed to investigate thelinkages between participation in the PFDS program and improvedconsumption and nutritional status. Additional analyses of other datasets are proposed and described in detail.

BIBLIOGRAPHY
Ahmed, Raisuddin. 1979. Foodgrain supply, distribution, andconsumption policies within a dual pricing mechanism: A casestudy of Bangladesh. Research Report 8. Washington, D.C.:International Food Policy Research Institute.
Ahmed, Raisuddin, Omar Haider Chowdhury, Mahabub Hossain, Shubh K.Kumar, and Md. Abul Quasem. 1985. Development impact of theFood-for-Work Program in Bangladesh, summary. Final reportsubmitted to the World Food Programme, July, by the InternationalFood Policy Research Institute, Washington, D.C., and theBangladesh Institute of Development Studies, Dhaka.
Alderman, Harold, and Joachim von Braun. 1984. The effects of theEgyptian food ration and subsidy system on income distribution andconsumption. Research Report 45. Washington, D.C.:International Food Policy Research Institute.
Alderman, Harold, M. Ghaffar Chaudhry, and Marito Garcia. 1988.Household food security in Pakfstan: The ration shop system.Working Papers on Food Subsidies 4. Washington, D.C.:International Food Policy Research Institute.
Anderson, M. A. 1979. Comparison of anthropometric measures innutritional status in preschool children in five developingcountries. American Journal of Clinical Nutrition 32.
Bangladesh Bureau of Statistics. 1986. Report of the BangladeshHousehold Expenditure Survey 1981-82. Dhaka: BBS.
__...."..... 1987. Report of the Child Nutrition Status Module,Bangladesh Household Expenditure Study, 1985-86. Dhaka: BBS.
Bangladesh, Ministry of Food (MOF). 1986. Report on the eXistingsystem of public food distribution in Bangladesh and proposal forrestructuri ng. Report prepared by Bangl adesh Economi c Consul tants(BECaN), for the Ministry of Food, Dhaka. Mimeo.
Beaton, George H., and Hossein Ghassemi. 1982. Supplementary feedingprograms for young children in developing countries. AmericanJournal of Clinical Nutrition 35(4).

- 60 -
BECON (Bang1 adesh Economic Consultants). 1988. Final report onmodified rationing in Bangladesh. Prepared for the BangladeshMinistry of Food, Dhaka. Mimeo.
Brown, K. H., R. E. Black, S. Becker, and A. Hoque. 1982. Patterns ofphysical growth in a longitudinal study of young children in ruralBangladesh. American Journal of C7inica7 Nutrition 36(2): 294302.
Brundin, Hja1mar. 1979. Food for Work in Bang1adesh--Recommendationsfor improved program effectiveness. Dhaka. Mimeo.
CARE International. 1988. Final report on the FV88 integrated Food forWork Program: Analysis of strategies and achievements. Dhaka.Mimeo.
Chen, L. C., A. K. A. Chowdhury, and S. L. Huffman. 1979. Seasonaldimensions of energy protein malnutrition in rural Bangladesh:The role of agriculture, dietary practices, and infection.Ec070gy of Food and Nutrition 8: 175-187.
Chen, L. C., A. K. A. Chowdhury, and S. L. Huffman. 1980.Anthropometric assessment of energy-protein malnutrition andsubsequent risk of mortality among preschool aged children.American Journa7 of C7inica7 Nutrition 33: 1836-1845.
Chen, L. C., E. Huq, and S. D'Souza. 1981. Sex bias in the familyallocation of food and health care in rural Bangladesh.Popu7ation and Deve70pment Review 7(1): 55-70.
Chowdhury, A. K. M. A.. 1988. Child mortality in Bangladesh: Foodversus health care. Food and nutrition bu77etin 10(2): 3-8.
Chowdhury, A. K. M. A., S. L. Huffman, and G. T. Curlin. 1977.Malnutrition, menarche, and marriage in rural Bangladesh. Socia7Bi070gy 24(4): 316-325.
Chowdhury, Omar Haider. 1989. Analytical bib1 iography on ruraldevelopment. Acritical review of studies on nutrition in ruralBangladesh. Dhaka. Mimeo.
Chowdhury, Rafiqu1 H. 1984. Determinants of dietary adequacy forpre-school children in Bangladesh. Food and Nutrition Bu77etin6(4).
Currey, Bruce. 1978. The famine syndrome: Its definition for reliefand rehabilitation in Bangladesh. Ec070gy of Food and Nutrition7.

- 61 -
Darton-Hill, Ian. 1987. Wheat consumption of vulnerable groups inBangladesh. Paper prepared for Helen Keller International, Dhaka.Mimeo.
EUREKA (Bangladesh) ltd. 1986. Study on subsidies in public fooddistribution system in Bangladesh. Dhaka. Mimeo.
Hassan, Najmul, and Kamal Uddin Ahmad. 1984. Studies on food andnutrient intake by rural population in Bangladesh: Comparisonbetween intakes of 1962-64, 1975-76, and 1981-82. Ec070gy of Foodand Nutrition 15(2): 143-158.
Helen Keller International (HKI). 1985. Bangladesh nutritionalblindness study 1982-83, key results. HKI and Inst1tlMte of PublicHealth and Nutrition, Dhaka. Mimeo.
Helen Keller Internatinnal and Institute of Public Health and Nutrition.1983. Bangladesh xerophthalmia prevalence survey: Initial datareport. Dhaka. Mimeo.
Huffman, S. L., A. K. A. Chowdhury, and W. H. Mosley. 1978. Postpartumamenorrhea: How is it affected by maternal nutritional status?Science 200. .
Huffman, S. L., A. K. A. Chowdhury, and Z. M. Sykes. 1980. Lactationand fertility in rural Bangladesh •. Population Studies.
Institute of Nutrition and Food Science (INFS), University of Dhaka.1970. Nutritional surveillance of WFP Project 2226 for VulnerableGroup Feeding in distressed areas of Bangladesh. Dhaka. Mimeo.
_________• 1977. Nutrition survey of rural Banglade~h, 1975/76. Dhaka.
__________• 1978. Work p7an 1978-83. Dhaka: INFS.
______~. 1979. Acceptance of sorghum. A study of the Public FoodDistribution System in Bang7adesh. Dhaka: INFS.
_________• 1980. Acceptance of sorghum: Report II. Dhaka: INFS.
_________• 1981. Food for work: An evaluation of the primary andsecondary effects. Dhaka. Mimeo.
_________. 1983. Nutrition survey of rural Bangladesh, 1981/82. Dhaka.
Islam, M.S., and Rushidan Islam Rahman. 1978. Surplus labor inBangladesh agriculture--A comment. Bang7adesh Deve70pment Studies6(2).

- 62 -
Islam, M. S., M. M. Rahman, K. M. S. Aziz, M. Rahman, M. H. Munshi, andY. Patwar1. Infant mortality in rural Bangladesh: An analysis ofcauses during neonatal and postnatal period. Dhaka:International Centre for Diarrheal Disease Research, Bangladesh.
Israel, Ron, et al., eds. 1983. Maternal and infant nutrition reviews,Bangladesh. Newton, Mass.: International Nutrition CommunityService Pub.
Kielman, A., C. Ajello, and N. Kielman. 1980. Evaluation of nutritionintervention projects. Final report of the do~umentation
coordinator. Washington D.C.: U. S. Agency for InternationalDevelopment.
Kennedy, Eileen T., and Harold H. Alderman. 1987. Comparative analysesof nutritional effectiveness of food subsidies and otherfood-related interventions. International Food Policy ResearchInstitute, Washington, D.C .• Mimeo.
Kumar, Shubh K. 1979. Impact of subsidized rice on food consumptionand nutrition in Kerala. Research Report 5. Washington, D.C.:International Food Policy Research Institute.
______~. 1987. The nutrition situation and its food policy links. InAccelerating food production in Sub-Saharan Africa, ed. JohnMellor, Christopher Delgado, and Malcolm Blackie. Baltimore, Md.:Johns Hopkins University Press for the International Food PolicyResearch Institute.
langsteQ' Ray. 1981. The effect of crises on differential mortality bysex in Bangladesh. Bangladesh Development Studies 9(2): 75-96.
Muqtada, M. 1975. The Seed-fertilizer technology and surplus labor inBangladesh agriculture. Bangladesh Development Studies 3(4):403-428.
____~. 1981. Poverty and famines in Bangladesh. BangladeshDevelopment Studies 9(1).
Murshid, K. A. S. 1987. Micro-level adjustment to food grain shortagesin Bangladesh. Bangladesh Development Studies 15(2).
Nelson, G. O. 1979. Food aid and domestic foodgrain production inBangladesh. Resource Paper, A&P Agricultural and Resource StaffSeminar, Yogyakarta, Indonesia.
Osmani, S. R., and o. H. Chowdhury. 1983. Short-run impacts of Foodfor Work Programme in Bangladesh. Bangladesh Development Studies11(2): 135-190.
I

• 63 •
Pitt, Mark M. 1983. Food preferences and nutrition in ruralBangladesh. Review of Economics and Statistics 65(1): 105·114.
Rahman, Atiq. 1986. Poverty alleviation in the most disadvantagedgroups 1n Bangladesh agriculture. The Bang7adesh Deve70pmentStudies 14(1).
Rahman, M., et ale 1984. Health status of the rural poor inBangladesh. International Centre for Diarrheal Disease Research,Bangladesh, Dhaka. Mimeo.
Ravallion, Martin. 1987. Markets and famines. New York: OxfordUniversity Press.
Save the Children Fund (United Kingdom). 1979. Bangladesh. RiverProject: Nutrition survey report 1. Dhaka. Mimeo.
Strauss, John. 1986. Does better nutrition raise farm productivity?Journal of Politica7 Economy 94(2): 297-320.
UNICEF, (United Nations Children's Fund). 1984. The State of thewor7d's children 1984. Oxford: Oxford University Press.
__....".-.. 1987. An analysis of the situation of children. inBangladesh. Dhaka: BRAC Publishers.
World Food Programme. 1986. Report on 1985 survey of VGFPbeneficiaries. Dhaka. Mimeo.
_____' 1988a. Final monitoring report 1987/88. Dhaka. Mimeo.
____-:-. 1988b. Report on field monitoring of Vulnerable GroupsDevelopment Programme. Dhaka. Mimeo.
_______' 1989. Bangladesh foodgrain forecast, 4/89. April 10.
World Health Organization. 1980. The incidence of low birth weight:A critical review of available information. World HealthStatistics Quarterly 33(3).
World Bank. 1979. Bangladesh: Current trends and development issues.Washington D.C.: South Asia Regional Office, World Bank.
____~. 1981. World Deve70pment Report 1981. Washington, D.C.:World Bank.