
A Hybrid Taguchi-Immune approach to optimize an integrated supply chain design problem with multiple...
12
Production, Manufacturing and Logisitics A Hybrid Taguchi–Immune approach to optimize an integrated supply chain design problem with multiple shipping M.K. Tiwari a, * , N. Raghavendra a , Shubham Agrawal b , S.K. Goyal c a Department of Industrial Engineering and Management, Indian Institute of Technology, Kharagpur 721 302, India b Operations Research and Industrial Engineering, Department of Mechanical Engineering, University of Texas at Austin, Austin, TX 78705, USA c Decision Sciences and MIS, John Molson School of Business, Concordia University, West Montreal, Quebec, Canada article info Article history: Received 18 October 2007 Accepted 10 July 2009 Available online 15 July 2009 Keywords: Supply chain design Optimization Taguchi Artificial Immune System Heuristic abstract Supply chain network design is considered a strategic decision level problem that provides an optimal platform for the effective and efficient supply chain management. In this research, we have mathemati- cally modeled an integrated supply chain design. To ensure high customer service levels, we propose the inclusion of multiple shipping/transportation options and distributed customer demands with fixed lead times into the supply chain distribution framework and formulated an integer-programming model for the five-tier supply chain design problem considered. The problem has been made additionally complex by including realistic assumptions of nonlinear transportation and inventory holding costs and the pres- ence of economies of scale. In the light of aforementioned facts, this research proposes a novel solution methodology that amalgamates the features of Taguchi technique with Artificial Immune System (AIS) for the optimum or near optimum resolution of the problem at hand. The performance of the proposed solution methodology has been benchmarked against a set of test instances and the obtained results are compared against those obtained by Genetic Algorithm (GA), Hybrid Taguchi–Genetic Algorithm (HTGA) and AIS. Simulation results indicate that the proposed approach can not only search for optimal/near optimal solutions in large search spaces but also has good repeatability and convergence characteristics, thereby proving its superiority. Ó 2009 Elsevier B.V. All rights reserved. 1. Introduction The desire to obtain competitive edge over other counterparts is driving each entity involved in a business process to concentrate its effort towards the area of Supply Chain Management which entails efficient matching of supply and demand and ensures maximum customer satisfaction at minimum cost. With the heightened expectation of customers for better service and on-time deliveries at reduced cost, extra pressure is continuously levied on the area of supply chain logistics and management. Logis- tics network design considering potential customer locations is therefore considered an important decision problem which must be resolved to ascertain optimum performance of the supply chain. The location theory was first introduced by Weber (1909), who studied the problem of locating a single warehouse among custom- ers in order to minimize the total distance between them. This work was followed by a plethora of researches. Moore and ReVelle (1982) modeled the hierarchical service location problem as hier- archical covering problem with the objective of maximizing the covered demand subject to fixed number of facilities and coverage constraints. Geoffrion and Graves (1974) converted the service le- vel requirements into a product specific delivery delay bound, where the average time taken to deliver the product to all the cus- tomers and warehouses must be less than the bound. Pirkul and Schilling (1991) further extended the maximal covering location problem with capacity limit constraint on the facilities. Nozick (2001) discussed a fixed charge facility location model with cover- age restrictions. Two Lagrangian relaxation based heuristics have been utilized by him whereby both used the greedy adding algo- rithm to calculate the upper bounds while sub-gradient optimiza- tion was used to calculate the lower bounds. Other representative set of researches include works by Jayaraman and Pirkul (2001), Jayaraman and Ross (2003), Yan et al. (2003), Syam (2002), Amiri (2006), Gen and Syarif (2005) and Truong and Azadivar (2005). The large number of studies dealing with the supply chain design problem have been surveyed by Vidal and Goetschalckx (1997), Beamon (1998), Erenguc et al. (1999), Pontrandolfo and Okogbaa (1999) and Goetschalckx et al. (2002). Chan et al. (2002) simulated the supply chain of single channel logistics network incorporating order release theory. Chan and Chan (2006) have modeled the sup- ply chain as a distributed constraint satisfaction problem and have used simulation method to check the performance. They have developed coordination mechanism with quantity flexibility for 0377-2217/$ - see front matter Ó 2009 Elsevier B.V. All rights reserved. doi:10.1016/j.ejor.2009.07.004 * Corresponding author. E-mail address: [email protected] (M.K. Tiwari). European Journal of Operational Research 203 (2010) 95–106 Contents lists available at ScienceDirect European Journal of Operational Research journal homepage: www.elsevier.com/locate/ejor
-
Upload
independent -
Category
Documents
-
view
4 -
download
0
Transcript of A Hybrid Taguchi-Immune approach to optimize an integrated supply chain design problem with multiple...
European Journal of Operational Research 203 (2010) 95–106
Contents lists available at ScienceDirect
European Journal of Operational Research
journal homepage: www.elsevier .com/locate /e jor
Production, Manufacturing and Logisitics
A Hybrid Taguchi–Immune approach to optimize an integrated supply chaindesign problem with multiple shipping
M.K. Tiwari a,*, N. Raghavendra a, Shubham Agrawal b, S.K. Goyal c
a Department of Industrial Engineering and Management, Indian Institute of Technology, Kharagpur 721 302, Indiab Operations Research and Industrial Engineering, Department of Mechanical Engineering, University of Texas at Austin, Austin, TX 78705, USAc Decision Sciences and MIS, John Molson School of Business, Concordia University, West Montreal, Quebec, Canada
a r t i c l e i n f o a b s t r a c t
Article history:Received 18 October 2007Accepted 10 July 2009Available online 15 July 2009
Keywords:Supply chain designOptimizationTaguchiArtificial Immune SystemHeuristic
0377-2217/$ - see front matter � 2009 Elsevier B.V. Adoi:10.1016/j.ejor.2009.07.004
* Corresponding author.E-mail address: [email protected] (M.K. Tiwari)
Supply chain network design is considered a strategic decision level problem that provides an optimalplatform for the effective and efficient supply chain management. In this research, we have mathemati-cally modeled an integrated supply chain design. To ensure high customer service levels, we propose theinclusion of multiple shipping/transportation options and distributed customer demands with fixed leadtimes into the supply chain distribution framework and formulated an integer-programming model forthe five-tier supply chain design problem considered. The problem has been made additionally complexby including realistic assumptions of nonlinear transportation and inventory holding costs and the pres-ence of economies of scale. In the light of aforementioned facts, this research proposes a novel solutionmethodology that amalgamates the features of Taguchi technique with Artificial Immune System (AIS)for the optimum or near optimum resolution of the problem at hand. The performance of the proposedsolution methodology has been benchmarked against a set of test instances and the obtained results arecompared against those obtained by Genetic Algorithm (GA), Hybrid Taguchi–Genetic Algorithm (HTGA)and AIS. Simulation results indicate that the proposed approach can not only search for optimal/nearoptimal solutions in large search spaces but also has good repeatability and convergence characteristics,thereby proving its superiority.
� 2009 Elsevier B.V. All rights reserved.
1. Introduction
The desire to obtain competitive edge over other counterparts isdriving each entity involved in a business process to concentrateits effort towards the area of Supply Chain Management whichentails efficient matching of supply and demand and ensuresmaximum customer satisfaction at minimum cost. With theheightened expectation of customers for better service andon-time deliveries at reduced cost, extra pressure is continuouslylevied on the area of supply chain logistics and management. Logis-tics network design considering potential customer locations istherefore considered an important decision problem which mustbe resolved to ascertain optimum performance of the supply chain.
The location theory was first introduced by Weber (1909), whostudied the problem of locating a single warehouse among custom-ers in order to minimize the total distance between them. Thiswork was followed by a plethora of researches. Moore and ReVelle(1982) modeled the hierarchical service location problem as hier-archical covering problem with the objective of maximizing thecovered demand subject to fixed number of facilities and coverage
ll rights reserved.
.
constraints. Geoffrion and Graves (1974) converted the service le-vel requirements into a product specific delivery delay bound,where the average time taken to deliver the product to all the cus-tomers and warehouses must be less than the bound. Pirkul andSchilling (1991) further extended the maximal covering locationproblem with capacity limit constraint on the facilities. Nozick(2001) discussed a fixed charge facility location model with cover-age restrictions. Two Lagrangian relaxation based heuristics havebeen utilized by him whereby both used the greedy adding algo-rithm to calculate the upper bounds while sub-gradient optimiza-tion was used to calculate the lower bounds. Other representativeset of researches include works by Jayaraman and Pirkul (2001),Jayaraman and Ross (2003), Yan et al. (2003), Syam (2002), Amiri(2006), Gen and Syarif (2005) and Truong and Azadivar (2005).The large number of studies dealing with the supply chain designproblem have been surveyed by Vidal and Goetschalckx (1997),Beamon (1998), Erenguc et al. (1999), Pontrandolfo and Okogbaa(1999) and Goetschalckx et al. (2002). Chan et al. (2002) simulatedthe supply chain of single channel logistics network incorporatingorder release theory. Chan and Chan (2006) have modeled the sup-ply chain as a distributed constraint satisfaction problem and haveused simulation method to check the performance. They havedeveloped coordination mechanism with quantity flexibility for

96 M.K. Tiwari et al. / European Journal of Operational Research 203 (2010) 95–106
inventory management. Chan and Chan (2005) simulated five com-mon supply chain models and calculated various performancemeasures like transportation cost, resources utilization, inventorylevel, and order cycle time. Chan et al. (2004) have studied verticaland horizontal supply chain collaboration and have proposed acentral coordination system. Chan and Chung (2004) have opti-mized the supply chain management problems using multi-crite-rion genetic optimization technique. Chan et al. (2004) and Chanand Chung (2004) have used analytical hierarchy process (AHP)with Genetic Algorithms to solve the problem.
Although there are a number of researches that have addressedthe design problems in a supply chain, few researches especiallythe papers by Erlebacher and Meller (2000), Daskin et al. (2002),Shen (2007), Shen et al. (2003) and Shen and Qi (2007) have fo-cused on the non-linear aspects of inventory holding cost. Erleb-acher and Meller (2000) formulated a nonlinear integer location/inventory model and solved the problem using continuous approx-imation as well as a number of constructions and bounding heuris-tics. Shen (2000), Shen (2007), Shen et al. (2003) and Daskin et al.(2002) studied the joint location and inventory model. They com-bined the location, transportation, and nonlinear inventory costsin the same model and utilized an integrated approach to deter-mine the number of distribution centers to establish, their corre-sponding locations, and the amount of inventory that each willmaintain. Daskin et al. (2002) applied Lagrangian relaxation whilecolumn generation was used by Shen et al. (2003). Both these re-search used several other assumptions to reduce the number ofnon-linear terms in the objective to one. Recently, Shen and Qi(2007) proposed an integrated stochastic supply chain design mod-el that takes into consideration the location, inventory and routingcosts. They considered a three-tiered supply chain system consist-ing of one or more suppliers, distribution centers and customerswith uncertain demand that follows a certain probability distribu-tion. Inventory holding costs and transportation costs were as-sumed to exhibit economies of scale. An interesting piece ofwork is reported in Cheong et al. (2004) who examined the benefitsof segmenting demand according to the lead time sensitivity ofcustomers and proposed a facility grouping method to ensure thatdifferent demand classes are satisfied on time.
Roughly, the decision-making in a supply chain can be classifiedinto three levels of hierarchy: strategic, tactical, and operational.The decisions at strategic level deal with network design, flow ofgoods, cost-effective location of facilities, etc., while the decisionsrelated to inventory management, transportation, etc. are consid-ered as tactical level decisions. These decision problems are typi-cally treated individually in the literature which gives rise toserious sub-optimality. However, recent researches have shownthat the strategic level decisions have a significant impact on thedecisions that took place at the tactical level and these decisionsshould be made in an integrated manner for the optimal perfor-mance of the supply chain (Shen and Qi, 2007). Despite, a researchgap still exists in the supply chain design literature related to theintegrated network design including customer’s perspectives.
Current study embarks from these issues and presents a newconsideration on how to design and configure a supply chain con-sisting of various suppliers, manufacturing locations, shipping/transportation options, warehouses, distribution centers, and geo-graphically distributed customers with their corresponding de-mand and fixed lead times. The five-tier supply chain designproblem constituting of aforementioned distributed entities ismathematically modeled with the aim of satisfying maximum cus-tomer demands at lowest possible cost. Pertaining to the signifi-cant interaction between decisions that took place at thestrategic and tactical level, we have integrated both into a commonoptimization framework. In addition, economies of scale in trans-portation and inventory holding costs have been assumed. The
model is formulated as an integer program that belongs to the classof NP-Complete problems which are difficult to solve optimally inacceptable computing time, and the inclusion of aforementionedrealistic assumption makes the overall problem nonlinear and in-duces much more complexity. Hence, this research develops anefficient solution methodology to deal with such problems of realsize in an acceptable time frame.
Last decade has witnessed a significant growth in the use ofevolutionary meta-heuristics for the optimization of computation-ally complex NP-hard problems of real dimensions. In this re-search, a novel Hybrid Taguchi–Immune (HTAIS) meta-heuristichas been proposed for the global optimization of underlying net-work design problem. The utilized Taguchi method is a robust de-sign approach based upon statistical experimental design forevaluating and implementing improvements in products, pro-cesses and equipments (Taguchi et al., 2000). Taguchi methodshave been applied with evolutionary algorithms in the past andthe resulting meta-heuristics have shown efficient performanceover a wide range of test instances (Chou et al., 1998; Tsai et al.,2004). In this research, we have utilized two most popular toolsof the Taguchi method, i.e., signal-to-noise ratio for measuringquality, and orthogonal arrays for the simultaneous study of largenumber of design parameters. On the other hand, immune system(IS) is a very intricate biological system which accounts for theresistance of a living body against harmful foreign entities (De Cas-tro and Zuben, 2002). The proposed HTAIS strategy fuses the po-tential of both these methods (i.e., Taguchi and AIS) into a singlemeta-heuristic skeleton to enhance the exploratory potential ofAIS and impart robustness, statistical soundness and quick conver-gence to the search. In this research, we have also utilized a novelencoding schema specially structured for the problem at handwhich, in combination with a proposed heuristic procedure, aimsto satisfy maximum customer demands at minimum possible cost.The performance of the proposed methodology is comparedagainst traditional Genetic Algorithm (Goldberg, 1989); HybridTaguchi–Genetic Algorithm (HTGA) and Artificial Immune System(AIS) algorithm on a set of randomly generated test instances,whereby the results demonstrate that the modifications done byus have led to significant improvements.
The rest of this paper is organized as follows: Section 2 presentsthe mathematical model of the integrated design optimizationproblem. Section 3 provides an explication of the proposed HTAISsolution methodology. The article then moves to analysis and dis-cussion of results in Section 4 and finally concludes in Section 5suggesting directions for future research.
2. Model, assumptions and analysis
2.1. Model parameters and assumptions
We consider the design of an integrated supply chain modelthat combines the strategic and tactical decision levels. We haveassumed that customers are distributed in a large connected regionwith independent demands and fixed lead times. The main intentof the design problem considered is to select among the variouspotential suppliers, manufacturing, storage and distribution loca-tions, and different shipping options, the best design that mini-mizes the total cost while maximizing the satisfied customerdemand. In the underlying model, raw materials are supplied bydifferent suppliers to the manufacturer, who in turn, manufacturesthe product and send them to different warehouses. Warehousesare used to store finished products and as a continuous replenish-ment medium for the distribution centers. The demands of distrib-uted customers are satisfied through the delivery of products fromthe distribution centers. In the proposed model, various shipping/
M.K. Tiwari et al. / European Journal of Operational Research 203 (2010) 95–106 97
transportation options are assumed to be available with manufac-turers, warehouses and distribution centers. Attributes of each op-tion include average distance traveled per day, time between twoconsecutive shipments, shipping frequency i.e., no. of shipmentsper year, cost of shipment ($ per unit distance per unit product).We have further assumed that the transportation costs and inven-tory holding costs follow economies of scale and utilized piecewiselinear cost functions to model the assumption. Several otherassumptions used in this problem are:
� Each supplier can supply to more than one manufacturer.� Demand of each warehouse is fulfilled by only one
manufacturer.� Manufacturer does not hold any inventory or the inventory
holding cost of manufacturer is assumed zero. All the invento-ries of the finished products are stored at the warehouse.
� Demand of each distribution center is fulfilled by only onewarehouse.
� Customer demands are only satisfied by distribution centers.� Demand of each customer is fulfilled by only one distribution
center.� The lead time of warehouse and distribution centers are
assumed zero.� No material flow between two warehouses or distribution cen-
ters take place.� Each manufacturer, warehouse and distribution center can serve
more than one warehouse, distribution center and customer,respectively.
� Inventory holding cost at warehouse is relatively smaller thanthat at distribution centers.
� The transportation option available to different classes of busi-ness entities are not the same. For example, the choices availableto a manufacturer for delivering the bulk quantity of finishedproducts to the warehouses, generally twice or thrice a month,will not be the same which are available with a distribution cen-ter that frequently delivers comparatively much lesser quantityof goods to the customers.
� A periodic review inventory replenishment policy is assumed, inwhich each warehouse and distribution center’s review periodequals the time delay between two shipments.
� Capacity constraints and manufacturing time are ignored.
2.2. The mathematical model
The objective function aims to identify the optimal supply chaindesign that minimizes the combined cost of operating supply chainnetwork while at the same time satisfies maximum possible cus-tomer demands. This is achieved by associating a penalty term thatpenalizes the objective for each unit of lost demand. Mathemati-cally, the problem is modeled as an integer linear program whichis given below
Minimize Cost ¼ TRCþ TFCþ TVCþ TTCþ THCþ TBC: ð1Þ
The aforementioned objective function includes total raw materialcost (TRC), total fixed cost (TFC), total variable cost (TVC), totaltransportation cost (TTC), total inventory holding cost (THC) and to-tal backorder cost (TBC). Thus, this formulation incorporates differ-ent types of cost associated with the network. (The detailedformulation can be found in Appendices A, B and C. The first twoappendices define the notations and objective function whereasthe last appendix describes the constraints.)
The aforementioned supply chain design problem comes underthe category of NP-Hard problems which are difficult to solve opti-mally. We have also considered non-linear inventory holding andtransportation costs and presence of economies of scale. Albeit,
this assumption of ours brings the problem more close to reality,this also complicates it by incorporating into it the elements ofnonlinearity. In order to resolve such complexities, during the pastdecade, meta-heuristic techniques were proposed that draws sim-ilarity from the natural phenomenon occurring in day to day life.These techniques were shown to perform well over a wide rangeof test instances and demonstrated superior results over theirdeterministic counterparts. One such approach based on humanimmune mechanism and termed as Artificial Immune System(AIS) has been utilized in this research with proposed modifica-tions based on Taguchi technique, to solve the supply chain designproblem considered. The proposed HTAIS approach and its imple-mentation on the problem at hand will be detailed in the sectionto follow.
3. The solution methodology
3.1. The Taguchi method
Taguchi method is a robust parameter design method basedupon improving the quality of a product by minimizing the effectof causes of variation. This research uses two major tools of Tagu-chi method – orthogonal array (OA) and the signal-to-noise ratio(SNR). An orthogonal array can be defined as a fractional factorialmatrix which is used for determining the combinations of factorlevels to use for each experimental run while ensuring a balancedcomparison of levels of any factor or interaction of factors. The de-sign of orthogonal array comprises of rows and columns whererows represent the level of factors for a particular experimentationwhile column represents a particular factor that can be changed ineach run. Detailed description on orthogonal arrays and Taguchimethod are available in Montgomery (1991), Park (1996), Phadke(1989), Taguchi et al. (2000) and Wu and Wu (2000).
In this research, we have utilized standard two level orthogonalarrays which are generally represented as: Lnð2n�1Þ, where, ‘n ¼ 2k’is the number of experimental runs; ‘k’ a positive integer which isgreater than 1; ‘2’ number of levels of each factor; ‘n� 1’ number ofcolumns in the orthogonal array. This research also utilizes the Sig-nal-to-Noise Ratio (SNR), a quality measuring characteristic in thefield of communication engineering, which is introduced in thefield of Design of Experiments (DOE) by Taguchi. It has previouslybeen implemented for the improvement of measurement and qual-ity via variability reduction. The SNR is used to transform severalrepetitions into one value, which represents the amount of varia-tion and the mean response. Depending upon the type of charac-teristics, SNRs are classified into continuous or discrete, nominalis best, smaller the better, larger the better; details on which couldbe obtained from Park (1996); Montgomery (1991); Taguchi et al.(2000); Phadke (1989) and Wu and Wu (2000).
3.2. Artificial immune system
The immune system is composed of hierarchically arrangedmolecules, cells, and organs which defends the body against for-eign attacks. The immune mechanism involves the search and re-moval of malfunctioning cells and foreign disease causingelements from the body. Any element whether belonging to thebody or foreign, that can be recognized by the immune system, iscalled antigen, the discrimination of which is based on receptormolecules present on the surface of immune cells. When an anti-body recognizes an antigen, it binds the antigen with a bindingstrength which is directly proportional to the affinity. The antigensstimulate the antibody cells to proliferate and mature into anotherkind of cells called plasma cells. Plasma cells are also calledterminal cells, as they do not divide further. In proliferation or cell
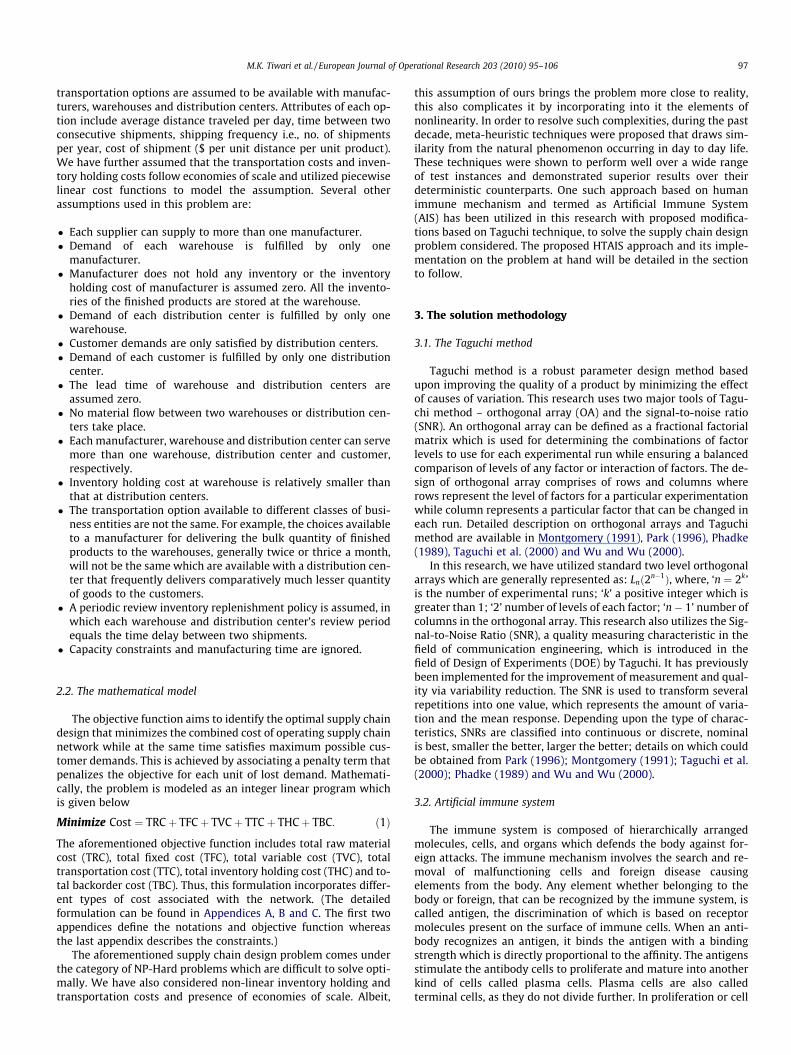
Initialization of Antibodies
Fitness Evaluation
Generation of Clones based on Taguchi Method
Maturation
Fitness Evaluation
Selection
Is termination criteria met?
STOP
Is clonal population = full?
No
No Yes
Yes
Fig. 1. Flowchart of HTAIS algorithm.
98 M.K. Tiwari et al. / European Journal of Operational Research 203 (2010) 95–106
division, clones are generated which are progenies of a single cell(De Castro and Zuben, 2002). The so-called clone generation takesplace in order to achieve the state of plasma cells as they are themost active secretors of the antibodies.
These biological principles of clone generation, proliferationand maturation are mimicked and incorporated into an algorithmtermed the clonal selection algorithm (CLONALG), invariably re-ferred as artificial immune system (AIS). While implementing AISusing clonal selection principle, the main steps in the algorithm in-clude: activation of antibodies; proliferation and differentiation onthe encounter of cells with antigens; maturation and diversifica-tion of antibody types by carrying out affinity maturation processthrough random genetic changes; and removing those differenti-ated immune cells which posses low affinity antigenic receptors.In order to imitate AIS concept in optimization, the affinity conceptis transferred to fitness function evaluation and constraint satisfac-tion. Here, antigens represent constraints and the antibody–anti-genic affinity refers to the extent of constraint satisfaction, i.e.,higher the satisfaction of constraints more is the affinity. In addi-tion, if two solutions equally satisfy their constraints, one with bet-ter value of the corresponding objective attains larger affinity orfitness value.
Initially, a population of random solutions is generated whichrepresent a pool of antibodies which undergo proliferation andmaturation. The proliferation of antibodies, with, rate directly pro-portional to the affinity is realized by cloning each member of theinitial pool, i.e., copying each of the initial solution depending ontheir affinity (higher affinity generates higher number of off-springs). However, higher affinity is accompanied by a smallermaturation rate. The maturation process is carried through randomgenetic changes (hyper mutation) and removing those differenti-ated immune cells (clones) which posses low affinity antigenicreceptors (fitness value). This process of proliferation, maturationand antibody–antigen interaction is repeated iteratively, withsome suitable stopping criteria. AIS has previously been appliedto successfully solve a variety of complex optimization problemsincluding traveling salesman problem (De Castro and Zuben,2000), machine loading problem (Chan et al., 2005), flow shopscheduling (Kumar et al., 2006), economic load dispatch (Panigrahiet al., 2007), etc.
3.3. The proposed solution methodology
This section will detail the proposed HTAIS solution methodol-ogy and its implementation perspectives on the integrated supplychain design problem. AIS is the progenitor of the proposed ap-proach, whereby we have modified the cloning procedure usingTaguchi technique. The suggested modification aims at ensuringelitism and steers the search towards optimal regions of the searchspace. A fitness proportionate mutation has been utilized in combi-nation with the aforementioned cloning mechanism to counter thepre-mature convergence that might occur as a negative conse-quence of elitism. A flowchart of the HTAIS approach is providedin Fig. 1. The following subsections will further describe the vari-ous components of the proposed HTAIS meta-heuristic and theirimplementation on the problem at hand.
3.3.1. The encoding schemaThe proposed approach uses a novel encoding schema com-
posed of both binary and integer values. The generic construct ofan antibody thus formed is composed of pre-calculated numberof sequentially arranged receptor cells. The receptor cells in anti-bodies are characterized by two factors, its position within an anti-body and its value. As an example, consider a network designproblem composed of five suppliers of each type (number of typesof supplier is taken as 2), two manufacturing locations, four poten-
tial warehouses, six distribution centers and five shipping/trans-portation options available with each opened facility. Thecorresponding antibody formed is shown in Fig. 2, whereby thefirst two receptor cells (integer encoded) represent the two typeof suppliers selected corresponding to the first manufacturingfacility. The next two receptor cells respectively represent the sup-pliers selected for the second manufacturing facility. Thereafter,the next two receptor cells are encoded in binary digits and signifywhich manufacturing facilities are opened/closed (‘0’ for a closedfacility and ‘1’ for an opened one). Similarly, the value in next eightreceptor cells decide which warehouses are opened/closed (by thefirst four out of the chosen eight) and the shipping option (by thelast four) through which they are supplied with. Finally, the lasttwelve receptor cells represent the corresponding decisions forthe distribution centers.
The major advantages obtained through the use of proposedencoding schema are: simplified and effective representation ofsearch space, ease of maturation, and high retainment of feasibilityduring maturation. In fact, during the execution of the proposedmethodology on the problem at hand, only three type of infeasibil-ities were encountered; those arising due to no opened manufac-turing facility, selection of lesser number of warehousescompared to opened manufacturing facility, and selection of lessernumber of distribution centers compared to opened warehouses(violation of constraint 18, 19 and 20 respectively). The other con-straints were not violated through the maturation process used,since it exchanges the value of receptor cells only with new feasi-ble ones. Another point worth consideration here is that the pro-posed encoding methodology only provides a partial networkstructure. The factors like allocation of warehouses to manufactur-ing centers, distribution centers to warehouses, as well as the allo-cation of distribution centers and transportation option tocustomers are taken care by the proposed heuristic procedure.The utilized heuristic procedure is aimed at maximizing the levelof satisfied customer demand at minimum cost and within theopened facilities decided by the antibody string.

Type of suppliers
Type of suppliers × No. of
manufacturers
2 3 1 1 07 4 0 5 5 3411 1 0 101 1 1 2 423 5
No. of manufacturers
Number of Warehouses
Number of Warehouses
Number of distribution centers
Number of distribution centers
Fig. 2. Encoding schema for the underlying supply chain design problem.
M.K. Tiwari et al. / European Journal of Operational Research 203 (2010) 95–106 99
3.3.2. Fitness evaluationA fitness function is used to evaluate the affinity of an antibody
with the antigens. Higher the fitness value of an antibody is, higherwill be its affinity with the antigens (constraints) and better will bethe objective function value. In this research, a modified SNR trans-formation ðgi ¼ 1=costiÞ is utilized as the fitness function which isto be maximized. The fitness evaluation is carried out using Eq. (1).A heuristic procedure is proposed in this research to establish theoptimum links between the opened facilities and thereby maxi-mize the satisfied demand while minimizes the cost incurred init. The proposed procedure utilizes, as input, the antibody stringwhich provides the decisions regarding the opening/closing of afacility. It then hierarchically assigns the distributed entities basedon minimum distance criteria. First, the customers are assigned tothe opened distribution centers closest to them with appropriateshipping/transportation option that fulfills the lead time require-ment in minimum cost. Thereafter, the distribution centers andhubs are respectively allocated to opened hubs and manufacturinglocations closest to them.
Such an allocation of entities based on minimum distance crite-ria is a very efficient strategy as the transportation cost is assumedto be proportional to the distance, and thereby minimizing the dis-tance traveled will effectively lead to the minimization of totalcost. At this point, one may argue that the use of proposed heuristicwith consideration of economies of scale and piecewise linear costfunction may result in sub-optimality in certain scenarios in whicheconomies of scale in inventory holding cost may offset the addi-tional transportation costs. However, the inclusion of high fixedcost of opening and closing of any facility will seldom lead to suchsituations in practical scenario because the optimal solution willconsist of minimal number of opened facilities (to avoid the fixedcost of opening more facilities) distributed evenly, leading toalmost zero possibility that a particular location could be econom-ically served by more than one facility. In addition, the percentagecontribution of transportation costs in the total cost structure ofthe supply chain far exceeds the holding cost’s contribution andtherefore its minimization (as done through the proposed heuris-tic) effectively leads to the minimization of the total cost of thesupply chain. The use of the proposed heuristic with the HTAISmethodology offers distinguished advantages like, optimum allo-cation of facilities, faster computation and the possibility of inclu-sion of large number of customer zones without significantincrease in computational burden.
3.3.3. Taguchi based cloningThe cloning process in AIS has been hybridized with the Taguchi
method to produce better clones. Taguchi method is used to studylarge number of decision variables in only a small number ofexperiments. The combinations of factor levels to be experimentedare decided by the orthogonal array design. For a problem involv-ing N number of factors, an orthogonal array Lnð2n�1Þ, wheren� 1 P N, is utilized.n� 1 > N If only the first N columns are used,
while others are ignored. In Taguchi based cloning, two antibodiesare randomly selected and Taguchi method is applied over them todetermine the optimal level of each decision variable. The value ofdecision variables (factors) of one antibody forms their ‘level 1’while the value of decision variables of another antibody forms ‘le-vel 2’. Experimentations were then performed by varying the factorlevel according to orthogonal array design and the value of fitnessfunction is recorded for each experiment performed. The value ofvarious factors at different level is then calculated using,
Vfl ¼X
gi 8i : factor f is at level l; ð2Þ
where v fl is the value of factor f at level l, and i is the experimentnumber. The optimal level of each decision variable is the onewhich gives higher Vfl and their combination forms the modifiedclone with optimum or near optimum function value. Generationsof clones based on Taguchi method is shown in Fig. 3. The majoradvantage accrued by this method is that instead of performing2N experiments to evaluate all combinations of N factors, Taguchimethod requires much lesser experimentations to determine theoptimal chromosome.
3.3.4. MaturationIn immune algorithms, the maturation in antibodies is per-
formed by hypermutation and receptor editing mechanism. Inthe maturation process, the antibodies are altered in a similar fash-ion as by the mutation operator of Genetic Algorithms (Goldberg,1989); however, basic difference lies in the rate of mutation whichhere varies inversely with fitness value. Thus, higher the fitness ofan antibody is, the lower is its mutation rate and vice versa.
3.3.5. SelectionAfter maturation, the antibodies are evaluated based on the gi-
ven fitness function and roulette wheel mechanism is then appliedfor selection. The choice of roulette wheel as the selection mecha-nism is done to impart the element of randomness in the selectionprocedure and allow for certain probability of selection of lesser fitantibodies thereby limiting greediness of the search process andavoiding sub-optimality. Thus in the proposed meta-heuristic,the antibodies are randomly initialized at first within the searchspace and evaluated. Thereafter, Taguchi based cloning is per-formed to generate high quality clones. These clones are then mat-urated through hyper-mutation and receptor editing mechanismafter which selection is performed to form the pool of elite anti-bodies. This pool of antibodies form the initial antibody populationfor the next iteration and the entire process is repeated iterativelytill the termination criteria is met.
3.4. Hybrid Taguchi–Genetic Algorithm
Genetic Algorithms are stochastic algorithms inspired by Dar-win’s theory of evolution. Hybrid Taguchi–Genetic Algorithm

Fig. 3. Generation of clones based on Taguchi method.
Table 1Design of test instances.
No. ofsuppliers
No. of typesof supplier
Total no. ofmanufacturers
No. of shippingoption
No. ofware-house
No. of transportationoptions
No. of distributioncenters
No. of transportationoptions
No. of customers
1 10 2 5 5 8 5 15 5 402 10 3 8 8 12 8 15 8 453 15 2 8 8 12 8 15 8 504 15 3 10 5 15 5 20 5 505 15 3 10 10 15 10 20 10 606 20 2 10 5 15 5 25 5 707 20 3 12 8 18 8 25 8 758 20 4 15 10 20 10 30 10 90
100 M.K. Tiwari et al. / European Journal of Operational Research 203 (2010) 95–106

AG
A
43,5
0013
,230
,400
81,8
0018
,682
,200
70,0
0019
,516
,100
03,0
0026
,255
,800
10,6
0025
,631
,900
72,4
0024
,672
,200
51,1
0025
,376
,200
76,4
0036
,868
,700
M.K. Tiwari et al. / European Journal of Operational Research 203 (2010) 95–106 101
(HTGA) combines GA with Taguchi method. Taguchi method isimplemented between crossover and mutation operation of Genet-ic Algorithm. This ensures better chromosomes are selected aftercrossover operation. Detailed description of HTGA along with anexample of how Taguchi method is implemented can be found inTsai et al. (2004).
Tabl
e2
Com
pari
son
ofpe
rfor
man
ces
ofth
ete
sted
algo
rith
ms
onbe
nchm
ark
inst
ance
s.
Inst
ance
nu
mbe
rA
vera
geco
stob
tain
ed($
)St
anda
rdde
viat
ion
Min
imu
mco
st($
)M
axim
um
cost
valu
e
HTA
ISA
ISH
TGA
GA
HTA
ISA
ISH
TGA
GA
HTA
ISA
ISH
TGA
GA
HTA
ISA
ISH
TG
19,
906,
000
12,1
94,8
0011
,954
,100
12,4
84,8
000.
006
0.03
50.
046
0.03
59,
805,
400
11,4
55,5
0010
,860
,700
11,1
62,4
0010
,020
,400
13,2
91,9
0012
,72
13,9
83,1
0016
,095
,700
14,5
20,5
0016
,229
,400
0.05
70.
087
0.12
10.
145
12,4
70,0
0013
,333
,500
12,1
81,7
0013
,267
,100
15,1
65,9
0017
,518
,500
17,5
312
,469
,700
16,5
99,8
0013
,413
,900
16,2
41,2
000.
049
0.09
60.
098
0.10
411
,507
,500
13,0
22,9
0011
,817
,400
14,5
95,7
0013
,472
,100
19,2
70,5
0017
,44
18,8
21,7
0021
,346
,600
19,8
27,0
0022
,341
,600
0.04
30.
085
0.06
20.
131
17,4
82,6
0017
,789
,100
17,7
11,3
0018
,103
,300
20,0
08,6
0025
,560
,000
21,9
518
,897
,300
22,4
54,1
0019
,880
,100
22,0
82,1
000.
053
0.08
70.
066
0.11
917
,183
,400
19,6
81,3
0017
,330
,600
18,5
01,4
0020
,732
,200
25,6
22,5
0021
,76
19,4
82,8
0022
,531
,500
20,9
02,0
0022
,606
,000
0.04
10.
061
0.06
80.
071
18,0
32,8
0019
,988
,900
18,1
49,9
0020
,918
,600
21,0
16,4
0024
,594
,000
23,7
718
,368
,200
22,1
63,2
0020
,869
,500
22,7
93,8
000.
041
0.07
20.
069
0.07
417
,095
,300
18,1
00,6
0017
,954
,900
19,5
83,8
0019
,634
,400
24,5
81,9
0023
,78
28,0
55,3
0031
,420
,100
28,1
01,5
0030
,223
,700
0.04
90.
061
0.09
30.
112
24,8
56,5
0028
,982
,300
24,9
66,1
0026
,569
,500
30,1
90,0
0034
,628
,800
33,4
4. Results and discussion
4.1. Test instances
In this section, we present the results obtained by the applica-tion of the proposed meta-heuristic on various test instances con-sidered. Eight test instances of varying size and configurationshave been taken to test the efficacy and applicability of the pro-posed methodology on large as well as small datasets. The problemdesign is detailed in Table 1. All the instances consist of potentialsuppliers, manufacturing, warehousing and distributing locations,different transportation options as well as fixed customer loca-tions. We have assumed that the different entities in the aforemen-tioned model are geographically dispersed over a large squareregion. The location (co-ordinates) of each entity is then randomlygenerated using a uniform random number generator while thedistance between them is assumed to be Euclidean and is calcu-lated through the use of their coordinates. The other parametersrelated to cost, demand, etc. were also generated uniformly be-tween proper intervals selected from existing literature and anec-dotal experience.
4.2. Parameter settings
The results obtained through the use of the proposed methodol-ogy were compared against those obtained using Genetic Algo-rithm (GA), Hybrid Taguchi–Genetic Algorithm (HTGA) and AIS.The algorithms were coded in C++ and implemented on a PentiumIV PC running at 3.40 GHz and 1 GB RAM. Several combinations ofvalues for the parameters used in HTAIS, GA, HTGA and AIS weretested and the results are reported for the parameter values thatwere found best. For all the simulations, a population size of 100,the number of antibodies selected for cloning ðNabÞ as 10, and a fit-ness proportionate mutation in which the probability of mutationðPmÞ varies inversely with the fitness value is utilized. While, forsimulating GA and HTGA, a population size of 100, a cross-over rateof 0.6 and a mutation rate of 0.01 has been utilized. In order tomeasure the performance of each algorithm on a common plat-form, the number of fitness function evaluations is considered asthe stopping criterion and all the three algorithms were run forequal number of fitness function evaluations (100 iterations).
4.3. Results on test instances
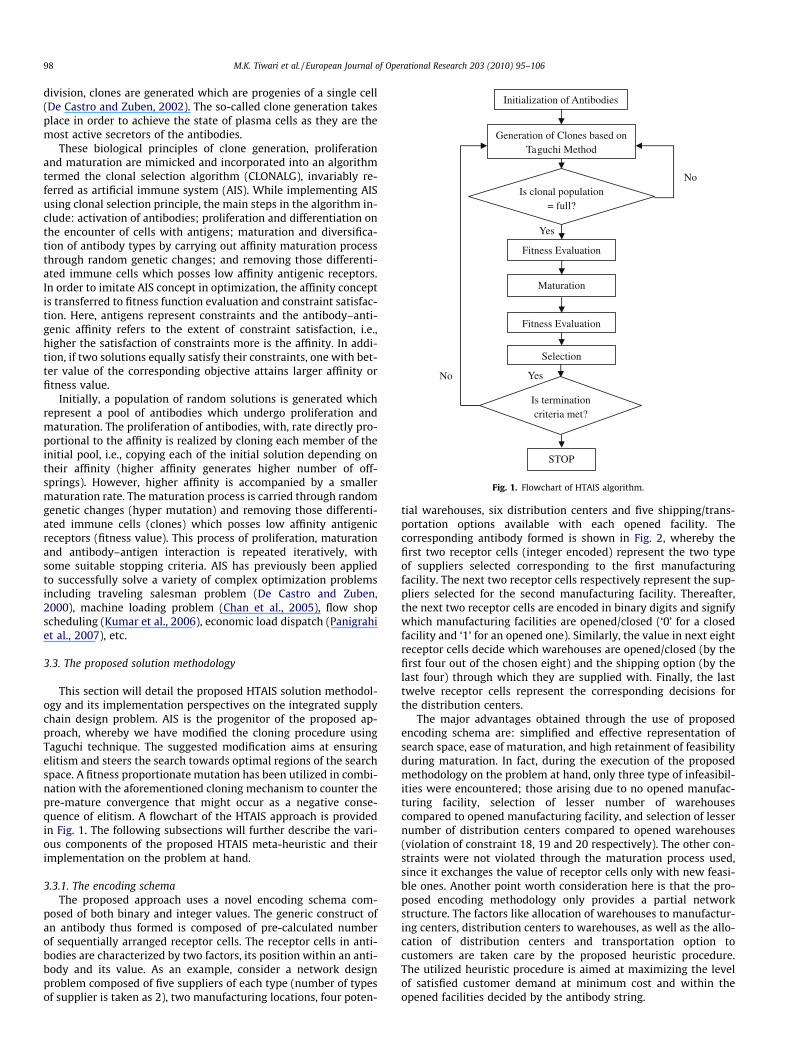
In order to study the benefits obtained due to the proposedmodifications, comparative analysis has been performed betweenthe results obtained by the implementation of the proposed HTAISalgorithm and the three other aforementioned algorithms (GA,HTGA& AIS) on the problem at hand. The comparison results arelisted in Table 2, from which it is evident that the proposed meth-odology obtained much better results as compared to GA, HTGAand AIS. In addition, the standard deviation in the results is veryless indicating high reproducibility and consistent search capabil-ity of the proposed approach. These modifications are attributedto the efficient incorporation of the Taguchi technique within thecloning mechanism which led to early generation of optimal orclose to optimal antibodies and thereby quickly direct the searchtowards optimal regions. The convergence trend for the four algo-
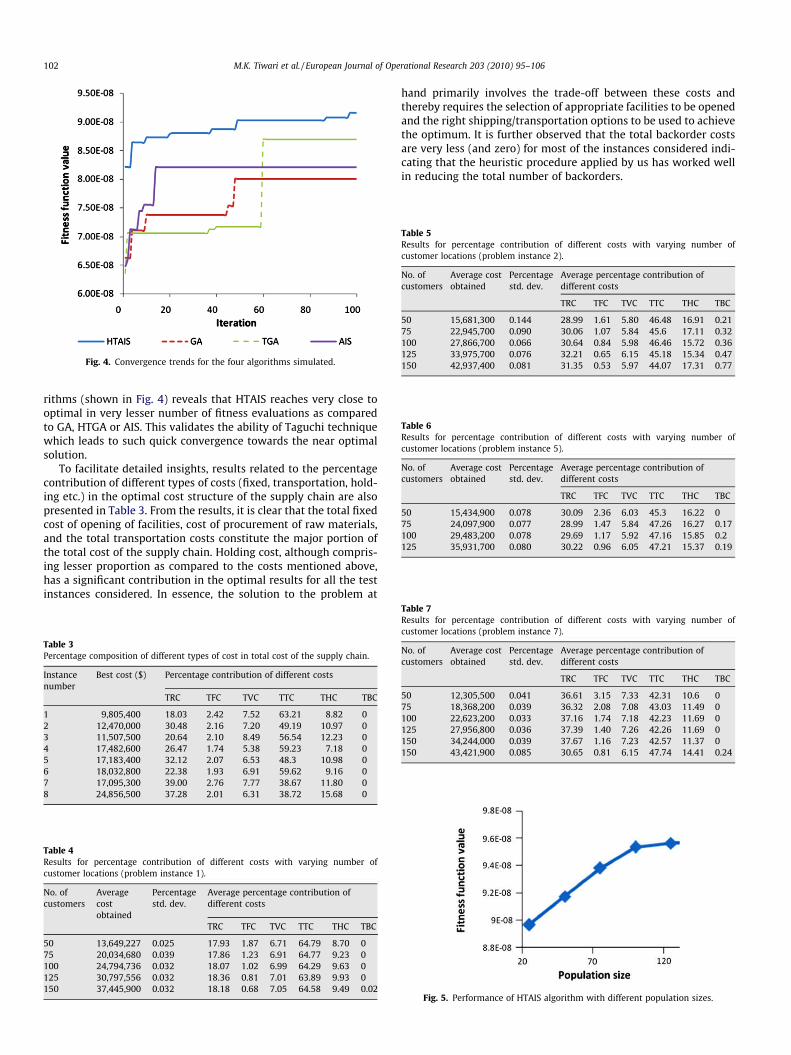
Fig. 4. Convergence trends for the four algorithms simulated.
Table 5Results for percentage contribution of different costs with varying number ofcustomer locations (problem instance 2).
No. ofcustomers
Average costobtained
Percentagestd. dev.
Average percentage contribution ofdifferent costs
TRC TFC TVC TTC THC TBC
50 15,681,300 0.144 28.99 1.61 5.80 46.48 16.91 0.2175 22,945,700 0.090 30.06 1.07 5.84 45.6 17.11 0.32100 27,866,700 0.066 30.64 0.84 5.98 46.46 15.72 0.36125 33,975,700 0.076 32.21 0.65 6.15 45.18 15.34 0.47150 42,937,400 0.081 31.35 0.53 5.97 44.07 17.31 0.77
Table 6Results for percentage contribution of different costs with varying number ofcustomer locations (problem instance 5).
No. ofcustomers
Average costobtained
Percentagestd. dev.
Average percentage contribution ofdifferent costs
TRC TFC TVC TTC THC TBC
50 15,434,900 0.078 30.09 2.36 6.03 45.3 16.22 075 24,097,900 0.077 28.99 1.47 5.84 47.26 16.27 0.17100 29,483,200 0.078 29.69 1.17 5.92 47.16 15.85 0.2125 35,931,700 0.080 30.22 0.96 6.05 47.21 15.37 0.19
102 M.K. Tiwari et al. / European Journal of Operational Research 203 (2010) 95–106
rithms (shown in Fig. 4) reveals that HTAIS reaches very close tooptimal in very lesser number of fitness evaluations as comparedto GA, HTGA or AIS. This validates the ability of Taguchi techniquewhich leads to such quick convergence towards the near optimalsolution.
To facilitate detailed insights, results related to the percentagecontribution of different types of costs (fixed, transportation, hold-ing etc.) in the optimal cost structure of the supply chain are alsopresented in Table 3. From the results, it is clear that the total fixedcost of opening of facilities, cost of procurement of raw materials,and the total transportation costs constitute the major portion ofthe total cost of the supply chain. Holding cost, although compris-ing lesser proportion as compared to the costs mentioned above,has a significant contribution in the optimal results for all the testinstances considered. In essence, the solution to the problem at
Table 3Percentage composition of different types of cost in total cost of the supply chain.
Instancenumber
Best cost ($) Percentage contribution of different costs
TRC TFC TVC TTC THC TBC
1 9,805,400 18.03 2.42 7.52 63.21 8.82 02 12,470,000 30.48 2.16 7.20 49.19 10.97 03 11,507,500 20.64 2.10 8.49 56.54 12.23 04 17,482,600 26.47 1.74 5.38 59.23 7.18 05 17,183,400 32.12 2.07 6.53 48.3 10.98 06 18,032,800 22.38 1.93 6.91 59.62 9.16 07 17,095,300 39.00 2.76 7.77 38.67 11.80 08 24,856,500 37.28 2.01 6.31 38.72 15.68 0
Table 4Results for percentage contribution of different costs with varying number ofcustomer locations (problem instance 1).
No. ofcustomers
Averagecostobtained
Percentagestd. dev.
Average percentage contribution ofdifferent costs
TRC TFC TVC TTC THC TBC
50 13,649,227 0.025 17.93 1.87 6.71 64.79 8.70 075 20,034,680 0.039 17.86 1.23 6.91 64.77 9.23 0100 24,794,736 0.032 18.07 1.02 6.99 64.29 9.63 0125 30,797,556 0.032 18.36 0.81 7.01 63.89 9.93 0150 37,445,900 0.032 18.18 0.68 7.05 64.58 9.49 0.02
hand primarily involves the trade-off between these costs andthereby requires the selection of appropriate facilities to be openedand the right shipping/transportation options to be used to achievethe optimum. It is further observed that the total backorder costsare very less (and zero) for most of the instances considered indi-cating that the heuristic procedure applied by us has worked wellin reducing the total number of backorders.
Table 7Results for percentage contribution of different costs with varying number ofcustomer locations (problem instance 7).
No. ofcustomers
Average costobtained
Percentagestd. dev.
Average percentage contribution ofdifferent costs
TRC TFC TVC TTC THC TBC
50 12,305,500 0.041 36.61 3.15 7.33 42.31 10.6 075 18,368,200 0.039 36.32 2.08 7.08 43.03 11.49 0100 22,623,200 0.033 37.16 1.74 7.18 42.23 11.69 0125 27,956,800 0.036 37.39 1.40 7.26 42.26 11.69 0150 34,244,000 0.039 37.67 1.16 7.23 42.57 11.37 0150 43,421,900 0.085 30.65 0.81 6.15 47.74 14.41 0.24
Fig. 5. Performance of HTAIS algorithm with different population sizes.
Tabl
e8
Effe
ctof
diff
eren
tra
tes
ofm
utat
ion
onth
epe
rfor
man
ceof
HTA
ISal
gori
thm
.
Inst
ance
nu
mbe
rP m¼
0:4
P m¼
0:5
P m¼
0:6
P m¼
0:7
P m¼
0:8
Fitn
ess
prop
orti
onat
em
uta
tion
Ave
rage
cost
Std.
dev.
Ave
rage
cost
Std.
dev.
Ave
rage
cost
Std.
dev.
Ave
rage
cost
Std.
dev.
Ave
rage
cost
Std.
dev.
Ave
rage
cost
Std.
dev.
19,
906,
000
0.00
610
,064
,000
0.00
910
,230
,800
0.01
010
,344
,100
0.01
410
,482
,000
0.01
610
,608
,200
0.01
52
16,4
69,6
000.
067
16,9
24,9
000.
066
16,0
52,2
000.
070
15,8
49,7
000.
070
16,2
99,6
000.
064
13,9
83,1
000.
057
314
,835
,100
0.06
615
,244
,400
0.06
215
,172
,000
0.06
515
,384
,400
0.06
314
,220
,100
0.05
112
,469
,700
0.04
94
19,7
77,6
000.
055
19,5
94,6
000.
065
20,5
79,7
000.
053
20,4
98,0
000.
053
21,0
08,8
000.
050
18,8
21,7
000.
043
521
,747
,200
0.06
421
,516
,500
0.06
621
,737
,000
0.05
721
,877
,900
0.06
522
,176
,300
0.08
518
,897
,300
0.05
36
21,7
07,2
000.
052
23,0
22,5
000.
052
22,5
77,1
000.
069
23,3
66,7
000.
058
23,5
97,2
000.
071
19,4
82,8
000.
041
721
,100
,100
0.07
023
,011
,200
0.05
622
,105
,600
0.05
421
,670
,000
0.07
021
,765
,300
0.04
418
,368
,200
0.04
18
32,5
22,0
000.
046
31,8
73,2
000.
086
32,2
08,4
000.
045
32,2
04,3
000.
043
35,1
92,2
000.
071
28,0
55,3
000.
049
M.K. Tiwari et al. / European Journal of Operational Research 203 (2010) 95–106 103
We also investigated the effect of varying number of customerlocations on the decisions related to opening/closing of distributedfacilities. Four problem instances (instance 1, 2, 5, and 7) havebeen chosen for the purpose of simulation where the number ofcustomers is varied as 50, 75, 100, 125, and 150 for each instance.The optimal findings are listed in Tables 4–7. The results revealthat with an increase in the number of customers, the number ofopened facilities increases leading to an increase in the percentagecontribution of fixed cost. It is further observed that with an in-crease in the number of customer locations the percentage of hold-ing cost also increases while that of transportation costs decreases.This decrease in transportation cost can be attributed to the in-creased number of opened facilities.
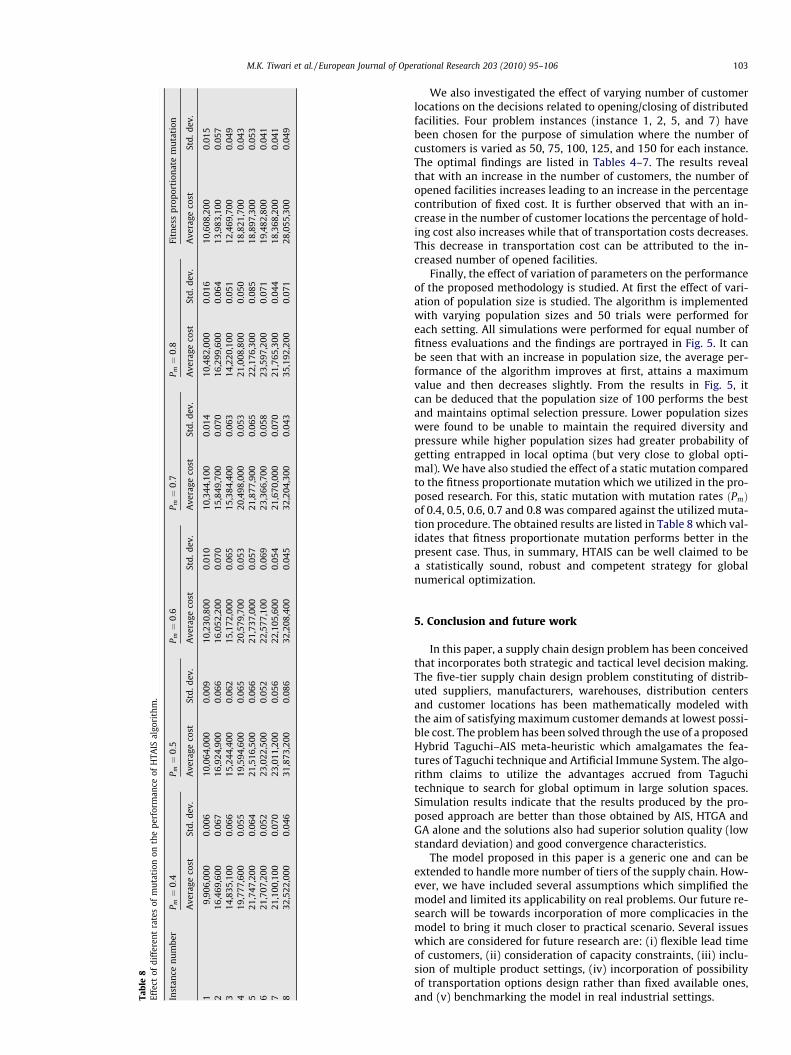
Finally, the effect of variation of parameters on the performanceof the proposed methodology is studied. At first the effect of vari-ation of population size is studied. The algorithm is implementedwith varying population sizes and 50 trials were performed foreach setting. All simulations were performed for equal number offitness evaluations and the findings are portrayed in Fig. 5. It canbe seen that with an increase in population size, the average per-formance of the algorithm improves at first, attains a maximumvalue and then decreases slightly. From the results in Fig. 5, itcan be deduced that the population size of 100 performs the bestand maintains optimal selection pressure. Lower population sizeswere found to be unable to maintain the required diversity andpressure while higher population sizes had greater probability ofgetting entrapped in local optima (but very close to global opti-mal). We have also studied the effect of a static mutation comparedto the fitness proportionate mutation which we utilized in the pro-posed research. For this, static mutation with mutation rates ðPmÞof 0.4, 0.5, 0.6, 0.7 and 0.8 was compared against the utilized muta-tion procedure. The obtained results are listed in Table 8 which val-idates that fitness proportionate mutation performs better in thepresent case. Thus, in summary, HTAIS can be well claimed to bea statistically sound, robust and competent strategy for globalnumerical optimization.
5. Conclusion and future work
In this paper, a supply chain design problem has been conceivedthat incorporates both strategic and tactical level decision making.The five-tier supply chain design problem constituting of distrib-uted suppliers, manufacturers, warehouses, distribution centersand customer locations has been mathematically modeled withthe aim of satisfying maximum customer demands at lowest possi-ble cost. The problem has been solved through the use of a proposedHybrid Taguchi–AIS meta-heuristic which amalgamates the fea-tures of Taguchi technique and Artificial Immune System. The algo-rithm claims to utilize the advantages accrued from Taguchitechnique to search for global optimum in large solution spaces.Simulation results indicate that the results produced by the pro-posed approach are better than those obtained by AIS, HTGA andGA alone and the solutions also had superior solution quality (lowstandard deviation) and good convergence characteristics.
The model proposed in this paper is a generic one and can beextended to handle more number of tiers of the supply chain. How-ever, we have included several assumptions which simplified themodel and limited its applicability on real problems. Our future re-search will be towards incorporation of more complicacies in themodel to bring it much closer to practical scenario. Several issueswhich are considered for future research are: (i) flexible lead timeof customers, (ii) consideration of capacity constraints, (iii) inclu-sion of multiple product settings, (iv) incorporation of possibilityof transportation options design rather than fixed available ones,and (v) benchmarking the model in real industrial settings.
104 M.K. Tiwari et al. / European Journal of Operational Research 203 (2010) 95–106
Acknowledgements
The authors thank anonymous referees and the editor for theirhelpful comments and constructive suggestions on earlier versionof this paper.
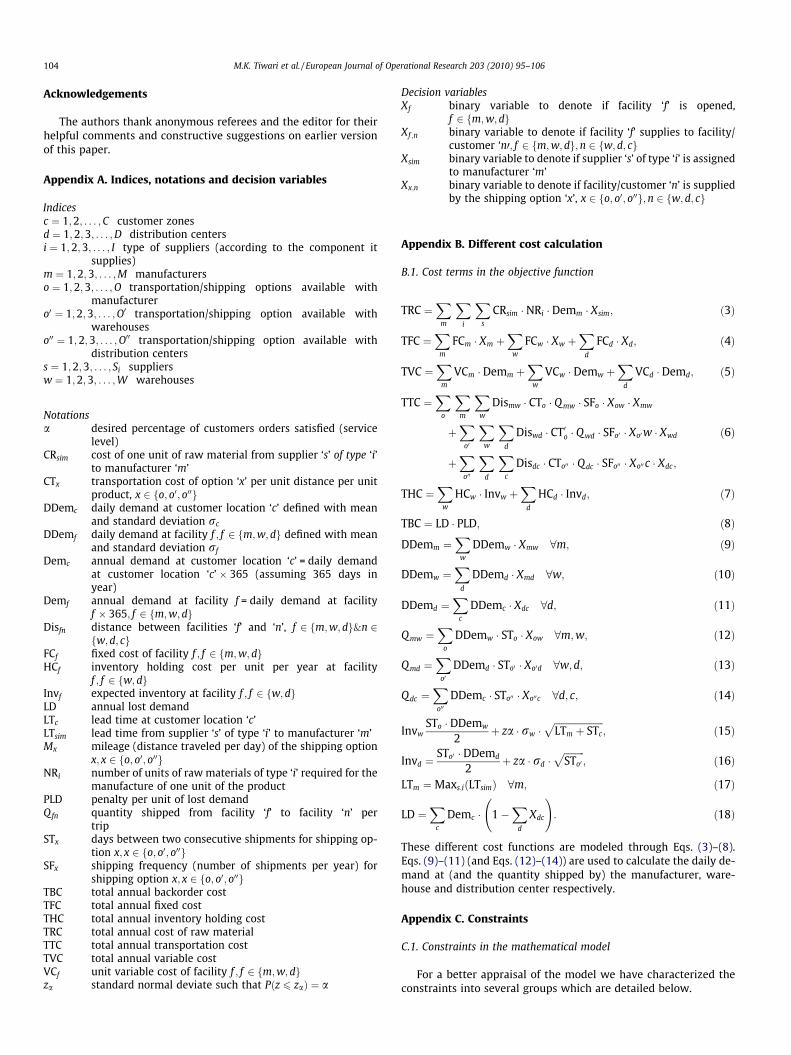
Appendix A. Indices, notations and decision variables
Indicesc ¼ 1;2; . . . ;C customer zonesd ¼ 1;2;3; . . . ;D distribution centersi ¼ 1;2;3; . . . ; I type of suppliers (according to the component it
supplies)m ¼ 1;2;3; . . . ;M manufacturerso ¼ 1;2;3; . . . ;O transportation/shipping options available with
manufacturero0 ¼ 1;2;3; . . . ;O0 transportation/shipping option available with
warehouseso00 ¼ 1;2;3; . . . ;O00 transportation/shipping option available with
distribution centerss ¼ 1;2;3; . . . ; Si suppliersw ¼ 1;2;3; . . . ;W warehouses
Notationsa desired percentage of customers orders satisfied (service
level)CRsim cost of one unit of raw material from supplier ‘s’ of type ‘i’
to manufacturer ‘m’CTx transportation cost of option ‘x’ per unit distance per unit
product, x 2 fo; o0; o00gDDemc daily demand at customer location ‘c’ defined with mean
and standard deviation rc
DDemf daily demand at facility f ; f 2 fm;w;dg defined with meanand standard deviation rf
Demc annual demand at customer location ‘c’ = daily demandat customer location ‘c’ � 365 (assuming 365 days inyear)
Demf annual demand at facility f = daily demand at facilityf � 365; f 2 fm;w;dg
Disfn distance between facilities ‘f’ and ‘n’, f 2 fm;w;dg&n 2fw;d; cg
FCf fixed cost of facility f ; f 2 fm;w; dgHCf inventory holding cost per unit per year at facility
f ; f 2 fw; dgInvf expected inventory at facility f ; f 2 fw;dgLD annual lost demandLTc lead time at customer location ‘c’LTsim lead time from supplier ‘s’ of type ‘i’ to manufacturer ‘m’Mx mileage (distance traveled per day) of the shipping option
x; x 2 fo; o0; o00gNRi number of units of raw materials of type ‘i’ required for the
manufacture of one unit of the productPLD penalty per unit of lost demandQfn quantity shipped from facility ‘f’ to facility ‘n’ per
tripSTx days between two consecutive shipments for shipping op-
tion x; x 2 fo; o0; o00gSFx shipping frequency (number of shipments per year) for
shipping option x; x 2 fo; o0; o00gTBC total annual backorder costTFC total annual fixed costTHC total annual inventory holding costTRC total annual cost of raw materialTTC total annual transportation costTVC total annual variable costVCf unit variable cost of facility f ; f 2 fm;w; dgza standard normal deviate such that Pðz 6 zaÞ ¼ a
Decision variablesXf binary variable to denote if facility ‘f’ is opened,
f 2 fm;w; dgXf ;n binary variable to denote if facility ‘f’ supplies to facility/
customer ‘n0; f 2 fm;w; dg;n 2 fw;d; cgXsim binary variable to denote if supplier ‘s’ of type ‘i’ is assigned
to manufacturer ‘m’Xx;n binary variable to denote if facility/customer ‘n’ is supplied
by the shipping option ‘x’, x 2 fo; o0; o00g;n 2 fw;d; cg
Appendix B. Different cost calculation
B.1. Cost terms in the objective function
TRC ¼X
m
Xi
Xs
CRsim � NRi � Demm � Xsim; ð3Þ
TFC ¼X
m
FCm � Xm þX
w
FCw � Xw þX
d
FCd � Xd; ð4Þ
TVC ¼X
m
VCm � Demm þX
w
VCw � Demw þX
d
VCd � Demd; ð5Þ
TTC ¼X
o
Xm
Xw
Dismw � CTo � Q mw � SFo � Xow � Xmw
þX
o0
Xw
Xd
Diswd � CT0o � Qwd � SFo0 � Xo0w � Xwd ð6Þ
þX
o00
Xd
Xc
Disdc � CTo00 � Q dc � SFo00 � Xo00c � Xdc;
THC ¼X
w
HCw � Invw þX
d
HCd � Invd; ð7Þ
TBC ¼ LD � PLD; ð8Þ
DDemm ¼X
w
DDemw � Xmw 8m; ð9Þ
DDemw ¼X
d
DDemd � Xmd 8w; ð10Þ
DDemd ¼X
c
DDemc � Xdc 8d; ð11Þ
Qmw ¼X
o
DDemw � STo � Xow 8m;w; ð12Þ
Qmd ¼X
o0DDemd � STo0 � Xo0d 8w;d; ð13Þ
Qdc ¼X
o00DDemc � STo00 � Xo00c 8d; c; ð14Þ
InvwSTo � DDemw
2þ za � rw �
ffiffiffiffiffiffiffiffiffiffiffiffiffiffiffiffiffiffiffiffiffiLTm þ STc
p; ð15Þ
Invd ¼STo0 � DDemd
2þ za � rd �
ffiffiffiffiffiffiffiffiffiSTo0
p; ð16Þ
LTm ¼Maxs;iðLTsimÞ 8m; ð17Þ
LD ¼X
c
Demc � 1�X
d
Xdc
!: ð18Þ
These different cost functions are modeled through Eqs. (3)–(8).Eqs. (9)–(11) (and Eqs. (12)–(14)) are used to calculate the daily de-mand at (and the quantity shipped by) the manufacturer, ware-house and distribution center respectively.
Appendix C. Constraints
C.1. Constraints in the mathematical model
For a better appraisal of the model we have characterized theconstraints into several groups which are detailed below.
M.K. Tiwari et al. / European Journal of Operational Research 203 (2010) 95–106 105
Xm
Xm P 1; ð19Þ
Xw
Xw �X
w
Xm P 0; ð20Þ
Xd
Xd �X
w
Xw P 0: ð21Þ
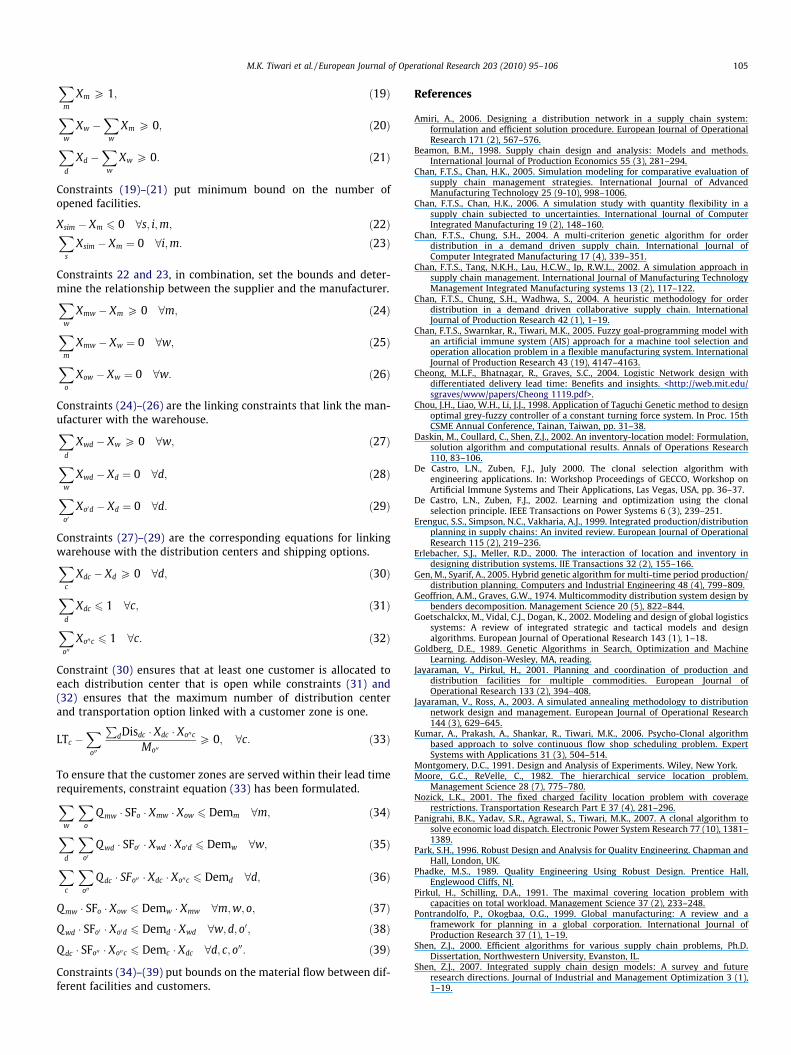
Constraints (19)–(21) put minimum bound on the number ofopened facilities.
Xsim � Xm 6 0 8s; i;m; ð22ÞXs
Xsim � Xm ¼ 0 8i;m: ð23Þ
Constraints 22 and 23, in combination, set the bounds and deter-mine the relationship between the supplier and the manufacturer.X
w
Xmw � Xm P 0 8m; ð24Þ
Xm
Xmw � Xw ¼ 0 8w; ð25Þ
Xo
Xow � Xw ¼ 0 8w: ð26Þ
Constraints (24)–(26) are the linking constraints that link the man-ufacturer with the warehouse.X
d
Xwd � Xw P 0 8w; ð27Þ
Xw
Xwd � Xd ¼ 0 8d; ð28Þ
Xo0
Xo0d � Xd ¼ 0 8d: ð29Þ
Constraints (27)–(29) are the corresponding equations for linkingwarehouse with the distribution centers and shipping options.X
c
Xdc � Xd P 0 8d; ð30Þ
Xd
Xdc 6 1 8c; ð31Þ
Xo00
Xo00c 6 1 8c: ð32Þ
Constraint (30) ensures that at least one customer is allocated toeach distribution center that is open while constraints (31) and(32) ensures that the maximum number of distribution centerand transportation option linked with a customer zone is one.
LTc �X
o00
PdDisdc � Xdc � Xo00c
Mo00P 0; 8c: ð33Þ
To ensure that the customer zones are served within their lead timerequirements, constraint equation (33) has been formulated.X
w
Xo
Q mw � SFo � Xmw � Xow 6 Demm 8m; ð34Þ
Xd
Xo0
Q wd � SFo0 � Xwd � Xo0d 6 Demw 8w; ð35Þ
Xc
Xo00
Q dc � SFo00 � Xdc � Xo00c 6 Demd 8d; ð36Þ
Qmw � SFo � Xow 6 Demw � Xmw 8m;w; o; ð37Þ
Q wd � SFo0 � Xo0d 6 Demd � Xwd 8w;d; o0; ð38Þ
Qdc � SFo00 � Xo00c 6 Demc � Xdc 8d; c; o00: ð39Þ
Constraints (34)–(39) put bounds on the material flow between dif-ferent facilities and customers.
References
Amiri, A., 2006. Designing a distribution network in a supply chain system:formulation and efficient solution procedure. European Journal of OperationalResearch 171 (2), 567–576.
Beamon, B.M., 1998. Supply chain design and analysis: Models and methods.International Journal of Production Economics 55 (3), 281–294.
Chan, F.T.S., Chan, H.K., 2005. Simulation modeling for comparative evaluation ofsupply chain management strategies. International Journal of AdvancedManufacturing Technology 25 (9-10), 998–1006.
Chan, F.T.S., Chan, H.K., 2006. A simulation study with quantity flexibility in asupply chain subjected to uncertainties. International Journal of ComputerIntegrated Manufacturing 19 (2), 148–160.
Chan, F.T.S., Chung, S.H., 2004. A multi-criterion genetic algorithm for orderdistribution in a demand driven supply chain. International Journal ofComputer Integrated Manufacturing 17 (4), 339–351.
Chan, F.T.S., Tang, N.K.H., Lau, H.C.W., Ip, R.W.L., 2002. A simulation approach insupply chain management. International Journal of Manufacturing TechnologyManagement Integrated Manufacturing systems 13 (2), 117–122.
Chan, F.T.S., Chung, S.H., Wadhwa, S., 2004. A heuristic methodology for orderdistribution in a demand driven collaborative supply chain. InternationalJournal of Production Research 42 (1), 1–19.
Chan, F.T.S., Swarnkar, R., Tiwari, M.K., 2005. Fuzzy goal-programming model withan artificial immune system (AIS) approach for a machine tool selection andoperation allocation problem in a flexible manufacturing system. InternationalJournal of Production Research 43 (19), 4147–4163.
Cheong, M.L.F., Bhatnagar, R., Graves, S.C., 2004. Logistic Network design withdifferentiated delivery lead time: Benefits and insights. <http://web.mit.edu/sgraves/www/papers/Cheong 1119.pdf>.
Chou, J.H., Liao, W.H., Li, J.J., 1998. Application of Taguchi Genetic method to designoptimal grey-fuzzy controller of a constant turning force system. In Proc. 15thCSME Annual Conference, Tainan, Taiwan, pp. 31–38.
Daskin, M., Coullard, C., Shen, Z.J., 2002. An inventory-location model: Formulation,solution algorithm and computational results. Annals of Operations Research110, 83–106.
De Castro, L.N., Zuben, F.J., July 2000. The clonal selection algorithm withengineering applications. In: Workshop Proceedings of GECCO, Workshop onArtificial Immune Systems and Their Applications, Las Vegas, USA, pp. 36–37.
De Castro, L.N., Zuben, F.J., 2002. Learning and optimization using the clonalselection principle. IEEE Transactions on Power Systems 6 (3), 239–251.
Erenguc, S.S., Simpson, N.C., Vakharia, A.J., 1999. Integrated production/distributionplanning in supply chains: An invited review. European Journal of OperationalResearch 115 (2), 219–236.
Erlebacher, S.J., Meller, R.D., 2000. The interaction of location and inventory indesigning distribution systems. IIE Transactions 32 (2), 155–166.
Gen, M., Syarif, A., 2005. Hybrid genetic algorithm for multi-time period production/distribution planning. Computers and Industrial Engineering 48 (4), 799–809.
Geoffrion, A.M., Graves, G.W., 1974. Multicommodity distribution system design bybenders decomposition. Management Science 20 (5), 822–844.
Goetschalckx, M., Vidal, C.J., Dogan, K., 2002. Modeling and design of global logisticssystems: A review of integrated strategic and tactical models and designalgorithms. European Journal of Operational Research 143 (1), 1–18.
Goldberg, D.E., 1989. Genetic Algorithms in Search, Optimization and MachineLearning. Addison-Wesley, MA, reading.
Jayaraman, V., Pirkul, H., 2001. Planning and coordination of production anddistribution facilities for multiple commodities. European Journal ofOperational Research 133 (2), 394–408.
Jayaraman, V., Ross, A., 2003. A simulated annealing methodology to distributionnetwork design and management. European Journal of Operational Research144 (3), 629–645.
Kumar, A., Prakash, A., Shankar, R., Tiwari, M.K., 2006. Psycho-Clonal algorithmbased approach to solve continuous flow shop scheduling problem. ExpertSystems with Applications 31 (3), 504–514.
Montgomery, D.C., 1991. Design and Analysis of Experiments. Wiley, New York.Moore, G.C., ReVelle, C., 1982. The hierarchical service location problem.
Management Science 28 (7), 775–780.Nozick, L.K., 2001. The fixed charged facility location problem with coverage
restrictions. Transportation Research Part E 37 (4), 281–296.Panigrahi, B.K., Yadav, S.R., Agrawal, S., Tiwari, M.K., 2007. A clonal algorithm to
solve economic load dispatch. Electronic Power System Research 77 (10), 1381–1389.
Park, S.H., 1996. Robust Design and Analysis for Quality Engineering. Chapman andHall, London, UK.
Phadke, M.S., 1989. Quality Engineering Using Robust Design. Prentice Hall,Englewood Cliffs, NJ.
Pirkul, H., Schilling, D.A., 1991. The maximal covering location problem withcapacities on total workload. Management Science 37 (2), 233–248.
Pontrandolfo, P., Okogbaa, O.G., 1999. Global manufacturing: A review and aframework for planning in a global corporation. International Journal ofProduction Research 37 (1), 1–19.
Shen, Z.J., 2000. Efficient algorithms for various supply chain problems, Ph.D.Dissertation, Northwestern University, Evanston, IL.
Shen, Z.J., 2007. Integrated supply chain design models: A survey and futureresearch directions. Journal of Industrial and Management Optimization 3 (1),1–19.

106 M.K. Tiwari et al. / European Journal of Operational Research 203 (2010) 95–106
Shen, Z.J., Qi, L., 2007. Incorporating inventory and routing costs in strategic locationmodels. European Journal of Operational Research 179 (2), 372–389.
Shen, Z.J., Coullard, C., Daskin, M., 2003. A joint location-inventory model.Transportation Science 37 (1), 40–55.
Syam, S.S., 2002. A model and methodologies for the location problemwith logistical components. Computers and Operations Research 29 (9),1173–1193.
Taguchi, G., Chowdhury, S., Taguchi, S., 2000. Robust Engineering. McGraw-Hill,New York.
Truong, T.H., Azadivar, F., 2005. Optimal design methodologies for configurationof supply chains. International Journal of Production Research 43 (11), 2217–2236.
Tsai, J.T., Liu, T.K., Chou, J.H., 2004. Hybrid Taguchi Genetic algorithm for globalnumerical optimization. IEEE Transactions on Evolutionary Computation 8 (4),365–377.
Vidal, C.J., Goetschalckx, M., 1997. Strategic production-distribution models: Acritical review with emphasis on global supply chain models. European Journalof Operational Research 98 (1), 1–18.
Weber, A., 1909. Uber den Standort der Industrien, translated as Alfred Weber’sTheory of Location of Industries. University of Chicago Press, Chicago.
Wu, Y., Wu, A., 2000. Taguchi Methods for Robust Design. ASME, New York.Yan, H., Yu, Z., Cheng, T.C.E., 2003. A strategic model for supply chain design with
logical constraints: Formulation and solution. Computers and OperationsResearch 30 (14), 2135–2155.