A Heterogeneous Expression Pattern for Nanog in Embryonic Stem Cells
9
A Heterogeneous Expression Pattern for Nanog in Embryonic Stem Cells AMAR M. SINGH,TAKASHI HAMAZAKI,KATHERINE E. HANKOWSKI,NAOHIRO TERADA Department of Pathology, University of Florida College of Medicine, Gainesville, Florida, USA Key Words. Embryonic stem cells • Nanog • Gata6 • Heterogeneity • Primitive endoderm ABSTRACT Nanog is a critical homeodomain factor responsible for main- taining embryonic stem (ES) cell self-renewal and pluripo- tency. Of interest, Nanog expression is not homogeneous in the conventional culture of murine ES cells. A Nanog-high popu- lation expresses markers for pluripotent ES cells, whereas a Nanog-low population expresses markers for primitive endoderm, such as Gata6. Since the inner cell mass of early blastocysts has recently been reported to be heterogeneous in terms of Nanog and Gata6 expression, ES cells appear to closely resemble the developing stage from which they origi- nate. We further demonstrate that Nanog can directly repress Gata6 expression through its binding to the proximal promoter region of the Gata6 gene and that overexpression of Nanog reduces heterogeneity during ES cell maintenance. Interest- ingly, Nanog heterogeneity does not correlate with the hetero- geneous expression of stage-specific embryonic antigen-1, sug- gesting that multiple but overlapping levels of heterogeneity may exist in ES cells. These findings provide insight into the factors that control ES cell self-renewal and the earliest lineage commitment to primitive endoderm while also suggesting methods to promote homogeneity during ES cell maintenance. STEM CELLS 2007;25:2534 –2542 Disclosure of potential conflicts of interest is found at the end of this article. INTRODUCTION Embryonic stem (ES) cells are isolated from the inner cell mass of preimplantation blastocysts and have the capacity for indefinite self-renewal in cell culture [1, 2]. ES cells are pluripotent and can be differentiated in vitro into multiple cell lineages by the hanging drop method [3]. In this method, ES cells are aggregated into embryoid bodies in droplets on the lids of Petri dishes. Upon aggregation and differentiation, ES cells recapitulate early embry- onic development by forming an outer primitive endoderm layer, whereas the inner cells stay more epiblast-like [4]. Extrinsic factors, such as leukemia inhibitory factor (LIF) and bone morphogenetic protein-4, have been shown to be required for maintenance of ES cells in an undifferentiated state [5–7]. Furthermore, multiple in- trinsic factors, including Nanog, Oct4, and Sox2, are important for maintaining ES cells and preventing the onset of differentiation [8 –11]. Likewise, several intrinsic factors, such as Gata4, Gata6, and Brachyury, are critical for the early stages of differentiation to primitive endoderm and mesendoderm lineages [4]. The homeodomain protein Nanog is considered to be a master transcriptional regulator of self-renewal and pluripotency in ES cells [12]. Nanog is expressed in ES cells and is rapidly downregu- lated during in vitro differentiation. Upon aggregation of ES cells, even in the presence of LIF, Nanog downregulation occurs at the outer layer, along with primitive endoderm formation [13]. Inter- estingly, Nanog overexpression maintains ES cells in the absence of LIF and blocks primitive endoderm differentiation upon aggre- gation [8, 13]. Similarly, Nanog is highly expressed in the inner cell mass of preimplantation blastocysts and is downregulated during further lineage specification [8]. Nanog knockout embryos fail to form epiblasts, and are mostly composed of disorganized extraem- bryonic tissue [8]. These data suggest that a primary function for Nanog is the repression of differentiation to primitive endoderm. The mechanism by which Nanog inhibits primitive endoderm differentiation is likely multifaceted, since Nanog, in combination with Oct4 and Sox2, serves as both an activator and repressor of multiple target genes responsible for self-renewal and differentia- tion [14]. Heterogeneity during ES cell differentiation has posed a particular problem in the formation of lineage-specific cell pop- ulations potentially useful for cell-transplantation therapies [15]. Recently, both human and mouse ES cells have been described as being heterogeneous cell populations during normal ES cell maintenance. For example, mouse ES cells were shown to heterogeneously express Pecam-1/CD31, and pluripotency fac- tors were more highly expressed in the Pecam-1 positive pop- ulation [16]. Also, the epigenetic status of some genes was different between the Pecam-1 positive and negative popula- tions. Furthermore, human ES cells have been separated based on the expression of stage-specific embryonic antigen-3 (SSEA3) [17]. Differences in these populations showed variable expression of pluripotency factors and also changes in clonoge- nicity and cell cycle. In the present study, we have explored mouse ES cell heterogeneity in terms of Nanog gene expression. MATERIALS AND METHODS Maintenance of Mouse ES Cells The cell lines used for this study were Nanog-TRE ES cells as we previously described [13], R1 ES cells (a gift from Dr. A. Nagy, Toronto), Nanog -geo ES cells (a gift from Dr. S. Yamanaka, Correspondence: Naohiro Terada, M.D., Ph.D., Department of Pathology, University of Florida College of Medicine, Box 100275, Gainesville, Florida 32610, USA. Telephone: (352) 392-2696; Fax: (352) 392-6249; e-mail: [email protected] Received February 14, 2007; accepted for publication June 23, 2007; first published online in STEM CELLS EXPRESS July 5, 2007. ©AlphaMed Press 1066-5099/2007/$30.00/0 doi: 10.1634/stemcells.2007-0126 EMBRYONIC STEM CELLS S TEM CELLS 2007;25:2534 –2542 www.StemCells.com
-
Upload
independent -
Category
Documents
-
view
0 -
download
0
Transcript of A Heterogeneous Expression Pattern for Nanog in Embryonic Stem Cells

A Heterogeneous Expression Pattern for Nanog in EmbryonicStem Cells
AMAR M. SINGH, TAKASHI HAMAZAKI, KATHERINE E. HANKOWSKI, NAOHIRO TERADA
Department of Pathology, University of Florida College of Medicine, Gainesville, Florida, USA
Key Words. Embryonic stem cells • Nanog • Gata6 • Heterogeneity • Primitive endoderm
ABSTRACT
Nanog is a critical homeodomain factor responsible for main-taining embryonic stem (ES) cell self-renewal and pluripo-tency. Of interest, Nanog expression is not homogeneous in theconventional culture of murine ES cells. A Nanog-high popu-lation expresses markers for pluripotent ES cells, whereas aNanog-low population expresses markers for primitiveendoderm, such as Gata6. Since the inner cell mass of earlyblastocysts has recently been reported to be heterogeneous interms of Nanog and Gata6 expression, ES cells appear toclosely resemble the developing stage from which they origi-nate. We further demonstrate that Nanog can directly repress
Gata6 expression through its binding to the proximal promoterregion of the Gata6 gene and that overexpression of Nanogreduces heterogeneity during ES cell maintenance. Interest-ingly, Nanog heterogeneity does not correlate with the hetero-geneous expression of stage-specific embryonic antigen-1, sug-gesting that multiple but overlapping levels of heterogeneitymay exist in ES cells. These findings provide insight into thefactors that control ES cell self-renewal and the earliest lineagecommitment to primitive endoderm while also suggestingmethods to promote homogeneity during ES cell maintenance.STEM CELLS 2007;25:2534–2542
Disclosure of potential conflicts of interest is found at the end of this article.
INTRODUCTION
Embryonic stem (ES) cells are isolated from the inner cell mass ofpreimplantation blastocysts and have the capacity for indefiniteself-renewal in cell culture [1, 2]. ES cells are pluripotent and canbe differentiated in vitro into multiple cell lineages by the hangingdrop method [3]. In this method, ES cells are aggregated intoembryoid bodies in droplets on the lids of Petri dishes. Uponaggregation and differentiation, ES cells recapitulate early embry-onic development by forming an outer primitive endoderm layer,whereas the inner cells stay more epiblast-like [4]. Extrinsic factors,such as leukemia inhibitory factor (LIF) and bone morphogeneticprotein-4, have been shown to be required for maintenance of EScells in an undifferentiated state [5–7]. Furthermore, multiple in-trinsic factors, including Nanog, Oct4, and Sox2, are important formaintaining ES cells and preventing the onset of differentiation[8–11]. Likewise, several intrinsic factors, such as Gata4, Gata6,and Brachyury, are critical for the early stages of differentiation toprimitive endoderm and mesendoderm lineages [4].
The homeodomain protein Nanog is considered to be a mastertranscriptional regulator of self-renewal and pluripotency in EScells [12]. Nanog is expressed in ES cells and is rapidly downregu-lated during in vitro differentiation. Upon aggregation of ES cells,even in the presence of LIF, Nanog downregulation occurs at theouter layer, along with primitive endoderm formation [13]. Inter-estingly, Nanog overexpression maintains ES cells in the absenceof LIF and blocks primitive endoderm differentiation upon aggre-gation [8, 13]. Similarly, Nanog is highly expressed in the inner cellmass of preimplantation blastocysts and is downregulated duringfurther lineage specification [8]. Nanog knockout embryos fail toform epiblasts, and are mostly composed of disorganized extraem-
bryonic tissue [8]. These data suggest that a primary function forNanog is the repression of differentiation to primitive endoderm.The mechanism by which Nanog inhibits primitive endodermdifferentiation is likely multifaceted, since Nanog, in combinationwith Oct4 and Sox2, serves as both an activator and repressor ofmultiple target genes responsible for self-renewal and differentia-tion [14].
Heterogeneity during ES cell differentiation has posed aparticular problem in the formation of lineage-specific cell pop-ulations potentially useful for cell-transplantation therapies [15].Recently, both human and mouse ES cells have been describedas being heterogeneous cell populations during normal ES cellmaintenance. For example, mouse ES cells were shown toheterogeneously express Pecam-1/CD31, and pluripotency fac-tors were more highly expressed in the Pecam-1 positive pop-ulation [16]. Also, the epigenetic status of some genes wasdifferent between the Pecam-1 positive and negative popula-tions. Furthermore, human ES cells have been separated basedon the expression of stage-specific embryonic antigen-3(SSEA3) [17]. Differences in these populations showed variableexpression of pluripotency factors and also changes in clonoge-nicity and cell cycle. In the present study, we have exploredmouse ES cell heterogeneity in terms of Nanog gene expression.
MATERIALS AND METHODS
Maintenance of Mouse ES CellsThe cell lines used for this study were Nanog-TRE ES cells as wepreviously described [13], R1 ES cells (a gift from Dr. A. Nagy,Toronto), Nanog �-geo ES cells (a gift from Dr. S. Yamanaka,
Correspondence: Naohiro Terada, M.D., Ph.D., Department of Pathology, University of Florida College of Medicine, Box 100275,Gainesville, Florida 32610, USA. Telephone: (352) 392-2696; Fax: (352) 392-6249; e-mail: [email protected] Received February14, 2007; accepted for publication June 23, 2007; first published online in STEM CELLS EXPRESS July 5, 2007. ©AlphaMed Press1066-5099/2007/$30.00/0 doi: 10.1634/stemcells.2007-0126
EMBRYONIC STEM CELLS
STEM CELLS 2007;25:2534–2542 www.StemCells.com
Kyoto, Japan) [8], Rosa ES cells (a gift from Dr. S. P. Oh, Univer-sity of Florida, Gainesville, FL), and J1 ES cells (American TypeCulture Collection, Manassas, VA, http://www.atcc.org). All em-bryonic stem cell lines were maintained in an undifferentiated stateas described [13]. Briefly, ES cells were maintained in an undiffer-entiated state on gelatin-coated dishes in knockout Dulbecco’s mod-ified Eagle’s medium (Gibco-BRL, Gaithersburg, MD, http://www.gibcobrl.com) containing 10% knockout serum replacement (Gibco-BRL), 1% fetal bovine serum (Atlanta Biologicals, Lawrenceville,GA, http://www.atlantabio.com), 2 mM L-glutamine, 100 U/ml pen-icillin, 100 �g/ml streptomycin, 25 mM HEPES (Gibco-BRL),300 �M monothioglycerol (Sigma-Aldrich, St. Louis, http://www.sigmaaldrich.com), and 1,000 U/ml recombinant mouseLIF (ESGRO; Chemicon, Temecula, CA, http://www.chemicon.com).
Differentiation of ES CellsFluorescent-activated cell sorting (FACS) separated cells were dif-ferentiated in monolayer culture by plating 40,000 cells onto gela-tin-coated dishes in Dulbecco’s modified Eagle’s medium, 20%fetal bovine serum (Atlanta Biologicals), 2 mM L-glutamine, 100U/ml penicillin, and 100 �g/ml streptomycin (Gibco-BRL).
Site-Directed MutagenesisMutagenesis of the Gata6 �-galactosidase reporter vector (a giftfrom Dr. Molkentin [18]) was performed using QuikChange Site-Directed Mutagenesis Kit (Stratagene, La Jolla, CA, http://www.stratagene.com) according to the manufacturer’s instructions.Briefly, the following forward (GTGTTACAGCGCTGGAT-GGGCCTGGGTCGCTGGCC) and reverse (GGCCAGCGAC-CCAGGCCCATCCAGCGCTGTAACAC) polyacrylamide gelelectrophoresis purified primers were ordered from Integrated DNATechnologies, Inc. (Coralville, IA, http://www.idtdna.com/Home/Home.aspx; mutated sites are italicized). Reaction consisted of 5 �lof 10� reaction buffer, 50 ng of vector template, 125 ng of eachprimer, 1 �l of deoxynucleoside-5�-triphosphate mix, and 1 �l ofpfuTurbo DNA polymerase up to a final volume of 50 �l. Reactionconditions consisted of one cycle at 95°C for 30 seconds and then18 cycles of 95°C for 30 seconds, 55°C for 1 minute, and 68°C for9 minutes. Template vector was next degraded by the addition of 1�l of DpnI restriction endonuclease and incubated at 37°C for 1hour. Reactions were transformed into Max Efficiency DH5� chem-ically competent cells (Invitrogen, Carlsbad, CA, http://www.invitrogen.com), analyzed by gel electrophoresis, and sequenced.All the recombinant DNA experiments here and below were per-formed under the National Institutes of Health guidelines.
Reverse Transcription-Polymerase Chain ReactionTotal RNA was extracted using the RNA aqueous kit according tothe manufacturer’s instructions (Ambion, Austin, TX, http://www.ambion.com), and reverse transcription-polymerase chain reaction(RT-PCR) was performed as previously described [13]. Briefly,cDNA was synthesized using SuperScript II first-strand synthesissystem with oligo(dT) (Invitrogen). PCR was performed using TaqDNA polymerase kit (Eppendorf AG, Hamburg, Germany, http://www.eppendorf.de). For each gene, primers were designed fromdifferent exons, avoiding pseudogenes, to make sure that the PCRproduct would represent the mRNA target and not backgroundgenomic DNA. Primer sequences are available upon request.
Chromatin ImmunoprecipitationChromatin immunoprecipitation (ChIP) was performed using theChIP assay kit from Upstate (Charlottesville, VA, http://www.upstate.com) according to the manufacturer’s instructions. Briefly, a100-mm plate of ES cells was fixed in formaldehyde to a finalconcentration of 1% and incubated for 10 minutes at 37°C. Cellswere collected in cold phosphate-buffered saline (PBS) with pro-tease inhibitors. Cells were sonicated by three 20-second bursts with2-minute rests on ice using setting 7 on a Fisher Scientific SonicatorDismembrator Model 100 (Fisher Scientific International, Hamp-ton, NH, http://www.fisherscientific.com). Lysates were centrifugedfor 10 minutes, and supernatants were collected, diluted, and a
sample was kept as input DNA. The supernatant was next pre-cleared and collected again following centrifugation. Approxi-mately 5 �l of each antibody (control IgG, Sigma; H3-acetylated(general) and H3-K9-dimethylated, Upstate; Nanog, Chemicon)was added to the supernatant and incubated overnight at 4°C. Thefollowing day, 60 �l of Salmon Sperm DNA/Protein A Agarose-50% slurry was added to the reaction and incubated for 1-hourrocking at 4°C. The agarose complex was then collected andwashed, and the DNA was eluted off in 1% sodium dodecyl sulfateand 0.1 M NaHCO3, and cross-linking was reversed by incubationat 65°C for 4 hours. Proteins were degraded by proteinase K for 1hour at 45°C. Finally, DNA was recovered using the Qiagen PCRPurification Kit (Qiagen, Hilden, Germany, http://www1.qiagen.com), and PCR was performed with the Taq DNA polymerase kit(Eppendorf).
Immunofluorescence Staining and ConfocalMicroscopy AnalysisES cells were grown on eight-chamber slides (BD Biosciences, SanDiego, http://www.bdbiosciences.com). Immunostaining was per-formed by first fixing the differentiated cells in 3.7% formaldehyde.Cells were next permeabilized with 0.5% Triton X-100 in PBS.Cells were blocked for 1 hour in 5% bovine serum albumin/PBS andthen incubated with the Nanog antibody (Calbiochem, San Diego,http://www.emdbiosciences.com), Oct4 antibody (Santa Cruz Bio-technology Inc., Santa Cruz, CA, http://www.scbt.com), and SSEA1antibody (MC-480) (Developmental Studies Hybridoma Bank, IowaCity, IA, http://www.uiowa.edu/�dshbwww) overnight in blockingsolution. Cells were washed five times in PBS and incubated withsecondary antibody, rhodamine-conjugated anti-Rabbit IgG for 45minutes (Nanog), fluorescein isothiocyanate-conjugated anti-mouseIgG (Oct4), and fluorescein isothiocyanate-conjugated anti-mouseIgM (SSEA1). Cells were again washed five times in PBS. The slideswere counterstained and mounted in antifade medium (Vectashield;Vector Laboratories, Burlingame, CA, http://www.vectorlabs.com)with 4�-6-diamidino-2-phenylindole. Fluorescence was documentedusing a laser scanning spectral confocal microscope (TCS SP2; Leica,Heerbrugg, Switzerland, http://www.leica.com).
5-Bromo-4-chloro-3-indolyl-�-D-galactoside StainingWe performed 5-bromo-4-chloro-3-indolyl-�-D-galactoside (X-gal)staining using the In Situ �-Galactosidase Staining Kit according tomanufacturer’s instructions (Stratagene). Medium from the cellswas removed, and the cells were then fixed in 1� fixing solution for10 minutes at room temperature. Cells were washed twice in PBS,and then 1� staining solution was added containing 1 mg/ml X-gal.Cells were incubated overnight at 37°C and analyzed by bright-fieldlight microscopy.
�-Galactosidase Activity Assays�-Galactosidase activity assays were performed using the �-Galac-tosidase Enzyme Assay System with Reporter Lysis Buffer kit(Promega, Madison, WI, http://www.promega.com) according tomanufacturer’s instructions. Briefly, cells were collected using arubber scraper in 1� Reporter Lysis Buffer. Next, 150 �l of celllysates were mixed with 150 �l of Assay 2� Buffer and incubatedfor 3 hours at 37°C. Reactions were stopped by adding 500 �l of 1M sodium carbonate. The absorbance was read at 420 nm, andreadings were compared with a standard curve using �-galactosi-dase enzyme. Activity is measured in units of �-galactosidase. Allassays were performed in triplicate, and standard deviations and pvalues from Student’s t test were determined.
Fluorescein di-�-D-Galactopyranoside Staining of ESCellsFluorescein di-�-D-galactopyranoside (FDG) (Sigma) was dis-solved in dimethyl sulfoxide to make a 20 mM stock solution, andaliquots were frozen at �20°C. Staining was performed as previ-ously described [19]. Cells were first washed twice in PBS and thenincubated in PBS for 5 minutes at 37°C. Next, a 1 mM FDGsolution in 50% PBS/H2O was prepared and warmed to 37°C. PBS
2535Singh, Hamazaki, Hankowski et al.
www.StemCells.com
was then removed from the cells, and FDG solution was added tothe plate and incubated at 37°C for 1 minute. Cells were then placedon ice, and 1 ml of ice-cold PBS was added to the cells for 5minutes. Immunofluorescence was detected using an Olympus (To-kyo, http://www.olympus-global.com) IX70 inverted fluorescentmicroscope with an Optronics (Muskogee, OK, http://www.optronicsinc.com) digital camera.
Fluorescent-Activated Cell SortingCells were prepared in a single cell suspension by treatment with0.05% trypsin/EDTA and incubated at 37°C for 5–10 minutes. Acell pellet was collected by centrifugation. To FDG stain cells forFACS, the following protocol was used: A 2-mM FDG solution insterile warm deionized H2O was first prepared. Next, the cell pelletwas resuspended in 100 �l of prewarmed reduced serum medium(Opti-MEM; Invitrogen). Then, 100 �l of FDG solution was addedto the cells, and the mixture was incubated at 37°C for 1 minute.The cell suspension was next diluted in ice-cold growth mediumand kept on ice for 30 minutes. Before FACS, 1 �g/ml propidiumiodide (Sigma) was added to account for the dead cells resultingfrom the osmotic shock.
For sorting of the SSEA1 stained cells, ES cell pellets wereresuspended in PBS containing 1% bovine serum albumin and werestained with anti-SSEA1 antibody (MC-480) (Developmental Stud-ies Hybridoma Bank) for 60 minutes on ice. The cells were thenwashed and resuspended in the buffer containing phycoerythrin-conjugated anti-mouse IgM (BioLegend, San Diego, http://www.biolegend.com). After 60 minutes of incubation on ice, the cellswere washed. Sorted cells were collected by Vantage (Becton,Dickinson and Company, Franklin Lakes, NJ, http://www.bd.com)using CellQuest Acquisition data analysis software (Becton, Dick-inson).
Gene Expression ProfilingRNA was extracted from FDG sorted cells using RNAqueous Kit(Ambion) as already described. Gene expression profiling wasperformed by GenUs Biosystems (Northbrook, IL, http://www.genusbiosystems.com). Total RNA samples were quantitated by UVspectrophotometry (optical density 260/280). Quality of total RNAwas assessed using an Agilent Bioanalyzer (Agilent Technologies,Palo Alto, CA, http://www.agilent.com). First and second strandcDNA were prepared from the total RNA samples. Biotinylatedcomplementary RNA (cRNA) target was prepared from the DNAtemplate and verified on the Bioanalyzer. cRNA was fragmented touniform size and verified on the Bioanalyzer. CodeLink MouseWhole Genome Bioarrays (GE Healthcare, Piscataway, NJ, http://www.gehealthcare.com) containing approximately 36,000 gene tar-gets were hybridized with the cRNA target and stained with Cy5-streptavidin. Slides were washed and then scanned on an AxonGenePix 4000B scanner (Axon Instruments/Molecular DevicesCorp., Union City, CA, http://www.moleculardevices.com). Datawere analyzed with CodeLink and GeneSpring software packages.Intensity values were normalized to the median value from thearray, and those genes that were differentially expressed by twofoldor more were annotated.
RESULTS
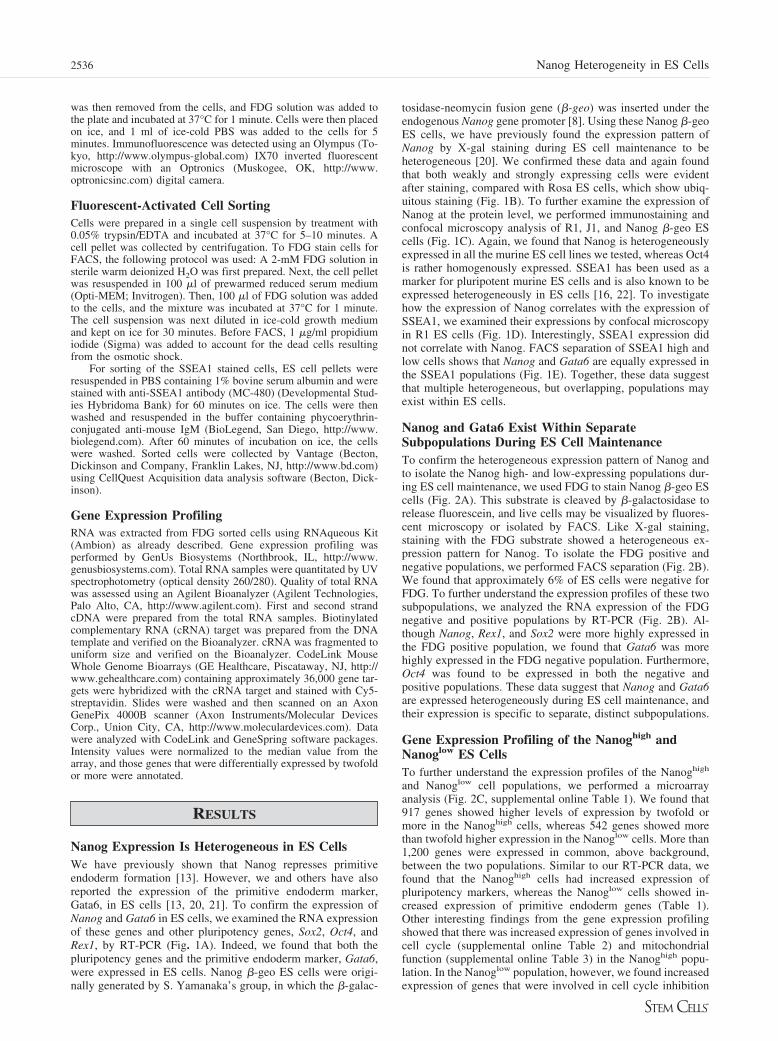
Nanog Expression Is Heterogeneous in ES CellsWe have previously shown that Nanog represses primitiveendoderm formation [13]. However, we and others have alsoreported the expression of the primitive endoderm marker,Gata6, in ES cells [13, 20, 21]. To confirm the expression ofNanog and Gata6 in ES cells, we examined the RNA expressionof these genes and other pluripotency genes, Sox2, Oct4, andRex1, by RT-PCR (Fig. 1A). Indeed, we found that both thepluripotency genes and the primitive endoderm marker, Gata6,were expressed in ES cells. Nanog �-geo ES cells were origi-nally generated by S. Yamanaka’s group, in which the �-galac-
tosidase-neomycin fusion gene (�-geo) was inserted under theendogenous Nanog gene promoter [8]. Using these Nanog �-geoES cells, we have previously found the expression pattern ofNanog by X-gal staining during ES cell maintenance to beheterogeneous [20]. We confirmed these data and again foundthat both weakly and strongly expressing cells were evidentafter staining, compared with Rosa ES cells, which show ubiq-uitous staining (Fig. 1B). To further examine the expression ofNanog at the protein level, we performed immunostaining andconfocal microscopy analysis of R1, J1, and Nanog �-geo EScells (Fig. 1C). Again, we found that Nanog is heterogeneouslyexpressed in all the murine ES cell lines we tested, whereas Oct4is rather homogenously expressed. SSEA1 has been used as amarker for pluripotent murine ES cells and is also known to beexpressed heterogeneously in ES cells [16, 22]. To investigatehow the expression of Nanog correlates with the expression ofSSEA1, we examined their expressions by confocal microscopyin R1 ES cells (Fig. 1D). Interestingly, SSEA1 expression didnot correlate with Nanog. FACS separation of SSEA1 high andlow cells shows that Nanog and Gata6 are equally expressed inthe SSEA1 populations (Fig. 1E). Together, these data suggestthat multiple heterogeneous, but overlapping, populations mayexist within ES cells.
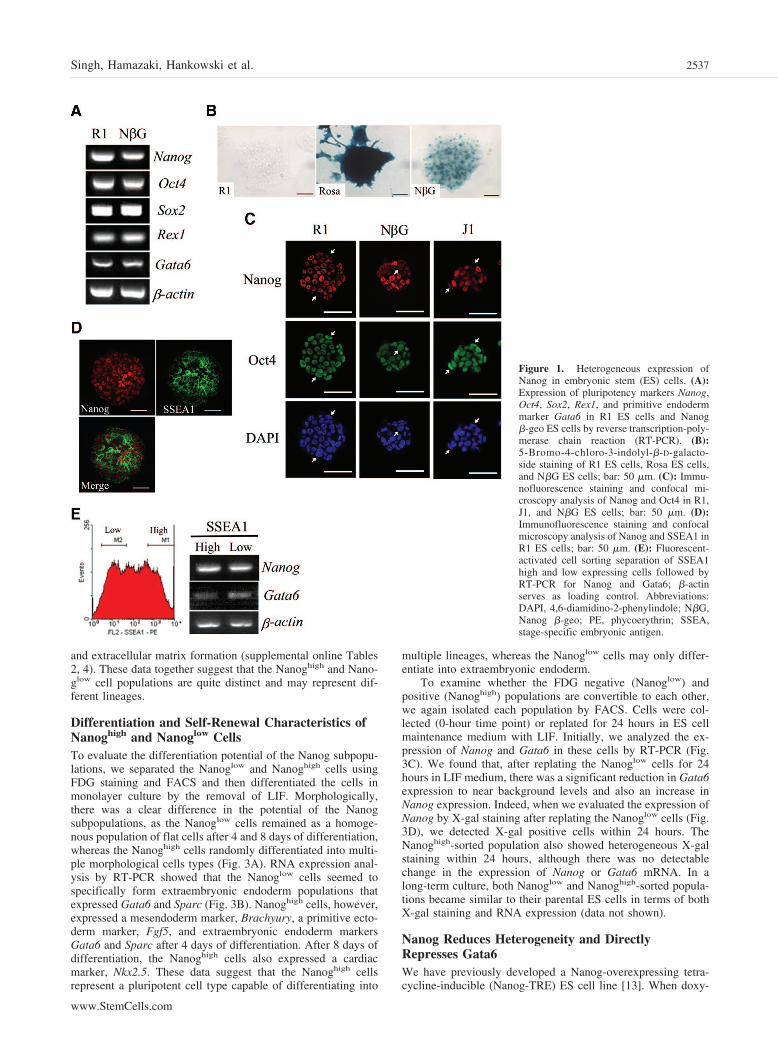
Nanog and Gata6 Exist Within SeparateSubpopulations During ES Cell MaintenanceTo confirm the heterogeneous expression pattern of Nanog andto isolate the Nanog high- and low-expressing populations dur-ing ES cell maintenance, we used FDG to stain Nanog �-geo EScells (Fig. 2A). This substrate is cleaved by �-galactosidase torelease fluorescein, and live cells may be visualized by fluores-cent microscopy or isolated by FACS. Like X-gal staining,staining with the FDG substrate showed a heterogeneous ex-pression pattern for Nanog. To isolate the FDG positive andnegative populations, we performed FACS separation (Fig. 2B).We found that approximately 6% of ES cells were negative forFDG. To further understand the expression profiles of these twosubpopulations, we analyzed the RNA expression of the FDGnegative and positive populations by RT-PCR (Fig. 2B). Al-though Nanog, Rex1, and Sox2 were more highly expressed inthe FDG positive population, we found that Gata6 was morehighly expressed in the FDG negative population. Furthermore,Oct4 was found to be expressed in both the negative andpositive populations. These data suggest that Nanog and Gata6are expressed heterogeneously during ES cell maintenance, andtheir expression is specific to separate, distinct subpopulations.
Gene Expression Profiling of the Nanoghigh andNanoglow ES CellsTo further understand the expression profiles of the Nanoghigh
and Nanoglow cell populations, we performed a microarrayanalysis (Fig. 2C, supplemental online Table 1). We found that917 genes showed higher levels of expression by twofold ormore in the Nanoghigh cells, whereas 542 genes showed morethan twofold higher expression in the Nanoglow cells. More than1,200 genes were expressed in common, above background,between the two populations. Similar to our RT-PCR data, wefound that the Nanoghigh cells had increased expression ofpluripotency markers, whereas the Nanoglow cells showed in-creased expression of primitive endoderm genes (Table 1).Other interesting findings from the gene expression profilingshowed that there was increased expression of genes involved incell cycle (supplemental online Table 2) and mitochondrialfunction (supplemental online Table 3) in the Nanoghigh popu-lation. In the Nanoglow population, however, we found increasedexpression of genes that were involved in cell cycle inhibition
2536 Nanog Heterogeneity in ES Cells
and extracellular matrix formation (supplemental online Tables2, 4). These data together suggest that the Nanoghigh and Nano-glow cell populations are quite distinct and may represent dif-ferent lineages.
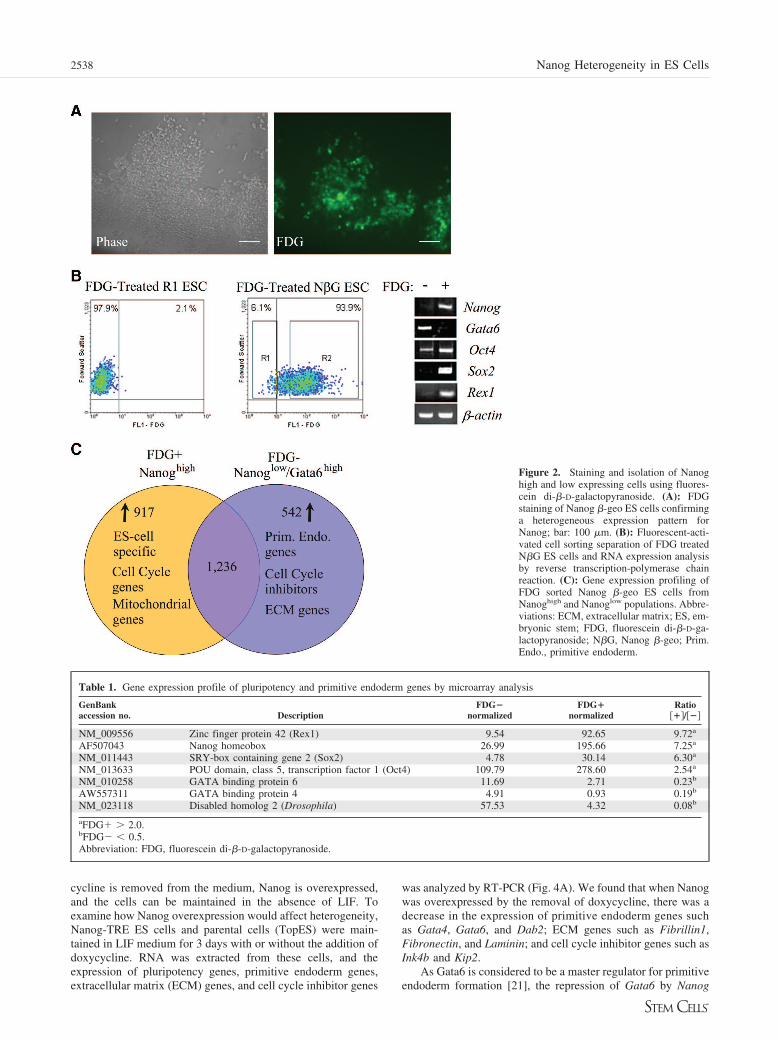
Differentiation and Self-Renewal Characteristics ofNanoghigh and Nanoglow CellsTo evaluate the differentiation potential of the Nanog subpopu-lations, we separated the Nanoglow and Nanoghigh cells usingFDG staining and FACS and then differentiated the cells inmonolayer culture by the removal of LIF. Morphologically,there was a clear difference in the potential of the Nanogsubpopulations, as the Nanoglow cells remained as a homoge-nous population of flat cells after 4 and 8 days of differentiation,whereas the Nanoghigh cells randomly differentiated into multi-ple morphological cells types (Fig. 3A). RNA expression anal-ysis by RT-PCR showed that the Nanoglow cells seemed tospecifically form extraembryonic endoderm populations thatexpressed Gata6 and Sparc (Fig. 3B). Nanoghigh cells, however,expressed a mesendoderm marker, Brachyury, a primitive ecto-derm marker, Fgf5, and extraembryonic endoderm markersGata6 and Sparc after 4 days of differentiation. After 8 days ofdifferentiation, the Nanoghigh cells also expressed a cardiacmarker, Nkx2.5. These data suggest that the Nanoghigh cellsrepresent a pluripotent cell type capable of differentiating into
multiple lineages, whereas the Nanoglow cells may only differ-entiate into extraembryonic endoderm.
To examine whether the FDG negative (Nanoglow) andpositive (Nanoghigh) populations are convertible to each other,we again isolated each population by FACS. Cells were col-lected (0-hour time point) or replated for 24 hours in ES cellmaintenance medium with LIF. Initially, we analyzed the ex-pression of Nanog and Gata6 in these cells by RT-PCR (Fig.3C). We found that, after replating the Nanoglow cells for 24hours in LIF medium, there was a significant reduction in Gata6expression to near background levels and also an increase inNanog expression. Indeed, when we evaluated the expression ofNanog by X-gal staining after replating the Nanoglow cells (Fig.3D), we detected X-gal positive cells within 24 hours. TheNanoghigh-sorted population also showed heterogeneous X-galstaining within 24 hours, although there was no detectablechange in the expression of Nanog or Gata6 mRNA. In along-term culture, both Nanoglow and Nanoghigh-sorted popula-tions became similar to their parental ES cells in terms of bothX-gal staining and RNA expression (data not shown).
Nanog Reduces Heterogeneity and DirectlyRepresses Gata6We have previously developed a Nanog-overexpressing tetra-cycline-inducible (Nanog-TRE) ES cell line [13]. When doxy-
Figure 1. Heterogeneous expression ofNanog in embryonic stem (ES) cells. (A):Expression of pluripotency markers Nanog,Oct4, Sox2, Rex1, and primitive endodermmarker Gata6 in R1 ES cells and Nanog�-geo ES cells by reverse transcription-poly-merase chain reaction (RT-PCR). (B):5-Bromo-4-chloro-3-indolyl-�-D-galacto-side staining of R1 ES cells, Rosa ES cells,and N�G ES cells; bar: 50 �m. (C): Immu-nofluorescence staining and confocal mi-croscopy analysis of Nanog and Oct4 in R1,J1, and N�G ES cells; bar: 50 �m. (D):Immunofluorescence staining and confocalmicroscopy analysis of Nanog and SSEA1 inR1 ES cells; bar: 50 �m. (E): Fluorescent-activated cell sorting separation of SSEA1high and low expressing cells followed byRT-PCR for Nanog and Gata6; �-actinserves as loading control. Abbreviations:DAPI, 4,6-diamidino-2-phenylindole; N�G,Nanog �-geo; PE, phycoerythrin; SSEA,stage-specific embryonic antigen.
2537Singh, Hamazaki, Hankowski et al.
www.StemCells.com
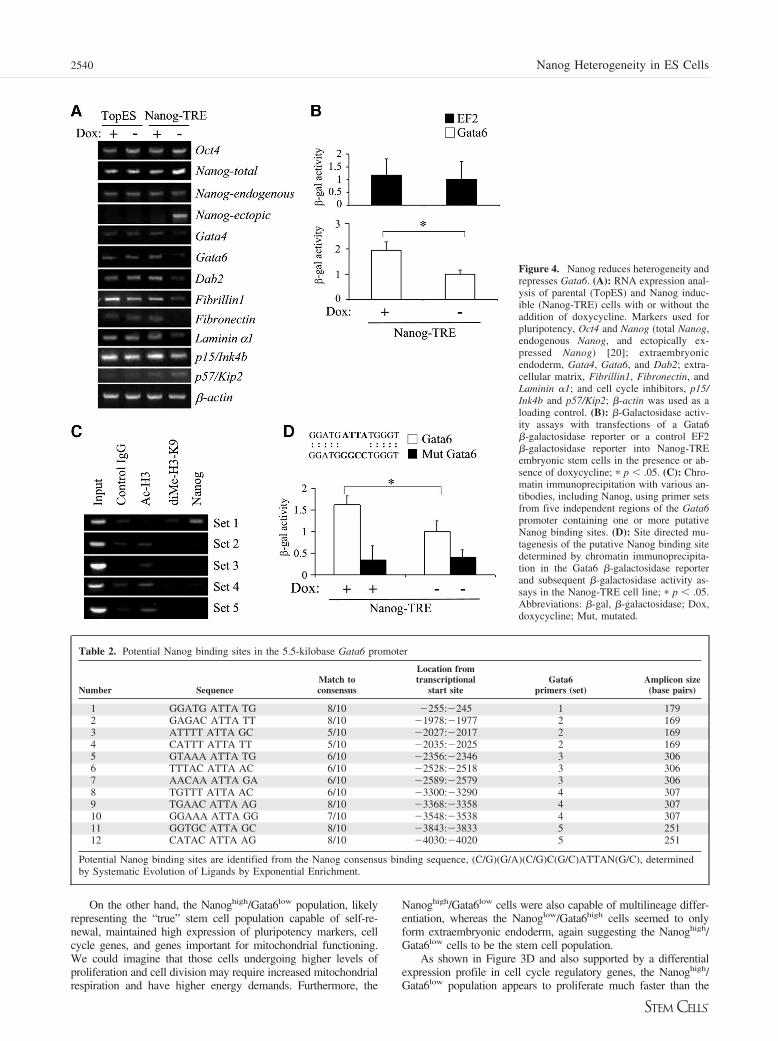
cycline is removed from the medium, Nanog is overexpressed,and the cells can be maintained in the absence of LIF. Toexamine how Nanog overexpression would affect heterogeneity,Nanog-TRE ES cells and parental cells (TopES) were main-tained in LIF medium for 3 days with or without the addition ofdoxycycline. RNA was extracted from these cells, and theexpression of pluripotency genes, primitive endoderm genes,extracellular matrix (ECM) genes, and cell cycle inhibitor genes
was analyzed by RT-PCR (Fig. 4A). We found that when Nanogwas overexpressed by the removal of doxycycline, there was adecrease in the expression of primitive endoderm genes suchas Gata4, Gata6, and Dab2; ECM genes such as Fibrillin1,Fibronectin, and Laminin; and cell cycle inhibitor genes such asInk4b and Kip2.
As Gata6 is considered to be a master regulator for primitiveendoderm formation [21], the repression of Gata6 by Nanog
Figure 2. Staining and isolation of Nanoghigh and low expressing cells using fluores-cein di-�-D-galactopyranoside. (A): FDGstaining of Nanog �-geo ES cells confirminga heterogeneous expression pattern forNanog; bar: 100 �m. (B): Fluorescent-acti-vated cell sorting separation of FDG treatedN�G ES cells and RNA expression analysisby reverse transcription-polymerase chainreaction. (C): Gene expression profiling ofFDG sorted Nanog �-geo ES cells fromNanoghigh and Nanoglow populations. Abbre-viations: ECM, extracellular matrix; ES, em-bryonic stem; FDG, fluorescein di-�-D-ga-lactopyranoside; N�G, Nanog �-geo; Prim.Endo., primitive endoderm.
Table 1. Gene expression profile of pluripotency and primitive endoderm genes by microarray analysis
GenBankaccession no. Description
FDG�normalized
FDG�normalized
Ratio���/���
NM_009556 Zinc finger protein 42 (Rex1) 9.54 92.65 9.72a
AF507043 Nanog homeobox 26.99 195.66 7.25a
NM_011443 SRY-box containing gene 2 (Sox2) 4.78 30.14 6.30a
NM_013633 POU domain, class 5, transcription factor 1 (Oct4) 109.79 278.60 2.54a
NM_010258 GATA binding protein 6 11.69 2.71 0.23b
AW557311 GATA binding protein 4 4.91 0.93 0.19b
NM_023118 Disabled homolog 2 (Drosophila) 57.53 4.32 0.08b
aFDG� � 2.0.bFDG� 0.5.Abbreviation: FDG, fluorescein di-�-D-galactopyranoside.
2538 Nanog Heterogeneity in ES Cells
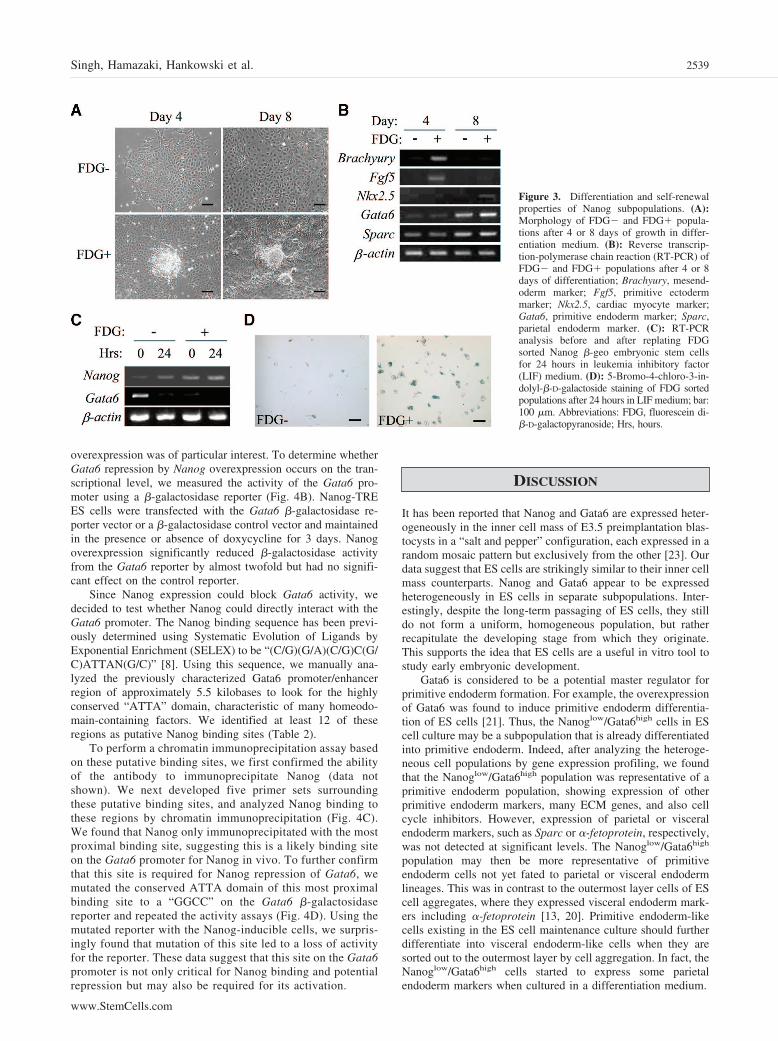
overexpression was of particular interest. To determine whetherGata6 repression by Nanog overexpression occurs on the tran-scriptional level, we measured the activity of the Gata6 pro-moter using a �-galactosidase reporter (Fig. 4B). Nanog-TREES cells were transfected with the Gata6 �-galactosidase re-porter vector or a �-galactosidase control vector and maintainedin the presence or absence of doxycycline for 3 days. Nanogoverexpression significantly reduced �-galactosidase activityfrom the Gata6 reporter by almost twofold but had no signifi-cant effect on the control reporter.
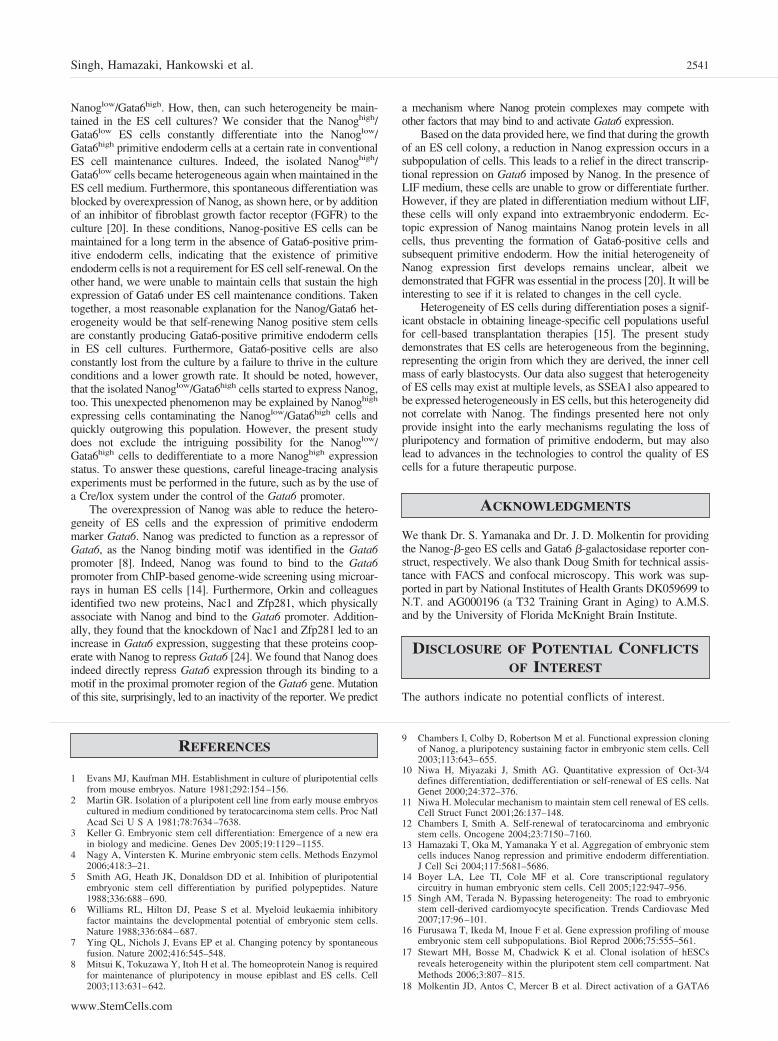
Since Nanog expression could block Gata6 activity, wedecided to test whether Nanog could directly interact with theGata6 promoter. The Nanog binding sequence has been previ-ously determined using Systematic Evolution of Ligands byExponential Enrichment (SELEX) to be “(C/G)(G/A)(C/G)C(G/C)ATTAN(G/C)” [8]. Using this sequence, we manually ana-lyzed the previously characterized Gata6 promoter/enhancerregion of approximately 5.5 kilobases to look for the highlyconserved “ATTA” domain, characteristic of many homeodo-main-containing factors. We identified at least 12 of theseregions as putative Nanog binding sites (Table 2).
To perform a chromatin immunoprecipitation assay basedon these putative binding sites, we first confirmed the abilityof the antibody to immunoprecipitate Nanog (data notshown). We next developed five primer sets surroundingthese putative binding sites, and analyzed Nanog binding tothese regions by chromatin immunoprecipitation (Fig. 4C).We found that Nanog only immunoprecipitated with the mostproximal binding site, suggesting this is a likely binding siteon the Gata6 promoter for Nanog in vivo. To further confirmthat this site is required for Nanog repression of Gata6, wemutated the conserved ATTA domain of this most proximalbinding site to a “GGCC” on the Gata6 �-galactosidasereporter and repeated the activity assays (Fig. 4D). Using themutated reporter with the Nanog-inducible cells, we surpris-ingly found that mutation of this site led to a loss of activityfor the reporter. These data suggest that this site on the Gata6promoter is not only critical for Nanog binding and potentialrepression but may also be required for its activation.
DISCUSSION
It has been reported that Nanog and Gata6 are expressed heter-ogeneously in the inner cell mass of E3.5 preimplantation blas-tocysts in a “salt and pepper” configuration, each expressed in arandom mosaic pattern but exclusively from the other [23]. Ourdata suggest that ES cells are strikingly similar to their inner cellmass counterparts. Nanog and Gata6 appear to be expressedheterogeneously in ES cells in separate subpopulations. Inter-estingly, despite the long-term passaging of ES cells, they stilldo not form a uniform, homogeneous population, but ratherrecapitulate the developing stage from which they originate.This supports the idea that ES cells are a useful in vitro tool tostudy early embryonic development.
Gata6 is considered to be a potential master regulator forprimitive endoderm formation. For example, the overexpressionof Gata6 was found to induce primitive endoderm differentia-tion of ES cells [21]. Thus, the Nanoglow/Gata6high cells in EScell culture may be a subpopulation that is already differentiatedinto primitive endoderm. Indeed, after analyzing the heteroge-neous cell populations by gene expression profiling, we foundthat the Nanoglow/Gata6high population was representative of aprimitive endoderm population, showing expression of otherprimitive endoderm markers, many ECM genes, and also cellcycle inhibitors. However, expression of parietal or visceralendoderm markers, such as Sparc or �-fetoprotein, respectively,was not detected at significant levels. The Nanoglow/Gata6high
population may then be more representative of primitiveendoderm cells not yet fated to parietal or visceral endodermlineages. This was in contrast to the outermost layer cells of EScell aggregates, where they expressed visceral endoderm mark-ers including �-fetoprotein [13, 20]. Primitive endoderm-likecells existing in the ES cell maintenance culture should furtherdifferentiate into visceral endoderm-like cells when they aresorted out to the outermost layer by cell aggregation. In fact, theNanoglow/Gata6high cells started to express some parietalendoderm markers when cultured in a differentiation medium.
Figure 3. Differentiation and self-renewalproperties of Nanog subpopulations. (A):Morphology of FDG� and FDG� popula-tions after 4 or 8 days of growth in differ-entiation medium. (B): Reverse transcrip-tion-polymerase chain reaction (RT-PCR) ofFDG� and FDG� populations after 4 or 8days of differentiation; Brachyury, mesend-oderm marker; Fgf5, primitive ectodermmarker; Nkx2.5, cardiac myocyte marker;Gata6, primitive endoderm marker; Sparc,parietal endoderm marker. (C): RT-PCRanalysis before and after replating FDGsorted Nanog �-geo embryonic stem cellsfor 24 hours in leukemia inhibitory factor(LIF) medium. (D): 5-Bromo-4-chloro-3-in-dolyl-�-D-galactoside staining of FDG sortedpopulations after 24 hours in LIF medium; bar:100 �m. Abbreviations: FDG, fluorescein di-�-D-galactopyranoside; Hrs, hours.
2539Singh, Hamazaki, Hankowski et al.
www.StemCells.com
On the other hand, the Nanoghigh/Gata6low population, likelyrepresenting the “true” stem cell population capable of self-re-newal, maintained high expression of pluripotency markers, cellcycle genes, and genes important for mitochondrial functioning.We could imagine that those cells undergoing higher levels ofproliferation and cell division may require increased mitochondrialrespiration and have higher energy demands. Furthermore, the
Nanoghigh/Gata6low cells were also capable of multilineage differ-entiation, whereas the Nanoglow/Gata6high cells seemed to onlyform extraembryonic endoderm, again suggesting the Nanoghigh/Gata6low cells to be the stem cell population.
As shown in Figure 3D and also supported by a differentialexpression profile in cell cycle regulatory genes, the Nanoghigh/Gata6low population appears to proliferate much faster than the
Figure 4. Nanog reduces heterogeneity andrepresses Gata6. (A): RNA expression anal-ysis of parental (TopES) and Nanog induc-ible (Nanog-TRE) cells with or without theaddition of doxycycline. Markers used forpluripotency, Oct4 and Nanog (total Nanog,endogenous Nanog, and ectopically ex-pressed Nanog) [20]; extraembryonicendoderm, Gata4, Gata6, and Dab2; extra-cellular matrix, Fibrillin1, Fibronectin, andLaminin �1; and cell cycle inhibitors, p15/Ink4b and p57/Kip2; �-actin was used as aloading control. (B): �-Galactosidase activ-ity assays with transfections of a Gata6�-galactosidase reporter or a control EF2�-galactosidase reporter into Nanog-TREembryonic stem cells in the presence or ab-sence of doxycycline; � p .05. (C): Chro-matin immunoprecipitation with various an-tibodies, including Nanog, using primer setsfrom five independent regions of the Gata6promoter containing one or more putativeNanog binding sites. (D): Site directed mu-tagenesis of the putative Nanog binding sitedetermined by chromatin immunoprecipita-tion in the Gata6 �-galactosidase reporterand subsequent �-galactosidase activity as-says in the Nanog-TRE cell line; � p .05.Abbreviations: �-gal, �-galactosidase; Dox,doxycycline; Mut, mutated.
Table 2. Potential Nanog binding sites in the 5.5-kilobase Gata6 promoter
Number SequenceMatch toconsensus
Location fromtranscriptional
start siteGata6
primers (set)Amplicon size(base pairs)
1 GGATG ATTA TG 8/10 �255:�245 1 1792 GAGAC ATTA TT 8/10 �1978:�1977 2 1693 ATTTT ATTA GC 5/10 �2027:�2017 2 1694 CATTT ATTA TT 5/10 �2035:�2025 2 1695 GTAAA ATTA TG 6/10 �2356:�2346 3 3066 TTTAC ATTA AC 6/10 �2528:�2518 3 3067 AACAA ATTA GA 6/10 �2589:�2579 3 3068 TGTTT ATTA AC 6/10 �3300:�3290 4 3079 TGAAC ATTA AG 8/10 �3368:�3358 4 30710 GGAAA ATTA GG 7/10 �3548:�3538 4 30711 GGTGC ATTA GC 8/10 �3843:�3833 5 25112 CATAC ATTA AG 8/10 �4030:�4020 5 251
Potential Nanog binding sites are identified from the Nanog consensus binding sequence, (C/G)(G/A)(C/G)C(G/C)ATTAN(G/C), determinedby Systematic Evolution of Ligands by Exponential Enrichment.
2540 Nanog Heterogeneity in ES Cells
Nanoglow/Gata6high. How, then, can such heterogeneity be main-tained in the ES cell cultures? We consider that the Nanoghigh/Gata6low ES cells constantly differentiate into the Nanoglow/Gata6high primitive endoderm cells at a certain rate in conventionalES cell maintenance cultures. Indeed, the isolated Nanoghigh/Gata6low cells became heterogeneous again when maintained in theES cell medium. Furthermore, this spontaneous differentiation wasblocked by overexpression of Nanog, as shown here, or by additionof an inhibitor of fibroblast growth factor receptor (FGFR) to theculture [20]. In these conditions, Nanog-positive ES cells can bemaintained for a long term in the absence of Gata6-positive prim-itive endoderm cells, indicating that the existence of primitiveendoderm cells is not a requirement for ES cell self-renewal. On theother hand, we were unable to maintain cells that sustain the highexpression of Gata6 under ES cell maintenance conditions. Takentogether, a most reasonable explanation for the Nanog/Gata6 het-erogeneity would be that self-renewing Nanog positive stem cellsare constantly producing Gata6-positive primitive endoderm cellsin ES cell cultures. Furthermore, Gata6-positive cells are alsoconstantly lost from the culture by a failure to thrive in the cultureconditions and a lower growth rate. It should be noted, however,that the isolated Nanoglow/Gata6high cells started to express Nanog,too. This unexpected phenomenon may be explained by Nanoghigh
expressing cells contaminating the Nanoglow/Gata6high cells andquickly outgrowing this population. However, the present studydoes not exclude the intriguing possibility for the Nanoglow/Gata6high cells to dedifferentiate to a more Nanoghigh expressionstatus. To answer these questions, careful lineage-tracing analysisexperiments must be performed in the future, such as by the use ofa Cre/lox system under the control of the Gata6 promoter.
The overexpression of Nanog was able to reduce the hetero-geneity of ES cells and the expression of primitive endodermmarker Gata6. Nanog was predicted to function as a repressor ofGata6, as the Nanog binding motif was identified in the Gata6promoter [8]. Indeed, Nanog was found to bind to the Gata6promoter from ChIP-based genome-wide screening using microar-rays in human ES cells [14]. Furthermore, Orkin and colleaguesidentified two new proteins, Nac1 and Zfp281, which physicallyassociate with Nanog and bind to the Gata6 promoter. Addition-ally, they found that the knockdown of Nac1 and Zfp281 led to anincrease in Gata6 expression, suggesting that these proteins coop-erate with Nanog to repress Gata6 [24]. We found that Nanog doesindeed directly repress Gata6 expression through its binding to amotif in the proximal promoter region of the Gata6 gene. Mutationof this site, surprisingly, led to an inactivity of the reporter. We predict
a mechanism where Nanog protein complexes may compete withother factors that may bind to and activate Gata6 expression.
Based on the data provided here, we find that during the growthof an ES cell colony, a reduction in Nanog expression occurs in asubpopulation of cells. This leads to a relief in the direct transcrip-tional repression on Gata6 imposed by Nanog. In the presence ofLIF medium, these cells are unable to grow or differentiate further.However, if they are plated in differentiation medium without LIF,these cells will only expand into extraembryonic endoderm. Ec-topic expression of Nanog maintains Nanog protein levels in allcells, thus preventing the formation of Gata6-positive cells andsubsequent primitive endoderm. How the initial heterogeneity ofNanog expression first develops remains unclear, albeit wedemonstrated that FGFR was essential in the process [20]. It will beinteresting to see if it is related to changes in the cell cycle.
Heterogeneity of ES cells during differentiation poses a signif-icant obstacle in obtaining lineage-specific cell populations usefulfor cell-based transplantation therapies [15]. The present studydemonstrates that ES cells are heterogeneous from the beginning,representing the origin from which they are derived, the inner cellmass of early blastocysts. Our data also suggest that heterogeneityof ES cells may exist at multiple levels, as SSEA1 also appeared tobe expressed heterogeneously in ES cells, but this heterogeneity didnot correlate with Nanog. The findings presented here not onlyprovide insight into the early mechanisms regulating the loss ofpluripotency and formation of primitive endoderm, but may alsolead to advances in the technologies to control the quality of EScells for a future therapeutic purpose.
ACKNOWLEDGMENTS
We thank Dr. S. Yamanaka and Dr. J. D. Molkentin for providingthe Nanog-�-geo ES cells and Gata6 �-galactosidase reporter con-struct, respectively. We also thank Doug Smith for technical assis-tance with FACS and confocal microscopy. This work was sup-ported in part by National Institutes of Health Grants DK059699 toN.T. and AG000196 (a T32 Training Grant in Aging) to A.M.S.and by the University of Florida McKnight Brain Institute.
DISCLOSURE OF POTENTIAL CONFLICTS
OF INTEREST
The authors indicate no potential conflicts of interest.
REFERENCES
1 Evans MJ, Kaufman MH. Establishment in culture of pluripotential cellsfrom mouse embryos. Nature 1981;292:154–156.
2 Martin GR. Isolation of a pluripotent cell line from early mouse embryoscultured in medium conditioned by teratocarcinoma stem cells. Proc NatlAcad Sci U S A 1981;78:7634–7638.
3 Keller G. Embryonic stem cell differentiation: Emergence of a new erain biology and medicine. Genes Dev 2005;19:1129–1155.
4 Nagy A, Vintersten K. Murine embryonic stem cells. Methods Enzymol2006;418:3–21.
5 Smith AG, Heath JK, Donaldson DD et al. Inhibition of pluripotentialembryonic stem cell differentiation by purified polypeptides. Nature1988;336:688–690.
6 Williams RL, Hilton DJ, Pease S et al. Myeloid leukaemia inhibitoryfactor maintains the developmental potential of embryonic stem cells.Nature 1988;336:684–687.
7 Ying QL, Nichols J, Evans EP et al. Changing potency by spontaneousfusion. Nature 2002;416:545–548.
8 Mitsui K, Tokuzawa Y, Itoh H et al. The homeoprotein Nanog is requiredfor maintenance of pluripotency in mouse epiblast and ES cells. Cell2003;113:631–642.
9 Chambers I, Colby D, Robertson M et al. Functional expression cloningof Nanog, a pluripotency sustaining factor in embryonic stem cells. Cell2003;113:643–655.
10 Niwa H, Miyazaki J, Smith AG. Quantitative expression of Oct-3/4defines differentiation, dedifferentiation or self-renewal of ES cells. NatGenet 2000;24:372–376.
11 Niwa H. Molecular mechanism to maintain stem cell renewal of ES cells.Cell Struct Funct 2001;26:137–148.
12 Chambers I, Smith A. Self-renewal of teratocarcinoma and embryonicstem cells. Oncogene 2004;23:7150–7160.
13 Hamazaki T, Oka M, Yamanaka Y et al. Aggregation of embryonic stemcells induces Nanog repression and primitive endoderm differentiation.J Cell Sci 2004;117:5681–5686.
14 Boyer LA, Lee TI, Cole MF et al. Core transcriptional regulatorycircuitry in human embryonic stem cells. Cell 2005;122:947–956.
15 Singh AM, Terada N. Bypassing heterogeneity: The road to embryonicstem cell-derived cardiomyocyte specification. Trends Cardiovasc Med2007;17:96–101.
16 Furusawa T, Ikeda M, Inoue F et al. Gene expression profiling of mouseembryonic stem cell subpopulations. Biol Reprod 2006;75:555–561.
17 Stewart MH, Bosse M, Chadwick K et al. Clonal isolation of hESCsreveals heterogeneity within the pluripotent stem cell compartment. NatMethods 2006;3:807–815.
18 Molkentin JD, Antos C, Mercer B et al. Direct activation of a GATA6
2541Singh, Hamazaki, Hankowski et al.
www.StemCells.com
cardiac enhancer by Nkx2.5: Evidence for a reinforcing regulatory net-work of Nkx2.5 and GATA transcription factors in the developing heart.Dev Biol 2000;217:301–309.
19 Angelotti TP, Uhler MD, Macdonald RL. Assembly of GABAAreceptor subunits: Analysis of transient single-cell expression utiliz-ing a fluorescent substrate/marker gene technique. J Neurosci 1993;13:1418 –1428.
20 Hamazaki T, Kehoe SM, Nakano T et al. The Grb2/Mek pathwayrepresses Nanog in murine embryonic stem cells. Mol Cell Biol 2006;26:7539–7549.
21 Fujikura J, Yamato E, Yonemura S et al. Differentiation of embry-
onic stem cells is induced by GATA factors. Genes Dev 2002;16:784 –789.
22 Cui L, Johkura K, Yue F et al. Spatial distribution and initial changes ofSSEA1 and other cell adhesion-related molecules on mouse embryonicstem cells before and during differentiation. J Histochem Cytochem2004;52:1447–1457.
23 Chazaud C, Yamanaka Y, Pawson T et al. Early lineage segregationbetween epiblast and primitive endoderm in mouse blastocysts throughthe Grb2-MAPK pathway. Dev Cell 2006;10:615–624.
24 Wang J, Rao S, Chu J et al. A protein interaction network for pluripo-tency of embryonic stem cells. Nature 2006;444:364–368.
See www.StemCells.com for supplemental material available online.
2542 Nanog Heterogeneity in ES Cells