Sensory and behavioural responses of the malaria mosquito ...

A geographical sampling method for surveys of mosquito larvaein an urban area using high-resolution satellite imagery
Adriana Troyo1,2, Douglas O. Fuller3, Olger Calderón-Arguedas2, and John C. Beier1,4
1Global Public Health Program, Department of Epidemiology and Public Health, University of Miami, 12500SW 152 St. Building A, Miami, FL 33177, U.S.A.
2Centro de Investigación en Enfermedades Tropicales, Departamento de Parasitología, Facultad deMicrobiología, Universidad de Costa Rica, San José, Costa Rica
3Department of Geography and Regional Studies, University of Miami, Miami, FL 33146, U.S.A.
4Abess Center for Ecosystem Science and Policy, University of Miami, Miami, FL 33146, U.S.A.
AbstractEntomological surveys in urban areas are often biased by selecting houses or locations with knownhigh vector densities. A sampling strategy was developed for Puntarenas, Costa Rica, using high-resolution satellite imagery. Grids from the Advanced Spaceborne Thermal Emission and ReflectionRadiometer and a QuickBird classified land cover map were used to determine the optimal final gridarea for surveys. A random sample (10% of cells) was selected, and sample suitability was assessedby comparing the mean percentage of tree cover between sample and total cells. Sample cells wereused obtain entomological data from 581 locations: 26.3% of all locations positive for mosquitolarvae were not households, they contained 29.5% of mosquito-positive habitats and 16% of Aedesaegypti pupae collected. Entomological indices for Ae. aegypti (pupae per person, Breteau index,container index, location index) were slightly lower when only household data were analyzed. High-resolution satellite imagery and geographical information systems appear useful for evaluating urbansites and randomly selecting locations for accurate entomological surveys.
KeywordsRemote sensing; urban environment; mosquitoes; Aedes aegypti; Costa Rica
INTRODUCTIONField evaluations for studying the epidemiology of mosquito-borne diseases in urban areas arecommonly performed in locations where densities of mosquitoes and their habitats are knownto be high. In addition, surveys are often restricted to sampling of households and buildingsduring surveys (Morrison et al. 2004, Chadee 2003). In Aedes aegypti surveillance, houses areusually sampled during pupal/demographic surveys, and houses are a main component of twotraditional larval indices: House (or Premises) index (HI) and Breteau index (BI) (Focks andChadee 1997, Focks 2003, Chadee 2004). In all cases, the resulting sampling frame mayexclude locations within the complex urban environment such as streets, public buildings,parks, and schools that may provide valuable information about mosquito diversity and typesof larval habitats. Therefore, in the case of diseases that are usually considered “urban” likedengue fever and dengue hemorrhagic fever, productive habitats may be overlooked duringstandard household surveys and bias the results. Sampling strategies for selecting mosquitocollection sites may need to include non-residential locations in field surveys, such as those
NIH Public AccessAuthor ManuscriptJ Vector Ecol. Author manuscript; available in PMC 2008 October 3.
Published in final edited form as:J Vector Ecol. 2008 June ; 33(1): 1–7.
NIH
-PA Author Manuscript
NIH
-PA Author Manuscript
NIH
-PA Author Manuscript
required for studying dengue and other vector-borne diseases of urban environments (Morrisonet al. 2006, Barrera et al. 2006).
Geographical information systems (GIS) and remote sensing offer powerful tools fordescribing, illustrating, explaining, and predicting epidemiological phenomena, which can beused to develop or improve surveillance, prevention, and control strategies (Rogers andRandolph 2003). However, these technologies have been used to study vector-borne diseasesmostly in non-urban areas and at very broad scales (Hay et al. 1997, Hay et al. 2000, Beck etal. 2000, Rogers et al. 2006). Data currently available from sensors like the AdvancedSpaceborne Thermal Emission and Reflection Radiometer (ASTER, 15 m spatial resolution)and QuickBird (0.6 m panchromatic and 2.4 m multispectral spatial resolution) are useful forstudying factors that affect diseases within the heterogeneous urban environment. In this report,a sampling strategy is described for the Great Puntarenas area, Costa Rica. This method wasdeveloped for sampling specific mosquito larval habitats using GIS technology and high-resolution satellite imagery from ASTER and QuickBird.
MATERIALS AND METHODSThe study site included ten localities of the Greater Puntarenas area, a city on the Pacific coastof Costa Rica where dengue fever is currently endemic. Puntarenas is the site of denguereintroduction to Costa Rica in 1993 (WHO 1994), and no detailed entomological orgeoreferenced data in the form of GIS layers were available at the beginning of this study.High-resolution satellite images were obtained for the Greater Puntarenas area to develop thesampling strategy. Only two QuickBird scenes from March 2002 (dry season) and October2003 (wet season) were available at very high resolution, each including a different section ofthe study site. Multispectral bands (blue, green, red, and near infrared) and the panchromaticband were obtained. In addition, ASTER imagery was available for those same years. All theGIS operations were performed using Idrisi Kilimanjaro software (J.R. Eastman, ClarkUniversity, Worcester, MA. 2004).
A classified land cover map generated from the mosaicked 2002 and 2003 multispectralQuickBird imagery by using the back propagation artificial neural network (ANN) in IdrisiKilimanjaro was selected for the analyses. Training sites for “water”, “tree”, “grass/bare soil”,“built”, and “paved” classes were developed using polygons digitized from visualinterpretation of the 0.6 m QuickBird panchromatic band. The ANN algorithm produced a landcover classification with an overall accuracy of 80% and Kappa of 0.74, which was moreaccurate than those produced by other classification algorithms evaluated, such as maximumlikelihood. The “built” class had 24% errors of omission and 20% errors of commission, whilethe “tree” class had 7% errors of omission and 10% errors of commission. Most of the GreaterPuntarenas area is limited by natural barriers including open water and mangroves, so changesin land cover classes caused by urbanization from 2002 to 2003 were assumed to be minimal.
The “built” class from the land cover map provided patches of pixels that represented individualhouses and small buildings of Puntarenas. Since ASTER imagery was already available, gridsof different sizes were obtained from it and were used to estimate the mean number of houses/small buildings per cell extracted from the land cover map. According to the mean number ofhouses/small buildings per area, an optimal grid cell area that would be operationally adequatewas estimated at 10 000 m2 (Figure 1). At this cell size, the number of houses per cell wasapproximately normally distributed and contained 13±6 houses (Shapiro-Wilk normality testW=0.976, p=0.738). A smaller cell size would not contain enough houses and would requiretraveling long distances frequently. Therefore, a cell size of 100 by 100 m was considered largeenough for a team of two people to search in half a day (approximately three h at 15 min perhouse). A final grid was created using the multispectral Quickbird imagery, and cells were
Troyo et al. Page 2
J Vector Ecol. Author manuscript; available in PMC 2008 October 3.
NIH
-PA Author Manuscript
NIH
-PA Author Manuscript
NIH
-PA Author Manuscript

grouped according to each of the ten localities of Puntarenas included in the cover map. Thisfinal grid contained cells 42 by 42 pixels (100.8 × 100.8 m), and only the 355 cells that hadmore than 90% of their area within one specific locality of Puntarenas were included in thesampling frame. This would allow a stratified sampling method (below) and guarantee thatevery larval habitat found in a grid cell searched could be considered as belonging to onelocality.
Cells were numbered and a stratified random sample was selected from each locality, whichwas proportional to the total number of cells. Localities in Puntarenas have been geographicallydetermined by the Ministry of Health, and they correspond to proximate groups of houses,where people usually share socioeconomic characteristics, to be serviced by a local healthclinic. The stratified sampling method was performed to ensure at least one sample set of eachof the ten localities, which would improve representativeness of the total sample. The randomsample consisted of 36 cells, approximately 10% of the total 355 cells (Figure 2). This numberof grid cells selected was such that the time taken to collect the field data would not exceedthree weeks, since in this case it would be necessary for the entomological data to be analyzedwithin approximately homogeneous external environmental conditions of each season.
To initially assess the representativeness of the selected sample grid cells, the QuickBird landcover map was used to extract the proportion of tree area (“tree” class Kappa = 0.91) inindividual grid cells, as well as in the total area of the localities. Tree cover was evaluatedbecause larval habitats have been associated to shade and specially vegetation (Barrera et al.2006, Vezzani et al. 2005). For each locality, the mean percentage of tree cover in the selectedsample cells was compared to the mean percentage of tree cover in the total cells and thepercentage of tree cover in the total area of the locality.
The resulting grid with the selected cells was overlaid on the QuickBird panchromatic imagefor identification and visualization of the location and limits of the specific cells. The maximumand minimum coordinates for the selected cells also served to determine their position whilethe teams were in the field with global positioning system (GPS) units. By displaying the cellson the QuickBird panchromatic image, printing the images, and taking them to the field, smallfeatures that served as visual limits for the survey cells like roads, houses, and trees could beidentified (Figure 3).
The first entomological survey that applied the sampling method was performed during thewet season 2006 (July and August). The area within each of the grid cells selected was searchedfor all potential larval habitats, most of which were the traditional “wet containers” (places orobjects that held water for more than one day and seemed able to maintain this condition formore than 48 h). Within the grid cells, numbers were assigned to each “location”, which wasany legally limited section of land that may or may not include a house or building (such asparks, streets and sidewalks, households, lots, churches, construction sites, buildings, parkinglots, and schools). In the cases where the limit of the grid cell fell on the footprint of a houseor building, only the structures on the north and west boundaries of the cell were consideredcompletely (the structures on the south and east boundaries were not evaluated). This methodwould cancel out the additional and missing portions of the properties in the limits of the cell.When there were houses in the grid cells, the number of persons living in the house was noted.
All possible habitats were characterized according to their location (household or non-household and private or public area), type, and size. When present, all pupae and a sample ofthe larvae were collected and processed as had been performed in other areas of Costa Rica(Calderon-Arguedas et al. 2004a, 2004b). The specimens were transported in glass vials with70% ethanol to the Medical Arthropodology Laboratory, University of Costa Rica, where theywere cleared in lactophenol, mounted in Hoyer's medium, and identified. The presence of Ae.
Troyo et al. Page 3
J Vector Ecol. Author manuscript; available in PMC 2008 October 3.
NIH
-PA Author Manuscript
NIH
-PA Author Manuscript
NIH
-PA Author Manuscript

aegypti larvae, as well as the number of Ae. aegypti pupae was specially noted in order todetermine the container index, location index, Breteau location index, pupae per area, andpupae per person. These larval indices are analogous to traditional Container, House (orPremise), and Breteau indices (Focks 2003) but consider all household and non-householdlocations in their calculation:
Container index: Number of habitats positive for Ae. aegypti larvae and/or pupae per 100potential habitats.
Location index: Number of locations positive for Ae. aegypti larvae and/or pupae per 100locations.
Breteau location index: Number of habitats positive for Ae. aegypti larvae and/or pupaeper 100 locations.
RESULTSThe initial assessment of the selected sample grid cells showed representativeness in terms oftree cover for most of the localities. In eight of ten localities the difference between theestimated percentage of tree cover (from sample cells) and the real percentage of tree coverwas less than 3% (Table 1). The proportions of tree cover and built area are being used fordetailed analyses of urban structure and dengue, which will be published elsewhere.
During the wet season survey, a total of 581 locations were searched for mosquito larvalhabitats. The locations included mostly houses, but also many non-household locations suchas empty lots, streets, parks, soccer fields, public schools, churches, offices, and commercialstructures (Table 2). Twenty-six locations that were not categorized as houses harbored one ormore positive containers, which represent 26.3% of all larvae-positive locations. Of 830potential habitats observed, 20.6% were found in non-household locations (9.3% were in publicareas), and 16.7% had mosquito larvae and/or pupae. Of mosquito-positive habitats, 29.5%were not in or around houses, and most of these habitats were observed in empty private lots.Most of the positive habitats (78%) contained immature stages of Ae. aegypti, and the secondmost abundant species was Culex quinquefasciatus (in 15.8% of positive containers). If onlythe houses were searched for mosquito larval habitats, 41 positive habitats would have beenoverlooked (25 containing larvae and/or pupae of Ae. aegypti and a total 85 Ae. aegypti pupae).Table 2 also presents the entomological indices when the total area in the cells is consideredas opposed to only the houses. Results for the complete entomological and house surveys bylocality, container profiles for wet and dry seasons, mosquito diversity, and associations withurban structure in the Greater Puntarenas area will be published elsewhere.
DISCUSSIONThese results support the geographical sampling strategy reported and show that it would yieldslightly different and more exact entomological indices than a traditional household surveyperformed in the same areas. This research shows that in the urban ecosystem of Puntarenas,an important portion of the habitats containing mosquito larvae were not in or around houses.As has been reported previously (Morrison et al. 2006, Mahadev et al. 2004), these locationsshould be considered when studying mosquito ecology or diversity in urban areas, as well asfor directing source reduction activities in dengue prevention and control. As in all studies, themain objective and resources available will determine the best sampling method, althoughcalculating the entomological indices “geographically” would be more accurate than usingonly household surveys for entomological surveillance in most cases. There would be moredetailed information available to direct control strategies, by providing, for example, keymosquito habitats in public areas that are not the direct responsibility of the household ownersand may need to be eliminated by public health officials or the local municipality.
Troyo et al. Page 4
J Vector Ecol. Author manuscript; available in PMC 2008 October 3.
NIH
-PA Author Manuscript
NIH
-PA Author Manuscript
NIH
-PA Author Manuscript

In spite of the cited advantages of this method during research and in areas where recent datais not available, it may not be the most suitable for continuous entomological surveillance. Thismethod required GIS knowledge and high-resolution satellite imagery to determine the optimalcell size using the built structures per area and to accurately detect cell limits in the field. Theoptimal methodology would include imagery that is temporarily accurate, and this depends onhow fast the urban landscape is changing in the study site. Recent satellite imagery can becostly, especially for programs in developing countries (QuickBird imagery cost isapproximately USD $1,300 for the minimum area of 12 km2). Multispectral data from mediumresolution sensors like Landsat and ASTER may provide an alternative that is less expensive,but their resolution does not allow for identification of individual houses, small roads, andbuildings. While both ASTER and QuickBird data were used in this study, QuickBird imagerymay be used to create the grids and calculate houses per area when coarser resolution imageryis not available. In some cases, aerial photography or local vector layers are available at thehouse level, and these can be substituted for the satellite image layer, depending on the finalobjective of the research and surveys. However, if an urban area is not under constant changeand once the optimal cell size has been determined, imagery may be obtained every two orthree years, and this geographical method may be considered more useful for confirmation andquality control than constant surveillance.
In this report, remote sensing and GIS technology provided useful tools to develop a samplingframe for field studies within urban Puntarenas. Although a common approach inentomological studies, sampling areas known to have high mosquito densities may result insignificant selection bias. The sampling methodology applied in Puntarenas builds on thestrategy proposed for sampling malaria vectors (Keating et al. 2003), which used coarserresolution satellite imagery. However, the method presented in this report shows that detailprovided by high-resolution satellite imagery allows more precise calculations of optimal cellsize, as well as useful information for pinpointing specific locations in urban areas and planningoperations previous to the site visit. Although high-resolution satellite imagery and GIS wereused to evaluate urban areas and randomly select sections aimed at obtaining data on mosquitolarval habitats, this method could be applied to sample other interactions and disease systemsin urban and peri-urban environments such as malaria, lymphatic filariasis, Chagas disease,and leishmaniasis. Although no entomological data was available in Puntarenas, it is possiblethat the selection of the cells and cell size would vary if information on vector densities, larvalindices, and disease incidence is available, even though the main geographical method andprinciple will still be applicable. These strategies would reduce bias and provide informationfrom the field that is both practical to obtain and representative. By selecting a geographicalapproach to sampling in urban environments that guarantees inclusion of all vector habitats,significant improvements could be made to strategies for prevention and control of vector-borne diseases.
AcknowledgmentsWe thank Joseph Keating for his comments on the manuscript; Mayra E. Solano and Adrián Avendaño for their helpfulsuggestions and efforts during the sampling and field surveys; and Lissette Retana, Nelson Mena, Iván Coronado, andChristian Fonseca for their extensive efforts in performing the field surveys.
This research was supported by Grant Number P20 RR020770 from the National Center for Research Resources(NCRR), a component of the National Institutes of Health (NIH), and its contents are solely the responsibility of theauthors and do not necessarily represent the official view of NCRR or NIH. AT and OC were also supported by theUniversity of Costa Rica and project VI-803-A6-401, and JCB by the Abess Center for Ecosystem Science and Policy,University of Miami.
Troyo et al. Page 5
J Vector Ecol. Author manuscript; available in PMC 2008 October 3.
NIH
-PA Author Manuscript
NIH
-PA Author Manuscript
NIH
-PA Author Manuscript

REFERENCES CITEDBarrera R, Amador M, Clark GC. Use of the pupal survey technique for measuring Aedes aegypti (Diptera:
Culicidae) productivity in Puerto Rico. Am. J. Trop. Med. Hyg 2006;74:290–302. [PubMed:16474086]
Beck LR, Lobitz BM, Wood BL. Remote sensing and human health: new sensors and new opportunities.Emerg. Infect. Dis 2000;6:217–226. [PubMed: 10827111]
Calderón-Arguedas O, Troyo A, Solano ME. Diversidad larval de mosquitos (Diptera: Culicidae) encontenedores artificiales procedentes de una comunidad urbana de San José, Costa Rica. Parasitol.Latinoam 2004a;59:132–136.
Calderón-Arguedas O, Troyo A, Solano ME. Caracterizacion de los sitios de multiplicacion de Aedesaegypti (Diptera: Culicidae) en el caserio “La Carpio”, San Jose, Costa Rica durante la estacion secadel año 2003. Rev. Biomed 2004b;15:73–79.
Chadee DD. Surveillance for the dengue vector Aedes aegypti in Tobago, West Indies. J. Am. Mosq.Contr. Assoc 2003;19:199–205.
Chadee DD. Key premises, a guide to Aedes aegypti (Diptera: Culicidae) surveillance and control. B.Entomol. Res 2004;94:201–207.
Focks DA, Chadee DD. Pupal survey: An epidemiologically significant surveillance method for Aedesaegypti: an example using data from Trinidad. Am. J. Trop. Med. Hyg 1997;56:159–167. [PubMed:9080874]
Focks, DA. A review of entomological sampling methods and indicators for dengue vectors. World HealthOrganization; Geneva: 2003. Document WHO/TDR/IDE/Den/03.1
Hay SI, Packer MJ, Rogers DJ. The impact of remote sensing on the study and control of invertebrateintermediate hosts and vectors for disease. Int. J. Remote Sensing 1997;18:2899–2930.
Hay SI, Omumbo JA, Craig MH, Snow RW. Earth observation, geographic information systems andPlasmodium falciparum malaria in sub-Saharan Africa. Adv. Parasitol 2000;47:173–215. [PubMed:10997207]
Keating J, Macintyre K, Mbogo C, Githeko A, Regens JL, Swalm C, Ndenga B, Steinberg LJ, Kibe L,Githure JI, Beier JC. A geographic sampling strategy for studying relationships between humanactivity and malaria vectors in urban Africa. Am. J. Trop. Med. Hyg 2003;68:357–365. [PubMed:12685645]
Mahadev PVM, Fulmali PV, Mishra AC. A preliminary study of multilevel geographic distribution andprevalence of Aedes aegypti (Diptera: Culicidae) in the state of Goa, India. Indian J. Med. Res2004;120:173–182. [PubMed: 15489555]
Morrison AC, Gray K, Getis A, Astete H, Sihuincha M, Focks D, Watts D, Stancil JD, Olson JG, BlairP, Scott TW. Temporal and geographical patterns of Aedes aegypti (Diptera: Culicidae) productionin Iquitos. Peru. J. Med. Entomol 2004;41:1123–1142.
Morrison AC, Sihuincha M, Stancil JD, Zamora E, Astete H, Olson JG, Vidal-Ore C, Scott TW. Aedesaegypti (Diptera:Culicidae) production from non-residential sites in the Amazonian city of Iquitos.Peru. Ann. Trop. Med. Parasitol 2006;100(Suppl 1):73–86.
Rogers DJ, Randolph SE. Studying the global distribution of infectious diseases using GIS and RS. NatureRev. Microbiol 2003;1:231–237. [PubMed: 15035027]
Rogers DJ, Wilson AJ, Hay SI, Graham AJ. The global distribution of yellow fever and dengue. Adv.Parasitol 2006;62:181–220. [PubMed: 16647971]
Vezzani D, Rubio A, Velazquez SM, Schweigmann N, Wiegand T. Detailed assessment of microhabitatsuitability for Aedes aegypti (Diptera: Culicidae) in Buenos Aires, Argentina. Acta Trop2005;95:123–131. [PubMed: 15993832]
World Health Organization. Outbreak of classic dengue, Costa Rica. Wkly. Epidemiol. Rec 1994;69:85–86. [PubMed: 8003402]
Troyo et al. Page 6
J Vector Ecol. Author manuscript; available in PMC 2008 October 3.
NIH
-PA Author Manuscript
NIH
-PA Author Manuscript
NIH
-PA Author Manuscript

Figure 1.Grid cell sizes from ASTER and mean house numbers estimated from QuickBird forPuntarenas, Costa Rica.
Troyo et al. Page 7
J Vector Ecol. Author manuscript; available in PMC 2008 October 3.
NIH
-PA Author Manuscript
NIH
-PA Author Manuscript
NIH
-PA Author Manuscript
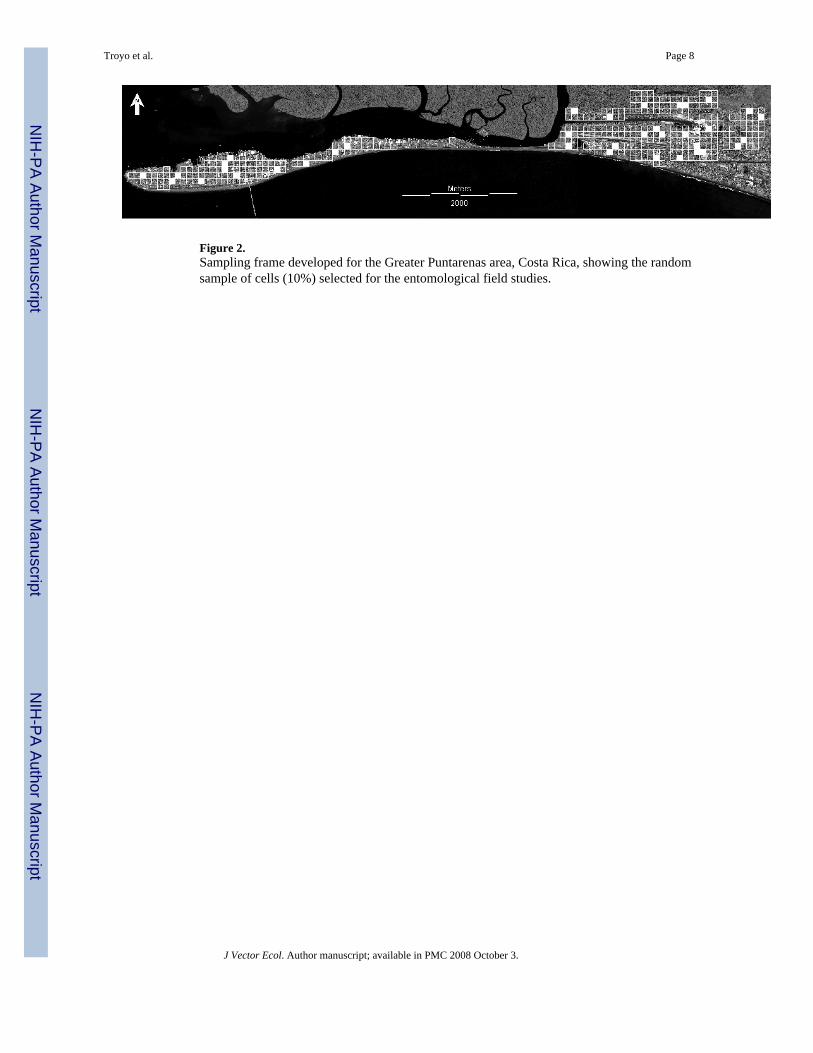
Figure 2.Sampling frame developed for the Greater Puntarenas area, Costa Rica, showing the randomsample of cells (10%) selected for the entomological field studies.
Troyo et al. Page 8
J Vector Ecol. Author manuscript; available in PMC 2008 October 3.
NIH
-PA Author Manuscript
NIH
-PA Author Manuscript
NIH
-PA Author Manuscript

Figure 3.Sampled cell from Puntarenas (100.8 by 100.8 m), displaying the detailed structures of the areato be analyzed in the background QuickBird panchromatic image (60 cm spatial resolution).
Troyo et al. Page 9
J Vector Ecol. Author manuscript; available in PMC 2008 October 3.
NIH
-PA Author Manuscript
NIH
-PA Author Manuscript
NIH
-PA Author Manuscript

NIH
-PA Author Manuscript
NIH
-PA Author Manuscript
NIH
-PA Author Manuscript
Troyo et al. Page 10Ta
ble
1C
ompa
rison
of t
he a
vera
ge tr
ee c
over
ext
ract
ed fr
om sa
mpl
e ce
lls a
nd th
e to
tal c
ells
in th
e lo
calit
ies o
f Pun
tare
nas,
Cos
ta R
ica.
Loc
ality
% tr
eeof
tota
l are
a%
tree
mea
n of
tota
l cel
ls%
tree
mea
n of
sam
ple
Stan
dard
Err
or*
Diff
eren
ce†
Bar
rio E
l Car
men
22.6
225
.15
22.1
55.
51−3
.00
El C
entro
15.3
616
.35
17.7
53.
841.
40El
Coc
al18
.82
19.0
729
.74
5.80
10.6
7V
eint
e de
Nov
iem
bre
41.4
640
.60
49.3
18.
058.
71C
haca
rita
26.5
120
.82
18.8
45.
96−1
.98
Fray
Cas
iano
41.8
238
.28
38.5
54.
770.
27Sa
n Lu
is50
.53
48.0
947
.85
9.54
−0.2
4C
arriz
al40
.37
41.3
842
.48
9.58
1.10
El H
uerto
54.8
254
.38
56.7
519
.61
2.37
Lind
a V
ista
54.3
650
.21
48.4
712
.46
−1.7
4To
tal a
rea
33.6
032
.97
35.0
83.
202.
11
* Stan
dard
err
or c
orre
cted
for f
inite
pop
ulat
ions
: [po
pula
tion
stan
dard
dev
iatio
n / n
½] [
(tota
l cel
ls-n
)/(to
tal c
ells
-1)]
½
† Diff
eren
ce =
% tr
ee m
ean
sam
ple −
% tr
ee m
ean
tota
l cel
ls.
J Vector Ecol. Author manuscript; available in PMC 2008 October 3.

NIH
-PA Author Manuscript
NIH
-PA Author Manuscript
NIH
-PA Author Manuscript
Troyo et al. Page 11Ta
ble
2En
tom
olog
ical
obs
erva
tions
for h
ouse
hold
s, no
n-ho
useh
old
loca
tions
, and
tota
l are
a of
the
sam
ple
cells
sur
veye
d in
Pun
tare
nas,
Cos
taR
ica.
Non
-hou
seho
ld lo
catio
ns (%
)H
ouse
hold
s (%
)Pr
ivat
ePu
blic
Tot
alT
otal
(%)*
No.
loca
tions
eva
luat
ed46
3 (7
9.7)
80 (1
3.8)
38 (6
.5)
118
(20.
3)58
1 (1
00)
No.
loca
tions
with
larv
ae-p
ositi
veha
bita
ts73
(73.
7)16
(16.
2)10
(10.
1)26
(26.
3)99
(100
)
No.
pot
entia
l lar
val h
abita
ts65
9 (7
9.4)
94 (1
1.3)
77 (9
.3)
171
(20.
6)83
0 (1
00)
No.
larv
ae-p
ositi
ve h
abita
ts98
(70.
5)28
(20.
1)13
(9.4
)41
(29.
5)13
9 (1
00)
No.
Ae.
aeg
ypti
pupa
e44
5 (8
4.0)
36 (6
.8)
49 (9
.2)
85 (1
6.0)
530
(100
)Ae
. aeg
ypti
pupa
e pe
r per
son
0.3
--
-0.
4C
onta
iner
Inde
x12
.7-
-14
.613
.1Lo
catio
n In
dex
14.0
--
14.4
14.1
Bre
teau
Loc
atio
n In
dex
18.1
--
21.1
18.8
* Hou
seho
lds +
tota
l non
-hou
seho
ld lo
catio
ns.
J Vector Ecol. Author manuscript; available in PMC 2008 October 3.
Copyright © 2022 FDOKUMEN