opium addiction and english literature - Cambridge University ...
Upload
independentCategory
view
1download
0
A gene expression signature associated with “K-Ras addiction”reveals regulators of EMT and tumor cell survival
Anurag Singh1, Patricia Greninger1, Daniel Rhodes2, Louise Koopman3, Sheila Violette4,Nabeel Bardeesy1, and Jeff Settleman1,*1 Massachusetts General Hospital Cancer Center and Harvard Medical School, 149 13th Street,Charlestown, MA 02129, USA2 Department of Pathology and Department of Bioinformatics, University of Michigan MedicalSchool, Ann Arbor, MI 48109, USA3 Department of Discovery Oncology, Biogen Idec, Cambridge, MA 021424 Stromedix Inc., One Canal Park, Suite 1120, Cambridge MA 02141
AbstractSUMMARY—K-Ras mutations occur frequently in epithelial cancers. Using shRNAs to deplete K-Ras in lung and pancreatic cancer cell lines harboring K-Ras mutations, two classes were identified—lines that do or do not require K-Ras to maintain viability. Comparing these two classes of cancercells revealed a gene expression signature in K-Ras-dependent cells, associated with a well-differentiated epithelial phenotype, which was also seen in primary tumors. Several of these genesencode pharmacologically tractable proteins, such as Syk and Ron kinases and integrin beta6,depletion of which induces epithelial-mesenchymal transformation (EMT) and apoptosis specificallyin K-Ras-dependent cells. These findings indicate that epithelial differentiation and tumor cellviability are associated, and that EMT regulators in “K-Ras-addicted” cancers represent candidatetherapeutic targets.
SIGNIFICANCE—K-Ras is the most frequently mutated oncogene in solid tumors and whenaberrantly activated, is a potent tumor initiator. However, the identification of the critical effectorsof K-Ras-mediated tumorigenesis and the development of clinically effective therapeutic strategiesin this setting remain challenging. We have found that cancer cell lines harboring K-Ras mutationscan be broadly classified into K-Ras-dependent and K-Ras-independent groups. By establishing agene expression signature that can distinguish these two groups, we identified genes that arespecifically up-regulated in K-Ras-dependent cells and are required for their viability. Therefore, theK-Ras dependency signature has revealed several potential therapeutic targets in a subset of otherwisepharmacologically intractable human cancers.
INTRODUCTIONK-Ras is mutationally activated in approximately 20 percent of all solid tumors. However, thedevelopment of clinically effective K-Ras-directed cancer therapies has been largely
*Correspondence: Telephone: (617) 724-9556, fax: (617) 726-7808, [email protected] Statement S.V. and L.K. have been or are in the employ of Biogen Idec. S.V. is currently employed by Stromedix Inc. Thesecompanies currently have an anti-integrin αVβ6 monoclonal antibody in clinical development.Publisher's Disclaimer: This is a PDF file of an unedited manuscript that has been accepted for publication. As a service to our customerswe are providing this early version of the manuscript. The manuscript will undergo copyediting, typesetting, and review of the resultingproof before it is published in its final citable form. Please note that during the production process errors may be discovered which couldaffect the content, and all legal disclaimers that apply to the journal pertain.
NIH Public AccessAuthor ManuscriptCancer Cell. Author manuscript; available in PMC 2010 June 2.
Published in final edited form as:Cancer Cell. 2009 June 2; 15(6): 489–500. doi:10.1016/j.ccr.2009.03.022.
NIH
-PA Author Manuscript
NIH
-PA Author Manuscript
NIH
-PA Author Manuscript

unsuccessful and K-Ras mutant cancers remain among the most refractory to availabletreatments (Beer et al., 2002; Cox and Der, 2002; Grutzmann et al., 2004; Iacobuzio-Donahueet al., 2003; Logsdon et al., 2003; Olejniczak et al., 2007; Stearman et al., 2005; Wagner et al.,2007). K-Ras mutations occur most frequently in adenocarcinomas of the lung, pancreas andcolon and mutational activation of K-Ras in these tissues is sufficient to initiate neoplasia inmice (Aguirre et al., 2003; Haigis et al., 2008; Johnson et al., 2001).
The role of oncogenic K-Ras in later stages of neoplastic progression following initiation isstill poorly understood. Oncogene “addiction” is a phenomenon whereby tumors require thesustained expression and activity of a single aberrantly activated gene, despite the accumulationof multiple oncogenic lesions (Weinstein, 2002). Clinically, this is seen in BCR-ABL-expressing chronic myelogenous leukemias (CML) and EGFR mutant non-small cell lungcancer (NSCLC) (Sharma et al., 2007). Such patients, when treated with inhibitors of theseactivated kinases can experience impressive clinical responses, suggesting that these cancersare addicted to or dependent on single oncogenically-activated proteins. Such findings haveprompted widespread efforts to develop additional “rationally-targeted” therapeutics for avariety of malignancies, potentially exploiting other settings in which oncogene addiction isinvolved. However, efforts to develop Ras-directed molecular therapeutics are challenged bythe difficulty in selectively targeting the Ras GTPase with a small molecule. Moreover,numerous identified downstream K-Ras effectors may contribute to its role in oncogenesis(Repasky et al., 2004). Consequently, there remains a pressing need to identifypharmacologically tractable components of K-Ras driven tumorigenesis.
The goal of this study was to stratify a large panel of human cancer cell lines harboring mutantK-Ras on the basis of their requirement for sustained K-Ras function in maintaining viabilityand to define features of these cells that relate to their K-Ras dependency. This analysis wasexpected to establish phenotypic characteristics of “K-Ras addiction”, potentially revealingtherapeutic targets for these largely treatment-refractory cancers.
RESULTSAn RNAi-based assay to quantify K-Ras dependency in human tumor cells
We used RNAi to determine the effects of K-Ras depletion in a panel of human tumor-derivedcell lines. We first identified three different K-Ras-directed shRNA sequences that producevarying degrees of knockdown of K-Ras protein expression. The effects of K-Ras ablation oncell proliferation and viability were initially assessed in two lung cancer-derived cell lines,A549 and H358, which harbor homozygous G12S and heterozygous G12C activating K-Rasmutations, respectively. Upon K-Ras ablation, the growth of A549 cells was not significantlydiminished, whereas H358 cell growth was markedly decreased (Fig. 1A). K-Ras expressionwas substantially reduced following shRNA expression in both cell lines and growthsuppression was correlated with the level of K-Ras protein knockdown in H358 cells (Fig. 1B).Reduced K-Ras expression in A549 cells did not detectably suppress activation of thedownstream Ras effectors, Akt and Erk, whereas in H358 cells, K-Ras levels were wellcorrelated with Erk and Akt activation (Fig. 1B).
To exclude RNAi-associated off-target effects, a “rescue” analysis was performed in whichexogenous HA-tagged K-Ras(12V) was expressed in the K-Ras-dependent H358 cell line. K-Ras protein expression was ablated using two shRNAs (K-RasB and K-RasC) (Fig. 1C). TheK-RasB shRNA ablates expression of both endogenous and exogenously introduced K-Ras,whereas K-RasC specifically ablates endogenous K-Ras. Exogenous K-Ras(12V) expressingcells are significantly growth inhibited by the K-RasB shRNA but are much less affected bythe K-RasC shRNA (Fig. 1C). Moreover, exogenous expression of K-Ras(12V) is sufficientto prevent Caspase-3 and PARP cleavage upon ablation of endogenous K-Ras, indicating a
Singh et al. Page 2
Cancer Cell. Author manuscript; available in PMC 2010 June 2.
NIH
-PA Author Manuscript
NIH
-PA Author Manuscript
NIH
-PA Author Manuscript

block in apoptosis (Fig. 1D). In summary, the growth inhibitory and apoptotic effects seenupon RNAi-mediated K-Ras ablation reflect a specific requirement for K-Ras.
K-Ras dependency varies widely in K-Ras mutant cancer cell linesTo assess K-Ras dependency across a larger panel of K-Ras mutant human cancer cell lines,we established a “Ras Dependency Index” (RDI) to quantify K-Ras-dependency for individualcell lines (see Experimental Procedures). By this analysis, the greater the RDI for a given cellline, the more K-Ras-dependent the line is. RDI values for a panel of lung and pancreaticadenocarcinoma cell lines vary significantly, with two broad groups emerging, those withrelatively high RDI values and those with relatively low values (Fig. 2A).
For further analysis, we chose K-Ras ablation-induced apoptosis as a strict operationaldefinition of “K-Ras addiction” in order to categorize cell lines more rigorously. Notably,previous studies have shown that ablation of mutant K-Ras by RNAi can affect proliferationof some pancreatic cancer cells, but does not necessarily result in apoptotic cell death (Baineset al., 2006; Fleming et al., 2005). Apoptotic responses to K-Ras ablation were assessed bymeasuring cleaved Caspase-3, which has been well correlated with a commitment toprogrammed cell death (Figs. 2B,C). Generally, induction of Caspase-3 cleavage upon K-Rasablation was specifically seen in cell lines demonstrating RDIs greater than 2.0. We thereforedefined this value of 2.0 as the “Dependency Threshold” for subsequent analyses. Thus, overall,the RDI value appears to reflect K-Ras dependency as assessed by Caspase-3 cleavagefollowing K-Ras depletion, and RDI and relative Caspase-3 cleavage values were wellcorrelated for each respective cell line (Fig. S1 – two tailed T-Test; p=0.0008). Based on theexperimentally derived RDI values, cell lines were classified as being either K-Ras-dependent(denoted by asterisks in Fig. 2B and bold type in Fig. 2C) or K-Ras independent. PARPcleavage provided a second indicator of apoptosis and was similarly induced upon K-Rasablation in K-Ras-dependent cell lines but not in K-Ras-independent cell lines (Fig. S2).
In SK-LU-1 and PANC-1 cells, we observed modest Caspase-3 cleavage following K-Rasknockdown using the K-RasA shRNA, but not with B or C, despite K-RasA yielding theweakest efficiency in depleting K-Ras among the three we used. We therefore classified thesetwo cell lines as K-Ras-independent as the effect was probably due to knockdown of unintendedtargets by this shRNA. Knockdown of unintended targets can be a drawback of the RNAiapproach and can complicate the interpretation of results from a small number of samples ora single shRNA. However, our analysis, which involves a large panel of cell lines and multipleshRNAs, permitted a straightforward categorization of cells with respect to the requirementfor K-Ras expression for tumor cell viability.
Molecular and cellular differences between K-Ras-dependent and K-Ras-independent cancercells
To identify molecular features that distinguish K-Ras-dependent and K-Ras-independentcancer cell lines, we initially analyzed whole-genome SNP (single nucleotide polymorphism)array data for common genomic alterations. The vast majority of K-Ras-dependent cell linesexhibited focal K-Ras genomic amplification. Although two of the K-Ras-independent celllines, SK-LU-1 and H23, also demonstrated higher than diploid K-Ras copy numbers, therewas a highly statistically significant correlation (r2 = 0.41; p = 1.68x10⁻⁴) between K-Ras genecopy number and K-Ras-dependency, as measured by the RDI (Fig. 3A). Moreover, K-Rasprotein levels in the K-Ras-dependent cells were well correlated with K-Ras gene amplification(Fig. 3B). Significantly, the two K-Ras-independent cell lines with apparent K-Ras genomicamplification did not demonstrate elevated levels of K-Ras protein. Thus, elevated K-Rasprotein expression is strongly correlated with K-Ras dependency in K-Ras mutant cancer celllines.
Singh et al. Page 3
Cancer Cell. Author manuscript; available in PMC 2010 June 2.
NIH
-PA Author Manuscript
NIH
-PA Author Manuscript
NIH
-PA Author Manuscript

Notably, analysis of the K-Ras effectors Erk and Akt failed to reveal a correlation between K-Ras dependency and the engagement of these signaling pathways (Fig. S3). Similarly, thesensitivity of two NSCLC cell lines, A549 and H358, to pharmacologic inhibition of Mek andPI-3 kinases revealed no correlation between sensitivity to these inhibitors and K-Rasdependency (Fig. S4). However, among K-Ras-independent pancreatic cancer cell lines, therewas a striking hyperactivation of Akt, which was inversely related to expression of the PTENtumor suppressor, a negative regulator of PI-3 kinase/Akt signaling (Fig. S3). Thus, PI-3 kinaseactivation may contribute to loss of K-Ras dependency in a context specific manner.
Epithelial differentiation state is linked to K-Ras dependencyWe noted that many of the K-Ras-dependent cells exhibit a classic epithelial morphology,whereas most K-Ras-independent cells appeared less uniformly epithelial (data not shown).We therefore examined the expression of E-cadherin, a marker of differentiated epithelia inthese cell lines. Strikingly, the majority of K-Ras-independent cell lines expressed little or noE-cadherin, indicative of EMT (Fig. 3B). Furthermore, although E-cadherin is detectable insome K-Ras-independent cell lines, it is mislocalized to punctate intracellular vesicles (Fig.3C). K-Ras-dependent cell lines, in contrast, exhibit prominent cortical E-cadherin expression.Moreover, the expression of vimentin, a mesenchymal marker, is readily detected in K-Ras-independent cell lines but is largely absent in K-Ras-dependent cell lines (Fig. 3C).
To demonstrate a causal relationship between K-Ras dependency and an epithelial phenotype,we tested the possibility that induction of EMT could affect K-Ras dependency. K-Ras-dependent H358 NSCLC cells were treated with TGFβ1, a promoter of EMT, for ten days.Consistent with EMT, the majority of TGFβ1-treated cells lost E-cadherin expression andgained vimentin expression (Fig. 3D). This resultant mesenchymal cell line was designatedH358M. Whereas parental H358 cells undergo Caspase-3 cleavage following K-Ras ablation,indicative of apoptosis, the mesenchymal H358M cells failed to undergo this response (Fig.3E). Moreover, the RDI for H358M cells is significantly lower than that of H358 cells and isbelow the “Dependency Threshold” of 2.0 (Fig. 3F). Thus, H358M cells bear the hallmarks ofK-Ras independency. H358M cells also demonstrate reduced coupling of K-Ras to downstreamsignaling pathways, reminiscent of many de novo K-Ras-independent cell lines (Fig. 3E).Together, these findings support a strong link between epithelial differentiation and K-Ras-dependency for cancer cell survival.
We next sought to determine whether the reverse process of MET in K-Ras-independent cellscould lead to the acquisition of K-Ras dependency. We noted that Zeb1, a transcription factorthat represses E-cadherin expression (Peinado et al., 2007), is expressed specifically in K-Ras-independent cell lines but not in K-Ras-dependent cells (Fig. 4A). As expected, this is inverselycorrelated with E-cadherin expression. Using an shRNA to deplete expression of Zeb1 in twoK-Ras-independent cell lines (A549 and PANC-1), we observed that loss of Zeb1 expressionresults in strong upregulation of E-cadherin (Fig. 4B). Moreover, E-cadherin in these cellsprominently localized at cell-cell junctions (Fig. 4C), as observed in K-Ras-dependent celllines. Notably, the stable cell lines in which Zeb1 had been ablated appeared to beheterogeneous, with subpopulations of cells appearing to retain strong Zeb1 expression. Thesecells did not undergo altered E-cadherin expression or localization and were morphologicallysimilar to the control shRNA-treated cells.
We next tested the possibility that Zeb1 ablation, which results in MET, could reverse K-Rasdependency. We initially noted that K-Ras protein expression was elevated in the Zeb1knockdown cells (Fig. 4D), reminiscent of cells we had previously established as K-Ras-dependent. Following ablation of K-Ras in control shRNA expressing A549 cells, we observedno Caspase-3 cleavage response. However, in Zeb1-depleted A549 cells, ablation of K-Rasresulted in a cell death response (Fig. 4D). We also noted that in Zeb1-depleted A549 and
Singh et al. Page 4
Cancer Cell. Author manuscript; available in PMC 2010 June 2.
NIH
-PA Author Manuscript
NIH
-PA Author Manuscript
NIH
-PA Author Manuscript

PANC-1 cells, there was a marked increase in K-Ras dependency as assessed by the RDIanalysis (Fig. 4E). Together, these observations strongly suggest that the epithelialdifferentiation state of K-Ras mutant cancer cells is associated with dependency on K-Ras tomaintain cell viability.
Establishment of an oncogenic “K-Ras dependency signature”We next attempted to identify a gene expression “signature” associated with K-Ras dependencywith a focus on genes consistently up-regulated in K-Ras-dependent cells, which couldpotentially correspond to therapeutic targets. Using expression data derived from a subset ofcell lines previously tested for K-Ras dependency (the “training set” –Fig. S5), we performeda supervised analysis of differential gene expression between K-Ras-dependent and K-Ras-independent cell lines using the Prediction Analysis of Microarrays (PAM) algorithm(Tibshirani et al., 2002). PAM employs the “nearest shrunken centroid” method to identifygenes that can accurately segregate two known training classes of samples based on cross-validation. In this case, the two classes are K-Ras-dependent and K-Ras-independent cell lines.
The PAM analysis yielded a list of differentially expressed genes ranked according to averageexpression within each class across the panel of tested cell lines (Fig. 5A). Thus, higher-rankinggenes are, on average, more highly expressed in one class versus the other. As expected, geneshighly expressed in K-Ras-dependent cell lines were relatively poorly expressed in K-Ras-independent cell lines, and vice versa. We also performed a gene functional annotation analysisusing the EASE algorithm (Dennis et al., 2003;Hosack et al., 2003) for term enrichment usingthe K-Ras dependency signature genes (Fig. S6). Notably, this analysis demonstratedstatistically significant term enrichment for facets of epithelial cell biology, again reinforcingan association between K-Ras dependency and epithelial differentiation. We also noted thatboth CDH1, which encodes E-cadherin, and TCF8, which encodes Zeb1, were represented inthe signature established by the PAM algorithm (Table S1).
To further explore the biology of K-Ras dependency and to verify the relevance of the cellculture-derived K-Ras dependency signature in human tissues, we employed the OncomineConcepts Map (Table 1). We identified a significant association with genes that are up-regulated by expression of oncogenic Ras in immortalized human mammary epithelial cells(HMEC) (Bild et al., 2006), suggesting that a large component of the K-Ras dependencysignature is comprised of Ras-regulated transcriptional targets (Fig. 5B). Significantly, the K-Ras dependency signature genes are specifically associated with signatures linked to oncogenicRas, but not to other oncogenes such as β-catenin, E2F3, Src, or Myc (Fig. 5C). Notably, theK-Ras dependency signature was also strongly associated with sensitivity to apoptosis-inducing agents APO2L/TRAIL and the BCL-2 inhibitor, ABT-737, as well as to EGFRtyrosine kinase inhibitors (Table 1).
Predictive value of the K-Ras dependency signatureTo test the predictive value of the K-Ras dependency signature, we utilized the facet of thePAM algorithm that classifies unknown samples into either class based on gene expressiondata. Initially, to generate a signature that minimized false discovery rate (FDR) andmisclassification errors, we chose a value for the so-called threshold parameter of 6.0 (Fig.S5). This yielded a list of 46 genes that could be used to segregate the two classes. Using thisthreshold value, the misclassification error rate for the training set was zero (Figure S5).
We then used gene expression datasets for a representative cross-tissue “test set” of 18 K-Ras mutant cancer cell lines to predict the K-Ras dependency of these cell lines (Fig. S7). Toempirically validate these predictions, we performed the K-Ras growth dependency assay,using the K-RasB and C shRNAs, and derived RDI values for these cell lines as described
Singh et al. Page 5
Cancer Cell. Author manuscript; available in PMC 2010 June 2.
NIH
-PA Author Manuscript
NIH
-PA Author Manuscript
NIH
-PA Author Manuscript
previously (Fig. 5D). Of 18 cell lines tested, 15 were classified correctly based on ourpreviously assigned “Dependency Threshold” of 2.0, yielding a misclassification error rate of0.17. A two-tailed Student T-test demonstrated statistical significance of the predictive valueof the K-Ras dependency signature (p=0.009). Additionally, ANOVA calculationsdemonstrated that classifications of K-Ras-independent and K-Ras-dependent cell lines basedon RDI values are non-random (Fig. S1; p = 4.35x10⁻⁸).
To visualize the expression of the K-Ras dependency signature genes across a large panel ofK-Ras mutant cancer cell lines, we broadened the signature by identifying 250 probe sets (TableS1) for differentially expressed genes. We then generated a “heat map” by performing ahierarchical clustering analysis of these probe sets across a large panel of K-Ras mutant celllines (Fig. 5E). The resultant heat map revealed a clear bifurcation of cell lines into two broadclusters, which generally segregate into K-Ras-dependent and K-Ras-independent cell lines,with the three previously misclassified cell lines falling outside their respective cluster. A thirdcluster is apparent upon close inspection to the leftmost extreme of the heat map, with cell linesthat seem to express genes that are associated with both K-Ras-dependency and K-Ras-independency. Together, these results indicate that a gene expression signature associated withdependency on oncogenic K-Ras can predict a state of K-Ras addiction.
Validation of K-Ras dependency genesTo validate the differential gene expression data derived from comparative microarrays, weanalyzed protein or mRNA levels corresponding to a subset of genes that were ranked highlywithin the K-Ras dependency signature. We first analyzed the expression of differentially-expressed genes, SYK, ITGB6 and MST1R, whose protein products, the Syk tyrosine kinase,integrin beta6 subunit, and the RON receptor tyrosine kinase, respectively, correspond topharmacologically tractable targets. Syk, integrin beta6 and RON protein levels were relativelyhigh in both lung and pancreatic cancer K-Ras-dependent cell lines (Fig. 6A). Some K-Ras-independent cell lines expressed Syk, integrin beta6, or RON, but not all three. Notably, severalof the lines used to assess Syk and integrin beta6 expression were not in the training set usedto generate the K-Ras dependency signature. We also examined whether expression of Syk,integrin beta6, and Ron-β are regulated by K-Ras. Ablation of K-Ras in H358 cells using theK-RasB and C shRNAs resulted in reduced Syk and RON-β expression but did not affectintegrin beta6 expression (Fig. 6B), indicating that expression of a subset of K-Ras dependencysignature genes is under the transcriptional or post-transcriptional control of oncogenic K-Ras.
We then investigated the expression of two additional genes in the signature. ANKRD22 is agene with unknown function predicted to encode a 22 kilodalton protein with three tandemankyrin repeat motifs. Since ANKRD22 antibodies are not available, we analyzed its mRNAlevel. As predicted, K-Ras-independent A549 lung and PATU8988T pancreas cells expressedlittle or no ANKRD22 mRNA whereas K-Ras-dependent H358 lung and YAPC pancreas cellsexpressed readily detectable ANKRD22 mRNA (Fig. S8). We also confirmed the elevatedexpression of PROM2, which encodes prominin 2, in K-RAS-dependent cell lines comparedto K-RAS-independent cell lines (Fig. S8).
Together, these findings confirm that the gene expression differences identified by microarrayanalysis are associated with K-Ras dependency.
K-Ras dependency genes are required for epithelial differentiation and cell survivalSince the PAM algorithm ranks genes by average expression across the entire class, wehypothesized that highly ranked genes may play functional roles in the context of K-Rasdependency. Using shRNAs to ablate the expression of MST1R, ITGB6, and SYK genes, weobserved clear differential growth inhibitory effects on K-Ras-dependent cell lines versus K-
Singh et al. Page 6
Cancer Cell. Author manuscript; available in PMC 2010 June 2.
NIH
-PA Author Manuscript
NIH
-PA Author Manuscript
NIH
-PA Author Manuscript
Ras-independent cell lines (Fig. 6C). Moreover, depletion of ITGB6 or SYK resulted in loss ofE-cadherin expression, indicative of EMT, and Caspase-3-associated cell death in K-Ras-dependent H358 NSCLC cells and YAPC PDAC cells, but not in K-Ras-independent A459and SW1990 cells (Fig. 6D). Knockdown of MST1R resulted in EMT and cell death in H358cells but not in the YAPC pancreatic cancer cell line, suggesting that RON may play contextspecific roles in the setting of K-Ras dependency. Ablation of ANKRD22 similarly resulted inreduced E-cadherin levels with concomitant apoptosis in K-Ras-dependent cells (Fig. S8). Incontrast, knock down of SMAD4 expression, a gene not represented in the K-Ras dependencysignature, in H358 cells did not affect E-cadherin expression or induce apoptosis (Fig. S8).
The function of Syk as a protein kinase makes it an attractive potential therapeutic target. Wetherefore tested the efficacy of a pharmacologic Syk kinase inhibitor, R406, which isundergoing clinical testing in rheumatoid arthritis and B-cell lymphoma (Braselmann et al.,2006). IC50 values for growth inhibition by R406 were measured in a panel of K-Ras-dependent and K-Ras-independent cell lines. We found a statistically significant difference (P-value = 0.0095) between the IC50 values for growth inhibition by R406 and the RDI valuesfor each respective cell line tested (Fig. 6E). Thus, overall, K-Ras-dependent cell linesdemonstrated substantially greater sensitivity to pharmacologic Syk inhibition than K-Ras-independent cell lines.
To elucidate potential mechanisms underlying this differential drug sensitivity, we analyzedthe signaling consequences of Syk inhibition in several cell lines. PA-TU-8988T cells did notdisplay any basal Syk autophosphorylation. In A549 K-Ras-independent cells as well as H358and YAPC K-Ras-dependent cells, there was an R406 dose-dependent inhibition of Sykautophosphorylation on Y525/526 (Fig. 6F). However, inhibition of Syk was accompanied bya dose-dependent induction of Caspase-3 cleavage only in H358 and YAPC cells but not inA549 and PA-TU-8988T cells. Therefore, Syk plays an anti-apoptotic role specifically in thesetting of K-Ras dependency. These findings implicate several of the genes within the K-Rasdependency signature in determining the epithelial character of cancer cells, and suggest thatsome of these may constitute therapeutic targets in a subset of K-Ras mutant tumors.
Expression of K-Ras dependency signature genes in lung and pancreatic tumorsWe next attempted to analyze the expression profile of K-Ras dependency signature genes inprimary lung tumors of sqaumous carcinoma and adenocarcinoma subtypes, using publiclyavailable gene expression data (Bild et al., 2006). We assigned a ‘Ras Dependency Score’based on the average expression of the signature genes on a per sample basis. We firstcategorized the samples based on K-Ras mutational status and histological grading (Fig. 7A).The Ras dependency score was highest in tumor samples that harbored K-Ras mutations. Ofthese K-Ras mutant cancers, all had been classified as well-to-moderately differentiated.Conversely, K-Ras mutant tumors classified as poorly-differentiated exhibited relatively lowRas dependency scores. Thus, expression of the Ras dependency signature genes is foundpredominantly in K-Ras mutant tumors classified as well-to-moderately differentiated,consistent with the cell culture findings, demonstrating that the signature is associated withepithelial differentiation state.
We then performed hierarchical clustering analyses of gene expression datasets from humanprimary lung adenocarcinomas and squamous cell carcinomas represented in Figure 7A, usingthe top 325 genes from the PAM analysis that were differentially expressed in K-Ras-dependentcell lines (Fig. 7B). Strikingly, we observed two distinct clusters in the resulting heat map. Thefirst cluster, which comprises a distinct subset of dependency signature genes, was comprisedalmost entirely of squamous cell lung cancers. Conversely, the second cluster was comprisedof tumor samples that were predominantly classified as well differentiated or well-to-moderately differentiated adenocarcinomas (Fig. 7B). This cluster contained two of the genes
Singh et al. Page 7
Cancer Cell. Author manuscript; available in PMC 2010 June 2.
NIH
-PA Author Manuscript
NIH
-PA Author Manuscript
NIH
-PA Author Manuscript

we had characterized previously as potential therapeutic targets, ITGB6 and MST1R. Theabsence of SYK from this cluster may be explained by the fact that it is highly expressed inendothelial and hematopoietic cells, which are typically present in “contaminating” stromaltissue within tumor specimens. Integrin beta6 and RON are not expressed in B-lymphocytecells, whereas Syk is expressed strongly (Fig. 6A). Thus, differential SYK expression may notbe apparent in tumor samples. Significantly, 9 of 11 K-Ras mutant samples fell into the well-differentiated tumor cluster, whereas 2 of 11 fell outside the cluster, suggesting that a subsetof K-Ras mutant cancers do not express the K-Ras dependency signature, consistent with thecell line findings.
We also analyzed the expression of integrin beta6 in a K-Ras-driven mouse pancreatic cancermodel (Aguirre et al., 2003) that exhibits tumors with varying degrees of differentiated ductalmorphology. Staining was scored blindly on a 0–3 scale and the proportion of positive cells inat least 5 high power fields was determined. Normal pancreatic acinar cells did not stain (score0) and normal ductal cells showed weak staining (score 1). Analysis of a series of 31 tumorsrevealed that strongly positive staining (score 2 or 3) was present in ductal (differentiated)elements (75.3 % +/− 20.6% of cells showed positive staining) whereas only weak or absentstaining (score 0 or 1) was observed in poorly-differentiated anaplastic or sarcomatoid elements(Fig. 7C). These findings further support a relationship between expression of K-Rasdependency genes and epithelial differentiation in tumors.
DISCUSSIONBy examining addiction to oncogenic K-Ras in a quantitative manner, we were able to classifyK-Ras mutant cancer cells into two groups based on K-Ras dependency for cell viability. Thisclassification yielded a gene expression signature that allows for the accurate prediction of K-Ras dependency across tissue types. As a predictive tool, the K-Ras dependency signature didyield a low misclassification error rate. This could reflect, in part, a bias in the training set ofcell lines, which consisted predominantly of lung adenocarcinoma-derived cell lines.Therefore, a K-Ras dependency signature that includes a larger number of lines representingadditional tumor types could serve to further refine a more broadly applicable K-Rasdependency signature for predictive purposes.
This expression signature is significantly associated with gene expression profiles from K-Ras human mutant tumor samples classified as well differentiated. Thus, the in vitro derivedsignature, which is associated with epithelial differentiation, is also associated with thedifferentiation state of tumors in vivo. Upon further refinement of the signature, expression ofsubsets of K-Ras dependency signature genes may prove useful as biomarkers for the treatmentof cancers with specific molecular profiles. We have shown that ITGB6, in particular, isstrongly associated with a well-differentiated K-Ras driven cancer phenotype, and efforts totarget the activity of integrin beta6 are currently underway. Syk and RON, two kinases thatour findings have also implicated as potential therapeutic targets, have previously establishedroles in cancer (Lu et al., 2007; Sada et al., 2001). Thus, comparing gene expression profilesbetween cancer cell lines based on oncogene dependency provides a strategy for context-specific drug target discovery.
We also document a correlation between K-Ras addiction and K-Ras genomic amplification.K-Ras amplification is observed in lung and pancreatic tumor specimens (Aguirre et al.,2004; Weir et al., 2007), and may provide a useful biomarker of response to therapeutics thattarget K-Ras-addicted human cancers. Interestingly, oncogene addiction in other settings isalso associated with genomic amplification, most notably in the cases of MYC in many cancertypes, EGFR in gliomas and lung cancers, MET in gastric and lung cancers, and HER2 in breast
Singh et al. Page 8
Cancer Cell. Author manuscript; available in PMC 2010 June 2.
NIH
-PA Author Manuscript
NIH
-PA Author Manuscript
NIH
-PA Author Manuscript
cancers (Collins and Groudine, 1982; Houldsworth et al., 1990; Tal et al., 1988; Wong et al.,1987).
We have established that K-Ras dependency is strongly linked to epithelial differentiationstatus. Upon EMT, K-Ras dependency is reduced, and conversely, by MET, K-Ras dependencyis gained. We have assessed the mutational status of well-established tumor suppressor genesand oncogenes, other than K-Ras, and found no clear associations with K-Ras dependency(Figure S9). Therefore, the mechanism underlying loss or gain of K-Ras dependency ispotentially epigenetic in nature, which may be affirmed by recent analysis of EMT andepithelial plasticity as epigenetic phenomena (Dumont et al., 2008).
The observed relationship between K-Ras addiction, TGFβ signaling, and epithelialdifferentiation is particularly interesting in the context of pancreatic adenocarcinomas, whichundergo frequent homozygous deletion of the TGFβ signaling component Smad4 (~50 % ofcases) (Hezel et al., 2006). Deletion of Smad4 in cooperation with K-Ras mutational activationaccelerates tumor progression in a mouse model of pancreatic cancer (Bardeesy et al., 2006).TGFβ induces both EMT and growth arrest or apoptosis in a subset of cancers, and Smad4appears to be required. Loss of Smad4 results in a well-differentiated tumor histopathology,suggesting disruption of TGFβ-driven EMT. Smad4 loss or loss of TGFβ response in generaland K-Ras addiction in pancreatic adenocarcinomas may be associated, as we have observedthat differentiated epithelial-like cancer cells remain K-Ras-dependent. Thus, K-Ras genomicamplification and Smad4 deletion may correspond to important biomarkers of responsivenessto K-Ras-directed therapeutics.
The described findings raise the possibility that associations between oncogene dependencyand epithelial differentiation may extend beyond K-Ras addiction. Indeed, it was recentlyreported that FGFR addiction in a mouse model of prostate cancer is irreversible when tumorshave undergone EMT (Acevedo et al., 2007). This is reminiscent of the observed K-Rasindependency in mesenchymal K-Ras mutant cell lines. We also found a significant associationbetween the K-Ras dependency signature and a gene expression profile of sensitivity to EGFRinhibitors in NSCLC (Table 1) (Coldren et al., 2006). Like K-Ras, EGFR is mutated andamplified in NSCLC, contributing to sensitivity to EGFR kinase inhibitors. Moreover,insensitivity to EGFR inhibitors in lung and liver cancers has been associated with EMT, furthersupporting a link between EMT and loss of oncogene addiction (Fuchs et al., 2008; Thomsonet al., 2005). The notion that poorly-differentiated tumors are generally more drug resistantand are associated with poorer prognosis has been widely recognized in clinical oncology(Shah and Gallick, 2007), and our findings may provide some mechanistic insight into thisobservation.
EXPERIMENTAL PROCEDURESLentiviral shRNA experiments
293T cells were seeded (2 x 10⁵ cells per ml) in 6 well plates. shRNA constructs were fromthe Broad RNAi Consortium and Clone IDs are shown in Table S2. Lentiviral particles weregenerated using a three plasmid system, as described previously (Moffat et al., 2006;Naldiniet al., 1996). To standardize lentiviral transduction assays, viral titers were measured in abenchmark cell line, A549. For growth assays, titers corresponding to multiplicities of infection(MOIs) of 5 and 1 in A549 cells were employed. For K-Ras knockdown, cells were plated onday zero at 3x10⁴ cells/ml in 96 or 12 well plates. Cells were spin infected, as describedpreviously (Moffat et al., 2006). 24 hours post-infection, cells were treated with 1 μg/mlpuromycin for 3 days to eliminate uninfected cells. Media was replaced and after 2 more days,cells were fixed with 4% formaldehyde and stained with 1 μM Syto60 dye for 1 hour. Syto60
Singh et al. Page 9
Cancer Cell. Author manuscript; available in PMC 2010 June 2.
NIH
-PA Author Manuscript
NIH
-PA Author Manuscript
NIH
-PA Author Manuscript

fluorescence was quantified with a LiCor fluorescence scanner in the IR700 channel.Alternatively, cells were harvested for western blot analysis.
Derivation of the Ras Dependency Index (RDI)Weighted averages for relative cell densities for MOIs of 5 and 1 with the K-Ras B and CshRNAs were calculated. The inverse of these averages were then calculated. This number wasmultiplied by the transduction efficiency for each respective cell line (the proportion of cellsexpressing the control shRNA following puromycin selection), yielding the RDI value.
Rescue of K-Ras ablation-induced cell deathpWPI-HA-K-Ras(12V) was generated by Gateway Cloning (Didier Trono, EcolePolytechnique de Lausanne), which encodes a tandem IRES-GFP cassette. pLenti6-V5-GFPwas used as a control. H358 NSCLC cells were infected with recombinant lentiviruses asdescribed above. Cells expressing GFP or K-Ras(12V) were sorted for high GFP fluorescenceintensity by FACS. The top 5% GFP-expressing cells were selected and expanded. These stablepolyclonal cell lines were then subjected to K-Ras shRNA infection as described above.
AntibodiesThe following antibodies were used– K-Ras (Calbiochem, OP-24), PARP (BD Pharmigen,4C10-5), H-Ras (Abcam, Y132), phospho-ERK (Cell Signaling, 9101), total ERK (CellSignaling, 9102), phospho AKT (Biosource), total AKT (Cell Signaling, 9272), GAPDH(Chemicon), cleaved Caspase-3 (Cell Signaling, 9661), E-cadherin (BD Pharmigen), Vimentin(Santa Cruz, H-84), Zeb1 (Santa Cruz, H-102), PTEN (Cell Signaling, 9552), phospho-Tyrosine (Cell Signaling, 9411), phospho-Syk (Y525/Y526) (Cell Signaling, 2710), total Syk(Cell Signaling, 2712), integrin beta-6 (Santa Cruz, H110), RON-β (Santa Cruz, C-20), Integrinbeta-6 for IHC (Stromedix, Cambridge, MA), Prominin2 (Neuromics Inc.).
Immunofluorescence microscopyCells were fixed in EM grade 4% formaldehyde and permeablized with 0.1% Triton X-100.Staining with primary antibodies was carried out overnight at 4°C. For mouse monoclonalantibodies, a Cy3-conjugated goat anti-mouse secondary antibody was used (JacksonLaboratories). For rabbit polyclonal antibodies, FiTC-conjugated goat anti-rabbit secondaryantibody was used (Chemicon Inc.). Nuclei were visualized using Hoechst 33342 dye(Molecular Probes). Micrographs were captured on an IX81 Spinning Disk DeconvolutionMicroscope equipped with a 40X Plan-Apo Oil objective lens. Digital images were processedwith Slidebook and Adobe Photoshop CS4.
SNP and Gene Expression Microarray AnalysesK-Ras gene copy number analysis was performed with SNP array data using the AffymetrixGeneChip Human Mapping 500K Array Set. Raw data were converted to copy numbers usingPLASQ (Probe-Level Allele-Specific Quantitation) algorithm (LaFramboise et al., 2005).Comparative whole-genome expression profiling was performed on Affymetrix U133 X3PMicroarrays. Expression data were normalized using GCRMA (Bolstad et al., 2003). SNP andgene expression data as well as raw cel files are publicly available via NCBI (Accession #GSE15126). The PAM algorithm (Tibshirani et al., 2002) was used to generate a geneexpression signature to differentiate K-Ras-dependent from K-Ras-independent cell lines(parameters for the algorithm are shown in Supplemental Experimental Procedures). Toidentify associations of the K-Ras dependency signature with published gene expressiondatasets, the Oncomine Concepts Map was used (Rhodes et al., 2004). The integrated softwarewas used to generate heat-maps showing associations with Ras transcriptional targets. Togenerate heat-maps for hierarchical clustering of the signature genes in K-Ras mutant cell lines,
Singh et al. Page 10
Cancer Cell. Author manuscript; available in PMC 2010 June 2.
NIH
-PA Author Manuscript
NIH
-PA Author Manuscript
NIH
-PA Author Manuscript

the “R” gene expression analysis software was used. Normalized gene expression data forRas_dependency genes were obtained from Oncomine. Average linkage hierarchical clusteringwas performed using Cluster/ Treeview (Eisen et al., 1998). To compute a Ras Dependencyscore, normalized_expression data for each Ras dependency gene was median-centeredand_then median-centered expression values were averaged.
Immunohistochemistry of mouse pancreatic cancersFor immunohistochemical staining we employed tumor sections from the Pdx1-Cre LSL-KrasG12D Ink4a/Arf Lox/Lox mouse model of pancreatic cancer (Aguirre et al., 2003) andfrom control wild type mouse. All mice were housed in a pathogen-free environment at theMassachusetts General Hospital and were handled in strict accordance with Good AnimalPractice as defined by the Office of Laboratory Animal Welfare, and all animal experimentswere done with approval from Massachusetts General Hospital Subcommittee on ResearchAnimal Care. Mice with signs of tumors (palpable abdominal mass, lethargy, weight loss) wereeuthanized, and the tumors were fixed overnight with neutral buffered 10% formalin. Tissueswere incubated with pepsin (00-3008; Zymed, San Francisco, CA) 10 min at 37°C and blockedwith 15ul/ml goat serum in TBS/Tween 20 + 0.1% BSA. Primary antibody was added to TBS/Tween 20 + 0.1% BSA and tissues were incubated for 60 min at room temperature. Forimmunostaining on mouse tissue, sections were incubated with a human/mouse chimeric formof the anti-integrin αVβ6 mAb, 2A1 (2.1 ul/ml) and an anti-human biotinylated secondaryantibody (BA-3000; Vector Laboratories). Avidin-biotin complex-horseradish peroxidase(Vector kit PK-4000) was applied to sections and incubated 30 min at room temperature, and3,3'-diaminobenzidine substrate was prepared as directed (SK-4100; Vector Laboratories) andapplied to sections for 5 min at room temperature. Tissue sections were stained with Mayer’shematoxylin for 1 min and rinsed in water and PBS.
Supplementary MaterialRefer to Web version on PubMed Central for supplementary material.
AcknowledgmentsA.S. was supported by a NRSA T32 post-doctoral fellowship. The studies were supported by NIH RO1 CA109447to J.S. We thank Marie Classon, Jeff Engelman and Rushika Perara for comments on the manuscript. We thank MichaelRothenberg for construction of the pWPI-K-Ras(12V) expression vector and for advice regarding lentiviral use. Wethank Maria Varadi for technical assistance. We thank Nathanael Gray for providing the R406 Syk inhibitor. We thankSridhar Ramaswamy and Andrew Yee for advice with the application of gene expression signatures as predictive tools.We thank Vikram Deshpande for assistance with IHC analysis.
ReferencesAcevedo VD, Gangula RD, Freeman KW, Li R, Zhang Y, Wang F, Ayala GE, Peterson LE, Ittmann M,
Spencer DM. Inducible FGFR-1 activation leads to irreversible prostate adenocarcinoma and anepithelial-to-mesenchymal transition. Cancer Cell 2007;12:559–571. [PubMed: 18068632]
Aguirre AJ, Bardeesy N, Sinha M, Lopez L, Tuveson DA, Horner J, Redston MS, DePinho RA. ActivatedKras and Ink4a/Arf deficiency cooperate to produce metastatic pancreatic ductal adenocarcinoma.Genes Dev 2003;17:3112–3126. [PubMed: 14681207]
Aguirre AJ, Brennan C, Bailey G, Sinha R, Feng B, Leo C, Zhang Y, Zhang J, Gans JD, Bardeesy N, etal. High-resolution characterization of the pancreatic adenocarcinoma genome. Proc Natl Acad Sci US A 2004;101:9067–9072. [PubMed: 15199222]
Baines AT, Lim KH, Shields JM, Lambert JM, Counter CM, Der CJ, Cox AD. Use of retrovirusexpression of interfering RNA to determine the contribution of activated K-Ras and ras effectorexpression to human tumor cell growth. Methods Enzymol 2006;407:556–574. [PubMed: 16757353]
Singh et al. Page 11
Cancer Cell. Author manuscript; available in PMC 2010 June 2.
NIH
-PA Author Manuscript
NIH
-PA Author Manuscript
NIH
-PA Author Manuscript

Bardeesy N, Cheng KH, Berger JH, Chu GC, Pahler J, Olson P, Hezel AF, Horner J, Lauwers GY,Hanahan D, DePinho RA. Smad4 is dispensable for normal pancreas development yet critical inprogression and tumor biology of pancreas cancer. Genes Dev 2006;20:3130–3146. [PubMed:17114584]
Beer DG, Kardia SL, Huang CC, Giordano TJ, Levin AM, Misek DE, Lin L, Chen G, Gharib TG, ThomasDG, et al. Gene-expression profiles predict survival of patients with lung adenocarcinoma. Nat Med2002;8:816–824. [PubMed: 12118244]
Bild AH, Yao G, Chang JT, Wang Q, Potti A, Chasse D, Joshi MB, Harpole D, Lancaster JM, BerchuckA, et al. Oncogenic pathway signatures in human cancers as a guide to targeted therapies. Nature2006;439:353–357. [PubMed: 16273092]
Bolstad BM, Irizarry RA, Astrand M, Speed TP. A comparison of normalization methods for high densityoligonucleotide array data based on variance and bias. Bioinformatics 2003;19:185–193. [PubMed:12538238]
Braselmann S, Taylor V, Zhao H, Wang S, Sylvain C, Baluom M, Qu K, Herlaar E, Lau A, Young C, etal. R406, an orally available spleen tyrosine kinase inhibitor blocks fc receptor signaling and reducesimmune complex-mediated inflammation. J Pharmacol Exp Ther 2006;319:998–1008. [PubMed:16946104]
Coldren CD, Helfrich BA, Witta SE, Sugita M, Lapadat R, Zeng C, Baron A, Franklin WA, Hirsch FR,Geraci MW, Bunn PA Jr. Baseline gene expression predicts sensitivity to gefitinib in non-small celllung cancer cell lines. Mol Cancer Res 2006;4:521–528. [PubMed: 16877703]
Collins S, Groudine M. Amplification of endogenous myc-related DNA sequences in a human myeloidleukaemia cell line. Nature 1982;298:679–681. [PubMed: 6285209]
Cox AD, Der CJ. Ras family signaling: therapeutic targeting. Cancer Biol Ther 2002;1:599–606.[PubMed: 12642680]
Dennis G Jr, Sherman BT, Hosack DA, Yang J, Gao W, Lane HC, Lempicki RA. DAVID: Database forAnnotation, Visualization, and Integrated Discovery. Genome Biol 2003;4:P3. [PubMed: 12734009]
Dumont N, Wilson MB, Crawford YG, Reynolds PA, Sigaroudinia M, Tlsty TD. Sustained induction ofepithelial to mesenchymal transition activates DNA methylation of genes silenced in basal-like breastcancers. Proc Natl Acad Sci U S A 2008;105:14867–14872. [PubMed: 18806226]
Eisen MB, Spellman PT, Brown PO, Botstein D. Cluster analysis and display of genome-wide expressionpatterns. Proc Natl Acad Sci U S A 1998;95:14863–14868. [PubMed: 9843981]
Fleming JB, Shen GL, Holloway SE, Davis M, Brekken RA. Molecular consequences of silencing mutantK-ras in pancreatic cancer cells: justification for K-ras-directed therapy. Mol Cancer Res 2005;3:413–423. [PubMed: 16046552]
Fuchs BC, Fujii T, Dorfman JD, Goodwin JM, Zhu AX, Lanuti M, Tanabe KK. Epithelial-to-mesenchymal transition and integrin-linked kinase mediate sensitivity to epidermal growth factorreceptor inhibition in human hepatoma cells. Cancer Res 2008;68:2391–2399. [PubMed: 18381447]
Grutzmann R, Pilarsky C, Ammerpohl O, Luttges J, Bohme A, Sipos B, Foerder M, Alldinger I, JahnkeB, Schackert HK, et al. Gene expression profiling of microdissected pancreatic ductal carcinomasusing high- density DNA microarrays. Neoplasia 2004;6:611–622. [PubMed: 15548371]
Haigis KM, Kendall KR, Wang Y, Cheung A, Haigis MC, Glickman JN, Niwa-Kawakita M, Sweet-Cordero A, Sebolt-Leopold J, Shannon KM, et al. Differential effects of oncogenic K-Ras and N-Ras on proliferation, differentiation and tumor progression in the colon. Nat Genet 2008;40:600–608. [PubMed: 18372904]
Hezel AF, Kimmelman AC, Stanger BZ, Bardeesy N, Depinho RA. Genetics and biology of pancreaticductal adenocarcinoma. Genes Dev 2006;20:1218–1249. [PubMed: 16702400]
Hosack DA, Dennis G Jr, Sherman BT, Lane HC, Lempicki RA. Identifying biological themes withinlists of genes with EASE. Genome Biol 2003;4:R70. [PubMed: 14519205]
Houldsworth J, Cordon-Cardo C, Ladanyi M, Kelsen DP, Chaganti RS. Gene amplification in gastricand esophageal adenocarcinomas. Cancer Res 1990;50:6417–6422. [PubMed: 2400999]
Iacobuzio-Donahue CA, Maitra A, Olsen M, Lowe AW, van Heek NT, Rosty C, Walter K, Sato N, ParkerA, Ashfaq R, et al. Exploration of global gene expression patterns in pancreatic adenocarcinomausing cDNA microarrays. Am J Pathol 2003;162:1151–1162. [PubMed: 12651607]
Singh et al. Page 12
Cancer Cell. Author manuscript; available in PMC 2010 June 2.
NIH
-PA Author Manuscript
NIH
-PA Author Manuscript
NIH
-PA Author Manuscript
Johnson L, Mercer K, Greenbaum D, Bronson RT, Crowley D, Tuveson DA, Jacks T. Somatic activationof the K-ras oncogene causes early onset lung cancer in mice. Nature 2001;410:1111–1116. [PubMed:11323676]
LaFramboise T, Weir BA, Zhao X, Beroukhim R, Li C, Harrington D, Sellers WR, Meyerson M. Allele-specific amplification in cancer revealed by SNP array analysis. PLoS Comput Biol 2005;1:e65.[PubMed: 16322765]
Logsdon CD, Simeone DM, Binkley C, Arumugam T, Greenson JK, Giordano TJ, Misek DE, Kuick R,Hanash S. Molecular profiling of pancreatic adenocarcinoma and chronic pancreatitis identifiesmultiple genes differentially regulated in pancreatic cancer. Cancer Res 2003;63:2649–2657.[PubMed: 12750293]
Lu Y, Yao HP, Wang MH. Multiple variants of the RON receptor tyrosine kinase: biochemical properties,tumorigenic activities, and potential drug targets. Cancer Lett 2007;257:157–164. [PubMed:17889431]
Moffat J, Grueneberg DA, Yang X, Kim SY, Kloepfer AM, Hinkle G, Piqani B, Eisenhaure TM, Luo B,Grenier JK, et al. A lentiviral RNAi library for human and mouse genes applied to an arrayed viralhigh-content screen. Cell 2006;124:1283–1298. [PubMed: 16564017]
Naldini L, Blomer U, Gallay P, Ory D, Mulligan R, Gage FH, Verma IM, Trono D. In vivo gene deliveryand stable transduction of nondividing cells by a lentiviral vector. Science 1996;272:263–267.[PubMed: 8602510]
Olejniczak ET, Van Sant C, Anderson MG, Wang G, Tahir SK, Sauter G, Lesniewski R, Semizarov D.Integrative genomic analysis of small-cell lung carcinoma reveals correlates of sensitivity to bcl-2antagonists and uncovers novel chromosomal gains. Mol Cancer Res 2007;5:331–339. [PubMed:17426248]
Peinado H, Olmeda D, Cano A. Snail, Zeb and bHLH factors in tumour progression: an alliance againstthe epithelial phenotype? Nat Rev Cancer 2007;7:415–428. [PubMed: 17508028]
Repasky GA, Chenette EJ, Der CJ. Renewing the conspiracy theory debate: does Raf function alone tomediate Ras oncogenesis? Trends Cell Biol 2004;14:639–647. [PubMed: 15519853]
Rhodes DR, Yu J, Shanker K, Deshpande N, Varambally R, Ghosh D, Barrette T, Pandey A, ChinnaiyanAM. ONCOMINE: a cancer microarray database and integrated data-mining platform. Neoplasia2004;6:1–6. [PubMed: 15068665]
Sada K, Takano T, Yanagi S, Yamamura H. Structure and function of Syk protein-tyrosine kinase. JBiochem 2001;130:177–186. [PubMed: 11481033]
Shah AN, Gallick GE. Src, chemoresistance and epithelial to mesenchymal transition: are they related?Anticancer Drugs 2007;18:371–375. [PubMed: 17351389]
Sharma SV, Bell DW, Settleman J, Haber DA. Epidermal growth factor receptor mutations in lung cancer.Nat Rev Cancer 2007;7:169–181. [PubMed: 17318210]
Stearman RS, Dwyer-Nield L, Zerbe L, Blaine SA, Chan Z, Bunn PA Jr, Johnson GL, Hirsch FR, MerrickDT, Franklin WA, et al. Analysis of orthologous gene expression between human pulmonaryadenocarcinoma and a carcinogen-induced murine model. Am J Pathol 2005;167:1763–1775.[PubMed: 16314486]
Tal M, Wetzler M, Josefberg Z, Deutch A, Gutman M, Assaf D, Kris R, Shiloh Y, Givol D, SchlessingerJ. Sporadic amplification of the HER2/neu protooncogene in adenocarcinomas of various tissues.Cancer Res 1988;48:1517–1520. [PubMed: 3345525]
Thomson S, Buck E, Petti F, Griffin G, Brown E, Ramnarine N, Iwata KK, Gibson N, Haley JD. Epithelialto mesenchymal transition is a determinant of sensitivity of non-small-cell lung carcinoma cell linesand xenografts to epidermal growth factor receptor inhibition. Cancer Res 2005;65:9455–9462.[PubMed: 16230409]
Tibshirani R, Hastie T, Narasimhan B, Chu G. Diagnosis of multiple cancer types by shrunken centroidsof gene expression. Proc Natl Acad Sci U S A 2002;99:6567–6572. [PubMed: 12011421]
Wagner KW, Punnoose EA, Januario T, Lawrence DA, Pitti RM, Lancaster K, Lee D, von Goetz M, YeeSF, Totpal K, et al. Death-receptor O-glycosylation controls tumor-cell sensitivity to the proapoptoticligand Apo2L/TRAIL. Nat Med 2007;13:1070–1077. [PubMed: 17767167]
Weinstein IB. Cancer. Addiction to oncogenes--the Achilles heal of cancer. Science 2002;297:63–64.[PubMed: 12098689]
Singh et al. Page 13
Cancer Cell. Author manuscript; available in PMC 2010 June 2.
NIH
-PA Author Manuscript
NIH
-PA Author Manuscript
NIH
-PA Author Manuscript

Weir BA, Woo MS, Getz G, Perner S, Ding L, Beroukhim R, Lin WM, Province MA, Kraja A, JohnsonLA, et al. Characterizing the cancer genome in lung adenocarcinoma. Nature 2007;450:893–898.[PubMed: 17982442]
Wong AJ, Bigner SH, Bigner DD, Kinzler KW, Hamilton SR, Vogelstein B. Increased expression of theepidermal growth factor receptor gene in malignant gliomas is invariably associated with geneamplification. Proc Natl Acad Sci U S A 1987;84:6899–6903. [PubMed: 3477813]
Singh et al. Page 14
Cancer Cell. Author manuscript; available in PMC 2010 June 2.
NIH
-PA Author Manuscript
NIH
-PA Author Manuscript
NIH
-PA Author Manuscript
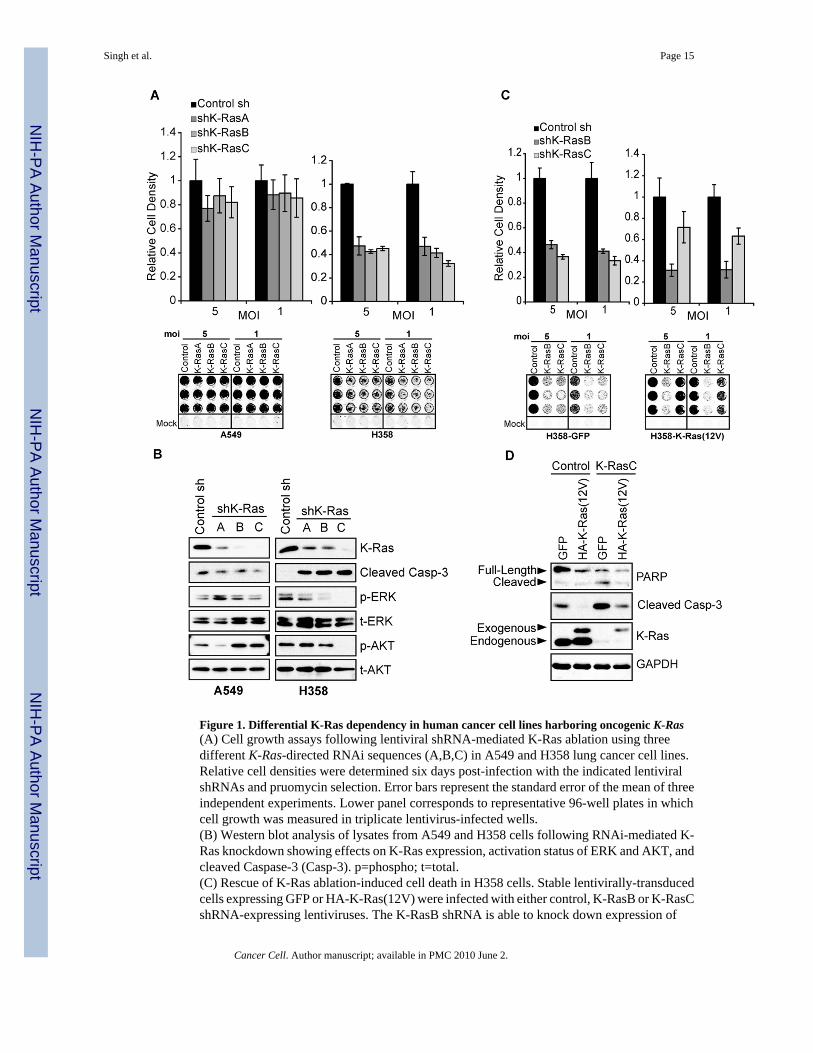
Figure 1. Differential K-Ras dependency in human cancer cell lines harboring oncogenic K-Ras(A) Cell growth assays following lentiviral shRNA-mediated K-Ras ablation using threedifferent K-Ras-directed RNAi sequences (A,B,C) in A549 and H358 lung cancer cell lines.Relative cell densities were determined six days post-infection with the indicated lentiviralshRNAs and pruomycin selection. Error bars represent the standard error of the mean of threeindependent experiments. Lower panel corresponds to representative 96-well plates in whichcell growth was measured in triplicate lentivirus-infected wells.(B) Western blot analysis of lysates from A549 and H358 cells following RNAi-mediated K-Ras knockdown showing effects on K-Ras expression, activation status of ERK and AKT, andcleaved Caspase-3 (Casp-3). p=phospho; t=total.(C) Rescue of K-Ras ablation-induced cell death in H358 cells. Stable lentivirally-transducedcells expressing GFP or HA-K-Ras(12V) were infected with either control, K-RasB or K-RasCshRNA-expressing lentiviruses. The K-RasB shRNA is able to knock down expression of
Singh et al. Page 15
Cancer Cell. Author manuscript; available in PMC 2010 June 2.
NIH
-PA Author Manuscript
NIH
-PA Author Manuscript
NIH
-PA Author Manuscript

endogenous and exogenous K-Ras, whereas K-RasC only affects endogenous K-Ras. Data arepresented as the mean of two independent experiments plus standard error.(D) Rescue of endogenous K-Ras ablation-induced cell death as assessed by both PARP andCaspase-3 cleavage by western blotting. GAPDH provides a protein loading control. Data arerepresentative of two independent experiments.
Singh et al. Page 16
Cancer Cell. Author manuscript; available in PMC 2010 June 2.
NIH
-PA Author Manuscript
NIH
-PA Author Manuscript
NIH
-PA Author Manuscript
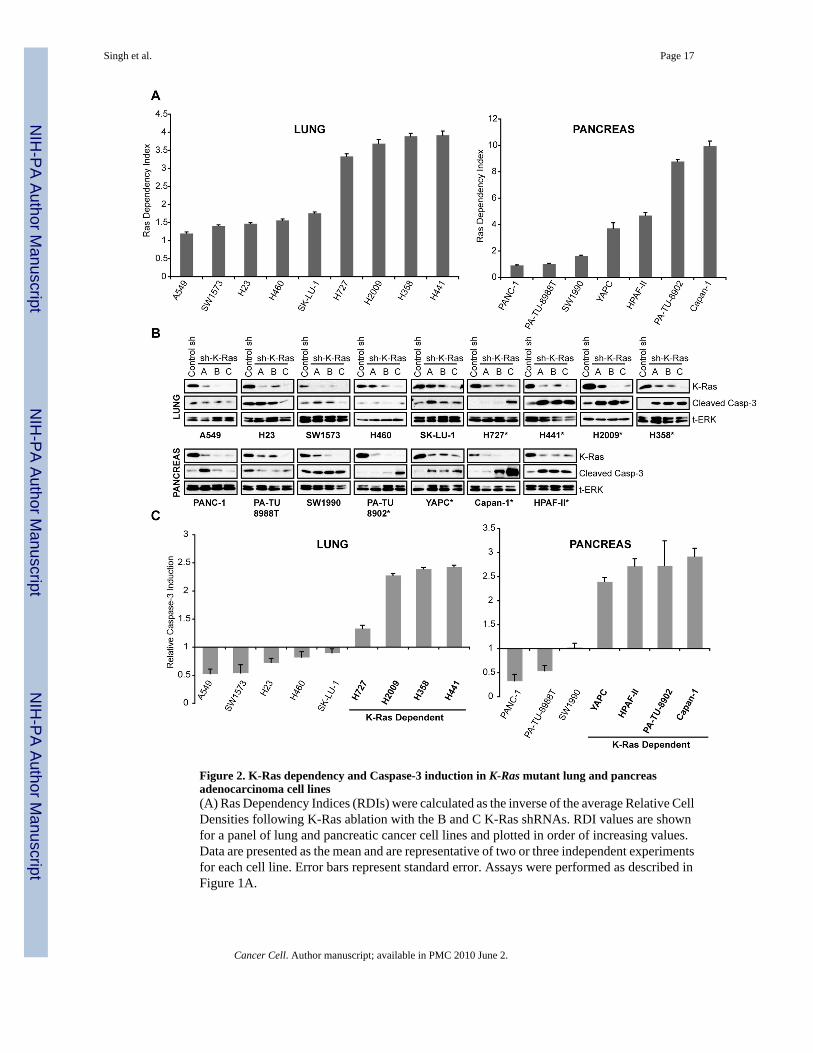
Figure 2. K-Ras dependency and Caspase-3 induction in K-Ras mutant lung and pancreasadenocarcinoma cell lines(A) Ras Dependency Indices (RDIs) were calculated as the inverse of the average Relative CellDensities following K-Ras ablation with the B and C K-Ras shRNAs. RDI values are shownfor a panel of lung and pancreatic cancer cell lines and plotted in order of increasing values.Data are presented as the mean and are representative of two or three independent experimentsfor each cell line. Error bars represent standard error. Assays were performed as described inFigure 1A.
Singh et al. Page 17
Cancer Cell. Author manuscript; available in PMC 2010 June 2.
NIH
-PA Author Manuscript
NIH
-PA Author Manuscript
NIH
-PA Author Manuscript

(B) Western blot analysis showing Caspase-3 cleavage following K-Ras ablation in cell linesshown in Figure 2A. Total ERK is a loading control. Data are representative of two independentexperiments for each cell line. Asterisks denote cell lines classified as being K-Ras-dependent.(C) Quantitation of relative Caspase-3 cleavage following K-Ras ablation with the K-RasCshRNA as assessed by densitometric analysis of cleaved Caspase-3 from blots in Figure 2B.Data are shown as values normalized to cleaved Caspase-3 band density from control shRNAtreated cells and presented as the mean of two densitometric readings. Error bars representstandard error.
Singh et al. Page 18
Cancer Cell. Author manuscript; available in PMC 2010 June 2.
NIH
-PA Author Manuscript
NIH
-PA Author Manuscript
NIH
-PA Author Manuscript
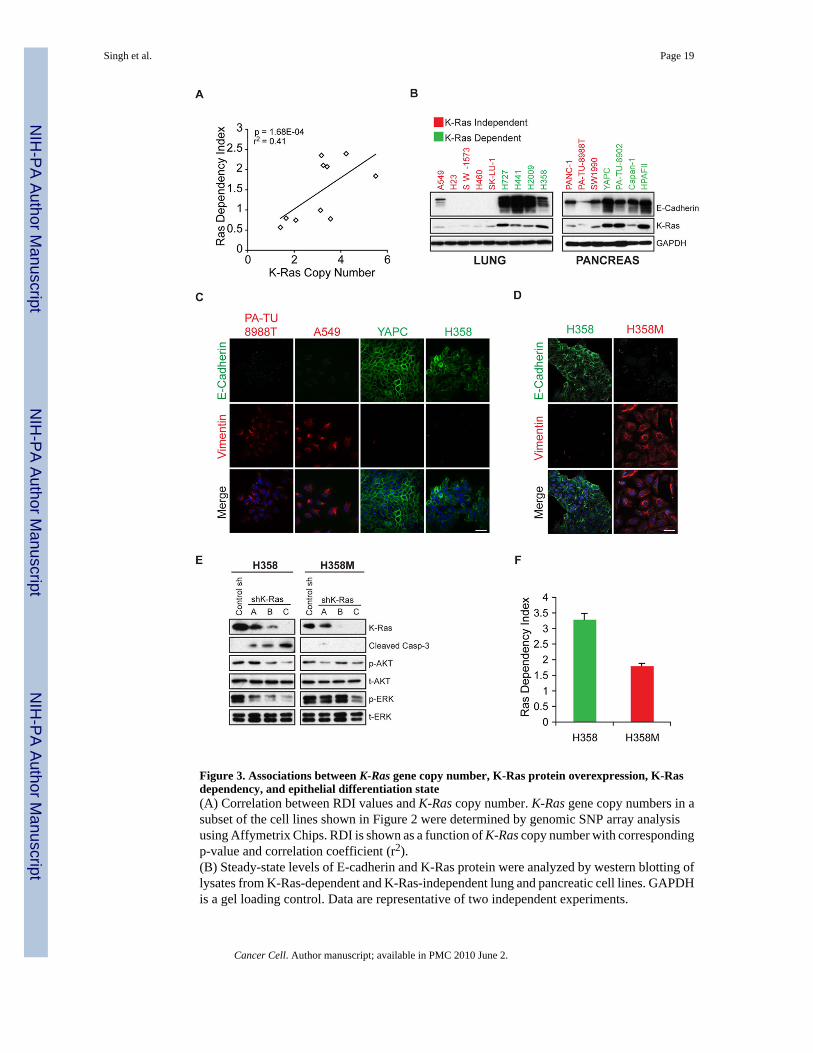
Figure 3. Associations between K-Ras gene copy number, K-Ras protein overexpression, K-Rasdependency, and epithelial differentiation state(A) Correlation between RDI values and K-Ras copy number. K-Ras gene copy numbers in asubset of the cell lines shown in Figure 2 were determined by genomic SNP array analysisusing Affymetrix Chips. RDI is shown as a function of K-Ras copy number with correspondingp-value and correlation coefficient (r2).(B) Steady-state levels of E-cadherin and K-Ras protein were analyzed by western blotting oflysates from K-Ras-dependent and K-Ras-independent lung and pancreatic cell lines. GAPDHis a gel loading control. Data are representative of two independent experiments.
Singh et al. Page 19
Cancer Cell. Author manuscript; available in PMC 2010 June 2.
NIH
-PA Author Manuscript
NIH
-PA Author Manuscript
NIH
-PA Author Manuscript
(C) Expression and subcellular localization of E-cadherin and vimentin in K-Ras-independent(red text) and K-Ras-dependent (green text) cell lines, as demonstrated by fluorescencemicroscopy. Green=E-cadherin; red=vimentin; blue=nuclei (Hoechst). Scale bar = 15 μM.(D) Loss of E-cadherin in H358 cells chronically treated with TGFβ, as demonstrated byfluorescence microscopy. The resulting stable mesenchymal cell line is designated H358M.Green=E-cadherin; red=vimentin. Scale bar = 15 μM.(E) Apoptotic response to shRNA-mediated K-Ras ablation as assessed by western blotting ofCaspase-3 cleavage in H358 versus H358M cells. Data are representative of two independentexperiments.(F) RDIs for H358 versus H358M cells were derived as described previously. The graph depictsmean RDIs from two independent experiments, with error bars corresponding to standard error.
Singh et al. Page 20
Cancer Cell. Author manuscript; available in PMC 2010 June 2.
NIH
-PA Author Manuscript
NIH
-PA Author Manuscript
NIH
-PA Author Manuscript
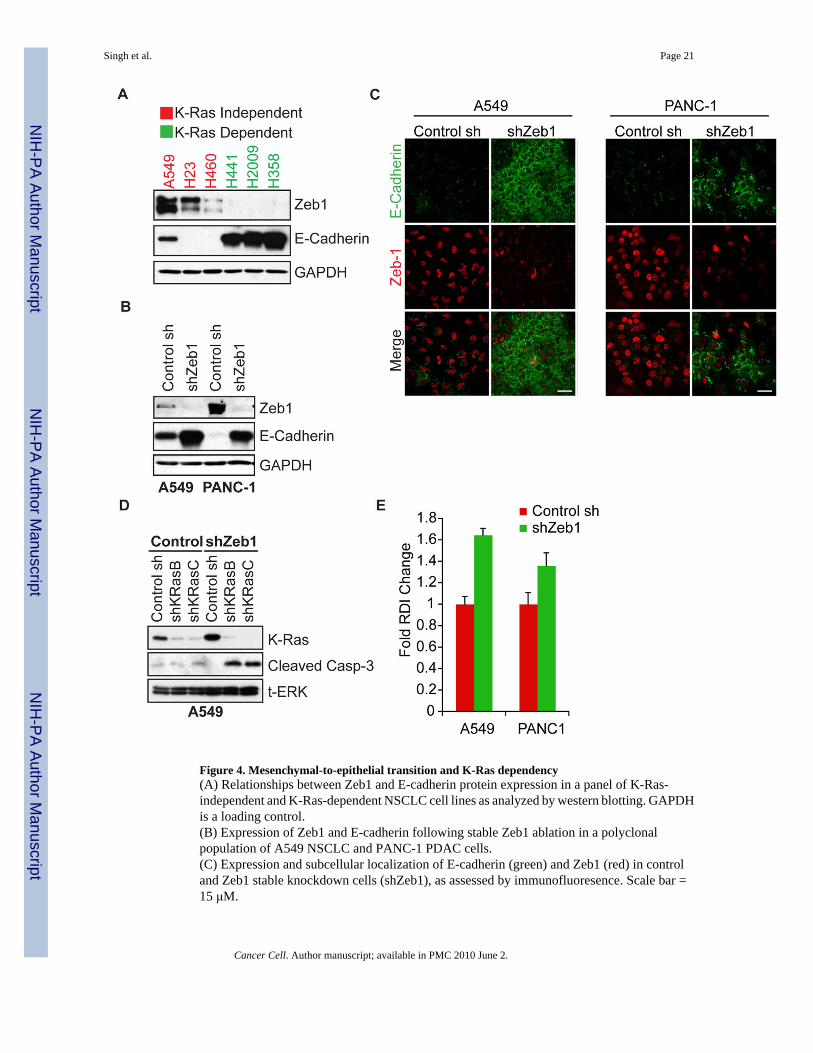
Figure 4. Mesenchymal-to-epithelial transition and K-Ras dependency(A) Relationships between Zeb1 and E-cadherin protein expression in a panel of K-Ras-independent and K-Ras-dependent NSCLC cell lines as analyzed by western blotting. GAPDHis a loading control.(B) Expression of Zeb1 and E-cadherin following stable Zeb1 ablation in a polyclonalpopulation of A549 NSCLC and PANC-1 PDAC cells.(C) Expression and subcellular localization of E-cadherin (green) and Zeb1 (red) in controland Zeb1 stable knockdown cells (shZeb1), as assessed by immunofluoresence. Scale bar =15 μM.
Singh et al. Page 21
Cancer Cell. Author manuscript; available in PMC 2010 June 2.
NIH
-PA Author Manuscript
NIH
-PA Author Manuscript
NIH
-PA Author Manuscript

(D) Ablation of K-Ras in control versus shZeb1 expressing A549 cells, and effects on apoptosisas assessed by Caspase-3 cleavage.(E) Fold changes in RDI values for A549 and PANC-1 shZeb1-expressing cells. Data arenormalized to control shRNA-expressing cells. Data are representative of the mean of two orthree independent experiments. Error bars represent standard error.
Singh et al. Page 22
Cancer Cell. Author manuscript; available in PMC 2010 June 2.
NIH
-PA Author Manuscript
NIH
-PA Author Manuscript
NIH
-PA Author Manuscript
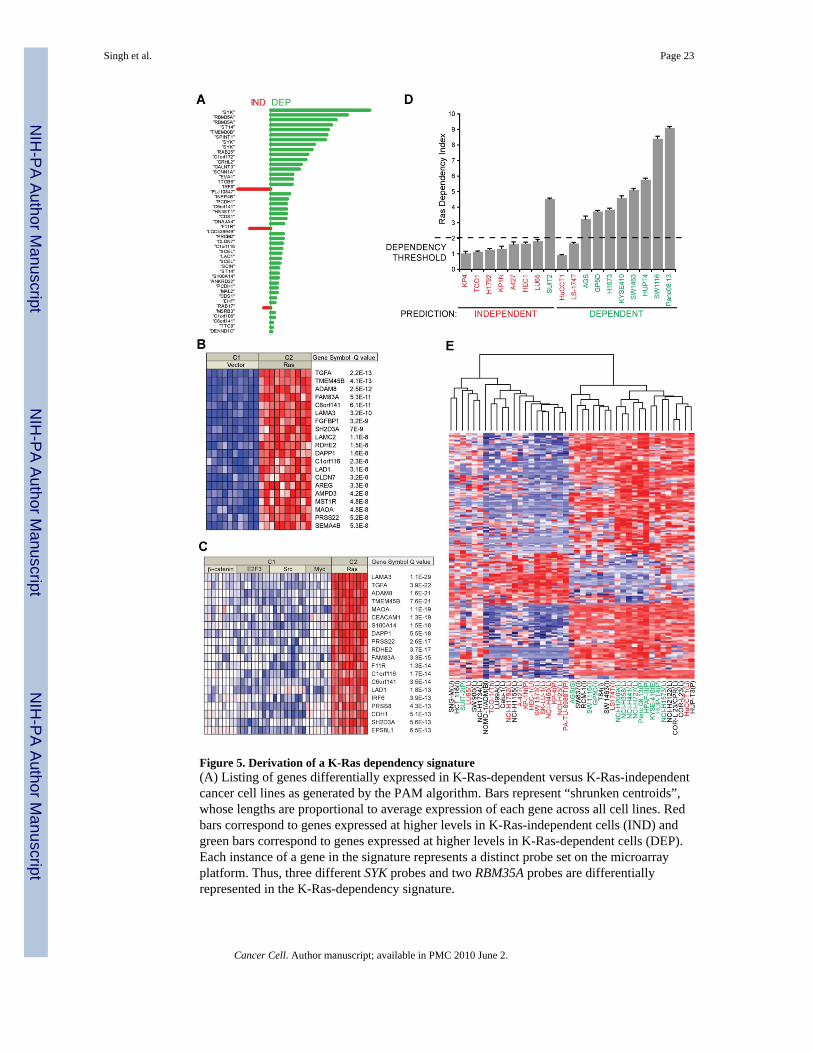
Figure 5. Derivation of a K-Ras dependency signature(A) Listing of genes differentially expressed in K-Ras-dependent versus K-Ras-independentcancer cell lines as generated by the PAM algorithm. Bars represent “shrunken centroids”,whose lengths are proportional to average expression of each gene across all cell lines. Redbars correspond to genes expressed at higher levels in K-Ras-independent cells (IND) andgreen bars correspond to genes expressed at higher levels in K-Ras-dependent cells (DEP).Each instance of a gene in the signature represents a distinct probe set on the microarrayplatform. Thus, three different SYK probes and two RBM35A probes are differentiallyrepresented in the K-Ras-dependency signature.
Singh et al. Page 23
Cancer Cell. Author manuscript; available in PMC 2010 June 2.
NIH
-PA Author Manuscript
NIH
-PA Author Manuscript
NIH
-PA Author Manuscript

(B) The K-Ras dependency signature is associated with a signature of activated Ras expressionin human mammary epithelial cells. The 20 Ras dependency genes most over-expressed uponactivated Ras transfection are depicted here.(C) The Ras dependency signature is significantly associated with genes transcriptionallyupregulated by activated Ras but not by other activated oncogenes, namely β-catenin, E2F3,Src and Myc.(D) Predictions of K-Ras dependency for a representative “test set” of K-Ras mutant cell linesfrom various tissue types were made using the PAM algorithm. Nominal RDIs were calculatedby plotting growth versus average values for relative K-Ras expression following RNAi,extrapolated from the training set of cell lines. Data are shown as the mean of two independentexperiments with error bars representing standard error. Red=K-Ras-independent; green=K-Ras-dependent. Prediction assignments are shown below cell line names. The ‘DependencyThreshold’ of 2.0 established previously is shown as a dashed line. A two-tailed student T-testyielded a p-value of 0.009, demonstrating statistical significance of the predictive value of theK-Ras dependency signature.(E) Heat map showing hierarchical clustering of K-Ras dependency signature gene expressionin a cross-tissue panel of K-Ras mutant cell lines. Red and blue indicate relative over orunderexpression of genes, respectively. Note the bifurcation of cell lines into two broad groups,with a third subgroup clustering to the leftmost extreme of the heatmap. For cell line names,red=K-Ras-independent lines; green=K-Ras-dependent lines; black= not tested. Tissue oforigin is indicated in parentheses: U=Uterus; I=Intestine; P=Pancreas; L=Lung; Bl=Blood;Th=Thymus; S=Stomach; E=Esophagus; Li=Liver.
Singh et al. Page 24
Cancer Cell. Author manuscript; available in PMC 2010 June 2.
NIH
-PA Author Manuscript
NIH
-PA Author Manuscript
NIH
-PA Author Manuscript
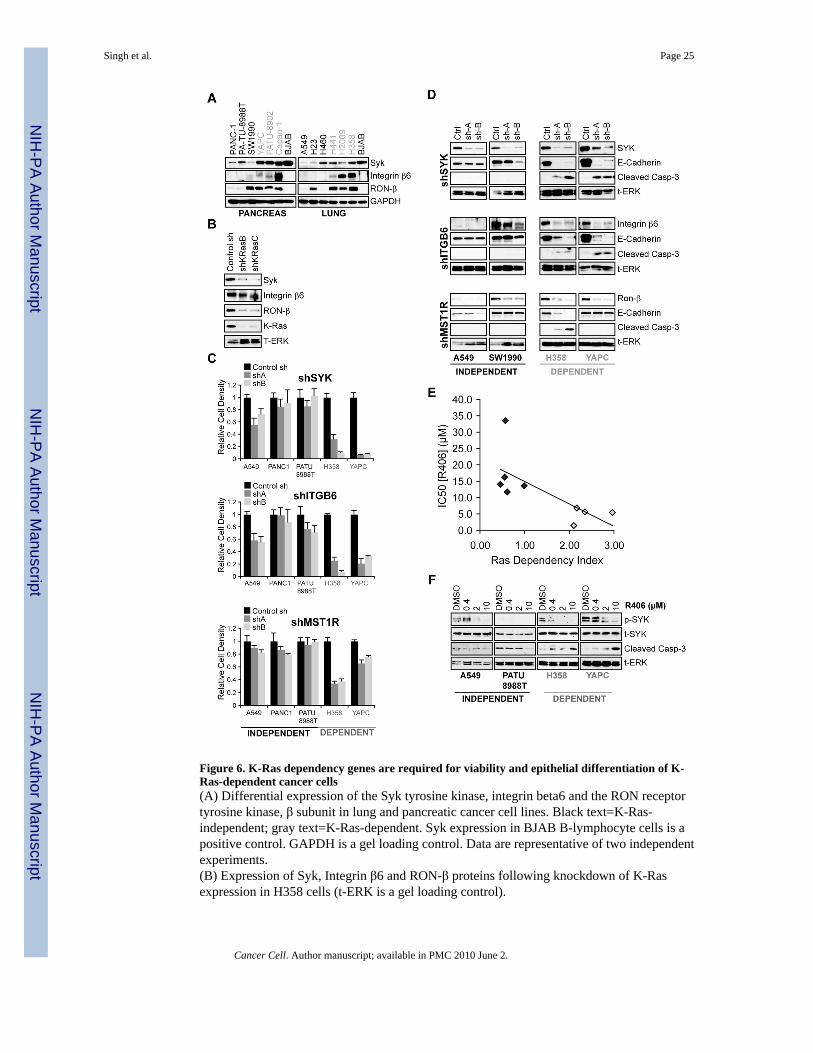
Figure 6. K-Ras dependency genes are required for viability and epithelial differentiation of K-Ras-dependent cancer cells(A) Differential expression of the Syk tyrosine kinase, integrin beta6 and the RON receptortyrosine kinase, β subunit in lung and pancreatic cancer cell lines. Black text=K-Ras-independent; gray text=K-Ras-dependent. Syk expression in BJAB B-lymphocyte cells is apositive control. GAPDH is a gel loading control. Data are representative of two independentexperiments.(B) Expression of Syk, Integrin β6 and RON-β proteins following knockdown of K-Rasexpression in H358 cells (t-ERK is a gel loading control).
Singh et al. Page 25
Cancer Cell. Author manuscript; available in PMC 2010 June 2.
NIH
-PA Author Manuscript
NIH
-PA Author Manuscript
NIH
-PA Author Manuscript

(C) Cell growth assays following shRNA-mediated knockdown of three K-Ras dependencygenes: SYK, ITGB6 (integrin β6), and MST1R (RON). Data are presented as means and arerepresentative of three independent experiments. Error bars represent standard error.(D) Knockdown of SYK, ITGB6 and MST1R in K-Ras-independent and K-Ras-dependent cellsand effects on E-cadherin expression and apoptosis. Caspase-3 induction and E-cadherinexpression were analyzed by western blotting, and total ERK (t-ERK) is a loading control.Data are representative of two independent experiments.(E) Correlation between RDI values and IC50 values for R406, a Syk kinase inhibitor, in apanel of K-Ras mutant cancer cell lines. Cells were treated with 0.016 μM to 10 μM R406 for3 days, and relative cell densities were quantified. Dark grey symbols represent K-Ras-independent lines and light grey represent K-Ras-dependent lines. Data are represented as themean of two independent experiments. (p-value = 0.0095)(F) Effects R406 on Syk autophosphorylation at Y525/526 (p-SYK) and effects on cell deathas assessed by Caspase-3 cleavage. Total Syk (t-Syk) and total Erk (t-ERK) serve as loadingcontrols.
Singh et al. Page 26
Cancer Cell. Author manuscript; available in PMC 2010 June 2.
NIH
-PA Author Manuscript
NIH
-PA Author Manuscript
NIH
-PA Author Manuscript

Figure 7. Expression of K-Ras dependency genes is associated with a well differentiated tumorphenotype(A) The Ras Dependency Score, a measure of average median centered gene expression valuesof the top ranking K-Ras dependency signature genes, is shown as a function of histologicgrading and K-Ras mutation status in a panel of human lung cancer specimens. Greenbars=K-Ras mutant tumors, and red bars=tumors with wild-type K-Ras (WT).(B) Hierarchical clustering analysis of gene expression profiles of K-Ras dependency signaturegenes from the same panel of human lung cancer specimens as in Figure 7A. Two major clustersof overexpressed genes show enrichment for either well-differentiated adenocarcinomas orsquamous cell carcinomas, with 9 of 11 K-Ras mutant tumors falling within the well-differentiated adenocarcinoma cluster. Genes differentially expressed in well-differentiatedadenocarcinomas are listed and ITGB6 and MST1R, two characterized genes, are highlightedin green.
Singh et al. Page 27
Cancer Cell. Author manuscript; available in PMC 2010 June 2.
NIH
-PA Author Manuscript
NIH
-PA Author Manuscript
NIH
-PA Author Manuscript

(C) Expression of integrin β6, as assessed by immunohistochemistry in normal mousepancreatic tissue versus mutant K-Ras driven pancreatic cancers (PDACs), that were classifiedas either poorly or well-differentiated, based on glandular ductal morphology. Sections wereco-stained with hematoxylin. The field shown is representative of 5 high-power fields fromindependent mouse tumors. The upper and lower panels are shown at 125X magnification, andthe middle panel is shown at 250X. Scale bars = 50 μM.
Singh et al. Page 28
Cancer Cell. Author manuscript; available in PMC 2010 June 2.
NIH
-PA Author Manuscript
NIH
-PA Author Manuscript
NIH
-PA Author Manuscript
NIH
-PA Author Manuscript
NIH
-PA Author Manuscript
NIH
-PA Author Manuscript
Singh et al. Page 29
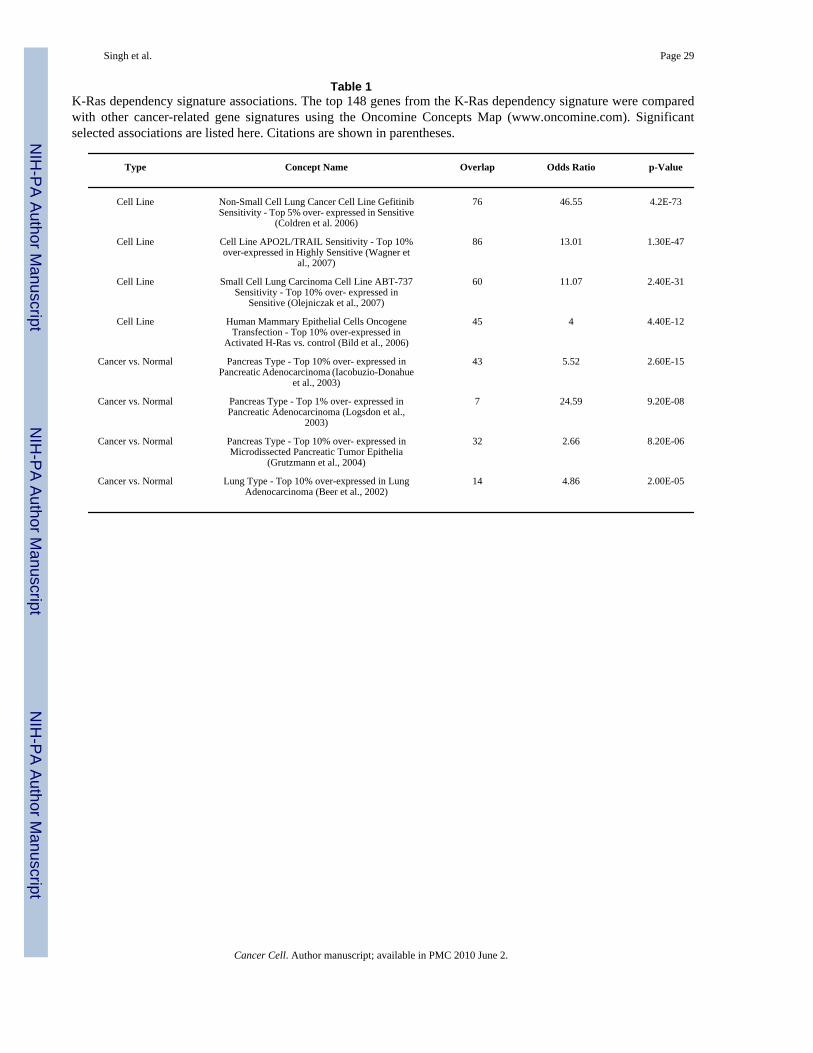
Table 1K-Ras dependency signature associations. The top 148 genes from the K-Ras dependency signature were comparedwith other cancer-related gene signatures using the Oncomine Concepts Map (www.oncomine.com). Significantselected associations are listed here. Citations are shown in parentheses.
Type Concept Name Overlap Odds Ratio p-Value
Cell Line Non-Small Cell Lung Cancer Cell Line GefitinibSensitivity - Top 5% over- expressed in Sensitive
(Coldren et al. 2006)
76 46.55 4.2E-73
Cell Line Cell Line APO2L/TRAIL Sensitivity - Top 10%over-expressed in Highly Sensitive (Wagner et
al., 2007)
86 13.01 1.30E-47
Cell Line Small Cell Lung Carcinoma Cell Line ABT-737Sensitivity - Top 10% over- expressed in
Sensitive (Olejniczak et al., 2007)
60 11.07 2.40E-31
Cell Line Human Mammary Epithelial Cells OncogeneTransfection - Top 10% over-expressed in
Activated H-Ras vs. control (Bild et al., 2006)
45 4 4.40E-12
Cancer vs. Normal Pancreas Type - Top 10% over- expressed inPancreatic Adenocarcinoma (Iacobuzio-Donahue
et al., 2003)
43 5.52 2.60E-15
Cancer vs. Normal Pancreas Type - Top 1% over- expressed inPancreatic Adenocarcinoma (Logsdon et al.,
2003)
7 24.59 9.20E-08
Cancer vs. Normal Pancreas Type - Top 10% over- expressed inMicrodissected Pancreatic Tumor Epithelia
(Grutzmann et al., 2004)
32 2.66 8.20E-06
Cancer vs. Normal Lung Type - Top 10% over-expressed in LungAdenocarcinoma (Beer et al., 2002)
14 4.86 2.00E-05
Cancer Cell. Author manuscript; available in PMC 2010 June 2.
Copyright © 2022 FDOKUMEN