Food Addiction and Eating Addiction - MDPI
180
Food Addiction and Eating Addiction Scientific Advances and Their Clinical, Social and Policy Implications Printed Edition of the Special Issue Published in Nutrients www.mdpi.com/journal/nutrients Adrian Carter, Tracy Burrows and Charlotte Hardman Edited by
-
Upload
khangminh22 -
Category
Documents
-
view
0 -
download
0
Transcript of Food Addiction and Eating Addiction - MDPI

Food Addiction and Eating AddictionScientific Advances and Their Clinical, Social and Policy Implications
Printed Edition of the Special Issue Published in Nutrients
www.mdpi.com/journal/nutrients
Adrian Carter, Tracy Burrows and Charlotte HardmanEdited by
Food Addiction and Eating Addiction • Adrian Carter, Tracy Burrows and Charlotte H
ardman

Food Addiction and Eating Addiction


Food Addiction and Eating Addiction: Scientific Advances and Their Clinical, Social and Policy Implications
Special Issue Editors
Adrian Carter
Tracy Burrows
Charlotte Hardman
MDPI • Basel • Beijing • Wuhan • Barcelona • Belgrade • Manchester • Tokyo • Cluj • Tianjin

Special Issue Editors
Adrian Carter
Monash University
Australia
Tracy Burrows University of Newcastle Australia
Charlotte Hardman University of Liverpool UK
Editorial Office
MDPI
St. Alban-Anlage 66
4052 Basel, Switzerland
This is a reprint of articles from the Special Issue published online in the open access journal
Nutrients (ISSN 2072-6643) (available at: https://www.mdpi.com/journal/nutrients/special issues/
Food Addiction Eating Addiction).
For citation purposes, cite each article independently as indicated on the article page online and as
indicated below:
LastName, A.A.; LastName, B.B.; LastName, C.C. Article Title. Journal Name Year, Article Number,
Page Range.
ISBN 978-3-03936-358-2 (Pbk)
ISBN 978-3-03936-359-9 (PDF)
c© 2020 by the authors. Articles in this book are Open Access and distributed under the Creative
Commons Attribution (CC BY) license, which allows users to download, copy and build upon
published articles, as long as the author and publisher are properly credited, which ensures maximum
dissemination and a wider impact of our publications.
The book as a whole is distributed by MDPI under the terms and conditions of the Creative Commons
license CC BY-NC-ND.

Contents
About the Special Issue Editors . . . . . . . . . . . . . . . . . . . . . . . . . . . . . . . . . . . . . vii
Adrian Carter, Charlotte A. Hardman and Tracy Burrows
Food Addiction and Eating Addiction: Scientific Advances and Their Clinical, Socialand Policy ImplicationsReprinted from: Nutrients 2020, 12, 1485, doi:10.3390/nu12051485 . . . . . . . . . . . . . . . . . . 1
May Thet Khine, Atsuhiko Ota, Ashley N. Gearhardt, Akiko Fujisawa, Mamiko Morita,
Atsuko Minagawa, Yuanying Li, Hisao Naito and Hiroshi Yatsuya
Validation of the Japanese Version of the Yale Food Addiction Scale 2.0 (J-YFAS 2.0)Reprinted from: Nutrients 2019, 11, 687, doi:10.3390/nu11030687 . . . . . . . . . . . . . . . . . . . 5
Kirrilly M. Pursey, Oren Contreras-Rodriguez, Clare E. Collins, Peter Stanwell and Tracy L. Burrows
Food Addiction Symptoms and Amygdala Response in Fasted and Fed StatesReprinted from: Nutrients 2019, 11, 1285, doi:10.3390/nu11061285 . . . . . . . . . . . . . . . . . . 19
Shanon L. Casperson, Lisa Lanza, Eram Albajri and Jennifer A. Nasser
Increasing Chocolate’s Sugar Content Enhances Its Psychoactive Effects and IntakeReprinted from: Nutrients 2019, 11, 596, doi:10.3390/nu11030596 . . . . . . . . . . . . . . . . . . . 29
Siddharth Sarkar, Kanwal Preet Kochhar and Naim Akhtar Khan
Fat Addiction: Psychological and Physiological TrajectoryReprinted from: Nutrients 2019, 11, 2785, doi:10.3390/nu11112785 . . . . . . . . . . . . . . . . . . 41
Rachel C. Adams, Jemma Sedgmond, Leah Maizey, Christopher D. Chambers and Natalia S. Lawrence
Food Addiction: Implications for the Diagnosis and Treatment of OvereatingReprinted from: Nutrients 2019, 11, 2086, doi:10.3390/nu11092086 . . . . . . . . . . . . . . . . . . 57
Susana Jimenez-Murcia, Zaida Ag uera, Georgios Paslakis, Lucero Munguia, Roser Granero, Jessica Sanchez-Gonzalez, Isabel Sanchez, Nadine Riesco, Ashley N Gearhardt, Carlos Dieguez, et al.
Food Addiction in Eating Disorders and Obesity: Analysis of Clusters and Implications for TreatmentReprinted from: Nutrients 2019, 11, 2633, doi:10.3390/nu11112633 . . . . . . . . . . . . . . . . . . 93
Laurence J. Nolan and Steve M. Jenkins
Food Addiction Is Associated with Irrational Beliefs via Trait Anxiety and Emotional EatingReprinted from: Nutrients 2019, 11, 1711, doi:10.3390/nu11081711 . . . . . . . . . . . . . . . . . . 109
Stephanie E. Cassin, Daniel Z. Buchman, Samantha E. Leung, Karin Kantarovich, Aceel Hawa, Adrian Carter and Sanjeev Sockalingam
Ethical, Stigma, and Policy Implications of Food Addiction: A Scoping ReviewReprinted from: Nutrients 2019, 11, 710, doi:10.3390/nu11040710 . . . . . . . . . . . . . . . . . . . 123
Helen K. Ruddock, Michael Orwin, Emma J. Boyland, Elizabeth H. Evans and Charlotte A. Hardman
Obesity Stigma: Is the ‘Food Addiction’ Label Feeding the Problem?Reprinted from: Nutrients 2019, 11, 2100, doi:10.3390/nu11092100 . . . . . . . . . . . . . . . . . . 141
v

Kerry S. O’Brien, Rebecca M. Puhl, Janet D. Latner, Dermot Lynott, Jessica D. Reid, Zarina Vakhitova, John A. Hunter, Damian Scarf, Ruth Jeanes, Ayoub Bouguettaya and Adrian Carter
The Effect of a Food Addiction Explanation Model for Weight Control and Obesity on Weight StigmaReprinted from: Nutrients 2020, 12, 294, doi:10.3390/nu12020294 . . . . . . . . . . . . . . . . . . . 159
vi

About the Special Issue Editors
Adrian Carter (Ph.D.): Associate Professor Adrian Carter is an NHMRC Research Fellow and Director, Community Engagement and Neuroethics, Turner Institute for Brain and Mental Health, Monash University. He is also: Director, Neuroethics Program, ARC Centre of Excellence for Integrative Brain Function; Co-Chair, Neuroethics and Responsible Research and Innovation Committee, Australian Brain Alliance; Co-Editor-in-Chief, Neuroethics (Springer); and sits on the Board of Directors, International Neuroethics Society. His research examines the impact of neuroscience on our understanding and treatment of mental and neurological disorders. Dr Carter has been an advisor to the WHO, OECD, European Monitoring Centre for Drugs and Drug Addiction, and United Nations Office on Drugs and Crime.
Tracy Burrows (Ph.D.): Associate Professor Tracy Burrows is a NHMRC Research Fellow at The University of Newcastle and a researcher at the Hunter Medical Research Institute. She is recognized as a Fellow of the Dietitians Association of Australia. Her research focuses on understanding eating behavior with an interest in mental health populations, dietary assessment and weight management.
Charlotte Hardman (Ph.D.): Dr Charlotte Hardman is a Senior Lecturer in the University of Liverpool. She is also: Fellow of the Higher Education Academy (FHEA); Co-ordinator of the North West Network of the UK Association for the Study of Obesity; and Advisory Editor for the journal Appetite. Her research focuses on the psychology of food-related behaviour and the application of this knowledge to interventions for behaviour change. She has received research funding from UK Research and Innovation, the European Commission, and the Wellcome Trust. She has published over 60 peer-reviewed articles in high-impact journals such as JAMA Psychiatry, Nature Reviews Endocrinology and the International Journal of Obesity.
vii


nutrients
Editorial
Food Addiction and Eating Addiction:Scientific Advances and Their Clinical, Socialand Policy Implications
Adrian Carter 1,*, Charlotte A. Hardman 2 and Tracy Burrows 3
1 School of Psychological Sciences and the Turner Institute for Brain and Mental Health, Monash University,Clayton, VIC 3800, Australia
2 Department of Psychology, University of Liverpool, Liverpool L69 7ZA, UK;[email protected]
3 School of Health Sciences, Faculty of Health, University of Newcastle, Newcastle, NSW 2308, Australia;[email protected]
* Correspondence: [email protected]; Tel.: +61-3-9902-9431
Received: 1 May 2020; Accepted: 14 May 2020; Published: 20 May 2020
There is a growing understanding within the literature that certain foods, particularly those high inrefined sugars and fats, may have addictive potential for some individuals. Moreover, individualswho are overweight and have obesity display dietary intake patterns that resemble the ways inwhich individuals with substance use disorders consume addictive drugs. While food addictionis not yet recognized in the Diagnostic and Statistical Manual of Mental Disorders, Fifth Edition(DSM-5), there are many similarities with substance use disorders, and a growing acceptance thatsome forms of obesity should be treated as a food addiction. Despite growing research in this area,there remain many unresolved questions about the science of food addiction and its potential impactupon: how we treat overweight and overeating; stigmatization and discrimination of people who areoverweight; internalized weight bias and treatment seeking; as well as policies to reduce excess weightand overeating.
This interdisciplinary special issue collects 10 articles, including reviews and original research,that further our understanding and application of the science of addictive eating. These papers span abroad range of areas, including basic science, clinical assessment tools, neural responses to addictivefoods, as well as insights into future treatments and public health policies, and the possible stigmaassociated with food addiction.
1. Validation of Food Addiction Scales
Validation of the Japanese Version of the Yale Food Addiction Scale 2.0 (J-YFAS 2.0)
The Yale Food Addiction Scale (YFAS) is the most widely used diagnostic tool for food addiction,and has been translated into numerous languages, including Italian, French, German, Spanish,Arabic Chinese and Turkish. In this special issue, Khine and colleagues [1] describe the translationand validation of the Japanese version of the Yale Food Addiction Scale 2.0 (J-YFAS 2.0), carried outin 731 undergraduate students. The J-YFAS 2.0 has a one-factor structure and adequate convergentvalidity and reliability, similar to the YFAS 2.0 in other languages. Prevalence of J-YFAS 2.0-diagnosedmild, moderate, and severe food addiction was 1.1%, 1.2%, and 1.0% respectively.
2. Neural Responses Underlying Food Addiction
2.1. Food Addiction Symptoms and Amygdala Response in Fasted and Fed States
Pursey et al. [2] conducted a small pilot study to explore the association between food addictionsymptoms and activation in the basolateral amygdala and central amygdala. 12 females, aged 24.1 ± 2.6 years,
Nutrients 2020, 12, 1485; doi:10.3390/nu12051485 www.mdpi.com/journal/nutrients1

Nutrients 2020, 12, 1485
completed two functional magnetic resonance imaging (fMRI) scans (fasted and fed) while viewinghigh-calorie food images and low-calorie food images. Food addiction symptoms were assessed usingthe Yale Food Addiction Scale. Participants had a mean BMI of 27.4 ± 5.0 kg/m2, and food addictionsymptom score of 4.1 ± 2.2. The results found a significant positive association, between food addictionsymptoms, and higher activation of the left basolateral amygdala to high-calorie versus low-caloriefoods in the fasted session, but not the fed session. There were no significant associations with thecentral amygdala in either session.
2.2. Increasing Chocolate’s Sugar Content Enhances Its Psychoactive Effects and Intake
This study by Caperson and colleagues explored the potential psychoactive effect of chocolate [3].Participants consumed 5 g of a commercially available chocolate with increasing amounts of sugar (90%cocoa, 85% cocoa, 70% cocoa, and milk chocolate). After each chocolate sample, participants completedthe Psychoactive Effects Questionnaire (PEQ) and the Binge Eating Scale (BES). Participants werealso allowed to eat as much as they wanted of each of the different chocolates. Casperson et al. [3]found that the excitement subscale of the PEQ increased (relative to baseline) after the 90% cocoa.The Morphine–Benzedrine Group subscale (containing questions about wellbeing and euphoria) andthe Morphine subscale (focusing on attitudes and physical sensations) increased after the 85th cocoasample. This suggests incremental increases in the sugar content of chocolate has a psychoactive effectwhich enhances the addictive-like eating response.
3. Implications for Treatment
3.1. Food Addiction: Implications for the Diagnosis and Treatment of Overeating
The validity of a food addiction diagnosis remains controversial, despite a growing body ofpreclinical, neurobiological and clinical evidence supporting it. This literature review discusses theDSM-5 diagnostic criteria for substance use disorders, to summarize evidence for food addiction.Adams and colleagues [4] concluded that there is evidence to suggest that, for some individuals,food can induce addictive-type behaviors similar to those seen with other addictive substances.However, as several DSM-5 criteria have limited application to overeating, they argue that the term‘food addiction’ is likely to apply only in a minority of cases. Research investigating the underlyingpsychological causes of overeating within the context of food addiction has also led to some noveltreatment approaches, such as cognitive training tasks and neuro-modulation interventions.
3.2. Food Addiction in Eating Disorders and Obesity: Analysis of Clusters and Implications for Treatment
This study by Jimenez-Murcia et al. [5] identified three distinct clusters of food addiction in thosewith eating disorders and obesity. The study was conducted in 234 participants who scored positiveon the Yale Food Addiction Scale 2.0. Cluster 1, classified as “dysfunctional”, was associated withthe highest prevalence of other specified feeding or eating disorders and bulimia nervosa, as well asthe highest eating disorder severity and psychopathology, and more dysfunctional personality traits.Cluster 2, classified as “moderate”, was associated with high prevalence of bulimia nervosa and bingeeating disorders, and moderate levels of eating disorder psychopathology. Cluster 3, classified as“adaptive”, was characterized by high prevalence of obesity and binge eating disorders, low levelsof eating disorder psychopathology and more functional personality traits. The authors suggest thatthe identification of types of food addiction traits may allow for more personalized treatment toimprove outcomes.
3.3. Food Addiction Is Associated with Irrational Beliefs via Trait Anxiety and Emotional Eating
Irrational beliefs are believed to be one of the prime causes of psychopathologies, includinganxiety and depression. A study of 239 adults by Nolan and colleagues [6] investigated whetherfood addiction and emotional eating are associated with irrational beliefs. Questionnaires measuring
2

Nutrients 2020, 12, 1485
food addiction, irrational beliefs, emotional eating, depression, trait anxiety, and anthropometry wereassessed and reported. They found that irrational beliefs were significantly positively correlated withfood addiction, emotional eating, depression and trait anxiety. Results also showed that irrationalbeliefs were associated with higher food addiction via higher trait anxiety and emotional eating actingin a serial pathway. As such, targeting irrational beliefs as a treatment in individuals who experiencefood addiction and emotional eating may be a reasonable approach for clinicians.
3.4. Fat Addiction: Psychological and Physiological Trajectory
A number of recent studies have attempted to parse out the psychological and physiologicaletiology of food addiction. This review article by Sarkar et al. [7] examines the specific role of dietaryfats in compulsive overeating. They review preclinical, psychological and clinical evidence to argue forthe addiction to fat rich diets as a prominent subset of food addiction. They then discuss the clinicalimplications of “fat addiction” for society.
4. Associations between Food Addiction, Stigma and Public Policy
4.1. Ethical, Stigma, and Policy Implications of Food Addiction: A Scoping Review
This scoping review by Cassin and colleagues [8] examines the potential ethical, stigma and healthpolicy implications of food addiction described in the current literature. Their findings suggest that theliterature on potential ethical implications was mostly focused on debates regarding individualizedresponsibility and sources for blame. Potential stigma focused on evidence of internalized andexternalized stigma when food addiction is used as the explanation for obesity. The policy implicationsof food addiction largely drew on comparisons with the historic regulation of the tobacco industryto manage food addiction in policy, and the current challenges in classifying foods in terms of theiraddictive potential.
4.2. Obesity Stigma: Is the ‘Food Addiction’ Label Feeding the Problem?
There is significant debate around whether describing someone as addicted to food would increaseor decrease weight-based stigma. Ruddock et al. [9] examined the effect of the food addiction labelon stigmatizing attitudes towards an individual with obesity, and towards people with obesity moregenerally (i.e., general stigma). They presented the results of two online studies, where participants(n = 439, n = 523) read a short description about a woman described as ‘very overweight’. They foundthat a food addiction label may exacerbate stigmatizing attitudes towards an individual with obesity.However, the label appears to have no effect on general weight-based stigma. Stigmatizing attitudestowards people with obesity also appeared to be more pronounced in individuals with low levels ofaddiction-like eating behaviors, compared to high levels of addiction-like eating.
4.3. The Effect of a Food Addiction Explanation Model for Weight Control and Obesity on Weight Stigma
In the final paper of this special issue, O’Brien and colleagues [10] reported on two experimentalstudies examining the impact of a food addiction model of obesity and weight control on weightstigma. In both experiments, participants were randomized to receive one of two newspaper articles:one describing obesity as the result of a brain-based food addiction, and the other describing obesityas the result of diet and exercise. The food addiction explanation for weight control and obesitydid not increase weight stigma, and resulted in lower stigma than the diet and exercise explanation,which attributes obesity to personal control. Their findings highlight the need for evidence-basedhealth messaging about the causes of obesity, and the need for communications that do not exacerbateweight stigma.
Author Contributions: T.B. developed an initial draft of the manuscript that was updated by A.C. All authorsrevised the final manuscript. All authors have read and agreed to the published version of the manuscript.
3
Nutrients 2020, 12, 1485
Funding: This research received no external funding.
Conflicts of Interest: The authors declare no conflict of interest.
References
1. Khine, M.T.; Ota, A.; Gearhardt, A.N.; Fujisawa, A.; Morita, M.; Minagawa, A.; Li, Y.; Naito, H.; Yatsuya, H.Validation of the Japanese Version of the Yale Food Addiction Scale 2.0 (J-YFAS 2.0). Nutrients 2019, 11, 687.[CrossRef] [PubMed]
2. Pursey, K.M.; Contreras-Rodriguez, O.; Collins, C.E.; Stanwell, P.; Burrows, T.L. Food Addiction Symptomsand Amygdala Response in Fasted and Fed States. Nutrients 2019, 11, 1285. [CrossRef]
3. Casperson, S.L.; Lanza, L.; Albajri, E.; Nasser, J.A. Increasing Chocolate’s Sugar Content Enhances ItsPsychoactive Effects and Intake. Nutrients 2019, 11, 596. [CrossRef]
4. Adams, R.C.; Sedgmond, J.; Maizey, L.; Chambers, C.D.; Lawrence, N.S. Food Addiction: Implications forthe Diagnosis and Treatment of Overeating. Nutrients 2019, 11, 2086. [CrossRef] [PubMed]
5. Jiménez-Murcia, S.; Agüera, Z.; Paslakis, G.; Munguia, L.; Granero, R.; Sánchez-González, J.; Sánchez, I.;Riesco, N.; Gearhardt, A.N.; Dieguez, C.; et al. Food Addiction in Eating Disorders and Obesity: Analysis ofClusters and Implications for Treatment. Nutrients 2019, 11, 2633. [CrossRef] [PubMed]
6. Nolan, L.; Jenkins, S. Food Addiction Is Associated with Irrational Beliefs via Trait Anxiety and EmotionalEating. Nutrients 2019, 11, 1711. [CrossRef] [PubMed]
7. Sarkar, S.; Kochhar, K.P.; Khan, N.A. Fat Addiction: Psychological and Physiological Trajectory. Nutrients2019, 11, 2785. [CrossRef] [PubMed]
8. Cassin, S.E.; Buchman, D.Z.; Leung, S.E.; Kantarovich, K.; Hawa, A.; Carter, A.; Sockalingam, S. Ethical,Stigma, and Policy Implications of Food Addiction: A Scoping Review. Nutrients 2019, 11, 710. [CrossRef][PubMed]
9. Ruddock, H.K.; Orwin, M.; Boyland, E.J.; Evans, E.H.; Hardman, C.A. Obesity Stigma: Is the ‘Food Addiction’Label Feeding the Problem? Nutrients 2019, 11, 2100. [CrossRef] [PubMed]
10. O’Brien, K.S.; Puhl, R.M.; Latner, J.D.; Lynott, D.; Reid, J.D.; Vakhitova, Z.; Bouguettaya, A. The Effect of aFood Addiction Explanation Model for Weight Control and Obesity on Weight Stigma. Nutrients 2020, 12,294. [CrossRef] [PubMed]
© 2020 by the authors. Licensee MDPI, Basel, Switzerland. This article is an open accessarticle distributed under the terms and conditions of the Creative Commons Attribution(CC BY) license (http://creativecommons.org/licenses/by/4.0/).
4

nutrients
Article
Validation of the Japanese Version of the Yale FoodAddiction Scale 2.0 (J-YFAS 2.0)
May Thet Khine 1, Atsuhiko Ota 1,*, Ashley N. Gearhardt 2, Akiko Fujisawa 1, Mamiko Morita 3,
Atsuko Minagawa 3, Yuanying Li 1, Hisao Naito 1 and Hiroshi Yatsuya 1
1 Department of Public Health, Fujita Health University School of Medicine, 1-98 Dengakugakubo,Kutsukake-cho, Toyoake, Aichi 470-1192, Japan; [email protected] (M.T.K.); [email protected] (A.F.);[email protected] (Y.L.); [email protected] (H.N.); [email protected] (H.Y.)
2 Department of Psychology, University of Michigan, 2268 East Hall, 530 Church Street,Ann Arbor, MI 48109, USA; [email protected]
3 Faculty of Nursing, Fujita Health University School of Health Sciences, 1-98 Dengakugakubo,Kutsukake-cho, Toyoake, Aichi 470-1192, Japan; [email protected] (M.M.);[email protected] (A.M.)
* Correspondence: [email protected]; Tel.: +81-562-93-2453; Fax: +81-562-93-3079
Received: 9 February 2019; Accepted: 19 March 2019; Published: 22 March 2019
Abstract: The Yale Food Addiction Scale 2.0 (YFAS 2.0) is used for assessing food addiction(FA). Our study aimed at validating its Japanese version (J-YFAS 2.0). The subjects included731 undergraduate students. Confirmatory factor analysis indicated the root-mean-square errorof approximation, comparative fit index, Tucker–Lewis index, and standardized root-mean-squareresidual were 0.065, 0.904, 0.880, and 0.048, respectively, for a one-factor structure model.Kuder–Richardson α was 0.78. Prevalence of the J-YFAS 2.0-diagnosed mild, moderate, and severeFA was 1.1%, 1.2%, and 1.0%, respectively. High uncontrolled eating and emotional eating scores ofthe 18-item Three-Factor Eating Questionnaire (TFEQ R-18) (p < 0.001), a high Kessler PsychologicalDistress Scale score (p < 0.001), frequent desire to overeat (p = 0.007), and frequent snacking (p = 0.003)were associated with the J-YFAS 2.0-diagnosed FA presence. The scores demonstrated significantcorrelations with the J-YFAS 2.0-diagnosed FA symptom count (p < 0.01). The highest attained bodymass index was associated with the J-YFAS 2.0-diagnosed FA symptom count (p = 0.026). The TFEQR-18 cognitive restraint score was associated with the J-YFAS 2.0-diagnosed FA presence (p < 0.05)and symptom count (p < 0.001), but not with the J-YFAS 2.0-diagnosed FA severity. Like the YFAS2.0 in other languages, the J-YFAS 2.0 has a one-factor structure and adequate convergent validityand reliability.
Keywords: food addiction; Japan; validation; Yale Food Addiction Scale 2.0
1. Introduction
The idea of food addiction (FA) is receiving increased interest [1]. Evidence is emerging thatcertain types of foods (e.g., highly processed foods with high levels of refined carbohydrates and/oradded fat) may be capable of triggering addictive-like eating behaviors (e.g., loss of control, withdrawal,and cravings) in some individuals, which can lead to significant impairment or distress, [2,3].Obesity and eating disorders such as bulimia nervosa (BN), binge eating disorders (BED), along withpsychiatric disorders such as depression, posttraumatic stress disorder, attention-deficit hyperactivitydisorder, have been reported as potential correlates with FA [4–6]. Relevant pharmacological findingshave been reported. Highly processed sweetened and fatty foods trigger a rewarding effect throughthe release of dopamine [7]. Repeated eating of hyper-palatable food down-regulates the dopaminergicresponse, resulting in impulsive and compulsive responses to food cues [8]. Food craving—an intense
Nutrients 2019, 11, 687; doi:10.3390/nu11030687 www.mdpi.com/journal/nutrients5

Nutrients 2019, 11, 687
desire to eat a specific food—activates the hippocampus, insula, and caudate nucleus, similar to drugcraving [9]. On the other hand, there has been a lot of debate regarding the extent to which food can beaddictive in the same way as drugs. Controversies exist, for instance, as to whether FA represents aspecific construct as addiction that is distinct from other eating disorders, such as BED, and whetherneurobiological changes underlying FA behaviors are sufficiently ascertained in humans [10,11].
The Yale Food Addiction Scale (YFAS) is the most commonly used measure to assess FA,although FA is not included in the Diagnostic and Statistical Manual of Mental Disorders, 5th edition(DSM-5) [12] and controversy exists regarding its definition [11]. The original YFAS applies the DSM4th edition (DSM-IV) diagnostic criteria for substance dependence to the consumption of highlypalatable foods (e.g., chocolate, ice cream, and pizza) [13,14]. Later, the scale was replaced with the YaleFood Addiction Scale 2.0 (YFAS 2.0) in response to the revision of the Substance-Related and AddictiveDisorders criteria in the DSM-5 [15]. The YFAS 2.0 additionally introduced the following four diagnosticcriteria: craving, use despite interpersonal or social consequences, failure in role obligations, and use inphysically hazardous situations. It also introduced a severity classification. The YFAS 2.0 is availablenot only in English but also in German, French, Italian, Spanish, and Arabic [16–20]. The YFAS 2.0exhibits good internal consistency, as well as convergent, discriminant, and incremental validity [15–20].Associations of the YFAS-diagnosed FA with obesity, eating disorders, and psychiatric disorders havebeen accumulated. The YFAS 2.0-defined FA prevalence is supposed to draw a J-shape curve accordingto body mass index (BMI): 3.3–15.8% in healthy general populations [15–20], 17.2–47.4% in obesepopulation [16,21], and 15.0% in underweight population [21]. Women and patients with eatingdisorders (BN and BED) and mental disorders (depression, sleep disturbance, and general psychiatricstatus) were more likely to have FA diagnosed with the YFAS 2.0 [15,17–19].
The current study aimed to validate the Japanese version of YFAS 2.0 (J-YFAS 2.0). Scant evidenceregarding FA is available in Asia. The previous version of YFAS was translated into Chinese [22,23]and Malay [24]. Using these questionnaires, researchers reported that a FA diagnosis was assignedto 6.9–9.2% of Chinese teenage students [22,23] and 10.4% of Malay obese adults [24]. FA prevalencein Japan has not been reported so far, to the best of our knowledge. The YFAS 2.0 has not yet beentranslated into Asian languages. Development of the J-YFAS 2.0 enables examining the FA prevalencein Japan, comparing it with other countries and regions, and exploring the mechanism of FA. Referringto previous research [15–19], we hypothesized that (1) the J-YFAS has a one-factorial structure forthe 11 J-YFAS 2.0 diagnostic criteria (structural validity); (2) underweight, overweight, obesity,uncontrolled and emotional eating, frequent desire to overeat, frequent snacking, and mood andanxiety disorders are associated with the J-YFAS 2.0-diagnosed FA (convergent validity); (3) cognitiverestraint in eating is not associated with the J-YFAS 2.0-diagnosed FA (discriminant validity); and (4)the internal consistency is good for the 11 J-YFAS 2.0 diagnostic criteria (reliability).
2. Subjects and Methods
2.1. Study Design
We employed a cross-sectional design. All data were collected from a questionnaire survey.The present study was completed in accordance with the Declaration of Helsinki and the EthicalGuidelines for Medical and Health Research Involving Human Subjects established by the Ministryof Education, Culture, Sports, Science and Technology and the Ministry of Health, Labour andWelfare, Japan. We obtained the approval by the Ethics Review Committee of Fujita HealthUniversity, Japan (HM17-110 and HM18-155). All subjects provided their informed written consent forparticipation in the present study.
2.2. Subjects
This study was conducted with a convenience sample of undergraduate students from a privatemedical and health science university in Japan. The authors (A.O., M.M., and A.M.) explained the
6

Nutrients 2019, 11, 687
study purpose and methods to the students in the classes. Paper-based questionnaires were thendistributed. Of the 759 students to whom the questionnaires were distributed, 752 (99%) were returned.Those who did not provide informed consent (n = 2) and who did not fully complete the J-YFAS 2.0(n = 18) were excluded from the analysis. One student who replied to experience desire to overeat50 times per week was excluded as this reply was a significant outlier. Consequently, we retained theremaining 731 students (96%) as the subjects.
2.3. J-YFAS 2.0
As with the YFAS 2.0 [15], the J-YFAS 2.0 is a 35-item self-administered questionnaire (Table S1).It assesses food consumption during the past 12 months. A Likert-scale ranging from 0 (never)through 7 (every day) is employed as a response option for each item. The items assess clinicalimpairment/distress and the following 11 diagnostic criteria: (1) eating larger amounts for a longerperiod than intended (consumed more than intended); (2) persistent desire or repeated unsuccessfulattempts to quit eating (unable to cut down or stop); (3) spending considerable time or activity obtainingor eating food or recovering from eating (great deal of time spent); (4) giving up or reducing importantsocial, occupational, or recreational activities due to eating (important activities given up); (5) continuedeating despite knowledge of adverse consequences (use despite physical/emotional consequences);(6) development of tolerance (tolerance); (7) characteristic withdrawal symptoms (withdrawal);(8) continued eating despite interpersonal or social problems (use despite interpersonal/socialproblems); (9) failure to fulfil major role obligation at work, school, and home due to eating (failure inrole obligation); (10) eating even in physically hazardous situations (use in physically hazardoussituations); and (11) craving, strong desire, or urge for certain foods (craving). Each item is scoreddichotomously based on the threshold determined by the YFAS 2.0 validation paper [15]. If anyitem that corresponds to the diagnostic criteria or clinical severity meets the clinical threshold, thiscriterion is endorsed. There are two scoring methods: the symptom count and the diagnostic threshold.For the symptom count scoring method, the diagnostic criteria for which the subjects meet are summedtogether. For the diagnostic threshold, the clinically significant impairment/distress criterion has tobe met and two or more diagnostic criteria have to be met. The J-YFAS 2.0 FA diagnostic severityis classified as mild (2–3 criteria met plus impairment/distress), moderate (4–5 criteria met plusimpairment/distress), and severe (6–11 criteria met plus impairment/distress).
For the development of the J-YFAS 2.0, the original English YFAS 2.0 [15] was translated intoJapanese by the three Japanese authors (A.O., A.F., and H.Y.) and back-translated into English byan external professional translator who had no previous knowledge of the YFAS 2.0. Discrepanciesbetween the back-translation and the original were resolved by consensus amongst the three Japaneseauthors and an American author (A.N.G.), who developed the original YFAS 2.0. We added two foodexamples, wagashi (Japanese traditional confectionery) and instant noodles (as salty snacks), in theintroductory part, considering that food preference in Japan differs from western countries.
2.4. Variables for Convergent and Discriminant Validity
2.4.1. Body Mass Index (BMI)
Each subject self-reported their current and highest attained BMI. The questionnaire included atable indicating BMI from the weights and heights so that the subjects could choose their BMI fromthe following options: <16.0, 16.0–16.9, 17.0–18.4, 18.5–22.9, 23.0–24.9, 25.0–29.9, and ≥30.0 kg/m2.No one chose <16.0 kg/m2 for their current or highest attained BMI.
It was reported that Japanese tended to under-report their body weights and the tendencywas more prominent among those with high BMI than those with low BMI [25]. We arranged thecategorical response options for BMI to minimize the shame that subjects may feel for self-reportingtheir actual BMI.
7

Nutrients 2019, 11, 687
2.4.2. Three-Factor Eating Questionnaire Revised 18-Item Version (TFEQ R-18)
The TFEQ R-18 is a self-assessment tool used to measure the following three types of eatingbehaviors: Cognitive restraint, uncontrolled eating, and emotional eating [26]. Cognitive restraint is acontrol over food intake in order to influence body weight and body shape [26]. Uncontrolled eating isa tendency to overeat food with the feeling of being out of control [27]. Emotional eating is a tendencyto eat in response to negative emotions [27]. The higher the score is, the greater the levels of cognitiverestraint, uncontrolled eating, and emotional eating are. We chose the corresponding items for thecurrent study from the Japanese version of the original 51-item TFEQ [28].
2.4.3. Desire to Overeat
No validated questionnaire was available in Japanese to evaluate binge eating frequency. Thus,we asked the frequency of desiring to overeat with a single question, “How many times per weekdid you feel you wanted to eat more even after eating quite a lot of food during the last two hours?”The subjects filled in the number of the times.
2.4.4. Snacking Frequency
A frequency of snacking (eating and drinking outside of breakfast, lunch, or dinner) wasself-reported. No validated questionnaire was available in Japanese to evaluate the frequency ofsnacking. Thus, we developed a single question, “How many days per week are you snacking?” forthis evaluation. The subjects chose one of the following options: none, 2–3 days, 4–5 days, and almostevery day. The snack included foods and drinks that contained any calories. Zero-calorie drinks, suchas coffee and tea without milk and sugar, and vitamin and mineral supplements were excluded fromthe snack.
2.4.5. Kessler Psychological Distress Scale (K6)
The Japanese version of K6 was used as an indicator of mood and anxiety disorders [29]. A K6score of 13 or greater was regarded as having such disorders.
2.5. Statistical Analyses
Confirmatory factor analysis (CFA) was conducted to assess the one-factor structure for the 11J-YFAS 2.0 diagnostic criteria. Clinically significant impairment/distress was not included in this CFAanalysis. The model fit was evaluated with the root-mean-square error of approximation (RMSEA),comparative fit index (CFI), Tucker–Lewis index (TLI), and standardized root-mean-square residual(SRMR). For assessing the reliability, internal consistency was calculated for the 11 J-YFAS 2.0 diagnosticcriteria with Kuder–Richardson’s α (KR-20). Convergent and discriminant validity was examined withchi-square test, t-test, analysis of variance (ANOVA), and Spearman’s rank correlation. We examinedwhether the current and highest attained BMI, TFEQ R-18 cognitive restraint, uncontrolled eating,and emotional eating scores, frequency of desire to overeat, snacking frequency, and K6 score wereassociated with the J-YFAS 2.0-diagnosed FA. Not only the presence and severity (mild, moderate,and severe) but also the symptom count was used as the J-YFAS 2.0-diagnosed FA index, given thesmall numbers of subjects diagnosed as having FA. We could not apply the chi-square test to examinethe associations of BMI, high K6 score, and the snacking frequency with the J-YFAS 2.0-diagnosed FAseverity, since more than 20% of all cells had an expected frequency of less than five. Effect size indiceswere calculated [30–32]. Subjects with missing responses were excluded from the correspondinganalyses. SPSS version 23.0 (IBM, Armonk, NY, USA) and Amos Version 23.0 (IBM, Chicago, IL, USA)were used for statistical calculations.
8

Nutrients 2019, 11, 687
3. Results
3.1. Subjects’ Characteristics
Most subjects were women (78.5%, n = 574) (Table 1). The mean (standard deviation) age was20.8 (1.8) years. The years and majors included fourth-year medical technology students, first- tofourth-year nursing students, and third-year medical students. Around 80% of the subjects reportednormal-weight BMI, 18.5–24.9 kg/m2.
Table 1. Subject characteristics (n = 731).
Characteristics Frequency (%) or Mean (SD)
Sex
Men 156 (21.3%)Women 574 (78.5%)
Age (year) 20.8 (1.8)
Years and Majors
Fourth-year medical technology students 149 (20.4%)First-year nursing students 142 (19.4%)Second-year nursing students 132 (18.1%)Third-year medical students 111 (15.2%)Fourth-year nursing students 99 (13.5%)Third-year nursing students 98 (13.4%)
Current body mass index (BMI) (kg/m2)
16.0–16.9 17 (2.3%)17.0–18.4 108 (14.8%)18.5–22.9 521 (71.3%)23.0–24.9 57 (7.8%)25.0–29.9 21 (2.9%)30 and above 6 (0.8%)
Highest attained BMI (kg/m2) *
16.0–16.9 3 (0.4%)17.0–18.4 60 (8.2%)18.5–22.9 493 (67.4%)23.0–24.9 117 (16.0%)25.0–29.9 51 (7.0%)30 and above 7 (1.0%)
Kessler Psychological Distress Scale (K6) score 4.6 (4.5)
13 or greater 45 (6.2%)
Three-factor Eating Questionnaire-R 18 (TFEQ R-18) score
Cognitive restraint 37.0 (20.2)Uncontrolled eating 35.5 (19.9)Emotional eating 29.7 (27.5)
Desire to overeat 0.5 (1.0) (Range: 0–7)
Snacking frequency per week
None 89 (12.2%)2–3 days 276 (37.8%)4–5 days 157 (21.5%)Almost every day 208 (28.5%)
J-YFAS 2.0-diagnosed food addiction (FA)
No FA 707 (96.7%)Mild FA 8 (1.1%)Moderate FA 9 (1.2%)Severe FA 7 (1.0%)
SD: standard deviation. There were missing responses for sex (n = 1), age (n = 1), current BMI (n = 1), K6 (n = 4),the TFEQ R-18 cognitive restraint (n = 8), uncontrolled eating (n = 12), and emotional eating (n = 2), desire to overeat(n = 1), and snacking frequency (n = 1). * Highest attained BMI means the highest weight ever (when not pregnant)during the lifetime.
9

Nutrients 2019, 11, 687
3.2. CFA and Internal Consistency
The RMSEA, CFI, TLI, and SRMR were 0.065, 0.904, 0.880, and 0.048, respectively. One diagnosticcriterion (failure in role obligation) indicated a factor loading of 0.31 (Table 2). The other diagnosticcriteria had factor loadings of 0.41 or higher. The KR-20 was 0.78 for the 11 diagnostic criteria.
Table 2. Diagnostic criteria of the Japanese version of the Yale Food Addiction Scale 2.0 (n = 731).
Diagnostic Criteria Met Criteria Did Not Meet Criteria Factor Loading
Consumed more than intended 82 (11.2%) 649 (88.8%) 0.57 ***Unable to cut down or stop 124 (17.0%) 607 (83.0%) 0.52 ***
Great deal of time spent 30 (4.1%) 701 (95.9%) 0.45 ***Important activities given up 25 (3.4%) 706 (96.6%) 0.41 ***
Use despite physical/emotional consequences 45 (6.2%) 686 (93.8%) 0.55 ***Tolerance 31 (4.2%) 700 (95.8%) 0.50 ***
Withdrawal 90 (12.3%) 641 (87.7%) 0.62 ***Use despite interpersonal/social problems 98 (13.4%) 633 (86.6%) 0.54 ***
Failure in role obligation 29 (4.0%) 702 (96.0%) 0.31 ***Use in physically hazardous situations 42 (5.7%) 689 (94.3%) 0.56 ***
Craving 21 (2.9%) 710 (97.1%) 0.50 ***Impairment/distress 29 (4.0%) 702 (96.0%)
*** p < 0.001, calculated with confirmatory factor analysis.
3.3. J-YFAS 2.0-Diagnosed FA Prevalence
The mean J-YFAS 2.0-diagnosed FA symptom count was 0.84 (SD = 1.61; range = 0–11).The proportions of the subjects who met the threshold for each diagnostic criterion ranged from2.9–17.0% (Table 2). A total of 24 (3.3%) subjects were regarded as having FA: 8 (1.1%) received a mild,9 (1.2%) a moderate, and 7 (1.0%) a severe FA diagnosis using the J-YFAS 2.0 (Table 1). All subjectswho were diagnosed as FA with the J-YFAS 2.0 were women. Sex was significantly associated with theJ-YFAS 2.0-diagnosed FA (p = 0.004, Fisher’s Exact Test).
3.4. Convergent and Discriminant Validity
For convergent validity, neither the current nor the highest attained BMI was associated withthe presence of J-YFAS 2.0-diagnosed FA (Table 3). The highest attained BMI was associated with theJ-YFAS 2.0-diagnosed FA symptom count, while the current BMI was not (Table 4). The effect size wassmall for the association between the highest attained BMI and the J-YFAS 2.0-diagnosed FA symptomcount—the η2 was 0.02. A high K6 score and snacking frequency were significantly associated with theJ-YFAS 2.0-diagnosed FA presence and the J-YFAS 2.0-diagnosed FA symptom count (Tables 3 and 4,respectively). TFEQ R-18 uncontrolled eating and emotional eating scores and desire to overeat weresignificantly associated with the J-YFAS 2.0-diagnosed FA presence, severity, and symptom count(Tables 5–7, respectively).
For discriminant validity, there was a significant association between the TFEQ R-18 cognitiverestraint score and the J-YFAS 2.0-diagnosed FA presence (Table 5). Its effect size was small—theCohen’s d was 0.44. There was no significant association between the cognitive restraint score andthe J-YFAS 2.0-diagnosed FA severity (Table 6). We found a significant correlation between thecognitive restraint score and the J-YFAS 2.0-diagnosed FA symptom count (Table 7). Its Spearman’srank correlation coefficient was 0.143.
10

Nutrients 2019, 11, 687
Table 3. Associations of body mass index (BMI), the Kessler Psychological Distress Scale (K6) score,and snacking frequency with the J-YFAS 2.0-diagnosed food addiction (FA) absence/presence.
FA Absent(n = 707)
FA Present(n = 24)
Chi-Square p Value Effect Size (V)
Current BMI (kg/m2)
16.0–16.9 16 (94.1%) 1 (5.9%)
1.421 0.922 0.04
17.0–18.4 105 (97.2%) 3 (2.8%)18.5–22.9 503 (96.5%) 18 (3.5%)23.0–24.9 55 (96.5%) 2 (3.5%)25.0–29.9 21 (100%) 0 (0%)
30 and above 6 (100%) 0 (0%)
Highest attained BMI (kg/m2) *
16.0–16.9 3 (100%) 0 (0%)
1.522 0.911 0.05
17.0–18.4 58 (96.7%) 2 (3.3%)18.5–22.9 478 (97.0%) 15 (3.0%)23.0–24.9 113 (96.6%) 4 (3.4%)25.0–29.9 48 (94.1%) 3 (5.9%)
30 and above 7 (100%) 0 (0%)
K6 score
12 or less 665 (97.5%) 17 (2.5%) 22.565 <0.001 0.1813 or greater 38 (84.4%) 7 (15.6%)
Snacking Frequency Per Week
None 89 (100%) 0 (0%)
13.855 0.003 0.142–3 days 272 (98.6%) 4 (1.4%)4–5 days 151 (96.2%) 6 (3.8%)
Almost every day 194 (93.3%) 14 (6.7%)
Chi-square test was used. The numbers of missing responses were as follows: current BMI (n = 1), K6 score (n = 4),and snacking frequency (n = 1). * Highest attained BMI means the highest weight ever (when not pregnant) duringthe lifetime.
Table 4. Associations of body mass index (BMI), the Kessler Psychological Distress Scale (K6) score,and snacking frequency with the J-YFAS 2.0-diagnosed food addiction (FA) symptom count (n = 731).
FASymptom Count
F/tValue
p ValuePairwise Difference
a Effect Size (η2)/(d)
Current BMI (kg/m2)
16.0–16.9 1.0 (2.7)
1.375 0.231 0.01
17.0–18.4 0.6 (1.2)18.5–22.9 0.8 (1.6)23.0–24.9 1.1 (1.8)25.0–29.9 1.4 (2.1)
30 and above 1.3 (1.5)
Highest attained BMI (kg/m2) *
16.0–16.9 (1) 0.7 (0.6)
2.555 0.026 (2), (3), (4) < (5) 0.02
17.0–18.4 (2) 0.6 (1.7)18.5–22.9 (3) 0.8 (1.6)23.0–24.9 (4) 0.7 (1.1)25.0–29.9 (5) 1.5 (2.3)
30 and above (6) 1.1 (1.5)
K6 score
12 or less 0.8 (1.4) −3.060 0.004 0.9513 or greater 2.2 (3.2)
Snacking frequency per week
None (1) 0.4 (0.7)
15.986 <0.001 (1), (2) < (3), (4) 0.062–3 days (2) 0.5 (1.0)4–5 days (3) 1.0 (1.9)
Almost every day (4) 1.4 (2.1)
Analysis of variance (for BMI and snacking frequency) and t-test (for K6 score) were used. FA symptom countsare shown as mean (standard deviation). The numbers of missing responses were as follows: Current BMI (n = 1),K6 score (n = 4), and snacking frequency (n = 1). a Pairwise differences were of p < 0.05 (Bonferroni corrected). *Highest attained BMI means the highest weight ever (when not pregnant) during the lifetime.
11

Nutrients 2019, 11, 687
Table 5. Associations of the 18-item Three-Factor Eating Questionnaire (TFEQ R-18) scores andfrequency of desiring to overeat with the J-YFAS 2.0-diagnosed food addiction (FA) absence/presence.
FA Absent(n = 707)
FA Present(n = 24)
tValue
pValue
Effect Size (d)
Cognitive restraint 36.7 (20.1) 45.7 (21.7) −2.097 0.036 0.44Uncontrolled eating 34.5 (19.1) 64.1 (23.1) −7.246 <0.001 1.54
Emotional eating 28.6 (26.4) 63.9 (34.6) −4.959 <0.001 1.32Desire to overeat 0.41 (0.91) 1.7 (2.0) −2.965 0.007 1.28
t-test was used. TFEQ R-18 scores and frequency of desiring to overeat are shown as mean (standard deviation).The numbers of missing responses were as follows: TFEQ R-18 cognitive restraint, n = 8 (7 from FA absent, 1 fromFA present); uncontrolled eating, n = 12 (11 from FA absent, 1 from FA present); emotional eating, n = 2 (all from FAabsent); and desire to overeat, n = 1 (from FA absent).
Table 6. Associations of the 18-item Three-Factor Eating Questionnaire (TFEQ R-18) scores andfrequency of desiring to overeat with the J-YFAS 2.0-diagnosed food addiction (FA) severity.
FA Absent(n = 707)
Mild FA(n = 8)
Moderate FA(n = 9)
Severe FA(n = 7)
FValue
pValue
PairwiseDifference a
Effect Size(η2)
Cognitive restraint 36.7 (20.1) 43.1 (17.8) 48.6 (24.3) 45.2 (25.6) 1.56 0.197 0.01Uncontrolled eating 34.5 (19.1) 56.0 (24.5) 62.5 (20.5) 75.1 (23.2) 18.80 <0.001 1 < 2,3,4 0.07
Emotional eating 28.6 (26.4) 43.1 (37.3) 74.1 (26.1) 74.6 (34.4) 16.06 <0.001 1 < 3,4 0.06
Desire to overeat 0.4 (0.9) 0.6 (1.2) 1.8 (1.5) 2.7 (2.9) 19.53 <0.001 1 < 3, 4;2 < 4 0.07
Analysis of variance was used. TFEQ R-18 scores and frequency of desiring to overeat are shown as mean (standarddeviation). The numbers of missing responses were as follows: TFEQ R-18 cognitive restraint, n = 8 (7 from FAabsent, 1 from Moderate FA); uncontrolled eating, n = 12 (11 from FA absent, 1 from Moderate FA); emotional eating,n = 2 (all from FA absent); and desire to overeat, n = 1 (from FA absent). a Pairwise differences were of p < 0.05(Bonferroni corrected). 1 = No FA, 2 = Mild FA, 3 = Moderate FA, 4 = Severe FA.
Table 7. Spearman’s rank correlation coefficients among the J-YFAS 2.0-diagnosed food addiction (FA)symptom count, the 18-item Three-Factor Eating Questionnaire (TFEQ R-18) scores, and frequency ofdesiring to overeat (n = 731).
FASymptom Count
Cognitive Restraint Uncontrolled Eating Emotional Eating Desire to Overeat
FA symptom countCognitive restraint 0.143 ***
Uncontrolled eating 0.403 *** 0.248 ***Emotional eating 0.296 *** 0.258 *** 0.619 ***Desire to overeat 0.277 *** 0.039 0.449 *** 0.361 ***
*** p < 0.001. The numbers of missing responses were as follows: TFEQ R-18 cognitive restraint (n = 8), uncontrolledeating (n = 12), emotional eating (n = 2), and desire to overeat, (n = 1).
4. Discussion
We examined the J-YFAS 2.0’s properties in a sample of healthy undergraduate students in Japan.The J-YFAS 2.0 had a one-factor structure and adequate convergent validity and reliability, like theYFAS 2.0 in other languages [15–20], whereas our results were not the same as hypothesized withregard to the associations of BMI and cognitive restraint in eating with the J-YFAS 2.0-diagnosed FA.The J-YFAS 2.0-diagnosed FA prevalence was 3.3% in our subjects. Similar findings were reportedfrom Italian and Spanish young healthy samples [18,19].
A one-factor structure was confirmed for the J-YFAS 2.0, which is the same as for the English,German, French, Italian, and Spanish YFAS 2.0 [15–19]. Our findings did not strictly meet the Hu andBentler criteria, i.e., RMSEA ≤ 0.06, CFI ≥ 0.95, TLI ≥ 0.95, and SRMR ≤ 0.08 [33]. However, one ormore of the four indices do not often meet the criteria [34]. The French version of the YFAS 2.0 showeda CFI of 0.887 and RMSEA of 0.083 [17]. There is the criticism that the Hu and Bentler criteria maybe too stringent [35]. Our fit indices did not deviate substantially from the Hu and Bentler criteria.We thus retained the one-factor structure of the J-YFAS 2.0. Regarding the reliability of the J-YFAS 2.0,KR-20 was 0.78. This suggests the acceptable internal consistency of the J-YFAS 2.0.
12
Nutrients 2019, 11, 687
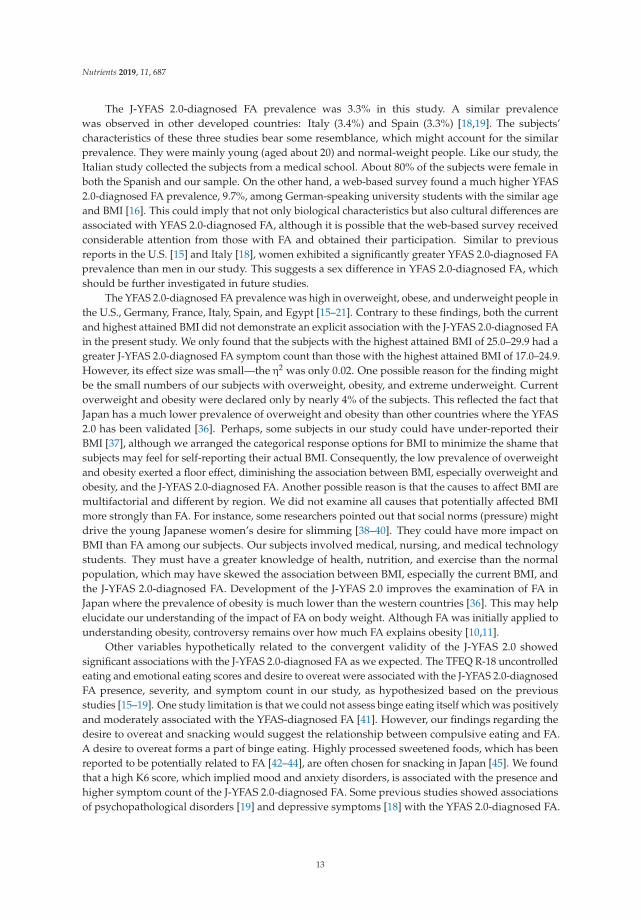
The J-YFAS 2.0-diagnosed FA prevalence was 3.3% in this study. A similar prevalencewas observed in other developed countries: Italy (3.4%) and Spain (3.3%) [18,19]. The subjects’characteristics of these three studies bear some resemblance, which might account for the similarprevalence. They were mainly young (aged about 20) and normal-weight people. Like our study, theItalian study collected the subjects from a medical school. About 80% of the subjects were female inboth the Spanish and our sample. On the other hand, a web-based survey found a much higher YFAS2.0-diagnosed FA prevalence, 9.7%, among German-speaking university students with the similar ageand BMI [16]. This could imply that not only biological characteristics but also cultural differences areassociated with YFAS 2.0-diagnosed FA, although it is possible that the web-based survey receivedconsiderable attention from those with FA and obtained their participation. Similar to previousreports in the U.S. [15] and Italy [18], women exhibited a significantly greater YFAS 2.0-diagnosed FAprevalence than men in our study. This suggests a sex difference in YFAS 2.0-diagnosed FA, whichshould be further investigated in future studies.
The YFAS 2.0-diagnosed FA prevalence was high in overweight, obese, and underweight people inthe U.S., Germany, France, Italy, Spain, and Egypt [15–21]. Contrary to these findings, both the currentand highest attained BMI did not demonstrate an explicit association with the J-YFAS 2.0-diagnosed FAin the present study. We only found that the subjects with the highest attained BMI of 25.0–29.9 had agreater J-YFAS 2.0-diagnosed FA symptom count than those with the highest attained BMI of 17.0–24.9.However, its effect size was small—the η2 was only 0.02. One possible reason for the finding mightbe the small numbers of our subjects with overweight, obesity, and extreme underweight. Currentoverweight and obesity were declared only by nearly 4% of the subjects. This reflected the fact thatJapan has a much lower prevalence of overweight and obesity than other countries where the YFAS2.0 has been validated [36]. Perhaps, some subjects in our study could have under-reported theirBMI [37], although we arranged the categorical response options for BMI to minimize the shame thatsubjects may feel for self-reporting their actual BMI. Consequently, the low prevalence of overweightand obesity exerted a floor effect, diminishing the association between BMI, especially overweight andobesity, and the J-YFAS 2.0-diagnosed FA. Another possible reason is that the causes to affect BMI aremultifactorial and different by region. We did not examine all causes that potentially affected BMImore strongly than FA. For instance, some researchers pointed out that social norms (pressure) mightdrive the young Japanese women’s desire for slimming [38–40]. They could have more impact onBMI than FA among our subjects. Our subjects involved medical, nursing, and medical technologystudents. They must have a greater knowledge of health, nutrition, and exercise than the normalpopulation, which may have skewed the association between BMI, especially the current BMI, andthe J-YFAS 2.0-diagnosed FA. Development of the J-YFAS 2.0 improves the examination of FA inJapan where the prevalence of obesity is much lower than the western countries [36]. This may helpelucidate our understanding of the impact of FA on body weight. Although FA was initially applied tounderstanding obesity, controversy remains over how much FA explains obesity [10,11].
Other variables hypothetically related to the convergent validity of the J-YFAS 2.0 showedsignificant associations with the J-YFAS 2.0-diagnosed FA as we expected. The TFEQ R-18 uncontrolledeating and emotional eating scores and desire to overeat were associated with the J-YFAS 2.0-diagnosedFA presence, severity, and symptom count in our study, as hypothesized based on the previousstudies [15–19]. One study limitation is that we could not assess binge eating itself which was positivelyand moderately associated with the YFAS-diagnosed FA [41]. However, our findings regarding thedesire to overeat and snacking would suggest the relationship between compulsive eating and FA.A desire to overeat forms a part of binge eating. Highly processed sweetened foods, which has beenreported to be potentially related to FA [42–44], are often chosen for snacking in Japan [45]. We foundthat a high K6 score, which implied mood and anxiety disorders, is associated with the presence andhigher symptom count of the J-YFAS 2.0-diagnosed FA. Some previous studies showed associationsof psychopathological disorders [19] and depressive symptoms [18] with the YFAS 2.0-diagnosed FA.
13

Nutrients 2019, 11, 687
A recent systematic review suggested a positive, moderate association of the YFAS-diagnosed FA withdepression and anxiety [41]. Our finding was consistent with them.
Regarding the discriminant validity, we hypothesized that cognitive restraint in eating was adifferent entity from FA, referring to the idea that the YFAS 2.0 does not simply measure an intentionand a failure to restrict food consumption [15,16]. Our findings exhibited an inconsistency in theassociation of cognitive restraint in eating with the FA presence, severity, and symptom count. In oursample, the association between cognitive restraint and the J-YFAS 2.0-diagnosed FA would not be sostrong even if the association existed. Previous findings are also inconsistent regarding the association.It was reported in France and Italy that the YFAS 2.0-diagnosed FA was associated with a high levelof cognitive restraint [17,18]. The Italian researchers mentioned the possibility that addictive-likeeating and restricting food consumption could coexist in patients with anorexia nervosa [18]. We couldnot ascertain this possibility in our study since we did not examine whether the subjects sufferedfrom anorexia. Further research would be necessary to examine the role of anorexia in the associationbetween cognitive restraint and FA.
There are several limitations to the interpretation of our findings. First, the current studyemployed a convenience sample that was dominated by young, under- and normal-weight, female,healthy undergraduate students. For a generalization of the present findings, the J-YFAS 2.0 shouldbe tested for different-age groups, obese individuals, and patients with eating disorders. Second,we were not able to include all kinds of validity and reliability. For instance, we did not addressincremental validity and test-retest reliability. Third, we used our original questions to assess thedesire to overeat and frequency of snacking. For instance, the Binge Eating Scale (BES) [46] and theEating Behavior Patterns Questionnaire (EBPQ) [47] are the validated tools to evaluate binge eatingand snacking, respectively. We did not use them since they were not translated into and validated inJapanese. This may limit the comparison of our results with the others. Finally, as FA has not yet beenrecognized in the DSM-5, we could not define the standard of psychiatrist-diagnosed FA.
As mentioned in the introduction, the conceptual construct of FA and the neurobiologicalchanges underpinning it remain controversial [10,11]. Development of the J-YFAS 2.0 would facilitateresearch on FA in Japan where prevalence of overweight and obesity is much lower than thewestern countries [36]. This would contribute to specifying the conceptual construct of FA andthe neurobiological changes related to FA.
5. Conclusions
The J-YFAS 2.0 had a one-factor structure and adequate convergent validity and reliability, likethe YFAS 2.0 in other languages. Further studies are necessary to confirm the discriminant validity ofthe J-YFAS 2.0.
Supplementary Materials: The following are available online at http://www.mdpi.com/2072-6643/11/3/687/s1,Table S1: The Japanese version of the Yale Food Addiction Scale 2.0 (J-YFAS 2.0) (written in Japanese).
Author Contributions: M.T.K., A.O., A.N.G., and H.Y. designed the study plan. A.O., A.N.G., A.F., and H.Y.translated the English YFAS 2.0 into Japanese. M.T.K., A.O., A.F., M.M., A.M., Y.L., H.N., and H.Y. collected thedata. M.T.K., A.O., and H.Y. analyzed the data and drafted the manuscript. A.N.G., A.F., M.M., A.M., Y.L., andH.N. critically reviewed and approved the manuscript. A.O. and H.Y. obtained the fund.
Funding: This research was funded by Fujita Health University. The funder had no role in the design of the study,the collection, analyses, or interpretation of data, writing the manuscript, or the decision to publish the results.
Acknowledgments: Data collection and processing were supported by Shunsuke Omura, Nozomi Furukawa,Yukino Onuma, Sho Nakahama, and Keigo Yamada.
Conflicts of Interest: The authors declare no conflict of interest. The content does not present the official views ofthe affiliations to which the authors belong.
14

Nutrients 2019, 11, 687
References
1. Meule, A. Back by Popular Demand: A Narrative Review on the History of Food Addiction Research. Yale J.Biol. Med. 2015, 88, 295–302. [PubMed]
2. Schulte, E.M.; Smeal, J.K.; Gearhardt, A.N. Foods are differentially associated with subjective effect reportquestions of abuse liability. PLoS ONE 2017, 12, e0184220. [CrossRef] [PubMed]
3. Meule, A.; Hermann, T.; Kubler, A. Food addiction in overweight and obese adolescents seeking weight-losstreatment. Eur. Eat. Disord. Rev. J. Eat. Disord. Assoc. 2015, 23, 193–198. [CrossRef]
4. Meule, A.; Gearhardt, A.N. Five years of the Yale Food Addiction Scale: Taking stock and moving forward.Curr. Addict. Rep. 2014, 1, 193–205. [CrossRef]
5. Pursey, K.M.; Stanwell, P.; Gearhardt, A.N.; Collins, C.E.; Burrows, T.L. The prevalence of food addiction asassessed by the Yale Food Addiction Scale: A systematic review. Nutrients 2014, 6, 4552–4590. [CrossRef][PubMed]
6. Brewerton, T.D. Food addiction as a proxy for eating disorder and obesity severity, trauma history,PTSD symptoms, and comorbidity. Eat. Weight Disord. 2017, 22, 241–247. [CrossRef]
7. Onaolapo, A.Y.; Onaolapo, O.J. Food additives, food and the concept of ‘food addiction’: Is stimulation ofthe brain reward circuit by food sufficient to trigger addiction? Pathophysiology 2018, 25, 263–276. [CrossRef]
8. Volkow, N.D.; Wise, R.A.; Baler, R. The dopamine motive system: Implications for drug and food addiction.Nat. Rev. Neurosci. 2017, 18, 741–752. [CrossRef]
9. Pelchat, M.L.; Johnson, A.; Chan, R.; Valdez, J.; Ragland, J.D. Images of desire: Food-craving activationduring fMRI. Neuroimage 2004, 23, 1486–1493. [CrossRef]
10. Ziauddeen, H.; Farooqi, I.S.; Fletcher, P.C. Obesity and the brain: How convincing is the addiction model?Nat. Rev. Neurosci. 2012, 13, 279–286. [CrossRef]
11. Fletcher, P.C.; Kenny, P.J. Food addiction: A valid concept? Neuropsychopharmacology 2018, 43, 2506–2513.[CrossRef]
12. American Psychiatric Association (APA). Substance-related and addictive disorders. In Diagnostic andStatistical Manual of Mental Disorders (DSM-5), 5th ed.; APA, Ed.; APA: Arlington, VA, USA, 2013; pp. 481–589.
13. Gearhardt, A.N.; Corbin, W.R.; Brownell, K.D. Preliminary validation of the Yale Food Addiction Scale.Appetite 2009, 52, 430–436. [CrossRef]
14. American Psychiatric Association (APA). Substance-related disorders. In Diagnostic and Statistical Manual ofMental Disorders (DSM-IV), 4th ed.; APA, Ed.; APA: Arlington, VA, USA, 1994; pp. 175–272.
15. Gearhardt, A.N.; Corbin, W.R.; Brownell, K.D. Development of the Yale Food Addiction Scale Version 2.0.Psychol. Addict. Behav. 2016, 30, 113–121. [CrossRef] [PubMed]
16. Meule, A.; Müller, A.; Gearhardt, A.N.; Blechert, J. German version of the Yale Food Addiction Scale 2.0:Prevalence and correlates of ‘food addiction’ in students and obese individuals. Appetite 2017, 115, 54–61.[CrossRef] [PubMed]
17. Brunault, P.; Courtois, R.; Gearhardt, A.N.; Gaillard, P.; Journiac, K.; Cathelain, S.; Réveillère, C.; Ballon, N.Validation of the French Version of the DSM-5 Yale Food Addiction Scale in a Nonclinical Sample.Can. J. Psychiatry 2017, 62, 199–210. [CrossRef] [PubMed]
18. Aloi, M.; Rania, M.; Rodriguez Munoz, R.C.; Jimenez Murcia, S.; Fernandez-Aranda, F.; De Fazio, P.;Segura-Garcia, C. Validation of the Italian version of the Yale Food Addiction Scale 2.0 (I-YFAS 2.0) in asample of undergraduate students. Eat. Weight Disord. 2017, 22, 527–533. [CrossRef] [PubMed]
19. Granero, R.; Jiménez-Murcia, S.; Gearhardt, A.N.; Agüera, Z.; Aymamí, N.; Gómez-Peña, M.;Lozano-Madrid, M.; Mallorquí-Bagué, N.; Mestre-Bach, G.; Neto-Antao, M.I.; et al. Validation of theSpanish Version of the Yale Food Addiction Scale 2.0 (YFAS 2.0) and Clinical Correlates in a Sample of EatingDisorder, Gambling Disorder, and Healthy Control Participants. Front. Psychiatry 2018, 9, 208. [CrossRef][PubMed]
20. Fawzi, M.; Fawzi, M. Validation of an Arabic version of the Yale Food Addiction Scale 2.0. East. Mediterr.Health J. 2018, 24, 745–752. [CrossRef]
21. Hauck, C.; Weiß, A.; Schulte, E.M.; Meule, A.; Ellrott, T. Prevalence of ‘Food Addiction’ as Measured withthe Yale Food Addiction Scale 2.0 in a Representative German Sample and Its Association with Sex, Age andWeight Categories. Obes. Facts 2017, 10, 12–24. [CrossRef] [PubMed]
15

Nutrients 2019, 11, 687
22. Zhao, Z.; Ma, Y.; Han, Y.; Liu, Y.; Yang, K.; Zhen, S.; Wen, D. Psychosocial Correlates of Food Addiction andIts Association with Quality of Life in a Non-Clinical Adolescent Sample. Nutrients 2018, 10, 837. [CrossRef]
23. Chen, G.; Tang, Z.; Guo, G.; Liu, X.; Xiao, S. The Chinese version of the Yale Food Addiction Scale:An examination of its validation in a sample of female adolescents. Eat. Behav. 2015, 18, 97–102. [CrossRef][PubMed]
24. Swarna Nantha, Y.; Abd Patah, N.A.; Ponnusamy Pillai, M. Preliminary validation of the Malay Yale FoodAddiction Scale: Factor structure and item analysis in an obese population. Clin. Nutr. ESPEN 2016, 16,42–47. [CrossRef]
25. Anai, A.; Ueda, K.; Harada, K.; Katoh, T.; Fukumoto, K.; Wei, C.-N. Determinant factors of the differencebetween self-reported weight and measured weight among Japanese. Environ. Health Prev. Med. 2015, 20,447–454. [CrossRef] [PubMed]
26. Karlsson, J.; Persson, L.O.; Sjöström, L.; Sullivan, M. Psychometric properties and factor structure of theThree-Factor Eating Questionnaire (TFEQ) in obese men and women. Results from the Swedish ObeseSubjects (SOS) study. Int. J. Obes. 2000, 24, 1715–1725. [CrossRef]
27. Anglé, S.; Engblom, J.; Eriksson, T.; Kautiainen, S.; Saha, M.-T.; Lindfors, P.; Lehtinen, M.; Rimpelä, A.Three factor eating questionnaire-R18 as a measure of cognitive restraint, uncontrolled eating and emotionaleating in a sample of young Finnish females. Int. J. Behav. Nutr. Phys. Act. 2009, 6, 41. [CrossRef]
28. Adachi, Y.; Fujii, K.; Yamagami, T. Responses regarding restrained eating on the Three-Factor EatingQuestionnaire and weight loss. Jpn. J. Behav. Ther. 1992, 18, 140–148.
29. Furukawa, T.A.; Kawakami, N.; Saitoh, M.; Ono, Y.; Nakane, Y.; Nakamura, Y.; Tachimori, H.; Iwata, N.;Uda, H.; Nakane, H.; et al. The performance of the Japanese version of the K6 and K10 in the World MentalHealth Survey Japan. Int. J. Methods Psychiatr. Res. 2008, 17, 152–158. [CrossRef]
30. Cohen, J. A power primer. Psychol. Bull. 1992, 112, 155–159. [CrossRef]31. Volker, M.A. Reporting Effect Size Estimates in School Psychology Research. Psychol. Sch. 2006, 43, 653–672.
[CrossRef]32. Lakens, D. Calculating and reporting effect sizes to facilitate cumulative science: A practical primer for
t-tests and ANOVAs. Front. Psychol. 2013, 4, 863. [CrossRef]33. Hu, L.-T.; Bentler, P.M. Cutoff criteria for fit indexes in covariance structure analysis: Conventional criteria
versus new alternatives. Struct. Equ. Model. 1999, 6, 1–55. [CrossRef]34. Bagozzi, R.P.; Yi, Y. Specification, evaluation, and interpretation of structural equation models. J. Acad.
Mark. Sci. 2012, 40, 8–34. [CrossRef]35. Barrett, P. Structural equation modelling: Adjudging model fit. Pers. Individ. Dif. 2007, 42, 815–824.
[CrossRef]36. Yatsuya, H.; Li, Y.; Hilawe, E.H.; Ota, A.; Wang, C.; Chiang, C.; Zhang, Y.; Uemura, M.; Osako, A.; Ozaki, Y.;
et al. Global Trend in Overweight and Obesity and Its Association With Cardiovascular Disease Incidence.Circ. J. 2014, 78, 2807–2818. [CrossRef] [PubMed]
37. Elgar, F.J.; Roberts, C.; Tudor-Smith, C.; Moore, L. Validity of self-reported height and weight and predictorsof bias in adolescents. J. Adolesc. Health 2005, 37, 371–375. [CrossRef] [PubMed]
38. Takimoto, H.; Yoshiike, N.; Kaneda, F.; Yoshita, K. Thinness Among Young Japanese Women. Am. J.Public Health 2004, 94, 1592–1595. [CrossRef] [PubMed]
39. Hayashi, F.; Takimoto, H.; Yoshita, K.; Yoshiike, N. Perceived body size and desire for thinness of youngJapanese women: a population-based survey. Br. J. Nutr. 2007, 96, 1154–1162. [CrossRef]
40. Smith, A.R.; Joiner, T.E. Examining body image discrepancies and perceived weight status in adult Japanesewomen. Eat. Behav. 2008, 9, 513–515. [CrossRef] [PubMed]
41. Burrows, T.; Kay-Lambkin, F.; Pursey, K.; Skinner, J.; Dayas, C. Food addiction and associations with mentalhealth symptoms: A systematic review with meta-analysis. J. Hum. Nutr. Diet. 2018, 31, 544–572. [CrossRef]
42. Schulte, E.M.; Avena, N.M.; Gearhardt, A.N. Which foods may be addictive? The roles of processing, fatcontent, and glycemic load. PLoS ONE 2015, 10, e0117959. [CrossRef]
43. Gearhardt, A.N.; Davis, C.; Kuschner, R.; Brownell, K.D. The Addiction Potential of Hyperpalatable Foods.Curr. Drug Abuse Rev. 2011, 4, 140–145. [CrossRef] [PubMed]
44. Lindgren, E.; Gray, K.; Miller, G.; Tyler, R.; Wiers, C.E.; Volkow, N.D.; Wang, G.J. Food addiction: A commonneurobiological mechanism with drug abuse. Front. Biosci. (Landmark Ed.) 2018, 23, 811–836. [CrossRef][PubMed]
16

Nutrients 2019, 11, 687
45. Takeichi, H.; Taniguchi, H.; Fukinbara, M.; Tanaka, N.; Shikanai, S.; Sarukura, N.; Hsu, T.-F.; Wong, Y.;Yamamoto, S. Sugar intakes from snacks and beverages in Japanese children. J. Nutr. Sci. Vitaminol. (Tokyo)2012, 58, 113–117. [CrossRef] [PubMed]
46. Gormally, J.; Black, S.; Daston, S.; Rardin, D. The assessment of binge eating severity among obese persons.Addict. Behav. 1982, 7, 47–55. [CrossRef]
47. Schlundt, D.G.; Hargreaves, M.K.; Buchowski, M.S. The Eating Behavior Patterns Questionnaire predictsdietary fat intake in African American women. J. Am. Diet. Assoc. 2003, 103, 338–345. [CrossRef] [PubMed]
© 2019 by the authors. Licensee MDPI, Basel, Switzerland. This article is an open accessarticle distributed under the terms and conditions of the Creative Commons Attribution(CC BY) license (http://creativecommons.org/licenses/by/4.0/).
17


nutrients
Article
Food Addiction Symptoms and Amygdala Responsein Fasted and Fed States
Kirrilly M. Pursey 1,2, Oren Contreras-Rodriguez 3, Clare E. Collins 1,2, Peter Stanwell 1 and
Tracy L. Burrows 1,*
1 Faculty of Health and Medicine, The University of Newcastle, University Drive, Callaghan, NSW 2308,Australia; [email protected] (K.M.P.); [email protected] (C.E.O.);[email protected] (P.S.)
2 Priority Research Centre for Physical Activity and Nutrition, The University of Newcastle, University Drive,Callaghan, NSW 2308, Australia
3 Department of Psychiatry, Bellvitge Biomedical Research Institute (IDIBELL), and CIBERSAM, 08907Barcelona, Spain; [email protected]
* Correspondence: [email protected]; Tel.: +61-4921-5514
Received: 5 May 2019; Accepted: 4 June 2019; Published: 6 June 2019
Abstract: Few studies have investigated the underlying neural substrates of food addiction (FA) inhumans using a recognised assessment tool. In addition, no studies have investigated subregions ofthe amygdala (basolateral (BLA) and central amygdala), which have been linked to reward-seekingbehaviours, susceptibility to weight gain, and promoting appetitive behaviours, in the context ofFA. This pilot study aimed to explore the association between FA symptoms and activation in theBLA and central amygdala via functional magnetic resonance imaging (fMRI), in response to visualfood cues in fasted and fed states. Females (n = 12) aged 18–35 years completed two fMRI scans(fasted and fed) while viewing high-calorie food images and low-calorie food images. Food addictionsymptoms were assessed using the Yale Food Addiction Scale. Associations between FA symptomsand activation of the BLA and central amygdala were tested using bilateral masks and small-volumecorrection procedures in multiple regression models, controlling for BMI. Participants were 24.1± 2.6 years, with mean BMI of 27.4 ± 5.0 kg/m2 and FA symptom score of 4.1 ± 2.2. A significantpositive association was identified between FA symptoms and higher activation of the left BLA tohigh-calorie versus low-calorie foods in the fasted session, but not the fed session. There were nosignificant associations with the central amygdala in either session. This exploratory study providespilot data to inform future studies investigating the neural mechanisms underlying FA.
Keywords: Food addiction; Yale Food Addiction Scale; functional magnetic resonance imaging;basolateral amygdala
1. Introduction
There is increasing scientific interest in the possible role of “food addiction” (FA) underlyingparticular patterns of overeating, dietary relapse and weight gain in vulnerable individuals.Neuroimaging techniques, such as functional magnetic resonance imaging (fMRI), have providedinsight into this phenomenon in humans. Visual food cues and consumption of palatable, energy-densefoods have been shown to activate reward-related brain circuits in humans in a similar way to substancesof abuse [1]. Despite accumulating evidence supporting FA as a phenomenon in preclinical [2] andbehavioural research [3], few studies have investigated the potential underlying neural substrates inhumans. Many studies have used obesity as a proxy for addictive-like eating in lieu of a recognisedassessment tool for FA, such as the Yale Food Addiction Scale (YFAS) [4]. Using obesity as a proxy for
Nutrients 2019, 11, 1285; doi:10.3390/nu11061285 www.mdpi.com/journal/nutrients19

Nutrients 2019, 11, 1285
FA could result in inconsistent neuroimaging findings as it is unclear as to the proportion of participantstruly affected by addictive-like eating in these samples.
In one neuroimaging study using a recognised FA assessment tool, YFAS symptoms wereassociated with greater activation in response to a visual milkshake cue in brain areas encoding thereward value of foods and craving (amygdala, anterior cingulate cortex (ACC), medial orbitofrontalcortex (OFC), and the dorsolateral prefrontal cortex (DLPFC)) in young females [5]. In another study,while main effects were found activation in the amygdala, OFC, nucleus accumbens and inferior frontalcortex in response to the taste of sugar-sweetened beverages, no relationships were observed betweenYFAS symptoms and neural response in male and female adolescents [6]. The divergence in previousstudies may be related to the limited range of food cues used, which have often been restricted tosweetened beverages [5,6]. These previous studies have also not studied participants in differentmotivational states (i.e., fasted and fed), which is important given the differences in responsivity inreward-related networks in these states [7,8].
The amygdala has been implicated in previous FA neuroimaging research [5] and plays a role inregulating the hedonic impact of salient stimuli and coordinating appetitive behaviours, with studiesreporting selective sensitivity of the amygdala to food cues in the fasted state [9,10]. The amygdala hasalso been shown to integrate interoceptive states and sensory cues along the ventral visual stream [9]and has been implicated in drug cue reactivity and drug craving [11,12]. While the amygdala mayplay an important role in the context of FA, no studies have explored the potential role of distinctsubregions of the amygdala. The basolateral amygdala (BLA) is of particular interest as it has beenshown to drive external cues to the hypothalamic feeding centres in both humans and rats [13,14],consistent with the role in processing high-level sensory input and stimulus-value associations inhumans [15]. In animal studies, the BLA has been implicated in reward-seeking behaviours in responseto food-related stimuli [16] and relapse to food seeking [17]. In the satiated state, the BLA has also beenassociated with eating in the absence of homeostatic needs in rats [18] as well as predicting weight gainsusceptibility in males and females [13]. In addition, the central amygdala has been reported to have arole in increasing reward saliency, modulating food consumption and promoting appetitive behavioursin mice [19]. While these previous studies of the BLA and central amygdala were not conducted inFA populations specifically, these findings suggest that there is a need to study the subregions of theamygdala in relation to FA in different motivational states.
This pilot study aimed to explore the association between YFAS assessed FA symptoms andactivation in the central and BLA, assessed via functional MRI, in response to visual food cues in fastedand fed states. It was hypothesised that FA symptoms would be associated with greater activation inthe BLA in response to high-calorie vs low-calorie foods in both the fasted and fed states, based on thefindings of previous neuroimaging research [7,9,10].
2. Materials and Methods
2.1. Participants
Australian females aged 18–35 years were recruited to the current study from an existing poolof participants who had completed an online FA survey, which aimed to determine FA prevalenceand associations with dietary intake in Australian adults [20]. At the end of the survey, participantscould exit the survey with no further contact or could volunteer to be recontacted for future research.Full details regarding the FA survey are published elsewhere [20]. This study was approved by theUniversity of Newcastle Human Research Ethics Committee (Approval number H-2012-0419) and wasconducted in accordance with the ethical standards of the 1964 Helsinki Declaration.
Participants were eligible for the current study if they were female, aged 18–35 years, lived withina one-hour proximity to the imaging facility (Newcastle, NSW, Australia) and elected to be contacted forfuture research at the end of the online survey. Eligibility for this pilot study was restricted to femalesonly in order to reduce potential inter-person variation in appetite and neural activation to visual
20

Nutrients 2019, 11, 1285
food cues associated with sex-related differences [21]. Seventy-seven participants from the originalsurvey volunteered for future research and were recontacted via email to participate in the fMRIcomponent of the study. Of those recontacted, 35 responded that they were interested in participatingin the fMRI study and were screened via telephone. Exclusion criteria for the current study includedpregnancy, body mass >150 kg due to weight limitations for the MRI scanner, contraindications to MRI,left handedness, pre-existing medical or Axis 1 disorders, disordered eating behaviour, medicationsaffecting appetite, history of substance abuse or head injury with loss of consciousness, allergy to anybeverage ingredients, risk of adverse medical events as a result of fasting (e.g., diabetes), or inabilityto refrain from cigarette smoking. Seventeen participants did not meet the inclusion criteria for thecurrent study, and five participants were not able to be contacted for screening, resulting in a finalsample of thirteen participants. Written informed consent was obtained from all participants in thecurrent study.
2.2. Procedures
The study procedure is outlined in Figure 1. Participants attended a single session where theyunderwent two fMRI scans of the brain, the first in the fasted state and the second in the fed state. Fourhours prior to the first scan, participants consumed a standardised pre-fast meal (237 mL Ensure Plus;1485 kJ/355 kcal). Participants then fasted for four hours, excluding water, to capture the hunger-stateexperienced when approaching the next meal. Participants were instructed to avoid caffeinated andalcoholic beverages, and smoking for twelve hours prior to the scan. Compliance with the pre-scanprotocol was checked via verbal self-report upon arrival at the imaging facility prior to scanning.The session included anthropometric measurements, a demographic survey, hunger and image ratings,and the first of two fMRI scans. Following the first scan, participants drank a second Ensure Plus drinkwith compliance monitored by the research team. Participants again completed the hunger and imageratings before undertaking a second fMRI scan approximately 45 min following the completion of thesecond meal replacement beverage. Participants were not able to be scanned at the same time of daydue to scheduling at the imaging facility.
Figure 1. Flow diagram of the study procedure.
2.3. Measures
Demographics: Demographic data including sex, age, indigenous status, marital status andhighest qualification were collected. Current and previous dieting history [22] was also assessed.
Yale Food Addiction Scale: The YFAS is a 25-item questionnaire which assesses addictive-likeeating according to the diagnostic criteria for substance dependence. The YFAS has been shown to haveadequate psychometric properties [4]. The tool includes two scoring options, a symptom score from0–7 based on the DSM criteria for substance dependence, as well as a diagnosis of FA if ≥3 symptomsare reported as well as clinical impairment or distress. Cronbach α for the current sample was 0.93.
Anthropometrics: Height was taken using a BSM370 stadiometer, while weight and bodycomposition (% body fat, fat free mass) was assessed using the InBody720 bioelectrical impedanceanalyser (Biospace, Seoul, Korea) using a standardised protocol. Body mass index (BMI) wassubsequently calculated.
Hunger and Image Ratings: Participants completed a set of ratings related to hunger and appetite,as well as rating a subset of images shown to them in the MRI scanner (n = 20; n = 10 high-calorie,n = 10 low-calorie), using a 10 cm visual analogue scale. Participants completed the set of ratingsin the fasted state at baseline (prior to Scan 1) and in the fed state (prior to Scan 2). Hunger and
21

Nutrients 2019, 11, 1285
appetite ratings included self-reported (i) hunger, (ii) satiety, (iii) fullness and (iv) prospective foodconsumption [23]. For the image ratings, participants were asked to rate the (i) appeal of the food, (ii)desire to eat the food, (iii) whether the food increased their appetite and (iv) perceptions of prospectivefood consumption amount related to each of the food images.
2.4. Imaging Paradigm
Food images were chosen from a standardised database [24] and foods representative of theAustralian food environment. Images were matched for brightness, complexity, resolution and size.Two groups of images were created according to nutrient composition, (i) appetising high-calorie foods(e.g., chocolate, chips, pizza, ice cream) and (ii) low-calorie foods (fruits and vegetables). The selectedimages were informed by the foods commonly reported in the original FA online survey. Food imageswere piloted on a sample of six university students independent of the study sample (mean age27 years) regarding recognisability, familiarity and appeal. Those foods with low pilot ratings forrecognisability and familiarity were excluded (n = 27). A final sample of 150 single food imageswere selected for the study including n = 75 high-calorie and n = 75 low-calorie foods. Nutritionalcomposition of the food images can be found in Table S1.
Visual stimuli were presented in a block design format using Presentation software(Neurobehavioral Systems, Inc, Berkley, USA) and NordicNeuroLab sync box (NordicNeuroLabAS, Bergen, Norway), and consisted of two 18 min 20 s runs. Each run consisted of 15 epochs eachof (i) low-calorie foods, (ii) high-calorie foods and (iii) fixation cross. Within each 20 s epoch of foodimages, five images were presented for four seconds each. A 20 s central fixation cross was presentedas a control, and each epoch was separated by a four second blank screen. Each run consisted of440 volumes over the scanning period. Images were presented onto an MRI compatible screen via aprojector, and viewed via a mirror attached to the head coil. Standardised instructions to remain stillfocus on the visual stimuli were provided by the radiographer during the scan.
2.5. Imaging Data Collection
Structural and task-related functional scans were acquired using a Siemens 3-tesla MRI (SiemensAG, Germany). Structural images were acquired with a three-dimension (3D) magnetisation-preparedrapid gradient-echo (MP-RAGE) sequence with the following parameters: TE = 3.5 ms, TR = 2 s, 7◦excitation flip angle, 160 slices with 1mm isotropic resolution. Task-related functional MR images wereacquired using a T2*-weighted gradient-echo echo planar imaging (EPI) pulse sequence. The parameterswere TE = 24 ms, TR = 2.5 s, 90◦ excitation flip angle, 47 axial slices 3 mm thick with a 0 mm interslicegap, in-plane resolution of 3 × 3 mm, covering from vertex to cerebellum. Axial slices were angled tothe anterior cranial floor for to limit distortions that may impact on imaging of the orbito-frontal region.
2.6. Statistical Analysis
Participant characteristics, hunger and image ratings were analysed descriptively using Stata13.Differences in hunger and image ratings between the first and second scan were assessed usingpaired t-tests. Task-related functional MR images were processed and analysed using MATLABversion R2017a (The MathWorks Inc, Natick, Mass, USA) and Statistical Parametric Software (SPM12;The Welcome Department of Imaging Neuroscience, London, UK). Preprocessing steps involvedmotion correction, spatial normalization and smoothing using a Gaussian filter (FWHM 8 mm).The realigned functional sequences were coregistered to each participant’s anatomical scan, whichhad been previously coregistered and normalized to the SPM-T1 template. Normalization parameterswere then applied to the coregistered functional images, which were then resliced to a 2 mm isotropicresolution in Montreal Neurological Institute (MNI) space.
First-level (single-subject) SPM contrasts images were estimated for each of the fasted and fedscans for the following task main effects of interest: high-calorie > low-calorie foods, and low-calorie> high-calorie foods. Changes in brain activation between sessions were computed by the creation
22

Nutrients 2019, 11, 1285
of the following contrasts: (Fasted scan (high-calorie > low-calorie foods) – Fed scan (high-calorie> low-calorie foods)) and (Fed scan (high-calorie > low-calorie foods) – Fasted scan (high-calorie >low-calorie foods)). The same contrasts were created to explore the between session effects on theactivation of low-calorie > high calorie foods. Three regressors were used in these analyses to modelconditions separately corresponding to high-calorie and low-calorie foods, and the fixation cross.Furthermore, to correct for subtle in-scanner movements from volume-to-volume scans, we identifiedthe outlier scans present in the realigned task-related functional scans as determined using the CONNtoolbox (Whitfield-Gabrieli and Nieto-Castanon, 2012). For each participant, the actual removal ofoutlier scans was completed by entering the subject-specific variables identifying the outlier scans (i.e.,one regressor per outlier) in the first-level models as covariates of no interest, so these outlier scanswere removed from these and subsequent analyses. We excluded one subject that had 19.8% of outlierscans. A hemodynamic delay of 4 s and a high-pass filter (1/120 Hz) were considered. The resultingfirst-level contrasts images were then carried forward to subsequent second-level random-effects(group) analyses. One-sample t-tests were used to assess the main task effects in the fasted and fedsessions. Multiple regression models were used to assess associations between FA symptoms andwhole-brain activation under the main task effects in the fasted and fed sessions, and the changebetween sessions. These analyses were controlled for the subject-specific number of outlier scans, BMI,hunger and dieting when the association with FA symptoms was explored. Results were consideredsignificant when surviving a p > 0.001 and a determined cluster-extent using Monte Carlo simulationsimplemented in the AlphaSim thresholding approach [25] (94 voxels and 135 voxels for the fasted andfed sessions, respectively incorporating a 2×2×2mm grey matter mask of 128,190 voxels). However,we specifically tested for associations between FA symptoms and the activation of the basolateraland central amygdala using bilateral masks and small-volume correction procedures in the multipleregression models. To that end, we defined bilateral basolateral and centromedial amygdala maskscomprising 3.5 mm radial spheres cantered at left basolateral (x = −26, y = −5, z = −23) and right BLA(x = 29, y = −3, z = −23), and the left centromedial amygdala (x = −19, y = −5, z = −15) and rightcentromedial amygdala (x = 23, y = −5, z = −13) following previous research [26,27].
3. Results
Participant characteristics can be found in Table 1. The mean YFAS symptom score for the groupwas 4.1 ± 2.2 (range 1–7), with six participants classified as having a YFAS FA diagnosis. Hunger andimage ratings are presented in Table 2. Hunger ratings were not significantly different between thefasted and fed scans (p = 0.13); however, ratings of fullness and satisfaction increased, and prospectivefood consumption decreased (all p < 0.05). Image ratings were significantly reduced from the fasted tofed scans (p < 0.05). FA symptoms were not associated with hunger or image ratings (p > 0.05)
Table 1. Participant characteristics at baseline (n = 12).
Characteristic Total Sample
Age (years) 24.1 ± 2.6 (range 21–29)Aboriginal or Torres Strait Islander background n (%) 0 (0)Highest level of education n (%)Higher school certificate 2 (17)Diploma 2 (17%)University degree 8 (67%)Body mass index (BMI) (kg/m2) 27.4 ± 5.0 (range 21.7–39.0)Body fat (%) 32.5 ± 9.8 (range 18.7–50.1)Symptom score 4.1 ± 2.2 (range 1–7)Current dieting n (%) 6 (50)Previous dieting n (%) 12 (100)
Data is presented as mean ± SD unless otherwise specified.
23

Nutrients 2019, 11, 1285
Table 2. Hunger, appetite and image ratings in the fasted and fed states.
Rating p
Fasted Scan Fed Scan
Hunger and appetite ratings
Self-reported hunger 5.8 ± 1.9 4.2 ± 3.0 0.13Self-reported satisfaction 3.1 ± 2.4 5.4 ± 2.6 0.03Self-perceived fullness 2.1 ± 2.3 5.8 ± 3.1 0.003Prospective food consumptionamount 7.2 ± 1.8 4.8 ± 2.7 0.02
Image ratings
Appeal of food 6.0 ± 1.6 4.5 ± 1.3 0.02Desire to eat food 5.2 ± 1.7 3.8 ± 1.2 0.03Effect of food in increasing appetite 4.5 ± 1.6 3.1 ± 1.1 0.02Prospective consumption amount offood depicted in image 5.2 ± 1.3 3.2 ± 1.0 <0.001
Ratings completed using a 10 cm visual analogue scale. Results are presented as mean ± SD.
Brain Activation and Association with FA Symptoms
Visual cues of high-calorie vs low-calorie foods activated a cluster in the right amygdala, the lefthippocampus, the fusiform gyrus, and in bilateral occipital cortex in the fasted session, and the leftamygdala in the fed session (Table 3, Figure 2). No significant activations were recorded in the contrastlow-calorie vs high-calorie foods in the fasted and fed sessions.
Table 3. Brain regions showing significant activation in response to the sight of high-calorie vslow-calorie foods in the fasted and fed sessions.
Brain ActivationCoordinates
(x, y, z)t-Value CS
Fasted session
Amygdala 14, −6, −18 6.1 111Hippocampus −36, −18, −16 6.7 243Fusiform gyrus 32, −46, −16 5.2 127Occipital cortex 42, −88, 6 8.3 434
−34, −94, 2 7.9 165Fed session
Amygdala −24, 14, −20 7.5 314
Coordinates are given in Montreal Neurological (MNI) Atlas space. The results for the fasted session surpasseda p < 0.001 and a cluster size (CS) of 94 voxels and 135 voxels, for the fasted and fed session, respectively. Thet-values refer to the comparison of the activation of each of the listed brain regions to the high-calorie vs low-caloriefood images.
24

Nutrients 2019, 11, 1285
Figure 2. Increased brain activation to “high-calorie vs low-calorie” foods during the fasted and the fedsessions. Right side of the figure corresponds to the right hemisphere in the coronal views. In sagittalviews, the upper figure corresponds to the right hemisphere, whereas the lower figure correspondsto the left hemisphere. Colour bar displays t-values for the comparison of activation in response tohigh-calorie vs low-calorie food cues.
No significant associations with FA symptoms were found using whole-brain corrections, but asignificant association between the FA symptoms and higher activation of the left BLA to high-calorie vslow-calorie foods in the fasted session (x =−26, y=−4, z=−26, t= 3.45, 11 voxels, pSVC-FWE<0.05 = 0.042)were identified using small-volume correction procedures. Importantly, this association was foundregardless of the body mass index of the participants, and it also remained statistically significantafter controlling for hunger reported by the participants during the fasted session and current dietingstatus. No significant associations were identified between FA symptoms and the activation of thecentral amygdala in the fasted session, and the activation of the basolateral and central amygdala inthe fed session (all pSVC-FWE >0.05). The change in the magnitude of activation from the fasted to thefed sessions of the left BLA showed a significant association with FA symptoms, controlling for BMI(x = −26, y = −4, z = −26, t = 3.77, 8 voxels, pSVC-FWE<0.05 = 0.027) (Figure 3).
Figure 3. Association between the activation of the left basolateral amygdala and food addictiontraits, (a) location of the basolateral (green) and central (blue) amygdala seeds, used as a mask forsmall-volume corrections; (b) left basolateral amygdala significantly associated with food addictiontraits during the fasted session (pSVC-FWE <0.05 = 0.042); (c) scatter plot represents the correlation betweenthe change in the activation of the left basolateral amygdala from the fasted to the fed sessions (y-axis)and food addiction traits (x-axis) (x = −26, y = −4, z = −26, t = 3.77, pSVC-FWE<0.05 = 0.027).
25

Nutrients 2019, 11, 1285
4. Discussion
This is the first study to use fMRI to investigate activation in distinct subregions of the amygdalain response to visual food cues in relation to FA symptoms in both fasting and fed states. In line withthe hypothesis, activation in the BLA in response to high-calorie foods versus low-calorie foods wasfound to be associated with higher FA symptoms in the fasted state, which is consistent with previousresearch [7,9,10]. Furthermore, participants with greater FA symptoms showed higher activation in theBLA in the fasted than in the fed scans to the sight of high-calorie vs low-calorie foods. One possiblemechanism consistent with this is that the amygdala boosts activation in the ventral stream [9,28],increasing food salience in the hunger state. Individual differences in BLA response in the hunger stateto appetizing, high-calorie foods may therefore be associated with susceptibility to overeating.
The findings of the current study suggest that those with higher FA symptoms may be vulnerableto environmental food cues of energy-dense, nutrient-poor, high-calorie food when hungry comparedto those with lower FA symptoms. This may lead those vulnerable individuals to greater desire to eat,hence leading to food seeking and consumption, which is consistent with previous research [16,17].It is possible that FA may play a mediating role in non-homeostatic eating, dietary relapse and otherlonger-term issues such as weight gain. This may be an important consideration in future interventionstargeting FA, suggesting a regular meal pattern that uses strategies to avoid long periods of fastingmay be warranted. This may also suggest that further consideration to reducing environmental foodcues (e.g., food advertisements) in treatment approaches may be warranted for those vulnerable toaddictive-like eating.
The second hypothesis was not supported, with no significant associations found between FAsymptoms and BLA activation in the fed state. This is divergent previous work investigating the roleof the amygdala in eating in the absence of hunger and weight gain susceptibility [13]. However,the study by Sun and colleagues [13] did not recruit a sample to investigated FA, in contrast to thecurrent study. These differences may also be due to the study samples (i.e., inclusion of males in theprevious study) and use of different food cues (i.e., taste vs sight). Alternatively, this may be related tothe standardised meal not significantly reducing self-reported hunger from baseline in the currentstudy, although fullness was increased, and prospective food consumption was decreased. Of note, thestandardised meal would have contributed a relatively small proportion of total daily energy intake(TEE) for participants (<30%). Future studies should therefore consider the use of a standardised mealwith greater contribution to %TEE.
The strengths of the current study include the use of a recognised assessment tool for FA andinvestigation of participants in fasted and fed states. Food images were informed by previous researchand selected from a standardised database [24], which was found to be a limitation of previousstudies [21]. This current exploratory study is limited by the small sample size and inclusion of femalesonly. Additionally, participants could not be scanned at the same time of day, however, a standardisedmeal replacement was provided to reduce inter-individual variation. Self-reported hunger was notsignificantly different between the fasted and fed states, however, other measures of appetite weresignificantly reduced. Future studies should consider standardised meals with greater calorie content,to ensure hunger is significantly different between the two conditions. As the scans were not conductedin a counterbalanced order, it is possible that the lack of associations may be attributed to a habituationeffect. A further limitation is the lack of control condition in the cue reactivity task, and the addition ofa control condition should be considered in future studies. Although participants were asked aboutdisordered eating behaviours during the screening process, a clinical interview to identify eatingdisorder was not included in the baseline assessment. Future studies should use a clinical eatingdisorder assessment to better control for underlying disordered eating. This study used the originalYFAS tool as the updated YFAS 2.0 tool had not been released at the time of the study. Future imagingstudies should consider the use of the YFAS 2.0, which aligns with the DSM-5 criteria [29]. The currentstudy also investigated associations between neural activation and FA symptoms, however, future
26

Nutrients 2019, 11, 1285
studies may consider analysing according to the dichotomous YFAS diagnosis and in those with higherFA symptoms to better understand addictive-like eating.
5. Conclusions
This study demonstrates that activation of the BLA, which has been linked to reward-seekingbehaviours and susceptibility to weight gain, was associated with FA symptoms in the fasted state.This study provides pilot data to inform future studies with larger sample sizes investigating the neuralmechanisms associated with FA.
Supplementary Materials: The following are available online at http://www.mdpi.com/2072-6643/11/6/1285/s1,Table S1: Nutritional composition of food image groups per 100 g.
Author Contributions: Conceptualization, K.M.P., T.L.B., P.S. and C.E.C.; Analysis, O.C.-R., K.M.P.;Writing—Original Draft Preparation, K.M.P.; Writing—Review and Editing, T.L.B., O.C.-R., C.E.C., P.S.; FundingAcquisition, T.L.B. All authors have contributed to the development of the manuscript and have approved thefinal version.
Funding: This study was funded by a University of Newcastle, Faculty of Health and Medicine Pilot Grantobtained by T.L.B.
Acknowledgments: K.M.P. is supported by a Hunter Medical Research Institute Greaves Family Early CareerSupport Grant. O.C.-R. is funded by the postdoctoral contract “PERIS” (SLT006/17/00236) from the CatalanGovernment. T.L.B. is supported by University of Newcastle Brawn Research Fellowship.
Conflicts of Interest: The authors declare that they have no conflict of interest.
References
1. Kenny, P.J. Reward mechanisms in obesity: New insights and future directions. Neuron 2011, 69, 664–679.[CrossRef] [PubMed]
2. Avena, N.M.; Rada, P.; Hoebel, B.G. Evidence for sugar addiction: Behavioral and neurochemical effects ofintermittent, excessive sugar intake. Neurosci. Biobehav. Rev. 2008, 32, 20–39. [CrossRef] [PubMed]
3. Pursey, K.M.; Stanwell, P.; Gearhardt, A.N.; Collins, C.E.; Burrows, T.L. The prevalence of food addiction asassessed by the Yale Food Addiction Scale: A systematic review. Nutrients 2014, 6, 4552–4590. [CrossRef][PubMed]
4. Gearhardt, A.N.; Corbin, W.R.; Brownell, K.D. Preliminary validation of the Yale Food Addiction Scale.Appetite 2009, 52, 430–436. [CrossRef] [PubMed]
5. Gearhardt, A.N.; Yokum, S.; Orr, P.T.; Stice, E.; Corbin, W.R.; Brownell, K.D. Neural correlates of foodaddiction. Arch. Gen. Psychiatry 2011, 68, 808–816. [CrossRef]
6. Feldstein Ewing, S.W.; Claus, E.D.; Hudson, K.A.; Filbey, F.M.; Yakes Jimenez, E.; Lisdahl, K.M.; Kong, A.S.Overweight adolescents’ brain response to sweetened beverages mirrors addiction pathways. Brain ImagingBehav. 2017, 11, 925–935. [CrossRef] [PubMed]
7. Siep, N.; Roefs, A.; Roebroeck, A.; Havermans, R.; Bonte, M.L.; Jansen, A. Hunger is the best spice: An fMRIstudy of the effects of attention, hunger and calorie content on food reward processing in the amygdala andorbitofrontal cortex. Behav. Brain. Res. 2009, 198, 149–158. [CrossRef]
8. Tomasi, D.; Volkow, N.D. Striatocortical pathway dysfunction in addiction and obesity: Differences andsimilarities. Crit. Rev. Biochem. Mol. Biol. 2013, 48, 1–19. [CrossRef]
9. LaBar, K.S.; Gitelman, D.R.; Parrish, T.B.; Kim, Y.-H.; Nobre, A.C.; Mesulam, M.M. Hunger selectivelymodulates corticolimbic activation to food stimuli in humans. Behav. Neurosci. 2001, 115, 493–500. [CrossRef]
10. Mohanty, A.; Gitelman, D.R.; Small, D.M.; Mesulam, M.M. The spatial attention network interacts withlimbic and monoaminergic systems to modulate motivation-induced attention shifts. Cereb. Cortex 2008, 18,2604–2613. [CrossRef]
11. Childress, A.R.; Mozley, P.D.; McElgin, W.; Fitzgerald, J.; Reivich, M.; O’Brien, C.P. Limbic activation duringcue-induced cocaine craving. Am. J. Psychiatry 1999, 156, 11–18. [CrossRef] [PubMed]
12. Wilson, S.J.; Sayette, M.A.; Fiez, J.A. Prefrontal responses to drug cues: A neurocognitive analysis. Nat.Neurosci. 2004, 7, 211–214. [CrossRef] [PubMed]
27

Nutrients 2019, 11, 1285
13. Sun, X.; Kroemer, N.B.; Veldhuizen, M.G.; Babbs, A.E.; de Araujo, I.E.; Gitelman, D.R.; Sherwin, R.S.; Sinha, R.;Small, D.M. Basolateral amygdala response to food cues in the absence of hunger is associated with weightgain susceptibility. J. Neurosci. 2015, 35, 7964–7976. [CrossRef] [PubMed]
14. Petrovich, G.D.; Setlow, B.; Holland, P.C.; Gallagher, M. Amygdalo-hypothalamic circuit allows learned cuesto override satiety and promote eating. J. Neurosci. 2002, 22, 8748–8753. [CrossRef] [PubMed]
15. Bzdok, D.; Laird, A.R.; Zilles, K.; Fox, P.T.; Eickhoff, S.B. An investigation of the structural, connectional, andfunctional subspecialization in the human amygdala. Hum. Brain Mapp. 2013, 34, 3247–3266. [CrossRef]
16. McLaughlin, R.J.; Floresco, S.B. The role of different subregions of the basolateral amygdala in cue-inducedreinstatement and extinction of food-seeking behavior. Neuroscience 2007, 146, 1484–1494. [CrossRef][PubMed]
17. Campbell, E.J.; Barker, D.J.; Nasser, H.M.; Kaganovsky, K.; Dayas, C.V.; Marchant, N.J. Cue-induced foodseeking after punishment is associated with increased Fos expression in the lateral hypothalamus andbasolateral and medial amygdala. Behav. Neurosci. 2017, 131, 155–167. [CrossRef]
18. Weingarten, H.P. Conditioned cues elicit feeding in sated rats: A role for learning in meal initiation. Science1983, 220, 431–433. [CrossRef]
19. Douglass, A.M.; Kucukdereli, H.; Ponserre, M.; Markovic, M.; Gründemann, J.; Strobel, C.; Alcala Morales, P.L.;Conzelmann, K.-K.; Lüthi, A.; Klein, R. Central amygdala circuits modulate food consumption through apositive-valence mechanism. Nat. Neurosci. 2017, 20, 1384. [CrossRef]
20. Pursey, K.M.; Collins, C.E.; Stanwell, P.; Burrows, T.L. Foods and dietary profiles associated with ‘foodaddiction’ in young adults. Addict. Behav. Rep. 2015, 2, 41–48. [CrossRef]
21. Pursey, K.; Stanwell, P.; Callister, R.J.; Brain, K.; Collins, C.E.; Burrows, T.L. Neural responses to visual foodcues according to weight status: A systematic review of functional magnetic resonance imaging studies.Front. Nutr. 2014, 1, 7. [CrossRef] [PubMed]
22. Meule, A.; Lutz, A.; Vogele, C.; Kubler, A. Self-reported dieting success is associated with cardiac autonomicregulation in current dieters. Appetite 2012, 59, 494–498. [CrossRef] [PubMed]
23. Flint, A.; Raben, A.; Blundell, J.E.; Astrup, A. Reproducibility, power and validity of visual analogue scalesin assessment of appetite sensations in single test meal studies. Int. J. Obes. Relat. Metab. Disord. 2000, 24,38–48. [CrossRef] [PubMed]
24. Blechert, J.; Meule, A.; Busch, N.A.; Ohla, K. Food-pics: An image database for experimental research oneating and appetite. Front. Psychol. 2014, 5, 617. [CrossRef] [PubMed]
25. Song, X.-W.; Dong, Z.-Y.; Long, X.-Y.; Li, S.-F.; Zuo, X.-N.; Zhu, C.-Z.; He, Y.; Yan, C.-G.; Zang, Y.-F. REST: Atoolkit for resting-state functional magnetic resonance imaging data processing. PLoS One 2011, 6, e25031.[CrossRef] [PubMed]
26. Baur, V.; Hanggi, J.; Langer, N.; Jancke, L. Resting-state functional and structural connectivity within aninsula-amygdala route specifically index state and trait anxiety. Biol. Psychiatry 2013, 73, 85–92. [CrossRef]
27. Pico-Perez, M.; Alonso, P.; Contreras-Rodriguez, O.; Martinez-Zalacain, I.; Lopez-Sola, C.; Jimenez-Murcia, S.;Verdejo-Garcia, A.; Menchon, J.M.; Soriano-Mas, C. Dispositional use of emotion regulation strategies andresting-state cortico-limbic functional connectivity. Brain Imaging Behav. 2018, 12, 1022–1031. [CrossRef]
28. Kravitz, D.J.; Saleem, K.S.; Baker, C.I.; Ungerleider, L.G.; Mishkin, M. The ventral visual pathway: Anexpanded neural framework for the processing of object quality. Trends Cogn. Sci. 2013, 17, 26–49. [CrossRef]
29. Gearhardt, A.N.; Corbin, W.R.; Brownell, K.D. Development of the Yale Food Addiction Scale Version 2.0.Psychol. Addict. Behav. 2016, 30, 113–121. [CrossRef]
© 2019 by the authors. Licensee MDPI, Basel, Switzerland. This article is an open accessarticle distributed under the terms and conditions of the Creative Commons Attribution(CC BY) license (http://creativecommons.org/licenses/by/4.0/).
28

nutrients
Article
Increasing Chocolate’s Sugar Content Enhances ItsPsychoactive Effects and Intake
Shanon L. Casperson 1,*, Lisa Lanza 2, Eram Albajri 2 and Jennifer A. Nasser 2,*
1 USDA, Agricultural Research Service, Grand Forks Human Nutrition Research Center, 2420 2nd Ave. North,Grand Forks, ND 58203-9034, USA
2 College of Nursing and Health Professions, Drexel University, 1601 Cherry St MS31030 RM 389, Philadelphia,PA 19102-1320, USA; [email protected] (L.L.); [email protected] (E.A.)
* Correspondence: [email protected] (S.L.C.); [email protected] (J.A.N.);Tel.: +1-701-795-8497 (S.L.C.); +1-267-359-5834 (J.A.N.)
Received: 29 January 2019; Accepted: 7 March 2019; Published: 12 March 2019
Abstract: Chocolate elicits unique brain activity compared to other foods, activating similar brainregions and neurobiological substrates with potentially similar psychoactive effects as substances ofabuse. We sought to determine the relationship between chocolate with varying combinations of itsmain constituents (sugar, cocoa, and fat) and its psychoactive effects. Participants consumed 5 g of acommercially available chocolate with increasing amounts of sugar (90% cocoa, 85% cocoa, 70% cocoa,and milk chocolates). After each chocolate sample, participants completed the Psychoactive EffectsQuestionnaire (PEQ). The PEQ consists of questions taken from the Morphine-Benzedrine Group(MBG), Morphine (M,) and Excitement (E) subscales of the Addiction Research Center Inventory.After all testing procedures, participants completed the Binge Eating Scale (BES) while left alone andallowed to eat as much as they wanted of each of the different chocolates. We found a measurablepsychoactive dose–effect relationship with each incremental increase in the chocolate’s sugar content.The total number of positive responses and the number of positive responses on the E subscale beganincreasing after tasting the 90% cocoa chocolate, whereas the number of positive responses on theMBG and M subscales began increasing after tasting the 85% cocoa chocolate sample. We did notfind a correlation between BES scores and the total amount of chocolate consumed or self-reportedscores on the PEQ. These results suggest that each incremental increase in chocolate’s sugar contentenhances its psychoactive effects. These results extend our understanding of chocolate’s appeal andunique ability to prompt an addictive-like eating response.
Keywords: chocolate; Addiction Research Center Inventory; sugar; craving; addictive-like eating;eating behavior
1. Introduction
Chocolate holds a special status in our society. Indeed, it is one of the most loved and craved, butproblematic, foods [1]. Consuming chocolate evokes pleasant feelings, reduces tension, and improvesmood [2,3]. Furthermore, chocolate elicits unique brain activity compared to other high-sugar andhigh-fat foods, recruiting brain structures that respond to craving-inducing stimuli, and is thereforemore likely to provoke an addictive-like eating response [4]. The particular combination of cocoa, sugar,and fat in chocolate may play important, yet distinct, roles in chocolate’s unique ability to elicit anaddictive-like eating response. Smit et al. [5] demonstrated a role of the main psychopharmacologicalactive constituents of cocoa in producing psychostimulant effects but determined that other attributes,such as sweetness and texture, may be more important. In a prior study, we observed effects of thepercent cocoa and sugar contents on “desire to consume more chocolate”, while fat content trendedtowards significance for this effect [6]. Defeliceantonio et al. [7] demonstrated a supra-additive effect
Nutrients 2019, 11, 596; doi:10.3390/nu11030596 www.mdpi.com/journal/nutrients29

Nutrients 2019, 11, 596
of combining sugar and fat on food reward in humans, while others have demonstrated that the sugarcomponent (in a sugar/fat combination) in particular is more effective at activating reward [8,9] andgustatory brain circuits [9]. Additionally, we have demonstrated that the highly reinforcing propertiesof sugar are difficult to overcome [10,11]. Taken together, chocolate’s desirability appears to arise fromthe synergistic relationship among its components.
Fat and sugar are known to stimulate both the dopamine and the opioid neurotransmitter systemsto regulate a food’s rewarding potential [12–14]. The dopamine neurotransmitter system stimulates‘wanting’, or the motivation to consume the food [12,14], whereas the opioid neurotransmitter systemmodulates the consumption of a desired food by amplifying ‘liking’, or the hedonic value, of the desiredfood [12,13]. Thus, the sight, smell, and taste of a highly palatable food such as chocolate work togetherto trigger motivational and hedonic reward mechanisms that result in the pursuit and consumptionof the desired food. Subjective dopaminergic and opioidergic effects of food consumption can bedifferentiated using the Addiction Research Center Inventory (ACRI) [15]. We previously utilizedthe ARCI, specifically the Morphine-Benzedrine Group (MBG), Morphine (M), and Excitement (E)subscales, in a between-group design (groups identified by percent cocoa of the sample tasted),to provide indices of the psychoactive effects of chocolate that are associated with addictive-likeeating [6]. We showed that simply tasting chocolate increases the number of positive responseson the MBG subscale of the ARCI, consistent with responses obtained on the MBG subscale afterdopaminergic–opioidergic drug administration [16]. These results help explain chocolate’s highreinforcing value, as foods that elevate feelings of euphoria have a greater reinforcing potential [17].However, different individuals may specifically crave a particular combination of chocolate’s maincomponents (dark vs milk chocolate).
To continue our study of the psychoactive effects of chocolates varying in percent cocoa andsugar and fat content, we repeated our 2011 study using a within-subject design. Because somehave postulated that “food addiction” is more of an “eating behavior addiction” similar to bingeeating [18,19], we added the Binge Eating Scale (BES) [20] to our data collection. We hypothesizedthat self-reported scores on the MBG and E subscales of the ARCI would correlate with the particularcombination of the main components (cocoa, sugar, and fat) of the chocolate and the amount ofeach of the different chocolates consumed after the tasting session. Consistent with our 2011 study,we expected no correlation between self-reported scores on the M subscale of the ARCI and theparticular combination of chocolate’s main components. In addition, we hypothesized that theamount of chocolate consumed after the tasting session would positively correlate with the increasingsugar content and decreasing cocoa and fat content of the chocolate. Furthermore, we hypothesizedthat BES scores would positively correlate with self-reported scores on the ARCI questionnaire andchocolate consumption.
2. Materials and Methods
2.1. Participants
Healthy adults (Table 1) were recruited from the greater Grand Forks, ND, and Philadelphia,PA, areas. Our participant population consisted of 57% non-overweight, 30% overweight, and 13%class 1 obese participants. Screening for study eligibility included height, weight, and a medicalhealth history questionnaire. Exclusion criteria included: presence of food and non-food allergies;current status as a dieter; current or past metabolic illnesses (diabetes, renal failure, thyroid illness,hypertension); psychiatric, neurological, or eating disorders (schizophrenia, depression, Parkinson’sDisease, Huntington’s Disease, cerebral palsy, stroke, epilepsy, anorexia nervosa, or bulimia nervosa);taking prescription medications except for oral contraceptives or antihyperlipidemia agents. The studywas approved by both the University of North Dakota and the Drexel University Institutional ReviewBoards and registered on clinicaltrials.gov as NCT03364413. Informed written consent was obtainedfrom all participants prior to any study-related procedures.
30

Nutrients 2019, 11, 596
Table 1. Participant characteristics. BMI, body mass index.
Grand Forks Philadelphia Total
N (F/M) 20 (14/6) 10 (6/4) 30 (20/10)Age, years 24.1 ± 6.8 26.1 ± 6.0 24.8 ± 6.5Height, cm 168.7 ± 9.3 172.3 ± 11.1 169.9 ± 9.9Weight, kg 72.1 ± 10.9 70.3 ± 11.1 70.7 ± 9.4
BMI, kg/m2 25.3 ± 3.5 23.8 ± 4.3 24.8 ± 3.8
Values are means ± SD.
2.2. Experimental Procedures
Participants reported to the Center at which they were recruited 3–4 h postprandial to determinethe psychoactive effect of consuming chocolate with varying amounts of fat, sugar, and cocoa (Table 2).Participants were instructed to have a light meal (e.g., sandwich with side salad or cup of soup)and to then refrain from eating or drinking (except water) before reporting for their study visit.Upon arrival, participants rated their appetite using 10 cm visual analog scales and completed abaseline Psychophysical Effects Questionnaire (PEQ; based on the ARCI) [6]. Participants were thenpresented with 5 g of commercially available chocolate varying in cocoa, sugar, and fat concentrations(Table 2). Chocolates were tested in order from least to most amount of sugar, and the PEQ wascompleted immediately after each chocolate tasting. Participants completed the Binge Eating Scale(BES) after the tasting session. Participants at the Grand Forks site were then left alone and allowed toeat as much as they wanted of each of the different chocolates.
Table 2. Characteristics of each 5 g chocolate sample.
Chocolate Type kcal Cocoa (%) Sugar (g) Fat (g)
Lindt® milk 29 38 2.4 1.9Lindt® dark 30 70 1.5 2.4Lindt® extra dark 29 85 0.6 2.3Lindt® supreme dark 30 90 0.4 2.8
2.3. Questionnaires
Subjective homeostatic and hedonic hunger ratings were assessed using 100 mm visual analoguescales. Questions asked included: 1. How hungry do you feel; 2. How strong is your desire to eat; 3.How full do you feel; 4. How satisfied do you feel; 5. How much do you think you could eat rightnow; 6. Would you like to eat something sweet; and 7. Would you like to eat something fatty.
The PEQ is composed of 30 questions taken from the ARCI Morphine-Benzedrine Group (MBG),Morphine (M), and Excitement (E) subscales that assess subjective dopaminergic and opioidergiceffects of psychoactive drugs [15]. The MBG subscale contains questions that center on feelingsof well-being and euphoria, which correlate with the activation of both the dopaminergic and theopioidergic neurotransmitter systems. The M subscale focuses on attitude and physical sensations,and the E subscale relates to physical and psychological feelings of excitement, both of which correlatewith activation of the dopaminergic neurotransmitter system [16]. Participants completed the PEQbefore and after tasting each of the different chocolates.
The BES is composed of 16 questions used to assess the presence of binge eating behavior [20].The BES contains questions that assess both behavioral manifestations of binge eating and of thefeelings that either cue or follow a binge episode. Participants completed the BES after completing alltesting procedures.
31

Nutrients 2019, 11, 596
2.4. Anthropometric Measurements
Height, measured to the nearest 0.1 cm using a stadiometer (SECA Model 214, Hamburg,Germany), and body weight, measured using a calibrated digital scale to the nearest 0.1 kg(Fairbanks model 50735; Kansas City, MO, USA), were obtained at the end of the testing session.
2.5. Statistical Analysis
General linear models were used to compare general participant characteristics (i.e., sex, age, bodymass index (BMI), hunger, testing site) and ARCI subscale scores of each chocolate type (defined bythe percent cocoa in the chocolate sample tasted) and the amount of chocolate consumed. Tukey’s posthoc analysis was used to determine differences. The threshold of significance was set at alpha = 0.05.JMP V14 (SAS Institute, Inc., Cary, NC, USA) was used for all analyses.
3. Results
3.1. Subjective Appetite Responses
On a scale from 0 (not at all) to 100 (very much), participants’ rating of hunger was 58 ± 21 and ofthe desire to eat was 66 ± 28, while fullness was 25 ± 24 and feeling of being satisfied was 31 ± 21.There was no main effect of hunger or fullness on the total number of positive responses and on thenumber of positive responses on the MBG and M subscales; however, there was a main effect of hunger(F(1,15) = 4.73, p = 0.046) and fullness (F(1,15) = 8.06, p = 0.012) on self-reported scores on the E subscaleof the PEQ.
Participants also rated their desire to eat foods with a specific taste profile on a scale from 0 (not atall) to 100 (very much). Participants’ rating of the desire to eat something sweet was 79 ± 14 and that ofthe desire to eat something fatty was 48 ± 27. There was no main effect of the desire to eat somethingsweet or fatty on the total number of positive responses or on the number of positive responses on theMBG, M, and E subscales.
3.2. Psychophysical Effects Questionnaire
There was no main effect of testing site, sex, age, BMI, or BES on the total number of positiveresponses or on the number of positive responses on the MBG, M, and E subscales. Because of thedirect correlation between the percent cocoa and sugar contents and the simultaneous changes ofthe fat and cocoa contents, we were not able to assess the direct effects of the individual chocolatecomponents in this within-subject study design.
There was a significant main effect of chocolate type on the total number of positive responses(F(4,106) = 30.10, p < 0.0001) and on the number of positive responses on the MBG (F(4,106) = 15.83,p < 0.0001), M (F(4,106) = 10.34, p < 0.0001) and E (F(4,106) = 16.57, p < 0.0001) subscales. Tukey’s posthoc analysis revealed slight differences in the effect of chocolate type on the total number of positiveresponses and on the number of positive responses on MBG, M, and E subscales.
The total number of positive responses (Figure 1) significantly increased after the consumption ofall the different types of chocolate, with milk chocolate eliciting the greatest increase.
The number of positive responses on the MBG subscale (Figure 2) significantly increased afterthe consumption of the 85% cocoa chocolate and continued to increase in a dose-dependent mannerin response to tasting each of the other chocolates. The number of positive responses on the MBGsubscale after the consumption of the milk chocolate was significantly greater than after consumptionof any of the other chocolates.
32

Nutrients 2019, 11, 596
To
tal
Re
spo
nse
s
Figure 1. Total Psychophysical Effects Questionnaire (PEQ) scores after the consumption of chocolatesdiffering in cocoa, sugar, and fat content. Self-reported scores on the PEQ questionnaire are presentedas box and whiskers plots with the line representing the median, the box representing the 25th to75th percentiles, and the whiskers representing the minimum to maximum values. Least-squaresmeans are Baseline: 8.26 ± 1.16 (SE), 95% CI [5.93, 10.58]; 90% cocoa: 10.87 ± 1.10 (SE), 95% CI[8.65, 13.08]; 85% cocoa: 12.37 ± 1.10 (SE), 95% CI [10.15, 14.58]; 70% cocoa: 13.70 ± 1.10 (SE), 95% CI[11.49, 15.91]; Milk: 15.87 ± 1.10 (SE), 95% CI [13.65, 18.08]. Levels not connected by the same letter aresignificantly different.
To
tal
Re
spo
nse
s
Figure 2. Morphine-Benzedrine Group (MBG) subscale scores after the consumption of chocolatesdiffering in cocoa, sugar, and fat content. Self-reported scores on the MBG subscale are presented asbox and whiskers plots with the line representing the median, the box representing the 25th to 75thpercentiles, and the whiskers representing the minimum to maximum values. Least-squares means areBaseline: 4.28 ± 0.71 (SE), 95% CI [2.86, 5.69]; 90% cocoa: 5.37 ± 0.66 (SE), 95% CI [4.03, 6.70]; 85% cocoa:6.10 ± 0.66 (SE), 95% CI [4.77, 7.43]; 70% cocoa: 6.63 ± 0.66 (SE), 95% CI [5.30, 7.97]; Milk: 7.97 ± 0.66(SE), 95% CI [6.63, 9.30]. Levels not connected by the same letter are significantly different.
The number of positive responses on the M subscale (Figure 3) did not increase after theconsumption of the 90% cocoa chocolate. A significant increase above baseline was not observeduntil participants consumed the 85% cocoa chocolate, with no further increases for each sequentialchocolate consumption.
33

Nutrients 2019, 11, 596
To
tal
Re
spo
nse
s
Figure 3. Morphine (M) subscale scores after the consumption of chocolates differing in cocoa, sugar,and fat content. Self-reported scores on the M subscale are presented as box and whiskers plots withthe line representing the median, the box representing the 25th to 75th percentiles, and the whiskersrepresenting the minimum to maximum values. Least-squares means are Baseline: 0.78 ± 0.20 (SE),95% CI [0.37, 1.19]; 90% cocoa: 1.00 ± 0.19 (SE), 95% CI [0.62, 1.38]; 85% cocoa: 1.47 ± 0.19 (SE), 95% CI[1.09, 1.84]; 70% cocoa: 1.57 ± 0.19 (SE), 95% CI [1.19, 1.94]; Milk: 1.57 ± 0.19 (SE), 95% CI [1.19, 1.94].Levels not connected by the same letter are significantly different.
The number of positive responses on the E subscale (Figure 4) significantly increased after theconsumption of the 90% cocoa chocolate. As with the MBG subscale, the number of positive responseson the E subscale continued to increase in a dose-dependent manner in response to each incrementalincrease in the chocolate’s sugar content and decrease in the percent cocoa and fat content.
To
tal
Re
spo
nse
s
Figure 4. Excitement (E) subscale scores after the consumption of chocolates differing in cocoa, sugar,and fat content. Self-reported scores on the E subscale are presented as box and whiskers plots withthe line representing the median, the box representing the 25th to 75th percentiles, and the whiskersrepresenting the minimum to maximum values. Least-squares means are Baseline: 3.51 ± 0.47 (SE),95% CI [2.56, 4.46]; 90% cocoa: 4.57 ± 0.44 (SE), 95% CI [3.68, 5.45]; 85% cocoa: 4.80 ± 0.44 (SE), 95% CI[3.92, 5.68]; 70% cocoa: 5.53 ± 0.44 (SE), 95% CI [4.65, 6.42]; Milk: 6.27 ± 0.44 (SE), 95% CI [5.38, 7.15].Levels not connected by the same letter are significantly different.
3.3. Chocolate Consumption
There was a main effect of chocolate type on the amount of chocolate consumed (p < 0.0001).Overall, participants consumed significantly more milk chocolate (21 g ± 25 (SD)) than any otherchocolate type (90% cocoa: 3 g ± 9; 85% cocoa: 2 g ± 4; 70% cocoa: 6 g ± 10 (SD)). There was nocorrelation between the amount of chocolate consumed and the total number of positive responses orthe number of positive responses on the MBG, M, or E subscales. There was a main effect of hunger
34

Nutrients 2019, 11, 596
(F(1,18) = 11.74, p = 0.003) on the total amount of chocolate consumed. Post hoc analysis revealeda main effect of hunger (F(1,17) = 8.64, p = 0.009) on the amount of milk chocolate consumed only.There was no main effect of BES score on the total amount of chocolate consumed.
4. Discussion
The current study aimed to extend our previous findings on the psychoactive effects of consumingchocolate varying in cocoa, sugar, and fat concentrations using a validated ARCI “drug effects”questionnaire in a within-subject design. The questions used simultaneously reflect alterations inmotivation, mood, sensation, and perception, and, therefore, provide insight into the interrelationof these variables and chocolate consumption [16]. Our data indicate a measurable psychoactivedose–effect relationship with each incremental increase in the chocolate’s sugar content and decreasein the percent cocoa and fat contents. Overall, there were an inverse dose–effect relationship withcocoa concentration and fat content and a positive dose–effect relationship with the sugar content of achocolate. In addition, our data indicate that the dose–effect relationship of the different chocolateswas slightly different for each ARCI subscale. Thus, the present study is the first to demonstrate adose-dependent relationship between self-reported scores on the PEQ and chocolate consumption.
Increased feelings of well-being, euphoria, and physical and psychological feelings of excitementafter chocolate consumption are consistent with chocolate’s ability to modulate both the opioidand the dopamine neurotransmitter systems. Both human and animal research has demonstratedthe reinforcing potential and comforting and mood-ameliorating effects of chocolate [2,3,21–23].Contrary to our hypothesis, we did not find an association between self-reported scores on theMBG subscale and chocolate consumption. These results are also inconsistent with our previous studyin which self-reported scores on the MBG subscale were associated with an increased desire to eatmore chocolate [6]. A possible explanation for these findings is that subjective appetite measurementswere obtained prior to the tasting session rather than after; however, participants were allowed toconsume as much of the different chocolates as they wanted after the tasting session. On average,participants consumed 8 ± 15 g more chocolate than what was provided to them for the tasting session.Another possible explanation for this difference is that the smell and tasting of four different chocolatesin the same session as opposed to only one type of chocolate could have satiated the desire to eatmore chocolate. Massolt et al. [24] demonstrated that not only eating but simply smelling chocolate(85% cocoa) suppresses appetite. Additionally, Sørensen and Astrup [25] demonstrated that darkchocolate (70% cocoa) increases satiety and decreases the desire to eat something sweet more than milkchocolate. In the current study, participants consumed 15 g of dark chocolate before tasting the milkchocolate, and this could have decreased their appetite for more chocolate.
The sugar content, which plays a key role in chocolate’s pleasurable taste and texture, is importantin determining chocolate’s reinforcing potential [26]. Research has shown that the added sugarcomponent of a food is greatly associated with its reinforcing value [8,9,27]. We have also shown thatthe highly reinforcing properties of sugar are difficult to overcome [10,11]. The activation of sweettaste receptors, the speed at which the information about a food is delivered from the chemosensoryand somatosensory neurons in the mouth to the brain, and the magnitude of the activation of the foodreward system govern the reinforcing and rewarding effect of sugar [28,29]. Low et al. [30] recentlyreported that the average concentration at which sugar can be differentiated from water is 9 masspercent (m%); however, interindividual variability is large (reported range from 2 m% to 32 m%).The sugar content of the chocolates provided in this study were 8 m%, 13 m%, 30 m%, and 48 m%for the 90% cocoa, 85% cocoa, 70% cocoa, and milk chocolates, respectively. Therefore, our findingthat consuming the 85% cocoa, 70% cocoa, and milk chocolates resulted in significant increases inself-reported scores on the PEQ, and each subscale, above baseline is supported by the fact that all ofthese chocolates were above the 9 m% detection threshold.
In agreement with our prior study [6], consuming milk chocolate elicited a greater increase,compared to all the other chocolates, in the total number of positive responses as well as a greater
35
Nutrients 2019, 11, 596
increase in positive responses on the MBG subscale. The sugar content of the milk chocolate, which wasequivalent to the upper sucrose detection threshold reported by Low et al. [30], may explain theseresults, as well as the mass appeal of milk chocolate. Indeed, participants in the current studyconsumed an average of 21 ± 25 g of milk chocolate compared to 6 ± 10 g of the 70% cocoa and 2 ± 4 gof the 85% cocoa chocolates. Taken together, these results agree substantively with other indicators ofreinforcement essential for motivational behavior [15,31] and support the “addictive-like” behaviorresponse individuals can experience with chocolate, in particular milk chocolate, consumption.
The finding that consuming chocolate containing 90% cocoa increased the total number ofpositive responses and the number of positive responses on the E subscale is of interest, given itsreported “bitter” taste. The bioactive compounds found in dark chocolate may explain these positiveresults. In two double-blind, placebo control studies, Smit et al. [5] demonstrated that the amount ofmethylxanthines (theobromine and caffeine) found in dark chocolate can produce psychostimulanteffects. They found that the consumption of both encapsulated cocoa powder and a “typical portion” ofdark chocolate increases energetic arousal (“energetic”, “alert”, etc. versus “tired”, “sluggish”). This isconsistent with our results demonstrating chocolate’s ability to increase physical and psychologicalfeelings of excitement. Interestingly, when examined separately, the amount of theobromine foundin a “typical portion” of chocolate (200–300 mg) does not appear to play a psychopharmacologicalrole [32], whereas the amount of caffeine (25–35 mg) is well above the previously reported stimulatorythreshold (12.5 mg [33]). The amount of caffeine consumed from the 90% cocoa chocolate sample in thecurrent study was 9 mg, well below the stimulatory threshold. It may be that the theobromine foundin chocolate enhances the stimulatory effect of caffeine. Thus, it is plausible that the combination oftheobromine and caffeine found in chocolate provides an additive psychostimulant effect. While themethylxanthines in chocolate provide psychostimulant effects, Smit et al. [5], as well as Michenerand Rozin [26], reported no difference in chocolate cravings between the ingestion of cocoa powderversus placebo, whereas consuming chocolate, including white chocolate (albeit to a lesser extent),immediately reduced chocolate cravings. As mentioned above, another explanation for this findingis that the sugar content of the 90% cocoa chocolate (8 m%) is well above the lowest and close to theaverage sucrose detection threshold previously reported [30]. Taken together, these results confirmthat the combination of the main chocolate constituents is necessary to produce its psychoactive effects.
As expected, more milk chocolate was consumed than any of the other chocolates, indicating itsreinforcing potential. This is consistent with the greater number of positive responses on the PEQ.However, contrary to our hypothesis, we did not find an association between the total amount ofchocolate consumed or the total number of positive responses on the PEQ and BES scores. A potentialexplanation for this finding is all of our study participants had a score less than or equal to 17 andthus would be classified as non-binge eaters [20]. The narrow range in BES scores (2–17) of ourparticipants may not have provided the heterogeneity needed to reliably determine a correlationbetween BES scores and chocolate consumption or self-reported PEQ scores. Further studies areneeded to determine the potential correlation between BES scores and chocolate consumption orself-reported PEQ scores. Additionally, the low BES scores may also explain why we did not find anassociation between self-reported scores on the MBG subscale and chocolate consumption.
This study is not without limitations. The direct correlation between the percent cocoa and sugarcontent and the simultaneous changes of the fat content in the chocolate samples did not allow us toassess the independent psychoactive effects of each component. However, using commercially availablechocolate provides a “real-world” value to our observations. Furthermore, tasting the chocolatesamples sequentially in a relatively short amount of time may have produced an additive effect onour outcomes, such as habituation or sensory-specific satiety [34]. For this study, each participantconsumed a total of 20 g of chocolate (5 g/sample) compared to the 12.5 g provided in our previousstudy [6] with similar PEQ results. Therefore, it does not appear that our within-subject studydesign had a significant impact on our results. Lastly, the participants in this study tended to behealthy-weight individuals (57% of the participants), thus, the results may not reflect the response of
36

Nutrients 2019, 11, 596
overweight and obese individuals. Although we did not find a significant effect of BMI on self-reportedscores on the PEQ or any of the subscales, research has shown that food reinforcement can varysignificantly between lean, overweight, and obese individual [35–37] and individuals with an eatingdisorder [38,39]. Further research is needed to determine if there exist differential psychoactive effectsof chocolate consumption between lean, overweight, and obese populations and individuals with aneating disorder.
Our prior work suggests that obese individuals who engage in binge eating may do so becauseof an inherent reward deficiency, resulting in overeating high-sugar foods. We previously found anincrease in food reinforcement after the consumption of a liquid chocolate-based preload, indicatinga “sensitization” response to foods that increase the dopaminergic response [39]. Davis et al. [38]found that obese individuals diagnosed with binge eating disorder have a “hyper-reactivity to thehedonic properties of food, coupled with the motivation to engage in appetitive behaviors.” In womendiagnosed with bulimia nervosa (BN), Bulik et al. [40] reported that food reinforcement decreasesfollowing deprivation. On the basis of these results, we posit that obese individuals with an eatingdisorder would demonstrate an overall increase in their self-reported scores on the PEQ due to rewardsensitization. However, we would not anticipate a significant increase per se in obese individuals whodo not exhibit a binge eating-related eating disorder.
Although questionnaires provide validated subjective measurements about food reward andeating behavior, the use of objective methodologies provide insight into the effect of highly palatablefood on central dopamine activity and brain regions known to have a high density of dopamine neurons(positron emission tomography and functional magnetic resonance imaging, respectively). However,the cost of instrumentation, the expertise needed to operate the equipment and interpret the data,as well as the engineering and mechanical constraints of the scanners make objective measurementsof the dopaminergic response to food challenging. A promising methodology, electroretinography(ERG), may provide a more efficient way to objectively assess central dopamine activity. ERG isa clinical ophthalmological procedure that overcomes the impediments of other neuroimagingmethods. ERG records the electrical potential from the retina, which is dependent upon dopaminesignaling [41,42], in response to light simulation. ERG has been used to show a negative correlationbetween self-reported cocaine craving and dopamine-mediated retinal signal [43,44] and a positivecorrelation between dopamine metabolite levels in the cerebrospinal fluid [45] and dopamine-mediatedretinal signal. We have also used ERG to demonstrate a positive correlation between increaseddopamine-mediated retinal signal with food stimulation and BES scores [46], consistent with positronemission tomography [47]. We are currently conducting research to extend those findings to chocolatesvarying in cocoa, sugar, and fat content. Results from this ongoing study should provide furtherevidence that ERG should be considered as a low-cost, non-invasive method for objective evaluationof the stimulating properties of food in conjunction with ARCI questionnaires.
5. Conclusions
Chocolate’s ability to modulate both the opioidergic and the dopaminergic systems, evident bythe significant increase in self-reported scores on the PEQ, is consistent with research demonstratingchocolate’s reinforcing potential and comforting and mood-ameliorating effects [2,3,21–23].These results help explain chocolate’s high reinforcing value, as foods that elevate feelings of euphoria,as indicated by an increase in the number of positive responses on the MBG subscales, have a greaterreinforcing potential [17]. Given the measurable psychoactive dose–effect relationship observed in thisstudy, we posit that chocolate’s ability to provoke “addictive-like” eating behavior is initiated by itsbioactive compounds, and each incremental increase in added sugar further enhances these effects.
Author Contributions: The authors’ responsibilities were as follows—S.L.C. and J.A.N.: conceived the project,developed the overall research plan, oversaw the study, wrote and edited the manuscript, and had primaryresponsibility for final content; S.L.C., L.L., and E.A.: collected the data, analyzed the data, and edited themanuscript; and all authors read and approved the final manuscript.
37

Nutrients 2019, 11, 596
Funding: This work was supported by the Agricultural Research Services of the United States Departmentof Agriculture #5450-51530-051-00D (S.L.C.) and a competitive pilot grant from the Clinical TranslationalResearch Institute (CTRI/DUCOM) to J.A.N. The role of the funding sponsors was to approve the study and thesubmission of this manuscript for publication (USDA) and approve funding for the grant proposing this research(CTRI/DUCOM).
Acknowledgments: The authors would like to thank Clint Hall and Joshua Severud for their assistancewith the implementation of the protocol, data collection, and data entry, and Wei DU, MD, MS (Chair,Department of Psychiatry, Drexel University College of Medicine (DUCOM), for his insights on thephysiological/pharmacological effects of addictive substances.
Conflicts of Interest: The authors have nothing to disclose. Mention of trade names or commercial products inthis publication is solely for the purpose of providing specific information and does not imply recommendationor endorsement by the U.S. Department of Agriculture. The U.S. Department of Agriculture (USDA) prohibitsdiscrimination in all its programs and activities on the basis of race, color, national origin, age, disability, and whereapplicable, sex, marital status, familial status, parental status, religion, sexual orientation, genetic information,political beliefs, reprisal, or because all or part of an individual’s income is derived from any public assistanceprogram. (Not all prohibited bases apply to all programs.) Persons with disabilities who require alternative meansfor communication of program information (Braille, large print, audiotape, etc.) should contact USDA’s TARGETCenter at (202) 720-2600 (voice and TDD). To file a complaint of discrimination, write to USDA, Director, Office ofCivil Rights, 1400 Independence Avenue, S.W., Washington, D.C. 20250-9410, or call (800) 795-3272 (voice) or (202)720-6382 (TDD). USDA is an equal opportunity provider and employer.
References
1. Schulte, E.M.; Avena, N.M.; Gearhardt, A.N. Which foods may be addictive? The roles of processing,fat content, and glycemic load. PLoS ONE 2015, 10, e0117959. [CrossRef]
2. Macht, M.; Dettmer, D. Everyday mood and emotions after eating a chocolate bar or an apple. Appetite2006, 46, 332–336. [CrossRef] [PubMed]
3. Meier, B.P.; Noll, S.W.; Molokwu, O.J. The sweet life: The effect of mindful chocolate consumption on mood.Appetite 2017, 108, 21–27. [CrossRef]
4. Asmaro, D.; Liotti, M. High-caloric and chocolate stimuli processing in healthy humans: An integration offunctional imaging and electrophysiological findings. Nutrients 2014, 6, 319–341. [CrossRef] [PubMed]
5. Smit, H.J.; Gaffan, E.A.; Rogers, P.J. Methylxanthines are the psycho-pharmacologically active constituentsof chocolate. Psychopharmacology 2004, 176, 412–419. [CrossRef]
6. Nasser, J.A.; Bradley, L.E.; Leitzsch, J.B.; Chohan, O.; Fasulo, K.; Haller, J.; Jaeger, K.; Szulanczyk, B.; DelParigi, A. Psychoactive effects of tasting chocolate and desire for more chocolate. Physiol. Behav. 2011, 104,117–121. [CrossRef] [PubMed]
7. DiFeliceantonio, A.G.; Coppin, G.; Rigoux, L.; Edwin Thanarajah, S.; Dagher, A.; Tittgemeyer, M.; Small, D.M.Supra-additive effects of combining fat and carbohydrate on food reward. Cell Metab. 2018, 28, 33–44.e3.[CrossRef] [PubMed]
8. Epstein, L.H.; Carr, K.A.; Lin, H.; Fletcher, K.D. Food reinforcement, energy intake, and macronutrient choice.Am. J. Clin. Nutr. 2011, 94, 12–18. [CrossRef]
9. Stice, E.; Burger, K.S.; Yokum, S. Relative ability of fat and sugar tastes to activate reward, gustatory, andsomatosensory regions. Am. J. Clin. Nutr. 2013, 98, 1377–1384. [CrossRef]
10. Casperson, S.L.; Johnson, L.; Roemmich, J.N. The relative reinforcing value of sweet versus savory snackfoods after consumption of sugar- or non-nutritive sweetened beverages. Appetite 2017, 112, 143–149.[CrossRef]
11. Casperson, S.L.; Roemmich, J.N. Impact of dietary protein and gender on food reinforcement. Nutrients2017, 9, 957. [CrossRef] [PubMed]
12. Berridge, K.C. ‘Liking’ and ‘wanting’ food rewards: Brain substrates and roles in eating disorders. Physiol.Behav. 2009, 97, 537–550. [CrossRef]
13. Pecina, S. Opioid reward ‘liking’ and ‘wanting’ in the nucleus accumbens. Physiol. Behav. 2008, 94, 675–680.[CrossRef] [PubMed]
14. Wise, R.A. Role of brain dopamine in food reward and reinforcement. Philos. Trans. R. Soc. B Biol. Sci.2006, 361, 1149–1158. [CrossRef]
15. Balster, R.L.; Walsh, S.L. Addiction research center inventory. In Encyclopedia of Psychopharmacology;Stolerman, I.P., Ed.; Springer: Berlin/Heidelberg, Germany, 2010; p. 20.
38

Nutrients 2019, 11, 596
16. Haertzen, C.A. Development of scales based on patterns of drug effects, using the addiction research centerinventory (arci). Psychol. Rep. 1966, 18, 163–194. [CrossRef] [PubMed]
17. Schulte, E.M.; Smeal, J.K.; Gearhardt, A.N. Foods are differentially associated with subjective effect reportquestions of abuse liability. PLoS ONE 2017, 12, e0184220. [CrossRef]
18. Leigh, S.J.; Morris, M.J. The role of reward circuitry and food addiction in the obesity epidemic: An update.Biol. Psychol. 2018, 131, 31–42. [CrossRef]
19. Novelle, M.G.; Dieguez, C. Food addiction and binge eating: Lessons learned from animal models. Nutrients2018, 10, 71. [CrossRef] [PubMed]
20. Gormally, J.; Black, S.; Daston, S.; Rardin, D. The assessment of binge eating severity among obese persons.Addict. Behav. 1982, 7, 47–55. [CrossRef]
21. Scholey, A.; Owen, L. Effects of chocolate on cognitive function and mood: A systematic review. Nutr. Rev.2013, 71, 665–681. [CrossRef]
22. Bruinsma, K.; Taren, D.L. Chocolate: Food or drug? J. Am. Diet. Assoc. 1999, 99, 1249–1256. [CrossRef]23. Parker, G.; Parker, I.; Brotchie, H. Mood state effects of chocolate. J. Affect. Disord. 2006, 92, 149–159.
[CrossRef] [PubMed]24. Massolt, E.T.; van Haard, P.M.; Rehfeld, J.F.; Posthuma, E.F.; van der Veer, E.; Schweitzer, D.H. Appetite
suppression through smelling of dark chocolate correlates with changes in ghrelin in young women.Regul. Pept. 2010, 161, 81–86. [CrossRef]
25. Sorensen, L.B.; Astrup, A. Eating dark and milk chocolate: A randomized crossover study of effects onappetite and energy intake. Nutr. Diabetes 2011, 1, e21. [CrossRef]
26. Michener, W.; Rozin, P. Pharmacological versus sensory factors in the satiation of chocolate craving.Physiol. Behav. 1994, 56, 419–422. [CrossRef]
27. Avena, N.M.; Rada, P.; Hoebel, B.G. Evidence for sugar addiction: Behavioral and neurochemical effects ofintermittent, excessive sugar intake. Neurosci. Biobehav. Rev. 2008, 32, 20–39. [CrossRef] [PubMed]
28. Treatment for Stimulant Use Disorders; Treatment Improvement Protocol (TIP) Series, No. 33; Center forSubstance Abuse Treatment: Rockville, MD, USA, 1999.
29. Lee, A.A.; Owyang, C. Sugars, sweet taste receptors, and brain responses. Nutrients 2017, 9, 653. [CrossRef]30. Low, J.Y.; McBride, R.L.; Lacy, K.E.; Keast, R.S. Psychophysical evaluation of sweetness functions across
multiple sweeteners. Chem. Senses 2017, 42, 111–120. [CrossRef]31. Noori, H.R.; Cosa Linan, A.; Spanagel, R. Largely overlapping neuronal substrates of reactivity to drug,
gambling, food and sexual cues: A comprehensive meta-analysis. Eur. Neuropsychopharmacol. 2016, 26, 1419–1430.[CrossRef] [PubMed]
32. Baggott, M.J.; Childs, E.; Hart, A.B.; de Bruin, E.; Palmer, A.A.; Wilkinson, J.E.; de Wit, H.Psychopharmacology of theobromine in healthy volunteers. Psychopharmacology 2013, 228, 109–118.[CrossRef] [PubMed]
33. Smit, H.J.; Rogers, P.J. Effects of low doses of caffeine on cognitive performance, mood and thirst in low andhigher caffeine consumers. Psychopharmacology 2000, 152, 167–173. [CrossRef] [PubMed]
34. Hetherington, M.; Rolls, B.J.; Burley, V.J. The time course of sensory-specific satiety. Appetite 1989, 12, 57–68.[CrossRef]
35. Temple, J.L.; Bulkley, A.M.; Badawy, R.L.; Krause, N.; McCann, S.; Epstein, L.H. Differential effects of daily snackfood intake on the reinforcing value of food in obese and nonobese women. Am. J. Clin. Nutr. 2009, 90, 304–313.[CrossRef] [PubMed]
36. Volkow, N.D.; Wang, G.J.; Tomasi, D.; Baler, R.D. Obesity and addiction: Neurobiological overlaps. Obes. Rev.2013, 14, 2–18. [CrossRef]
37. Epstein, L.H.; Carr, K.A.; Lin, H.; Fletcher, K.D.; Roemmich, J.N. Usual energy intake mediates therelationship between food reinforcement and bmi. Obesity 2012, 20, 1815–1819. [CrossRef]
38. Davis, C.A.; Levitan, R.D.; Reid, C.; Carter, J.C.; Kaplan, A.S.; Patte, K.A.; King, N.; Curtis, C.; Kennedy, J.L.Dopamine for “wanting” and opioids for “liking”: A comparison of obese adults with and without bingeeating. Obesity 2009, 17, 1220–1225. [CrossRef]
39. Nasser, J.A.; Evans, S.M.; Geliebter, A.; Pi-Sunyer, F.X.; Foltin, R.W. Use of an operant task to estimate foodreinforcement in adult humans with and without bed. Obesity 2008, 16, 1816–1820. [CrossRef]
40. Bulik, C.M.; Brinded, E.C. The effect of food deprivation on the reinforcing value of food and smoking inbulimic and control women. Physiol. Behav. 1994, 55, 665–672. [CrossRef]
39

Nutrients 2019, 11, 596
41. Witkovsky, P.; Veisenberger, E.; Haycock, J.W.; Akopian, A.; Garcia-Espana, A.; Meller, E. Activity-dependentphosphorylation of tyrosine hydroxylase in dopaminergic neurons of the rat retina. J. Neurosci.2004, 24, 4242–4249. [CrossRef]
42. Lavoie, J.; Illiano, P.; Sotnikova, T.D.; Gainetdinov, R.R.; Beaulieu, J.M.; Hebert, M. The electroretinogram asa biomarker of central dopamine and serotonin: Potential relevance to psychiatric disorders. Biol. Psychiatry2014, 75, 479–486. [CrossRef]
43. Roy, M.; Smelson, D.A.; Roy, A. Abnormal electroretinogram in cocaine-dependent patients. Relationship tocraving. Br. J. Psychiatry 1996, 168, 507–511. [CrossRef]
44. Smelson, D.A.; Roy, A.; Roy, M.; Tershakovec, D.; Engelhart, C.; Losonczy, M.F. Electroretinogram andcue-elicited craving in withdrawn cocaine-dependent patients: A replication. Am. J. Drug Alcohol Abuse2001, 27, 391–397. [CrossRef]
45. Roy, A.; Roy, M.; Berman, J.; Gonzalez, B. Blue cone electroretinogram amplitudes are related to dopaminefunction in cocaine-dependent patients. Psychiatry Res. 2003, 117, 191–195. [CrossRef]
46. Nasser, J.A.; Del Parigi, A.; Merhige, K.; Wolper, C.; Geliebter, A.; Hashim, S.A. Electroretinographic detectionof human brain dopamine response to oral food stimulation. Obesity 2013, 21, 976–980. [CrossRef]
47. Wang, G.J.; Geliebter, A.; Volkow, N.D.; Telang, F.W.; Logan, J.; Jayne, M.C.; Galanti, K.; Selig, P.A.; Han, H.;Zhu, W.; et al. Enhanced striatal dopamine release during food stimulation in binge eating disorder. Obesity2011, 19, 1601–1608. [CrossRef]
© 2019 by the authors. Licensee MDPI, Basel, Switzerland. This article is an open accessarticle distributed under the terms and conditions of the Creative Commons Attribution(CC BY) license (http://creativecommons.org/licenses/by/4.0/).
40

nutrients
Discussion
Fat Addiction: Psychological andPhysiological Trajectory
Siddharth Sarkar 1, Kanwal Preet Kochhar 2 and Naim Akhtar Khan 3,*
1 Department of Psychiatry and National Drug Dependence Treatment Centre (NDDTC), All India Institute ofMedical Sciences (AIIMS), New Delhi 110029, India; [email protected]
2 Department of Physiology, All India Institute of Medical Sciences (AIIMS), New Delhi 110029, India;[email protected]
3 Nutritional Physiology and Toxicology (NUTox), UMR INSERM U1231, University of Bourgogne andFranche-Comte (UBFC), 6 boulevard Gabriel, 21000 Dijon, France
* Correspondence: [email protected]; Tel.: +33-3-80-39-63-12; Fax: + 33-3-80-39-63-30
Received: 9 October 2019; Accepted: 12 November 2019; Published: 15 November 2019
Abstract: Obesity has become a major public health concern worldwide due to its high socialand economic burden, caused by its related comorbidities, impacting physical and mental health.Dietary fat is an important source of energy along with its rewarding and reinforcing properties.The nutritional recommendations for dietary fat vary from one country to another; however, the dietaryreference intake (DRI) recommends not consuming more than 35% of total calories as fat. Foodrich in fat is hyperpalatable, and is liable to be consumed in excess amounts. Food addiction as aconcept has gained traction in recent years, as some aspects of addiction have been demonstrated forcertain varieties of food. Fat addiction can be a diagnosable condition, which has similarities with theconstruct of addictive disorders, and is distinct from eating disorders or normal eating behaviors.Psychological vulnerabilities like attentional biases have been identified in individuals described tobe having such addiction. Animal models have provided an opportunity to explore this concept in anexperimental setting. This discussion sheds light on fat addiction, and explores its physiological andpsychological implications. The discussion attempts to collate the emerging literature on addiction tofat rich diets as a prominent subset of food addiction. It aims at addressing the clinical relevance atthe community level, the psychological correlates of such fat addiction, and the current physiologicalresearch directions.
Keywords: diet; fat; food addiction; obesity
1. Introduction
Over the last half a century, many developing countries have seen rapid socio-economicdevelopment, resulting in a move from a traditional to a modern way of life, including changesin local dietary and culinary profiles [1–3]. Abundance and easy availability of food, especially the onethat is rich in fat and carbohydrate, have resulted in changes of dietary patterns and preferences. Rightfrom early childhood in developing brains, the exposure and imprinting to high sugar, high salt andhigh fat food (rich in saturated and trans-fat), which is cheap and easily available, are impacting thehealth of younger population. Trans fat may lead to its greater consumption than polyunsaturated fat,as the latter is more quicker than the former to trigger satiety [4]. The changes in dietary intake profilewith cultural and societal transitions have gained traction [5]. The dietary profile and constitution havea role in the etiopathogenesis of lifestyle-related diseases like obesity, metabolic syndrome, coronaryartery disease, gut motility disorders, psychosomatic, autoimmune as well as degenerative disorders.Major transition, noticed during the last couple of years, has been an increasing use of sugar, processedfood, beverages, animal-fat based food rich in trans-fats that have impacted human health [6–10].
Nutrients 2019, 11, 2785; doi:10.3390/nu11112785 www.mdpi.com/journal/nutrients41

Nutrients 2019, 11, 2785
In the recent years, there is a growing interest in the concept of food addiction from both clinicaland applied nutritional research perspectives [9,11–14]. The increase in obesity, and associatedmetabolic syndrome and diabetes mellitus have called into the questions about factors leading togenesis of obesity. The imbalance of energy intake has been proposed as one of the reasons of increasingprevalence of obesity, though there are other several factors, i.e., epigenetics, psychological trauma,use of medications and dieting, that may increase body weight gain. why do some individualsconsume excess of certain types of food (including fat-rich food)? Hence, the phenomenon of addictionto food has been suggested to be one of the mechanisms. Food addiction can refer to a varietyof substrates, but fat and sugars have been considered the typical prototype food items to whichindividuals develop addiction. The occurrence of distinct features of salience and inability to controlintake of specific types of foods have been considered similar to addiction to other psychoactivesubstances. The adverse consequences of uncontrolled fat intake on the body metabolism have beendocumented [15,16]. This has implications in intervention modules for addressing this problem andpromoting healthy lifestyles [17,18]. Yet, the understanding of fat addiction as a concept is still underevolution, and progress is being made to characterise and discern the psychology and physiologybehind this condition.
Recent studies suggest that fat has its own metabolic, physiological and nutritional profiles, whichare distinct from other macronutrients [19–21]. Fat accords palatability and organoleptic properties tofood, and is consumed across all ages from infancy through adulthood to elderly. Evolutionarily, thisconfers survival benefit due to high energy density, more so in cultures with thrifty genotypes [22–24].In recent years, the benefits of mono-unsaturated fatty acid and controlled amounts of saturated fatintake have been revisited, especially in the context of benefits in cognitive functioning, synapticconnectivity, and membrane stability for both brain and heart health [25,26].
In this context, taste for fat has been proposed as the sixth taste modality in recent years [27].The interactions between fatty acids and specific receptors in taste bud cells elicit physiologicalchanges that are implicated in dietary fat preference via the activation of tongue-brain-gut axis.This phenomenon has an implication in the genesis of obesity as oro-sensory detection of nutrientsdetermines the ‘liking’ and ‘wanting’ of food products. It has been proposed that there are twocomponents of eating behavior, represented in neuronal circuits, i.e., emotional (hedonic and affective)and metabolic (homeostatic). Obesity may arise due to the imbalance of these two eating motives.
Research on food addiction or eating addiction has not paid distinct attention to specific nutrientslike dietary fat [9,10,12,13]. The concept of fat addiction would have important psychologicaldeterminants like motivation, depression, anxiety and reasoning that merit cautious evaluation. Thereis cognitive appraisal that makes an individual “like” and “want” a specific food product, and thereward obtained from the food is cognitively processed as well. Hence, the intertwined psychologicaland physiological aspects of addiction towards fat rich food must be considered and understoodfurther. There is a lack of comprehensive synthesis of literature to provide an account of fatty foodaddiction. In this paper, we have aimed at providing an overview of the construct, the clinical relevance,the psychological correlates, and the current physiological research trajectory in the emerging areaof fat addiction as a subset of food addiction. Wherever specific literature with regard to fat is notavailable, evidence related to food addiction will be alluded to. However, our main emphasis is todiscuss about fat addiction as this phenomenon might lead to high dietary fat intake and, consequently,to obesity. The term “high fat” in this article would mean the diet where the calories brought by fat aremore than 40% of total dietary calories as most of industrialized countries recommend to respect thislimit. As we have mentioned in the title, our main emphasis is to shed light on fat addiction and wehave excluded other addictive behaviors like sweet addiction.
2. The Construct of Fat Rich Food Addiction
Addressing the issue of obesity would require improved knowledge of pathophysiological andneurobehavioral mechanisms. This would help better target behaviors which predispose individuals
42

Nutrients 2019, 11, 2785
to obesity [28]. Schmidt and Campbell argue that disordered eating cannot remain “brainless” [29],and the “psychological constructs”, that define aberrant consumptive patterns of food, are relevant.In this regard, addiction to food explains hedonistic excess and uncontrolled consumption of fooditems which are associated with adverse consequences.
Addiction towards fat rich diet relates to the overall definition of addiction. Addiction has beenconceptualized as a maladaptive pattern of substance intake or behavior that signifies neurobiologicalchanges and is associated with adverse consequences. The nosological systems providing nomenclatureto diagnosis has moved on from abuse and dependence to substance use disorders in DSM5. The criteriabased evaluation of the cluster of symptomatology helps provide with coherent account of the disorder,and categorize individuals who meet a threshold for diagnosis and consequent potential treatment.
2.1. Defining Fatty Food Addiction in the Context of Nutrient Intake
Food addiction shares some of the commonalities with drug addiction like craving, bingeingand tolerance [30]. The DSM5 criteria for substance use disorders have been adapted and explored inthe context of food addiction [31,32]. The 11 criteria for substance use disorders can be applicable toindividuals with addiction to lipid dense foods (especially trans and saturated fat). The empiricallysupported criteria describe a substance (food) often taken in larger amounts or over a longer period oftime than that was intended, persistent desire or unsuccessful efforts to cut down or control substanceuse (food), and continued use despite knowledge of having a persistent or recurrent physical orpsychological problem. The plausible features include great deal of time being spent in activitiesnecessary to obtain or use the substance (food) or recover from its effects, recurrent substance (food) useresulting in a failure to fulfil major role obligations, continued use despite having persistent or recurrentsocial or interpersonal problems, important social, occupational, or recreational activities are given upor reduced, and tolerance. What might be difficult to clearly clinically elicit are withdrawal (whiledifferentiating from energy deficit), and recurrent use in physically hazardous situations. As withdifferent substances, each of the criteria is endorsed to different extent by a sample of participants.
The diagnostic constructs related to food addiction include binge eating disorder and an eatingdisorder not otherwise specified. Binge eating disorder is characterised by repeated ingestion ofeating in large amounts of food in a short amount of time, followed by intense guilt and attempts toeither remove the food (by vomiting or using laxatives) or compensatory behaviors to increase theenergy expenditure [33,34]. On the other hand, eating disorder not otherwise specified is a diagnosticrubric that resembles anorexia nervosa or binge eating disorder, but does not fulfil the diagnosticthresholds for these disorders. These disorders may have some overlap with food addiction from aphenomenological and behavioral perspective, but the constructs themselves are distinct. It has beenseen that individuals with binge eating disorders have greater rates of food addiction, than expectedby chance [35,36], though at the same time, not all individuals with binge eating disorders would havefood addiction [36,37].The main point of divergence lies in the focus of the constructs: food addictionlays emphasis on the salience and loss of control of hedonic eating behaviors, while eating disordersare accompanied by intense immediate guilt after excessive food consumption and efforts are made toget rid of (effects of) the ingested food quickly.
2.2. Clinical and Epidemiological Implications of Addiction towards Fat
While limited literature has looked at addiction to fat rich foods per se, there is enough evidencethat has ascertained the occurrence rate and determinants of food addiction in the community andclinical samples [38,39]. The questionnaires used to assess food addiction generally incorporate fat as acomponent of food that the respondents are asked to think about, when they answer the questions.The Yale Food Addiction Scale is perhaps the most commonly used instrument for the assessment offood addiction. The weighted mean prevalence of food addiction according to this instrument was19.9% [38]. The prevalence of food addiction was high in women with obesity [38]. Also, food addictionwas higher in clinical samples, as compared to community samples [37,38]. Food addiction was high
43

Nutrients 2019, 11, 2785
in subjects that were either obese, or suffered from eating disorders. High scores of food addictionwere associated with high depressive symptoms, food craving and impulsivity. Food addiction hasnot only been related to negative mood states, but also with poorer quality of life [40]. It has beenseen that individuals with food addiction had higher dietary fat intake as compared to those withoutfood addiction [41]. Similarly, Pursey et al reported that the subjects with high food addiction scoreshad high percentage of consumption of saturated fat [42]. Thus, food addiction provides a paradigmfor identification of individuals with skewed dietary profiles with other psychological vulnerabilities,which might require concomitant attention.
Food addiction has also been studied in those individuals who have undergone bariatric surgerywhich is generally indicated for people with severe obesity [43]. The rates of food addiction in bariatricsurgery population go down after the surgery. In one study, the proportion of individuals withfood addiction reduced to 2% post-surgery from 32% pre-surgery [44]. Another long term follow-upsuggested that the rates of food addiction reduced from 57.8% to 7.2% at 6 months and to 13.7% at12 months after surgery [45]. In pre-operative cases of bariatric surgery, the dietary intervention isless effective in individuals with food addiction [46]. It has been seen that food addiction in bariatricsurgery patients was associated with greater levels of depression, anxiety and binge eating episodes,though it did not predict the degree of weight loss. Thus, it seems that food addiction has some clinicalprognostic influence with surgical intervention outcomes.
2.3. Measurement Approaches
Currently the standard of practice for determination of food addiction has been the diagnosticcut-off from the Yale Food Addiction Scale (YFAS) [47]. The YEAS is a 25 item self–reported questionnairebased scale that assesses various features of food addiction. There are two items that assess for clinicallysignificant impairment or distress. The instrument looks at the past year pattern of food intake andincludes fatty foods like steak, bacon, hamburgers, cheeseburgers, pizza, and French fries as oneof the representative group of foods that are mentioned in the questionnaire. The instrument hasbecome standard of use in the field of food addiction. The instrument has adequate internal reliability,good convergent validity and good discriminant validity. The instrument has been adapted for usein children [48]. The instrument has also been translated into several other languages like Chinese,French and Malay [49–51]. A newer version of the scale (YFAS 2.0) has been developed considering thechanges in conjunction with the DSM5 [52]. The instrument has been used in studies of epidemiology,etiology, nosology and interventions of food addiction. While the YFAS addressed food as a whole,assessing fat addiction separately may have implications for interventions. This could be in terms ofthe type of food products that are focused upon in the intervention modules that are developed. Thiswould have also a corollary for the investigation procedures that can include assessment of salienceand behavioral neuroplasticity (eye tracking and neuroimaging) for different types of food products(fat rich versus carbohydrate rich, sweet versus savory fatty food) that are implicated in food addiction.
Other self-reported scales and questionnaires for assessment of aspects of food addiction are alsoavailable and have been validated, though they rely on features like craving and eating patterns. Theseinclude Eating Behaviors Questionnaire [53], Food Cravings Questionnaire [54], Eating Behaviors PatternsQuestionnaire [55], and Power of Food Scale [56]. Many of these questionnaires are self-reported, i.e.,the individual reads through the questions and responds through them. The responses are thereaftergraded and interpreted based upon the cut-offs from the population scores.
3. Psychological Correlates of Addiction to Fat Rich Diets
3.1. Attentional Biases and Cognitive Functioning
Research has been carried out towards attentional biases and psychological processing inindividuals with food addiction. Obese as compared to lean teens showed less activation of prefrontalregions (dorsolateral prefrontal cortex, ventral lateral prefrontal cortex) when trying to inhibit responses
44

Nutrients 2019, 11, 2785
to high-calorie food images which suggest behavioral evidence of reduced inhibitory control [57].Adults who had greater dorsolateral prefrontal cortex activation when instructed to “resist craving”after viewing food images had better weight loss success following gastric bypass surgery [58].This suggests that visual cue induction paradigms have relevance to assessment of how food imagesare processed centrally.
Rodrigue et al. [59] compared those with higher and lower food addiction scores on cognitiveprocesses of planning, inhibition, cognitive flexibility and error processing. The investigatorsfound that high food addiction group differed from the low food addiction group only in termsof inhibition/cognitive flexibility scaled scores, but not in individual scores. The authors infer thatthough basic level processes are intact, individuals with higher food addiction scores experiencegreater difficulties in more challenging context where they had to simultaneously keep in mind toinhibit a behavior and switch their mind-set when the task required it. This might make it difficultfor them to anticipate the long-term consequences of behavior. Also, individuals with symptoms offood addiction made more errors as the interference task became challenging, suggesting that thosewith food addiction might have greater difficulty in detecting and monitoring errors. Another studycompared error monitoring among individuals with food addiction and healthy controls using theEriksen flanker task [60]. The results suggested that food addiction group had higher number of errorson the flanker task, implying impaired performance monitoring and cognitive control, as seen withother addictions. In a study that included women with obesity, food addiction severity levels werenegatively correlated with overall scores on the Iowa Gambling Task, which measures decision makingcapacity [61]. Also, those with food addiction had attentional deficits as reflected by more omissionsand perseveration errors on the Continuous Performance Task. On the other hand, Blume et al. [62]compared response inhibition, attention, decision-making, and impulsivity among four groups ofindividuals, i.e., obesity and food addiction; obesity and binge eating disorder; obesity/food addictionand binge eating disorder; and obesity only. The authors did not find food addiction to be related toaltered executive functioning.
Ruddock et al. [63] evaluated the attentional bias using eye tracking while showing picturesof chocolate among individuals with self-perceived food addiction in design that evaluated statefactors like hunger or expectancy of reward or having food addiction. The authors found that theexpectancy of receiving chocolate as reward was associated with attentional bias, while hunger state orhaving self-perceived food addiction was not associated with attentional bias toward food related cues.In another eye tracking paradigm, sad mood induction through showing of a video of child passingaway with cancer was associated with attentional bias towards unhealthy food among those with foodaddiction, but such a change did not occur in those without food addiction [64]. This suggests thatemotional cues may impel or prime those with food addiction towards specific food types. In anotherstudy, Gearhardt et al. [65] studied food-related visual attention and dwell time of food stuff amongobese and overweight women. The authors reported that hunger was associated with attentionalbias toward sweets, and trend level attentional bias towards fried (fatty) foods. On the other hand,hunger was associated with shorter dwell time on fried food. Taken together, literature suggeststhat hunger may be an important component that may influence attentional biases in individualswith food addiction. We acknowledge that though addiction has gained traction, fat addiction is anemerging concept, and nevertheless needs debate and discussion to inform lifestyle practices andresearch directions.
3.2. Craving and Liking
Craving and liking are related, but represent distinct terms that are linked to food addiction.While craving refers to desire or urge to eat a food item, liking refers to qualitative and affectiveevaluation of food [66–68]. Liking for fat has been evaluated in a large web-based study to examine thedeterminants of dietary patterns and nutritional status [69]. The investigators reported that individualswith a strong liking for fat had high total energy and fat intake, and high consumption of saturated fats,
45
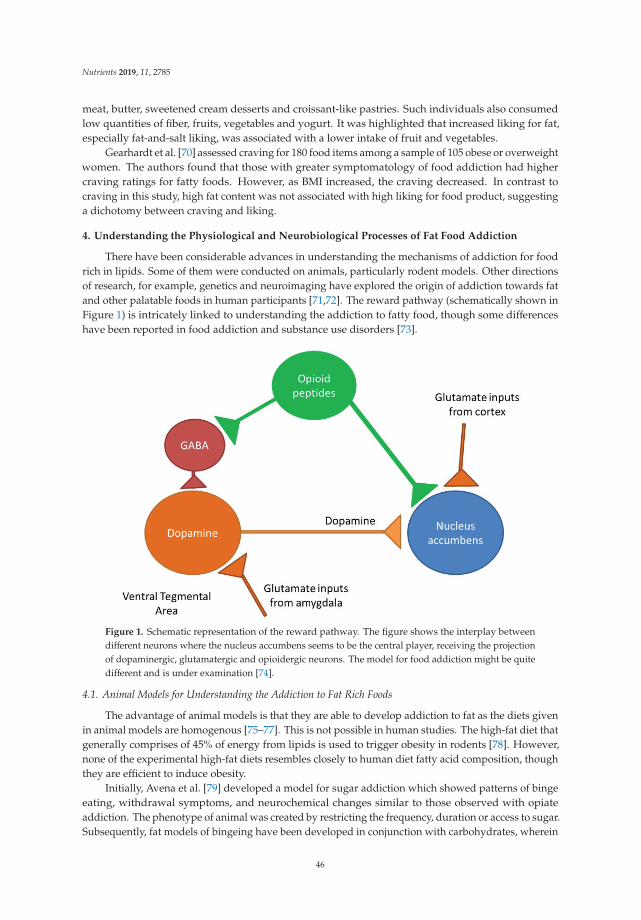
Nutrients 2019, 11, 2785
meat, butter, sweetened cream desserts and croissant-like pastries. Such individuals also consumedlow quantities of fiber, fruits, vegetables and yogurt. It was highlighted that increased liking for fat,especially fat-and-salt liking, was associated with a lower intake of fruit and vegetables.
Gearhardt et al. [70] assessed craving for 180 food items among a sample of 105 obese or overweightwomen. The authors found that those with greater symptomatology of food addiction had highercraving ratings for fatty foods. However, as BMI increased, the craving decreased. In contrast tocraving in this study, high fat content was not associated with high liking for food product, suggestinga dichotomy between craving and liking.
4. Understanding the Physiological and Neurobiological Processes of Fat Food Addiction
There have been considerable advances in understanding the mechanisms of addiction for foodrich in lipids. Some of them were conducted on animals, particularly rodent models. Other directionsof research, for example, genetics and neuroimaging have explored the origin of addiction towards fatand other palatable foods in human participants [71,72]. The reward pathway (schematically shown inFigure 1) is intricately linked to understanding the addiction to fatty food, though some differenceshave been reported in food addiction and substance use disorders [73].
Figure 1. Schematic representation of the reward pathway. The figure shows the interplay betweendifferent neurons where the nucleus accumbens seems to be the central player, receiving the projectionof dopaminergic, glutamatergic and opioidergic neurons. The model for food addiction might be quitedifferent and is under examination [74].
4.1. Animal Models for Understanding the Addiction to Fat Rich Foods
The advantage of animal models is that they are able to develop addiction to fat as the diets givenin animal models are homogenous [75–77]. This is not possible in human studies. The high-fat diet thatgenerally comprises of 45% of energy from lipids is used to trigger obesity in rodents [78]. However,none of the experimental high-fat diets resembles closely to human diet fatty acid composition, thoughthey are efficient to induce obesity.
Initially, Avena et al. [79] developed a model for sugar addiction which showed patterns of bingeeating, withdrawal symptoms, and neurochemical changes similar to those observed with opiateaddiction. The phenotype of animal was created by restricting the frequency, duration or access to sugar.Subsequently, fat models of bingeing have been developed in conjunction with carbohydrates, wherein
46

Nutrients 2019, 11, 2785
corn oil is used as a reinforcing food item. However, the features of opiate-like withdrawal were notnoted by Avena et al. [80] when animals were deprived of food after fat bingeing. This observationsuggests that fat addiction may have different phenomenological aspects than the addiction to sugars.An alternate explanation could be that fat addiction might be more closely aligned to behavioraladdiction like gambling disorder, while addiction to sugar rich food might be more closely alignedto substance use disorders. The development of animal models has the potential to advance thefield substantially, by enabling to better understand the neurobiological alterations, and to assessthe changes in bingeing behaviors with medications or other interventions [81]. Yet, one needs to becognizant of the fact that translation of human behavior of food consumption is much more complexthan animals, and is influenced by socio-economic and political environment, and the determinantslike cost, availability and marketing. Furthermore, it is possible that modeling addiction in animals(especially rodents) might differ substantially from clinical situation [8]. It has been argued thatsimplistic experiments would need critical reflection about translational validity of patterns of eatingbehavior and food choice from animals to humans.
4.2. Neurotransmitters Including Dopamine
Animal studies have suggested implication of dopamine in the nucleus accumbens in the rat modelof addictive behaviors towards fat [82]. Hence, microdialysis samples were taken in this model before,during and after sham feeding with corn oil. The study found an increase in dopamine in the shamlicking group leading to the inference that corn oil increases dopamine concentrations in the nucleusaccumbens in a manner similar to those induced by sucrose. In another study, low concentration ofnon-esterified fatty acid (linoleic acid) increased the dopamine levels in the nucleus accumbens andamygdala in a manner equivalent to those resulting from corn oil in the brain’s reward system [83].
Dela Cruz and colleagues studied the expression of c-Fos in reward circuit areas in rats which wereexposed to sugars and fats [84,85]. The authors reported c-Fos like immunoreactivity after consumptionof corn oil solutions, isocaloric glucose and fructose, in the dopaminergic mesotelencephalic nuclei(ventral tegmental area) and projections (infralimbic and prelimbic medial prefrontal cortex, basolateraland central-cortico-medial amygdala, core of nucleus accumbens as well as the dorsal striatum), but notin the nucleus accumbens shell. This signified transcriptional activation of the dopaminergic pathwaywith exposure to certain nutrients including fat.
Dela Cruz et al aimed at investigating whether dopamine antagonists (D1 receptor antagonistSCH23390 and D2 receptor antagonist raclopride) attenuated the development of fat conditionedflavour preference among rats [86]. These investigators reported that, as compared to sucrose,the D1 and D2 receptor antagonists were not able to attenuate the fat conditioned flavor preference.They further suggested that fat addiction in rats could possibly have distinct mechanisms than sugars,which involved the post ingestive phase.
The role of opioid receptors and fatty food addiction has also been explored [76]. It hasbeen seen that after injection of morphine, a mu-opioid receptor agonist, rats preferred fats overcarbohydrates when both were available. Intra-accumbens administration of opioid agonists increasedthe consumption of fats, and the effect was blocked by the administration of naltrexone, an opioidantagonist [87]. The opioid receptors have been implicated in not only the ‘liking’ process, but also the‘wanting’ process of excessive food consumption, and the effects are blocked by opioid antagonists.
Endocannabinoid system is another neurotransmitter system studied in relation with animalmodel of excessive fat consumptive behavior. Ward et al. [88] studied male, cannabinoid (CB1)knockout mice which were trained to respond to the sweet reinforcer (Ensure) or corn oil. The authorssuggest that CB1 receptor antagonism selectively attenuated reinstatement of responding for Ensure.Interestingly, the genetic deletion of the CB1 receptor did not attenuate reinstatement of corn-oil seeking.The authors suggest that either CB1 receptor system does not play an equivalent role in modulatingconditioned seeking or corn oil may serve as a robust reinforcer. Additionally, Brissard et al. [89]found that invalidation of CB1R gene was related to lower levels of fat preference among mice, and
47

Nutrients 2019, 11, 2785
similar results were obtained after using rimonabant, a cannabinoid receptor antagonist. The authorsreported that fat taste perception was mediated through calcium signaling and GLP-1 secretion inlingual taste bud cells. Peterschmitt et al. [90] looked at the link between the gustatory and the rewardpathway with regard to fat intake. The authors observed that lipid taste perception was based uponthe systematic activation of the major cerebral structures of the canonical gustatory pathway and wasintricately linked to the reward pathway through the ventral tegmental area.
4.3. Neuroimaging Correlates
Though literature exists on the neuroimaging correlates of obesity [91,92], studies on theneuroimaging of food addiction have gradually started to come up. Gearhardt et al. [93] assessed theblood oxygen level-dependent functional magnetic resonance imaging (fMRI) activation in responseto receipt and anticipated receipt of palatable food (chocolate milkshake) among adolescent femaleparticipants. The investigators demonstrated that food addiction scores correlated with greateractivation in the anterior cingulate cortex, medial orbitofrontal cortex and amygdala, consequent toanticipated receipt of food. The participants with high food addiction scores had enhanced activation ofdorsolateral prefrontal cortex and caudate, but less activation in lateral orbitofrontal cortex in responseto anticipated receipt of food. These findings underscore the similarity of food addiction to other typesof addictions, especially in relation to involvement of the reward pathway.
Hsu et al. [94] assessed response inhibition and error processing among subjects with obesityand sweet food addiction by fMRI. Women with obesity and food addiction had a higher scorefor impulsivity and lower brain activation (processing response inhibition over the right rolandicoperculum and thalamus) than controls. The activation during error processing over the left insula,precuneus, and bilateral putamen were higher in the subjects with obesity and sweet food addictionthan controls. These findings suggest that women with obesity and sweet food addiction have impairedrolandic operculum activation.
A further study looked at the relationship of food addiction and functional connectivity in thebrain during fasting and fed state [95]. The authors found that high number of symptoms of foodaddiction were associated with ventral caudate-hippocampus hyperconnectivity in the fasted scan only.However, a significant reduction of this connectivity was observed in the fed scans, suggesting thatheightened connectivity in the ventral striatum during a fasted state corroborated reward predictionsignals, further lending credence to the involvement of the reward pathway.
A schematic representation of the neurobiological relationship of fatty food intake, mediatedthrough gustatory signaling and reward pathway, is presented in Figure 2.
48
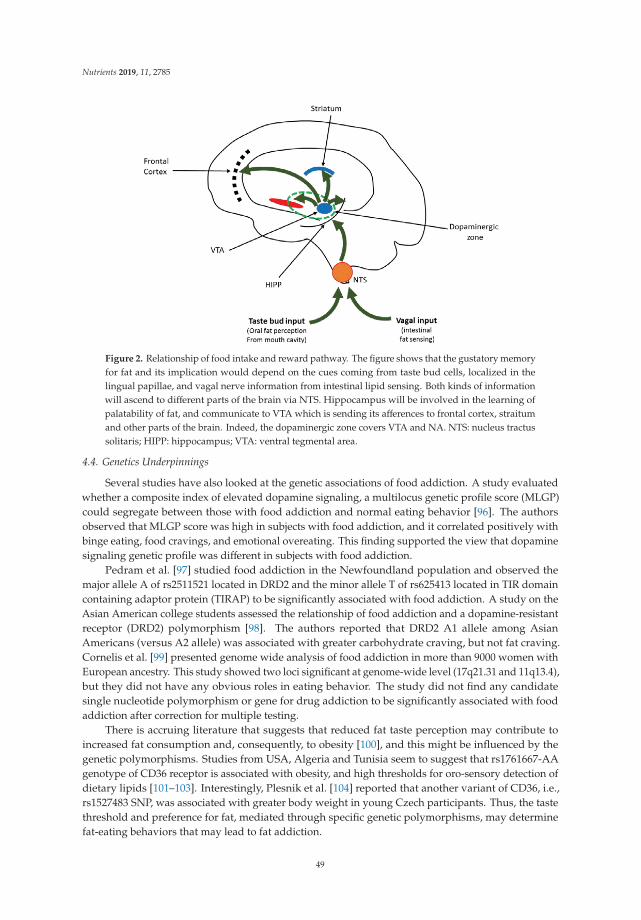
Nutrients 2019, 11, 2785
Figure 2. Relationship of food intake and reward pathway. The figure shows that the gustatory memoryfor fat and its implication would depend on the cues coming from taste bud cells, localized in thelingual papillae, and vagal nerve information from intestinal lipid sensing. Both kinds of informationwill ascend to different parts of the brain via NTS. Hippocampus will be involved in the learning ofpalatability of fat, and communicate to VTA which is sending its afferences to frontal cortex, straitumand other parts of the brain. Indeed, the dopaminergic zone covers VTA and NA. NTS: nucleus tractussolitaris; HIPP: hippocampus; VTA: ventral tegmental area.
4.4. Genetics Underpinnings
Several studies have also looked at the genetic associations of food addiction. A study evaluatedwhether a composite index of elevated dopamine signaling, a multilocus genetic profile score (MLGP)could segregate between those with food addiction and normal eating behavior [96]. The authorsobserved that MLGP score was high in subjects with food addiction, and it correlated positively withbinge eating, food cravings, and emotional overeating. This finding supported the view that dopaminesignaling genetic profile was different in subjects with food addiction.
Pedram et al. [97] studied food addiction in the Newfoundland population and observed themajor allele A of rs2511521 located in DRD2 and the minor allele T of rs625413 located in TIR domaincontaining adaptor protein (TIRAP) to be significantly associated with food addiction. A study on theAsian American college students assessed the relationship of food addiction and a dopamine-resistantreceptor (DRD2) polymorphism [98]. The authors reported that DRD2 A1 allele among AsianAmericans (versus A2 allele) was associated with greater carbohydrate craving, but not fat craving.Cornelis et al. [99] presented genome wide analysis of food addiction in more than 9000 women withEuropean ancestry. This study showed two loci significant at genome-wide level (17q21.31 and 11q13.4),but they did not have any obvious roles in eating behavior. The study did not find any candidatesingle nucleotide polymorphism or gene for drug addiction to be significantly associated with foodaddiction after correction for multiple testing.
There is accruing literature that suggests that reduced fat taste perception may contribute toincreased fat consumption and, consequently, to obesity [100], and this might be influenced by thegenetic polymorphisms. Studies from USA, Algeria and Tunisia seem to suggest that rs1761667-AAgenotype of CD36 receptor is associated with obesity, and high thresholds for oro-sensory detection ofdietary lipids [101–103]. Interestingly, Plesnik et al. [104] reported that another variant of CD36, i.e.,rs1527483 SNP, was associated with greater body weight in young Czech participants. Thus, the tastethreshold and preference for fat, mediated through specific genetic polymorphisms, may determinefat-eating behaviors that may lead to fat addiction.
49

Nutrients 2019, 11, 2785
5. Conclusions, Limitations and Future Directions
Addiction to food products, especially those rich in fat has received attention in recent decades.Figure 3 depicts the overall associations and implications of addiction to fat replete diets. The constructof food addiction has undergone sufficient scrutiny, and means and measures have been developedto reliably assess this condition. Fat as a component of food addiction itself has yet to find its niche,but has possible implications for the control and prevention of obesity. Research has elaborated onthe attentional biases and cognitive functioning in individuals with food addiction, and has pitchedvaried findings. Animal models of food addiction, especially those which have used fat as a substrate,have expanded the scope of the field and have given an armamentarium of options for understandingthe condition and interventional choices. Neuroimaging and genetic studies have also progressed,enriching the field.
Figure 3. Schematic representation of addiction to fat.
Some of the limitations of the present paper should be born in mind while considering differentobservations. The present findings have not been synthesized as a systematic review, but are ratherin the form of a narrative review. The advantage of narrative review is that broad range of findingscan be presented to provide the reader with various dimension of the topic, but it may not be able topresent all relevant literature in the field. The concept of food addiction, similar or different from other(substance/drug) addiction, as a continuum of behavioral addiction has been debated. Additionally,segregation of food addiction into a specific macronutrient based fat addiction may be difficult tooperationalize clinically, as food products generally contain multiple elements together (fats, sugarsand salt). Furthermore, food addiction as a concept has been criticized as pathologizing a normalbehavior, and some researchers have questioned the validity and nomenclature of the construct [8].
Future research investigations are required to look at the stability of addiction to fat rich food overlongitudinal course. The etiological understanding would be strengthened by foray into multi-modalassessment incorporating neuroimaging, genetic and psychological domains. Another aspect wouldbe determining a threshold for fat composition in the food to qualify for fat addiction. Neurobiologicalstudies would be strengthened if they incorporate the neuroimaging responses to palatable foodtaste, and cues (including visual cues). Neurobiological correlates of fat addiction and its persistencecan be elicited by developing studies for individual nutrient components as well as combinations insweet and savory food and linking it to markers of obesity. It would be pertinent to see how other
50

Nutrients 2019, 11, 2785
neuropsychological functions like motivation, sensory processing in various domains and workingmemory interact with reward and homeostatic systems in controlling the various phenomenologicalaspects of fat addiction. Also, relationship of addictive behavior with intervention outcomes (forexample, for obesity) needs to be looked into. The social impact of food addiction from a macro policylevel, and the lived experience of the individual with ‘food addiction’ would help better understandthe condition. Also, attempts to enhance the awareness of this condition and the harmful impact oftrans-fat and saturated fat, coupled with greater funding to understand and address this issue wouldhelp both for primary and secondary prevention. Of course, the overarching aim would be to providewith relevant prevention for at-risk population, and suitable interventions for affected individuals.
Author Contributions: Conceptualization, S.S., K.P.K., and N.A.K.; review of literature, S.S., K.P.K., and N.A.K.;data curation, S.S.; writing—original draft preparation, S.S.; writing—review and editing, K.P.K. and N.A.K.;project administration, N.A.K.
Funding: This research received no external funding
Conflicts of Interest: The authors declare no conflict of interest.
References
1. Popkin, B.M.; Adair, L.S.; Ng, S.W. Global nutrition transition and the pandemic of obesity in developingcountries. Nutr. Rev. 2012, 70, 3–21. [CrossRef] [PubMed]
2. Kochhar, K.P. Dietary spices in health and diseases: I. Ind. J. Physiol. Pharmacol. 2008, 52, 106–122.3. Kochhar, K.P. Dietary spices in health and diseases (II). Ind. J. Physiol. Pharmacol. 2008, 52, 327–354.4. Erlanson-Albertsson, C. Fat-rich food palatability and appetite regulation. In Fat Detection: Taste, Texture, and
Post Ingestive Effects; CRC Press/Taylor & Francis: Boca Raton, FL, USA, 2010.5. Drewnowski, A. Obesity, diets, and social inequalities. Nutr. Rev. 2009, 67 (Suppl. 1), S36–S39. [CrossRef]6. Popkin, B.M. Global nutrition dynamics: The world is shifting rapidly toward a diet linked with
noncommunicable diseases. Am. J. Clin. Nutr. 2006, 84, 289–298. [CrossRef]7. Popkin, B.M.; Gordon-Larsen, P. The nutrition transition: Worldwide obesity dynamics and their determinants.
Int. J. Obes. 2004, 28, S2–S9. [CrossRef]8. Hebebrand, J.; Albayrak, Ö.; Adan, R.; Antel, J.; Dieguez, C.; de Jong, J.; Leng, G.; Menzies, J.; Mercer, J.G.;
Murphy, M.; et al. “Eating addiction”, rather than “food addiction”, better captures addictive-like eatingbehavior. Neurosci. Biobehav. Rev. 2014, 47, 295–306. [CrossRef]
9. Gordon, E.L.; Ariel-Donges, A.H.; Bauman, V.; Merlo, L.J. What Is the Evidence for “Food Addiction?” ASystematic Review. Nutrients 2018, 10, 477. [CrossRef]
10. Lerma-Cabrera, J.M.; Carvajal, F.; Lopez-Legarrea, P. Food addiction as a new piece of the obesity framework.Nutr. J. 2015, 15, 5. [CrossRef]
11. Bassareo, V.; Gambarana, C. Food and Its Effect on the Brain: From Physiological to Compulsive Consumption.Front. Psychiatry 2019, 10, 209. [CrossRef]
12. Fernandez-Aranda, F.; Karwautz, A.; Treasure, J. Food addiction: A transdiagnostic construct of increasinginterest. Eur. Eat. Disord. Rev. J. Eat. Disord. Assoc. 2018, 26, 536–540. [CrossRef] [PubMed]
13. Pelchat, M.L. Food addiction in humans. J. Nutr. 2009, 139, 620–622. [CrossRef] [PubMed]14. Shriner, R.; Gold, M. Food addiction: An evolving nonlinear science. Nutrients 2014, 6, 5370–5391. [CrossRef]
[PubMed]15. Golay, A.; Bobbioni, E. The role of dietary fat in obesity. Int. J. Obes. Relat. Metab. Disord. J. Int. Assoc.
Study Obes. 1997, 21 (Suppl. 3), S2–S11.16. Smilowitz, J.T.; German, J.B.; Zivkovic, A.M. Food Intake and Obesity: The Case of Fat. In Fat Detection:
Taste, Texture, and Post Ingestive Effects; Frontiers in Neuroscience; Montmayeur, J.-P., le Coutre, J., Eds.; CRCPress/Taylor & Francis: Boca Raton, FL, USA, 2010; ISBN 978-1-4200-6775-0.
17. Meule, A. A Critical Examination of the Practical Implications Derived from the Food Addiction Concept.Curr. Obes. Rep. 2019, 8, 11–17. [CrossRef]
18. Cassin, S.E.; Buchman, D.Z.; Leung, S.E.; Kantarovich, K.; Hawa, A.; Carter, A.; Sockalingam, S. Ethical,Stigma, and Policy Implications of Food Addiction: A Scoping Review. Nutrients 2019, 11, 710. [CrossRef]
51

Nutrients 2019, 11, 2785
19. Khan, N.A.; Besnard, P. Oro-sensory perception of dietary lipids: New insights into the fat taste transduction.Biochim. Biophys. Acta 2009, 1791, 149–155. [CrossRef]
20. Mattes, R.D. Fat taste and lipid metabolism in humans. Physiol. Behav. 2005, 86, 691–697. [CrossRef]21. Drewnowski, A.; Mennella, J.A.; Johnson, S.L.; Bellisle, F. Sweetness and food preference. J. Nutr. 2012, 142,
1142S–1148S. [CrossRef]22. Sellayah, D.; Cagampang, F.R.; Cox, R.D. On the evolutionary origins of obesity: A new hypothesis.
Endocrinology 2014, 155, 1573–1588. [CrossRef]23. Reddon, H.; Patel, Y.; Turcotte, M.; Pigeyre, M.; Meyre, D. Revisiting the evolutionary origins of obesity:
Lazy versus peppy-thrifty genotype hypothesis. Obes. Rev. Off. J. Int. Assoc. Study Obes. 2018, 19, 1525–1543.[CrossRef] [PubMed]
24. Genné-Bacon, E.A. Thinking evolutionarily about obesity. Yale J. Biol. Med. 2014, 87, 99–112. [PubMed]25. Clifton, P.M.; Keogh, J.B. A systematic review of the effect of dietary saturated and polyunsaturated fat on
heart disease. Nutr. Metab. Cardiovasc. Dis. NMCD 2017, 27, 1060–1080. [CrossRef] [PubMed]26. Power, R.; Prado-Cabrero, A.; Mulcahy, R.; Howard, A.; Nolan, J.M. The Role of Nutrition for the Aging
Population: Implications for Cognition and Alzheimer’s Disease. Annu. Rev. Food Sci. Technol. 2019, 10,619–639. [CrossRef] [PubMed]
27. Besnard, P.; Passilly-Degrace, P.; Khan, N.A. Taste of Fat: A Sixth Taste Modality? Physiol. Rev. 2016, 96,151–176. [CrossRef]
28. Val-Laillet, D.; Aarts, E.; Weber, B.; Ferrari, M.; Quaresima, V.; Stoeckel, L.E.; Alonso-Alonso, M.; Audette, M.;Malbert, C.H.; Stice, E. Neuroimaging and neuromodulation approaches to study eating behavior andprevent and treat eating disorders and obesity. NeuroImage Clin. 2015, 8, 1–31. [CrossRef]
29. Schmidt, U.; Campbell, I.C. Treatment of eating disorders can not remain “brainless”: The case forbrain-directed treatments. Eur. Eat. Disord. Rev. J. Eat. Disord. Assoc. 2013, 21, 425–427. [CrossRef]
30. Rogers, P.J. Food and drug addictions: Similarities and differences. Pharmacol. Biochem. Behav. 2017, 153,182–190. [CrossRef]
31. Hone-Blanchet, A.; Fecteau, S. Overlap of food addiction and substance use disorders definitions: Analysisof animal and human studies. Neuropharmacology 2014, 85, 81–90. [CrossRef]
32. Meule, A.; Gearhardt, A.N. Food addiction in the light of DSM-5. Nutrients 2014, 6, 3653–3671. [CrossRef]33. Schreiber, L.R.N.; Odlaug, B.L.; Grant, J.E. The overlap between binge eating disorder and substance use
disorders: Diagnosis and neurobiology. J. Behav. Addict. 2013, 2, 191–198. [CrossRef] [PubMed]34. Citrome, L. A primer on binge eating disorder diagnosis and management. CNS Spectr. 2015, 20 (Suppl. 1),
44–50. [CrossRef] [PubMed]35. Carter, J.C.; Van Wijk, M.; Rowsell, M. Symptoms of “food addiction” in binge eating disorder using the Yale
Food Addiction Scale version 2.0. Appetite 2019, 133, 362–369. [CrossRef] [PubMed]36. Linardon, J.; Messer, M. Assessment of food addiction using the Yale Food Addiction Scale 2.0 in individuals
with binge-eating disorder symptomatology: Factor structure, psychometric properties, and clinicalsignificance. Psychiatry Res. 2019, 279, 216–221. [CrossRef] [PubMed]
37. Burrows, T.; Skinner, J.; McKenna, R.; Rollo, M. Food Addiction, Binge Eating Disorder, and Obesity: IsThere a Relationship? Behav. Sci. Basel Switz. 2017, 7, 54. [CrossRef] [PubMed]
38. Pursey, K.M.; Stanwell, P.; Gearhardt, A.N.; Collins, C.E.; Burrows, T.L. The prevalence of food addiction asassessed by the Yale Food Addiction Scale: A systematic review. Nutrients 2014, 6, 4552–4590. [CrossRef][PubMed]
39. Penzenstadler, L.; Soares, C.; Karila, L.; Khazaal, Y. Systematic Review of Food Addiction as Measured Withthe Yale Food Addiction Scale: Implications for the Food Addiction Construct. Curr. Neuropharmacol. 2018,16, 520. [CrossRef]
40. Zhao, Z.; Ma, Y.; Han, Y.; Liu, Y.; Yang, K.; Zhen, S.; Wen, D. Psychosocial Correlates of Food Addiction andIts Association with Quality of Life in a Non-Clinical Adolescent Sample. Nutrients 2018, 10, 837. [CrossRef]
41. Ayaz, A.; Nergiz-Unal, R.; Dedebayraktar, D.; Akyol, A.; Pekcan, A.G.; Besler, H.T.; Buyuktuncer, Z. Howdoes food addiction influence dietary intake profile? PLoS ONE 2018, 13, e0195541. [CrossRef]
42. Pursey, K.M.; Collins, C.E.; Stanwell, P.; Burrows, T.L. Foods and dietary profiles associated with “foodaddiction” in young adults. Addict. Behav. Rep. 2015, 2, 41–48. [CrossRef]
43. Ivezaj, V.; Wiedemann, A.A.; Grilo, C.M. Food addiction and bariatric surgery: A systematic review of theliterature. Obes. Rev. Off. J. Int. Assoc. Study Obes. 2017, 18, 1386–1397. [CrossRef] [PubMed]
52

Nutrients 2019, 11, 2785
44. Pepino, M.Y.; Stein, R.I.; Eagon, J.C.; Klein, S. Bariatric surgery-induced weight loss causes remission of foodaddiction in extreme obesity. Obes. Silver Spring Md. 2014, 22, 1792–1798. [CrossRef] [PubMed]
45. Sevinçer, G.M.; Konuk, N.; Bozkurt, S.; Coskun, H. Food addiction and the outcome of bariatric surgery at1-year: Prospective observational study. Psychiatry Res. 2016, 244, 159–164. [CrossRef]
46. Guerrero Pérez, F.; Sánchez-González, J.; Sánchez, I.; Jiménez-Murcia, S.; Granero, R.; Simó-Servat, A.;Ruiz, A.; Virgili, N.; López-Urdiales, R.; Montserrat-Gil de Bernabe, M.; et al. Food addiction and preoperativeweight loss achievement in patients seeking bariatric surgery. Eur. Eat. Disord. Rev. J. Eat. Disord. Assoc.2018, 26, 645–656. [CrossRef]
47. Gearhardt, A.N.; Corbin, W.R.; Brownell, K.D. Preliminary validation of the Yale food addiction scale.Appetite 2009, 52, 430–436. [CrossRef]
48. Gearhardt, A.N.; Roberto, C.A.; Seamans, M.J.; Corbin, W.R.; Brownell, K.D. Preliminary validation of theYale Food Addiction Scale for children. Eat. Behav. 2013, 14, 508–512. [CrossRef] [PubMed]
49. Chen, G.; Tang, Z.; Guo, G.; Liu, X.; Xiao, S. The Chinese version of the Yale Food Addiction Scale: Anexamination of its validation in a sample of female adolescents. Eat. Behav. 2015, 18, 97–102. [CrossRef]
50. Nantha, Y.S.; Patah, N.A.A.; Pillai, M.P. Preliminary validation of the Malay Yale Food Addiction Scale:Factor structure and item analysis in an obese population. Clin. Nutr. ESPEN 2016, 16, 42–47. [CrossRef]
51. Brunault, P.; Ballon, N.; Gaillard, P.; Réveillère, C.; Courtois, R. Validation of the French version of theYale Food Addiction Scale: An examination of its factor structure, reliability, and construct validity in anonclinical sample. Can. J. Psychiatry 2014, 59, 276–284. [CrossRef]
52. Gearhardt, A.N.; Corbin, W.R.; Brownell, K.D. Development of the Yale Food Addiction Scale Version 2.0.Psychol. Addict. Behav. J. Soc. Psychol. Addict. Behav. 2016, 30, 113–121. [CrossRef]
53. Wardle, J.; Guthrie, C.A.; Sanderson, S.; Rapoport, L. Development of the children’s eating behaviourquestionnaire. J. Child Psychol. Psychiatry 2001, 42, 963–970. [CrossRef] [PubMed]
54. Cepeda-Benito, A.; Gleaves, D.H.; Williams, T.L.; Erath, S.A. The development and validation of the stateand trait food-cravings questionnaires. Behav. Ther. 2000, 31, 151–173. [CrossRef]
55. Schlundt, D.G.; Hargreaves, M.K.; Buchowski, M.S. The eating behavior patterns questionnaire predictsdietary fat intake in African American women. J. Am. Diet. Assoc. 2003, 103, 338–345. [PubMed]
56. Cappelleri, J.C.; Bushmakin, A.G.; Gerber, R.A.; Leidy, N.K.; Sexton, C.C.; Karlsson, J.; Lowe, M.R. Evaluatingthe Power of Food Scale in obese subjects and a general sample of individuals: Development and measurementproperties. Int. J. Obes. 2009, 33, 913–922. [CrossRef] [PubMed]
57. Batterink, L.; Yokum, S.; Stice, E. Body mass correlates inversely with inhibitory control in response to foodamong adolescent girls: An fMRI study. NeuroImage 2010, 52, 1696–1703. [CrossRef] [PubMed]
58. Goldman, R.L.; Canterberry, M.; Borckardt, J.J.; Madan, A.; Byrne, T.K.; George, M.S.; O’Neil, P.M.;Hanlon, C.A. Executive control circuitry differentiates degree of success in weight loss following gastric-bypasssurgery. Obes. Silver Spring Md. 2013, 21, 2189–2196. [CrossRef]
59. Rodrigue, C.; Ouellette, A.-S.; Lemieux, S.; Tchernof, A.; Biertho, L.; Bégin, C. Executive functioning andpsychological symptoms in food addiction: A study among individuals with severe obesity. Eat. WeightDisord. EWD 2018, 23, 469–478. [CrossRef]
60. Franken, I.H.A.; Nijs, I.M.T.; Toes, A.; van der Veen, F.M. Food addiction is associated with impairedperformance monitoring. Biol. Psychol. 2018, 131, 49–53. [CrossRef]
61. Steward, T.; Mestre-Bach, G.; Vintró-Alcaraz, C.; Lozano-Madrid, M.; Agüera, Z.; Fernández-Formoso, J.A.;Granero, R.; Jiménez-Murcia, S.; Vilarrasa, N.; García-Ruiz-de-Gordejuela, A.; et al. Food addiction andimpaired executive functions in women with obesity. Eur. Eat. Disord. Rev. J. Eat. Disord. Assoc. 2018, 26,574–584. [CrossRef]
62. Blume, M.; Schmidt, R.; Hilbert, A. Executive Functioning in Obesity, Food Addiction, and Binge-EatingDisorder. Nutrients 2018, 11, 54. [CrossRef]
63. Ruddock, H.K.; Field, M.; Jones, A.; Hardman, C.A. State and trait influences on attentional bias to food-cues:The role of hunger, expectancy, and self-perceived food addiction. Appetite 2018, 131, 139–147. [CrossRef][PubMed]
64. Frayn, M.; Sears, C.R.; von Ranson, K.M. A sad mood increases attention to unhealthy food images in womenwith food addiction. Appetite 2016, 100, 55–63. [CrossRef] [PubMed]
53

Nutrients 2019, 11, 2785
65. Gearhardt, A.N.; Treat, T.A.; Hollingworth, A.; Corbin, W.R. The relationship between eating-relatedindividual differences and visual attention to foods high in added fat and sugar. Eat. Behav. 2012, 13, 371–374.[CrossRef] [PubMed]
66. Havermans, R.C. “You Say it’s Liking, I Say it’s Wanting . . . ”. On the difficulty of disentangling food rewardin man. Appetite 2011, 57, 286–294. [CrossRef] [PubMed]
67. Mela, D.J. Why do we like what we like? J. Sci. Food Agric. 2001, 81, 10–16. [CrossRef]68. Pelchat, M.L. Of human bondage: Food craving, obsession, compulsion, and addiction. Physiol. Behav. 2002,
76, 347–352. [CrossRef]69. Méjean, C.; Deglaire, A.; Kesse-Guyot, E.; Hercberg, S.; Schlich, P.; Castetbon, K. Association between intake
of nutrients and food groups and liking for fat (The Nutrinet-Santé Study). Appetite 2014, 78, 147–155.[CrossRef]
70. Gearhardt, A.N.; Rizk, M.T.; Treat, T.A. The association of food characteristics and individual differenceswith ratings of craving and liking. Appetite 2014, 79, 166–173. [CrossRef]
71. Volkow, N.; Wang, G.J.; Fowler, J.S.; Tomasi, D.; Baler, R. Food and drug reward: Overlapping circuits inhuman obesity and addiction. In Brain Imaging in Behavioral Neuroscience; Springer: Berlin, Germany, 2011;pp. 1–24.
72. Fortuna, J.L. Sweet preference, sugar addiction and the familial history of alcohol dependence: Shared neuralpathways and genes. J. Psychoact. Drugs 2010, 42, 147–151. [CrossRef]
73. Ahmed, S.H.; Lenoir, M.; Guillem, K. Neurobiology of addiction versus drug use driven by lack of choice.Curr. Opin. Neurobiol. 2013, 23, 581–587. [CrossRef]
74. Ziauddeen, H.; Farooqi, I.S.; Fletcher, P.C. Obesity and the brain: How convincing is the addiction model?Nat. Rev. Neurosci. 2012, 13, 279–286. [CrossRef] [PubMed]
75. Morgan, D.; Sizemore, G.M. Animal models of addiction: Fat and sugar. Curr. Pharm. Des. 2011, 17,1168–1172. [CrossRef] [PubMed]
76. Novelle, M.G.; Diéguez, C. Food Addiction and Binge Eating: Lessons Learned from Animal Models.Nutrients 2018, 10, 71. [CrossRef] [PubMed]
77. De Jong, J.W.; Vanderschuren, L.J.M.J.; Adan, R.A.H. Towards an animal model of food addiction. Obes. Facts2012, 5, 180–195. [CrossRef]
78. Marques, C.; Meireles, M.; Norberto, S.; Leite, J.; Freitas, J.; Pestana, D.; Faria, A.; Calhau, C. High-fatdiet-induced obesity Rat model: A comparison between Wistar and Sprague-Dawley Rat. Adipocyte 2016, 5,11–21. [CrossRef]
79. Avena, N.M. Examining the addictive-like properties of binge eating using an animal model of sugardependence. Exp. Clin. Psychopharmacol. 2007, 15, 481–491. [CrossRef]
80. Avena, N.M.; Rada, P.; Hoebel, B.G. Sugar and fat bingeing have notable differences in addictive-like behavior.J. Nutr. 2009, 139, 623–628. [CrossRef]
81. Wong, K.J.; Wojnicki, F.H.W.; Corwin, R.L.W. Baclofen, raclopride, and naltrexone differentially affect intakeof fat/sucrose mixtures under limited access conditions. Pharmacol. Biochem. Behav. 2009, 92, 528–536.[CrossRef]
82. Liang, N.-C.; Hajnal, A.; Norgren, R. Sham feeding corn oil increases accumbens dopamine in the rat. Am. J.Physiol. Regul. Integr. Comp. Physiol. 2006, 291, R1236–R1239. [CrossRef]
83. Adachi, S.; Endo, Y.; Mizushige, T.; Tsuzuki, S.; Matsumura, S.; Inoue, K.; Fushiki, T. Increased levels ofextracellular dopamine in the nucleus accumbens and amygdala of rats by ingesting a low concentration of along-chain Fatty Acid. Biosci. Biotechnol. Biochem. 2013, 77, 2175–2180. [CrossRef]
84. Dela Cruz, J.A.D.; Coke, T.; Bodnar, R.J. Simultaneous Detection of c-Fos Activation from Mesolimbic andMesocortical Dopamine Reward Sites Following Naive Sugar and Fat Ingestion in Rats. J. Vis. Exp. JoVE2016. [CrossRef]
85. Dela Cruz, J.A.D.; Coke, T.; Karagiorgis, T.; Sampson, C.; Icaza-Cukali, D.; Kest, K.; Ranaldi, R.; Bodnar, R.J.c-Fos induction in mesotelencephalic dopamine pathway projection targets and dorsal striatum followingoral intake of sugars and fats in rats. Brain Res. Bull. 2015, 111, 9–19. [CrossRef]
86. Dela Cruz, J.A.D.; Icaza-Cukali, D.; Tayabali, H.; Sampson, C.; Galanopoulos, V.; Bamshad, D.; Touzani, K.;Sclafani, A.; Bodnar, R.J. Roles of dopamine D1 and D2 receptors in the acquisition and expression offat-conditioned flavor preferences in rats. Neurobiol. Learn. Mem. 2012, 97, 332–337. [CrossRef] [PubMed]
54

Nutrients 2019, 11, 2785
87. Zhang, M.; Gosnell, B.A.; Kelley, A.E. Intake of high-fat food is selectively enhanced by mu opioid receptorstimulation within the nucleus accumbens. J. Pharmacol. Exp. Ther. 1998, 285, 908–914. [PubMed]
88. Ward, S.J.; Walker, E.A.; Dykstra, L.A. Effect of cannabinoid CB1 receptor antagonist SR141716A and CB1 receptorknockout on cue-induced reinstatement of Ensure and corn-oil seeking in mice. Neuropsychopharmacol. Off.Publ. Am. Coll. Neuropsychopharmacol. 2007, 32, 2592–2600. [CrossRef] [PubMed]
89. Brissard, L.; Leemput, J.; Hichami, A.; Passilly-Degrace, P.; Maquart, G.; Demizieux, L.; Degrace, P.; Khan, N.A.Orosensory Detection of Dietary Fatty Acids Is Altered in CB1R−/− Mice. Nutrients 2018, 10, 1347. [CrossRef][PubMed]
90. Peterschmitt, Y.; Abdoul-Azize, S.; Murtaza, B.; Barbier, M.; Khan, A.S.; Millot, J.-L.; Khan, N.A. Fatty AcidLingual Application Activates Gustatory and Reward Brain Circuits in the Mouse. Nutrients 2018, 10, 1246.[CrossRef] [PubMed]
91. Patriarca, L.; Magerowski, G.; Alonso-Alonso, M. Functional neuroimaging in obesity. Curr. Opin. Endocrinol.Diabetes Obes. 2017, 24, 260–265. [CrossRef] [PubMed]
92. Brooks, S.J.; Cedernaes, J.; Schiöth, H.B. Increased prefrontal and parahippocampal activation with reduceddorsolateral prefrontal and insular cortex activation to food images in obesity: A meta-analysis of fMRIstudies. PLoS ONE 2013, 8, e60393. [CrossRef]
93. Gearhardt, A.N.; Yokum, S.; Orr, P.T.; Stice, E.; Corbin, W.R.; Brownell, K.D. The Neural Correlates of “FoodAddiction”. Arch. Gen. Psychiatry 2011, 68, 808–816. [CrossRef]
94. Hsu, J.-S.; Wang, P.-W.; Ko, C.-H.; Hsieh, T.-J.; Chen, C.-Y.; Yen, J.-Y. Altered brain correlates of responseinhibition and error processing in females with obesity and sweet food addiction: A functional magneticimaging study. Obes. Res. Clin. Pract. 2017, 11, 677–686. [CrossRef] [PubMed]
95. Contreras-Rodriguez, O.; Burrows, T.; Pursey, K.M.; Stanwell, P.; Parkes, L.; Soriano-Mas, C.; Verdejo-Garcia, A.Food addiction linked to changes in ventral striatum functional connectivity between fasting and satiety.Appetite 2019, 133, 18–23. [CrossRef] [PubMed]
96. Davis, C.; Loxton, N.J.; Levitan, R.D.; Kaplan, A.S.; Carter, J.C.; Kennedy, J.L. “Food addiction” and itsassociation with a dopaminergic multilocus genetic profile. Physiol. Behav. 2013, 118, 63–69. [CrossRef][PubMed]
97. Pedram, P.; Zhai, G.; Gulliver, W.; Zhang, H.; Sun, G. Two novel candidate genes identified in adults fromthe Newfoundland population with addictive tendencies towards food. Appetite 2017, 115, 71–79. [CrossRef]
98. Yeh, J.; Trang, A.; Henning, S.M.; Wilhalme, H.; Carpenter, C.; Heber, D.; Li, Z. Food Cravings, FoodAddiction, and a Dopamine-Resistant (DRD2 A1) Receptor Polymorphism in Asian American CollegeStudents. Asia Pac. J. Clin. Nutr. 2016, 25, 424–429.
99. Cornelis, M.C.; Flint, A.; Field, A.E.; Kraft, P.; Han, J.; Rimm, E.B.; van Dam, R.M. A genome-wide investigationof food addiction. Obes. Silver Spring Md. 2016, 24, 1336–1341. [CrossRef]
100. Khan, A.S.; Murtaza, B.; Hichami, A.; Khan, N.A. A cross-talk between fat and bitter taste modalities.Biochimie 2019, 159, 3–8. [CrossRef]
101. Love-Gregory, L.; Abumrad, N. CD36 genetics and the metabolic complications of obesity. Curr. Opin. Clin.Nutr. Metab. Care 2011, 14, 527–534. [CrossRef]
102. Mrizak, I.; Šerý, O.; Plesnik, J.; Arfa, A.; Fekih, M.; Bouslema, A.; Zaouali, M.; Tabka, Z.; Khan, N.A. The aallele of cluster of differentiation 36 (CD36) SNP 1761667 associates with decreased lipid taste perception inobese Tunisian women. Br. J. Nutr. 2015, 113, 1330–1337. [CrossRef]
103. Melis, M.; Carta, G.; Pintus, S.; Pintus, P.; Piras, C.A.; Murru, E.; Manca, C.; Di Marzo, V.; Banni, S.; TomassiniBarbarossa, I. Polymorphism rs1761667 in the CD36 Gene Is Associated to Changes in Fatty Acid Metabolismand Circulating Endocannabinoid Levels Distinctively in Normal Weight and Obese Subjects. Front. Physiol.2017, 8, 8. [CrossRef]
104. Plesník, J.; Serý, O.; Khan, A.; Bielik, P.; Khan, N.A. The rs1527483, but not rs3212018, CD36 polymorphismassociates with linoleic acid detection and obesity in Czech young adults. Br. J. Nutr. 2018, 119, 1–7.[CrossRef]
© 2019 by the authors. Licensee MDPI, Basel, Switzerland. This article is an open accessarticle distributed under the terms and conditions of the Creative Commons Attribution(CC BY) license (http://creativecommons.org/licenses/by/4.0/).
55


nutrients
Review
Food Addiction: Implications for the Diagnosis andTreatment of Overeating
Rachel C. Adams 1,*, Jemma Sedgmond 1, Leah Maizey 1, Christopher D. Chambers 1 and
Natalia S. Lawrence 2
1 CUBRIC, School of Psychology, Cardiff University, Maindy Road, Cardiff CF24 4HQ, UK2 School of Psychology, College of Life and Environmental Sciences, University of Exeter, Exeter EX4 4QG, UK* Correspondence: [email protected]; Tel.: +44-(0)29-2087-0365
Received: 15 July 2019; Accepted: 21 August 2019; Published: 4 September 2019
Abstract: With the obesity epidemic being largely attributed to overeating, much research has beenaimed at understanding the psychological causes of overeating and using this knowledge to developtargeted interventions. Here, we review this literature under a model of food addiction and presentevidence according to the fifth edition of the Diagnostic and Statistical Manual (DSM-5) criteria forsubstance use disorders. We review several innovative treatments related to a food addiction modelranging from cognitive intervention tasks to neuromodulation techniques. We conclude that there isevidence to suggest that, for some individuals, food can induce addictive-type behaviours similar tothose seen with other addictive substances. However, with several DSM-5 criteria having limitedapplication to overeating, the term ‘food addiction’ is likely to apply only in a minority of cases.Nevertheless, research investigating the underlying psychological causes of overeating within thecontext of food addiction has led to some novel and potentially effective interventions. Understandingthe similarities and differences between the addictive characteristics of food and illicit substancesshould prove fruitful in further developing these interventions.
Keywords: food addiction; overeating; obesity; impulsivity; reward sensitivity; cognitive training;neuromodulation
1. Introduction
In 2003, obesity was declared a global epidemic by the World Health Organisation [1], andthe prevalence of overweight and obesity in both developed and developing countries continuesto increase [2,3]. In 2016, 39% of adults were estimated to be overweight and 13% to be obese [4].Overweight and obesity present a substantial economic burden; in the UK, the total direct andindirect costs are expected to reach £37.2 billion by 2025 [5]. One of the common explanations forthe increase in obesity over recent decades is the environment and, in particular, the availability ofhighly varied, palatable and fattening foods—which have been considered to be addictive [6–9]. Whilemany individuals manage to resist these temptations and maintain a healthy weight, obese individualshave been shown to have a preference for such energy-dense foods compared to healthy-weightindividuals [10–12]. The critical question is why some individuals are able to resist overeating whileothers cannot; what is the evidence for ‘food addiction’ and how can this be used to inform interventionsfor overeating.
The concept of ‘food addiction’ has been evident in the media and general public for some timeand is gaining increasing interest in the scientific literature [13]. There are now numerous reviewsdiscussing the diagnostic, neurobiological and practical aspects of food addiction, with argumentsboth for and against its utility and validity [14–20]. This surge of interest comes with the perspectivethat addiction can be conceptualised as a loss of control over intake for a particular substance orbehaviour without the need to focus purely on psychoactive substances [21,22]. The fifth edition of
Nutrients 2019, 11, 2086; doi:10.3390/nu11092086 www.mdpi.com/journal/nutrients57

Nutrients 2019, 11, 2086
the Diagnostic and Statistical Manual [23] acknowledged this shift in perspective, with the additionof gambling disorder as the first behavioural addiction. Acceptance of this disorder was based onevidence that gambling can produce behavioural symptoms that parallel those of substance addictionand can activate the same neural reward circuits as drugs of abuse [24,25]. There is now a largebody of research documenting similar observations for overeating and obesity. Moreover, treatmentsdeveloped for addictive disorders have also shown some efficacy for the treatment of obesity andovereating. These findings highlight how a model of food addiction may help us to understandelements of overweight/obesity beyond a simple lack of willpower and can also be used to informeffective interventions and policy [26–30].
Food addiction has not yet been recognised in the DSM; however, the similarities between somefeeding and eating disorders and substance-use disorders (SUDs) have been acknowledged. Thesesimilarities include the experience of cravings, reduced control over intake, increased impulsivity andaltered reward-sensitivity. Binge eating disorder (BED) and bulimia nervosa (BN) have been proposedas phenotypes that may reflect these similarities to the greatest extent [31–34]. Both BED and BN arecharacterised by recurrent episodes of binge eating in which large quantities of food are consumedin a short time accompanied by feelings of a lack of control, despite physical and emotional distress.Reports of food addiction have been shown to be particularly high amongst these individuals [32,35,36].Food addiction has also been acknowledged with a standardised ‘diagnostic’ tool—the Yale FoodAddiction Scale (YFAS) [37,38]. The YFAS is a questionnaire that parallels the diagnostic criteria forSUDs. The scale has so far been shown to exhibit good internal reliability as well as convergent,discriminant and incremental validity [37–40].
In this review, we first discuss the DSM-5 diagnostic criteria for SUDs to summarise evidencefor food addiction. These criteria are defined as ‘a cluster of cognitive, behavioural and physiologicalsymptoms’ [23]. More specifically, the following categories are considered: impaired control, socialimpairment, repeated use despite negative consequences and physiological criteria. However, it shouldbe noted that the physiological criteria of tolerance and withdrawal—for which there is less evidencein relation to food—are not necessary for a diagnosis of SUD. The DSM-5 also states that althoughchanges in neural functioning are a key characteristic of SUDs, the diagnosis is based on a pathologicalpattern of behaviours. Hence, we discuss the diagnostic criteria initially, followed by a review ofneurobiological evidence. We then explore the question of how this information can be, and has been,applied to interventions for overeating.
1.1. Impaired Control
Taking larger amounts of the substance for longer periods than intended has been cited as one ofthe most commonly reported symptoms in overweight/obese and BED individuals [41,42]. Excessiveand uncontrolled eating also forms the definition of binge eating in BED [23]. Although bingeing canbe a planned behaviour, it has been shown that planned binges still result in a greater intake thaninitially intended [41]. Binge eating has also been documented in non-clinical samples [43,44]; however,in these individuals, occasions of impaired control are more likely to reflect unintentional snackingand excessive portion sizes [8,41,45].
Unsuccessful efforts to restrict food intake are also well documented, with many dieters failing tomaintain their diet or even gaining weight in the long term [46–51]. In their paper reviewing evidencefor refined food addiction (i.e., processed foods with high levels of sugars or sweeteners, refinedcarbohydrates, fat, salt and caffeine), Ifland et al. [52] report that ‘Every refined food addict reports aseries of attempts to cut back on eating. They have used a variety of techniques’ (pg. 521). Curtis andDavis [41] also report similar anecdotes in women with BED who describe avoiding certain triggerfoods to control their binges.
The third criterion of time spent obtaining, using and recovering from substance use also translatesto BED and BN. These individuals may spend a lot of their time thinking about, engaging in andrecovering from binge episodes. As mentioned earlier, bingeing is often a planned behaviour which
58

Nutrients 2019, 11, 2086
may require a great deal of effort to purchase and store foods ready for a binge episode [41]. In addition,the criteria for BED emphasise the time spent bingeing, with the number of binge episodes per weekdetermining the severity of the disorder [23]. Moreover, these individuals often experience physicaland emotional distress following a binge eating episode. Recovery from food consumption has alsobeen reported in self-identified food addicts with references to feeling sleepy or ‘hung-over’ [52,53].
Although evidence for food addiction directly related to the DSM-5 diagnostic criteria for impairedcontrol is largely anecdotal, there is a considerable amount of empirical evidence for an associationbetween overeating/obesity and impaired control generally. Two aspects of self-regulatory failurethat are particularly pertinent in the case of substance use and overeating are impulsivity and rewardsensitivity [54–56].
1.1.1. Impulsivity
Although impulsivity is a multi-faceted construct, it can be defined broadly as the tendencyto think and act without sufficient forethought, which often results in behaviour that is discordantwith one’s long-term goals. The role of impulsivity in SUDs is well documented [55,57–60]. Manystudies have reported higher impulsivity levels with increasing substance use across a wide range ofquestionnaires and behavioural tasks, and for a variety of different substances [61–66]. For example,Noël et al. [67] performed a series of behavioural tasks assessing the ability to suppress irrelevantresponses (response inhibition) and irrelevant information (proactive interference) in a group ofdetoxified alcohol-dependent individuals and matched healthy controls. They found a statisticallysignificant group difference for all three tests assessing response inhibition but no differences forproactive interference.
Impulsivity has also been implicated in overeating and obesity [54,68–71]. Overweight/obeseindividuals score higher on self-reported [72–74] and behavioural measures of impulsivity [75–77],whereas those high in self-control have been shown to be less likely to give in to temptation [78–80]and are more likely to maintain a healthy diet and engage in physical exercise [81–83] Impulsivityscores have also been shown to predict poor food choices [84] and correlate positively with foodconsumption [85–87]. For example, Guerrieri et al. [87] found that, in a sample of healthy-weightwomen, those with higher impulsivity scores ate more candy during a ‘bogus’ taste test than thosewith lower impulsivity scores. Churchill and Jessop [88] also showed a predictive relationship betweenimpulsivity and snacking on high-fat foods over a two-week period. Scores on the YFAS have alsobeen associated with various measures of impulsivity, such as motor and attentional impulsivity,mood-related impulsivity and delay discounting [89,90].
1.1.2. Reward Sensitivity
A heightened general sensitivity to reward has also been linked to both substance use andovereating [69,77,91–93]. In the food literature, self-report measures of reward sensitivity have revealedassociations with BMI, food craving and preferences for foods high in fat and sugar [93–95]. Usingtwo behavioural tasks, Guerrieri et al. [69] measured reward sensitivity and response inhibition inchildren aged 8–10. They subsequently measured food intake in a bogus taste test when the foodswere either varied or monotonous. Their results revealed that reward-sensitive children consumedsignificantly more calories than non-reward sensitive children only when the food was varied. Therewas no effect of response inhibition on food intake, nor any interaction with variety; however, unlikereward sensitivity, deficient response inhibition was associated with being overweight. The authorssuggested that reward sensitivity may play a causal role in overeating, whereas deficient inhibitorycontrol may be more of a maintaining factor. This fits well with findings from a study demonstratinga role of reward sensitivity in the early onset of heroin use and a role of impulsivity in escalatinguse [92,96].
There is also evidence to suggest that reward sensitivity may decrease with more prolongedor established overeating, with studies showing anhedonia, or hypo-sensitivity to reward, in obese
59

Nutrients 2019, 11, 2086
participants [97–100]. For example, Davis et al. [97] demonstrated that although overweight womenwere more sensitive to reward than healthy-weight women, those who were obese were significantlyless reward sensitive than overweight women. Importantly, the earlier mentioned association betweenreward sensitivity and increased BMI was found in a sample of mainly healthy-weight women, withonly 1% classified as obese [93]. Although there is a great deal of evidence to suggest that sensitivity toreward plays a role in substance abuse and overeating, the causal direction of this relationship remainsunclear. On the one hand, increasing reward sensitivity may lead to overeating by increasing motivationtowards pleasurable activities, such as consuming energy-dense foods that elicit dopamine and opioidactivation. On the other hand, decreased reward sensitivity may cause individuals to seek out rewardingactivities as a form of ‘self-medication’ in order to boost dopamine functioning (i.e., addictive behaviouris the result of a ‘reward deficiency syndrome’) [101,102]. These two arguments, and the relevantneuroimaging literature, are discussed further below (see the Neurobiological Similarities sectionbelow) and in more detail by Burger and Stice [103].
Burger and Stice [103] offer several theories for how these two causal directions combine toexplain obesity. They propose that high sensitivity to reward may initially cause individuals toover-consume palatable foods, but this sensitivity is then modified over time as the brain’s rewardsystem adapts and shows divergent changes in food motivation (‘wanting’) versus hedonic pleasure(‘liking’). According to Robinson and Berridge’s [104–106] incentive-sensitisation theory, repeatedintake results in an increased incentive value for these foods and their associated cues, which maybe subjectively experienced as excessive wanting or craving. Moreover, this theory argues that withrepeated presentations of palatable foods, the hedonic pleasure derived from consuming the foodwill decrease due to neural habituation, while the anticipation of reward increases. Hence, a viciouscycle emerges in which the individual will experience less pleasure from the food (‘liking’), but willsimultaneously experience an increased desire (‘wanting’) for the food, driving further food seekingand consumption [107–109] (see Figure 1). The experience of intense cravings is the third criterionof impaired control and is another symptom of substance addiction that can be readily applied toovereating and obesity.
60

Nutrients 2019, 11, 2086
Figure 1. The proposed cycle of ‘food addiction’. Initial vulnerability for the over-consumption ofpalatable food is marked by increased impulsivity and reward sensitivity, as well as a diminishedcapacity for inhibitory control. As a consequence of overconsumption, individuals experience tolerance,craving and withdrawal, along with a range of social, emotional and behavioural difficulties such asweight stigmatisation and feelings of guilt and shame. With repeated consumption of these foods, theindividual is likely to habituate to the hedonic properties of the food, resulting in reduced enjoyment orliking. These changes are also accompanied by an increased desire or ‘wanting’ for the food [104–108].In an attempt to relieve these symptoms, the individual ‘self-medicates’ by increasing food consumption,which can result in compulsive or binge eating behaviour, thus creating a cycle of addiction. It shouldbe noted that the extent to which each of these mechanisms is experienced varies considerably acrossindividuals. In particular, initial vulnerability to addiction may be related to individual differences inreward sensitivity, impulsivity and inhibitory control [110–113].
1.2. Craving
The term ‘food craving’ typically refers to an intense desire to consume a specific food [114,115].Food cravings appear to be very common with reports of 100% of young women and 70% of youngmen experiencing a craving for at least one food in the past year [116,117]. The most commonlyreported craved food is chocolate, although cravings for carbohydrates and salty snacks are alsocommon [118–122]. The prevalence of food cravings has prompted the development of severalstandardised questionnaires that measure food cravings with a good degree of internal consistency andconstruct validity [123–127], including a specific questionnaire just for chocolate (Attitudes to ChocolateQuestionnaire) [128]. Recurrent food cravings are of interest in relation to food addiction as theyhave been associated with binge eating, increased food intake and increased BMI [124,127,129–132].Increased reports of food craving have also been demonstrated in individuals who score highly onmeasures of self-reported food addiction [133–135] and those with BED and BN [136–138]. Furthermore,just as drug craving is associated with an increased likelihood of relapse [139–141], food craving hasbeen linked to poor dieting success [142–144].
Further support for the similarity between drug and food craving is evident in the findingsof cue-reactivity research. The aphorism that cravings are most likely to occur in the presence ofsubstance-related stimuli has been well documented, with cue-exposure paradigms showing significanteffects of drug-related cues on self-reported and physiological measures of craving [145–148]. Similarly,exposure to food cues has also been shown to increase food cravings [149,150] and a recent systematicreview of 45 studies (involving 3292 participants) concluded that ‘food cue-reactivity’ (physiological,neural and subjective reward-related responses to food cues) reliably and prospectively predicts both
61

Nutrients 2019, 11, 2086
energy intake and weight gain, particularly over the longer-term, accounting for ~11% (7%–26%) ofvariance in these outcomes [129]. Food cue-induced craving is especially prevalent among bingeeaters and those with BED [151,152] in whom it has been correlated with binge eating frequencyand BMI [153]. It is possible, therefore, that certain individuals are more susceptible to cue-inducedcravings, and also that this susceptibility may transfer across different substances. Both Mahler and deWit [147] and Styn et al. [148] found a significant correlation between cue-induced cigarette cravingand cue-induced food craving in smokers, suggesting a common mechanism. Cue-induced craving isalso believed to strengthen with repeated consumption, fueling the vicious circle shown in Figure 1.
1.3. Social Impairment
Overeating and obesity have been associated with poor social functioning, especially amongchildren and adolescents. When assessing quality of life with child and parent-proxy reports, socialfunctioning is significantly lower for obese compared to healthy-weight children and is inverselycorrelated with BMI [154–156]. Poor social functioning in overweight children may be partly dueto the overt victimisation and teasing experienced as a direct result of their weight status [157,158].Hayden-Wade et al. [159] found that the degree of teasing experienced by overweight children waspositively correlated with loneliness, an increased preference for isolative activities and a lowerpreference for social activities. This preference for being alone, along with the emotional difficulty ofbeing victimised, fuels a vicious cycle as these circumstances are likely to promote further overeatingand binge-eating—which, in turn, leads to increased weight gain and further teasing [42,160] (seeFigure 1).
Weight stigmatisation may also affect interpersonal friendships and romantic relationships inadulthood with reports of discriminatory attitudes and behaviours in occupational [161,162] andromantic settings [158,162,163]. For example, Chen and Brown [164] reported that when making sexualchoices about a partner, both male and female college students ranked an obese individual as the leastliked. In a study focusing on the psychosocial correlates of food addiction, Chao et al. [165] found that,compared to control participants, those who met the YFAS criteria scored lower on physical, mentaland social aspects of health-related quality of life. Social impairments were related to self-esteem,sexual life, public distress and work. Interpersonal problems have also been associated with bingeeating—a relationship which is likely to be bidirectional [166,167].
1.4. Repeated Use Despite Negative Consequences
It has been noted that due to its increase in prevalence and associated comorbidities, obesitynow appears to be a greater threat to the burden of disease than smoking [168]. The physicaland psychological effects of overweight and obesity are well documented and include, but are notlimited to, depression, an increased risk of diabetes, hypertension, cardiovascular disease and somecancers [169–177]. With pervasive warnings regarding the consequences of overeating, from themedia, government, and the medical profession, it seems fair to assume that most overweight andobese individuals are aware of the negative outcomes associated with their dietary behaviour [41,52].Critically, even those who have undergone weight loss treatment often fail to lose weight or gain weightfollowing intervention [46,48,50,51]. Continued overeating also occurs in those who have receivedbariatric surgery with patients showing continued snacking and poor food choices [178,179]. There is,therefore, considerable evidence to support continued overeating despite negative consequences.
1.5. Physiological Criteria
Tolerance to a substance occurs when the same amount of the substance has an increasinglydiminished effect with repeated use. This effect usually results in escalated use as the individualincreases their dosage in order to recreate the original experience. There is some evidence of foodtolerance in animal models of sugar addiction. Rats given intermittent and excessive access to sugarsolution increase their intake significantly over time, and this is accompanied by neurochemical
62

Nutrients 2019, 11, 2086
changes that are similar to those seen in drug abuse [180,181]. In humans, there is some indicationthat tolerance to sugar may occur in the first few years of life. The effectiveness of sucrose as ananalgesic in young infants is reported to diminish after 18 months of age as sugar consumptionincreases [182–185]. The possibility of such early tolerance to palatable foods and the methodologicaldifficulties of diet restriction in humans makes finding empirical evidence of tolerance in adultsdifficult and unlikely. However, statistics indicating increased consumption and portion sizes for thesefoods provide indirect evidence of tolerance to high-fat/high-sugar foods at a population level [52,186],and also at an individual level based on anecdotal reports. For example, Pretlow [42] found that77% of overweight poll respondents reported eating more now than when they originally becameoverweight. Furthermore, in response to a follow-up question asking why they believed that they atemore, 15% indicated that they were less satisfied by food. Hetherington et al. [109] also found thatwhen participants were provided with chocolate for three weeks, they increased their intake over timewhile simultaneously reporting a reduction in food liking.
Withdrawal is the second physiological criterion for substance abuse and is defined by thepresence of physical or psychological symptoms in response to substance deprivation, or the use ofthe substance in order to relieve these symptoms. Evidence of withdrawal has also been found inthe aforementioned animal models of sugar addiction. Under conditions of sugar deprivation, theseanimals show withdrawal symptoms similar to those seen with morphine and nicotine withdrawal,including physical symptoms of teeth chattering, forepaw tremor, head shaking and reduced bodytemperature [187,188] as well as increased aggression [189] and anxiety [190]. There are also anecdotalreports of withdrawal-like symptoms in humans, including persistent cravings and negative affectswhen attempting to reduce food intake [42,191], as well as the tendency to eat to avoid the emotionalsymptoms associated with withdrawal such as fatigue, anxiety and depression [52]. Using the YFAS,withdrawal symptoms (such as agitation, anxiety, or other physical symptoms) have been reported inup to 50% of individuals with obesity and BED [35].
2. Neurobiological Similarities between Palatable Foods and Drugs of Abuse
Just as altered brain functioning has been reported in SUDs, overeating and obesity have alsobeen associated with changes in the neural processing of the motivational properties of food. Thisincludes changes in systems coding the hedonic and rewarding aspects of the substance, as well as thesystems involved in controlling these motivations [103,192–194]. Volkow and colleagues [195–199]have proposed a common model for addiction and obesity that involves two neural circuits that areboth modulated by dopamine—increased reward sensitivity and diminished inhibitory control [70].
2.1. Neurobiology of Reward Sensitivity
Addictive drugs directly affect the mesolimbic dopamine system (MDS), which is thought tomediate the processing of motivational salience, pleasure and reward [200]. Animal studies haveshown that, similar to drugs of abuse, palatable foods are capable of triggering dopamine release inthe nucleus accumbens (NAc) and ventral tegmental area (VTA) [181,201–203]. Furthermore, activityin the MDS has been linked to the amount of food ingested and its rewarding properties [204,205].However, distinct patterns of neuronal firing in the NAc to food and illicit substances have alsobeen reported [206,207]. Increased activation of this reward system has also been shown in humanparticipants during the presentation of food cues and meal consumption [96,208–211]. For example,Stoeckel et al. [212] demonstrated that when viewing images of high-calorie foods, obese womenshowed significantly greater activation in a number of regions associated with reward, compared tohealthy-weight women. Obese participants have also demonstrated increased responsivity to food ingustatory and somatosensory regions [213,214], suggesting a heightened sensitivity to palatable foodthat may contribute to overeating and obesity.
Although an increased sensitivity to reward may initially drive individuals to consume calorificfoods, it has been speculated that compulsive eating may develop as the pleasure derived from
63

Nutrients 2019, 11, 2086
these foods diminishes with increased tolerance (see Figure 1). It has been argued that, just as withdrugs of abuse, the chronic consumption of such rewarding foods may cause the downregulationof dopamine receptors in order to compensate for their overstimulation [215–217]. Decreasedstriatal dopamine receptor availability has frequently been observed in individuals with substanceaddictions [218–222], whereas increased receptor availability has been shown to have a protective roleagainst alcoholism [223,224]. It has also been shown that striatal D2 receptor availability is significantlylower in severely obese individuals compared to controls and is significantly and negatively correlatedwith BMI [99,100].
It has been argued, therefore, that a reduction in dopamine receptor availability may subsequentlycause or exacerbate overeating as a form of ‘self-medication’ in which the individual attemptsto compensate for a diminished experience of reward [100,225–227] (see Figure 2). For example,Geiger et al. [228] found that rats fed on a cafeteria-style diet showed reduced baseline levels ofmesolimbic dopamine activity. This activity was stimulated by cafeteria foods but not by their regularchow, thus suggesting that a preference for palatable food may develop as a consequence of its abilityto increase dopamine release compared to other, less palatable, foods. Animal studies have alsodemonstrated causal effects of D2 receptor agonists and antagonists on overeating. The administrationof D2 antagonists has been shown to increase meal size, meal duration and body weight, whereastreatment with D2 agonists can reduce hyperphagia and prevent weight gain [229–231]. The effectsof such pharmaceutical interventions in humans, however, have been fairly mixed. The use ofantipsychotic medication which blocks D2 receptors is typically associated with weight gain [232] andsome D2 agonists have been found to reduce body weight [233]. A recent trial, however, found no effectof the dopamine agonist cabergoline on preventing weight regain [234,235] and there is some evidencethat D2 agonists can promote weight gain in patients with anorexia nervosa [236]. More encouragingly,studies with gastric bypass patients have demonstrated increased D2 receptor availability followingweight loss, indicating that the effects of overeating on dopamine receptor downregulation may bereversible [237–239].
Figure 2. The proposed cycle of ‘food addiction’ including the role of dopamine. When palatable foodis consumed, the brain releases the hormone dopamine (alongside other neurotransmitters such asopioids). Over time, this increase in dopamine leads to the downregulation of dopamine receptors,causing individuals to experience a reduction in pleasure during palatable food consumption. Thisdecrease in pleasure, combined with symptoms of tolerance, craving, withdrawal and other social,emotional and behavioural difficulties, results in the individual engaging in compensatory behaviourby increasing food consumption. As a consequence, food consumption may become compulsive, thuscreating a cycle of food addiction.
64

Nutrients 2019, 11, 2086
2.2. Neurobiology of Inhibitory Control
Dopamine receptor availability in obese individuals has also been shown to correlate positivelywith metabolism in prefrontal regions involved in inhibitory control (specifically the dorsolateralprefrontal cortex [DLPFC], medial orbitofrontal cortex [mOFC] and anterior cingulate gyrus, as well asthe somatosensory cortices) [99]. Similar findings have been observed in healthy-weight participants,who demonstrated a positive correlation between dopamine receptor availability and inhibitory controlperformance on the stop-signal task [240]. Volkow et al. [99] hypothesised that altered dopaminefunctioning may play a role in overeating not only through altering the rewarding properties of foodbut also by reducing inhibitory control. A significant negative correlation between BMI and prefrontalactivity has also been reported [75,241,242] along with reduced prefrontal activation following a mealin obese men and women [243–245]. Conversely, successful dieting has been positively associated withfrontal activation [246–249].
In a study of healthy women, Lawrence et al. [96] reported an association between food cuereactivity in the NAc and later snack consumption [117]. They also found that this reactivity wasassociated with increased BMI for individuals who reported low self-control. The authors proposed a‘dual hit’ of increased reward motivation and poor self-control in predicting increased food intake [250].Similarly, reductions in frontal grey matter volume have also been linked to increased BMI, poorfood choices and related deficits in executive functioning [251–258]. These findings are reflective ofa growing literature on the cognitive dysfunction associated with drug abuse and obesity, althoughresearch indicates that the causal relationship is bidirectional [76,259–263].
Although it has been hypothesised that overeating is initially caused by a hyper-responsive rewardcircuitry and maintained by the subsequent degradation of this system [103], there is also evidenceto suggest that some individuals may be genetically vulnerable to an impaired capacity for rewardand inhibitory control. Genetics studies have revealed that both drug users and obese individualshave a significantly greater prevalence of the TaqI A1 allele polymorphism which can cause a 30%–40%reduction in striatal D2 receptors [213,264–269]. In addition, this polymorphism has been associatedwith behavioural measures of impulsivity and low reward sensitivity [270–272]. It has also been linkedto low grey matter volume in the anterior cingulate cortex (ACC) [273], an area which is believed to beinvolved in executive control and reward expectancy [240,274,275], and has been shown to be activeduring resistance of cigarette craving [276]. Together these findings demonstrate that overeating andSUDs may share a common neurobiological mechanism involving altered dopamine functioning thatsubsequently disrupts mechanisms involved in reward sensitivity and inhibitory control.
Our review, considering each of the DSM-5 criteria for SUDs in isolation, suggests that there isconsiderable evidence for food addiction. Whether an individual meets clinical diagnostic criteriaunder an SUD model, and the severity of the disorder, however, is dependent on an individualpresenting a number of symptoms (mild: two to three symptoms; moderate: four to five symptoms;severe: six or more symptoms). Studies utilising the YFAS (which uses diagnostic criteria for SUDs)have certainly suggested that a substantial proportion of the general population meet the diagnosticcut-off for food addiction (15%–20%), with approximately 11% of the population being classified as‘severe’ [38,276]. The prevalence of food addiction in those with BED and BN has been reported asmuch higher, with estimates of 92% for BED and 96%–100% for BN [32,277,278]. Acknowledging thepotential prevalence of food addiction, we next discuss a range of treatments for overeating that havebeen informed by the similarities between SUDs and overeating.
3. Treatment Implications
One of the greatest potential advantages of identifying the similarities between substanceaddictions and overeating is the development of effective interventions. The standard approach toweight loss, involving maintaining a healthy diet and physical exercise, is often associated with pooradherence rates and overall weight gain [46–51,279]. One possible reason for the ineffectiveness ofdieting is that it is treating the outcome of overeating and not the underlying cause. Approaches
65

Nutrients 2019, 11, 2086
that target increased impulsivity and reduced self-control may have more success. For example, Hall,Fong, Epp and Elias [280] showed that executive function on the go/no-go task (a measure of responseinhibition) predicted unique variance for dietary behaviour and physical exercise, and also moderatedthe association between intentions and behaviour [117,281]. This suggests that individuals who aremore capable of controlling their impulsive actions are more likely to successfully meet their goals.This also implies that techniques to improve such abilities may prove to be effective tools for aidingweight loss.
3.1. Cognitive Interventions
Increased motivation for illicit substances has been associated with several cognitive biasesincluding attentional biases [282–287], approach biases [283,284,288–290] and affective biases [291–294].One method for reducing this motivation, therefore, has been to use training tasks that are designedto reduce these cognitive biases, and recently, these training tasks have been explored as potentialinterventions for overeating.
Heightened attentional biases towards food have been demonstrated across various populations,including those with disordered eating patterns [295–300] and those who are overweight orobese [301–304]. Just as the addiction literature has explored whether attentional biases can bemanipulated to reduce substance intake, this approach has also been explored with food consumption,although with mixed results [305–309]. Hardman et al. [305] trained undergraduate students on thevisual probe task to either attend or avoid images of cake and stationery. They found a modest increasein attentional bias for the attend-cake group but no effects of bias training, for either group, on hungeror food consumption, suggesting that any attentional biases with food may be particularly difficult tomodify. Using a female-only sample, Kemps et al. [306] demonstrated significant effects of a similardot-probe training on attentional bias and food consumption. Effects on attention were found togeneralise to novel pictures, however, effects on food intake were specific to the trained food andwere undermined by participants consuming more of an equally unhealthy novel food. More recentresults hold some promise for attentional bias modification, indicating that training can be used todecrease immediate calorie consumption in overweight and obese women [310] and can increase theconsumption of healthy foods [311]. Multiple training sessions have also demonstrated that effects canpersist beyond the period of training for up to a week [312].
There is also a small body of evidence demonstrating an approach tendency towards food forindividuals with disordered eating [295,313,314], high trait food craving [315] and those who areoverweight or obese [316–318]. For example, Veenstra and de Jong [313] showed that those who scoredhighly on a measure of dietary restraint (a measure for the chronic, cognitive limitation of food intake)were significantly faster to move a manikin towards than away from images of food. Using a differentmeasure of approach bias, Kemps, Tiggemann, Martin and Elliott [319] also found that participantswho liked chocolate were significantly faster at pairing images of chocolate with approach wordscompared to avoid words. Furthermore, they also demonstrated that participants who were trained topair images of chocolate with either approach or avoid words increased and decreased their approachbias, respectively. The approach group also demonstrated a significant increase in chocolate cravings.Although the avoid group showed a decrease in reported craving, this finding was not statisticallysignificant from baseline [320]. Similar training protocols have also been shown to be effective atreducing action tendencies towards high-calorie foods and reducing trait- and cue-induced craving inparticipants with subclinical eating disorders [321].
The use of addictive substances can also be motivated by the positive affect associated with them;therefore, reducing such an affective bias should discourage their use. Studies using evaluative (oraffective) conditioning have shown initial promise. Here, the evaluation of a conditioned stimulus (CS)can be modified by consistently pairing it with a valenced unconditioned stimulus (US) [322,323]. In thefood literature, negatively valenced stimuli are typically used to reduce the implicit liking of unhealthyfoods [324–328]. Further, evaluative conditioning has been found to lead to more favourable food
66

Nutrients 2019, 11, 2086
choices in some studies. For example, Walsh and Kiviniemi [329] found that participants were threetimes more likely to select fruit over a granola bar after receiving evaluative conditioning training wherepositive (relative to negative or neutral) words and images were paired with images of fruit. Similarly,Hollands et al. [325] showed that participants were more likely to select fruit over an unhealthy snackwhen snack images were repeatedly paired with negative body images compared to a blank screen.Interestingly, this effect was moderated by implicit attitudes towards the snack foods; participantswith more favourable attitudes at baseline showed the greatest change in subsequent behaviour.Although these studies have involved healthy participants, this latter finding, in particular, suggeststhat evaluative conditioning may be an appropriate intervention for those with disordered eating whoshow strong preferences for unhealthy foods. However, the effects of evaluative conditioning trainingon reducing unhealthy food consumption are currently unclear. To date, only a limited number ofstudies have included post-intervention follow-up, and while some have found reduced consumptionin the week following training [330], others have failed to show immediate effects [327,328,330]. It islikely that training effects are dependent on baseline strength of liking for specific foods [325,330], thespecificity of the US used [331], and awareness of the CS-US contingencies [332–334]. To establish thetherapeutic benefits of evaluative conditioning training, studies in overweight and disordered eatinggroups are required.
Another approach to cognitive training is to reduce such biases indirectly through tasks such asresponse inhibition training. Response inhibition refers to our ability to interrupt or override impulsivereactions in accordance with new information, and plays a key role in goal-directed behaviour [335–340].Deficient response inhibition has been linked not only to the use of different addictive substances [70]but also to the severity of use [61,64,341], poor treatment outcomes [342] and likelihood of relapse [343].Houben and Wiers [344] have also shown that positive implicit attitudes towards alcohol are onlyrelated to alcohol consumption when inhibitory control is low. These results suggest that an increasedability to inhibit responses may enable an individual to exert self-control over their behaviour, evenwhen they possess strong implicit preferences [117].
Similar findings have also been replicated with overeating and obesity. Obese individualshave been shown to demonstrate less efficient response inhibition than their healthy-weightcounterparts [69,251,345,346] and poor inhibitory control has been associated with increased unhealthyfood consumption [86,347,348], high BMI [75,85,349,350], food cravings [351], unhealthy foodchoices [84,352] and binge-eating [353]. Moreover, as in the addiction literature, inhibitory controlhas also been shown to interact with implicit attitudes towards food, thus indicating that effectiveresponse inhibition may play a protective role against strong implicit preferences for unhealthyfoods [80,117,250].
Simple tasks designed to train response inhibition to relevant cues or contexts have been shownto reduce gambling behaviour and alcohol consumption [354–359]—although available evidencesuggests that the longevity of such effects may be limited [360]. These training tasks have also beenadapted to train response inhibition to food stimuli and are showing encouraging effects across arange of eating-related behaviours including food consumption [361–365], food choices [365–371] andeven weight loss [372–375]. For example, Lawrence et al. [376] trained participants to inhibit theirresponses towards either images of unhealthy snack foods (active group) or non-food items (controlgroup). After four training sessions, they found that, compared to the control group, individuals inthe active group showed reduced energy intake (220 kcal less per 24 h food diary) and reduced likingfor unhealthy foods. Furthermore, participants in the active group showed significant weight loss;showing objectively measured weight loss of 0.7 kg after 2 weeks and self-reported weight loss of morethan two kilograms after a six month follow up (2.66% decrease).
The cognitive training paradigms discussed above show promise but are currently in the earlyphases of testing. Before such training methods can be taken forward to clinical trials, researchersshould further explore the effects of different experimental protocols with the aim of developing themost effective training techniques. One aspect of training that is likely to be important in determining
67

Nutrients 2019, 11, 2086
successful behavior change is training performance. For example, the proportion of successfulinhibitions on an inhibition training task and accuracy during attentional bias training have bothbeen shown to moderate efficacy [308,375]. To establish whether effects can be long-lasting, weneed to consider repeated testing sessions, personalised training stimuli and combining trainingtechniques to simultaneously reduce cognitive biases and increase executive control [312,369,377,378].Understanding the mechanisms that underlie such effects could also prove crucial. For example, theeffects of inhibition training on food consumption may be due to the devaluation of inhibited stimuli.Several studies have shown that repeatedly pairing a stimulus with the inhibition of a response canreduce how much the image is liked or how attractive it was perceived to be [371,376]. Such devaluationcould be the result of action conflict or inherent links between avoidance and aversion [371,379–382].Designing interventions that promote automatic associations between stimuli and action tendenciesmay, therefore, prove fruitful, especially if training is performed accurately, personalised and deliveredacross multiple sessions. Combining cognitive training tasks with prefrontal brain stimulation isanother avenue worthy of investigation. Brain stimulation methods have the potential to augmentlearning effects [383] and can also be used to reduce food consumption and craving in isolation; thesemethods are discussed below.
3.2. Neuromodulation Interventions
Non-surgical brain stimulation techniques have also been explored for their potential benefits inreducing craving and addictive behaviours by altering neural activity and increasing dopamine [384–388]. The most commonly applied stimulation methods are transcranial magnetic stimulation (TMS)and transcranial direct current stimulation (tDCS). These methods are used in awake participants andare generally considered to be safe when administered within recommended guidelines [389–394].
The use of TMS involves the delivery of electromagnetic pulses that penetrate the skull to induceelectric current in the underlying cortex and cause short-term changes in cortical excitability. Themodulation of cortical excitability can last beyond the period of stimulation by delivering trains ofpulses, a technique known as repetitive TMS (rTMS) [395]. When applied to the DLPFC, rTMS hasbeen shown to effectively reduce cravings for cigarettes, alcohol and drugs of abuse, especially whenapplied for multiple sessions [396–400]. The DLPFC is an area involved extensively in inhibitorycontrol [401–404] and stimulation of this region may act to boost self-control, potentially by increasingdopamine release in the caudate nucleus [405,406].
Reductions in substance craving have also been demonstrated with stimulation of the DLPFCusing tDCS [114,407–412]. The use of tDCS involves the application of a weak (typically 1–2mA)direct electrical current to the scalp via a pair of electrodes. The effect of tDCS on brain activity isdependent on the stimulation polarity; anodal stimulation is thought to increase cortical excitabilityby neuronal depolarisation whereas cathodal stimulation is believed to decrease excitability byhyperpolarising neurons [413–418]. Long-lasting effects on resting membrane potential have beenshown with longer stimulation durations, for example, 13 min of anodal tDCS has been shown toincrease motor cortical excitability for up to 90 min [419]. Compared to TMS, tDCS is a weaker form ofstimulation with fewer incidental artefacts and is considered to be safer and more appropriate for reliabledouble-blinding [387,420,421]. It is also thought that tDCS can be used to potentiate learning [422],and may effectively enhance the effects of the aforementioned cognitive interventions [378,423].
These stimulation methods are currently being investigated for their potential to reduce foodcraving and consumption [424–429]. Using rTMS to the left DLPFC, Uher et al. [430] found an increasein cue-induced craving for palatable foods in the group who experienced sham stimulation but not theactive group. However, no effect was found on ad-libitum food consumption, although this result mayhave been due to the limited time period (5 min) causing participants in both groups to consume alarge amount of calories. Using a similar methodology, Van den Eynde et al. [431] demonstrated anincrease in craving scores in the sham group, but a decrease in craving scores for the active group in asample of participants with bulimic-type eating disorders. In addition, active rTMS was associated
68
Nutrients 2019, 11, 2086
with a reduction in binge-eating episodes in the following 24 h period. However, blinding was onlypartially successful in this study with most participants correctly guessing whether they were receivingactive or sham rTMS. In a later study, Barth et al. [432] used a within-subjects design with an improvedsham condition in which they matched the perceived pain of active rTMS with scalp electrodes. Theyfound an equal reduction in cravings for both conditions and attributed this effect to the experience ofpain rather than prefrontal stimulation.
As mentioned, tDCS is believed to involve a more appropriately matched sham condition,especially when participants receive active stimulation for a short initial period [420,421]. Whenstimulating the DLPFC bilaterally using tDCS, Fregni et al. [433] found a significant increase incue-induced craving, measured before and after stimulation, in the sham condition and a significantreduction when participants received anodal right/cathodal left stimulation. Compared to the shamcondition, active stimulation was also associated with a reduction in food intake during an ad-libitumeating phase. Although the authors did not assess blinding in this study, they did report equaloccurrences of mild adverse effects across conditions. Using the same montage, Goldman et al. [424]and Lapenta et al. [426] also found the same reduction in food craving, and an early meta-analysisrevealed a medium effect-size favouring active over sham stimulation in the reduction of cravings [434].However, as the number of studies utilizing tDCS in the exploration of its effects on food cravinghas increased, evidence of efficacy has weakened. A more recent meta-analysis, including eightexperiments, found no effect of tDCS on food craving [386], and subsequent research, includinga large pre-registered experiment, has also failed to replicate findings for both food craving andconsumption [435,436].
Another neuromodulation intervention, which is worthy of a brief mention and gainingin popularity for the treatment of SUDs, is real-time fMRI (rt-fMRI) neurofeedback training.Neurofeedback training involves providing participants with feedback of their neural responseto certain cues and instructing them to increase or decrease their response, so that they may gainvolitional control over specific brain regions. In the treatment of SUDs, neurofeedback training typicallyinvolves increasing activity in control regions, such as the prefrontal cortex, or decreasing activity inregions associated with craving, such as the ACC. For example, it has been shown that decreasingactivity in the ACC with rt-fMRI neurofeedback is significantly correlated with decreased nicotinecraving in smokers [437–439]. Using a similar technique with electroencephalography (EEG) hasalso shown improvements in cravings, drug use and treatment outcomes for a range of differentsubstances [440–443]. Although in its early days, the application of neurofeedback training to foodconsumption and obesity has already been proposed [444–446]; recent findings have also suggestedthat neurofeedback may be another method of decreasing activity in motivation- and reward-relatedregions [447] and increasing activity within critical prefrontal regions such as the DLPFC [448,449].
3.3. Therapeutic Interventions
Therapeutic interventions such as Overeaters Anonymous and cognitive behavioural therapy havetaken a more holistic approach to the treatment of obesity. Overeaters Anonymous (OA) is based directlyon the 12-step programme developed by Alcoholics Anonymous. The OA organisation promotes thecentral belief that obesity is a symptom of ‘compulsive overeating’, which is an addictive-like illnesswith physical, emotional and spiritual components [450]. Individuals are required to acknowledge thatcompulsive overeating is beyond their willpower to overcome and, therefore, they must attempt tocontrol their intake by avoiding certain foods and surrendering to a ‘higher power’. Just like AlcoholicsAnonymous, OA involves group meetings for individuals to share their feelings and experiences.Although the way in which this programme influences outcomes is unclear [53], the group meetingsmay act to alleviate feelings of isolation and instead foster a sense of community. As discussed earlier,due to the feelings of shame and guilt and the weight teasing experienced, overweight and obesityare associated with a preference for isolative activities [159]. This social isolation can subsequentlyexacerbate overeating, creating a vicious cycle [42,160]. It is possible, therefore, that OA acts to
69

Nutrients 2019, 11, 2086
break this cycle by providing a supportive and encouraging social environment. However, due tothe anonymous nature of OA, there has been little research conducted on its efficacy and it is notunderstood exactly how OA affects overeating and the extent to which it may do so.
Cognitive behavioural therapy (CBT), on the other hand, is a therapeutic approach which isextensively informed by research. CBT requires patients to critically evaluate the thoughts, feelingsand behaviours that result in maladaptive behaviour and then modify them through therapy. Thistherapy allows patients to recognise potential triggers and develop appropriate coping strategies.CBT interventions have been effective in the treatment of substance addictions [451] and have alsodemonstrated their potential in the treatment of obesity [452,453] and BED [453–456]. However, ithas been argued that the success of treating overeating and BED with CBT refutes the food addictionmodel [30]. The food addiction model applied in OA requires complete avoidance of so-called triggerfoods, thereby acting to increase dietary restraint, whereas a reduction in dietary restraint has beenshown to moderate the increased effectiveness of CBT on binge eating in a sample of patients withBN [457]. The focus of CBT is to replace dysfunctional eating with more normalised eating behaviour,therefore, favouring moderation and flexibility rather than absolute restraint.
4. Conclusions
As the prevalence of obesity continues to increase and traditional weight loss methods appear tobe largely unsuccessful, researchers and clinicians have begun to consider the addictive potential offood. There is a substantial body of evidence demonstrating the similarities between addictive drugsand food on reward and control pathways in the brain and subsequent behaviour such as craving andimpulsivity. There is also limited evidence to indicate that in some circumstances, overeating meets thephysiological criteria of substance dependence, although more research is necessary to determine thevalidity of these symptoms in human participants. More research is also required for other behaviouralcriteria such as social impairment and repeated use despite negative consequences, as the evidence todate is largely anecdotal. However, meeting the physiological criteria for addiction is not necessaryfor a DSM diagnosis, and as food is a legal substance, just like caffeine, tobacco and alcohol, not allcriteria associated with SUDs [23] readily translate to food addiction. Nevertheless, the criterion ofwithdrawal in SUDs has been associated with clinical severity and the number of symptoms that anindividual endorses is used to determine the disorder’s overall severity [23].
With a number of these criteria having a limited application to food addiction, a clinical diagnosisappears unlikely in most cases of overeating; however, using the YFAS, it has been estimated thatapproximately 11% of the general population meet the criteria for a ‘severe’ food addiction [38]. Itshould also be made clear that the concept of food addiction does not equate with obesity. Obesity is amultifactorial condition determined by genetic, environmental, biological and behavioural components.For the majority of cases, obesity is caused by a steady increase in excess energy intake and it is notcharacterised by a compulsive drive for food consumption. Instead, it is thought that the concept offood addiction applies most appropriately to individuals with BED and BN [31,32,277,278].
Despite there being considerable parallels between substance use and compulsive overeating,there is still some concern regarding the use and validity of the term ‘food addiction’, which is unlikelyto apply to the majority of cases [17]. There is also concern over the use of such terminology in the widersocial context and whether the term may do more harm than good. While most people would believethat an addiction model reduces individual responsibility, it has also been argued that attributing theproblem to a minority of individuals also reduces corporate responsibility [28,458]. As the majorityof the population would not be considered ‘food addicts’, there would be less pressure for the foodindustry to reduce marketing or to promote healthier alternatives. Likewise, any environmentalinterventions to reduce access and availability may also seem less critical with a food addiction model.
There are also implications of such terminology for the diagnosed individual. Obesity is alreadyassociated with significant social stigmatisation [157–159,161–164] and an additional ‘addict’ label,which may invoke stereotypes of a person who is untrustworthy and inferior [459], may only serve to
70

Nutrients 2019, 11, 2086
heighten the problem [460–462]. DePierre et al. [460] found that when an individual was labelled asan ‘obese food addict’ they were more stigmatised than when they received either label in isolation(‘food addict’ or ‘obese’). However, a study investigating the effect of an addiction model on publicperceptions found that it actually reduced stigma, blame and perceived psychopathology [463,464],suggesting that it may be beneficial in reducing weight-related prejudice. The ‘addicted’ individualdescribed in the study was viewed as being less at fault for their weight. Although, it is unclearwhether the fault then lies with the individual’s biology (i.e., certain individuals are prone to becoming‘food addicts’) or the industry that continues to promote potentially addictive foods. Although it isalmost certain to be a combination of both entities, demonstrating that certain foods can be addictiveshould increase corporate responsibility and pressure on the food industry to regulate the availability,advertising and nutritional content of such palatable foods [9,458].
Despite these issues and concerns, it has also been acknowledged that for some individuals,‘food addiction’ may be the most appropriate diagnosis for their symptoms and it may help to informtheir treatment [34]. The available evidence suggests, therefore, that some individuals are capableof experiencing an addictive-type relationship with food, although the majority of individuals whocompulsively overeat are unlikely to receive such a diagnosis. Considering the underlying causesof impulsive overeating has also led to the development of some exciting and potentially effectiveinterventions. While there are differences between the addictive characteristics of food and illicitsubstances, there are many parallels that should not be ignored. These parallels have contributed greatlyto our current knowledge of compulsive overeating and potential treatments. Both the similaritiesand differences should encourage more research, which is necessary to determine the extent andpotential impact of such a disorder. Until then, the idea of ‘food addiction’ is expected to remain hotlydebated [14,19,20].
Author Contributions: R.C.A. conceived, drafted and finalised the manuscript. J.S., L.M., C.D.C. and N.S.L. madesubstantial contributions to the manuscript drafts and final approval of the manuscript. All the authors agree tobe accountable for all aspects of the work in ensuring that questions related to the accuracy or integrity of any partof the work are appropriately investigated and resolved.
Funding: This research was supported by grants held by C.D.C. from the Biotechnology and Biological SciencesResearch Council [BB/K008277/1] and the European Research Council [Consolidator grant 647893 CCT].
Conflicts of Interest: The authors declare no competing interests.
References
1. WHO. Obesity and Overweight; World Health Organization: Geneva, Switzerland, 2003.2. Global Burden of Disease Collaborative Network. Global Burden of Disease Study. Obesity Prevalence 1990–2013;
Institute for Health Metrics and Evaluation (IHME): Seattle, WA, USA, 2014.3. Ng, M.; Fleming, T.; Robinson, M.; Thomson, B.; Graetz, N.; Margono, C.; Mullany, E.C.; Biryukov, S.;
Abbafati, C.; Abera, S.F.; et al. Global, regional, and national prevalence of overweight and obesity in childrenand adults during 1980–2013: A systematic analysis for the Global burden of disease study 2013. Lancet 2014,384, 766–781. [CrossRef]
4. WHO. Obesity and Overweight; World Health Organization: Geneva, Switzerland, 2018.5. Butland, B.; Jebb, S.; Kopelman, P.; McPherson, K.; Thomas, S.; Mardell, J.; Parry, V. Tackling Obesities: Future
Choices—Project Report, 2nd ed.; Foresight Programme of the Government Office for Science: London, UK,2007. Available online: www.bis.gov.uk/assets/bispartners/foresight/docs/obesity/17.pdf (accessed on 28September 2018).
6. Cummins, S.; Macintyre, S. Food environments and obesity—Neighbourhood or nation? Int. J. Epidemiol.2006, 35, 100–104. [CrossRef] [PubMed]
7. Jeffery, R.W.; Utter, J. The changing environment and population obesity in the United States. Obes. Res.2003, 11, 12S–22S. [CrossRef] [PubMed]
8. Levitsky, D.A. The non-regulation of food intake in humans: Hope for reversing the epidemic of obesity.Physiol. Behav. 2005, 86, 623–632. [CrossRef] [PubMed]
71

Nutrients 2019, 11, 2086
9. Schulte, E.M.; Avena, N.M.; Gearhardt, A.N. Which foods may be addictive? The roles of processing, fatcontent, and glycemic load. PLoS ONE 2015, 10, e0117959. [CrossRef] [PubMed]
10. Blundell, J.E.; Burley, V.J.; Cotton, J.R.; Lawton, C.L. Dietary fat and the control of energy intake: Evaluating theeffects of fat on meal size and postmeal satiety. Am. J. Clin. Nutr. 1993, 57, 772S–778S. [CrossRef] [PubMed]
11. Drewnowski, A.; Brunzell, J.; Sande, K.; Iverius, P.; Greenwood, M. Sweet tooth reconsidered: Tasteresponsiveness in human obesity. Physiol. Behav. 1985, 35, 617–622. [CrossRef]
12. Drewnowski, A.; Kurth, C.; Holden-Wiltse, J.; Saari, J. Food preferences in human obesity: Carbohydratesversus fats. Appetite 1992, 18, 207–221. [CrossRef]
13. Davis, C. An introduction to the Special Issue on ‘food addiction’. Appetite 2017, 115, 1–2. [CrossRef] [PubMed]14. Avena, N.M.; Gearhardt, A.N.; Gold, M.S.; Wang, G.-J.; Potenza, M.N. Tossing the baby out with the bathwater
after a brief rinse? The potential downside of dismissing food addiction based on limited data. Nat. Rev.Neurosci. 2012, 13, 514. [CrossRef]
15. Corsica, J.A.; Pelchat, M.L. Food addiction: True or false? Curr. Opin. Gastroenterol. 2010, 26, 165–169. [CrossRef][PubMed]
16. Meule, A.; Gearhardt, A. Food addiction in the light of DSM-5. Nutrients 2014, 6, 3653–3671. [CrossRef][PubMed]
17. Rogers, P.J.; Smit, H.J. Food craving and food “addiction”: A critical review of the evidence from abiopsychosocial perspective. Pharmacol. Biochem. Behav. 2000, 66, 3–14. [CrossRef]
18. Volkow, N.D.; Wise, R.A.; Baler, R. The dopamine motive system: Implications for drug and food addiction.Nat. Rev. Neurosci. 2017, 18, 741–752. [CrossRef] [PubMed]
19. Ziauddeen, H.; Farooqi, I.S.; Fletcher, P.C. Food addiction: is there a baby in the bathwater? Nat. Rev.Neurosci. 2012, 13, 514. [CrossRef]
20. Ziauddeen, H.; Farooqi, I.S.; Fletcher, P.C. Obesity and the brain: how convincing is the addiction model?Nat. Rev. Neurosci. 2012, 13, 279–286. [CrossRef] [PubMed]
21. Frascella, J.; Potenza, M.N.; Brown, L.L.; Childress, A.R. Carving addiction at a new joint? Shared brainvulnerabilities open the way for non-substance addictions. Ann. N. Y. Acad. Sci. 2010, 1187, 294–315. [CrossRef]
22. Orford, J. Addiction as excessive appetite. Addiction 2001, 96, 15–31. [CrossRef]23. American Psychiatric Association. Diagnostic and Statistical Manual of Mental Disorders, 5th ed.; American
Psychiatric Association: Washington, DC, USA, 2013.24. Potenza, M.N. Biological contributions to addictions in adolescents and adults: Prevention, treatment and
policy implications. J. Adolesc. Health 2013, 52, S22–S32. [CrossRef]25. Worhunsky, P.D.; Malison, R.T.; Rogers, R.D.; Potenza, M.N. Altered neural correlates of reward and
loss processing during simulated slot-machine fMRI in pathological gambling and cocaine dependence.Drug Alcohol Depend. 2014, 145, 77–86. [CrossRef]
26. Barry, D.; Clarke, M.; Petry, N.M. Obesity and its relationship to addictions: Is overeating a form of addictivebehavior? Am. J. Addict. 2009, 18, 439–451. [CrossRef] [PubMed]
27. Cassin, S.E.; Buchman, D.Z.; Leung, S.E.; Kantarovich, K.; Hawa, A.; Carter, A.; Sockalingam, S. Ethical,Stigma, and policy implications of food addiction: A scoping review. Nutrients 2019, 11, 710. [CrossRef][PubMed]
28. Gearhardt, A.N.; Grilo, C.M.; Dileone, R.J.; Brownell, K.D.; Potenza, M.N. Can food be addictive? Publichealth and policy implications. Addiction 2011, 106, 1208–1212. [CrossRef] [PubMed]
29. Volkow, N.D.; Wise, R.A. How can drug addiction help us understand obesity? Nat. Neurosci. 2005, 8,555–560. [CrossRef] [PubMed]
30. Wilson, G.T. Eating disorders, obesity and addiction. Eur. Eat. Disord. Rev. 2010, 18, 341–351. [CrossRef][PubMed]
31. Davis, C.; Carter, J.C. Compulsive overeating as an addiction disorder. A review of theory and evidence.Appetite 2009, 53, 1–8. [CrossRef] [PubMed]
32. Meule, A.; von Rezori, V.; Blechert, J. Food addiction and bulimia nervosa. Eur. Eat. Dis. Rev. 2014, 22,331–337. [CrossRef] [PubMed]
33. Shell, A.G.; Firmin, M.W. Binge eating disorder and substance use disorder: A case for food addiction.Psychol. Stud. 2017, 62, 370–376. [CrossRef]
34. Smith, D.G.; Robbins, T.W. The neurobiological underpinnings of obesity and binge eating: A rationale foradopting the food addiction model. Biol. Psychiatr. 2013, 73, 804–810. [CrossRef]
72

Nutrients 2019, 11, 2086
35. Cassin, S.E.; Von Ranson, K.M. Is binge eating experienced as an addiction? Appetite 2007, 49, 687–690.[CrossRef]
36. Gearhardt, A.N.; White, M.A.; Masheb, R.M.; Morgan, P.T.; Crosby, R.D.; Grilo, C.M. An examination ofthe food addiction construct in obese patients with binge eating disorder. Int. J. Eat. Dis. 2012, 45, 657–663.[CrossRef] [PubMed]
37. Gearhardt, A.N.; Corbin, W.R.; Brownell, K.D. Preliminary validation of the Yale food addiction scale.Appetite 2009, 52, 430–436. [CrossRef] [PubMed]
38. Gearhardt, A.N.; Corbin, W.R.; Brownell, K.D. Development of the Yale food addiction scale version 2.0.Psychol. Addict. Behav. 2016, 30, 113–121. [CrossRef] [PubMed]
39. Gearhardt, A.N.; Roberto, C.A.; Seamans, M.J.; Corbin, W.R.; Brownell, K.D. Preliminary validation of theYale food addiction scale for children. Eat. Behav. 2013, 14, 508–512. [CrossRef]
40. Murphy, C.M.; Stojek, M.K.; MacKillop, J. Interrelationships among impulsive personality traits, foodaddiction, and body mass index. Appetite 2014, 73, 45–50. [CrossRef]
41. Curtis, C.; Davis, C. A qualitative study of binge eating and obesity from an addiction perspective. Eat. Dis.2014, 22, 19–32. [CrossRef]
42. Pretlow, R.A. Addiction to highly pleasurable food as a cause of the childhood obesity epidemic: A qualitativeinternet study. Eat. Disord. 2011, 19, 295–307. [CrossRef]
43. French, S.; Jeffery, R.; Sherwood, N.; Neumark-Sztainer, D. Prevalence and correlates of binge eating in anonclinical sample of women enrolled in a weight gain prevention program. Int. J. Obes. 1999, 23, 576–585.[CrossRef]
44. Lu, H.K.; Mannan, H.; Hay, P. Exploring relationships between recurrent binge eating and illicit substanceuse in a non-clinical sample of women over two years. Behav. Sci. 2017, 7, 46. [CrossRef]
45. MacDiarmid, J.; Loe, J.; Kyle, J.; McNeill, G. “It was an education in portion size”. Experience of eating ahealthy diet and barriers to long term dietary change. Appetite 2013, 71, 411–419. [CrossRef]
46. Bacon, L.; Aphramor, L. Weight science: Evaluating the evidence for a paradigm shift. Nutr. J. 2011, 10, 9.[CrossRef] [PubMed]
47. Dansinger, M.L.; Gleason, J.A.; Griffith, J.L.; Selker, H.P.; Schaefer, E.J. Comparison of the Atkins, Ornish,Weight Watchers, and Zone Diets for Weight Loss and Heart Disease Risk Reduction. JAMA 2005, 293, 43.[CrossRef] [PubMed]
48. Jeffery, R.W.; Epstein, L.H.; Wilson, G.T.; Drewnowski, A.; Stunkard, A.J.; Wing, R.R. Long-term maintenanceof weight loss: Current status. Health Psychol. 2000, 19, 5–16. [CrossRef] [PubMed]
49. Lowe, M.R.; Annunziato, R.A.; Markowitz, J.T.; Didie, E.; Bellace, D.L.; Riddell, L.; Maille, C.; McKinney, S.;Stice, E. Multiple types of dieting prospectively predict weight gain during the freshman year of college.Appetite 2006, 47, 83–90. [CrossRef] [PubMed]
50. Mann, T.; Tomiyama, A.J.; Westling, E.; Lew, A.-M.; Samuels, B.; Chatman, J. Medicare’s search for effectiveobesity treatments: Diets are not the answer. Am. Psychol. 2007, 62, 220–233. [CrossRef] [PubMed]
51. Pietiläinen, K.H.; Saarni, S.E.; Kaprio, J.; Rissanen, A. Does dieting make you fat? A twin study. Int. J. Obes.2012, 36, 456–464. [CrossRef] [PubMed]
52. Ifland, J.; Preuss, H.; Marcus, M.; Rourke, K.; Taylor, W.; Burau, K.; Jacobs, W.; Kadish, W.; Manso, G. Refinedfood addiction: A classic substance use disorder. Med. Hypotheses 2009, 72, 518–526. [CrossRef] [PubMed]
53. Russell-Mayhew, S.; Von Ranson, K.M.; Masson, P.C. How does overeaters anonymous help its members? Aqualitative analysis. Eur. Eat. Disord. Rev. 2010, 18, 33–42. [CrossRef] [PubMed]
54. Dawe, S.; Loxton, N.J. The role of impulsivity in the development of substance use and eating disorders.Neurosci. Biobehav. Rev. 2004, 28, 343–351. [CrossRef]
55. Gullo, M.; Dawe, S. Impulsivity and adolescent substance use: Rashly dismissed as “all-bad”? Neurosci.Biobehav. Rev. 2008, 32, 1507–1518. [CrossRef] [PubMed]
56. Schulte, E.M.; Grilo, C.M.; Gearhardt, A.N. Shared and unique mechanisms underlying binge eating disorderand addictive disorders. Clin. Psychol. Rev. 2016, 44, 125–139. [CrossRef] [PubMed]
57. De Wit, H. Impulsivity as a determinant and consequence of drug use: A review of underlying processes.Addict. Biol. 2008, 14, 22–31. [CrossRef] [PubMed]
58. Hershberger, A.R.; Um, M.; Cyders, M.A. The relationship between the UPPS-P impulsive personality traitsand substance use psychotherapy outcomes: A meta-analysis. Drug Alcohol Depend. 2017, 178, 408–416.[CrossRef] [PubMed]
73

Nutrients 2019, 11, 2086
59. Iacono, W.G.; Malone, S.M.; McGue, M. Behavioral disinhibition and the development of early-onsetaddiction: Common and specific influences. Annu. Rev. Clin. Psychol. 2008, 4, 325–348. [CrossRef]
60. Verdejo-García, A.; Lawrence, A.J.; Clark, L. Impulsivity as a vulnerability marker for substance-usedisorders: Review of findings from high-risk research, problem gamblers and genetic association studies.Neurosci. Biobehav. Rev. 2008, 32, 777–810. [CrossRef]
61. Billieux, J.; Gay, P.; Rochat, L.; Khazaal, Y.; Zullino, D.; Van Der Linden, M. Lack of inhibitory controlpredicts cigarette smoking dependence: Evidence from a non-deprived sample of light to moderate smokers.Drug Alcohol Depend. 2010, 112, 164–167. [CrossRef] [PubMed]
62. Butler, G.; Montgomery, A. Impulsivity, risk taking and recreational ‘ecstasy’ (MDMA) use. Drug AlcoholDepend. 2004, 76, 55–62. [CrossRef]
63. García-Marchena, N.; De Guevara-Miranda, D.L.; Pedraz, M.; Araos, P.F.; Rubio, G.; Ruiz, J.J.; Pavón, F.J.;Serrano, A.; Castilla-Ortega, E.; Santín, L.J.; et al. Higher impulsivity as a distinctive trait of severe cocaineaddiction among individuals treated for cocaine or alcohol use disorders. Front. Psychol. 2018, 9, 26.[CrossRef] [PubMed]
64. Lawrence, A.J.; Luty, J.; Bogdan, N.A.; Sahakian, B.J.; Clark, L. Impulsivity and response inhibition in alcoholdependence and problem gambling. Psychopharmacology 2009, 207, 163–172. [CrossRef]
65. Monterosso, J.R.; Aron, A.R.; Cordova, X.; Xu, J.; London, E.D. Deficits in response inhibition associated withchronic methamphetamine abuse. Drug Alcohol Depend. 2005, 79, 273–277. [CrossRef]
66. Verdejo-García, A.J.; Perales, J.C.; Pérez-García, M. Cognitive impulsivity in cocaine and heroin polysubstanceabusers. Addict. Behav. 2007, 32, 950–966. [CrossRef] [PubMed]
67. Noël, X.; Van Der Linden, M.; Brevers, D.; Campanella, S.; Verbanck, P.; Hanak, C.; Kornreich, C.;Verbruggen, F. Separating intentional inhibition of prepotent responses and resistance to proactive interferencein alcohol-dependent individuals. Drug Alcohol Depend. 2013, 128, 200–205. [CrossRef] [PubMed]
68. Emery, R.L.; Levine, M.D. Questionnaire and behavioral task measures of impulsivity are differentiallyassociated with body mass index: A comprehensive meta-analysis. Psychol. Bull. 2017, 143, 868–902.[CrossRef] [PubMed]
69. Guerrieri, R.; Nederkoorn, C.; Jansen, A. The interaction between impulsivity and a varied food environment:Its influence on food intake and overweight. Int. J. Obes. 2008, 32, 708–714. [CrossRef] [PubMed]
70. Jentsch, J.D.; Pennington, Z.T. Reward, interrupted: Inhibitory control and its relevance to addictions.Neuropharmacology 2014, 76, 479–486. [CrossRef] [PubMed]
71. Meule, A. Impulsivity and overeating: A closer look at the subscales of the Barratt impulsiveness scale.Front. Psychol. 2013, 4, 177. [CrossRef]
72. Chalmers, D.K.; Bowyer, C.A.; Olenick, N.L. Problem drinking and obesity: A comparison in personalitypatterns and lifestyle. Int. J. Addict. 1990, 25, 803–817. [CrossRef]
73. Davis, C.; Levitan, R.D.; Carter, J.; Kaplan, A.S.; Reid, C.; Curtis, C.; Patte, K.; Kennedy, J.L. Personality andeating behaviors: A case-control study of binge eating disorder. Int. J. Eat. Disord. 2008, 41, 243–250. [CrossRef]
74. Rydén, A.; Sullivan, M.; Torgerson, J.S.; Karlsson, J.; Lindroos, A.-K.; Taft, C. Severe obesity and personality:A comparative controlled study of personality traits. Int. J. Obes. 2003, 27, 1534–1540. [CrossRef]
75. Batterink, L.; Yokum, S.; Stice, E. Body mass correlates inversely with inhibitory control in response to foodamong adolescent girls: An fMRI study. NeuroImage 2010, 52, 1696–1703. [CrossRef]
76. Davis, C.; Patte, K.; Curtis, C.; Reid, C. Immediate pleasures and future consequences. A neuropsychologicalstudy of binge eating and obesity. Appetite 2010, 54, 208–213. [CrossRef] [PubMed]
77. Nederkoorn, C.; Braet, C.; Van Eijs, Y.; Tanghe, A.; Jansen, A. Why obese children cannot resist food: The roleof impulsivity. Eat. Behav. 2006, 7, 315–322. [CrossRef] [PubMed]
78. Friese, M.; Hofmann, W. Control me or I will control you: Impulses, trait self-control, and the guidance ofbehavior. J. Res. Personal. 2009, 43, 795–805. [CrossRef]
79. Friese, M.; Hofmann, W.; Wänke, M. When impulses take over: Moderated predictive validity of explicit andimplicit attitude measures in predicting food choice and consumption behaviour. Br. J. Soc. Psychol. 2008, 47,397–419. [CrossRef] [PubMed]
80. Hofmann, W.; Friese, M.; Roefs, A. Three ways to resist temptation: The independent contributions ofexecutive attention, inhibitory control, and affect regulation to the impulse control of eating behavior. J. Exp.Soc. Psychol. 2009, 45, 431–435. [CrossRef]
74

Nutrients 2019, 11, 2086
81. Crescioni, A.W.; Ehrlinger, J.; Alquist, J.L.; Conlon, K.E.; Baumeister, R.F.; Schatschneider, C.; Dutton, G.R.High trait self-control predicts positive health behaviors and success in weight loss. J. Health Psychol. 2011,16, 750–759. [CrossRef] [PubMed]
82. De Boer, B.J.; van Hooft, E.A.J.; Bakker, A.B. Stop and start control: A distinction within self-control. Eur. J.Personal. 2011, 25, 349–362. [CrossRef]
83. Gerrits, J.H.; O’Hara, R.E.; Piko, B.F.; Gibbons, F.X.; De Ridder, D.T.D.; Keresztes, N.; Kamble, S.V.; DeWit, J.B.F. Self-control, diet concerns and eater prototypes influence fatty foods consumption of adolescentsin three countries. Health Educ. Res. 2010, 25, 1031–1041. [CrossRef]
84. Jasinska, A.J.; Yasuda, M.; Burant, C.F.; Gregor, N.; Khatri, S.; Sweet, M.; Falk, E.B. Impulsivity and inhibitorycontrol deficits are associated with unhealthy eating in young adults. Appetite 2012, 59, 738–747. [CrossRef]
85. Allan, J.L.; Johnston, M.; Campbell, N. Unintentional eating. What determines goal-incongruent chocolateconsumption? Appetite 2010, 54, 422–425. [CrossRef]
86. Allom, V.; Mullan, B. Individual differences in executive function predict distinct eating behaviours. Appetite2014, 80, 123–130. [CrossRef] [PubMed]
87. Guerrieri, R.; Nederkoorn, C.; Jansen, A. How impulsiveness and variety influence food intake in a sampleof healthy women. Appetite 2007, 48, 119–122. [CrossRef] [PubMed]
88. Churchill, S.; Jessop, D.C. Reflective and non-reflective antecedents of health-related behaviour: Exploringthe relative contributions of impulsivity and implicit self-control to the prediction of dietary behaviour. Br. J.Health Psychol. 2011, 16, 257–272. [CrossRef] [PubMed]
89. Meule, A.; De Zwaan, M.; Müller, A. Attentional and motor impulsivity interactively predict ‘food addiction’in obese individuals. Compr. Psychiatr. 2017, 72, 83–87. [CrossRef] [PubMed]
90. VanderBroek-Stice, L.; Stojek, M.K.; Beach, S.R.H.; Vandellen, M.R.; MacKillop, J. Multidimensionalassessment of impulsivity in relation to obesity and food addiction. Appetite 2017, 112, 59–68. [CrossRef][PubMed]
91. Appelhans, B.M.; Woolf, K.; Pagoto, S.L.; Schneider, K.L.; Whited, M.C.; Liebman, R. Inhibiting food reward:Delay discounting, food reward sensitivity, and palatable food intake in overweight and obese women.Obesity 2011, 19, 2175–2182. [CrossRef] [PubMed]
92. Dissabandara, L.O.; Loxton, N.J.; Dias, S.R.; Dodd, P.R.; Daglish, M.; Stadlin, A. Dependent heroin use andassociated risky behaviour: The role of rash impulsiveness and reward sensitivity. Addict. Behav. 2014, 39,71–76. [CrossRef]
93. Franken, I.H.; Muris, P. Individual differences in reward sensitivity are related to food craving and relativebody weight in healthy women. Appetite 2005, 45, 198–201. [CrossRef]
94. Davis, C.; Patte, K.; Levitan, R.; Reid, C.; Tweed, S.; Curtis, C. From motivation to behaviour: A model ofreward sensitivity, overeating, and food preferences in the risk profile for obesity. Appetite 2007, 48, 12–19.[CrossRef]
95. De Cock, N.; Van Lippevelde, W.; Goossens, L.; De Clercq, B.; Vangeel, J.; Lachat, C.; Beullens, K.; Huybregts, L.;Vervoort, L.; Eggermont, S.; et al. Sensitivity to reward and adolescents’ unhealthy snacking and drinkingbehavior: The role of hedonic eating styles and availability. Int. J. Behav. Nutr. Phys. Act. 2016, 13, 17. [CrossRef]
96. Lawrence, N.S.; Hinton, E.C.; Parkinson, J.A.; Lawrence, A.D. Nucleus accumbens response to food cuespredicts subsequent snack consumption in women and increased body mass index in those with reducedself-control. NeuroImage 2012, 63, 415–422. [CrossRef] [PubMed]
97. Davis, C.; Strachan, S.; Berkson, M. Sensitivity to reward: Implications for overeating and overweight.Appetite 2004, 42, 131–138. [CrossRef] [PubMed]
98. Volkow, N.D.; Fowler, J.S.; Wang, G.-J. The addicted human brain: Insights from imaging studies. J. Clin.Investig. 2003, 111, 1444–1451. [CrossRef] [PubMed]
99. Volkow, N.D.; Wang, G.-J.; Telang, F.; Fowler, J.S.; Thanos, P.K.; Logan, J.; Alexoff, D.; Ding, Y.-S.; Wong, C.;Ma, Y.; et al. Low dopamine striatal D2 receptors are associated with prefrontal metabolism in obese subjects:Possible contributing factors. NeuroImage 2008, 42, 1537–1543. [CrossRef] [PubMed]
100. Wang, G.J.; Volkow, N.D.; Logan, J.; Pappas, N.R.; Wong, C.T.; Zhu, W.; Netusil, N.; Fowler, J.S. Braindopamine and obesity. Lancet 2001, 357, 354–357. [CrossRef]
101. Blum, K.; Braverman, E.R.; Holder, J.M.; Lubar, J.F.; Monastra, V.J.; Miller, D.; Lubar, J.O.; Chen, T.J.;Comings, D.E. The reward deficiency syndrome: A biogenetic model for the diagnosis and treatment ofimpulsive, addictive and compulsive behaviors. J. Psychoact. Drugs 2000, 32, 1–112. [CrossRef]
75

Nutrients 2019, 11, 2086
102. Bowirrat, A.; Oscar-Berman, M. Relationship between dopaminergic neurotransmission, alcoholism, andreward deficiency syndrome. Am. J. Med. Genet. Part B Neuropsychiatr. Genet. 2005, 132, 29–37. [CrossRef]
103. Burger, K.S.; Stice, E. Variability in reward responsivity and obesity: Evidence from brain imaging studies.Curr. Drug Abus. Rev. 2011, 4, 182–189. [CrossRef]
104. Robinson, T. The neural basis of drug craving: An incentive-sensitization theory of addiction. Brain Res. Rev.1993, 18, 247–291. [CrossRef]
105. Robinson, T.E.; Berridge, K.C. Incentive-sensitization and addiction. Addiction 2001, 96, 103–114. [CrossRef]106. Robinson, T.E.; Berridge, K.C. Addiction. Annu. Rev. Psychol. 2003, 54, 25–53. [CrossRef] [PubMed]107. Berridge, K.C. ‘Liking’ and ‘wanting’ food rewards: Brain substrates and roles in eating disorders.
Physiol. Behav. 2009, 97, 537–550. [CrossRef] [PubMed]108. Berridge, K.C.; Ho, C.-Y.; Richard, J.M.; DiFeliceantonio, A.G. The tempted brain eats: Pleasure and desire
circuits in obesity and eating disorders. Brain Res. 2010, 1350, 43–64. [CrossRef] [PubMed]109. Hetherington, M.; Pirie, L.; Nabb, S.; Hetherington, M. Stimulus satiation: Effects of repeated exposure to
foods on pleasantness and intake. Appetite 2002, 38, 19–28. [CrossRef] [PubMed]110. Ersche, K.D.; Jones, P.S.; Williams, G.B.; Turton, A.J.; Robbins, T.W.; Bullmore, E.T. Abnormal brain structure
implicated in stimulant drug addiction. Science 2012, 335, 601–604. [CrossRef] [PubMed]111. Everitt, B.J.; Belin, D.; Economidou, D.; Pelloux, Y.; Dalley, J.W.; Robbins, T.W. Neural mechanisms underlying
the vulnerability to develop compulsive drug-seeking habits and addiction. Philos. Trans. R. Soc. B Biol. Sci.2008, 363, 3125–3135. [CrossRef] [PubMed]
112. Flagel, S.B.; Akil, H.; Robinson, T.E. Individual differences in the attribution of incentive salience toreward-related cues: Implications for addiction. Neuropharmacology 2009, 56, 139–148. [CrossRef]
113. Saunders, B.T.; Robinson, T.E. Individual variation in resisting temptation: Implications for addiction.Neurosci. Biobehav. Rev. 2013, 37, 1955–1975. [CrossRef] [PubMed]
114. Kekic, M.; McClelland, J.; Campbell, I.; Nestler, S.; Rubia, K.; David, A.S.; Schmidt, U. The effects of prefrontalcortex transcranial direct current stimulation (tDCS) on food craving and temporal discounting in womenwith frequent food cravings. Appetite 2014, 78, 55–62. [CrossRef]
115. Weingarten, H.P.; Elston, D. The phenomenology of food cravings. Appetite 1990, 15, 231–246. [CrossRef]116. Pelchat, M.L. Food cravings in young and elderly adults. Appetite 1997, 28, 103–113. [CrossRef] [PubMed]117. Lopez, R.B.; Hofmann, W.; Wagner, D.D.; Kelley, W.M.; Heatherton, T.F. Neural predictors of giving in to
temptation in daily life. Psychol. Sci. 2014, 25, 1337–1344. [CrossRef] [PubMed]118. Cocores, J.A.; Gold, M.S. The Salted Food Addiction Hypothesis may explain overeating and the obesity
epidemic. Med. Hypotheses 2009, 73, 892–899. [CrossRef] [PubMed]119. Corsica, J.A.; Spring, B.J. Carbohydrate craving: A double-blind, placebo controlled test of the self-medication
hypothesis. Eat. Behav. 2008, 9, 447–454. [CrossRef] [PubMed]120. Hill, A.J.; Heaton-Brown, L. The experience of food craving: A prospective investigation in healthy women.
J. Psychosom. Res. 1994, 38, 801–814. [CrossRef]121. Massey, A.; Hill, A.J. Dieting and food craving. A descriptive, quasi-prospective study. Appetite 2012, 58,
781–785. [CrossRef]122. Rozin, P.; Levine, E.; Stoess, C. Chocolate craving and liking. Appetite 1991, 17, 199–212. [CrossRef]123. Cepeda-Benito, A.; Gleaves, D.H.; Williams, T.L.; Erath, S.A. The development and validation of the state
and trait food-cravings questionnaires. Behav. Ther. 2000, 31, 151–173. [CrossRef]124. Hill, A.J.; Weaver, C.F.; Blundell, J.E. Food craving, dietary restraint and mood. Appetite 1991, 17, 187–197.
[CrossRef]125. Nicholls, W.; Hulbert-Williams, L. British english translation of the food craving inventory (FCI-UK). Appetite
2013, 67, 37–43. [CrossRef]126. Nijs, I.M.; Franken, I.H.; Muris, P. The modified trait and state food-cravings questionnaires: Development
and validation of a general index of food craving. Appetite 2007, 49, 38–46. [CrossRef] [PubMed]127. White, M.A.; Whisenhunt, B.L.; Williamson, D.A.; Greenway, F.L.; Netemeyer, R.G. Development and
validation of the food-craving inventory. Obes. Res. 2002, 10, 107–114. [CrossRef] [PubMed]128. Benton, D.; Greenfield, K.; Morgan, M. The development of the attitudes to chocolate questionnaire. Personal.
Individ. Differ. 1998, 24, 513–520. [CrossRef]129. Boswell, R.G.; Kober, H. Food cue reactivity and craving predict eating and weight gain: A meta-analytic
review. Obes. Rev. 2016, 17, 159–177. [CrossRef] [PubMed]
76

Nutrients 2019, 11, 2086
130. Burton, P.; Smit, H.J.; Lightowler, H.J. The influence of restrained and external eating patterns on overeating.Appetite 2007, 49, 191–197. [CrossRef] [PubMed]
131. Dalton, M.; Blundell, J.; Finlayson, G.S. Examination of food reward and energy intake under laboratoryand free-living conditions in a trait binge eating subtype of obesity. Front. Psychol. 2013, 4, 757. [CrossRef][PubMed]
132. Lafay, L.; Mennen, L.; Charles, M.A.; Eschwège, E.; Borys, J.-M. Gender differences in the relation betweenfood cravings and mood in an adult community: Results from the Fleurbaix Laventie Ville Sant study. Int. J.Eat. Disord. 2001, 29, 195–204. [CrossRef]
133. Davis, C.; Curtis, C.; Levitan, R.D.; Carter, J.C.; Kaplan, A.S.; Kennedy, J.L. Evidence that ‘food addiction’ is avalid phenotype of obesity. Appetite 2011, 57, 711–717. [CrossRef]
134. Meule, A. Food cravings in food addiction: Exploring a potential cut-off value of the food cravingsquestionnaire-trait-reduced. Eat. Weight Dis. Stud. Anorex. Bulim. Obes. 2018, 23, 39–43. [CrossRef]
135. Meule, A.; Kübler, A. Food cravings in food addiction: The distinct role of positive reinforcement. Eat. Behav.2012, 13, 252–255. [CrossRef]
136. Mussell, M.P.; Mitchell, J.E.; De Zwaan, M.; Crosby, R.D.; Seim, H.C.; Crow, S.J. Clinical characteristicsassociated with binge eating in obese females: A descriptive study. Int. J. Obes. Relat. Metab. Disord. J. Int.Assoc. Stud. Obes. 1996, 20, 324–331.
137. Ng, L.; Davis, C. Cravings and food consumption in binge eating disorder. Eat. Behav. 2013, 14, 472–475.[CrossRef]
138. Van den Eynde, F.; Koskina, A.; Syrad, H.; Guillaume, S.; Broadbent, H.; Campbell, I.C.; Schmidt, U. Stateand trait food craving in people with bulimic eating disorders. Eat. Behav. 2012, 13, 414–417. [CrossRef][PubMed]
139. Bottlender, M.; Soyka, M. Impact of craving on alcohol relapse during, and 12 months following, outpatienttreatment. Alcohol Alcohol. 2004, 39, 357–361. [CrossRef] [PubMed]
140. Litt, M.D.; Cooney, N.L.; Morse, P. Reactivity to alcohol-related stimuli in the laboratory and in the field:Predictors of craving in treated alcoholics. Addiction 2000, 95, 889–900. [CrossRef] [PubMed]
141. Paliwal, P.; Hyman, S.M.; Sinha, R. Craving predicts time to cocaine relapse: Further validation of the nowand brief versions of the cocaine craving questionnaire. Drug Alcohol Depend. 2008, 93, 252–259. [CrossRef][PubMed]
142. Gendall, K.A.; Sullivan, P.F.; Joyce, P.R.; Fear, J.L.; Bulik, C.M. Psychopathology and personality of youngwomen who experience food cravings. Addict. Behav. 1997, 22, 545–555. [CrossRef]
143. Meule, A.; Lutz, A.; Vögele, C.; Kübler, A. Food cravings discriminate differentially between successful andunsuccessful dieters and non-dieters. Validation of the food cravings questionnaires in German. Appetite2012, 58, 88–97. [CrossRef]
144. Meule, A.; Westenhöfer, J.; Kübler, A. Food cravings mediate the relationship between rigid, but not flexiblecontrol of eating behavior and dieting success. Appetite 2011, 57, 582–584. [CrossRef]
145. Carter, B.L.; Tiffany, S.T. Meta-analysis of cue-reactivity in addiction research. Addiction 1999, 94, 327–340.[CrossRef]
146. Davidson, D.; Tiffany, S.T.; Johnston, W.; Flury, L.; Li, T.-K. Using the cue-availability paradigm to assess cuereactivity. Alcohol. Clin. Exp. Res. 2003, 27, 1251–1256. [CrossRef]
147. Mahler, S.V.; De Wit, H. Cue-Reactors: Individual differences in cue-induced craving after food or smokingabstinence. PLoS ONE 2010, 5, e15475. [CrossRef] [PubMed]
148. Styn, M.A.; Bovbjerg, D.H.; Lipsky, S.; Erblich, J. Cue-induced cigarette and food craving: A common effect?Addict. Behav. 2013, 38, 1840–1843. [CrossRef] [PubMed]
149. Cornell, C.E.; Rodin, J.; Weingarten, H. Stimulus-induced eating when satiated. Physiol. Behav. 1989, 45,695–704. [CrossRef]
150. Nederkoorn, C.; Smulders, F.; Jansen, A. Cephalic phase responses, craving and food intake in normalsubjects. Appetite 2000, 35, 45–55. [CrossRef] [PubMed]
151. Meule, A.; Küppers, C.; Harms, L.; Friederich, H.-C.; Schmidt, U.; Blechert, J.; Brockmeyer, T. Foodcue-induced craving in individuals with bulimia nervosa and binge-eating disorder. PLoS ONE 2018, 13,e0204151. [CrossRef] [PubMed]
152. Karhunen, L.J.; Lappalainen, R.I.; Tammela, L.; Turpeinen, A.K.; Uusitupa, M.I.J. Subjective and physiologicalcephalic phase responses to food in obese binge-eating women. Int. J. Eat. Disord. 1997, 21, 321–328. [CrossRef]
77

Nutrients 2019, 11, 2086
153. Sobik, L.; Hutchison, K.; Craighead, L. Cue-elicited craving for food: A fresh approach to the study of bingeeating. Appetite 2005, 44, 253–261. [CrossRef]
154. Kjelgaard, H.H.; Holstein, B.E.; Due, P.; Brixval, C.S.; Rasmussen, M. Adolescent weight status: Associationswith structural and functional dimensions of social relations. J. Adolesc. Health 2017, 60, 460–468. [CrossRef]
155. Schwimmer, J.B.; Burwinkle, T.M.; Varni, J.W. Health-Related quality of life of severely obese children andadolescents. JAMA 2003, 289, 1813. [CrossRef]
156. Williams, J.; Wake, M.; Hesketh, K.; Maher, E.; Waters, E. Health-Related quality of life of overweight andobese children. JAMA 2005, 293, 70–76. [CrossRef] [PubMed]
157. Griffiths, L.J.; Wolke, D.; Page, A.S.; Horwood, J.P. Obesity and bullying: Different effects for boys and girls.Arch. Dis. Child. 2006, 91, 121–125. [CrossRef] [PubMed]
158. Pearce, M.J.; Boergers, J.; Prinstein, M.J. Adolescent obesity, overt and relational peer victimization, andromantic relationships. Obes. Res. 2002, 10, 386–393. [CrossRef] [PubMed]
159. Hayden-Wade, H.A.; Stein, R.I.; Ghaderi, A.; Saelens, B.E.; Zabinski, M.F.; Wilfley, D.E. Prevalence,characteristics, and correlates of teasing experiences among overweight children vs. non-overweight peers.Obes. Res. 2005, 13, 1381–1392. [CrossRef] [PubMed]
160. Neumark-Sztainer, D.; Falkner, N.; Story, M.; Perry, C.; Hannan, P.J.; Mulert, S. Weight-teasing amongadolescents: Correlations with weight status and disordered eating behaviors. Int. J. Obes. 2002, 26, 123–131.[CrossRef] [PubMed]
161. Puhl, R.; Brownell, K.D. Bias, Discrimination, and Obesity. Obes. Res. 2001, 9, 788–805. [CrossRef] [PubMed]162. Puhl, R.M.; Heuer, C.A. The stigma of obesity: A review and update. Obesity 2009, 17, 941–964. [CrossRef]
[PubMed]163. Puhl, R.M.; Latner, J.D. Stigma, obesity, and the health of the nation’s children. Psychol. Bull. 2007, 133,
557–580. [CrossRef]164. Chen, E.Y.; Brown, M. Obesity stigma in sexual relationships. Obes. Res. 2005, 13, 1393–1397. [CrossRef]165. Chao, A.M.; Shaw, J.A.; Pearl, R.L.; Alamuddin, N.; Hopkins, C.M.; Bakizada, Z.M.; Wadden, T.A.
Prevalence and psychosocial correlates of food addiction in persons with obesity seeking weight reduction.Compr. Psychiatr. 2017, 73, 97–104. [CrossRef]
166. Blomquist, K.K.; Ansell, E.B.; White, M.A.; Masheb, R.M.; Grilo, C.M. Interpersonal problems and developmentaltrajectories of binge eating disorder. Compr. Psychiatr. 2012, 53, 1088–1095. [CrossRef] [PubMed]
167. Lo Coco, G.; Gullo, S.; Salerno, L.; Iacoponelli, R. The association among interpersonal problems, bingebehaviors, and self-esteem, in the assessment of obese individuals. Compr. Psychiatr. 2011, 52, 164–170.[CrossRef] [PubMed]
168. Jia, H.; Lubetkin, E.I. Trends in quality-adjusted life-years lost contributed by smoking and obesity. Am. J.Prev. Med. 2010, 38, 138–144. [CrossRef] [PubMed]
169. Bray, G.A. Medical consequences of obesity. J. Clin. Endocrinol. Metab. 2004, 89, 2583–2589. [CrossRef][PubMed]
170. Carpenter, K.M.; Hasin, D.S.; Allison, D.B.; Faith, M.S. Relationships between obesity and DSM-IV majordepressive disorder, suicide ideation, and suicide attempts: Results from a general population study. Am. J.Public Health 2000, 90, 251–257. [PubMed]
171. Haslam, D.W.; James, W.P.T. Obesity. Lancet 2005, 366, 1197–1209. [CrossRef]172. Kahn, S.E.; Hull, R.L.; Utzschneider, K.M. Mechanisms linking obesity to insulin resistance and type 2
diabetes. Nature 2006, 444, 840–846. [CrossRef] [PubMed]173. Lopresti, A.L.; Drummond, P.D. Obesity and psychiatric disorders: Commonalities in dysregulated biological
pathways and their implications for treatment. Prog. Neuro Psychopharmacol. Biol. Psychiatr. 2013, 45, 92–99.[CrossRef]
174. Luppino, F.S.; de Wit, L.M.; Bouvy, P.F.; Stijnen, T.; Cuijpers, P.; Penninx, B.W.J.H.; Zitman, F.G. Overweight,obesity, and depression: A systematic review and meta-analysis of longitudinal studies. Arch. Gen. Psychiatr.2010, 67, 220–229. [CrossRef]
175. Mannan, M.; Mamun, A.; Doi, S.; Clavarino, A. Prospective associations between depression and obesity foradolescent males and females—A systematic review and meta-analysis of longitudinal studies. PLoS ONE2016, 11, 0157240. [CrossRef]
176. Mokdad, A.H.; Ford, E.S.; Bowman, B.A.; Dietz, W.H.; Vinicor, F.; Bales, V.S.; Marks, J.S. Prevalence of obesity,diabetes, and obesity-related health risk factors, 2001. JAMA 2003, 289, 76–79. [CrossRef] [PubMed]
78

Nutrients 2019, 11, 2086
177. Van Gaal, L.F.; Mertens, I.L.; De Block, C.E. Mechanisms linking obesity with cardiovascular disease. Nature2006, 444, 875–880. [CrossRef] [PubMed]
178. Elkins, G.; Whitfield, P.; Marcus, J.; Symmonds, R.; Rodriguez, J.; Cook, T. Noncompliance with behavioralrecommendations following bariatric surgery. Obes. Surg. 2005, 15, 546–551. [CrossRef]
179. Toussi, R.; Fujioka, K.; Coleman, K.J. Pre- and postsurgery behavioral compliance, patient health, andpostbariatric surgical weight loss. Obesity 2009, 17, 996–1002. [CrossRef] [PubMed]
180. Colantuoni, C.; Schwenker, J.; McCarthy, J.; Rada, P.; Ladenheim, B.; Cadet, J.-L.; Schwartz, G.J.; Moran, T.H.;Hoebel, B.G. Excessive sugar intake alters binding to dopamine and mu-opioid receptors in the brain.NeuroReport 2001, 12, 3549–3552. [CrossRef]
181. Rada, P.; Avena, N.; Hoebel, B. Daily bingeing on sugar repeatedly releases dopamine in the accumbens shell.Neuroscience 2005, 134, 737–744. [CrossRef] [PubMed]
182. Harrison, D.M. Oral sucrose for pain management in infants: Myths and misconceptions. J. Neonatal Nurs.2008, 14, 39–46. [CrossRef]
183. King, J.M. Patterns of sugar consumption in early infancy. Community Dent. Oral Epidemiol. 1978, 6, 47–52.[CrossRef]
184. Rossow, I.; Kjaernes, U.; Holst, D. Patterns of sugar consumption in early childhood. Community Dent. OralEpidemiol. 1990, 18, 12–16. [CrossRef]
185. Slater, R.; Cornelissen, L.; Fabrizi, L.; Patten, D.; Yoxen, J.; Worley, A.; Boyd, S.; Meek, J.; Fitzgerald, M. Oralsucrose as an analgesic drug for procedural pain in newborn infants: A randomised controlled trial. Lancet2010, 376, 1225–1232. [CrossRef]
186. Nielsen, S.J.; Popkin, B.M. Patterns and trends in food portion sizes, 1977–1998. JAMA 2003, 289, 450–453.[CrossRef] [PubMed]
187. Wideman, C.H.; Nadzam, G.R.; Murphy, H.M. Implications of an animal model of sugar addiction, withdrawaland relapse for human health. Nutr. Neurosci. 2005, 8, 269–276. [CrossRef] [PubMed]
188. Avena, N.M.; Rada, P.; Hoebel, B.G. Evidence for sugar addiction: Behavioral and neurochemical effects ofintermittent, excessive sugar intake. Neurosci. Biobehav. Rev. 2008, 32, 20–39. [CrossRef] [PubMed]
189. Galic, M.A.; Persinger, M.A. Voluminous sucrose consumption in female rats: Increased “nippiness” duringperiods of sucrose removal and possible oestrus periodicity. Psychol. Rep. 2002, 90, 58–60. [CrossRef][PubMed]
190. Avena, N.M.; Bocarsly, M.E.; Rada, P.; Kim, A.; Hoebel, B.G. After daily bingeing on a sucrose solution, fooddeprivation induces anxiety and accumbens dopamine/acetylcholine imbalance. Physiol. Behav. 2008, 94,309–315. [CrossRef] [PubMed]
191. Hetherington, M.M.; MacDiarmid, J.I. “Chocolate addiction”: A preliminary study of its description and itsrelationship to problem eating. Appetite 1993, 21, 233–246. [CrossRef] [PubMed]
192. Carnell, S.; Gibson, C.; Benson, L.; Ochner, C.N.; Geliebter, A. Neuroimaging and obesity: Current knowledgeand future directions. Obes. Rev. 2012, 13, 43–56. [CrossRef]
193. Parvaz, M.A.; Alia-Klein, N.; Woicik, P.A.; Volkow, N.D.; Goldstein, R.Z. Neuroimaging for drug addictionand related behaviors. Rev. Neurosci. 2011, 22, 609–624. [CrossRef] [PubMed]
194. Zhang, Y.; von Deneen, K.M.; Tian, J.; Gold, M.S.; Liu, Y. Food addiction and neuroimaging. Curr. Pharm.Des. 2011, 17, 1149–1157. [CrossRef] [PubMed]
195. Goldstein, R.Z.; Volkow, N.D. Drug addiction and its underlying neurobiological basis: Neuroimagingevidence for the involvement of the frontal cortex. Am. J. Psychiatr. 2002, 159, 1642–1652. [CrossRef]
196. Goldstein, R.Z.; Volkow, N.D. Dysfunction of the prefrontal cortex in addiction: Neuroimaging findings andclinical implications. Nat. Rev. Neurosci. 2011, 12, 652–669. [CrossRef] [PubMed]
197. Koob, G.F.; Volkow, N.D. Neurobiology of addiction: A neurocircuitry analysis. Lancet Psychiatr. 2016, 3,760–773. [CrossRef]
198. Volkow, N.D.; Wang, G.-J.; Fowler, J.S.; Telang, F. Overlapping neuronal circuits in addiction and obesity:Evidence of systems pathology. Philos. Trans. R. Soc. B Biol. Sci. 2008, 363, 3191–3200. [CrossRef] [PubMed]
199. Volkow, N.D.; Wang, G.-J.; Tomasi, D.; Baler, R.D. The addictive dimensionality of obesity. Biol. Psychiatr.2013, 73, 811–818. [CrossRef] [PubMed]
200. Pierce, R.C.; Kumaresan, V. The mesolimbic dopamine system: The final common pathway for the reinforcingeffect of drugs of abuse? Neurosci. Biobehav. Rev. 2006, 30, 215–238. [CrossRef] [PubMed]
79

Nutrients 2019, 11, 2086
201. Hernández, L.; Hoebel, B.G. Food reward and cocaine increase extracellular dopamine in the nucleusaccumbens as measured by microdialysis. Life Sci. 1988, 42, 1705–1712. [CrossRef]
202. Radhakishun, F.S.; Van Ree, J.M.; Westerink, B.H. Scheduled eating increases dopamine release in the nucleusaccumbens of food-deprived rats as assessed with on-line brain dialysis. Neurosci. Lett. 1988, 85, 351–356.[CrossRef]
203. Yoshida, M.; Yokoo, H.; Mizoguchi, K.; Kawahara, H.; Tsuda, A.; Nishikawa, T.; Tanaka, M. Eating anddrinking cause increased dopamine release in the nucleus accumbens and ventral tegmental area in the rat:Measurement by in vivo microdialysis. Neurosci. Lett. 1992, 139, 73–76. [CrossRef]
204. Martel, P.; Fantino, M. Influence of the amount of food ingested on mesolimbic dopaminergic system activity:A microdialysis study. Pharmacol. Biochem. Behav. 1996, 55, 297–302. [CrossRef]
205. Martel, P.; Fantino, M. Mesolimbic dopaminergic system activity as a function of food reward: A microdialysisstudy. Pharmacol. Biochem. Behav. 1996, 53, 221–226. [CrossRef]
206. Carelli, R.M.; Ijames, S.G.; Crumling, A.J. Evidence that separate neural circuits in the nucleus accumbensencode cocaine versus “natural” (water and food) reward. J. Neurosci. 2000, 20, 4255–4266. [CrossRef] [PubMed]
207. Caine, S.B.; Koob, G.F. Effects of mesolimbic dopamine depletion on responding maintained by cocaine andfood. J. Exp. Anal. Behav. 1994, 61, 213–221. [CrossRef] [PubMed]
208. Rothemund, Y.; Preuschhof, C.; Bohner, G.; Bauknecht, H.-C.; Klingebiel, R.; Flor, H.; Klapp, B.F. Differentialactivation of the dorsal striatum by high-calorie visual food stimuli in obese individuals. NeuroImage 2007,37, 410–421. [CrossRef]
209. Small, D.M.; Jones-Gotman, M.; Dagher, A. Feeding-induced dopamine release in dorsal striatum correlateswith meal pleasantness ratings in healthy human volunteers. NeuroImage 2003, 19, 1709–1715. [CrossRef]
210. Volkow, N.D.; Wang, G.-J.; Fowler, J.S.; Logan, J.; Jayne, M.; Franceschi, D.; Wong, C.; Gatley, S.J.; Gifford, A.N.;Ding, Y.-S.; et al. Nonhedonic food motivation in humans involves dopamine in the dorsal striatum andmethylphenidate amplifies this effect. Synapse 2002, 44, 175–180. [CrossRef] [PubMed]
211. Volkow, N.D.; Wang, G.-J.; Maynard, L.; Jayne, M.; Fowler, J.S.; Zhu, W.; Logan, J.; Gatley, S.J.; Ding, Y.-S.;Wong, C.; et al. Brain dopamine is associated with eating behaviors in humans. Int. J. Eat. Disord. 2003, 33,136–142. [CrossRef] [PubMed]
212. Stoeckel, L.E.; Weller, R.E.; Cook, E.W.; Twieg, D.B.; Knowlton, R.C.; Cox, J.E.; Iii, E.W.C. Widespreadreward-system activation in obese women in response to pictures of high-calorie foods. NeuroImage 2008, 41,636–647. [CrossRef]
213. Stice, E.; Spoor, S.; Bohon, C.; Small, D.M. Relation between obesity and blunted striatal response to food ismoderated by TaqIA A1 allele. Science 2008, 322, 449–452. [CrossRef]
214. Wang, G.-J.; Volkow, N.D.; Felder, C.; Fowler, J.S.; Levy, A.V.; Pappas, N.R.; Wong, C.T.; Zhu, W.; Netusil, N.Enhanced resting activity of the oral somatosensory cortex in obese subjects. NeuroReport 2002, 13, 1151–1155.[CrossRef] [PubMed]
215. Bello, N.T.; Lucas, L.R.; Hajnal, A. Repeated sucrose access influences dopamine D2 receptor density in thestriatum. NeuroReport 2002, 13, 1575–1578. [CrossRef] [PubMed]
216. Johnson, P.M.; Kenny, P.J. Dopamine D2 receptors in addiction-like reward dysfunction and compulsiveeating in obese rats. Nat. Neurosci. 2010, 13, 635–641. [CrossRef] [PubMed]
217. Volkow, N.D.; Wang, G.-J.; Fowler, J.S.; Tomasi, D.; Telang, F.; Baler, R. Addiction: Decreased rewardsensitivity and increased expectation sensitivity conspire to overwhelm the brain’s control circuit. BioEssays2010, 32, 748–755. [CrossRef] [PubMed]
218. Fehr, C.; Yakushev, I.; Hohmann, N.; Buchholz, H.G.; Landvogt, C.; Deckers, H.; Eberhardt, A.; Smolka, M.N.;Scheurich, A.; Dielentheis, T.; et al. Association of low striatal dopamine D 2 receptor availability withnicotine dependence similar to that seen with other drugs of abuse. Am. J. Psychiatr. 2008, 165, 507–514.[CrossRef] [PubMed]
219. Heinz, A. Correlation Between Dopamine D2 Receptors in the Ventral Striatum and Central Processing ofAlcohol Cues and Craving. Am. J. Psychiatr. 2004, 161, 1783–1789. [CrossRef] [PubMed]
220. Volkow, N.D.; Fowler, J.S.; Wang, G.-J.; Hitzemann, R.; Logan, J.; Schlyer, D.J.; Dewey, S.L.; Wolf, A.P.Decreased dopamine D2 receptor availability is associated with reduced frontal metabolism in cocaineabusers. Synapse 1993, 14, 169–177. [CrossRef]
80

Nutrients 2019, 11, 2086
221. Volkow, N.D.; Wang, G.-J.; Fowler, J.S.; Logan, J.; Hitzemann, R.; Ding, Y.-S.; Pappas, N.; Shea, C.; Piscani, K.Decreases in dopamine receptors but not in dopamine transporters in alcoholics. Alcohol. Clin. Exp. Res.1996, 20, 1594–1598. [CrossRef] [PubMed]
222. Volkow, N.D.; Chang, L.; Wang, G.-J.; Fowler, J.S.; Ding, Y.-S.; Sedler, M.; Logan, J.; Franceschi, D.; Gatley, J.;Hitzemann, R.; et al. Low level of brain dopamine D2 receptors in methamphetamine abusers: Associationwith metabolism in the orbitofrontal cortex. Am. J. Psychiatr. 2001, 158, 2015–2021. [CrossRef]
223. Thanos, P.K.; Volkow, N.D.; Freimuth, P.; Umegaki, H.; Ikari, H.; Roth, G.; Ingram, D.K.; Hitzemann, R.Overexpression of dopamine D2 receptors reduces alcohol. J. Neurochem. 2001, 78, 1094–1103. [CrossRef]
224. Volkow, N.D.; Wang, G.-J.; Begleiter, H.; Porjesz, B.; Fowler, J.S.; Telang, F.; Wong, C.; Ma, Y.; Logan, J.;Goldstein, R.; et al. High levels of dopamine D2 receptors in unaffected members of alcoholic families.Arch. Gen. Psychiatr. 2006, 63, 999–1008. [CrossRef]
225. Reinholz, J.; Skopp, O.; Breitenstein, C.; Bohr, I.; Winterhoff, H.; Knecht, S. Compensatory weight gain dueto dopaminergic hypofunction: New evidence and own incidental observations. Nutr. Metab. 2008, 5, 35.[CrossRef]
226. Wang, G.; Volkow, N.D.; Thanos, P.K.; Fowler, J.S. Similarity between obesity and drug addiction as assessedby neurofunctional imaging: A concept review. J. Addict. Dis. 2004, 23, 39–53. [CrossRef] [PubMed]
227. Hardman, C.A.; Herbert, V.M.; Brunstrom, J.M.; Munafò, M.R.; Rogers, P.J.; Brunstrom, J. Dopamine and foodreward: Effects of acute tyrosine/phenylalanine depletion on appetite. Physiol. Behav. 2012, 105, 1202–1207.[CrossRef] [PubMed]
228. Geiger, B.M.; Haburcak, M.; Avena, N.M.; Moyer, M.C.; Hoebel, B.G.; Pothos, E.N. Deficits of mesolimbicdopamine neurotransmission in rat dietary obesity. Neuroscience 2009, 159, 1193–1199. [CrossRef] [PubMed]
229. Baptista, T.; Parada, M.; Hernández, L. Long term administration of some antipsychotic drugs increasesbody weight and feeding in rats. Are D2 dopamine receptors involved? Pharmacol. Biochem. Behav. 1987, 27,399–405. [CrossRef]
230. Clifton, P.G.; Rusk, I.N.; Cooper, S.J. Effects of dopamine D1 and dopamine D2 antagonists on the free feedingand drinking patterns of rats. Behav. Neurosci. 1991, 105, 272–281. [CrossRef]
231. Scislowski, P.; Tozzo, E.; Zhang, Y.; Phaneuf, S.; Prevelige, R.; Cincotta, A. Biochemical mechanismsresponsible for the attenuation of diabetic and obese conditions in ob/ob mice treated with dopaminergicagonists. Int. J. Obes. 1999, 23, 425–431. [CrossRef]
232. Goudie, A.J.; Cooper, G.D.; Halford, J.C.G. Antipsychotic-induced weight gain. Diabetes Obes. Metab. 2005, 7,478–487. [CrossRef]
233. Cincotta, A.H.; Meier, A.H. Bromocriptine (Ergoset) reduces body weight and improves glucose tolerance inobese subjects. Diabetes Care 1996, 19, 667–670. [CrossRef]
234. Manning, P.J.; Grattan, D.; Merriman, T.; Manning, T.; Williams, S.; Sutherland, W. Pharmaceuticalinterventions for weight-loss maintenance: No effect from cabergoline. Int. J. Obes. 2018, 42, 1871–1879.[CrossRef]
235. Gibson, C.D.; Karmally, W.; McMahon, D.J.; Wardlaw, S.L.; Korner, J. Randomized pilot study of cabergoline,a dopamine receptor agonist: Effects on body weight and glucose tolerance in obese adults. Diabetes Obes.Metab. 2012, 14, 335–340. [CrossRef]
236. Frank, G.K.W.; Shott, M.E.; Hagman, J.O.; Schiel, M.A.; DeGuzman, M.C.; Rossi, B. The Partial Dopamine D2Receptor Agonist Aripiprazole is Associated With Weight Gain in Adolescent Anorexia Nervosa. Int. J. Eat.Disord. 2017, 50, 447–450. [CrossRef] [PubMed]
237. Steele, K.E.; Prokopowicz, G.P.; Schweitzer, M.A.; Magunsuon, T.H.; Lidor, A.O.; Kuwabawa, H.; Kuma, A.;Brasic, J.; Wong, D.F. Alterations of central dopamine receptors before and after gastric bypass surgery.Obes. Surg. 2010, 20, 369–374. [CrossRef] [PubMed]
238. Van Der Zwaal, E.M.; De Weijer, B.A.; Van De Giessen, E.M.; Janssen, I.; Berends, F.J.; Van De Laar, A.;Ackermans, M.T.; Fliers, E.; La Fleur, S.E.; Booij, J.; et al. Striatal dopamine D2/3 receptor availability increasesafter long-term bariatric surgery-induced weight loss. Eur. Neuropsychopharmacol. 2016, 26, 1190–1200.[CrossRef] [PubMed]
239. Ochner, C.N.; Kwok, Y.; Conceição, E.; Pantazatos, S.P.; Puma, L.M.; Carnell, S.; Teixeira, J.; Hirsch, J.;Geliebter, A. Selective reduction in neural responses to high calorie foods following gastric bypass surgery.Ann. Surg. 2011, 253, 502–507. [CrossRef] [PubMed]
81

Nutrients 2019, 11, 2086
240. Ghahremani, D.G.; Lee, B.; Robertson, C.L.; Tabibnia, G.; Morgan, A.T.; De Shetler, N.; Brown, A.K.;Monterosso, J.R.; Aron, A.A.; Mandelkern, M.A.; et al. Striatal dopamine D2/D3 receptors mediate responseinhibition and related activity in frontostriatal neural circuitry in humans. J. Neurosci. 2012, 32, 7316–7324.[CrossRef] [PubMed]
241. Lavagnino, L.; Arnone, D.; Cao, B.; Soares, J.C.; Selvaraj, S. Inhibitory control in obesity and bingeeating disorder: A systematic review and meta-analysis of neurocognitive and neuroimaging studies.Neurosci. Biobehav. Rev. 2016, 68, 714–726. [CrossRef] [PubMed]
242. Volkow, N.D.; Wang, G.-J.; Telang, F.; Fowler, J.S.; Goldstein, R.Z.; Alia-Klein, N.; Logan, J.; Wong, C.;Thanos, P.K.; Ma, Y.; et al. Inverse association between BMI and prefrontal metabolic activity in healthyadults. Obesity 2009, 17, 60–65. [CrossRef] [PubMed]
243. Le, D.S.N.T.; Pannacciulli, N.; Chen, K.; Del Parigi, A.; Salbe, A.D.; Reiman, E.M.; Krakoff, J. Less activationof the left dorsolateral prefrontal cortex in response to a meal: A feature of obesity. Am. J. Clin. Nutr. 2006,84, 725–731. [CrossRef]
244. Le, D.S.N.; Pannacciulli, N.; Chen, K.; Salbe, A.D.; Hill, O.J.; Wing, R.R.; Reiman, E.M.; Krakoff, J. Lessactivation in the left dorsolateral prefrontal cortex in the reanalysis of the response to a meal in obese than inlean women and its association with successful weight loss. Am. J. Clin. Nutr. 2007, 86, 573–579. [CrossRef]
245. Gautier, J.F.; Chen, K.; Salbe, A.D.; Bandy, D.; Pratley, R.E.; Heiman, M.; Ravussin, E.; Reiman, E.M.;Tataranni, P.A. Differential brain responses to satiation in obese and lean men. Diabetes 2000, 49, 838–846.[CrossRef]
246. Del Parigi, A.; Chen, K.; Salbe, A.D.; Hill, J.O.; Wing, R.R.; Reiman, E.M.; Tataranni, P.A. Successful dietershave increased neural activity in cortical areas involved in the control of behavior. Int. J. Obes. 2007, 31,440–448. [CrossRef] [PubMed]
247. Hollmann, M.; Hellrung, L.; Pleger, B.; Schlögl, H.; Kabisch, S.; Stumvoll, M.; Villringer, A.; Horstmann, A.Neural correlates of the volitional regulation of the desire for food. Int. J. Obes. 2012, 36, 648–655. [CrossRef][PubMed]
248. McCaffery, J.M.; Haley, A.P.; Sweet, L.H.; Phelan, S.; Raynor, H.A.; Del Parigi, A.; Cohen, R.; Wing, R.R.Differential functional magnetic resonance imaging response to food pictures in successful weight-lossmaintainers relative to normal-weight and obese controls. Am. J. Clin. Nutr. 2009, 90, 928–934. [CrossRef][PubMed]
249. Weygandt, M.; Mai, K.; Dommes, E.; Leupelt, V.; Hackmack, K.; Kahnt, T.; Rothemund, Y.; Spranger, J.;Haynes, J.-D. The role of neural impulse control mechanisms for dietary success in obesity. NeuroImage 2013,83, 669–678. [CrossRef] [PubMed]
250. Nederkoorn, C.; Houben, K.; Hofmann, W.; Roefs, A.; Jansen, A. Control yourself or just eat what you like?Weight gain over a year is predicted by an interactive effect of response inhibition and implicit preference forsnack foods. Health Psychol. 2010, 29, 389–393. [CrossRef] [PubMed]
251. Cohen, J.; Yates, K.F.; Duong, M.; Convit, A. Obesity, orbitofrontal structure and function are associated withfood choice: A cross-sectional study. BMJ Open 2011, 1, e000175. [CrossRef] [PubMed]
252. Maayan, L.; Hoogendoorn, C.; Sweat, V.; Convit, A. Disinhibited eating in obese adolescents is associatedwith orbitofrontal volume reductions and executive dysfunction. Obesity 2011, 19, 1382–1387. [CrossRef][PubMed]
253. Masouleh, S.K.; Arelin, K.; Horstmann, A.; Lampe, L.; Kipping, J.A.; Luck, T.; Riedel-Heller, S.G.;Schroeter, M.L.; Stumvoll, M.; Villringer, A.; et al. Higher body mass index in older adults is associatedwith lower gray matter volume: Implications for memory performance. Neurobiol. Aging 2016, 40, 1–10.[CrossRef]
254. Pannacciulli, N.; Del Parigi, A.; Chen, K.; Le, D.S.N.; Reiman, E.M.; Tataranni, P.A. Brain abnormalities inhuman obesity: A voxel-based morphometric study. NeuroImage 2006, 31, 1419–1425. [CrossRef]
255. Taki, Y.; Kinomura, S.; Sato, K.; Inoue, K.; Goto, R.; Okada, K.; Uchida, S.; Kawashima, R.; Fukuda, H.Relationship between body mass index and gray matter volume in 1428 healthy individuals. Obesity 2008,16, 119–124. [CrossRef]
256. Walther, K.; Birdsill, A.C.; Glisky, E.L.; Ryan, L. Structural brain differences and cognitive functioning relatedto body mass index in older females. Hum. Brain Mapp. 2010, 31, 1052–1064. [CrossRef] [PubMed]
257. Yao, L.; Li, W.; Dai, Z.; Dong, C. Eating behavior associated with gray matter volume alternations: A voxelbased morphometry study. Appetite 2016, 96, 572–579. [CrossRef] [PubMed]
82

Nutrients 2019, 11, 2086
258. Yokum, S.; Stice, E. Cognitive regulation of food craving: Effects of three cognitive reappraisal strategies onneural response to palatable foods. Int. J. Obes. 2013, 37, 1565–1570. [CrossRef] [PubMed]
259. Bechara, A. Decision making, impulse control and loss of willpower to resist drugs: A neurocognitiveperspective. Nat. Neurosci. 2005, 8, 1458–1463. [CrossRef] [PubMed]
260. Davis, C.; Levitan, R.D.; Muglia, P.; Bewell, C.; Kennedy, J.L. Decision-making deficits and overeating: A riskmodel for obesity. Obes. Res. 2004, 12, 929–935. [CrossRef] [PubMed]
261. Elias, M.F.; Elias, P.K.; Sullivan, L.M.; Wolf, P.A.; D’Agostino, R.B. Obesity, diabetes and cognitive deficit:The Framingham heart study. Neurobiol. Aging 2005, 26, 11–16. [CrossRef] [PubMed]
262. Gunstad, J.; Paul, R.H.; Cohen, R.A.; Tate, D.F.; Spitznagel, M.B.; Gordon, E. Elevated body mass indexis associated with executive dysfunction in otherwise healthy adults. Compr. Psychiatr. 2007, 48, 57–61.[CrossRef] [PubMed]
263. Lowe, C.J.; Reichelt, A.C.; Hall, P.A. The prefrontal cortex and obesity: A health neuroscience perspective.Trends Cogn. Sci. 2019, 23, 349–361. [CrossRef] [PubMed]
264. Blum, K.; Braverman, E.R.; Wood, R.C.; Gill, J.; Li, C.; Chen, T.J.; Taub, M.; Montgomery, A.R.; Sheridan, P.J.;Cull, J.G. Increased prevalence of the Taq I A1allele of the dopamine receptor gene (DRD2) in obesity withcomorbid substance use disorder: A preliminary report. Pharmacogenetics 1996, 6, 297–305. [CrossRef][PubMed]
265. Comings, D.E.; Muhleman, D.; Ahn, C.; Gysin, R.; Flanagan, S.D. The dopamine D2 receptor gene: A geneticrisk factor in substance abuse. Drug Alcohol Depend. 1994, 34, 175–180. [CrossRef]
266. Han, D.H.; Yoon, S.J.; Sung, Y.H.; Lee, Y.S.; Kee, B.S.; Lyoo, I.K.; Renshaw, P.F.; Cho, S.C. A preliminary study:Novelty seeking, frontal executive function, and dopamine receptor (D2) TaqI A gene polymorphism inpatients with methamphetamine dependence. Compr. Psychiatr. 2008, 49, 387–392. [CrossRef] [PubMed]
267. Jönsson, E.G.; Nöthen, M.M.; Grünhage, F.; Farde, L.; Nakashima, Y.; Propping, P.; Sedvall, G.C.; Nöthen, M.;Jönsson, E. Polymorphisms in the dopamine D2 receptor gene and their relationships to striatal dopaminereceptor density of healthy volunteers. Mol. Psychiatr. 1999, 4, 290–296. [CrossRef]
268. Noble, E. Addiction and its reward process through polymorphisms of the D2 dopamine receptor gene: Areview. Eur. Psychiatr. 2000, 15, 79–89. [CrossRef]
269. Spitz, M.R.; Detry, M.A.; Pillow, P.; Hu, Y.; Amos, C.I.; Hong, W.K.; Wu, X. Variant alleles of the D2 dopaminereceptor gene and obesity. Nutr. Res. 2000, 20, 371–380. [CrossRef]
270. Eisenberg, D.T.; MacKillop, J.; Modi, M.; Beauchemin, J.; Dang, D.; Lisman, S.A.; Lum, J.K.; Wilson, D.S.Examining impulsivity as an endophenotype using a behavioral approach: A DRD2 TaqI A and DRD4 48-bpVNTR association study. Behav. Brain Funct. 2007, 3, 2. [CrossRef] [PubMed]
271. Kirsch, P.; Reuter, M.; Mier, D.; Lonsdorf, T.; Stark, R.; Gallhofer, B.; Vaitl, D.; Hennig, J. Imaginggene–substance interactions: The effect of the DRD2 TaqIA polymorphism and the dopamine agonistbromocriptine on the brain activation during the anticipation of reward. Neurosci. Lett. 2006, 405, 196–201.[CrossRef]
272. Klein, T.A.; Neumann, J.; Reuter, M.; Hennig, J.; Von Cramon, D.Y.; Ullsperger, M. Genetically determineddifferences in learning from errors. Science 2007, 318, 1642–1645. [CrossRef]
273. Montag, C.; Weber, B.; Jentgens, E.; Elger, C.; Reuter, M. An epistasis effect of functional variants on theBDNF and DRD2 genes modulates gray matter volume of the anterior cingulate cortex in healthy humans.Neuropsychology 2010, 48, 1016–1021. [CrossRef]
274. Gasquoine, P.G. Localization of function in anterior cingulate cortex: From psychosurgery to functionalneuroimaging. Neurosci. Biobehav. Rev. 2013, 37, 340–348. [CrossRef]
275. Peoples, L.L. Will, anterior cingulate cortex, and addiction. Science 2002, 296, 1623–1624. [CrossRef]276. Brody, A.L.; Mandelkern, M.A.; Olmstead, R.E.; Jou, J.; Tiongson, E.; Allen, V.; Scheibal, D.; London, E.D.;
Monterosso, J.R.; Tiffany, S.T.; et al. Neural substrates of resisting craving during cigarette cue exposure.Biol. Psychiatr. 2007, 62, 642–651. [CrossRef] [PubMed]
277. Pursey, K.M.; Stanwell, P.; Gearhardt, A.N.; Collins, C.E.; Burrows, T.L. The prevalence of food addiction asassessed by the Yale food addiction scale: A systematic review. Nutrients 2014, 6, 4552–4590. [CrossRef][PubMed]
278. Carter, J.C.; Van Wijk, M.; Rowsell, M. Symptoms of ‘food addiction’ in binge eating disorder using the Yalefood addiction scale version 2.0. Appetite 2019, 133, 362–369. [CrossRef] [PubMed]
83

Nutrients 2019, 11, 2086
279. De Vries, S.-K.; Meule, A. Food addiction and bulimia nervosa: New data based on the Yale food addictionscale 2.0. Eur. Eat. Disord. Rev. 2016, 24, 518–522. [CrossRef] [PubMed]
280. Hall, P.A.; Fong, G.T.; Epp, L.J.; Elias, L.J. Executive function moderates the intention-behavior link forphysical activity and dietary behavior. Psychol. Health 2008, 23, 309–326. [CrossRef] [PubMed]
281. Hall, P.A. Executive control resources and frequency of fatty food consumption: Findings from an age-stratifiedcommunity sample. Health Psychol. 2012, 31, 235–241. [CrossRef] [PubMed]
282. Alcorn, J.L.; Marks, K.R.; Stoops, W.W.; Rush, C.R.; Lile, J.A. Attentional bias to cannabis cues in cannabisusers but not cocaine users. Addict. Behav. 2019, 88, 129–136. [CrossRef] [PubMed]
283. Bradley, B.; Field, M.; Mogg, K.; De Houwer, J. Attentional and evaluative biases for smoking cues in nicotinedependence: Component processes of biases in visual orienting. Behav. Pharmacol. 2004, 15, 29–36. [CrossRef]
284. Field, M.; Eastwood, B.; Bradley, B.P.; Mogg, K. Selective processing of cannabis cues in regular cannabisusers. Drug Alcohol Depend. 2006, 85, 75–82. [CrossRef]
285. Qureshi, A.; Monk, R.L.; Pennington, C.R.; Wilcockson, T.D.; Heim, D. Alcohol-related attentional bias in agaze contingency task: Comparing appetitive and non-appetitive cues. Addict. Behav. 2019, 90, 312–317.[CrossRef]
286. Field, M.; Cox, W. Attentional bias in addictive behaviors: A review of its development, causes, andconsequences. Drug Alcohol Depend. 2008, 97, 1–20. [CrossRef] [PubMed]
287. Franken, I.H. Drug craving and addiction: Integrating psychological and neuropsychopharmacologicalapproaches. Prog. Neuro Psychopharmacol. Biol. Psychiatr. 2003, 27, 563–579. [CrossRef]
288. Detandt, S.; Verbanck, P.; Bazan, A.; Quertemont, E. Smoking addiction: The shift from head to hands:Approach bias towards smoking-related cues in low-dependent versus dependent smokers. J. Psychopharmacol.2017, 31, 819–829. [CrossRef] [PubMed]
289. Weckler, H.; Kong, G.; Larsen, H.; Cousijn, J.; Wiers, R.W.; Krishnan-Sarin, S. Impulsivity and approachtendencies towards cigarette stimuli: Implications for cigarette smoking and cessation behaviors amongyouth. Exp. Clin. Psychopharmacol. 2017, 25, 363–372. [CrossRef] [PubMed]
290. Watson, P.; De Wit, S.; Hommel, B.; Wiers, R.W. Motivational mechanisms and outcome expectanciesunderlying the approach bias toward addictive substances. Front. Psychol. 2012, 3, 440. [CrossRef] [PubMed]
291. Beraha, E.M.; Cousijn, J.; Hermanides, E.; Goudriaan, A.E.; Wiers, R.W. Implicit Associations and ExplicitExpectancies toward Cannabis in Heavy Cannabis Users and Controls. Front. Psychol. 2013, 4, 1–9. [CrossRef]
292. De Houwer, J.; Custers, R.; De Clercq, A. Do smokers have a negative implicit attitude toward smoking?Cogn. Emot. 2006, 20, 1274–1284. [CrossRef]
293. Houben, K.; Wiers, R.W. Are drinkers implicitly positive about drinking alcohol? Personalizing thealcohol-IAT to reduce negative extrapersonal contamination. Alcohol Alcohol. 2007, 42, 301–307. [CrossRef]
294. McCarthy, D.M.; Thompsen, D.M. Implicit and explicit measures of alcohol and smoking cognitions. Psychol.Addict. Behav. 2006, 20, 436–444. [CrossRef]
295. Brignell, C.; Griffiths, T.; Bradley, B.P.; Mogg, K. Attentional and approach biases for pictorial food cues.Influence of external eating. Appetite 2009, 52, 299–306. [CrossRef]
296. Deluchi, M.; Costa, F.S.; Friedman, R.; Gonçalves, R.; Bizarro, L. Attentional bias to unhealthy food inindividuals with severe obesity and binge eating. Appetite 2017, 108, 471–476. [CrossRef] [PubMed]
297. Hardman, C.A.; Scott, J.; Field, M.; Jones, A. To eat or not to eat. The effects of expectancy on reactivity tofood cues. Appetite 2014, 76, 153–160. [CrossRef] [PubMed]
298. Popien, A.; Frayn, M.; Von Ranson, K.M.; Sears, C.R. Eye gaze tracking reveals heightened attention to foodin adults with binge eating when viewing images of real-world scenes. Appetite 2015, 91, 233–240. [CrossRef][PubMed]
299. Field, M.; Werthmann, J.; Franken, I.; Hofmann, W.; Hogarth, L.; Roefs, A. The role of attentional bias inobesity and addiction. Health Psychol. 2016, 35, 767–780. [CrossRef] [PubMed]
300. Stojek, M.; Shank, L.M.; Vannucci, A.; Bongiorno, D.M.; Nelson, E.E.; Waters, A.J.; Engel, S.G.; Boutelle, K.N.;Pine, D.S.; Yanovski, J.A.; et al. A systematic review of attentional biases in disorders involving binge eating.Appetite 2018, 123, 367–389. [CrossRef]
301. Castellanos, E.H.; Charboneau, E.; Dietrich, M.S.; Park, S.; Bradley, B.P.; Mogg, K.; Cowan, R.L.; Bradley, B.Obese adults have visual attention bias for food cue images: Evidence for altered reward system function.Int. J. Obes. 2009, 33, 1063–1073. [CrossRef]
84

Nutrients 2019, 11, 2086
302. Iceta, S.; Benoit, J.; Cristini, P.; Lambert-Porcheron, S.; Segrestin, B.; Laville, M.; Poulet, E.; Disse, E. Attentionalbias and response inhibition in severe obesity with food disinhibition: A study of P300 and N200 event-relatedpotential. Int. J. Obes. 2019, 1. [CrossRef]
303. Nijs, I.M.; Muris, P.; Euser, A.S.; Franken, I.H. Differences in attention to food and food intake betweenoverweight/obese and normal-weight females under conditions of hunger and satiety. Appetite 2010, 54,243–254. [CrossRef]
304. Werthmann, J.; Roefs, A.; Nederkoorn, C.; Mogg, K.; Bradley, B.P.; Jansen, A. Can (not) take my eyes off it:Attention bias for food in overweight participants. Health Psychol. 2011, 30, 561–569. [CrossRef]
305. Hardman, C.A.; Rogers, P.J.; Etchells, K.A.; Houstoun, K.V.E.; Munafò, M.R. The effects of food-relatedattentional bias training on appetite and food intake. Appetite 2013, 71, 295–300. [CrossRef]
306. Kemps, E.; Tiggemann, M.; Orr, J.; Grear, J. Attentional retraining can reduce chocolate consumption. J. Exp.Psychol. Appl. 2013, 20, 94–102. [CrossRef] [PubMed]
307. Schmitz, F.; Svaldi, J. Effects of bias modification training in binge eating disorder. Behav. Ther. 2017, 48,707–717. [CrossRef] [PubMed]
308. Werthmann, J.; Field, M.; Roefs, A.; Nederkoorn, C.; Jansen, A. Attention bias for chocolate increaseschocolate consumption—An attention bias modification study. J. Behav. Ther. Exp. Psychiatr. 2014, 45,136–143. [CrossRef] [PubMed]
309. Zhang, S.; Cui, L.; Sun, X.; Zhang, Q. The effect of attentional bias modification on eating behavior amongwomen craving high-calorie food. Appetite 2018, 129, 135–142. [CrossRef] [PubMed]
310. Smith, E.; Treffiletti, A.; Bailey, E.P.; Moustafa, A. The effect of attentional bias modification training on foodintake in overweight and obese women. J. Health Psychol. 2018, 1–11. [CrossRef] [PubMed]
311. Kakoschke, N.L.; Kemps, E.; Tiggemann, M. Attentional bias modification encourages healthy eating.Eat. Behav. 2014, 15, 120–124. [CrossRef] [PubMed]
312. Kemps, E.; Tiggemann, M.; Elford, J. Sustained effects of attentional re-training on chocolate consumption.J. Behav. Ther. Exp. Psychiatr. 2015, 49, 94–100. [CrossRef] [PubMed]
313. Veenstra, E.M.; De Jong, P.J. Restrained eaters show enhanced automatic approach tendencies towards food.Appetite 2010, 55, 30–36. [CrossRef]
314. Becker, D.; Jostmann, N.B.; Wiers, R.W.; Holland, R.W. Approach avoidance training in the eating domain:Testing the effectiveness across three single session studies. Appetite 2015, 85, 58–65. [CrossRef]
315. Brockmeyer, T.; Hahn, C.; Reetz, C.; Schmidt, U.; Friederich, H.-C. Approach bias and cue reactivity towardsfood in people with high versus low levels of food craving. Appetite 2015, 95, 197–202. [CrossRef]
316. Havermans, R.C.; Giesen, J.C.; Houben, K.; Jansen, A. Weight, gender, and snack appeal. Eat. Behav. 2011, 12,126–130. [CrossRef] [PubMed]
317. Mehl, N.; Mueller-Wieland, L.; Mathar, D.; Horstmann, A. Retraining automatic action tendencies in obesity.Physiol. Behav. 2018, 192, 50–58. [CrossRef] [PubMed]
318. Mogg, K.; Bradley, B.P.; O’Neill, B.; Bani, M.; Merlo-Pich, E.; Koch, A.; Bullmore, E.T.; Nathan, P.J. Effect ofdopamine D3 receptor antagonism on approach responses to food cues in overweight and obese individuals.Behav. Pharmacol. 2012, 23, 603–608. [CrossRef] [PubMed]
319. Kemps, E.; Tiggemann, M.; Martin, R.; Elliott, M. Implicit approach–avoidance associations for craved foodcues. J. Exp. Psychol. Appl. 2013, 19, 30–38. [CrossRef] [PubMed]
320. Schumacher, S.E.; Kemps, E.; Tiggemann, M. Bias modification training can alter approach bias and chocolateconsumption. Appetite 2016, 96, 219–224. [CrossRef] [PubMed]
321. Brockmeyer, T.; Hahn, C.; Reetz, C.; Schmidt, U.; Friederich, H.-C. Approach Bias Modification in FoodCraving-A Proof-of-Concept Study. Eur. Eat. Disord. Rev. 2015, 23, 352–360. [CrossRef] [PubMed]
322. De Houwer, J. A conceptual and theoretical analysis of evaluative conditioning. Span. J. Psychol. 2007, 10,230–241. [CrossRef] [PubMed]
323. De Houwer, J.; Thomas, S.; Baeyens, F. Association learning of likes and dislikes: A review of 25 years ofresearch on human evaluative conditioning. Psychol. Bull. 2001, 127, 853–869. [CrossRef] [PubMed]
324. Dwyer, D.M.; Jarratt, F.; Dick, K. Evaluative conditioning with foods as CSs and body shapes as USs: Noevidence for sex differences, extinction, or overshadowing. Cogn. Emot. 2007, 21, 281–299. [CrossRef]
325. Hollands, G.J.; Prestwich, A.; Marteau, T.M. Using aversive images to enhance healthy food choices andimplicit attitudes: An experimental test of evaluative conditioning. Health Psychol. 2011, 30, 195–203.[CrossRef]
85

Nutrients 2019, 11, 2086
326. Lascelles, K.R.; Field, A.P.; Davey, G.C. Using foods as CSs and body shapes as UCSs: A putative role forassociative learning in the development of eating disorders. Behav. Ther. 2003, 34, 213–235. [CrossRef]
327. Lebens, H.; Roefs, A.; Martijn, C.; Houben, K.; Nederkoorn, C.; Jansen, A. Making implicit measures ofassociations with snack foods more negative through evaluative conditioning. Eat. Behav. 2011, 12, 249–253.[CrossRef] [PubMed]
328. Wang, Y.; Wang, G.; Zhang, D.; Wang, L.; Cui, X.; Zhu, J.; Fang, Y. Learning to dislike chocolate: Conditioningnegative attitudes toward chocolate and its effect on chocolate consumption. Front. Psychol. 2017, 8, 1–7.[CrossRef] [PubMed]
329. Walsh, E.M.; Kiviniemi, M.T. Changing how I feel about the food: Experimentally manipulated affectiveassociations with fruits change fruit choice behaviors. J. Behav. Med. 2014, 37, 322–331. [CrossRef] [PubMed]
330. Shaw, J.A.; Forman, E.M.; Espel, H.M.; Butryn, M.L.; Herbert, J.D.; Lowe, M.R.; Nederkoorn, C. Canevaluative conditioning decrease soft drink consumption? Appetite 2016, 105, 60–70. [CrossRef]
331. Houben, K.; Havermans, R.C.; Wiers, R.W. Learning to dislike alcohol: Conditioning negative implicitattitudes toward alcohol and its effect on drinking behavior. Psychopharmacology 2010, 211, 79–86. [CrossRef][PubMed]
332. Zerhouni, O.; Houben, K.; El Methni, J.; Rutte, N.; Werkman, E.; Wiers, R.W. I didn’t feel like drinking, but Iguess why: Evaluative conditioning changes on explicit attitudes toward alcohol and healthy foods dependson contingency awareness. Learn. Motiv. 2019, 66, 1–12. [CrossRef]
333. Hofmann, W.; De Houwer, J.; Perugini, M.; Baeyens, F.; Crombez, G. Evaluative conditioning in humans: Ameta-analysis. Psychol. Bull. 2010, 136, 390–421. [CrossRef]
334. Benedict, T.; Richter, J.; Gast, A. The influence of misinformation manipulations on evaluative conditioning.Acta Psychol. 2019, 194, 28–36. [CrossRef]
335. Aron, A.R.; Robbins, T.W.; Poldrack, R.A. Inhibition and the right inferior frontal cortex. Trends Cogn. Sci.2004, 8, 170–177. [CrossRef]
336. Aron, A.R.; Robbins, T.W.; Poldrack, R.A. Inhibition and the right inferior frontal cortex: One decade on.Trends Cogn. Sci. 2014, 18, 177–185. [CrossRef] [PubMed]
337. Logan, G.D. Executive control of thought and action. Acta Psychol. 1985, 60, 193–210. [CrossRef]338. Logan, G.D.; Cowan, W.B. On the ability to inhibit thought and action: A theory of an act of control.
Psychol. Rev. 1984, 91, 295–327. [CrossRef]339. Logan, G.D.; Schachar, R.J.; Tannock, R. Impulsivity and inhibitory control. Psychol. Sci. 1997, 8, 60–64. [CrossRef]340. Miyake, A.; Friedman, N.P.; Emerson, M.J.; Witzki, A.H.; Howerter, A.; Wager, T.D. The unity and diversity
of executive functions and their contributions to complex “frontal lobe” tasks: A latent variable analysis.Cogn. Psychol. 2000, 41, 49–100. [CrossRef] [PubMed]
341. Nigg, J.T.; Wong, M.M.; Martel, M.M.; Jester, J.M.; Puttler, L.I.; Glass, J.M.; Adams, K.M.; Fitzgerald, H.E.;Zucker, R.A. Poor response inhibition as a predictor of problem drinking and illicit drug use in adolescents atrisk for alcoholism and other substance use disorders. J. Am. Acad. Child Adolesc. Psychiatr. 2006, 45, 468–475.[CrossRef]
342. Krishnan-Sarin, S.; Reynolds, B.; Duhig, A.M.; Smith, A.; Liss, T.; McFetridge, A.; Cavallo, D.A.; Carroll, K.M.;Potenza, M.N. Behavioral impulsivity predicts treatment outcome in a smoking cessation program foradolescents. Drug Alcohol Depend. 2007, 88, 79–82. [CrossRef]
343. Czapla, M.; Simon, J.J.; Richter, B.; Kluge, M.; Friederich, H.C.; Herpertz, S.; Loeber, S. The impact of cognitiveimpairment and impulsivity on relapse of alcohol-dependent patients: Implications for psychotherapeutictreatment. Addict. Biol. 2016, 21, 873–884. [CrossRef]
344. Houben, K.; Wiers, R.W. Response inhibition moderates the relationship between implicit associations anddrinking behavior. Alcohol. Clin. Exp. Res. 2009, 33, 626–633. [CrossRef]
345. Nederkoorn, C.; Smulders, F.T.; Havermans, R.C.; Roefs, A.; Jansen, A. Impulsivity in obese women. Appetite2006, 47, 253–256. [CrossRef]
346. Price, M.; Lee, M.; Higgs, S. Food-specific response inhibition, dietary restraint and snack intake in lean andoverweight/obese adults: A moderated-mediation model. Int. J. Obes. 2016, 40, 877. [CrossRef] [PubMed]
347. Houben, K. Overcoming the urge to splurge: Influencing eating behavior by manipulating inhibitory control.J. Behav. Ther. Exp. Psychiatr. 2011, 42, 384–388. [CrossRef] [PubMed]
348. Nederkoorn, C.; Dassen, F.C.; Franken, L.; Resch, C.; Houben, K. Impulsivity and overeating in children inthe absence and presence of hunger. Appetite 2015, 93, 57–61. [CrossRef] [PubMed]
86

Nutrients 2019, 11, 2086
349. Houben, K.; Nederkoorn, C.; Jansen, A. Eating on impulse: The relation between overweight and food-specificinhibitory control. Obesity 2014, 22, e6–e8. [CrossRef] [PubMed]
350. Mühlberg, C.; Mathar, D.; Villringer, A.; Horstmann, A.; Neumann, J. Stopping at the sight of food—Howgender and obesity impact on response inhibition. Appetite 2016, 107, 663–676. [CrossRef] [PubMed]
351. Meule, A.; Lutz, A.P.; Vögele, C.; Kübler, A. Impulsive reactions to food-cues predict subsequent food craving.Eat. Behav. 2014, 15, 99–105. [CrossRef] [PubMed]
352. Allan, J.L.; Johnston, M.; Campbell, N. Missed by an inch or a mile? Predicting the size of intention–behaviourgap from measures of executive control. Psychol. Health 2011, 26, 635–650. [CrossRef]
353. Rosval, L.; Steiger, H.; Bruce, K.; Israël, M.; Richardson, J.; Aubut, M. Impulsivity in women with eating disorders:Problem of response inhibition, planning, or attention? Int. J. Eat. Disord. 2006, 39, 590–593. [CrossRef]
354. Bowley, C.; Faricy, C.; Hegarty, B.; Johnstone, S.J.; Smith, J.L.; Kelly, P.J.; Rushby, J.A. The effects of inhibitorycontrol training on alcohol consumption, implicit alcohol-related cognitions and brain electrical activity.Int. J. Psychophysiol. 2013, 89, 342–348. [CrossRef]
355. Di Lemma, L.C.G.; Field, M. Cue avoidance training and inhibitory control training for the reductionof alcohol consumption: A comparison of effectiveness and investigation of their mechanisms of action.Psychopharmacology 2017, 234, 2489–2498. [CrossRef]
356. Houben, K.; Havermans, R.C.; Nederkoorn, C.; Jansen, A. Beer à no-go: Learning to stop respondingto alcohol cues reduces alcohol intake via reduced affective associations rather than increased responseinhibition. Addiction 2012, 107, 1280–1287. [CrossRef] [PubMed]
357. Houben, K.; Nederkoorn, C.; Wiers, R.W.; Jansen, A. Resisting temptation: Decreasing alcohol-related affectand drinking behaviour by training response inhibition. Drug Alcohol Depend. 2011, 116, 132–136. [CrossRef][PubMed]
358. Kilwein, T.M.; Bernhardt, K.A.; Stryker, M.L.; Looby, A. Decreased alcohol consumption after pairingalcohol-related cues with an inhibitory response. J. Subst. Use 2017, 23, 154–161. [CrossRef]
359. Verbruggen, F.; Adams, R.; Chambers, C.D. Proactive motor control reduces monetary risk taking in gambling.Psychol. Sci. 2012, 23, 805–815. [CrossRef] [PubMed]
360. Verbruggen, F.; Adams, R.C.; Van’t Wout, F.; Stevens, T.; McLaren, I.P.L.; Chambers, C.D. Are the effects ofresponse inhibition on gambling long-lasting? PLoS ONE 2013, 7, e70155. [CrossRef] [PubMed]
361. Adams, R.C.; Lawrence, N.S.; Verbruggen, F.; Chambers, C.D. Training response inhibition to reduce foodconsumption: Mechanisms, stimulus specificity and appropriate training protocols. Appetite 2017, 109, 11–23.[CrossRef] [PubMed]
362. Houben, K.; Jansen, A. Training inhibitory control. A recipe for resisting sweet temptations. Appetite 2011,56, 345–349. [CrossRef]
363. Houben, K.; Jansen, A. Chocolate equals stop. Chocolate-specific inhibition training reduces chocolate intakeand go associations with chocolate. Appetite 2015, 87, 318–323. [CrossRef]
364. Lawrence, N.S.; Verbruggen, F.; Morrison, S.; Adams, R.C.; Chambers, C.D. Stopping to food pictures reducesfood intake: Effects of cue specificity, control conditions and individual differences. Appetite 2015, 85, 91–103.[CrossRef]
365. Oomen, D.; Grol, M.; Spronk, D.; Booth, C.; Fox, E. Beating uncontrolled eating: Training inhibitory controlto reduce food intake and food cue sensitivity. Appetite 2018, 131, 73–83. [CrossRef]
366. Camp, B.; Lawrence, N.S. Giving pork the chop: Response inhibition training to reduce meat intake. Appetite2019, 141, 104315. [CrossRef] [PubMed]
367. Chen, Z.; Holland, R.W.; Quandt, J.; Dijksterhuis, A.; Veling, H. When mere action versus inaction leads torobust preference change. J. Personal. Soc. Psychol. 2019. [CrossRef] [PubMed]
368. Porter, L.; Bailey-Jones, C.; Priudokaite, G.; Allen, S.; Wood, K.; Stiles, K.; Lawrence, N.S. From cookies tocarrots; the effect of inhibitory control training on children’s snack selections. Appetite 2018, 124, 111–123.[CrossRef] [PubMed]
369. Van Koningsbruggen, G.M.; Veling, H.; Stroebe, W.; Aarts, H. Comparing two psychological interventions inreducing impulsive processes of eating behaviour: Effects on self-selected portion size. Br. J. Health Psychol.2013, 19, 767–782. [CrossRef] [PubMed]
370. Veling, H.; Aarts, H.; Stroebe, W. Using stop signals to reduce impulsive choices for palatable unhealthyfoods. Br. J. Health Psychol. 2013, 18, 354–368. [CrossRef] [PubMed]
87

Nutrients 2019, 11, 2086
371. Veling, H.; Aarts, H.; Stroebe, W. Stop signals decrease choices for palatable foods through decreased foodevaluation. Front. Psychol. 2013, 4, 875. [CrossRef] [PubMed]
372. Gish, M.Y. Addiction to food: How go/no-go tasks affect appetite. Biomed. Health Sci. Res. 2015, 6, 221–231.[CrossRef]
373. Veling, H.; van Koningsbruggen, G.M.; Aarts, H.; Stroebe, W. Targeting impulsive processes of eatingbehavior via the internet. Effects on body weight. Appetite 2014, 78, 102–109. [CrossRef]
374. Allom, V.; Mullan, B.; Hagger, M. Does inhibitory control training improve health behaviour? A meta-analysis.Health Psychol. Rev. 2015, 10, 1–38. [CrossRef]
375. Jones, A.; Di Lemma, L.C.; Robinson, E.; Christiansen, P.; Nolan, S.; Tudur-Smith, C.; Field, M. Inhibitorycontrol training for appetitive behaviour change: A meta-analytic investigation of mechanisms of action andmoderators of effectiveness. Appetite 2016, 97, 16–28. [CrossRef]
376. Lawrence, N.S.; O’Sullivan, J.; Parslow, D.; Javaid, M.; Adams, R.C.; Chambers, C.D.; Kos, K.; Verbruggen, F.Training response inhibition to food is associated with weight loss and reduced energy intake. Appetite 2015,95, 17–28. [CrossRef] [PubMed]
377. Kakoschke, N.L.; Kemps, E.; Tiggemann, M. The effect of combined avoidance and control training onimplicit food evaluation and choice. J. Behav. Ther. Exp. Psychiatr. 2017, 55, 99–105. [CrossRef] [PubMed]
378. Schakel, L.; Veldhuijzen, D.S.; Van Middendorp, H.; Van Dessel, P.; De Houwer, J.; Bidarra, R.; Evers, A.W.M.The effects of a gamified approach avoidance training and verbal suggestions on food outcomes. PLoS ONE2018, 13, e0201309. [CrossRef] [PubMed]
379. Chen, Z.; Veling, H.; Dijksterhuis, A.; Holland, R.W. Do impulsive individuals benefit more from foodgo/no-go training? Testing the role of inhibition capacity in the no-go devaluation effect. Appetite 2018, 124,99–110. [CrossRef] [PubMed]
380. McLaren, I.P.L.; Verbruggen, F. Association and inhibition. In The Wiley Blackwell Handbook on the CognitiveNeuroscience of Learning; Murphy, R.A., Honey, R.C., Eds.; John Wiley and Sons: Chichester, UK, 2016.
381. Veling, H.; Holland, R.W.; Van Knippenberg, A. When approach motivation and behavioral inhibition collide:Behavior regulation through stimulus devaluation. J. Exp. Soc. Psychol. 2008, 44, 1013–1019. [CrossRef]
382. Verbruggen, F.; Best, M.; Bowditch, W.A.; Stevens, T.; McLaren, I.P. The inhibitory control reflex.Neuropsychology 2014, 65, 263–278. [CrossRef] [PubMed]
383. Alonso-Alonso, M. Translating tDCS into the field of obesity: Mechanism-driven approaches. Front. Hum.Neurosci. 2013, 7, 512.
384. Feil, J.; Zangen, A. Brain stimulation in the study and treatment of addiction. Neurosci. Biobehav. Rev. 2010,34, 559–574. [CrossRef] [PubMed]
385. Hall, P.A.; Vincent, C.M.; Burhan, A.M. Non-invasive brain stimulation for food cravings, consumption, anddisorders of eating: A review of methods, findings and controversies. Appetite 2018, 124, 78–88. [CrossRef]
386. Lowe, C.J.; Vincent, C.; Hall, P.A. Effects of noninvasive brain stimulation on food cravings and consumption:A meta-analytic review. Psychosom. Med. 2017, 79, 2–13. [CrossRef]
387. Nardone, R.; Bergmann, J.; Christova, M.; Lochner, P.; Tezzon, F.; Golaszewski, S.; Trinka, E.; Brigo, F.Non-invasive brain stimulation in the functional evaluation of alcohol effects and in the treatment of alcoholcraving: A review. Neurosci. Res. 2012, 74, 169–176. [CrossRef] [PubMed]
388. Song, S.; Zilverstand, A.; Gui, W.; Li, H.J.; Zhou, X. Effects of single-session versus multi-session non-invasivebrain stimulation on craving and consumption in individuals with drug addiction, eating disorders orobesity: A meta-analysis. Brain Stimul. 2018, 12, 606–618. [CrossRef] [PubMed]
389. Maizey, L.; Allen, C.P.; Dervinis, M.; Verbruggen, F.; Varnava, A.; Kozlov, M.; Adams, R.C.; Stokes, M.;Klemen, J.; Bungert, A.; et al. Comparative incidence rates of mild adverse effects to transcranial magneticstimulation. Clin. Neurophysiol. 2013, 124, 536–544. [CrossRef] [PubMed]
390. Matsumoto, H.; Ugawa, Y. Adverse effects of tDCS and tACS: A review. Clin. Neurophysiol. Pract. 2017, 2,19–25. [CrossRef] [PubMed]
391. Pascual-Leone, A.; Houser, C.; Reese, K.; Shotland, L.; Grafman, J.; Sato, S.; Valls-Sole, J.; Brasil-Neto, J.;Wassermann, E.; Cohen, L.; et al. Safety of rapid-rate transcranial magnetic stimulation in normal volunteers.Electroencephalogr. Clin. Neurophysiol. Potentials Sect. 1993, 89, 120–130. [CrossRef]
392. Poreisz, C.; Boros, K.; Antal, A.; Paulus, W. Safety aspects of transcranial direct current stimulation concerninghealthy subjects and patients. Brain Res. Bull. 2007, 72, 208–214. [CrossRef] [PubMed]
88
Nutrients 2019, 11, 2086
393. Rossi, S.; Hallett, M.; Rossini, P.M.; Pascual-Leone, A. Safety, ethical considerations, and application guidelinesfor the use of transcranial magnetic stimulation in clinical practice and research. Clin. Neurophysiol. 2009,120, 2008–2039. [CrossRef] [PubMed]
394. Taylor, R.; Gálvez, V.; Loo, C. Transcranial magnetic stimulation (TMS) safety: A practical guide forpsychiatrists. Australas. Psychiatr. 2018, 26, 189–192. [CrossRef]
395. Fitzgerald, P.; Fountain, S.; Daskalakis, Z. A comprehensive review of the effects of rTMS on motor corticalexcitability and inhibition. Clin. Neurophysiol. 2006, 117, 2584–2596. [CrossRef]
396. Amiaz, R.; Levy, D.; Vainiger, D.; Grunhaus, L.; Zangen, A. Repeated high-frequency transcranial magneticstimulation over the dorsolateral prefrontal cortex reduces cigarette craving and consumption. Addiction2009, 104, 653–660. [CrossRef]
397. Bolloni, C.; Panella, R.; Pedetti, M.; Frascella, A.G.; Gambelunghe, C.; Piccoli, T.; Maniaci, G.; Brancato, A.;Cannizzaro, C.; Diana, M. Bilateral transcranial magnetic stimulation of the prefrontal cortex reduces cocaineintake: A pilot study. Front. Psychol. 2016, 7, 101. [CrossRef]
398. Mishra, B.R.; Praharaj, S.K.; Katshu, M.Z.U.H.; Sarkar, S.; Nizamie, S.H. Comparison of anticraving efficacy ofright and left repetitive transcranial magnetic stimulation in alcohol dependence: A randomized double-blindstudy. J. Neuropsychiatry Clin. Neurosci. 2015, 27, 54. [CrossRef] [PubMed]
399. Su, H.; Zhong, N.; Gan, H.; Wang, J.; Han, H.; Chen, T.; Li, X.; Ruan, X.; Zhu, Y.; Jiang, H.; et al. High frequencyrepetitive transcranial magnetic stimulation of the left dorsolateral prefrontal cortex for methamphetamineuse disorders: A randomised clinical trial. Drug Alcohol Depend. 2017, 175, 84–91. [CrossRef] [PubMed]
400. Terraneo, A.; Leggio, L.; Saladini, M.; Ermani, M.; Bonci, A.; Gallimberti, L.; Information, P.E.K.F.C.Transcranial magnetic stimulation of dorsolateral prefrontal cortex reduces cocaine use: A pilot study.Eur. Neuropsychopharmacol. 2016, 26, 37–44. [CrossRef] [PubMed]
401. Beeli, G.; Casutt, G.; Baumgartner, T.; Jäncke, L. Modulating presence and impulsiveness by externalstimulation of the brain. Behav. Brain Funct. 2008, 4, 33. [CrossRef] [PubMed]
402. Garavan, H.; Hester, R.; Murphy, K.; Fassbender, C.; Kelly, C. Individual differences in the functionalneuroanatomy of inhibitory control. Brain Res. 2006, 1105, 130–142. [CrossRef] [PubMed]
403. Oldrati, V.; Patricelli, J.; Colombo, B.; Antonietti, A. The role of dorsolateral prefrontal cortex in inhibitionmechanism: A study on cognitive reflection test and similar tasks through neuromodulation. Neuropsychology2016, 91, 499–508. [CrossRef] [PubMed]
404. Zheng, D.; Oka, T.; Bokura, H.; Yamaguchi, S. The key locus of common response inhibition network forno-go and stop signals. J. Cogn. Neurosci. 2008, 20, 1434–1442. [CrossRef] [PubMed]
405. Diana, M. The dopamine hypothesis of drug addiction and its potential therapeutic value. Front. Psychol.2011, 2, 64. [CrossRef] [PubMed]
406. Strafella, A.P.; Paus, T.; Barrett, J.; Dagher, A. Repetitive Transcranial Magnetic Stimulation of the HumanPrefrontal Cortex Induces Dopamine Release in the Caudate Nucleus. J. Neurosci. 2001, 21, RC157. [CrossRef][PubMed]
407. Batista, E.K.; Klauss, J.; Fregni, F.; Nitsche, M.A.; Nakamura-Palacios, E.M. A Randomized Placebo-ControlledTrial of Targeted Prefrontal Cortex Modulation with Bilateral tDCS in Patients with Crack-Cocaine Dependence.Int. J. Neuropsychopharmacol. 2015, 18, 066. [CrossRef] [PubMed]
408. Boggio, P.S.; Liguori, P.; Sultani, N.; Rezende, L.; Fecteau, S.; Fregni, F. Cumulative priming effects of corticalstimulation on smoking cue-induced craving. Neurosci. Lett. 2009, 463, 82–86. [CrossRef] [PubMed]
409. Boggio, P.S.; Sultani, N.; Fecteau, S.; Merabet, L.; Mecca, T.; Pascual-Leone, A.; Basaglia, A.; Fregni, F.Prefrontal cortex modulation using transcranial DC stimulation reduces alcohol craving: A double-blind,sham-controlled study. Drug Alcohol Depend. 2008, 92, 55–60. [CrossRef] [PubMed]
410. Boggio, P.S.; Zaghi, S.; Villani, A.B.; Fecteau, S.; Pascual-Leone, A.; Fregni, F. Modulation of risk-takingin marijuana users by transcranial direct current stimulation (tDCS) of the dorsolateral prefrontal cortex(DLPFC). Drug Alcohol Depend. 2010, 112, 220–225. [CrossRef] [PubMed]
411. Fecteau, S.; Agosta, S.; Hone-Blanchet, A.; Fregni, F.; Boggio, P.; Ciraulo, D.; Pascual-Leone, A. Modulation ofsmoking and decision-making behaviors with transcranial direct current stimulation in tobacco smokers: Apreliminary study. Drug Alcohol Depend. 2014, 140, 78–84. [CrossRef] [PubMed]
412. Klauss, J.; Anders, Q.S.; Felippe, L.V.; Nitsche, M.A.; Nakamura-Palacios, E.M. Multiple sessions oftranscranial direct current stimulation (tDCS) reduced craving and relapses for alcohol use: A randomizedplacebo-controlled trial in alcohol use disorder. Front. Pharmacol. 2018, 9, 716. [CrossRef] [PubMed]
89

Nutrients 2019, 11, 2086
413. Antal, A.; Terney, D.; Poreisz, C.; Paulus, W. Towards unravelling task-related modulations of neuroplasticchanges induced in the human motor cortex. Eur. J. Neurosci. 2007, 26, 2687–2691. [CrossRef] [PubMed]
414. Liebetanz, D.; Nitsche, M.A.; Tergau, F.; Paulus, W. Pharmacological approach to the mechanisms oftranscranial DC-stimulation-induced after-effects of human motor cortex excitability. Brain 2002, 125,2238–2247. [CrossRef] [PubMed]
415. Nitsche, M.A.; Paulus, W. Excitability changes induced in the human motor cortex by weak transcranialdirect current stimulation. J. Physiol. 2000, 527, 633–639. [CrossRef]
416. Nitsche, M.; Schauenburg, A.; Lang, N.; Liebetanz, D.; Exner, C.; Paulus, W.; Tergau, F. Facilitation of implicitmotor learning by weak transcranial direct current stimulation of the primary motor cortex in the human.J. Cogn. Neurosci. 2003, 15, 619–626. [CrossRef]
417. Nitsche, M.A.; Seeber, A.; Frommann, K.; Klein, C.C.; Rochford, C.; Nitsche, M.S.; Fricke, K.; Liebetanz, D.;Lang, N.; Antal, A.; et al. Modulating parameters of excitability during and after transcranial direct currentstimulation of the human motor cortex. J. Physiol. 2005, 568, 291–303. [CrossRef] [PubMed]
418. Priori, A. Brain polarization in humans: A reappraisal of an old tool for prolonged non-invasive modulationof brain excitability. Clin. Neurophysiol. 2003, 114, 589–595. [CrossRef]
419. Nitsche, M.A.; Paulus, W. Sustained excitability elevations induced by transcranial DC motor cortexstimulation in humans. Neurology 2001, 57, 1899–1901. [CrossRef]
420. Gandiga, P.C.; Hummel, F.C.; Cohen, L.G. Transcranial DC stimulation (tDCS): A tool for double-blindsham-controlled clinical studies in brain stimulation. Clin. Neurophysiol. 2006, 117, 845–850. [CrossRef] [PubMed]
421. Nitsche, M.A.; Cohen, L.G.; Wassermann, E.M.; Priori, A.; Lang, N.; Antal, A.; Paulus, W.; Hummel, F.;Boggio, P.S.; Fregni, F.; et al. Transcranial direct current stimulation: State of the art 2008. Brain Stimul. 2008,1, 206–223. [CrossRef] [PubMed]
422. Stagg, C.J.; Nitsche, M.A. Physiological basis of transcranial direct current stimulation. Neuroscience 2011, 17,37–53. [CrossRef]
423. Wiers, R.W.; Gladwin, T.E.; Hofmann, W.; Salemink, E.; Ridderinkhof, K.R. Cognitive bias modification andcognitive control training in addiction and related psychopathology: Mechanisms, clinical perspectives, andways forward. Clin. Psychol. Sci. 2013, 1, 192–212. [CrossRef]
424. Goldman, R.L.; Borckardt, J.J.; Frohman, H.A.; O’Neil, P.M.; Madan, A.; Campbell, L.K.; Budak, A.;George, M.S. Prefrontal cortex transcranial direct current stimulation (tDCS) temporarily reduces foodcravings and increases the self-reported ability to resist food in adults with frequent food craving. Appetite2011, 56, 741–746. [CrossRef]
425. Kim, S.H.; Chung, J.H.; Kim, T.H.; Lim, S.H.; Kim, Y.; Lee, Y.A.; Song, S.W. The effects of repetitive transcranialmagnetic stimulation on eating behaviors and body weight in obesity: A randomized controlled study.Brain Stimul. 2018, 11, 528–535. [CrossRef]
426. Lapenta, O.M.; Di Sierve, K.; De Macedo, E.C.; Fregni, F.; Boggio, P.S. Transcranial direct current stimulationmodulates ERP-indexed inhibitory control and reduces food consumption. Appetite 2014, 83, 42–48. [CrossRef]
427. Ljubisavljevic, M.; Maxood, K.; Bjekic, J.; Oommen, J.; Nagelkerke, N. Long-Term effects of repeated prefrontalcortex transcranial direct current stimulation (tDCS) on food craving in normal and overweight young adults.Brain Stimul. 2016, 9, 826–833. [CrossRef] [PubMed]
428. Montenegro, R.A.; Okano, A.H.; Cunha, F.A.; Gurgel, J.L.; Fontes, E.B.; Farinatti, P.T. Prefrontal cortextranscranial direct current stimulation associated with aerobic exercise change aspects of appetite sensationin overweight adults. Appetite 2012, 58, 333–338. [CrossRef] [PubMed]
429. Ray, M.K.; Sylvester, M.D.; Osborn, L.; Helms, J.; Turan, B.; Burgess, E.E.; Boggiano, M.M. The critical role ofcognitive-based trait differences in transcranial direct current stimulation (tDCS) suppression of food cravingand eating in frank obesity. Appetite 2017, 116, 568–574. [CrossRef]
430. Uher, R.; Yoganathan, D.; Mogg, A.; Eranti, S.V.; Treasure, J.; Campbell, I.C.; McLoughlin, D.M.; Schmidt, U.Effect of left prefrontal repetitive transcranial magnetic stimulation on food craving. Biol. Psychiatr. 2005, 58,840–842. [CrossRef]
431. Van den Eynde, F.; Claudino, A.M.; Mogg, A.; Horrell, L.; Stahl, D.; Ribeiro, W.; Uher, R.; Campbell, I.;Schmidt, U. Repetitive transcranial magnetic stimulation reduces cue-induced food craving in bulimicdisorders. Biol. Psychiatr. 2010, 67, 793–795. [CrossRef]
90

Nutrients 2019, 11, 2086
432. Barth, K.S.; Rydin-Gray, S.; Kose, S.; Borckardt, J.J.; O’Neil, P.M.; Shaw, D.; Madan, A.; Budak, A.; George, M.S.Food Cravings and the Effects of Left Prefrontal Repetitive Transcranial Magnetic Stimulation Using anImproved Sham Condition. Front. Psychol. 2011, 2, 9. [CrossRef]
433. Fregni, F.; Orsati, F.; Pedrosa, W.; Fecteau, S.; Tome, F.A.; Nitsche, M.A.; Mecca, T.; Macedo, E.C.;Pascual-Leone, A.; Boggio, P.S. Transcranial direct current stimulation of the prefrontal cortex modulates thedesire for specific foods. Appetite 2008, 51, 34–41. [CrossRef] [PubMed]
434. Jansen, J.M.; Daams, J.G.; Koeter, M.W.; Veltman, D.J.; Brink, W.V.D.; Goudriaan, A.E. Effects of non-invasiveneurostimulation on craving: A meta-analysis. Neurosci. Biobehav. Rev. 2013, 37, 2472–2480. [CrossRef][PubMed]
435. Ray, M.K.; Sylvester, M.D.; Helton, A.; Pittman, B.R.; Wagstaff, L.E.; McRae, T.R.; Turan, B.; Fontaine, K.R.;Amthor, F.R.; Boggiano, M.M.; et al. The effect of expectation on transcranial direct current stimulation(tDCS) to suppress food craving and eating in individuals with overweight and obesity. Appetite 2019, 136,1–7. [CrossRef] [PubMed]
436. Sedgmond, J.; Lawrence, N.S.; Verbruggen, F.; Morrison, S.; Chambers, C.D.; Adams, R.C. Prefrontal brainstimulation during food-related inhibition training: Effects on food craving, food consumption and inhibitorycontrol. R. Soc. Open Sci. 2019, 6, 181186. [CrossRef]
437. Hanlon, C.A.; Hartwell, K.J.; Canterberry, M.; Li, X.; Owens, M.; LeMatty, T.; Prisciandaro, J.J.; Borckardt, J.;Brady, K.T.; George, M.S. Reduction of cue-induced craving through realtime neurofeedback in nicotineusers: The role of region of interest selection and multiple visits. Psychiatr. Res. 2013, 213, 79–81. [CrossRef][PubMed]
438. Hartwell, K.J.; Prisciandaro, J.J.; Borckardt, J.; Li, X.; George, M.S.; Brady, K.T. Real-time fMRI in the treatmentof nicotine dependence: A conceptual review and pilot studies. Psychol. Addict. Behav. 2013, 27, 501–509.[CrossRef] [PubMed]
439. Li, X.; Hartwell, K.J.; Borckardt, J.; Prisciandaro, J.J.; Saladin, M.E.; Morgan, P.S.; Johnson, K.A.; LeMatty, T.;Brady, K.T.; George, M.S. Volitional reduction of anterior cingulate cortex activity produces decreased cuecraving in smoking cessation: A preliminary real-time fMRI study. Addict. Biol. 2012, 18, 739–748. [CrossRef][PubMed]
440. Dehghani-Arani, F.; Rostami, R.; Nadali, H. Neurofeedback training for opiate addiction: Improvement ofmental health and craving. Appl. Psychophysiol. Biofeedback 2013, 38, 133–141. [CrossRef] [PubMed]
441. Dehghani-Arani, F.; Rostami, R.; Nostratabadi, M. Effectiveness of neurofeedback training as a treatment foropioid-dependent patients. Clin. EEG Neurosci. 2010, 41, 170–177. [CrossRef] [PubMed]
442. Horrell, T.; El-Baz, A.; Baruth, J.; Tasman, A.; Sokhadze, G.; Stewart, C.; Sokhadze, E. NeurofeedbackEffects on Evoked and Induced EEG Gamma Band Reactivity to Drug-related Cues in Cocaine Addiction.J. Neurother. 2010, 14, 195–216. [CrossRef] [PubMed]
443. Scott, W.C.; Kaiser, D.; Othmer, S.; Sideroff, S.I. Effects of an EEG biofeedback protocol on a mixed substanceabusing population. Am. J. Drug Alcohol Abus. 2005, 31, 455–469. [CrossRef]
444. Dewiputri, W.I.; Auer, T. Functional Magnetic Resonance Imaging (fMRI) neurofeedback: Implementationsand applications. Malays. J. Med Sci. 2013, 20, 5–15.
445. Frank, S.; Lee, S.; Preissl, H.; Schultes, B.; Birbaumer, N.; Veit, R. The obese brain athlete: Self-regulation ofthe anterior insula in adiposity. PLoS ONE 2012, 7, e42570. [CrossRef]
446. Frank, S.; Kullmann, S.; Veit, R. Food related processes in the insular cortex. Front. Hum. Neurosci. 2013, 7,499. [CrossRef]
447. Ihssen, N.; Sokunbi, M.O.; Lawrence, A.D.; Lawrence, N.S.; Linden, D.E. Neurofeedback of visual food cuereactivity: A potential avenue to alter incentive sensitization and craving. Brain Imaging Behav. 2017, 11,915–924. [CrossRef]
448. Kohl, S.H.; Veit, R.; Spetter, M.S.; Günther, A.; Rina, A.; Lührs, M.; Birbaumer, N.; Preissl, H.; Hallschmid, M.Real-time fMRI neurofeedback training to improve eating behavior by self-regulation of the dorsolateralprefrontal cortex: A randomized controlled trial in overweight and obese subjects. NeuroImage 2019, 191,596–609. [CrossRef] [PubMed]
449. Spetter, M.S.; Malekshahi, R.; Birbaumer, N.; Lührs, M.; Van Der Veer, A.H.; Scheffler, K.; Spuckti, S.;Preissl, H.; Veit, R.; Hallschmid, M. Volitional regulation of brain responses to food stimuli in overweightand obese subjects: A real-time fMRI feedback study. Appetite 2017, 112, 188–195. [CrossRef] [PubMed]
91
Nutrients 2019, 11, 2086
450. Weiner, S. The addiction of overeating: Self-help groups as treatment models. J. Clin. Psychol. 1998, 54,163–167. [CrossRef]
451. Magill, M.; Ray, L.A. Cognitive-behavioural treatment with alcohol and illicit drug users: A meta-analysis ofrandomized controlled trials. J. Stud. Alcohol Drugs 2009, 70, 516–527. [CrossRef] [PubMed]
452. Göhner, W.; Schlatterer, M.; Seelig, H.; Frey, I.; Berg, A.; Fuchs, R. Two-Year follow-up of an interdisciplinarycognitive-behavioral intervention program for obese adults. J. Psychol. 2012, 146, 371–391. [CrossRef][PubMed]
453. Marchesini, G.; Natale, S.; Chierici, S.; Manini, R.; Besteghi, L.; Di Domizio, S.; Sartini, A.; Pasqui, F.;Baraldi, L.; Forlani, G.; et al. Effects of cognitive–behavioural therapy on health-related quality of life inobese subjects with and without binge eating disorder. Int. J. Obes. 2002, 26, 1261–1267. [CrossRef] [PubMed]
454. Linardon, J.; Wade, T.D.; Garcia, X.D.L.P.; Brennan, L. The efficacy of cognitive-behavioral therapy for eatingdisorders: A systematic review and meta-analysis. J. Consult. Clin. Psychol. 2017, 85, 1080–1094. [CrossRef][PubMed]
455. Vanderlinden, J.; Adriaensen, A.; Vancampfort, D.; Pieters, G.; Probst, M.; Vansteelandt, K. ACognitive-behavioral therapeutic program for patients with obesity and binge eating disorder: Short-and long- term follow-up data of a prospective study. Behav. Modif. 2012, 36, 670–686. [CrossRef] [PubMed]
456. Wilfley, D.E.; Welch, R.R.; Stein, R.I.; Spurrell, E.B.; Cohen, L.R.; Saelens, B.E.; Dounchis, J.Z.; Frank, M.A.;Wiseman, C.V.; Matt, G.E. A randomized comparison of group cognitive-behavioral therapy and groupinterpersonal psychotherapy fort the treatment of overweight individuals with binge-eating disorder.Arch. Gen. Psychiatr. 2002, 59, 713721. [CrossRef] [PubMed]
457. Wilson, G.T.; Fairburn, C.C.; Agras, W.S.; Walsh, B.T.; Kraemer, H. Cognitive-behavioral therapy for bulimianervosa: Time course and mechanisms of change. J. Consult. Clin. Psychol. 2002, 70, 267–274. [CrossRef][PubMed]
458. Gearhardt, A.N.; Corbin, W.R.; Brownell, K.D. Food addiction: An examination of the diagnostic criteria fordependence. J. Addict. Med. 2009, 3, 1–8. [CrossRef] [PubMed]
459. Earnshaw, V.; Smith, L.; Copenhaver, M. Drug addiction stigma in the context of methadone maintenancetherapy: An investigation into understudied sources of stigma. Int. J. Ment. Healthy Addict. 2013, 11, 110–122.[CrossRef] [PubMed]
460. DePierre, J.A.; Puhl, R.M.; Luedicke, J. A new stigmatized identity? Comparisons of a “food addict” labelwith other stigmatized health conditions. Basic Appl. Soc. Psychol. 2013, 35, 10–21. [CrossRef]
461. Rasmussen, N. Stigma and the addiction paradigm for obesity: Lessons from 1950s America. Addiction 2015,110, 217–225. [CrossRef] [PubMed]
462. Hardman, C.A.; Rogers, P.J.; Dallas, R.; Scott, J.; Ruddock, H.K.; Robinson, E. “Food addiction is real”. Theeffects of exposure to this message on self-diagnosed food addiction and eating behaviour. Appetite 2015, 91,179–184. [CrossRef] [PubMed]
463. Latner, J.D.; Puhl, R.M.; Murakami, J.M.; O’Brien, K.S. Food addiction as a causal model of obesity. Effects onstigma, blame, and perceived psychopathology. Appetite 2014, 77, 79–84. [CrossRef]
464. Reid, J.; O’Brien, K.S.; Puhl, R.; Hardman, C.A.; Carter, A. Food addiction and its potential links with weightstigma. Curr. Addict. Rep. 2018, 5, 192–201. [CrossRef]
© 2019 by the authors. Licensee MDPI, Basel, Switzerland. This article is an open accessarticle distributed under the terms and conditions of the Creative Commons Attribution(CC BY) license (http://creativecommons.org/licenses/by/4.0/).
92

nutrients
Article
Food Addiction in Eating Disorders and Obesity:Analysis of Clusters and Implications for Treatment
Susana Jiménez-Murcia 1,2,3,*, Zaida Agüera 1,2,4, Georgios Paslakis 5,6, Lucero Munguia 3,
Roser Granero 2,7, Jéssica Sánchez-González 1, Isabel Sánchez 1,2, Nadine Riesco 1,2,
Ashley N Gearhardt 8, Carlos Dieguez 2,9, Gilda Fazia 10,11, Cristina Segura-García 11,12,
Isabel Baenas 1, José M Menchón 1,3,13 and Fernando Fernández-Aranda 1,2,3,*
1 Department of Psychiatry, University Hospital of Bellvitge-IDIBELL, L’Hospitalet de Llobregat,08907 Barcelona, Spain; [email protected] (Z.A.); [email protected] (J.S.-G.);[email protected] (I.S.); [email protected] (N.R.);[email protected] (I.B.); [email protected] (J.M.M.)
2 CIBER Fisiopatología Obesidad y Nutrición (CIBERobn), Instituto de Salud Carlos III, L’Hospitalet deLlobregat, 08907 Barcelona, Spain; [email protected] (R.G.); [email protected] (C.D.)
3 Clinical Sciences Department, School of Medicine, University of Barcelona, 08907 L’Hospitalet de Llobregat,Spain; [email protected]
4 Department of Public Health, Mental Health and Maternal-Child Nursing, School of Nursing, University ofBarcelona, 08907 L’Hospitalet de Llobregat, Spain
5 Toronto General Hospital, University Health Network, Toronto, ON M5G 2C4, Canada; [email protected] Department of Psychiatry, University of Toronto, Toronto, ON M5T 1R8, Canada7 Department of Psychobiology and Methodology, Autonomous University of Barcelona,
08193 Barcelona, Spain8 Department of Psychology, University of Michigan, Ann Arbor, MI 48109, USA; [email protected] Department Physiology, Center for Research in Molecular Medicine and Chronic Diseases (CIMUS), Health
Research Institute of Santiago USC-IDIS, University Santiago de Compostela,15705 Santiago de Compostela, Spain
10 Department of Health Sciences, University “Magna Graecia” of Catanzaro, Viale Europa, 88100 Catanzaro,Italy; [email protected]
11 Center for Clinical Research and Treatment of Eating Disorders, Azienda Ospedaliera Universitaria MaterDomini, 88100 Catanzaro, Italy; [email protected]
12 Department of Medical and Surgical Sciences, University “Magna Graecia” of Catanzaro,88100 Catanzaro, Italy
13 CIBER de Salud Mental (CIBERSAM), Instituto de Salud Carlos III, L’Hospitalet de Llobregat,08907 Barcelona, Spain
* Correspondence: [email protected] (S.J.-M.); [email protected] (F.F.-A.);Tel.: +34 93 260 79 88 (S.J.-M.); +34-932-60-72-27 (F.F.-A.)
Received: 31 July 2019; Accepted: 14 October 2019; Published: 3 November 2019
Abstract: Food addiction (FA) has been associated with greater psychopathology in individuals witheating disorders (ED) and obesity (OBE). The current study aims to provide a better phenotypiccharacterization of the FA construct by conducting a clustering analysis of FA in both conditions(ED and OBE). The total sample was comprised of 234 participants that scored positive on the YaleFood Addiction Scale 2.0. (YFAS-2) (119 bulimia nervosa (BN), 50 binge eating disorder (BED),49 other specified feeding or eating disorder (OSFED) and 16 OBE). All participants completed acomprehensive battery of questionnaires. Three clusters of FA participants were identified. Cluster 1(dysfunctional) was characterized by the highest prevalence of OSFED and BN, the highest ED severityand psychopathology, and more dysfunctional personality traits. Cluster 2 (moderate) showed a highprevalence of BN and BED and moderate levels of ED psychopathology. Finally, cluster 3 (adaptive)was characterized by a high prevalence of OBE and BED, low levels of ED psychopathology, and morefunctional personality traits. In conclusion, this study identified three distinct clusters of ED-OBEpatients with FA and provides some insight into a better phenotypic characterization of the FA
Nutrients 2019, 11, 2633; doi:10.3390/nu11112633 www.mdpi.com/journal/nutrients93

Nutrients 2019, 11, 2633
construct when considering psychopathology, personality and ED pathology. Future studies shouldaddress whether these three food addiction categories are indicative of therapy outcome.
Keywords: food addiction; eating disorders; bulimia nervosa; binge eating disorders; obesity; otherspecified feeding or eating disorders; cluster analysis
1. Introduction
Food addiction (FA) is a concept that has been of increasing scientific interest and debate.An immense body of literature within the field of eating disorder (ED) research has emerged,with whole special issues of scientific journals being dedicated to its characterization [1,2]. In additionto obvious phenomenological similarities between addiction and ED (e.g., loss of control, continued usedespite negative consequences, cravings), a great number of neurobiological findings have emerged toadditionally support the new concept, not only in preclinical studies, but also in humans [3–6].
Still, not all controversies have yet been resolved. Starting off as a concept to explain a potentialsubtype of obesity (OBE) [7–10], FA has also been associated with ED, such as bulimia nervosa(BN) [11–13], binge eating disorder (BED) [14–16], and even anorexia nervosa (AN) [17]. In a systematicreview of studies on FA in non-clinical and clinical cohorts, it was especially BED that was associatedwith the most severe FA symptoms [15]. FA also seems to be prevalent in individuals with OBEwaiting for bariatric surgery [18,19] and predicts less effective weight reduction throughout dietaryintervention before surgery [20]. Interestingly, surgery-induced weight loss may lead to remission ofFA [21,22].
The Yale Food Addiction Scale (YFAS) is the main instrument for the assessment of FA andhas been developed to assess FA based on the known criteria used for the assessment of substancedependence, but applied for high palatable foods [23,24]. Higher scores on the YFAS have beenassociated with higher body mass index (BMI), binge eating episodes, impulsivity, and cravings forhighly palatable food [25], as well as with neural responses similar to those found in substance usedisorders [26–29].
There is scarce evidence with regard to the identification of key determinants of FA based onpersonality traits or ED-related symptoms and most of what is known is derived from non-clinicalcohorts. In a non-clinical sample, negative urgency (irrational acting in aversive affective states) and lowlevels of task persistence (lack of perseverance) were shown to be significantly and directly associatedwith FA and FA mediated their association to BMI [30]. In another study in undergraduates, negativeurgency, impulsivity when under distress, and emotion dysregulation positively predicted symptomcount on the YFAS [31]. Similar findings were shown in a clinical ED cohort, although negativeurgency appeared to be the only independent predictor for FA, while self-directedness and emotiondysregulation predicted negative urgency and were highly related to ED-related symptomatology,but not to food addiction itself [32,33]. In individuals with OBE awaiting bariatric surgery, FA wasassociated with personality traits such as neuroticism, impulsivity, and alexithymia [34], but also moreemotion dysregulation, more harm avoidance, and less self-directedness [35].
FA has also been associated with a positive screen for more severe variants of ED-relatedpsychopathology [7] as well as with a positive screen for major mental health symptoms, majordepressive episode, anxiety, early life adversities, such as psychological and sexual abuse, andan overall reduced quality of life [36–38]. Finally, female gender was a predictor of severe foodaddiction [36] and high reward sensitivity was significantly associated with more severe FA symptomsin females [39].
Due to these meaningful interrelationships in the literature between FA and personality traits,as well as psychopathology, it is important to consider the association of FA with these factors in anintegrated way (rather than looking at each construct in isolation). Evaluating how personality and
94
Nutrients 2019, 11, 2633
psychopathology cluster within the FA construct could lead to a better understanding of potentialdistinct phenotypes within FA that could have different clinical profiles.
Based on this premise, the aim of the present paper was to explore empirically the severity ofclusters of FA-positive (FA+) participants based on psychopathological symptomatology (namelyED-related psychopathology and general psychopathology) and personality traits, and to investigatehow the clinical features and diagnosis of ED and OBE were distributed among them. This is the firststudy that attempts this type of analysis in order to identify subgroups among participants with positiveFA in order to provide a better phenotypic characterization of the FA construct. We hypothesized that,despite overlaps, patients with ED would predominantly fit into a cluster characterized by a moresevere ED-related psychopathology that would be different than the cluster predominantly foundamong individuals with OBE. We then evaluated whether there were differences by ED subtypes, witha subgroup of patients (basically BED, but also BN) who are more similar to participants with OBE. Wealso hypothesized that, among others, ED-related severity, general psychopathology, and personalitytraits would be important determinants of the FA phenotypes. The rationale for performing this kindof analysis was to gain insight into the possibility of different FA clusters that would ideally translateinto future symptom-targeted treatments for FA phenotypes in individuals with OBE and for thosesuffering from ED.
2. Materials and Methods
2.1. Participants
From an initial sample of 395, the final participants of the current study were 234 females whoscored positive for the FA (based on YFAS 2.) and who also had a diagnosis of ED or OBE (119 withBN, 50 with BED, 49 with other specified feeding or eating disorder (OSFED), and 16 with OBE).All participants in the OBE group (n = 16) as well as n = 42 participants in the BED group (84.0%),n = 27 in the BN group (22.7%), and n = 2 in the OSFED group (4.1%) had a BMI higher than 30. Allparticipants included in the study were consecutively referred for assessment and treatment at theUnit of Eating Disorders of the Department of Psychiatry of the University Hospital of Bellvitge inBarcelona, between May of 2016 and November 2018, diagnosed according to the DSM-5 [40] criteria,and were between 18 and 60 years old.
Male participants referred for the Unit in that time period were excluded from the study, as thenumber of them in our sample was too small for meaningful statistical comparisons (n = 21; four withBN, eight with BED, two with OSFED, and seven with OBE). Considering the controversial results ofthe presence of FA in AN [17], as well as the characteristic fears and cognitive distortions about foodand weight involved in AN that may influence patients understanding of what is considered excessivefood intake or abnormal eating behavior [41], patients diagnosed with AN were excluded from thestudy as well. Likewise, due to the different reported prevalence of FA in OBE patients [20] comparedto OBE with a comorbid ED [14,15,17], the homogeneity of the sample was preserved by only inducingpatients with OBE without ED (n = 53), and only those with positive FA were included (n = 16).
According to the Declaration of Helsinki, the present study was approved by the Clinical ResearchEthics Committee (CEIC) of Bellvitge University Hospital (ethic approval code: PR205/17), andwritten informed consent was obtained from all participants. All the assessments were conducted byexperienced psychologist and psychiatrists.
2.2. Assessment
For the assessment, anthropometric measures such as weight and height (without the participantswearing clothes or shoes) were taken to calculate the BMI (i.e., weight (kg)/height (m2)). In addition toclinically relevant variables (like age of onset or duration of the disorder) and sociodemographicalcharacteristics, a battery of the Spanish-validated versions of the following instruments was used.
95

Nutrients 2019, 11, 2633
2.2.1. Eating Disorders Inventory 2 (EDI-2)
The Eating Disorders Inventory 2 (EDI-2) [42] is a 91-item multidimensional self-reportquestionnaire answered on a 6-point Likert scale that assesses different cognitive and behavioralcharacteristics typical for ED: Drive for Thinness, Bulimia, Body Dissatisfaction, Ineffectiveness,Perfectionism, Interpersonal Distrust, Interoceptive Awareness, Maturity Fears, Asceticism, ImpulseRegulation, and Social Insecurity. The validated version for the Spanish population was developed byGarner, 1998 [43], with a mean internal consistency of 0.63 (coefficient alpha).
2.2.2. Symptom Checklist-90-Revised (SCL-90-R)
The Symptom Checklist-90-Revised (SCL-90-R) [44] is used to evaluate a broad range ofpsychological problems and symptoms of psychopathology. It consist of a 90-item questionnaire thatmeasures nine primary symptom dimensions: Somatization, Obsession-Compulsion, InterpersonalSensitivity, Depression, Anxiety, Hostility, Phobic Anxiety, Paranoid Ideation, and Psychoticism; andincludes three global indices: global severity index (overall psychological distress), positive symptomdistress index (the intensity of symptoms), and a positive symptom total (self-reported symptoms).The global severity index can be used as a summary of the test. The validation of the scale in a Spanishpopulation [45], obtained a mean internal consistency of 0.75 (coefficient alpha).
2.2.3. Yale Food Addiction Scale 2.0 (YFAS-2)
The Yale Food Addiction Scale 2.0 (YFAS-2) [24] is a 35-item self-report questionnaire for measuringFA during the previous 12 months. This original instrument (YFAS) was based on the Diagnosticand Statistical Manual of Mental Disorders (DSM-IV-TR) criteria for substance dependence and wasadapted to the context of food consumption. The newer version of the instrument, YFAS-2, is based onDSM-5 Criteria and evaluates 11 symptoms. The scale produces two measurements: (a) a continuoussymptom count score that reflects the number of fulfilled diagnostic criteria (ranging from 0 to 11),and (b) a food addiction threshold based on the number of symptoms (at least 2) and self-reportedclinically significant impairment or distress. This final measurement allows for the binary classificationof food addiction (present versus absent). Additionally, based on the revised DSM-5 taxonomy, ispossible to establish severity cut-offs: mild (2–3 symptoms), moderate (4–5 symptoms), and severe(6–11 symptoms). The translation and validation of the YFAS-2 for Spanish speaking samples with EDwas carried out by Granero et al. (2018) [13], showing excellent internal reliability coefficient (α = 0.94),as well as an excellent accuracy in discriminating between healthy controls and ED subsamples(κ = 0.75).
2.2.4. Temperament and Character Inventory-Revised (TCI-R)
The Temperament and Character Inventory-Revised (TCI-R) [46] is a 240-item, 5-point Likert scale,questionnaire that measures four temperament dimensions (Harm Avoidance, Novelty Seeking, RewardDependence, and Persistence) and three character dimensions (Self-Directedness, Cooperativeness,and Self-Transcendence) of personality. The Spanish validation in an adult population was carried outby Gutiérrez-Zotes et al. [47]; the internal consistency (coefficient alpha) of the scales was 0.87.
2.3. Statistical Analysis
Statistical analysis was carried out with SPSS23 for Windows. Empirical clusters were exploredwith the two-step-cluster procedure, using as indicators the ED severity level (EDI-2 scores), the globalpsychopathological state (SCL-90-R scores), the personality profile (TCI-R scores), and the DSM-5diagnostic subtype. Two-step-cluster used the log-likelihood distance measure through a multinomialprobability mass function for categorical variables and a normal density function for continuousvariables. This clustering technique has desirable features which makes it different from traditionalgrouping and latent class techniques [48,49]: (a) scalability, which allows analysis of large data files by
96

Nutrients 2019, 11, 2633
constructing a cluster-features-tree which is used as a summary of the records; (b) automatic selectionof the number of clusters-classes; and (c) handling of categorical and quantitative variables. Criteriafor the final model selected in this study were adequate goodness-of-fit (based on a cohesion andseparation index) and adequate clinical interpretability [50]. In this study, the Silhouettes coefficientwas used as a measure of the goodness of the final cluster solution. This coefficient estimates thecohesion of the elements within a cluster and the separation between the clusters, and it ranges from –1to +1 (being the values lower than 0.30 interpreted as poor fitting, between 0.30 and 0.50 as fair fitting,and higher than 0.50 as good fitting [51]).
Comparison between clusters was based on chi-square tests (χ2) for categorical variables andanalysis of variance (ANOVA) for quantitative criteria. Effect size was measured through Cohen’s-dcoefficient for mean and proportion comparisons (low effect size was considered for |d| > 0.2, moderatefor |d| > 0.5, and large for |d| > 0.8; [52]). The Finner’s method was used to control Type-I error due tomultiple statistical comparisons (this procedure is included into the Familywise error rate stepwiseprocedures and offers a more powerful test than the classical Bonferroni correction) [53].
3. Results
3.1. Characteristics of the Sample
All the participants in the analyses were women who met criteria for FA positive screeningscore based on the YFAS-2 questionnaire n = 234. The distribution of the whole sample according todiagnostic group was 16 OBE (without ED) (6.8%), 50 BED (21.4%), 119 BN (50.9%), and 49 OSFED(20.9%). Most of the participants were single (62.0%, compared to 24.8% married or living with astable partner and 13.2% separated or divorced) and achieved primary (40.6%) or secondary (44.9%)education levels. Table A1 (Appendix A) includes the distribution of the clinical profiles stratified andcompared by the diagnostic subtype.
3.2. Cluster Composition
The best grouping structure selected for the sample of the study was the three-cluster solution,which coincided with the most optimal solution chosen by the two-step-cluster procedure. This solutionobtained a Silhouettes index (0.30) into the fair range, suggesting mild-moderate evidence of the clusterstructure in the data. The comparison between the largest cluster size (n = 90, 38.5%) and the smallest(n = 60, 25.6%) yielded a ratio of 1.50.
Figure 1 summarizes the results of the clustering procedure: the bar-graph with the indicatorrelevance for each variable (which reports how good each variable was for the grouping and candifferentiate between the derived clusters: the higher the importance of the measure, the less likely itis that the variation for the variable between clusters is due to chance and the more likely it is dueto underlying differences) and the centroids (which summarizes the cluster patterns for the set ofvariables and allows clinical interpretation of the empirical clusters). The indicator variables with thehighest contribution into the clustering were SCL-90-R scales measuring the symptom levels (concretelypsychotic, depressive, interpersonal sensitivity, anxiety, paranoia), followed by the EDI-2 scalesmeasuring ED severity (impulse regulation, social insecurity, and ineffectiveness). The personalitytraits measured with the TCI-R obtained low relevance for the clustering, except for harm avoidance(which achieved moderate-low capacity), as well as the diagnostic subtype (which achieved poorcapacity for the differentiation between the groups).
97

Nutrients 2019, 11, 2633
Figure 1. Results of the clustering procedure. Note. EDI-2: Eating disorders Inventory 2. SCL-90-R:Symptom Checklist-90-Revised. SCL-90-R Obsess-comp.: Obsession-Compulsion SCL-90-R subscale.TCI-R: Temperament and Character Inventory-Revised.
3.3. Comparison between the Empirical Clusters
The first part of Table 1 contains the comparison between the three empirical clusters for the civilstatus and the education levels. Differences between the groups only were found for the civil status:compared with the other two groups, cluster 1 had the highest proportion of single participants.
The second block of Table 1 contains the comparison between the clusters for the clinical profile.As a whole, clusters were ordered by the psychopathological state and personality profiles. Cluster 1(n = 60, 25.6%) included the youngest participants (mean 28.8 years-old), with the lowest age of onset(mean 18.5 years-old), the shortest duration of the eating problems (mean 10.5 years), and the lowestBMI (mean 27.6 kg/m2), but with the highest severity in eating problems (the highest means in theEDI-2), the worst psychopathological state (the highest means in the SCL-90R), the highest levels in thepersonality traits of harm avoidance and self-transcendence, and the lowest levels in self-directednessand cooperativeness. Cluster 1 was labeled in this study as the “dysfunctional cluster”.
98

Nutrients 2019, 11, 2633
Table 1. Comparison between clusters for variables of the study.
Cluster 1 Cluster 2 Cluster 3 Pairwise Comparisons
n = 60 (25.6%) n = 90 (38.5%) n = 84 (35.9%) Cl1-Cl2 Cl1-Cl3 Cl2-Cl3
n % n % n % p |d| p |d| p |d|Civil status—Single 46 76.7% 53 58.9% 46 54.8% 0.049 * 0.39 0.026 * 0.51 † 0.620 0.08Married—Couple 10 16.7% 22 24.4% 26 31.0% 0.19 0.34 0.15
Separated—divorced 4 6.7% 15 16.7% 12 14.3% 0.32 0.25 0.07Education Primary 29 48.3% 33 36.7% 33 39.3% 0.164 0.24 0.083 0.18 0.688 0.05
Secondary 27 45.0% 43 47.8% 35 41.7% 0.06 0.07 0.12University 4 6.7% 14 15.6% 16 19.0% 0.29 0.38 0.09
Mean SD Mean SD Mean SD p |d| p |d| p |d|Age (years-old) 28.77 11.05 35.66 12.99 34.54 12.13 0.001 * 0.57 † 0.006 * 0.50 † 0.546 0.09
Age of onset (years-old) 18.50 9.17 21.97 10.71 21.66 9.10 0.034 * 0.35 0.057 0.35 0.837 0.03Duration (years) 10.49 9.10 14.30 10.20 12.64 8.72 0.016 * 0.39 0.177 0.24 0.246 0.17
YFAS-2: total criteria 8.22 2.66 9.59 1.80 7.55 2.77 0.001 * 0.61 † 0.102 0.25 0.001 * 0.87 †BMI (kg/m2) 27.55 11.13 30.29 9.08 31.48 10.99 0.114 0.27 0.025 * 0.36 0.447 0.12
EDI-2: Drive for thinness 17.67 2.84 15.60 4.82 13.77 4.83 0.005 * 0.52 † 0.001 * 0.98 † 0.007 * 0.38EDI-2: Body dissatisfaction 21.60 5.61 20.44 6.52 17.18 7.06 0.288 0.19 0.001 * 0.69 † 0.001 * 0.51 †EDI-2: Interoceptive awar. 18.25 5.77 15.54 5.33 8.19 5.12 0.003 * 0.52 † 0.001 * 1.84 † 0.001 * 1.41 †
EDI-2: Bulimia 8.68 5.30 11.67 3.85 6.92 4.69 0.001 * 0.64 † 0.023 0.35 0.001 * 1.11 †EDI-2: Interpers.distrust 9.35 5.23 7.08 4.76 4.12 3.89 0.003 * 0.52 † 0.001 * 1.14 † 0.001 * 0.68 †
EDI-2: Ineffectiveness 18.73 6.57 15.27 6.06 7.08 4.50 0.001 * 0.55 † 0.001 * 2.07 † 0.001 * 1.53 †EDI-2: Maturity fears 12.70 5.69 9.03 5.37 6.19 5.18 0.001 * 0.66 † 0.001 * 1.20 † 0.001 * 0.54 †EDI-2: Perfectionism 7.67 4.63 6.53 4.21 4.52 3.65 0.101 0.26 0.001 * 0.75 † 0.002 * 0.51 †
EDI-2: Impulse regulation 13.63 5.46 7.50 4.38 3.27 3.41 0.001 * 1.24 † 0.001 * 2.27 † 0.001 * 1.08 †EDI-2: Ascetism 10.45 3.18 8.88 2.78 5.69 2.91 0.001 * 0.53 † 0.001 * 1.56 † 0.001 * 1.12 †
EDI-2: Social Insecurity 13.40 4.54 9.60 4.10 4.51 3.03 0.001 * 0.88 † 0.001 * 2.30 † 0.001 * 1.41 †EDI-2: Total 152.13 27.03 127.14 20.64 81.45 22.16 0.001 * 1.04 † 0.001 * 2.86 † 0.001 * 2.13 †
SCL-90-R: somatization 2.75 0.63 2.13 0.71 1.46 0.72 0.001 * 0.93 † 0.001 * 1.92 † 0.001 * 0.94 †SCL-90-R: obsess-comp. 2.83 0.59 2.34 0.57 1.53 0.64 0.001 * 0.84 † 0.001 * 2.11 † 0.001 * 1.34 †SCL-90-R: interpers.sens. 3.03 0.53 2.50 0.54 1.38 0.67 0.001 * 1.00 † 0.001 * 2.73 † 0.001 * 1.84 †
SCL-90-R: depressive 3.24 0.43 2.68 0.53 1.67 0.62 0.001 * 1.17 † 0.001 * 2.93 † 0.001 * 1.74 †SCL-90-R: anxiety 2.76 0.55 1.96 0.64 1.08 0.54 0.001 * 1.36 † 0.001 * 3.09 † 0.001 * 1.49 †SCL-90-R: hostility 2.32 0.88 1.43 0.73 0.87 0.67 0.001 * 1.10 † 0.001 * 1.86 † 0.001 * 0.81 †
SCL-90-R: phobic anxiety 2.04 0.83 1.32 0.79 0.51 0.52 0.001 * 0.89 † 0.001 * 2.22 † 0.001 * 1.21 †SCL-90-R: paranoia 2.48 0.62 1.57 0.59 0.87 0.53 0.001 * 1.50 † 0.001 * 2.77 † 0.001 * 1.25 †SCL-90-R: psychotic 2.31 0.52 1.56 0.45 0.85 0.48 0.001 * 1.55 † 0.001 * 2.92 † 0.001 * 1.53 †SCL-90-R: GSI index 2.73 0.36 2.06 0.33 1.26 0.38 0.001 * 1.90 † 0.001 * 3.96 † 0.001 * 2.26 †SCL-90-R: PST index 81.63 6.60 71.93 8.36 55.42 13.26 0.001 * 1.29 † 0.001 * 2.50 † 0.001 * 1.49 †SCL-90-R: PSDI index 3.01 0.34 2.60 0.36 2.03 0.36 0.001 * 1.20 † 0.001 * 2.81 † 0.001 * 1.57 †
TCI-R: Novelty seeking 103.32 16.27 99.00 16.77 100.79 14.63 0.105 0.26 0.347 0.16 0.460 0.11TCI-R: Harm avoidance 133.15 13.32 126.94 16.59 109.63 16.15 0.018 * 0.41 0.001 * 1.59 † 0.001 * 1.06 †TCI-R: Reward-depend. 95.83 17.43 98.68 15.33 103.25 15.83 0.289 0.17 0.007 * 0.45 0.062 0.29
TCI-R: Persistence 103.42 22.25 102.77 20.58 107.33 19.98 0.852 0.03 0.267 0.19 0.149 0.23TCI-R: Self-directedness 96.03 13.89 104.39 15.30 124.70 17.28 0.002 * 0.57 † 0.001 * 1.83 † 0.001 * 1.24 †TCI-R: Cooperativeness 124.40 19.00 133.38 16.53 139.31 11.39 0.001 * 0.50 † 0.001 * 0.95 † 0.013 * 0.42
TCI-R: Self-transcendence 73.35 13.87 63.43 15.43 63.73 17.46 0.001 * 0.68 † 0.001 * 0.61 † 0.903 0.02
Note. SD: standard deviation. * Bold: significant comparison (0.05 level). † Bold: effect size into themoderate (|d| > 0.50) to high range (|d| > 0.80). YFAS-2: Yale food addiction scale 2.0. BMI: Body mass index.EDI-2: Eating disorders Inventory 2. SCL-90-R: Symptom Checklist-90-Revised. TCI-R: Temperament andCharacter Inventory-Revised.
Cluster 2 (n = 90, 38.5%) included the participants with the longest duration of the eating problems(mean 14.3 years) and the highest level of food addiction (mean 9.6). The mean for BMI (30.3 kg/m2)was higher than in cluster 1, but similar to that obtained in cluster 3. The mean scores in the EDI-2and the SCL-90R were high for participants into cluster 2, but clearly lower than values registered forcluster 1. Cluster 2 was labeled in this study as the “moderate cluster”.
Cluster 3 (n = 84, 35.9%) was characterized by similar mean scores in age (34.5 years-old), onsetof eating problems (21.7 years) and duration of the disorder (12.6 years) than cluster 2. The mostadaptive scores in the clinical profile was registered for cluster 3 (the lowest scores in the EDI-2 and theSCL-90R), as well as the highest means in the personality traits of persistence, self-directedness andcooperativeness. Cluster 3 was labeled in this study as the “functional cluster”.
Figure 2 includes the 100%-stacked bar chart with the distribution of the DSM-5 ED diagnosticsubtype into each empirical cluster. OBE patients were primary included into cluster 3 (68.85),while BED patients were mostly distributed into clusters 3 and 2 (48.0% and 44.0%, respectively).Approximately half of the BN patients were into cluster 2 (52.1%), and the remaining participants intothis group were distributed between cluster 1 (27.7%) and cluster 3 (20.2%). A little more than half ofthe OSFED patients were in cluster 3 (51%), and almost 41% in cluster 1.
99

Nutrients 2019, 11, 2633
Figure 2. Distribution of the diagnostic subtype and the food addiction (FA) severity group within theempirical clusters. Note. OBE: obesity. BED: binge eating disorder. BN: bulimia nervosa. OSFED: otherspecified feeding eating disorder.
As a synthesis of the results, Figure 3 contains the radar-chart comparing the empirical clustersfor the main clinical variables of the study. To allow adequate interpretability, z-standardized scoreswere plotted.
-1.2
-0.8
-0.4
0.0
0.4
0.8
1.2
Cluster1 Cluster2 Cluster3
Figure 3. Radar-chart comparing the z-standardized mean scores between the empirical clusters Note.FA: Food addiction. BMI: Body mass index. EDI-2: Eating disorders Inventory 2. SCL-90-R GSI: GlobalSeverity Index of the Symptom Checklist-90-Revised.
4. Discussion
The aim of the present study was to explore empirical severity clusters with FA-positive (FA+)females, and to investigate whether these FA clusters differed by ED and OBE. A three-cluster structure
100

Nutrients 2019, 11, 2633
was detected based on general psychopathology, ED severity, and personality traits. These clustersranged from a more functional cluster, to moderate and highly dysfunctional group.
Although high FA has previously been associated with high eating psychopathology and moredysfunctional personality traits, [32], this is the first study that analyzes a potential heterogeneitywithin patients with FA. Although all the participants in the current study were FA+, we found that theidentified clusters followed a linearity with respect to FA severity with the most dysfunctional clusters(1 and 2) having the highest FA symptoms level, and the most functional one, the lowest. For the“dysfunctional cluster”, we found a higher prevalence of OSFED and BN, both ED conditionscharacterized by more dysfunctional personality traits, greater impulsivity, and more generalpsychopathology, [54–57], as well by their worse prognosis [56]. Consistent with this literature,the cluster with more OFED and BN had the worst psychopathological state and highest severity inED symptomatology.
Personality traits that were elevated in the most dysfunction cluster were greater difficulties inestablishing goals and objectives to guide their lives (self-directedness), the highest levels of anxiety,worry, fear (harm avoidance), and being a more self-centered person (lower cooperativeness). All ofthese characteristics have not only been associated with FA [32,35], but also with BN, substance usedisorders (SUD), and comorbidity between BN and SUD [58,59]. This cluster was also associated withhigher levels of novelty seeking, which is a predictor of risky behaviors and associated with SUD andED pathologies [59–64]. Therefore, the commonality of these extreme personality features in addictiveprofiles, suggests it could be important in the etiology and maintenance of FA and could be the focus ofintervention efforts. Additionally, the aforementioned characteristics have been related to higher risk ofdropout and poor outcome in OSFED patients with purging behaviors [56], suggesting important clinicalrelevance. Although the association of FA and treatment outcome was not the aim of this study, priorresearch suggests that higher initial FA scores have been associated with a worse prognosis in BN [65].
In sum, the severity of this dysfunctional cluster may be driven by the comorbid ED provided andcharacteristics associated with these disorders. Thus, in order to be successful, the treatment aimed atpatients who are in this cluster should target its principal psychological and psychiatric characteristics,in addition to factors that may maintain FA. As previous literature has reported, changes in personalitytraits are related to an overall improvement in eating pathology [66], and interventions that couldtarget the personality factors elevated in this cluster would likely be of benefit. Additionally, due tothe severity of the psychopathological state in this cluster, pharmacological approaches to addresscomorbid psychiatric conditions could be also considered if it is needed.
The second cluster, the moderate cluster, was the one that presented the highest level of FA, althoughfunctioning was more adaptive than cluster 1 (i.e., lower ED severity, intermediate psychopathologylevels). Therefore, we hypothesize that it is FA which mostly determines the characteristics of thiscluster. Regarding the personality traits, high levels of harm avoidance and low self-directedness werepresent in this cluster, but at moderate levels compared to cluster 1 (the dysfunctional). Related to theED pathology, there was a high presence of patients with BN followed by patients with BED within thiscluster. Higher FA scores have been already associated with bingeing ED-subtype patients [13,14,17,67],given the tendency to consume more high-fat/high-sugar caloric food during binges episodes, whichmay result in a higher number of FA symptoms [17] given the similar neural responses in rewardpathways modulated by dopamine by those types of food and addictive drugs [6,16,29,68–70]. In fact,new maintenance models of BN and BED have emerged, that take into consideration the addictiveresponse to palatable foods [71]. Related studies have also found that similar patterns of neuralunderpinning of tolerance and dependence observed in SUD appear to be related to binge-type eatingdisorders as well [72,73]. This is consistent with the high comorbidity between SUD and binge-typeED [74,75]. Finally, another important aspect to mention is that it has been shown that individualswith BN or BED experience more frequent and more intense food cravings than persons without bingeeating [76–79] and that both conditions show significantly larger food cue reactivity (self-reportedcraving) [80]. This intense desire or urge to eat a particular type of food also, at a neural level, resembles
101

Nutrients 2019, 11, 2633
responses to drug cues in SUD [26]. Therefore, it could be suggested that the treatment directedto patients in this cluster should target the reward related neural processes that maintain addictivedisorders. In this regard, it has been suggested that previously developed interventions for addictionscould be applied to binge eating behaviors [71], such as training in the reduction of food cue reactivityin order to reduce craving [81,82] and a reduction in the intake of high-fat/high-sugar caloric foodwhich hyper-activate reward systems.
The “adaptative” cluster presents with more functional personality traits and low levels of generalpsychopathology, as well as the lowest levels of FA. Thus, the FA in this cluster may be the result ofdifferent factors than patients in clusters 1 and 2, which could have important implications in thetreatment. First, it is important to mention that within this cluster, there was the highest presence ofpatients with OBE without ED. This is consistent with prior findings that patients with OBE with acomorbid ED have a higher level of psychopathology than OBE patients without ED [83–86]. Second,this cluster presents the most functional personality traits, the lowest levels of harm avoidance andself-transcendence, and the highest in cooperativeness and self-directedness. Similar results havebeen found in healthy control groups when comparing them with ED and behavioral addictionpatients [87,88]. Thus, BMI could be playing an important role in this cluster, considering that in oursample there are statistically significant differences between cluster 1 (the dysfunctional) and 3 (theadaptative) in BMI. It has been suggested that visceral adiposity levels could be a mediator of therelationship between middle-dorsal insula network connectivity (insula region relevant for eatingbehavior) and food craving [28], being that visceral fat disrupts insula coding of bodily homeostaticsignals, which may boost externally driven food cravings, and also, there are positive associationsbetween food craving and excessive overeating [89,90]. Given the characteristics of this cluster, forwhich no dysfunctional personality traits of severe ED symptomology or psychopathology mustbe addressed, it could be hypothesized that nutritional changes that would have a positive impacton a reduction of BMI could be also be beneficial for the reducing FA, through reducing cravingepisodes. This is consistent with previous studies that find that FA decreases significantly after bariatricsurgery [91], and that the induced weight loss by the surgery resulted in the remission of FA in 93% ofpatients [22]. Finally, there is a moderate representation of patients with BED in this cluster, whichmay be due to the common co-occurrence between both conditions (OBE-BED). This may be dueto the association of features such as grazing [92], craving [93–95], or hedonic [96] and emotionaleating [97,98] with OBE and BED. Addressing these factors (and their negative consequences) could bean important focus of treatment in this FA cluster, as grazing is associated with poorer weight losstreatment outcomes in OBE [92] and craving and the use of food to regulate mood are potential triggersfor overeating [41,99,100].
The results of this study should take into account the following limitations. First, the sample onlyincluded women, so the results cannot be generalized to males; for future studies, it will be importantto explore if the FA cluster structure found in this study is replicated in males. Another limitation isthat the size of some of the participant groups, divided by ED subtype and OBE, is small. Finally that,due to the fact that the participants were recruited in the same geographical area, the results may notbe generalizable to other samples
5. Conclusions
The findings in the present study describe a three-cluster structure of FA-positive (FA+) participantsthat differ by ED and OBE profile. The clusters range from more to less functional, depending onpsychopathology and personality traits. The identification of phenotypes in FA will not only increaseknowledge of each cluster’s characteristics, but may allow for better individualization of treatment byidentifying novel intervention targets and improving treatment outcomes. Likewise, the present studyidentifies future lines of research, as longitudinal studies that could analyze the predictive validity ofthis cluster structure on treatment outcome could be of importance.
102

Nutrients 2019, 11, 2633
Author Contributions: The authors had the following roles in this paper: conceptualization, S.J.-M., R.G., A.N.G.,C.D., F.F.-A. and R.G.; methodology, F.F.-A, S.J.-M., Z.A. and R.G.; formal statistical analysis, R.G.; data collectionand assessment: Z.A., G.P., L.M., J.S.-G., I.S. and N.R.; writing—original draft preparation, Z.A., G.P., L.M., J.S.-G.,R.G., A.N.G., F.F.-A. and S.J.-M.; writing—review and editing, Z.A., G.P., L.M., J.S.-G., I.B., J.M.M., A.N.G., C.D.,G.F., C.S.-G., F.F.-A., S.J.-M. and R.G.; supervision, F.F.-A. and S.J.-M.; funding acquisition, F.F.-A., J.M.M., C.D. andS.J.-M.; Investigation, S.J.-M., Z.A., G.P., L.M., J.S.-G., G.F. and F.F.-A.; Project administration, S.J.-M. and F.F.-A.;Resources, S.J.-M. and F.F.-A.
Funding: We thank CERCA Programme/Generalitat de Catalunya for institutional support. This manuscriptand research was supported by grants from the Ministerio de Economía y Competitividad (PSI2015-68701-R), bythe Delegación del Gobierno para el Plan Nacional sobre Drogas (2017I067), by the Instituto de Salud Carlos III(ISCIII) (FIS PI14/00290 and PI17/01167), by the SLT006/17/00246 grant, funded by the Department of Health ofthe Generalitat de Catalunya by the call “Acció instrumental de programes de recerca orientats en l’àmbit de larecerca i la innovació en salut”, and co-funded by FEDER funds/European Regional Development Fund (ERDF), away to build Europe. CIBERObn and CIBERSAM are both initiatives of ISCIII.
Conflicts of Interest: The authors declare no conflict of interest. The funders had no role in the design of thestudy; in the collection, analyses, or interpretation of data; in the writing of the manuscript, or in the decision topublish the results.
Appendix A
Table A1. Clinical profiles in the ED-subtypes.
Obesity BED BN OSFED
n = 16 n = 119 n = 50 n = 49
α Mean SD Mean SD Mean SD Mean SD p
Age (years-old) 44.13 11.89 40.90 12.62 31.31 11.23 27.73 9.94 <0.001 *
Age of onset (years-old) 26.06 11.44 25.90 11.18 19.32 9.14 18.29 6.91 <0.001 *
Duration (years) 18.75 9.94 14.79 9.79 12.26 9.24 9.81 8.53 0.003
YFAS2.0: total criteria 0.943 8.19 2.51 9.54 1.68 9.00 2.18 6.35 2.97 <0.001 *
BMI (kg/m2) 44.64 8.33 40.46 10.06 26.72 6.85 22.59 4.13 <0.001 *
EDI-2: Drive for thinness 0.736 12.31 3.32 12.82 5.19 16.44 4.23 16.88 3.81 <0.001 *
EDI-2: Body dissatisfaction 0.842 20.19 6.47 21.74 5.63 19.40 6.86 17.55 7.06 0.019
EDI-2: Interoceptiveawareness 0.785 11.56 7.12 12.30 6.96 14.69 6.66 12.94 6.58 0.078
EDI-2: Bulimia 0.710 6.13 4.67 10.08 3.72 10.91 4.53 5.14 4.63 <0.001 *
EDI-2: Interpersonal distrust 0.802 5.38 4.53 6.52 5.30 7.28 5.09 5.43 4.55 0.121EDI-2: Ineffectiveness 0.860 12.25 7.84 11.72 6.45 14.78 7.52 11.27 7.41 0.011 *
EDI-2: Maturity fears 0.784 8.06 6.92 7.06 5.95 9.79 5.65 9.14 5.95 0.048 *
EDI-2: Perfectionism 0.697 5.75 4.16 5.84 3.91 6.69 4.45 5.06 4.26 0.146EDI-2: Impulse regulation 0.757 4.50 4.47 5.74 5.36 8.56 6.15 7.96 5.73 0.005 *
EDI-2: Ascetic 0.717 8.00 3.76 7.24 3.35 8.70 3.58 7.73 3.21 0.071EDI-2: Social Insecurity 0.770 6.19 5.39 7.76 4.76 9.90 5.38 7.80 4.62 0.004 *
EDI-2: Total 0.928 100.31 34.62 108.82 33.40 127.13 34.96 106.90 38.03 <0.001 *
SCL-90-R: somatization 0.875 2.07 0.93 2.02 0.75 2.13 0.83 1.88 0.98 0.408SCL-90-R: obsess-comp. 0.818 1.88 0.94 2.06 0.80 2.29 0.72 2.10 0.85 0.094SCL-90-R: interpers.sens. 0.854 1.91 1.13 2.02 0.93 2.40 0.83 2.14 0.87 0.024 *
SCL-90-R: depressive 0.878 2.12 1.06 2.30 0.88 2.60 0.76 2.40 0.84 0.044 *
SCL-90-R: anxiety 0.865 1.36 0.86 1.62 0.87 1.98 0.84 1.92 0.90 0.008 *
SCL-90-R: hostility 0.840 0.99 0.71 1.26 0.81 1.59 0.98 1.49 0.94 0.035 *
SCL-90-R: phobic anxiety 0.800 1.13 0.93 0.97 0.86 1.31 0.94 1.25 0.96 0.179SCL-90-R: paranoia 0.745 1.63 0.97 1.42 0.85 1.64 0.83 1.46 0.85 0.355SCL-90-R: psychotic 0.788 1.21 0.67 1.25 0.73 1.61 0.70 1.59 0.80 0.009 *
SCL-90-R: GSI index 0.971 1.69 0.80 1.77 0.67 2.06 0.64 1.91 0.71 0.025 *
SCL-90-R: PST index 0.971 60.81 20.65 65.24 15.58 71.10 12.26 67.98 15.03 0.012 *
SCL-90-R: PSDI index 0.971 2.44 0.59 2.38 0.55 2.57 0.50 2.48 0.53 0.162
TCI-R: Novelty seeking 0.782 94.69 14.06 100.80 15.70 101.85 17.34 100.00 12.76 0.394TCI-R: Harm avoidance 0.873 117.69 19.22 120.28 17.00 124.04 18.74 121.73 18.85 0.440TCI-R: Reward-depend. 0.834 108.94 17.06 99.20 16.70 97.74 15.58 101.43 16.48 0.057
TCI-R: Persistence 0.893 103.94 15.64 97.26 20.19 104.36 21.44 112.76 18.92 0.003 *
TCI-R: Self-directedness 0.844 115.31 23.31 108.64 20.65 106.87 18.25 115.06 19.58 0.054TCI-R: Cooperativeness 0.844 139.88 11.85 131.56 20.63 132.02 16.52 135.59 12.66 0.195
TCI-R: Self-transcendence 0.863 72.38 21.29 66.14 16.53 65.84 14.92 64.55 17.63 0.420
Note. α: Cronbach’s alpha in the sample. BED: binge eating disorder; BN: bulimia nervosa; OSFED: other specifiedfeeding eating disorder. SD: standard deviation. * Bold: significant comparison (.05 level). YFAS: Yale food addictionscale 2.0. BMI: Body mass index. EDI-2: Eating disorders Inventory 2. SCL-90-R: Symptom Checklist-90-Revised.TCI-R: Temperament and Character Inventory-Revised.
103
Nutrients 2019, 11, 2633
References
1. Schulte, E.M.; Joyner, M.A.; Potenza, M.N.; Grilo, C.M.; Gearhardt, A.N. Current Considerations RegardingFood Addiction. Curr. Psychiatry Rep. 2015, 17, 17–19. [CrossRef] [PubMed]
2. Fernandez-Aranda, F.; Karwautz, A.; Treasure, J. Food addiction: A transdiagnostic construct of increasinginterest. Eur. Eat. Disord. Rev. 2018, 26, 536–540. [CrossRef] [PubMed]
3. Avena, N.M.; Rada, P.; Hoebel, B.G. Evidence for sugar addiction: Behavioral and neurochemical effects ofintermittent, excessive sugar intake. Neurosci. Biobehav. Rev. 2008, 32, 20–39. [CrossRef] [PubMed]
4. Volkow, N.D.; Wang, G.J.; Fowler, J.S.; Tomasi, D.; Baler, R. Food and Drug Reward: Overlapping Circuits inHuman Obesity and Addiction Inhibitory control. Curr. Top. Behav. Neurosci. 2011, 11, 1–24.
5. Tang, D.W.; Fellows, L.K.; Small, D.M.; Dagher, A. Food and drug cues activate similar brain regions:A meta-analysis of functional MRI studies. Physiol. Behav. 2012, 106, 317–324. [CrossRef] [PubMed]
6. Michaud, A.; Vainik, U.; Garcia-Garcia, I.; Dagher, A. Overlapping Neural Endophenotypes in Addictionand Obesity. Front. Endocrinol. 2017, 8, 127. [CrossRef] [PubMed]
7. Gearhardt, A.N.; Boswell, R.G.; White, M.A. The association of “food addiction” with disordered eating andbody mass index. Eat. Behav. 2014, 15, 427–433. [CrossRef]
8. Ferrario, C.R. Food Addiction and Obesity. Neuropsychopharmacol. Rev. 2017, 42, 361–362. [CrossRef]9. Cope, E.C.; Gould, E. New Evidence Linking Obesity and Food Addiction. Biol. Psychiatry 2017, 81, 734–736.
[CrossRef]10. Sinha, R. Role of addiction and stress neurobiology on food intake and obesity. Biol. Psychol. 2018, 131, 5–13.
[CrossRef]11. Meule, A.; Von Rezori, V.; Blechert, J. Food Addiction and Bulimia Nervosa. Eur. Eat. Disord. Rev. 2014, 22,
331–337. [CrossRef] [PubMed]12. De Vries, S.-K.; Meule, A. Food Addiction and Bulimia Nervosa: New Data Based on the Yale Food Addiction
Scale 2.0. Eur. Eat. Disord. Rev. 2016, 24, 518–522. [CrossRef] [PubMed]13. Granero, R.; Jiménez-Murcia, S.; Gearhardt, A.N.; Agüera, Z.; Aymamí, N.; Gómez-Peña, M.;
Lozano-Madrid, M.; Mallorquí-Bagué, N.; Mestre-Bach, G.; Neto-Antao, M.I.; et al. Validation of theSpanish Version of the Yale Food Addiction Scale 2.0 (YFAS 2.0) and Clinical Correlates in a Sample of EatingDisorder, Gambling Disorder, and Healthy Control Participants. Front. Psychiatry 2018, 9, 208. [CrossRef][PubMed]
14. Gearhardt, A.N.; White, M.A.; Masheb, R.M.; Morgan, P.T.; Crosby, R.D.; Grilo, C.M. An Examination of theFood Addiction Construct in Obese Patients with Binge Eating Disorder. Int. J. Eat. Disord. 2012, 45, 657–663.[CrossRef]
15. Penzenstadler, L.; Soares, C.; Karila, L.; Khazaal, Y. Systematic Review of Food Addiction as Measured withthe Yale Food Addiction Scale: Implications for the Food Addiction Construct. Curr. Neuropharmacol. 2019,17, 1–13. [CrossRef]
16. Smith, D.G.; Robbins, T.W. The Neurobiological Underpinnings of Obesity and Binge Eating: A Rationale forAdopting the Food Addiction Model. Biol. Psychiatry 2013, 73, 804–810. [CrossRef]
17. Granero, R.; Hilker, I.; Agüera, Z.; Jiménez-Murcia, S.; Sauchelli, S.; Islam, M.A.; Fagundo, A.B.; Sánchez, I.;Riesco, N.; Dieguez, C.; et al. Food Addiction in a Spanish Sample of Eating Disorders: DSM-5 DiagnosticSubtype Differentiation and Validation Data. Eur. Eat. Disord. Rev. 2014, 22, 389–396. [CrossRef]
18. Ivezaj, V.; Wiedemann, A.A.; Grilo, C.M. Food Addiction and Bariatric Surgery: A Systematic Review of theLiterature. Obes. Rev. 2017, 18, 1386–1397. [CrossRef]
19. Müller, A.; Leukefeld, C.; Hase, C.; Gruner, K.; Mall, J.W.; Köhler, H.; Zwaan, M. De Food addiction andother addictive behaviours in bariatric surgery candidates. Eur. Eat. Disord. 2018, 26, 1–12.
20. Guerrero Pérez, F.; Sánchez-González, J.; Sánchez, I.; Jiménez-Murcia, S.; Granero, R.; Simó-Servat, A.;Ruiz, A.; Virgili, N.; López-Urdiales, R.; Montserrat-Gil de Bernabe, M.; et al. Food addiction and preoperativeweight loss achievement in patients seeking bariatric surgery. Eur. Eat. Disord. Rev. 2018, 26, 645–656.[CrossRef]
21. Murray, S.M.; Tweardy, S.; Geliebter, A.; Avena, N.M. A Longitudinal Preliminary Study of Addiction-LikeResponses to Food and Alcohol Consumption Among Individuals Undergoing Weight Loss Surgery. Obes.Surg. 2019. [CrossRef] [PubMed]
104

Nutrients 2019, 11, 2633
22. Pepino, M.Y.; Stein, R.I.; Eagon, J.C.; Klein, S. Bariatric surgery-induced weight loss causes remission of foodaddiction in extreme obesity. Obesity 2014, 22, 1792–1798. [CrossRef] [PubMed]
23. Gearhardt, A.N.; Corbin, W.R.; Brownell, K.D. Food addiction: an examination of the diagnostic criteria fordependence. J. Addict. Med. 2009, 3, 1–7. [CrossRef] [PubMed]
24. Gearhardt, A.N.; Corbin, W.R.; Brownell, K.D. Development of the Yale Food Addiction Scale Version 2.0.Psychol. Addict. Behav. 2016, 30, 113–121. [CrossRef] [PubMed]
25. Meule, A.; Gearhardt, A.N. Food addiction in the light of DSM-5. Nutrients 2014, 6, 3653–3671. [CrossRef][PubMed]
26. Gearhardt, A.N.; Yokum, S.; Orr, P.T.; Stice, E.; Corbin, W.R.; Brownell, K.D. The Neural Correlates of “FoodAddiction”. Arch. Gen. Psychiatry 2011, 68, 808–816. [CrossRef] [PubMed]
27. Davis, C.; Loxton, N.J.; Levitan, R.D.; Kaplan, A.S.; Carter, J.C.; Kennedy, J.L. “Food addiction” and itsassociation with a dopaminergic multilocus genetic profile. Physiol. Behav. 2013, 118, 63–69. [CrossRef]
28. Contreras-Rodriguez, O.; Burrows, T.; Pursey, K.M.; Stanwell, P.; Parkes, L.; Soriano-Mas, C.; Verdejo-Garcia, A.Food addiction linked to changes in ventral striatum functional connectivity between fasting and satiety.Appetite 2019, 133, 18–23. [CrossRef]
29. Schulte, E.M.; Yokum, S.; Potenza, M.N.; Gearhardt, A.N. Neural systems implicated in obesity as anaddictive disorder: from biological to behavioral mechanisms. Prog. Brain Res. 2016, 223, 329–346.
30. Murphy, C.M.; Stojek, M.K.; MacKillop, J. Interrelationships among impulsive personality traits, foodaddiction, and Body Mass Index. Appetite 2014, 73, 45–50. [CrossRef]
31. Pivarunas, B.; Conner, B.T. Impulsivity and emotion dysregulation as predictors of food addiction. Eat. Behav.2015, 19, 9–14. [CrossRef] [PubMed]
32. Wolz, I.; Hilker, I.; Granero, R.; Jiménez-Murcia, S.; Gearhardt, A.N.; Dieguez, C.; Casanueva, F.F.;Crujeiras, A.B.; Menchón, J.M.; Fernández-Aranda, F. “Food Addiction” in Patients with Eating Disorders isAssociated with Negative Urgency and Difficulties to Focus on Long-Term Goals. Front. Psychol. 2016, 7, 61.[CrossRef] [PubMed]
33. Wolz, I.; Granero, R.; Fernández-aranda, F. A comprehensive model of food addiction in patients withbinge-eating symptomatology: The essential role of negative urgency. Compr. Psychiatry 2017, 74, 118–124.[CrossRef] [PubMed]
34. Brunault, P.; Ducluzeau, P.H.; Courtois, R.; Bourbao-Tournois, C.; Delbachian, I.; Réveillère, C.; Ballon, N.Food Addiction is Associated with Higher Neuroticism, Lower Conscientiousness, Higher Impulsivity, butLower Extraversion in Obese Patient Candidates for Bariatric Surgery. Subst. Use Misuse 2018, 53, 1919–1923.[CrossRef] [PubMed]
35. Ouellette, A.-S.; Rodrigue, C.; Lemieux, S.; Tchernof, A.; Biertho, L.; Bégin, C. An examination of themechanisms and personality traits underlying food addiction among individuals with severe obesityawaiting bariatric surgery. Eat. Weight Disord. Stud. Anorexia, Bulim. Obes. 2017, 22, 633–640. [CrossRef]
36. Burrows, T.; Skinner, J.; McKenna, R.; Rollo, M. Food Addiction, Binge Eating Disorder, and Obesity: IsThere a Relationship? Behav. Sci. 2017, 7, 54. [CrossRef]
37. Burrows, T.; Kay-Lambkin, F.; Pursey, K.; Skinner, J.; Dayas, C. Food addiction and associations with mentalhealth symptoms: A systematic review with meta-analysis. J. Hum. Nutr. Diet. 2018, 31, 544–572. [CrossRef]
38. Nunes-neto, P.R.; Köhler, C.A.; Schuch, F.B.; Solmi, M.; Quevedo, J.; Maes, M.; Murru, A.; Vieta, E.;Mcintyre, R.S.; Mcelroy, S.L.; et al. Food addiction: Prevalence, psychopathological correlates and associationswith quality of life in a large sample. J. Psychiatr. Res. 2018, 96, 145–152. [CrossRef]
39. Loxton, N.J.; Tipman, R.J. Reward sensitivity and food addiction in women. Appetite 2017, 115, 28–35.[CrossRef]
40. American Psychiatric Association. Diagnostic and Statistical Manual of Mental Disorders (DSM-5); AmericanPsychiatric Association: Arlington, VA, USA, 2013; ISBN 0-89042-555-8.
41. Gendall, K.A.; Joyce, P.R.; Sullivan, P.F.; Bulik, C.M. Food cravers: Characteristics of those who binge.Int. J. Eat. Disord. 1998, 23, 353–360. [CrossRef]
42. Garner, D. Eating Disorder Inventory-2; Psychological Assessment Resources: Odessa, Ukraine, 1991.43. Garner, D. Inventario de Trastornos de la Conducta Alimentaria (EDI-2)—Manual; TEA Ediciones: Madrid,
Spain, 1998.44. Derogatis, L. SCL-90-R. Administration, Scoring and Procedures Manual—II for the Revised Version. Clinical
Psychometric Research; Clinical Psychometric Research: Baltimore, MD, USA, 1990.
105

Nutrients 2019, 11, 2633
45. Derogatis, L. SCL-90-R. Cuestionario de 90 Síntomas-Manual; TEA Ediciones: Madrid, Spain, 2002.46. Cloninger, C.R. The Temperament and Character Inventory–Revised; Washington University, Center for
Psychobiology of Personality: St. Louis, MO, USA, 1999.47. Gutiérrez-Zotes, J.A.; Bayón, C.; Montserrat, C.; Valero, J.; Labad, A.; Cloninger, C.R.; Fernández-Aranda, F.
Temperament and Character Inventory—Revised (TCI-R). Standardization and normative data in a generalpopulation sample. ACTAS Esp. Psiquiatr. 2004, 32, 8–15. [PubMed]
48. Bacher, J. A Probabilistic Clustering Model for Variables of Mixed Type. Qual. Quant. 2000, 34, 223–235.[CrossRef]
49. Huang, Z. Extensions to the k-Means Algorithm for Clustering Large Data Sets with Categorical Values.Data Mining Knowl. Discov. 1998, 2, 283–304. [CrossRef]
50. Nylund, K.L.; Asparouhov, T.; Muthén, B.O. Deciding on the Number of Classes in Latent Class Analysisand Growth Mixture Modeling: A Monte Carlo Simulation Study. Struct. Equ. Model. A Multidiscip. J. 2007,14, 535–569. [CrossRef]
51. Rousseeuw, P.J. Silhouettes: A graphical aid to the interpretation and validation of cluster analysis. J. Comput.Appl. Math. 1987, 20, 53–65. [CrossRef]
52. Kelley, K.; Preacher, K.J. On Effect Size. Association 2012, 17, 137–152. [CrossRef]53. Finner, H. On a Monotonicity Problem in Step-Down Multiple Test Procedures. J. Am. Stat. Assoc. 1993,
88, 920. [CrossRef]54. Fontenelle, L.F.; Mendlowicz, M.V.; Moreira, R.O.; Appolinario, J.C. An empirical comparison of atypical
bulimia nervosa and binge eating disorder. Braz. J. Med. Biol. Res. 2005, 38, 1663–1667. [CrossRef]55. Mustelin, L.; Lehtokari, V.-L.; Keski-Rahkonen, A. Other specified and unspecified feeding or eating disorders
among women in the community. Int. J. Eat. Disord. 2016, 49, 1010–1017. [CrossRef]56. Riesco, N.; Agüera, Z.; Granero, R.; Jiménez-Murcia, S.; Menchón, J.M.; Fernández-Aranda, F. Other Specified
Feeding or Eating Disorders (OSFED): Clinical heterogeneity and cognitive-behavioral therapy outcome.Eur. Psychiatry 2018, 54, 109–116. [CrossRef]
57. Van Hanswijck de Jonge, P.; van Furth, E.F.; Hubert Lacey, J.; Waller, G. The prevalence of DSM-IV personalitypathology among individuals with bulimia nervosa, binge eating disorder and obesity. Psychol. Med. 2003,33, 1311–1317. [CrossRef] [PubMed]
58. Del Pino-Gutiérrez, A.; Jiménez-Murcia, S.; Fernández-Aranda, F.; Agüera, Z.; Granero, R.; Hakansson, A.;Fagundo, A.B.; Bolao, F.; Valdepérez, A.; Mestre-Bach, G.; et al. The relevance of personality traits inimpulsivity-related disorders: From substance use disorders and gambling disorder to bulimia nervosa.J. Behav. Addict. 2017, 6, 396–405. [CrossRef] [PubMed]
59. Janiri, L.; Martinotti, G.; Dario, T.; Schifano, F.; Bria, P. The gamblers’ Temperament and Character Inventory(TCI) personality profile. Subst. Use Misuse 2007, 42, 975–984. [CrossRef] [PubMed]
60. Wang, Y.; Liu, Y.; Yang, L.; Gu, F.; Li, X.; Zha, R.; Wei, Z.; Pei, Y.; Zhang, P.; Zhou, Y.; et al. Novelty seeking isrelated to individual risk preference and brain activation associated with risk prediction during decisionmaking. Sci. Rep. 2015, 5, 10534. [CrossRef] [PubMed]
61. Stansfield, K.H.; Kirstein, C.L. Effects of novelty on behavior in the adolescent and adult rat. Dev. Psychobiol.2006, 48, 10–15. [CrossRef] [PubMed]
62. Grucza, R.A.; Robert Cloninger, C.; Bucholz, K.K.; Constantino, J.N.; Schuckit, M.I.; Dick, D.M.; Bierut, L.J.Novelty seeking as a moderator of familial risk for alcohol dependence. Alcohol. Clin. Exp. Res. 2006, 30,1176–1183. [CrossRef] [PubMed]
63. Krug, I.; Pinheiro, A.P.; Bulik, C.; Jiménez-Murcia, S.; Granero, R.; Penelo, E.; Masuet, C.; Agüera, Z.;Fernández-Aranda, F. Lifetime substance abuse, family history of alcohol abuse/dependence and noveltyseeking in eating disorders: Comparison study of eating disorder subgroups. Psychiatry Clin. Neurosci. 2009,63, 82–87. [CrossRef] [PubMed]
64. Angres, D.; Nielsen, A. The role of the TCI-R (Temperament Character Inventory) in individualized treatmentplannning in a population of addicted professionals. J. Addict. Dis. 2007, 26 (Suppl. 1), 51–64. [CrossRef]
65. Hilker, I.; Sánchez, I.; Steward, T.; Jiménez-Murcia, S.; Granero, R.; Gearhardt, A.N.; Rodríguez-Muñoz, R.C.;Dieguez, C.; Crujeiras, A.B.; Tolosa-Sola, I.; et al. Food Addiction in Bulimia Nervosa: Clinical Correlatesand Association with Response to a Brief Psychoeducational Intervention. Eur. Eat. Disord. Rev. 2016, 24,482–488. [CrossRef]
106

Nutrients 2019, 11, 2633
66. Agüera, Z.; Krug, I.; Sánchez, I.; Granero, R.; Penelo, E.; Peñas-Lledó, E.; Jiménez-Murcia, S.; Menchón, J.M.;Fernández-Aranda, F. Personality Changes in Bulimia Nervosa after a Cognitive Behaviour Therapy. Eur.Eat. Disord. Rev. 2012, 20, 379–385. [CrossRef]
67. Davis, C.; Curtis, C.; Levitan, R.D.; Carter, J.C.; Kaplan, A.S.; Kennedy, J.L. Evidence that “food addiction” isa valid phenotype of obesity. Appetite 2011, 57, 711–717. [CrossRef] [PubMed]
68. Gearhardt, A.N.; Davis, C.; Kuschner, R.; Brownell, K.D. The addiction potential of hyperpalatable foods.Curr. Drug Abuse Rev. 2011, 4, 140–145. [CrossRef] [PubMed]
69. Schulte, E.M.; Avena, N.M.; Gearhardt, A.N. Which Foods May Be Addictive? The Roles of Processing, FatContent, and Glycemic Load. PLoS ONE 2015, 10, 117959. [CrossRef] [PubMed]
70. Wiss, D.A.; Criscitelli, K.; Gold, M.; Avena, N. Preclinical evidence for the addiction potential of highlypalatable foods: Current developments related to maternal influence. Appetite 2017, 115, 19–27. [CrossRef][PubMed]
71. Treasure, J.; Leslie, M.; Chami, R.; Fernández-Aranda, F. Are trans diagnostic models of eating disordersfit for purpose? A consideration of the evidence for food addiction. Eur. Eat. Disord. Rev. 2018, 26, 83–91.[CrossRef]
72. Berridge, K.C. “Liking” and “wanting” food rewards: Brain substrates and roles in eating disorders. Physiol.Behav. 2009, 97, 537–550. [CrossRef]
73. Kessler, R.M.; Hutson, P.H.; Herman, B.K.; Potenza, M.N. The neurobiological basis of binge-eating disorder.Neurosci. Biobehav. Rev. 2016, 63, 223–238. [CrossRef]
74. Gregorowski, C.; Seedat, S.; Jordaan, G. A clinical approach to the assessment and management of co-morbideating disorders and substance use disorders. BMC Psychiatry 2013, 13, 289. [CrossRef]
75. Fernández-Aranda, F.; Steward, T.; Jimenez-Murcia, S. Substance-Related Disorders in Eating Disorders.In Encyclopedia of Feeding and Eating Disorders; Wade, T., Ed.; Springer: Singapore, 2016; pp. 1–5.
76. Innamorati, M.; Imperatori, C.; Balsamo, M.; Tamburello, S.; Belvederi Murri, M.; Contardi, A.; Tamburello, A.;Fabbricatore, M. Food cravings questionnaire-trait (FCQ-T) discriminates between obese and overweightpatients with and without binge eating tendencies: The italian version of the FCQ-T. J. Pers. Assess. 2014, 96,632–639. [CrossRef]
77. Moreno, S.; Rodríguez, S.; Fernandez, M.C.; Tamez, J.; Cepeda-Benito, A. Clinical validation of the trait andstate versions of the food craving questionnaire. Assessment 2008, 15, 375–387. [CrossRef]
78. Ferrer-Garcia, M.; Pla-Sanjuanelo, J.; Dakanalis, A.; Vilalta-Abella, F.; Riva, G.; Fernandez-Aranda, F.;Sánchez, I.; Ribas-Sabaté, J.; Andreu-Gracia, A.; Escandón-Nagel, N.; et al. Eating behavior style predictscraving and anxiety experienced in food-related virtual environments by patients with eating disorders andhealthy controls. Appetite 2017, 117, 284–293. [CrossRef] [PubMed]
79. Van den Eynde, F.; Koskina, A.; Syrad, H.; Guillaume, S.; Broadbent, H.; Campbell, I.C.; Schmidt, U. Stateand trait food craving in people with bulimic eating disorders. Eat. Behav. 2012, 13, 414–417. [CrossRef][PubMed]
80. Meule, A.; Küppers, C.; Harms, L.; Friederich, H.C.; Schmidt, U.; Blechert, J.; Brockmeyer, T. Foodcue-induced craving in individuals with bulimia nervosa and binge-eating disorder. PLoS ONE 2018,13, e0204151. [CrossRef] [PubMed]
81. Giel, K.E.; Speer, E.; Schag, K.; Leehr, E.J.; Zipfel, S. Effects of a food-specific inhibition training in individualswith binge eating disorder—Findings from a randomized controlled proof-of-concept study. Eat. WeightDisord. 2017, 22, 345–351. [CrossRef]
82. Turton, R.; Nazar, B.P.; Burgess, E.E.; Lawrence, N.S.; Cardi, V.; Treasure, J.; Hirsch, C.R. To Go or Not toGo: A Proof of Concept Study Testing Food-Specific Inhibition Training for Women with Eating and WeightDisorders. Eur. Eat. Disord. Rev. 2018, 26, 11–21. [CrossRef]
83. Arias Horcajadas, F.; Sánchez Romero, S.; Gorgojo Martínez, J.J.; Almódovar Ruiz, F.; Fernández Rojo, S.;Llorente Martin, F. Clinical differences between morbid obese patients with and without binge eating. Actasespañolas Psiquiatr. 2006, 34, 362–370.
84. Fandiño, J.; Moreira, R.O.; Preissler, C.; Gaya, C.W.; Papelbaum, M.; Coutinho, W.F.; Appolinario, J.C. Impactof binge eating disorder in the psychopathological profile of obese women. Compr. Psychiatry 2010, 51,110–114. [CrossRef]
85. Fichter, M.M.; Quadflieg, N.; Brandl, B. Recurrent overeating: An empirical comparison of binge eatingdisorder, bulimia nervosa, and obesity. Int. J. Eat. Disord. 1993, 14, 1–16. [CrossRef]
107

Nutrients 2019, 11, 2633
86. Villarejo, C.; Jiménez-Murcia, S.; Álvarez-Moya, E.; Granero, R.; Penelo, E.; Treasure, J.; Vilarrasa, N.;Gil-Montserrat de Bernabé, M.; Casanueva, F.F.; Tinahones, F.J.; et al. Loss of Control over Eating: ADescription of the Eating Disorder/Obesity Spectrum in Women. Eur. Eat. Disord. Rev. 2014, 22, 25–31.[CrossRef]
87. Álvarez-Moya, E.M.; Jiménez-Murcia, S.; Granero, R.; Vallejo, J.; Krug, I.; Bulik, C.M.; Fernández-Aranda, F.Comparison of personality risk factors in bulimia nervosa and pathological gambling. Compr. Psychiatry2007, 48, 452–457. [CrossRef]
88. Fassino, S.; Daga, G.A.; Pierò, A.; Leombruni, P.; Rovera, G.G. Anger and personality in eating disorders.J. Psychosom. Res. 2001, 51, 757–764. [CrossRef]
89. Brockmeyer, T.; Hahn, C.; Reetz, C.; Schmidt, U.; Friederich, H.C. Approach bias and cue reactivity towardsfood in people with high versus low levels of food craving. Appetite 2015, 95, 197–202. [CrossRef] [PubMed]
90. Hetherington, M.M.; Macdiarmid, J.I. Pleasure and excess: Liking for and overconsumption of chocolate.Physiol. Behav. 1995, 57, 27–35. [CrossRef]
91. Sevinçer, G.M.; Konuk, N.; Bozkurt, S.; Coskun, H. Food addiction and the outcome of bariatric surgery at1-year: Prospective observational study. Psychiatry Res. 2016, 244, 159–164. [CrossRef]
92. Heriseanu, A.I.; Hay, P.; Corbit, L.; Touyz, S. Grazing in adults with obesity and eating disorders: A systematicreview of associated clinical features and meta-analysis of prevalence. Clin. Psychol. Rev. 2017, 58, 16–32.[CrossRef]
93. White, M.A.; Grilo, C.M. Psychometric properties of the Food Craving Inventory among obese patients withbinge eating disorder. Eat. Behav. 2005, 6, 239–245. [CrossRef]
94. Grilo, C.M. The assessment and treatment of binge eating disorder. J. Pract. Psychiatry Behav. Health 1998, 4,191–201. [CrossRef]
95. Ng, L.; Davis, C. Cravings and food consumption in binge eating disorder. Eat. Behav. 2013, 14, 472–475.[CrossRef]
96. Davis, C.A.; Levitan, R.D.; Reid, C.; Carter, J.C.; Kaplan, A.S.; Patte, K.A.; King, N.; Curtis, C.; Kennedy, J.L.Dopamine for “wanting” and opioids for liking: A comparison of obese adults with and without bingeeating. Obesity 2009, 17, 1220–1225. [CrossRef]
97. Eldredge, K.L.; Agras, W.S. Weight and shape overconcern and emotional eating in binge eating disorder.Int. J. Eat. Disord. 1996, 19, 73–82. [CrossRef]
98. Geliebter, A.; Aversa, A. Emotional eating in overweight, normal weight, and underweight individuals. Eat.Behav. 2003, 3, 341–347. [CrossRef]
99. Polivy, K.; Herman, C. Etiology of binge eating: Psychological mechanisms. In Binge Eating: Nature,Assessment, and Treatment; Fairburn, C., Wilson, G., Eds.; Guilford Press: New York, NY, USA, 1993;pp. 173–205.
100. Greeno, C.G.; Wing, R.R.; Shiffman, S. Binge antecedents in obese women with and without binge eatingdisorder. J. Consult. Clin. Psychol. 2000, 68, 95–102. [CrossRef] [PubMed]
© 2019 by the authors. Licensee MDPI, Basel, Switzerland. This article is an open accessarticle distributed under the terms and conditions of the Creative Commons Attribution(CC BY) license (http://creativecommons.org/licenses/by/4.0/).
108

nutrients
Article
Food Addiction Is Associated with Irrational Beliefsvia Trait Anxiety and Emotional Eating
Laurence J. Nolan * and Steve M. Jenkins
Department of Psychology, Wagner College, 1 Campus Rd., Staten Island, NY 10301, USA* Correspondence: [email protected]; Tel.: +1-718-390-3358
Received: 31 May 2019; Accepted: 22 July 2019; Published: 25 July 2019
Abstract: Irrational beliefs (IB) are believed, in cognitive behavioral therapies, to be a prime causeof psychopathologies including anxiety, depression, problem eating, and alcohol misuse. “Foodaddiction” (FA), which has been modeled on diagnostic criteria for substance use disorder, andemotional eating (EE) have both been implicated in the rise in overweight and obesity. Both FA andEE are associated with anxiety. Thus, in the present study, the hypothesis that IB is associated withFA and with EE was tested. Furthermore, possible mediation of these relationships by trait anxietyand depression (and EE for IB and FA) was examined. The responses of 239 adult participants toquestionnaires measuring FA, IB, EE, depression, trait anxiety, and anthropometrics were recorded.The results revealed that IB was significantly positively correlated with FA and EE (and depressionand trait anxiety). Furthermore, only EE mediated the effect of IB on FA and this was not moderatedby BMI. Finally, trait anxiety (but not depression) mediated the effect of IB on EE. Exploratory analysisrevealed a significant serial mediation such that IB predicted higher FA via elevated trait anxiety andemotional eating in that order. The results of this study suggest that IB may be a source of the anxietythat is associated with EE and FA and suggest that clinicians may find IB a target for treatment ofthose persons who report experiences of EE and FA. IB may play a role in food misuse that leads toelevated BMI.
Keywords: food addiction; irrational beliefs; emotional eating; anxiety; food misuse
1. Introduction
“Food addiction” (FA) has been suggested as a factor in the increased prevalence of overweightand obesity. Proponents of FA suggest that some energy-dense highly palatable foods (or specificadditives to foods such as salt or refined sugar) generate addiction-like behaviors in those who consumethem [1]. FA, as measured by the Yale Food Addiction Scale (YFAS), is associated with binge eatingbehavior (BED) [2–4], bulimia nervosa [5], night eating syndrome [6], and with elevated BMI even inthe absence of BED [4,7,8]. The FA concept is not without controversy. Some critics prefer an alternatedescription that focuses on the behavior (i.e., “eating addiction”) and suggest there is little evidencefor an addicting substance in food. They instead suggest that overeating may be a form of habitualfood “abuse” [9] or represent a possible food use disorder [10]. Others have suggested that there is notenough evidence yet to conclude that FA is a distinct entity that explains overeating [11]. Nonetheless,there has been significant interest in FA in the scientific community in recent years [12]. The YFAS,which was based on DSM IV substance dependence criteria, has now been updated to reflect thesubstance use disorder criteria described in the DSM-5 and dubbed the YFAS2 (which has since beenprovided in a shortened form [13]).
In cognitive behavioral therapies (CBT), irrational beliefs are believed to be a prime cause ofpsychopathologies including problem eating and addictive behavior. Ellis [14] and Beck [15] proposedthat individuals often have habitual affect-eliciting thought patterns (referred to as irrational beliefs by
Nutrients 2019, 11, 1711; doi:10.3390/nu11081711 www.mdpi.com/journal/nutrients109

Nutrients 2019, 11, 1711
Ellis) that can lead to dysfunctional emotional and/or behavioral responses. These irrational beliefsoriginate from a core process of perfectionism [14] or absolutist thinking [16] and the idea that oneshould be extremely upset when things go wrong and that it is crucial to be successful and approvedof by everyone [15]. This absolutist thinking inevitably leads to anxiety and, in turn, may lead toirrational coping strategies such as substance use and uncontrolled eating typified by emotional eatingand FA.
In a meta-analysis of 100 independent samples, irrational beliefs were found to be moderatelycorrelated with psychological distress [17]. More specifically, irrational beliefs were associated withtrait anxiety [18,19]. While Rohsenow and Smith [18] did not find a connection between irrationalbeliefs and depression (as measured by Minnesota Multiphasic Personality Inventory), in daily reportsof mood over several months, there was an association of irrational beliefs and reports of depression.Others reported that irrational beliefs were related to depression as measured by the Beck DepressionInventory in a sample of women [20]. Mayhew and Edeleman [21] found that irrational beliefs werepredictive of poor coping strategies and low self-esteem. Irrational beliefs have been associated withaddictive behaviors such as drug misuse [22–25] and problem gambling (see [26] for review) although,in the gambling studies, irrational beliefs are often assessed using different measures than they are instudies of depression and anxiety.
Several studies (mostly involving samples of undergraduate women without eating disorderdiagnoses) have reported a link between irrational beliefs and problem eating. Ruderman [27] reportedthat irrational beliefs were associated with dietary restraint (the cognitive control of food consumptionas measured by the Revised Restraint Scale or RRS), particularly the concern with dieting subscale.Studies examining the relationship between irrational beliefs and subclinical eating disorder symptomsare more common. Irrational beliefs predicted a number of bulimia symptoms in undergraduatewomen [20,28,29]. In addition, irrational beliefs were found to be predictive of drive for thinness, bodydissatisfaction, ineffectiveness, and poor interceptive awareness as measured by the Eating DisordersInventory [21]. More recently, Tomotaki et al. [30] reported that obsession with eating, dieting, andobese-phobia were predicted by irrational beliefs. Irrational beliefs were found to be higher in womenwith high body dissatisfaction when compared to a group diagnosed with eating disorders and a groupwith low body dissatisfaction [31].
While irrational beliefs have been associated with dietary restraint, it has not been examined inrelation to emotional eating. Emotional eating is generally viewed as a response to negative emotionor distress [32,33] or ego-threat [34], and has been associated with overeating, binge eating, bulimianervosa, and obesity (see [32]). There is a positive association between emotional eating and anxietyin persons with obesity (but not in persons with a BMI between 18 and 25) [35] and in a sample ofchildren and adolescents [36]. Irrational beliefs and depression were positively correlated in a sampleof women [37]. Thus, irrational beliefs may be associated with emotional eating, possibly as the sourceof anxiety and/or depression.
The research findings described above suggest that irrational beliefs could predict FA andemotional eating. If they do, it is likely that there would be mediating variables. FA is positivelycorrelated to depression in persons with obesity. Furthermore, FA has been associated with depressionin persons with obesity [2,3] and in students and the general population [6,38]. FA has also previouslybeen associated with emotional eating [1,2] and with anxiety [39]. The present study was conducted todetermine whether the presence of irrational beliefs predicts higher FA symptoms. Furthermore, ifsuch a relationship exists, it may be mediated by depression, trait anxiety, and/or emotional eating,and may depend on BMI. Absolutist irrational beliefs are predicted to produce psychological distressvia activation of anxiety. Maladaptive responses such as emotional or uncontrolled eating (e.g., FA)may occur in response to this anxiety. Thus, the following hypotheses (H) were tested. Irrationalbeliefs and FA are positively correlated (H1). Furthermore, the effect of irrational beliefs on FA ismediated by trait anxiety, depression, and/or emotional eating (H1a). It was also hypothesized thatthere would be a positive relationship between irrational beliefs and emotional eating (H2) and that
110

Nutrients 2019, 11, 1711
the effect of irrational beliefs on emotional eating is mediated by trait anxiety and/or depression (H2a).Finally, it was hypothesized that there would be a moderation of these relationships by BMI; thatthe effect of irrational beliefs would depend on the value of BMI (H3). Moderation by gender wasalso hypothesized but not examined in the present study due to the relatively low number of men inthe sample.
2. Materials and Methods
2.1. Participants
The participants were 239 adults; the sample included individuals who identified as women(n = 176), men (n = 60), or as having non-binary gender (n = 3). The sample was mostly composed ofundergraduate students. The mean age of participants was 20.72 years (SEM = 0.42; range = 18–57)and their mean BMI was 24.07 kg/m2 (SEM = 0.32; 5.4% had a BMI less than 18.5; 62.3% between 18.5and 24.9; 20.9% were between 25 and 29.9; 11.3% ≥ 30). When asked in an open-ended question todescribe their ethnic or racial background, participants described themselves as having Arab (1.3%),African (6.3%), Asian (4.2%), European (73.2%), South Asian (3.8%), or more than one primary (4.6%)ancestry. In addition, some of the participants (6.7%) also indicated Hispanic ancestry. In total, 17.8%of the participants met the criteria for FA. In total, 20.9% of the sample had a depression score of 50 orhigher suggesting the presence of depression. See Table 1 for mean scores on questionnaires.
2.2. Measures
2.2.1. Food Addiction
FA was assessed by the Modified Yale Food Addiction Scale 2.0 (mYFAS2) which is designed toevaluate indications of “addiction” toward foods according to the DSM-5 criteria for substance usedisorder but with fewer questions than the YFAS 2.0 [13]. The mYFAS2 has been validated againstquestionnaires that measure related constructs, and has a Kuder–Richardson’s alpha of 0.86. In thepresent study, Kuder–Richardson’s alpha was 0.77. The mYFAS2 has 13 items (11 for FA symptomsand 2 for distress) and is scored by counting the number of diagnostic criteria that are met. A personis considered to have FA when 3 or more of the criteria are met, and there is impairment or distresspresent. In analyses presented below, the mYFAS2 was entered as a continuous variable (number ofsymptoms).
2.2.2. Irrational Beliefs
Irrational beliefs were measured by the Shortened General Attitude and Belief Scale (SGABS) [40].The SGABS is a 26-item scale that uses Likert-type ratings with responses ranging from 1 (stronglydisagree) to 5 (strongly agree). The SGABS has one rational beliefs subscale and six irrationality subscales(need for achievement, need for approval, need for comfort, demand for fairness, self-downing, andother downing) that are summed to create a total irrationality score (higher scores indicate strongerirrational beliefs). Several instruments are available to measure irrational beliefs, some of which maybe more sensitive to affect than to cognitions (for a review see [41]). The SGABS is based on the Ellismodel of psychopathology [41] and its score has been shown to be less affected by mood than someprevious measures [40]. The reliability for this sample was very good (Cronbach’s α = 0.86).
2.2.3. Eating Styles
Eating styles were measured by the Dutch Eating Behavior Questionnaire (DEBQ) which containsthree subscales: restrained eating (DEBQr), emotional eating (DEBQe), and external eating (DEBQx) [42].All 33 questions are rated on a 5-point Likert-type scale with “never” and “very often” as the anchors.The restraint (cognitive restraint of eating) and external eating (eating in the presence of external cues)scales each have 10 items while the DEBQe contains 13 items. Score for each subscale is the mean
111

Nutrients 2019, 11, 1711
rating. In the present sample, the Cronbach’s α for the DEBQe, DEBQr, and DEBQx were 0.94, 0.79,and 0.94 respectively.
2.2.4. Trait Anxiety
Trait anxiety was measured using the State-Trait Anxiety Inventory for Adults (STAI) [43]. TheSTAI differentiates between trait anxiety and state anxiety with 40 items (4-point Likert-type scale)regarding how participants generally feel (trait) and how they feel at this moment (state). Only thetrait measure was used in the statistical analysis. In the present study, the Cronbach’s α was 0.93.
2.2.5. Depression
Depression was assessed using the Self-report Depression Scale (SDS) [44]. The SDS score is thesum of responses to 20 questions to which the participant responds on a 4-point Likert-type scale.The total score can range from 20 to 80 with most depressed persons scoring between 50 and 69 [45].The Cronbach’s α for the SDS was 0.87 for this sample.
2.3. Procedure
The hypotheses were pre-registered with the Open Science Framework after data collection hadcommenced but prior to examination of the data (doi: 10.17605/OSF.IO/QWSRD). The procedure wasapproved by the Wagner College Human Experimentation Review Board (code F18–10).
All participants completed questionnaires using an online platform (Qualtrics, Provo, UT, USA).Questionnaires were presented in randomized order after informed consent was obtained. Questionsregarding age, height and weight, gender, and ethnicity were presented after questionnaires. Allparticipants were debriefed as to the purpose of the study after the survey was completed. In thedebriefing, none of the participants appeared to be aware of the study’s purpose. Students participatedin groups at scheduled times in a computer laboratory as one way to complete a research requirementfor an introductory psychology course (n = 174). Other participants were recruited via the universitydaily email bulletin and via a link (which took them to the same website on the university server asthat used by the students) posted on Facebook. These participants were entered into a lottery to winone of four $25 gift cards if they wished.
2.4. Data Analysis
To ensure quality of data, records were screened for inappropriate responses to open-endedquestions, lack of response variation (e.g., giving the same answer to all questions), and unusuallyshort survey completion times.
Statistical analysis was performed using IBM SPSS (version 24). The variables were first correlatedto establish whether there was a relationship between irrational beliefs and FA and whether each wascorrelated to trait anxiety, depression, eating styles, and BMI. Then, mediation multiple regressionanalysis was conducted using the PROCESS plug-in for SPSS (release 2.16.3) [46] using 5000 bootstrapsamples. Variables were mean-centered and heteroscedasticity-consistent standard errors were used.Residuals were checked for stochasticity prior to the analysis. The unstandardized beta coefficients (B),confidence intervals (CI) and adjusted R2 are reported. Planned analysis included testing whetherthe relationship between irrational beliefs and FA was mediated by emotional eating, trait anxiety,and/or depression and whether these would be moderated by BMI. That is, the causal hypothesiswas that irrational beliefs produce an elevation in FA by increasing trait anxiety, depression, and/oremotional eating. Furthermore, the mediation of the effect of irrational beliefs on emotional eating bytrait anxiety and/or depression was also examined (the hypothesis that irrational beliefs cause elevatedemotional eating by increasing trait anxiety and/or depression). The results of these analyses led toan exploratory analysis of the indirect pathway between irrational beliefs, trait anxiety, depression,emotional eating, and FA in that order (serial mediation). This final analysis tested the hypothesis that
112

Nutrients 2019, 11, 1711
irrational beliefs increase FA symptoms via a pathway from higher trait anxiety and/or depression tohigher emotional eating.
3. Results
3.1. Confirmatory Analyses
3.1.1. Correlations
To examine the relationships among the questionnaire variables and test hypotheses H1 and H2,Pearson correlation coefficients were performed. The results indicated that irrational beliefs werepositively correlated with all measures (most strongly with depression and trait anxiety; see Table 1).Correlation coefficients indicated that body mass index was significantly positively correlated onlywith dietary restraint and FA and not with irrational beliefs or other measures (see Table 2).
Table 1. Pearson correlation coefficients among and descriptive statistics for the questionnaire measures.
Measure SGABS DEBQe DEBQx DEBQr SDS mYFAS2 STAI
SGABS 0.298 4 0.166 1 0.242 2 0.498 4 0.282 3 0.601 4
DEBQe 0.530 4 0.388 4 0.338 4 0.485 4 0.422 4
DEBQx 0.219 2 0.039 0.409 4 0.057DEBQr 0.182 1 0.328 4 0.240 2
SDS 0.342 4 0.800 4
mYFAS2 0.362 4
Mean 59.09 2.38 3.06 2.81 40.91 1.62 43.87SEM 0.79 0.06 0.04 1.01 0.66 0.14 0.79
1 p ≤ 0.01, 2 p ≤ 0.001, 3 p < 0.0001, 4 p < 0.00001. SGABS: Shortened General Attitude Belief Scale. DEBQe: DutchEating Behavior Questionnaire Emotional Eating. DEBQx: Dutch Eating Behavior Questionnaire External Eating.DEBQr: Dutch Eating Behavior Questionnaire Restrained Eating. SDS: Self-report Depression Scale. mYFAS2:Modified Food Addiction Scale 2.0. STAI: State-Trait Anxiety Inventory.
Table 2. Pearson correlation coefficients among the questionnaire measures and body mass index (BMI).
Measure SGABS DEBQe DEBQx DEBQr SDS mYFAS2 STAI
BMI −0.020 0.082 0.037 0.161 1 −0.024 0.269 2 0.0321 p < 0.05, 2 p < 0.0001. SGABS: Shortened General Attitude Belief Scale. DEBQe: Dutch Eating BehaviorQuestionnaire Emotional Eating. DEBQx: Dutch Eating Behavior Questionnaire External Eating. DEBQr: DutchEating Behavior Questionnaire Restrained Eating. SDS: Self-report Depression Scale. mYFAS2: Modified FoodAddiction Scale 2.0. STAI: State-Trait Anxiety Inventory.
3.1.2. Multiple Regression Mediation Analysis
Multiple Mediation of the Effect of Irrational Beliefs on FA
Multiple mediation analysis (PROCESS model 4) was used to determine whether the effect ofirrational beliefs on FA was mediated by depression, trait anxiety, and/or emotional eating (H1a).BMI was included as a covariate because of its correlation with the criterion variable, FA. The results(see Figure 1) indicated that, although irrational beliefs significantly predicted elevated scores ondepression, trait anxiety, and emotional eating measures, only emotional eating mediated the effect;there was a significant indirect effect of irrational beliefs on FA through emotional eating (B = 0.02;95%CI: 0.010–0.034) but not though trait anxiety (B = 0.00; 95%CI: −0.021–0.021) or depression (B = 0.02;95%CI: −0.001–0.035). In the mediation model, there was no significant direct effect of irrational beliefson FA (B = 0.02, t = 1.17, p = 0.242; 95%CI: −0.010–0.040). The total effect was statistically significant(B = 0.05, t = 4.20, p < 0.001; 95%CI: 0.027–0.074).
113

Nutrients 2019, 11, 1711
Figure 1. The relationship between irrational beliefs and food addiction (FA) is mediated by emotionaleating but not depression or trait anxiety. Solid arrows indicate statistically significant regressioncoefficients. Nonsignificant BMI effects on mediators are not included for simplicity.
Moderated Mediation by BMI of the Effect of Irrational Beliefs on FA
In order to examine whether BMI moderated the direct and indirect (e.g., through emotionaleating) effects of irrational beliefs on FA (H3), BMI was added to the model presented above as amoderator (a moderated mediation model, PROCESS model 15). The results of this analysis againshowed emotional eating to be the only significant mediator of the effect of irrational beliefs on FA andindicated that there were no significant interactions between BMI and other effects on FA (see Figure 2).There was no significant conditional direct effect of irrational beliefs on FA at mean-1SD, mean, andmean+1SD values of BMI. In addition, there was a statistically significant conditional indirect effect ofirrational beliefs on FA at mean-1SD BMI (95%CI: 0.008–0.037), mean BMI (95%CI: 0.009–0.034) andmean+1SD BMI (95%CI: 0.007–0.038); each coefficient was virtually identical (B = 0.019). The index formoderated mediation was not statistically significant (95%CI: −0.0017–0.0017). Finally, there was nomoderation of the nonsignificant mediated effects of depression and trait anxiety on FA.
Figure 2. The statistical model for the moderated mediation of the effect of irrational beliefs on FA withBMI as moderator. Solid arrows indicate statistically significant regression coefficients. Nonsignificantmediator variables and BMI effects on mediators are not shown for simplicity.
114

Nutrients 2019, 11, 1711
Multiple Mediation of the Effect of Irrational Beliefs on Emotional Eating
Mediation analysis (PROCESS model 4) was used to determine whether the effect of irrationalbeliefs on emotional eating was mediated by depression and/or trait anxiety (H2a). The resultsindicated that, although irrational beliefs significantly predicted elevated scores on depression andtrait anxiety, only the latter mediated the effect of irrational beliefs on FA (see Table 3). There was asignificant indirect effect of irrational beliefs on emotional eating through trait anxiety (B = 0.02; 95%CI:0.006–0.027) but not through depression (B = 0.00; 95%CI: −0.007–0.007; see Figure 3). In the mediationmodel, there was no significant direct effect of irrational beliefs on emotional eating (B = 0.01, t = 0.83,p = 0.406; 95%CI: −0.007–0.016). The total effect was statistically significant (B = 0.02, t = 4.69, p < 0.001,95%CI: 0.012–0.030).
Table 3. Multiple mediation model predicting DEBQe from SGABS. Total effect: R2 = 0.181, F(3,235) =15.98, p < 0.0001.
Predictor
Mediator: STAIR2 = 0.362, F(1,237) = 148.52, p < 0.0001
95%Confidence Interval
Coeff. SE p Lower Upper
SGABS 0.602 0.049 <0.0001 0.505 0.670
Mediator: SDSR2 = 0.248, F(1,237) = 75.85, p < 0.0001
SGABS 0.413 0.048 <0.0001 0.320 0.507
Criterion: DEBQeR2 = 0.182, F(3,235) = 15.98, p < 0.0001
SGABS 0.005 0.006 0.406 −0.007 0.016STAI 0.027 0.009 0.002 0.010 0.044SDS 0.000 0.008 0.989 −0.017 0.016
STAI: State-Trait Anxiety Inventory. SDS: Self-report Depression Scale. DEBQe: Dutch Eating Behavior QuestionnaireEmotional Eating. SGABS: Shortened General Attitude Belief Scale.
Figure 3. The relationship between irrational beliefs and emotional eating is mediated by trait anxietybut not depression. Solid arrows indicate statistically significant regression coefficients.
3.2. Exploratory Analyses: Serial Mediation of the Effect of Irrational Beliefs on FA
The results presented above indicate a strong relationship between irrational beliefs and depressionand trait anxiety but neither predicted FA. Because irrational beliefs are associated with emotionaleating via trait anxiety and anxiety and depressed mood have been associated with emotional eating, anadditional serial mediation analysis was conducted. Based on the results of the planned correlationaland mediation analyses presented above, the hypothesis that the indirect pathway between irrational
115

Nutrients 2019, 11, 1711
beliefs and FA would include trait anxiety and depression was examined. Specifically, it was proposedthat irrational beliefs would increase trait anxiety which, in turn, would increase depression. Depressionand/or trait anxiety was expected to increase emotional eating which, in turn, would increase higherfood addiction. BMI was included as a covariate in the model because of its correlation with FA. Theresults of this analysis (PROCESS model 6; see Table 4) largely supported this hypothesis with theexception that depression was not associated with elevated emotional eating. As depicted in Figure 4,there was a significant indirect effect of irrational beliefs on food addiction through trait anxiety andemotional eating (B = 0.02; 95%CI: 0.007–0.028). While trait anxiety was a significant predictor ofhigher depression score (B = 0.65, t = 15.56, p < 0.001; 95%CI: 0.568–0.732), the indirect path includingdepression was not statistically significant (B = 0.00; 95%CI: −0.006–0.007).
Table 4. Serial mediation analysis predicting mYFAS2 from SGABS. Total effect: R2 = 0.155,F(2,236) = 16.93, p < 0.0001.
Predictor
Mediator: STAIR2 = 0.363, F(2,236) = 72.58, p < 0.0001
95%Confidence Interval
Coeff. SE p Lower Upper
SGABS 0.603 0.050 <0.0001 0.504 0.702BMI 0.109 0.171 0.525 −0.227 0.445
Mediator: SDSR2 = 0.643, F(3,235) = 180.88, p < 0.0001
SGABS 0.020 0.044 0.656 −0.067 0.106STAI 0.653 0.042 <0.0001 0.570 0.735BMI −0.100 0.083 0.229 −0.263 0.063
Mediator: DEBQeR2 = 0.186, F(4,234) = 13.03, p < 0.0001
SGABS 0.005 0.006 0.387 −0.007 0.017STAI 0.026 0.009 0.004 0.008 0.043SDS 0.001 0.008 0.933 −0.016 0.017BMI 0.013 0.120 0.299 −0.011 0.036
Criterion: mYFAS2R2 = 0.334, F(5,233) = 14.51, p < 0.0001
SGABS 0.015 0.013 0.242 −0.010 0.040STAI 0.001 0.018 0.964 −0.035 0.037SDS 0.037 0.022 0.092 −0.006 0.079DEBQe 0.947 0.194 <0.0001 0.565 1.328BMI 0.105 0.026 .0001 0.054 0.157
STAI: State-Trait Anxiety Inventory. SGABS: Shortened General Attitude Belief Scale. SDS: Self-report DepressionScale. DEBQe: Dutch Eating Behavior Questionnaire Emotional Eating. mYFAS2: Modified Food AddictionScale 2.0.
116
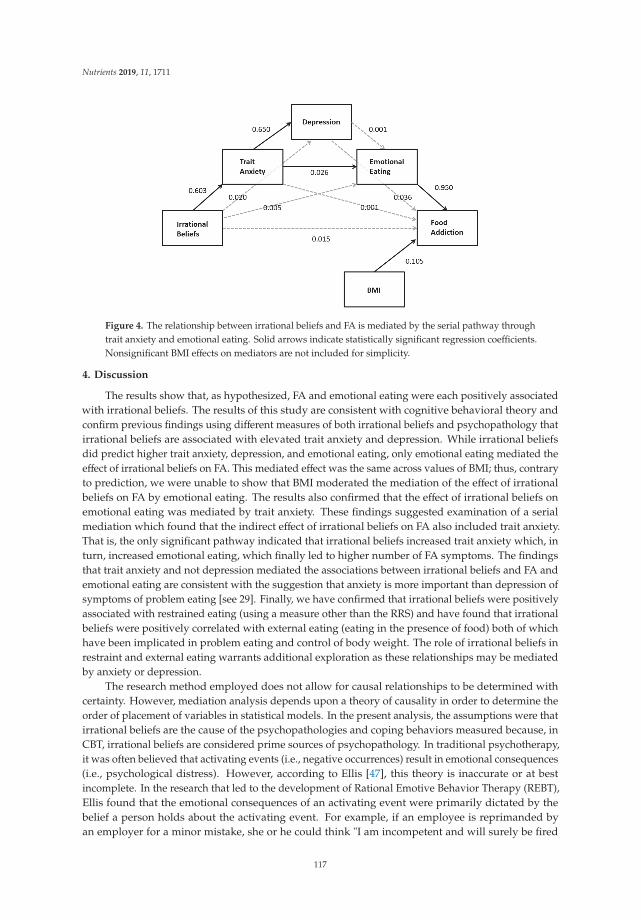
Nutrients 2019, 11, 1711
Figure 4. The relationship between irrational beliefs and FA is mediated by the serial pathway throughtrait anxiety and emotional eating. Solid arrows indicate statistically significant regression coefficients.Nonsignificant BMI effects on mediators are not included for simplicity.
4. Discussion
The results show that, as hypothesized, FA and emotional eating were each positively associatedwith irrational beliefs. The results of this study are consistent with cognitive behavioral theory andconfirm previous findings using different measures of both irrational beliefs and psychopathology thatirrational beliefs are associated with elevated trait anxiety and depression. While irrational beliefsdid predict higher trait anxiety, depression, and emotional eating, only emotional eating mediated theeffect of irrational beliefs on FA. This mediated effect was the same across values of BMI; thus, contraryto prediction, we were unable to show that BMI moderated the mediation of the effect of irrationalbeliefs on FA by emotional eating. The results also confirmed that the effect of irrational beliefs onemotional eating was mediated by trait anxiety. These findings suggested examination of a serialmediation which found that the indirect effect of irrational beliefs on FA also included trait anxiety.That is, the only significant pathway indicated that irrational beliefs increased trait anxiety which, inturn, increased emotional eating, which finally led to higher number of FA symptoms. The findingsthat trait anxiety and not depression mediated the associations between irrational beliefs and FA andemotional eating are consistent with the suggestion that anxiety is more important than depression ofsymptoms of problem eating [see 29]. Finally, we have confirmed that irrational beliefs were positivelyassociated with restrained eating (using a measure other than the RRS) and have found that irrationalbeliefs were positively correlated with external eating (eating in the presence of food) both of whichhave been implicated in problem eating and control of body weight. The role of irrational beliefs inrestraint and external eating warrants additional exploration as these relationships may be mediatedby anxiety or depression.
The research method employed does not allow for causal relationships to be determined withcertainty. However, mediation analysis depends upon a theory of causality in order to determine theorder of placement of variables in statistical models. In the present analysis, the assumptions were thatirrational beliefs are the cause of the psychopathologies and coping behaviors measured because, inCBT, irrational beliefs are considered prime sources of psychopathology. In traditional psychotherapy,it was often believed that activating events (i.e., negative occurrences) result in emotional consequences(i.e., psychological distress). However, according to Ellis [47], this theory is inaccurate or at bestincomplete. In the research that led to the development of Rational Emotive Behavior Therapy (REBT),Ellis found that the emotional consequences of an activating event were primarily dictated by thebelief a person holds about the activating event. For example, if an employee is reprimanded byan employer for a minor mistake, she or he could think "I am incompetent and will surely be fired
117

Nutrients 2019, 11, 1711
from my job, and then no one will ever want to hire me!" The emotional consequence of such a beliefwould most likely be a significant level of anxiety. If that same person had the more rational thought"It is unfortunate that I made a mistake, but I am human so it will happen sometimes. It is highlyunlikely that I will be fired if I make a minor mistake once in a while.", the emotional consequencewould likely be one of mild concern or annoyance. Hence, one’s emotional state is usually the resultof how he or she interprets an event, rather than the event itself. Ellis [47] found that individualswho frequently interpret reality from a distorted, or irrational, perspective are likely to have anxietyor depressive disorders. He also found that when people are emotionally disturbed, they seek outways to cope with the distress. Coping mechanisms can be adaptive (i.e., make appropriate changes,practice acceptance, exercise, etc.) or maladaptive (i.e., substance use, self-harm, uncontrolled eating).Indeed, some persons may eat to regulate mood and escape anxiety [48,49].
Irrational beliefs-based uncontrolled eating may not necessarily lead to weight gain; in the presentstudy, irrational beliefs were not correlated with BMI. The research on the relationship betweenirrational beliefs and alcohol consumption indicates that irrational beliefs are associated with problemswith alcohol use and not amount of alcohol used [22,23] or frequency of use or getting drunk [24].Furthermore, perceived lack of control over alcohol use is correlated with irrational beliefs [24]. Thisis interesting in relation to FA as, unlike alcohol consumption, everyone needs to eat food but thosewith FA constitute a subset of people who have problem eating who often feel that they cannot controleating. Indeed, lack of control over eating is the most commonly reported FA symptom [50]. Irrationalbeliefs may lead to FA; FA is common in those with high BMI [7]. It is important to determine whetherirrational beliefs are associated with energy consumption from food which may lead to higher BMI insome people. Recent findings suggest that psychological distress is associated with elevated BMI viahigher FA and emotional eating [51]. Irrational beliefs may be a source of that psychological distress.
This study has several limitations. While mediation models often use causal wording (i.e., directand indirect “effects”), the results are correlational and the direction of effect speculative. The sampleis composed mostly of students who report having normal body weight. While students are of interestin the study of anxiety and other psychopathology due to high rates of anxiety, depression [52,53] andproblem eating [54], their overrepresentation in the present study may limit the generalizability of thefindings. Furthermore, while significant, the conditional effects are somewhat weak which may be dueto the relatively low percentage of people with BMI greater than 25. In addition, while nearly a fifth ofthe sample meets the criterion for FA, the number of symptoms is rather low in the sample as a whole.Given the association of emotional eating and FA in persons with high BMI, the relationships reportedhere would be expected to be higher in those with high BMI.
5. Conclusions
In conclusion, these results suggest for the first time that irrational beliefs may underlie problemeating such as emotional eating and FA via trait anxiety. Additional research may consider whetheranxiety sensitivity, the fear that somatic arousal leads to catastrophic consequences, more stronglymediates the relationship between irrational beliefs and FA than trait anxiety. Anxiety sensitivity isdistinct from trait anxiety and has been related to substance misuse and emotional eating, particularlyin those with high BMI [55]. The results of the present study also suggest that irrational beliefs maybe an appropriate target for clinicians when treating problem eating; CBT is an effective approach intreatment of addictive behaviors and problem eating [56].
Author Contributions: Conceptualization, L.J.N. and S.M.J.; Formal analysis, L.J.N.; Investigation, L.J.N.;Methodology, L.J.N. and S.M.J.; Project administration, L.J.N.; Visualization, L.J.N.; Writing—original draft, L.J.N.;Writing—review and editing, L.J.N. and S.M.J.
Funding: This research received no external funding.
Conflicts of Interest: The authors declare no conflict of interest.
118

Nutrients 2019, 11, 1711
References
1. Gearhardt, A.N.; Corbin, W.R.; Brownell, K.D. Preliminary validation of the Yale food addiction scale.Appetite 2009, 52, 430–436. [CrossRef] [PubMed]
2. Davis, C.; Curtis, C.; Levitan, R.D.; Carter, J.C.; Kaplan, A.S.; Kennedy, J.L. Evidence that ‘food addiction’ is avalid phenotype of obesity. Appetite 2011, 57, 711–717. [CrossRef] [PubMed]
3. Gearhardt, A.N.; White, M.A.; Masheb, R.M.; Morgan, P.T.; Crosby, R.D.; Grilo, C.M. An examination of thefood addiction construct in obese patients with binge eating disorder. Int. J. Eat. Disord. 2012, 45, 657–663.[CrossRef] [PubMed]
4. Gearhardt, A.N.; Boswell, R.G.; White, M.A. The association of “food addiction” with disordered eating andbody mass index. Eat. Behav. 2014, 15, 427–433. [CrossRef] [PubMed]
5. De Vries, S.K.; Meule, A. Food addiction and bulimia nervosa: New data based on the Yale Food AddictionScale 2.0. Eur. Eat. Disord. Rev. 2016, 24, 518–522. [CrossRef] [PubMed]
6. Nolan, L.J.; Geliebter, A. “Food addiction” is associated with night eating severity. Appetite 2016, 98, 89–94.[CrossRef] [PubMed]
7. Meule, A. How prevalent is “food addiction”? Front. Psychiatry 2011, 2, 61. [CrossRef] [PubMed]8. Pedram, P.; Wadden, D.; Amini, P.; Gulliver, W.; Randell, E.; Cahill, F.; Vasdev, S.; Goodridge, A.; Carter, J.C.;
Zhai, G.; et al. Food addiction: Its prevalence and significant association with obesity in the generalpopulation. PLoS ONE 2013, 8, e74832. [CrossRef]
9. Hebebrand, J.; Albayrak, Ö.; Adan, R.; Antel, J.; Dieguez, C.; de Jong, J.; Leng, G.; Menzies, J.; Mercer, J.G.;Murphy, M.; et al. “Eating addiction”, rather than “food addiction”, better captures addictive-like eatingbehavior. Neurosci. Biobehav. Rev. 2014, 47, 295–306. [CrossRef]
10. Nolan, L.J. Is it time to consider the “food use disorder”? Appetite 2017, 115, 16–18. [CrossRef]11. Long, C.G.; Blundell, J.E.; Finlayson, G. A systematic review of the application and correlates of
YFAS-diagnosed ‘food addiction’ in humans: Are eating-related ‘addictions’ a cause for concern or emptyconcepts? Obes. Facts 2015, 8, 386–401. [CrossRef] [PubMed]
12. Meule, A. Back by popular demand: A narrative review on the history of food addiction research. Yale J. Biol.Med. 2015, 88, 295–302. [PubMed]
13. Schulte, E.M.; Gearhardt, A.N. Development of the modified Yale food addiction scale version 2.0. Eur. Eat.Disord. Rev. 2017, 25, 302–308. [CrossRef] [PubMed]
14. Ellis, A. Reason and Emotion in Psychotherapy; Lyle Stuart: New York, NY, USA, 1962.15. Beck, A.T. Cognitive Therapy and the Emotional Disorders; International Universities Press: New York, NY, USA,
1976.16. Ellis, A. The essence of RET—1984. J. Ration. Emot. Cogn. Behav. Ther. 1984, 2, 19–25. [CrossRef]17. Vîslă, A.; Flückiger, C.; Grosse Holtforth, M.; David, D. Irrational beliefs and psychological distress: A
meta-analysis. Psychother. Psychosom. 2016, 85, 8–15. [CrossRef] [PubMed]18. Rohsenow, D.J.; Smith, R.E. Irrational beliefs and predictors of negative affective states. Motiv. Emot. 1982, 6,
299–314. [CrossRef]19. Deffenbacher, J.L.; Zwemer, W.A.; Whisman, M.A.; Hill, R.A.; Sloan, R.D. Irrational beliefs and anxiety.
Cognit. Ther. Res. 1986, 10, 281–291. [CrossRef]20. Wertheim, E.H.; Poulakis, Z. The relationship among the General Attitude and Belief Scale, other dysfunctional
cognition measures, and depressive or bulimic tendencies. J. Ration. Emot. Cogn. Behav. Ther. 1993, 10,219–233. [CrossRef]
21. Mayhew, R.; Edelmann, R.J. Self-esteem, irrational beliefs and coping strategies in relation to eating problemsin a non-clinical population. Person. Individ. Differ. 1989, 10, 581–584. [CrossRef]
22. Camatta, C.D.; Nagoshi, C.T. Stress, depression, irrational beliefs, and alcohol use and problems in a collegestudent sample. Alcohol. Clin. Exp. Res. 1995, 19, 142–146. [CrossRef]
23. Hutchinson, G.T.; Patock-Peckham, J.A.; Cheong, J.; Nagoshi, C.T. Irrational beliefs and behavioralmisregulation in the role of alcohol abuse among college students. J. Ration. Emot. Cogn. Behav. 1998, 16,61–74. [CrossRef]
24. Nagoshi, C.T. Perceived control of drinking and other predictors of alcohol use and problems in a collegestudent sample. Addict. Res. 1999, 7, 291–306. [CrossRef]
119

Nutrients 2019, 11, 1711
25. Denoff, M.S. Irrational beliefs as predictors of adolescent drug abuse and running away. J. Clin. Psychol.1987, 43, 412–423. [CrossRef]
26. Jacobsen, L.H.; Knudsen, A.K.; Krogh, E.; Pallesen, S.; Molde, H. An overview of cognitive mechanisms inpathological gambling. Nordic Psychol. 2007, 59, 347–361. [CrossRef]
27. Ruderman, A.J. Restraint and irrational cognitions. Behav. Res. Ther. 1985, 23, 557–561. [CrossRef]28. Ruderman, A.J. Bulimia and irrational beliefs. Behav. Res. Ther. 1986, 24, 193–197. [CrossRef]29. Lohr, J.M.; Parkinson, D.L. Irrational beliefs and bulimia symptoms. J. Ration. Emot. Cogn. Behav. Ther. 1989,
4, 253–262. [CrossRef]30. Tomotake, M.; Okura, M.; Taniguchi, T.; Ishimoto, Y. Traits of irrational beliefs related to eating problems in
Japanese college women. J. Med. Investig. 2002, 49, 51–55.31. Möller, A.T.; Bothma, M.E. Body dissatisfaction and irrational beliefs. Psychol. Rep. 2001, 88, 423–430.
[CrossRef]32. Lindeman, M.; Stark, K. Emotional eating and eating disorder psychopathology. Eat. Disord. 2001, 9, 251–259.
[CrossRef]33. Van Strien, T.; Ouwens, M.A. Effects of distress, alexithymia and impulsivity on eating. Eat. Behav. 2007, 8,
251–257. [CrossRef] [PubMed]34. Wallis, D.J.; Hetherington, M.M. Stress and eating: The effects of ego-threat and cognitive demand on food
intake in restrained and emotional eaters. Appetite 2004, 43, 39–46. [CrossRef] [PubMed]35. Schneider, K.L.; Appelhans, B.M.; Whited, M.C.; Oleski, J.; Pagoto, S.L. Trait anxiety, but not trait anger,
predisposes obese individuals to emotional eating. Appetite 2010, 55, 701–706. [CrossRef] [PubMed]36. Goossens, L.; Braet, C.; Van Vlierberghe, L.; Mels, S. Loss of control over eating in overweight youngsters:
The role of anxiety, depression and emotional eating. Eur. Eat. Disord. Rev. 2009, 17, 68–78. [CrossRef][PubMed]
37. Ouwens, M.A.; van Strien, T.; van Leeuwe, J.F. Possible pathways between depression, emotional andexternal eating. A structural equation model. Appetite 2009, 53, 245–248. [CrossRef]
38. Meadows, A.; Nolan, L.J.; Higgs, S. Self-perceived food addiction: Prevalence, predictors, and prognosis.Appetite 2017, 114, 282–298. [CrossRef] [PubMed]
39. Parylak, S.L.; Koob, G.F.; Zorrilla, E.P. The dark side of food addiction. Physiol. Behav. 2011, 104, 149–156.[CrossRef]
40. Lindner, H.; Kirkby, R.; Wertheim, E.; Birch, P.A. brief assessment of irrational thinking: The ShortenedGeneral Attitudes and Belief Scale. Cognit. Ther. Res. 1999, 23, 651–663. [CrossRef]
41. Bridges, K.R.; Harnish, R.J. Role of irrational beliefs in depression and anxiety: A review. Health 2010, 2,862–877. [CrossRef]
42. Van Strien, T.; Frijters, J.E.R.; Bergers, G.P.A.; Defares, P.B. The Dutch Eating Behavior Questionnaire (DEBQ)for assessment of restrained, emotional, and external eating behavior. Int. J. Eat. Disord. 1986, 5, 295–315.[CrossRef]
43. Spielberger, C.D.; Gorsuch, R.L.; Lushene, R.; Vagg, P.R.; Jacobs, G.A. Manual for the State-Trait AnxietyInventory; Consulting Psychologists: Palo Alto, CA, USA, 1983.
44. Zung, W.W. A self-rating depression scale. Arch. Gen. Psychiatry 1965, 12, 63–70. [CrossRef] [PubMed]45. Carroll, B.J.; Fielding, J.M.; Blashki, T.G. Depression rating scales: A critical review. Arch. Gen. Psychiatry
1973, 28, 361–366. [CrossRef]46. Hayes, A.F. Introduction to Mediation, Moderation, and Conditional Process Analysis: A Regression-Based Approach;
Guilford: New York, NY, USA, 2017.47. Ellis, A. Overcoming Destructive Beliefs, Feelings, and Behaviors: New Directions for Rational Emotive Behavior
Therapy; Prometheus Books: Amherst, NY, USA, 2001.48. Greeno, C.G.; Wing, R.R. Stress-induced eating. Psychol. Bull. 1994, 115, 444–464. [CrossRef] [PubMed]49. Heatherton, T.F.; Baumeister, R.F. Binge eating as escape from self-awareness. Psychol. Bull. 1991, 110, 86–108.
[CrossRef] [PubMed]50. Meule, A.; Gearhardt, A. Food addiction in the light of DSM-5. Nutrients 2014, 6, 3653–3671. [CrossRef]
[PubMed]51. Bourdier, L.; Orri, M.; Carre, A.; Gearhardt, A.N.; Romo, L.; Dantzer, C.; Berthoz, S. Are emotionally driven
and addictive-like eating behaviors the missing links between psychological distress and greater bodyweight? Appetite 2018, 120, 536–546. [CrossRef] [PubMed]
120

Nutrients 2019, 11, 1711
52. Eisenberg, D.; Gollust, S.E.; Golberstein, E.; Hefner, J.L. Prevalence and correlates of depression, anxiety, andsuicidality among university students. Am. J. Orthopsychiatry 2007, 77, 534–542. [CrossRef]
53. Beiter, R.; Nash, R.; McCrady, M.; Rhoades, D.; Linscomb, M.; Clarahan, M.; Sammut, S. The prevalence andcorrelates of depression, anxiety, and stress in a sample of college students. J. Affect. Disord. 2015, 173, 90–96.[CrossRef]
54. Zivin, K.; Eisenberg, D.; Gollust, S.E.; Golberstein, E. Persistence of mental health problems and needs in acollege student population. J. Affect. Disord. 2009, 117, 180–185. [CrossRef]
55. Hearon, B.A.; Utschig, A.C.; Smits, J.A.; Moshier, S.J.; Otto, M.W. The role of anxiety sensitivity and eatingexpectancy in maladaptive eating behavior. Cogn. Ther. Res. 2013, 37, 923–933. [CrossRef]
56. Schulte, E.M.; Joyner, M.A.; Potenza, M.N.; Grilo, C.M.; Gearhardt, A.N. Current considerations regardingfood addiction. Curr. Psychiatry Rep. 2015, 17, 563. [CrossRef] [PubMed]
© 2019 by the authors. Licensee MDPI, Basel, Switzerland. This article is an open accessarticle distributed under the terms and conditions of the Creative Commons Attribution(CC BY) license (http://creativecommons.org/licenses/by/4.0/).
121


nutrients
Review
Ethical, Stigma, and Policy Implications of FoodAddiction: A Scoping Review
Stephanie E. Cassin 1,2,3, Daniel Z. Buchman 4,5,6, Samantha E. Leung 2,7, Karin Kantarovich 2,7,
Aceel Hawa 8, Adrian Carter 9,10 and Sanjeev Sockalingam 2,3,7,8,*
1 Department of Psychology, Ryerson University, 350 Victoria St., Toronto, ON M5B 2K3, Canada;[email protected]
2 Centre for Mental Health, University Health Network, Network - Toronto General Hospital,200 Elizabeth Street, 8th Floor, Toronto, ON M5G 2C4, Canada; [email protected] (S.E.L.);[email protected] (K.K.)
3 Department of Psychiatry, University of Toronto, 250 College Street, Toronto, ON M5T 1R8, Canada4 University of Toronto Joint Centre of Bioethics, 155 College Street, Suite 754, Toronto, ON M5T 1P8, Canada;
[email protected] Bioethics Program and Krembil Brain Institute, Toronto Western Hospital, University Health Network,
399 Bathurst Street, Toronto, ON M5T 1P8, Canada6 Dalla Lana School of Public Health, University of Toronto, 155 College Street, 6th Floor, Toronto,
ON M5T 1R8, Canada7 Bariatric Surgery Program, University Health Network - Toronto Western Hospital, 399 Bathurst Street,
East Wing – 4th Floor, Toronto, ON M5T 2S8, Canada8 Department of Education, Centre for Addiction and Mental Health, 33 Russell Street, Toronto, ON M5S 2S1,
Canada; [email protected] School of Psychological Sciences, Monash University, Melbourne, VIC 3181, Australia;
[email protected] UQ Centre for Clinical Research, University of Queensland, Herston, QLD 4029, Australia* Correspondence: [email protected]; Tel.: +1-416-535-8501 (ext. x32178)
Received: 1 February 2019; Accepted: 20 March 2019; Published: 27 March 2019
Abstract: The concept of food addiction has generated much controversy. In comparison to researchexamining the construct of food addiction and its validity, relatively little research has examined thebroader implications of food addiction. The purpose of the current scoping review was to examinethe potential ethical, stigma, and health policy implications of food addiction. Major themes wereidentified in the literature, and extensive overlap was identified between several of the themes. Ethicssub-themes related primarily to individual responsibility and included: (i) personal control, willpower, and choice; and (ii) blame and weight bias. Stigma sub-themes included: (i) the impacton self-stigma and stigma from others, (ii) the differential impact of substance use disorder versusbehavioral addiction on stigma, and (iii) the additive stigma of addiction plus obesity and/or eatingdisorder. Policy implications were broadly derived from comparisons to the tobacco industry andfocused on addictive foods as opposed to food addiction. This scoping review underscored theneed for increased awareness of food addiction and the role of the food industry, empirical researchto identify specific hyperpalatable food substances, and policy interventions that are not simplyextrapolated from tobacco.
Keywords: ethics; food addiction; health policy; stigma
1. Introduction
The average weight of Americans increased dramatically in the 1980s, and this trend did notdiscriminate based on age, gender, or race [1]. Kessler notes that one remarkable change that coincided
Nutrients 2019, 11, 710; doi:10.3390/nu11040710 www.mdpi.com/journal/nutrients123

Nutrients 2019, 11, 710
with the dramatic weight increase was the availability of “hyperpalatable” foods, specifically thoseengineered to combine optimal amounts of sugar, fat, and salt [2]. Some authors likened thesehyperpalatable foods to addictive drugs, such as cocaine [3]. Though obesity only began garneringserious medical and public attention in recent years, the idea that obesity is a result of a food addictionwas, in fact, first posited during the 1940s and 1950s [4,5]. However, this early conceptualization offood addiction resulted in much societal debate as it intensified weight stigma and contributed toineffective policy changes around obesity and its consequences [5]. Since then, views on obesity andfood addiction have been evolving, though the concept of food addiction is still highly debated today.
Food addiction is not an official diagnosis in the Diagnostic and Statistical Manual of MentalDisorders (DSM-5) [6]; however, health care professionals, researchers, patients, and the general publicuse the term, and a questionnaire (Yale Food Addiction Scale; YFAS) has been developed to diagnoseits purported core features [7]. Many similarities have been noted between substance use disorders(e.g., alcohol, nicotine) and food addiction, including consuming more of the substance than intendedor over a longer period of time, preoccupation with the substance, craving or strong urge to use thesubstance, and continued consumption despite knowledge of adverse effects [8].
Food addiction can have negative impacts on individuals living with obesity. Several studies havefound that individuals with obesity who meet criteria for food addiction (as measured by the YFAS)demonstrate greater levels of eating disorder psychopathology, poorer general and health-relatedquality of life, greater depressive symptoms, and higher scores on impulsivity and self-controlmeasures [9–11]. Together, this underscores the importance of studying the relationship betweenfood addiction and obesity.
A food addiction model proposes that some individuals are addicted to certain foods and feeldriven to engage in weight promoting eating behaviors, such as binge eating or compulsive overeating,when exposed to “addictive” food substances [7,12,13]. Foods with added fat and refined carbohydrateshave been shown to be consumed in a more addictive manner [13,14] and craved more intensely [15]than less refined foods. This is thought to be, in part, a result of such hyperpalatable foods activatingthe mesolimbic reward-related pathway of the brain, which connects the ventral tegmental area ofthe midbrain to the nucleus accumbens in the ventral striatum via dopaminergic neurons [16,17].Neuroimaging studies on individuals meeting the cut-off for food addiction according to the YFAShave been shown to have dysfunctional patterns of reward-related neural activation [12,18], and studiesemploying the use of genotyping have demonstrated higher multi-locus genetic profile scores in thisgroup, which is associated with enhanced dopamine signaling [19].
Despite mounting evidence for the compulsive consumption of highly palatable foods, foodaddiction has continued to generate much controversy [20]. Discourses have centered around severalissues, including diagnostic challenges of food addiction; arguments that food addiction is not distinctfrom binge eating disorder [21,22]; debates as to whether food addiction is akin to a behavioraladdiction versus a substance use disorder [23]; and the notion that food (albeit not hyperpalatablefoods), unlike other substances, is necessary for survival [24]. With respect to the diagnostic challenges,there is emerging evidence that food addiction is distinct from binge eating disorder [25] and may bebest classified as a substance (food) use disorder as opposed to a behavioral (eating) addiction [8,26].A recent systematic review examining the validity of food addiction concluded that the existingresearch supports food addiction as a unique construct [8]. Amongst the 35 articles (52 studies),the largest number of studies found evidence for brain reward dysfunction and impaired control,followed by studies on tolerance and withdrawal for foods with the greater addictive potential,specifically added sugars and fats.
In comparison to research examining the construct of food addiction and its validity, relativelylittle research has examined the potential ethical, stigma, and health policy implications of foodaddiction. Other addictions to substances, such as tobacco, cannabis, or alcohol, have seen an increasein the use of stigmatization as a policy tool in order to promote public health [27]. As a result,ethical issues have arisen surrounding public health communication and its effect on individuals and
124
Nutrients 2019, 11, 710
on society as a whole [28]. Bayer has argued that the use of stigma may reduce the prevalence ofbehaviors linked to disease and mortality [29]. People who identify as “fat” or “obese” have longreceived stigmatizing “fat-shaming” messages from healthcare providers and public health officials.Stigmatization of people with obesity often has the opposite effect and is ethically indivisible given thestress and emotional and dignitary harms it causes [30]. This further emphasizes the importance ofdeveloping a nuanced understanding of the potential impact of a food addiction model on stigma,particularly given that it could have divergent effects on externalized stigma towards others andinternalized stigma towards the self.
A recent systematic review of nine empirical studies examining the link between food addictionand weight stigma concluded that limited evidence suggests that food addiction explanations mayreduce self-blame and stigma from others, but these benefits may be offset by the adverse impact onself-efficacy and eating behaviors [31]. However, the authors also noted that the existing empiricalresearch is sparse and inconsistent. To our knowledge, no scoping reviews have been conducted toexamine the ethical and health policy implications of food addiction, or the implications on stigmamore broadly beyond weight stigma. The purpose of this scoping review was to highlight what hasbeen published in the food addiction literature and to address these current gaps to help informcurrent perceptions by identifying the potential ethical, stigma, and health policy implications offood addiction.
2. Materials and Methods
This review was conducted as per the Arksey and O’Malley methodological framework forscoping reviews [32]. As part of the development of our research questions and approach, a stakeholdersummit was organized in collaboration with the Canadian Obesity Network (CON) involving abroad and diverse group of 18 stakeholders including local knowledge users (i.e., people withexperience with obesity-related treatment and food addiction), representatives from national obesityorganizations and patient advocacy groups, primary care physicians, and interprofessional researchleaders nationally and internationally in food addiction and/or obesity management. Data from apre-summit online questionnaire exploring perceptions related to the ethical and policy issues of foodaddiction in obesity informed summit discussions aimed at identifying key themes related to foodaddiction. The pre-summit online questionnaire was derived from previous studies on food addictionin obesity [33,34] and included open-ended questions regarding the potential implications of foodaddiction on stigma, ethics, and health policy. The following five stages were completed as part of thescoping review methodology.
Stage 1: Identifying the Research Questions
Based on the analysis of themes resulting from the stakeholder summit, this scoping reviewwas conducted to address the following question: What are the potential ethical, stigma and policyimplications of food addiction in obesity?
Inclusion/exclusion criteriaWe included peer- and non-peer reviewed articles, editorials, commentaries, letters, and replies to
authors that met the following criteria:
1. Were published in English;2. Were human studies;3. Established a link between obesity or binge eating and addiction or substance use;4. Presented a conceptual or mechanistic model of food addiction (i.e., had to include terms such as
“reward,” “reward pathway,” “compulsion,” “substance use,” or “pleasurable” somewhere in thearticle); and
5. Presented the issue of food addiction using a key concept (rather than quoting a prevalence).
125

Nutrients 2019, 11, 710
We excluded book chapters, dissertations, and policy documents. Papers were also excluded ifthey only focused on obesity and did not relate to food addiction.
Stage 2: Identifying Relevant Studies
We searched for relevant articles published up until January 26, 2017, for each question using thefollowing databases: Medline and PsycINFO from the OvidSP platform and CINAHL from the EBSCOplatform. Each of the OvidSP databases was searched individually. The searches were conducted withassistance from a research librarian from an academic health sciences center. The searches were runwith the limits of human studies and English language studies only. When appropriate, controlledvocabulary terms and/or text words were used in the subject component blocks. For example,obesity/bariatric terms included one block, food addiction terms included a second block, andethics/stigma/policy terms included a third block. Lastly, we reviewed key special issues on foodaddiction in prominent eating disorder and obesity periodicals to identify additional articles that mayhave met our inclusion criteria and were missed by our initial search. A total of 410 articles wereidentified from these search strategies.
Stage 3: Selecting Studies
All references resulting from the literature search were reviewed and 46 duplicates were removed.Preliminary screening was conducted by titles and abstracts by two independent reviewers. Seventeenreferences were missing and were excluded from screening. Screened abstracts were separated intothree categories: articles to include, unsure articles, and non-relevant articles to exclude. A secondaryscreening was then conducted by two additional independent reviewers on the articles that weredeemed unsure from the first round of screening. This screening procedure resulted in 296 articlesbeing excluded. Full text articles for the remaining 60 abstracts were then retrieved for data collection(see Figure 1 for PRISMA diagram).
Stage 4: Charting the Data
Data were extracted from all included full-text articles by one reviewer into a spreadsheet thatincluded authors, year of publication, and article type and relevant excerpts, themes, and quotes. Eachdomain was then separated into individual spreadsheets with the relevant articles and their respectiveidentifiers and variables for coding and analysis.
Stage 5: Collating, Summarizing, and Reporting the Results
Three independent reviewers completed this step. Each of the three main domains of ethics,stigma, and policy had two reviewers who independently reviewed the full text articles and coded thedata. A thematic analysis approach was used to critically analyze the articles and generate open codes.All reviewers then came together to discuss, compare, and organize the relevant excerpts, themes, andquotes that were extracted for each of the three main domains. These iterative discussions allowed fora higher level of thematic analysis, generating broad categories and higher-level themes. Reviewersmet nine times at 1- to 2-month intervals for a total of 18 h to review codes and to generate domainssummarized below.
126

Nutrients 2019, 11, 710
Figure 1. PRISMA flow diagram depicting the flow of information through the different phases of thisscoping review. From: [35].
3. Results
Each of the three domains of ethics, stigma, and policy implications related to food addictionare described below. All articles included from the search strategy for each of the three domains arelisted in Table S1. Of the 43 studies included in the analysis, 10 were reviews, 25 were original researcharticles, 5 were commentaries, 2 were opinions, and 1 was a brief. Table 1 provides a summary ofthemes and subthemes with sample quotes extracted from articles.
127
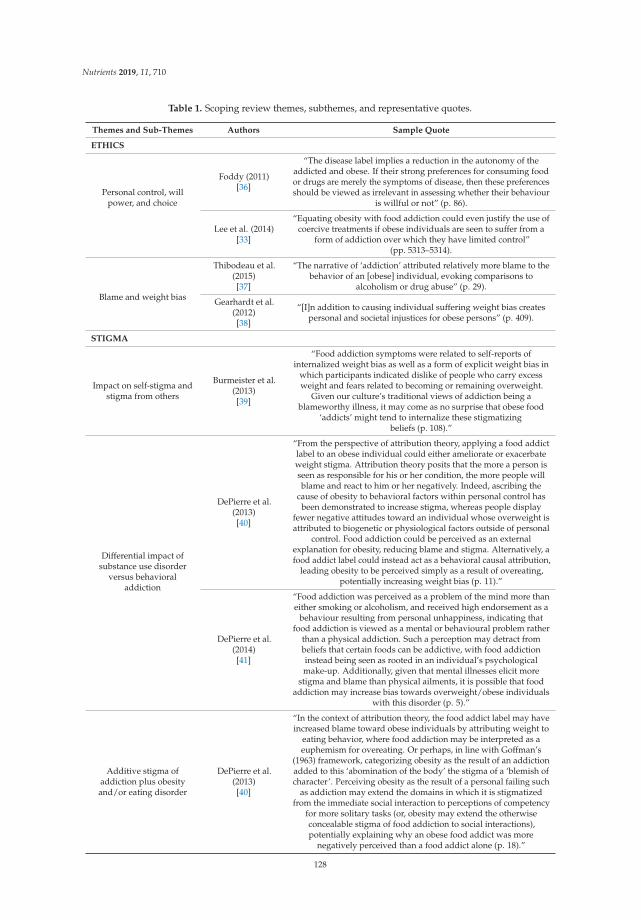
Nutrients 2019, 11, 710
Table 1. Scoping review themes, subthemes, and representative quotes.
Themes and Sub-Themes Authors Sample Quote
ETHICS
Personal control, willpower, and choice
Foddy (2011)[36]
“The disease label implies a reduction in the autonomy of theaddicted and obese. If their strong preferences for consuming foodor drugs are merely the symptoms of disease, then these preferencesshould be viewed as irrelevant in assessing whether their behaviour
is willful or not” (p. 86).
Lee et al. (2014)[33]
“Equating obesity with food addiction could even justify the use ofcoercive treatments if obese individuals are seen to suffer from a
form of addiction over which they have limited control”(pp. 5313–5314).
Blame and weight bias
Thibodeau et al.(2015)[37]
“The narrative of ‘addiction’ attributed relatively more blame to thebehavior of an [obese] individual, evoking comparisons to
alcoholism or drug abuse” (p. 29).
Gearhardt et al.(2012)[38]
“[I]n addition to causing individual suffering weight bias createspersonal and societal injustices for obese persons” (p. 409).
STIGMA
Impact on self-stigma andstigma from others
Burmeister et al.(2013)[39]
“Food addiction symptoms were related to self-reports ofinternalized weight bias as well as a form of explicit weight bias in
which participants indicated dislike of people who carry excessweight and fears related to becoming or remaining overweight.
Given our culture’s traditional views of addiction being ablameworthy illness, it may come as no surprise that obese food
‘addicts’ might tend to internalize these stigmatizingbeliefs (p. 108).”
Differential impact ofsubstance use disorder
versus behavioraladdiction
DePierre et al.(2013)[40]
“From the perspective of attribution theory, applying a food addictlabel to an obese individual could either ameliorate or exacerbateweight stigma. Attribution theory posits that the more a person isseen as responsible for his or her condition, the more people willblame and react to him or her negatively. Indeed, ascribing the
cause of obesity to behavioral factors within personal control hasbeen demonstrated to increase stigma, whereas people display
fewer negative attitudes toward an individual whose overweight isattributed to biogenetic or physiological factors outside of personal
control. Food addiction could be perceived as an externalexplanation for obesity, reducing blame and stigma. Alternatively, afood addict label could instead act as a behavioral causal attribution,
leading obesity to be perceived simply as a result of overeating,potentially increasing weight bias (p. 11).”
DePierre et al.(2014)[41]
“Food addiction was perceived as a problem of the mind more thaneither smoking or alcoholism, and received high endorsement as a
behaviour resulting from personal unhappiness, indicating thatfood addiction is viewed as a mental or behavioural problem rather
than a physical addiction. Such a perception may detract frombeliefs that certain foods can be addictive, with food addictioninstead being seen as rooted in an individual’s psychologicalmake-up. Additionally, given that mental illnesses elicit more
stigma and blame than physical ailments, it is possible that foodaddiction may increase bias towards overweight/obese individuals
with this disorder (p. 5).”
Additive stigma ofaddiction plus obesityand/or eating disorder
DePierre et al.(2013)[40]
“In the context of attribution theory, the food addict label may haveincreased blame toward obese individuals by attributing weight to
eating behavior, where food addiction may be interpreted as aeuphemism for overeating. Or perhaps, in line with Goffman’s
(1963) framework, categorizing obesity as the result of an addictionadded to this ‘abomination of the body’ the stigma of a ‘blemish ofcharacter’. Perceiving obesity as the result of a personal failing such
as addiction may extend the domains in which it is stigmatizedfrom the immediate social interaction to perceptions of competency
for more solitary tasks (or, obesity may extend the otherwiseconcealable stigma of food addiction to social interactions),potentially explaining why an obese food addict was more
negatively perceived than a food addict alone (p. 18).”
128

Nutrients 2019, 11, 710
Table 1. Cont.
Themes and Sub-Themes Authors Sample Quote
POLICY
Comparison to “BigTobacco”
Allen et al. (2012)[42]
“It is also vital to consider the numerous elements unique to theobesity epidemic that may require novel policy strategies. Most
evident is the fact that food is essential for survival, whereas tobaccouse is viewed as a dispensable, or even recreational, activity.”
Reducing access toaddictive foods through
regulation
Cullen et al. (2017)[43]
“[Restrictions] would probably help but if the person really wantsa Coke every day, they would probably find the means to get it.”
Food taxationPretlow RA.
2011[44]
“Taxation of sugar-sweetened beverages, and possibly junk foodand fast food, and restriction of such outlets to children, would
seem warranted and even embraced by some children.”
Limiting advertising foraddictive foods
Gearhardt et al.(2012)[38]
“[The food industry] has pledged to remove its unhealthy productsfrom schools and to market fewer unhealthy foods to children, inaddition to a variety of other promises. Whether the public and
elected officials find the industry trustworthy will determine in parthow aggressive government will be in regulating
industry practices.”
Limited information onfood addiction in obesity
guidelines
Allen et al. (2012)[42]
“In these guidelines, nothing is said about the potential that anunhealthy diet may not be easily changed due to addictive aspects
of hyperphagia. Furthermore, while they do recommend usinginterventions like taxation on high-energy food, they do not discuss
more strict strategies like limiting the access of children tosuch food.”
3.1. The Intersection of Ethics and Food Addiction
Our search yielded 20 articles related to ethics and food addiction. We identified individualresponsibility as the primary theme of this section, with the following sub-themes: (i) personal control,will power, and choice; and (ii) blame and weight bias.
3.1.1. Personal Control, Will Power, and Choice
We found a tension in the literature between the traditional framings of addiction that emphasizedpersonal control over food consumption, with medicalized, neuroscientific accounts of food addictionthat emphasized reduced personal control. For example, Appelhans, Whited, Schneider, and Pagotosuggested, “[d]ietary lapses or failures should be conceptualized as the result of brain systemsinteracting with a toxic food environment, and not as a reflection of poor personal choices or lack ofwillpower” [45] (p. 1135). Some scholars argue that framing food addiction within a disease modelmay reduce individual blame [46] as the impairment in the person’s autonomy and capacity for controlreflects dysfunction in the brain’s reward circuitry [36,44,47]. However, some scholars are skepticalthat a food addiction label or a disease model will reduce responsibility or obviate perceptions thatobesity is self-inflicted [5,48]. Others worry about the potential negative influence a brain diseasemodel of food addiction might have on people with obesity. For example, Lee and colleagues suggestthat a (brain) disease model could potentially justify coercive practices on a population that is thoughtto have reduced autonomy and limited control over their behavior [33].
A study by Lee and colleagues found that public support for a food addiction model of obesitywas associated with the view that the individual had to overcome their condition through willpowerand personal choice [34]. Other studies have reported that the public considers food addiction moreof a personal choice than an addiction to other substances such as alcohol [41]. Green suggests thatthe free autonomous behavior to consume highly palatable foods could be deterred potentially by theimplementation of sin taxes (or excise taxes) on said foods [49], but others, such as Franck, Grandi,and Eisenberg, question the evidence to support this recommendation [50]. Scholars have argued thatthe focus on individual-level factors, such as free will and personal choice, have failed to address thepublic health impact of high levels of highly palatable food consumption [51,52]. Some authors have
129

Nutrients 2019, 11, 710
argued that this narrow focus on individual-level factors “lets the food industry off the hook” for itscontributions [53] (p. 2).
3.1.2. Blame and Weight Bias
Given the emphasis on personal responsibility in the literature, perspectives on who or what is toblame for food addiction are also far from stable. The literature reflects tensions between attributingblame for food addiction to the individual, the environment (including government and industry),or both, but seldom the alleged addictive properties of the food itself [5,41]. For instance, Thibodeau,Perko, and Flusberg found that participants who agreed with narratives that blamed the individualfor their obesity (i.e., due to an addiction, a problem of individual behavior) were likely to supportinterventions that were penalizing, whereas support for narratives that blamed the environment werelikely to support policy interventions that sought to protect people with obesity [37]. These tensionsexist in a Western culture that values and legitimizes the over-consumption of foods and other materialgoods [51,54].
Weight bias is an ethically important concept in terms of its relevance to respect for persons,discrimination, and social justice, among others [38]. For example, entrenched harmful stereotypesthat describe people with obesity as lazy and lacking in willpower underpins the moral view that theymake poor choices with respect to food consumption and their health [38]. “Fat” people are considered“addict[ed] to inappropriate pleasures,” which serves to further stigmatize and blame “fat” people [55](p. 17).
3.2. Potential Implications of Food Addiction on Stigma
Our search yielded 19 articles related to stigma and food addiction. Identified themes included thefollowing: (i) the impact on self-stigma and stigma from others, (ii) the differential impact of substanceuse disorder versus behavioral addiction on stigma, and (iii) the additive stigma of addiction plusobesity and/or eating disorder. As noted below, there was extensive overlap between several of thestigma and ethics themes.
3.2.1. The Impact on Self-Stigma and Stigma from Others
Related to the concepts of personal control, willpower, and choice, as well as blame and weightbias described above, several authors discussed potential implications of food addiction on self-stigma(internalized stigma) and stigma from others (externalized stigma). Similar to people who usesubstances, people with obesity receive messages from individuals and society that their obesityis a character flaw [56]. Empirical research using hypothetical case vignettes has found some evidenceto suggest that a food addiction model may have a beneficial impact on stigma towards others whoare overweight. Latner, Puhl, Murakami, and O’Brien randomly assigned participants to one of fourconditions in which they read about either an addiction or non-addiction explanatory model of obesity,and subsequently read a vignette about a woman that was either obese or of normal weight [46].Regardless of the participant’s weight status, a food addiction explanatory model of obesity was foundto result in less stigma, less blame, and less perceived psychopathology attributed to the woman inthe vignette [46]. Moreover, a food addiction model resulted in less blame towards individuals withobesity in general, leading the authors to conclude that this explanatory model of obesity could have abeneficial impact on the pervasive prejudice against individuals with obesity.
Lee et al. conducted a large survey regarding public views of food addiction [34]. They foundsubstantial support for the concept of food addiction, particularly among individuals with obesity [34].They were less likely to agree that obesity is caused by overeating and they reported greater supportfor external causes of obesity. The authors speculated that a diagnosis of food addiction may reducesome of the guilt and self-blame associated with obesity. However, a correlational study by Burmeister,Hinman, Koball, Hoffman, and Carels found that weight-loss-seeking participants with a greaterseverity of food addiction, as measured by the YFAS, reported greater anti-fat attitudes (e.g., dislike of
130

Nutrients 2019, 11, 710
other people with excess weight), internalized weight bias (e.g., internalization of anti-fat attitudes),and body shame [39].
3.2.2. Differential Impact of Substance Use Disorder Versus Behavioral Addiction on Stigma
Despite evidence of shared neurobiological processes in substance use disorders and behavioraladdictions, a false dichotomy permeates much of the discourse whereby substance use disorders areperceived as a neurobiological disease and behavioral addictions are perceived as a mental/psychologicalcondition. Whether food addiction is considered a substance use disorder versus behavioral addictionmay impact factors such as personal responsibility, autonomy, and blame attribution, which in turnhave implications for internalized and externalized stigma. Stigma may decrease if food addiction isconsidered a substance use disorder because it provides an explanatory model for obesity “withoutinvoking character flaws, such as lack of willpower” [45] (p. 1133), and shifts responsibility from theindividual to the food substance and food industry. For example, Appelhans et al. state: “by emphasizinggenetically-influenced neurobiological processes that confer vulnerability to overeating in a toxic foodenvironment, the model enables dietetics practitioners to more effectively address obesity withoutpromoting stigma” [45] (p. 1133). However, Rasmussen points out that the “neurochemical concept ofobesity, as with drug addiction and eating disorders, can coexist with attribution of personal responsibilityfor the condition, and thus with blaming the impaired, addicted consumer rather than the supplier”(p. 217), and goes on to say that “it cannot be ruled out that attribution of addiction (as a chronic braindisease) will hurt more than it helps” [5] (p. 223).
Whereas opinions were mixed regarding whether considering food addiction as a substance usedisorder would reduce internalized and externalized stigma, it was generally believed that consideringfood addiction as a behavioral addiction would either have little effect on stigma or actually increasestigma because it is perceived as a choice that is under personal control. DePierre, Puhl, and Luedickeconducted an empirical study to examine public perceptions of food addiction compared to nicotineand alcohol addiction. Food addiction was considered to be a disease to a greater extent than smokingand to be the product of personal choice to a greater extent than alcohol addiction, leading the authorsto conclude that food addiction may be perceived as a behavioral addiction that is vulnerable tostigmatization rather than a substance addiction [41].
3.2.3. Additive Stigma of Addiction Plus Obesity/Eating Disorder
We found a tension in the literature regarding whether food addiction would reduce the stigmadirected towards individuals with obesity or create an additional stigmatized identity. Several authorspointed out that substance-related disorders, such as nicotine, alcohol, and cocaine use disorders,are stigmatized to an even greater extent than obesity, a finding that may be due to the fact thateveryone must eat food for survival, whereas a person must choose to seek out and use psychoactivesubstances of abuse [40,41,45]. It has also been suggested that food may be a less stigmatizing substanceof abuse because it has less impact on others compared to nicotine (e.g., second-hand smoke) andalcohol (e.g., driving under the influence, impulsive behaviors) [40,41].
Several authors raised concerns that a diagnosis of food addiction could result in a double oradditive stigma because the types of stigma associated with obesity and addiction differ [5,40,42,57].For example, applying the types of stigma described by Goffman in this context, obesity could beconsidered a visible “abomination of the body,” whereas addiction could be considered a “blemish ofcharacter” [40,58]. Foddy states: “I have said nothing about the myriad social dimensions in which westigmatize and disadvantage addicts [sic] differently from the obese. It is hard to say exactly whichgroup has the worse lot in this sense, since the stigma and discrimination takes different forms in eachcase” [36] (p. 87).
Rather than food addiction reducing stigma by providing an explanatory model forcompulsive/binge eating and obesity that reduces blame and personal responsibility, several authorsnoted that food addiction may actually amplify the harms of stigma because obesity, eating disorders,
131

Nutrients 2019, 11, 710
and addictions are all stigmatized conditions, and neurobiological explanations do not necessarilymodify attributions of personal responsibility. Allen et al. raised concerns about the “dietary obesebeing stigmatized as addicts [sic]” (p. 134) [42]. Rasmussen noted that “the stigmatizing attributionof addiction to people already stigmatized as obese may amplify the social harms that they suffer”(p. 217), “raising the risk that their combination might prove reinforcing” [5] (p. 223).
A few experimental studies have been conducted to examine the impact of food addiction onexternalized stigma. Bannon, Hunter-Reel, Wilson, and Karlin randomly assigned participants to oneof six conditions in which they read a vignette about a woman with obesity [59]. The independentvariables were her binge eating status (present vs. absent) and the cause of her obesity (biologicaladdiction vs. psychological vs. ambiguous). Unfortunately, the manipulation regarding the cause ofher obesity was not successful, which prevented interpretation of the specific impact of food addictionon externalized stigma. However, the presence of binge eating increased externalized stigma such thatparticipants rated individuals with obesity as less attractive and more blameworthy for their weight,and they desired greater social distance from them [59]. DePierre et al. directly examined the additiveeffect of food addiction on externalized stigma [40]. They found that labelling an individual as an“obese food addict” was more stigmatizing than either label on its own (“food addict” or “obese”) andconcluded that food addiction may increase the externalized stigma associated with obesity, but beless susceptible to stigma than other forms of addiction [40].
3.3. Potential Policy Implications of Food Addiction
Our search yielded 31 articles related to policy themes for addictive foods that were extrapolatedto the construct of food addiction. Policy themes related to addictive foods were generally derived fromcomparisons to the tobacco industry. Articles identified specific policy interventions from “Big Tobacco”that could be applied to food addiction included the following: (i) reducing access to addictive foods,(ii) food taxation, and (iii) limiting advertising for addictive foods.
3.3.1. Comparisons to “Big Tobacco”
Many articles made parallels between the policy issues related to the food industry and thetobacco industry. The role of food taxation, reducing access to potentially addictive foods, litigationagainst the food industry, and limiting food advertising in addressing food addiction and obesityarise from this comparison to “Big Tobacco” and highlight a prominent theme amongst most articlesfocusing on policy issues of food addiction [38,52,53]. The association between the food industry andtobacco industry is contingent on a clear link between certain foods and their addictive potential.Authors argued that if certain foods are conceptualized as “a potentially disease-causing agent suchas tobacco and alcohol then policy changes to encourage the intake of healthy food and decrease theintake of unhealthy foods are in order” [60] (p. 762). Furthermore, Schulte and colleagues argue that ifthe concept of food addiction is embraced by the public as it was for nicotine addiction, the shift inpublic perception of the substance (in this case, addictive foods) could generate enough support forchange in public policies for obesity [61]. This argument has been supported by an online survey of999 individuals from the U.S., including 52% of individuals who were overweight or obese, whichshowed that believing food is addictive increased support for obesity-related policies [62].
3.3.2. Reducing Access to Addictive Foods Through Regulation
In comparison to policies in the tobacco industry, the overall evidence for the effect of governmentregulations on limiting access to highly pleasurable food is still emerging and requires furtherexploration [63]. Current papers identified the role of government regulations on the food industry tosupport legislation, litigation, and regulation efforts to influence access to healthy as opposed to highfat or sugar foods [60,64]. Reports suggest that if food is deemed addictive, then governments need toestablish clear policies to limit, restrict, or even ban addictive foods [52], such as limiting the numberand location of fast food restaurants and soft drink vending machines in an area.
132

Nutrients 2019, 11, 710
The support for policies focused on addictive food restriction for children and youth as opposedto adults. For example, in a survey of youth who were unable to lose weight using an onlineopen-access website for obesity, participants felt that restriction of junk food and fast food outletswould be beneficial [36]. Additional articles supported early intervention efforts through increasedregulation of pleasurable foods in children and youth settings such as schools, implementation ofprograms promoting healthy eating and food choices, and engagement of pediatricians and familyphysicians [65,66]. In contrast, a recent qualitative study with 23 individuals with obesity showed thatindividuals were skeptical about the effectiveness of restrictions on highly pleasurable foods, althoughthey supported addictive food restrictions for children [43]. Nonetheless, reviews generally supportedexternal control of addictive foods based on examples where cigarette smokers perceived externalcontrol as being influential or effective compared to individual motivating factors (e.g., willpower,personal choice) [67,68].
Despite this support for policy interventions focused on increased food regulation, concerns wereexpressed in articles around the lack of clarity around “addictive,” or “good” and “bad,” ingredientsand foods [69]. The lack of clear evidence about foods categorized as “addictive” and the uniquechallenges with food being a necessary part of living (in contrast to alcohol) have complicatedabstinence arguments and approaches thus far. Nonetheless, authors have used the comparisonto the tobacco industry for informing food addiction policy interventions focused on restriction [56].Empirical evidence has demonstrated that narratives where obesity was considered an addiction or adisorder led to increased public support for a protective approach to policy interventions for obesity;however, implications for obesity treatment are not fully understood [37].
Studies reiterated the importance of obesity experts being more explicit about food engineeringand the need for greater public awareness of this issue beyond the traditional “obesogenic environment”discourses [44]. A greater focus on increasing public awareness about food engineering could leadto greater support for policy interventions focused on regulation and addictive food restriction. Onearticle noted that a potential consequence of identifying and regulating specific “addictive” foodscould be litigation and banning of the food industry for purposefully engineering foods to be moreaddictive [52].
3.3.3. Food Taxation
Themes related to food taxation also emerged predominantly from comparisons between thefood and tobacco industries, as highlighted above [42,44]. The rationale stems from evidence for thetaxation of tobacco products, which has estimated that a 10% increase in soft drink prices could resultin approximately an 8–10% reduction in soft drink consumption by individuals [70,71]. Moreover,several countries, including France and Hungary, have implemented tax levies on high caloricdensity foods [41]. These national policy initiatives will be beneficial in evaluating the effects ofthese interventions longitudinally on mitigating food addiction.
Despite this early evidence, several factors complicate food taxation as a policy intervention toreduce access to caloric dense foods. In contrast to tobacco products, caloric dense foods are alreadycheaper than healthier food options [42]. Therefore, food taxation efforts would affect children and thepoor disproportionately given the current low cost of caloric dense foods, although food taxes maypotentially be used to offset costs for healthier foods in this population [42]. In addition, it is unclearwhat food ingredients are highly addictive and as a result, conclusive recommendations on specificingredients warranting taxation remains a challenge [53].
3.3.4. Limiting Advertising for Addictive Foods
Studies have also articulated concerns about the early introduction of food advertising to youngchildren and adolescents. Gearhardt and colleagues identified the need to limit food advertisingto children to limit the potential long-term effects, such as food addiction [38]. Restriction of foodmarketing to youth has involved both government policies but also voluntary pledges by the food
133

Nutrients 2019, 11, 710
industry [38]. These initiatives have attempted to correct the default food industry messaging thathas been inoculating children and youth for decades [71]. As a result, authors argue that voluntaryself-regulatory efforts by the food industry are likely to be insufficient, and government protectivepolicies are needed to counteract these trends in early childhood food marketing strategies by the foodindustry [38].
3.3.5. Limited Information on Food Addiction in Obesity Guidelines
Several papers focused on the limited discussion of food addiction within key obesity relatedguidelines and resources such as the World Health Organization (WHO) and Centre for DiseaseControl (CDC) [42]. Despite increasing public dialogue on food addiction, obesity guidelines havenot included information on the controversies related to food addiction. This is complicated by theinability to differentiate specific addictive food ingredients and limited evidence for food addictionrelated interventions [72]. As a result, papers highlighted the need for an improved mechanisticunderstanding and the development and testing of new treatments for managing addictive foods.
Furthermore, there have been questions regarding the evidence for policy interventions forpreventing and managing addictive foods in patients with obesity. Gostin and colleagues believe thatthe “lack of science” argument for food addiction policy interventions is a faulty argument giventhat no single intervention resulted in a substantial reduction in nicotine use and there is a need fora multi-level intervention approach [73]. Thus, further research is needed to clarify the construct offood addiction, risk factors and effectiveness of policy interventions to facilitate integration withinobesity-related guidelines and resources.
4. Discussion
The current scoping review examined the potential ethical, stigma, and health policy implicationsof food addiction, identified the major themes in the literature, and provided insights into keychallenges in these areas.
4.1. Potential Ethical Implications of Food Addiction
While various disease models of alcohol use disorders have circulated within the populardiscourse since the early 19th century [74,75], more recently scholars have adopted the languageof neuroscience to characterize addiction more generally as a chronic, relapsing brain disease [76,77].We found that discussions in the literature lend themselves to moral debates over personal control,individual responsibility, and blame for the consequences of food consumption. Indeed, these moralframings are common in the obesity discourse [44,78]. However, the neurobiological theory of foodaddiction may place a disproportionate burden on the individual to treat their food addiction, whichmay provide less incentive for governments to scale up public health approaches, such as holding thefood industry accountable for their food engineering practices as well as the social conditions thatharm people who are defined as food addicted.
The focus of individual blame in the literature may be reflective of a culture of healthism, definedas the individual desire for health and well-being achieved primarily through lifestyle modification [79].The moral assumptions underlying healthism is that individuals are responsible for making goodchoices as opposed to bad choices about their health. Our results suggest that healthism describesgood choices as health-promoting and reflects self-control over eating while bad choices lead to foodaddiction or obesity. For instance, some dietary counselling recommendations include empoweringthe patient to take responsibility for their behaviors in the context of what they consider to be a toxicfood environment [45]. Our results suggest that some authors were concerned about a culture thatemphasizes healthism and individualism when the social conditions make the ability to make healthyeating choices near impossible [51]. Future research can build on the burgeoning literature in this areaand provide deeper insights into the moral attitudes about food addiction held by diverse publics.
134

Nutrients 2019, 11, 710
It will also be important for future research to explore if the empirical findings related to moral conceptsalign with the concerns raised in the conceptual philosophical and bioethics literatures.
4.2. Potential Stigma Implications of Food Addiction
Our review also examined the complex relationship between food addiction and stigma. Stigmais a multidimensional construct including many related concepts (e.g., labels, stereotypes, prejudice,discrimination), sources (e.g., self-stigma, public stigma, provider-based stigma [e.g., from healthcareproviders], institutional stigma), characteristics (e.g., stigma of the physical body, stigma of character),and dimensions (e.g., social distance, perceptions of dangerousness) that can complicate analyses [80].The limited empirical research conducted to date, much of which has experimentally manipulatedthe information provided in case vignettes, has generated mixed results regarding the impact of afood addiction model on externalized stigma. Whereas a food addiction explanation for obesity wasfound to reduce externalized stigma and blame towards a target in one study [45], another study foundthat labeling an individual as an “obese food addict” created an additive stigma that exceeded thestigma associated with either label on its own [40]. This finding is consistent with a recent qualitativestudy of individuals with obesity, which noted that some individuals who personally identified withthe concept of food addiction felt reluctant to be described as an “addict” because they believed thelabel would increase self-stigma and stigma from others [43]. Interestingly, the one study identifiedthrough our scoping review that examined the association between food addiction and externalizedstigma in a clinical sample found that patients with greater severity of food addiction reported greateranti-fat attitudes towards other individuals with excess weight [39]. The impact of food addiction onexternalized stigma has been examined in student samples, community samples, and a clinical sample,and additional research is warranted to examine the impact of a food addiction model on externalizedstigma among healthcare professionals.
In contrast to the mixed findings regarding the impact of a food addiction model on externalizedstigma, the association between food addiction and internalized stigma has been fairly consistent.The aforementioned study conducted in a clinical sample found that patients with greater severityof food addiction reported greater internalized weight bias and body shame, as well as lower eatingself-efficacy [39]. This finding is consistent with a recent study comparing three groups that varied withrespect to food addiction (i.e., non-food-addicted, self-perceived food addicted, and food-addictedaccording to the YFAS) and found that internalized weight bias increased across the groups despiteno differences in body mass index, whereas eating self-efficacy decreased across the groups [81].Similarly, a recent systematic review examining the association between internalized weight biasand health-related variables reported that the published studies conducted to date have consistentlyfound a positive association between food addiction and internalized weight bias [82]. Moreover,internalized weight bias was associated with a variety of negative mental and physical health outcomesincluding depression, anxiety, low self-esteem, poor body image, disordered eating, severity of obesity,reduced dietary adherence, and reduced motivation and self-efficacy to engage in health-promotingbehaviors. Although much of the research conducted to date has been cross-sectional, which precludesconclusions regarding the direction of causality, if replicated in prospective research, such findingswould lend support to concerns voiced by some authors that food addiction could have an adverseimpact on internalized stigma and reduce the self-efficacy needed to improve eating behaviors [29].Although the treatment implications of food addiction were beyond the scope of the current review,this important topic is recently receiving more attention in the literature [83,84] and the findings ofthe current review suggest that treatment approaches that reduce internalized weight bias and bolsterself-efficacy would be advised.
Whether food addiction is best characterized as a behavioral addiction or a substance use disorderhas been a topic of debate [26]. The results of the current review suggest that characterizing foodaddiction as a behavioral addiction likely has an adverse impact on externalized stigma comparedto characterizing it as a substance use disorder. Despite evidence that behavioral addictions and
135

Nutrients 2019, 11, 710
substance use disorders have many shared features, including neurobiological mechanisms and geneticcontributions [85,86], behavioral addictions are still commonly perceived as being more under personalcontrol. The general public perceives food addiction as being less of a disease and more under personalcontrol than alcoholism [41]. Increasing public awareness regarding the engineering of hyperpalatablefoods and the validity of food addiction as a diagnostic construct that shares similarities with othersubstance use disorders [8] may be helpful as both a public health and stigma reduction intervention.
4.3. Potential Policy Implications of Food Addiction
Across reviewed articles, we found that the tobacco industry served as an example for many ofthe policy recommendations for managing food addiction in obesity. The challenges with these policyinterventions were related to the lack of research on addictive food substances, specifically the currentinability to classify foods more broadly in their addictive potential. Despite authors drawing parallelsto “Big Tobacco,” we identified a dearth of evidence for the effectiveness of food addiction as a driverfor policy change in obesity. Therefore, many of the recommendations, such as food taxation, reducingadvertising to children, and reducing access to addictive foods (especially in children and youth), wereextrapolated from policy interventions observed in the tobacco industry as opposed to being specificto food addiction.
4.4. Limitations
Our results are subject to the following limitations associated with scoping review. Unlikea systematic review, we are unable to grade the quality of the studies or make any specificrecommendations related to level of evidence. The articles included in this scoping review includedcommentaries and empirical research (e.g., experimental and correlational studies). Further, althoughour search used multiple methods to identify potential articles, it is possible that some studies weremissed. This scoping review underscored the need for future research on the effectiveness of policyinterventions to mitigate the effect of addictive foods on the obesity epidemic. The inclusion of foodaddiction within obesity guidelines was a notable omission in the literature that was identified inour review. It is possible that the absence of food addiction in obesity guidelines reflects the need forgreater research on the role of food addiction on obesity management, including questions about itsbenefit for healthcare professionals and patients in obesity care.
5. Conclusions
This review is the first to explore the ethical, stigma, and policy issues related to food addictionusing a scoping review methodology. The gaps in the evidence related to this scoping reviewunderscore the need for additional research and increased clarity regarding the ethical and stigmarelated impact of a food addiction model. In addition, more rigorous studies are needed to movebeyond policy interventions generated predominantly from past experiences in the tobacco industry.
Supplementary Materials: The following are available online at http://www.mdpi.com/2072-6643/11/4/710/s1,Table S1: Complete List of Articles from Search Strategy.
Author Contributions: S.E.C., D.Z.B., and S.S. contributed to the conception and design of the study. S.E.L.,K.K., and A.H. conducted literature searches and provided summaries of previous research studies. All authorscontributed equally to the analysis and interpretation of the data and the writing of the manuscript. All authorshave approved the final manuscript.
Funding: This study was funded by the Canadian Institutes of Health Research (Grant No. 373261).
Acknowledgments: This project was funded by a Planning and Dissemination Grant from the Canadian Institutesof Health Research. We would like to thank Ashley Farrell for assisting with the scoping review methodology andliterature search, as well as the individuals who participated in our food addiction retreat.
Conflicts of Interest: The authors declare no conflict of interest.
136

Nutrients 2019, 11, 710
References
1. Kuczmarski, R.J.; Flegal, K.M.; Campbell, S.M.; Johnson, C.L. Increasing prevalence of overweight amongUS adults. The National Health and Nutrition Examination Surveys, 1960 to 1991. JAMA 1994, 272, 205–211.[PubMed]
2. Kessler, D.A. The End of Overeating: Taking Control of the Insatiable American Appetite; Rodale: New York, NY,USA, 2009.
3. Johnson, P.M.; Kenny, P.J. Dopamine D2 receptors in addiction-like reward dysfunction and compulsiveeating in obese rats. Nat. Neurosci. 2010, 13, 635–641.
4. Parr, J.; Rasmussen, N. Making addicts of the fat: Obesity, psychiatry and the ‘Fatties Anonymous’ Model ofSelf-Help Weight Loss in the Post-War United States. In Critical Perspectives on Addiction (Advances in MedicalSociology, Volume 14); Netherland, J., Ed.; Emerald Group Publishing Limited: Bingley, UK, 2012; pp. 181–200.
5. Rasmussen, N. Stigma and the addiction paradigm for obesity: Lessons from 1950s America. Addiction 2014,110, 217–225.
6. American Psychiatric Association. Diagnostic and Statistical Manual of Mental Disorders, 5th ed.; AmericanPsychiatric Association: Washington, DC, USA, 2013.
7. Gearhardt, A.N.; Corbin, W.R.; Brownell, K.D. Preliminary validation of the Yale food addiction Scale.Appetite 2009, 52, 430–436.
8. Gordon, E.L.; Ariel-Donges, A.H.; Bauman, V.; Merlo, L.J. What is the evidence for “food addiction”?A systematic review. Nutrients 2018, 12, 477.
9. Ivezaj, V.; White, M.A.; Grilo, C.M. Examining binge-eating disorder and food addiction in adults withoverweight and obesity. Obesity 2016, 24, 2064–2069.
10. Chao, A.M.; Shaw, J.A.; Pearl, R.L.; Alamuddin, N.; Hopkins, C.M.; Bakizada, Z.M.; Berkowitz, R.I.;Wadden, T.A. Prevalence and psychosocial correlated of food addiction in persons with obesity seekingweight reduction. Compr. Psychiatry 2016, 73, 97–104. [PubMed]
11. Gearhardt, A.N.; White, M.A.; Masheb, R.M.; Morgan, P.T.; Crosby, R.D.; Grilo, C.M. An examination of thefood addiction construct in obese patients with binge eating disorder. Int. J. Eat. Disord. 2012, 45, 657–663.[PubMed]
12. Gearhardt, A.N.; Davis, C.; Kuschner, R.; Brownell, K.D. The addiction potential of hyperpalatable foods.Curr. Drug Abuse Rev. 2011, 4, 140–145.
13. Schulte, E.M.; Avena, N.M.; Gearhardt, A.N. Which foods may be addictive? The roles of processing,fat content, and glycemic load. PLoS ONE 2015, 10, e0117959.
14. Curtis, C.; Davis, C. A qualitative study of binge eating and obesity from an addiction perspective. Eat. Disord.2014, 22, 19–32.
15. Gihooly, C.H.; Das, S.K.; Golden, J.K.; McCrory, M.A.; Dallal, G.E.; Saltzman, E.; Kramer, F.M.; Roberts, S.B.Food cravings and energy regulation: The characteristics of craved foods and their relationship with eatingbehaviors and weight change during 6 months of dietary energy restriction. Int. J. Obes. 2007, 31, 1849–1858.
16. Smith, D.G.; Robbins, T.W. The neurobiological underpinnings of obesity and being eating: A rationale foradopting the food addiction model. Biol. Psychiatry 2013, 73, 804–810.
17. Volkow, N.D.; Wang, G.J.; Fowler, J.S.; Tomais, D.; Baler, R. Food and drug reward: Overlapping circuits inhuman obesity and addiction. Curr. Top. Behav. Neurosci. 2012, 11, 1–24. [PubMed]
18. Gearhardt, A.N.; Yokum, S.; Orr, P.; Stice, E.; Corbin, W.; Brownell, K.D. The neural correlates of ‘foodaddiction’. Arch. Gen. Psychiatry 2011, 68, 808–816. [PubMed]
19. Davis, C.; Loxton, N.J.; Levitan, R.D.; Kaplan, A.S.; Carter, J.C.; Kennedy, J.L. ‘Food addiction’ and itsassociation with a dopaminergic multilocus genetic profile. Physiol. Behav. 2013, 118, 63–69. [PubMed]
20. Fletcher, P.C.; Kenny, P.J. Food addiction: A valid concept? Neuropsychopharmacology 2018, 43, 2506–2513.21. Burrows, T.; Skinner, J.; McKenna, R.; Rollo, M. Food addiction, binge eating disorder, and obesity: Is there a
relationship? Behav. Sci. 2017, 7, 54.22. Leigh, S.J.; Morris, M.J. The role of reward circuitry and food addiction in the obesity epidemic: An update.
Biol. Psychol. 2018, 131, 31–42.23. Muele, A.; Gearhardt, A.N. Food addiction in the light of DSM-5. Nutrients 2014, 6, 2652–2671.24. Corwin, R.L.; Grigson, P.S. Symposium overview - food addiction: Fact or fiction? J. Nutr. 2009, 139, 617–619.
137

Nutrients 2019, 11, 710
25. Davis, C. A commentary on the associations among ‘food addiction’, binge eating disorder, and obesity:Overlapping conditions with idiosyncratic clinical features. Appetite 2017, 115, 3–8. [PubMed]
26. Schulte, E.M.; Potenza, M.N.; Gearhardt, A.N. A commentary on the “eating addiction” versus “foodaddiction” perspectives on addictive-like food consumption. Appetite 2017, 115, 9–15.
27. Bell, K.; Salmon, A.; Bowers, M.; Bell, J.; McCullough, L. Smoking, stigma and tobacco ‘denormalization’:Further reflections on the use of stigma as a public health tool. Soc. Sci. Med. 2010, 70, 795–799.
28. Guttman, N.; Salmon, C.T. Guilt, fear, stigma and knowledge gaps: Ethical issues in public healthcommunication interventions. Bioethics 2004, 18, 531–552. [PubMed]
29. Bayer, R. Stigma and the ethics of public health: Not can we but should we. Soc. Sci. Med. 2008, 67, 463–472.30. Goldberg, D.S.; Puhl, R.M. Obesity stigma: A failed and ethically dubious strategy. Hastings Cent. Rep. 2013,
43, 5–6. [PubMed]31. Reid, J.; O’Brien, K.S.; Puhl, R.; Hardman, C.A.; Carter, A. Food addiction and its potential links with weight
stigma. Curr. Addict. Rep. 2018, 5, 192–201.32. Arksey, H.; O’Malley, L. Scoping studies: Towards a methodological framework. Int. J. Soc. Res. Methodol.
2005, 8, 19–32.33. Lee, N.M.; Hall, W.D.; Lucke, J.; Forlini, C.; Carter, A. Food Addiction and Its Impact on Weight-Based
Stigma and the Treatment of Obese Individuals in the U.S. and Australia. Nutrients 2014, 6, 5312–5326.34. Lee, N.M.; Lucke, J.; Hall, W.D.; Meurk, C.; Boyle, F.M.; Carter, A. Public Views on Food Addiction and
Obesity: Implications for Policy and Treatment. PLoS ONE 2013, 8, e74836.35. Moher, D.; Liberati, A.; Tetzlaff, J.; Altman, D.G. The PRISMA Group (2009). Preferred Reporting Items for
Systematic Reviews and Meta-Analyses: The PRISMA Statement. PLoS Med. 2009, 6, e1000097. [CrossRef]36. Foddy, B. Addicted to Food, Hungry for Drugs. Neuroethics 2011, 4, 79–89.37. Thibodeau, P.H.; Perko, V.L.; Flusberg, S.J. The relationship between narrative classification of obesity and
support for public policy interventions. Soc. Sci. Med. 2015, 141, 27–35. [PubMed]38. Gearhardt, A.N.; Bragg, M.A.; Pearl, R.L.; Schvey, N.A.; Roberto, C.A.; Brownell, K.D. Obesity and public
policy. Annu. Rev. Clin. Psychol. 2012, 8, 405–430. [PubMed]39. Burmeister, J.M.; Hinman, N.; Koball, A.; Hoffmann, D.A.; Carels, R.A. Food addiction in adults seeking
weight loss treatment. Implications for psychosocial health and weight loss. Appetite 2013, 60, 103–110.[PubMed]
40. DePierre, J.A.; Puhl, R.; Luedicke, J. A new stigmatized identity? Comparisons of a ‘food addict’ label withother stigmatized health conditions. Basic Appl. Soc. Psych. 2013, 35, 10–21.
41. DePierre, J.A.; Puhl, R.; Luedicke, J. Public perceptions of food addiction: A comparison with alcohol andtobacco. J. Subst. Use 2014, 19, 1–6.
42. Allen, P.J.; Batra, P.; Geiger, B.M.; Wommack, T.; Gilhooly, C.; Pothos, E.N. Rationale and consequences ofreclassifying obesity as an addictive disorder: Neurobiology, food environment and social policy perspectives.Physiol. Behav. 2012, 107, 126–137.
43. Cullen, A.J.; Barnett, A.; Komesaroff, P.A.; Brown, W.; O’Brien, K.S.O.; Hall, W.; Carter, A. A qualitativestudy of overweight and obese Australians’ views of food addiction. Appetite 2017, 115, 62–70. [PubMed]
44. Pretlow, R.A. Addiction to highly pleasurable food as a cause of the childhood obesity epidemic: A qualitativeInternet study. Eat. Disord. 2011, 19, 295–307.
45. Appelhans, B.M.; Whited, M.C.; Schneider, K.L.; Pagoto, S.L. Time to abandon the notion of personal choicein dietary counseling for obesity? J. Am. Diet. Assoc. 2011, 111, 1130–1136. [PubMed]
46. Latner, J.D.; Puhl, R.M.; Murakami, J.M.; O’Brien, K.S. Food addiction as a causal model of obesity. Effectson stigma, blame, and perceived psychopathology. Appetite 2014, 77, 77–82. [PubMed]
47. Ho, A.L.; Sussman, E.S.; Pendharkar, A.V.; Azagury, D.E.; Bohon, C.; Halpern, C.H. Deep brain stimulationfor obesity: Rationale and approach to trial design. Neurosurg. Focus 2015, 38, E8.
48. Ortiz, S.E.; Zimmerman, F.J.; Gilliam, F.D., Jr. Weighing in: The taste-engineering frame in obesity expertdiscourse. Am. J. Public Health 2015, 105, 554–559. [PubMed]
49. Green, R. The Ethics of Sin Taxes. Public Health Nurs. 2011, 28, 68–77. [PubMed]50. Franck, C.; Grandi, S.M.; Eisenberg, M.J. Taxing Junk Food to Counter Obesity. Am. J. Public Health 2013, 103,
1949–1953.51. Brownell, K.D.; Schwartz, M.B.; Puhl, R.M.; Henderson, K.E.; Harris, J.L. The need for bold action to prevent
adolescent obesity. J. Adolesc. Health 2009, 45, S8–S17.
138

Nutrients 2019, 11, 710
52. Pomeranz, J.L.; Teret, S.P.; Sugarman, S.D.; Rutkow, L.; Brownell, K.D. Innovative Legal Approaches toAddress Obesity. Milbank Q 2009, 87, 185–213.
53. Hebebrand, J. Obesity prevention: Moving beyond the food addiction debate. J. Neuroendocrinol. 2015, 27,737–738. [PubMed]
54. Blundell, J.E.; Finlayson, G. Food addiction not helpful: The hedonic component—Implicit wanting—Isimportant. Addiction 2011, 106, 1216–1218. [PubMed]
55. Mackenzie, R. Don’t Let Them Eat Cake! A View from Across the Pond. Am. J. Bioeth. 2010, 10, 16–18.[PubMed]
56. deShazo, R.D.; Hall, J.E.; Skipworth, L.B. Obesity bias, medical technology, and the hormonal hypothesis:Should we stop demonizing fat people? Am. J. Med. 2015, 128, 456–460. [PubMed]
57. Rasmussen, N. Weight stigma, addiction, science, and the medication of fatness in mid-twentieth centuryAmerica. Sociol. Health Illn. 2012, 34, 880–895.
58. Goffman, E. Stigma: Notes on the Management of Spoiled Identity; Simon & Schuster: New York, NY, USA, 1963.59. Bannon, K.L.; Hunter-Reel, D.; Wilson, G.T.; Karlin, R.A. The effects of casual beliefs and binge eating on the
stigmatization of obesity. Int. J. Eat. Disord. 2009, 42, 118–124.60. Battle, E.K.; Brownell, K.D. Confronting a rising tide of eating disorders and obesity: Treatment vs. prevention
and policy. Addict. Behav. 1996, 21, 755–765.61. Schulte, E.M.; Tuttle, H.M.; Gearhardt, A.N. Belief in Food Addiction and Obesity-Related Policy Support.
PLoS ONE 2016, 11, e0147557.62. Moran, A.; Musicus, A.; Soo, J.; Gearhardt, A.N.; Gollust, S.E.; Roberto, C.A. Believing that certain foods are
addictive is associated with support for obesity-related public policies. Prev. Med. 2016, 90, 39–46. [PubMed]63. Alonso-Alonso, M.; Woods, S.C.; Pelchat, M.; Grigson, P.S.; Stice, E.; Faroogi, S.; Khoo, C.S.; Mattes, R.D.;
Beauchamp, G.K. Food reward system: Current perspectives and future research needs. Nutr. Rev. 2015, 73,296–307. [PubMed]
64. Gearhardt, A.N.; Corbin, W.R.; Brownell, K.D. Food addiction: An examination of the diagnostic criteria fordependence. J. Addict. Med. 2009, 3, 1–7.
65. Volkow, N.D.; Wise, R.A. How can drug addiction help us understand obesity? Nat. Neurosci. 2005, 8,555–560. [PubMed]
66. Willette, A.L. Where have all the parents gone? Do efforts to regulate food advertising to curb childhoodobesity pass constitutional muster? J. Leg. Med. 2007, 28, 561–577.
67. Morphett, K.; Partridge, B.; Gartner, C.; Carter, A.; Hall, W. Why Don’t Smokers Want Help to Quit?A Qualitative Study of Smokers’ Attitudes towards Assisted vs. Unassisted Quitting. Int. J. Environ. Res.Public Health 2015, 12, 6591–6607.
68. Uppal, N.; Shahab, L.; Britton, J.; Ratschen, E. The forgotten smoker: A qualitative study of attitudes towardssmoking, quitting, and tobacco control policies among continuing smokers. BMC Public Health 2013, 13, 432.
69. Smith, T.G. All foods are habit-forming—What I want to know is which will kill me! Addiction 2011, 106,1218–1220.
70. Andreyeva, T.; Long, M.W.; Brownell, K.D. The impact of food prices on consumption: A systematic reviewof research on the price elasticity of demand for food. Am. J. Public Health 2010, 100, 216–222.
71. Brownell, K.D.; Frieden, T.R. Ounces of prevention—The public policy case for taxes on sugared beverages.N. Engl. J. Med. 2009, 360, 1805–1808. [PubMed]
72. Gearhardt, A.N.; Grilo, C.M.; DiLeone, R.J.; Brownell, K.D.; Potenza, M.N. Can food be addictive? Publichealth and policy implications. Addiction 2011, 106, 1208–1212.
73. Gostin, L.O. Limiting what we can eat: A bridge too far? Milbank Q. 2014, 92, 173–176.74. Rush, B. An Inquiry into the Effects of Ardent Spirits Upon the Human Body and Mind: With an Account of the
Means of Preventing, and of the Remedies for Curing Them; James Loring: Boston, NY, USA, 1823.75. Jellinek, E.M. The Disease Concept of Alcoholism; Hillhouse: New Haven, CT, USA, 1960.76. Leshner, A.I. Addiction is a brain disease, and it matters. Science 1997, 278, 45–47. [PubMed]77. Barnett, A.I.; Hall, W.; Fry, C.L.; Dilkes-Frayne, E.; Carter, A. Drug and alcohol treatment providers’ views
about the disease model of addiction and its impact on clinical practice: A systematic review. Drug Alcohol Rev.2018, 37, 697–720.
78. Rich, E.; Evans, J. ‘Fat ethics’—The obesity discourse and body politics. Soc. Theory Health 2005, 3, 341–358.
139

Nutrients 2019, 11, 710
79. Crawford, R. Healthism and the medicalization of everyday life. Int. J. Health Serv. 1980, 10, 365–388.[PubMed]
80. Pescosolido, B.A.; Martin, J.K. The stigma complex. Annu. Rev. Sociol. 2015, 41, 87–116. [PubMed]81. Meadows, A.; Nolan, L.J.; Higgs, S. Self-perceived food addiction: Prevalence, predictors, and prognosis.
Appetite 2017, 114, 282–298. [PubMed]82. Pearl, R.L.; Puhl, R.M. Weight bias internalization and health: A systematic review. Obes. Rev. 2018, 19,
1141–1163. [PubMed]83. Schulte, E.M.; Joyner, M.A.; Schiestl, E.T.; Gearhardt, A.N. Future directions in “food addiction”: Next steps
and treatment implications. Curr. Addict. Rep. 2017, 4, 165–171.84. Vella, S.C.; Pai, N.B. A narrative review of potential treatment strategies for food addiction. Eat. Weight Disord.
2017, 22, 387–393. [PubMed]85. Grant, J.E.; Potenza, M.N.; Weinstein, A.; Gorelick, D.A. Introduction to behavioral addictions. Am. J. Drug
Alcohol Abuse 2010, 36, 233–241.86. Leeman, R.F.; Potenza, M.N. A targeted review of the neurobiology and genetics of behavioral additions:
An emerging area of research. Can. J. Psychiatry 2014, 58, 260–273.
© 2019 by the authors. Licensee MDPI, Basel, Switzerland. This article is an open accessarticle distributed under the terms and conditions of the Creative Commons Attribution(CC BY) license (http://creativecommons.org/licenses/by/4.0/).
140
nutrients
Article
Obesity Stigma: Is the ‘Food Addiction’ LabelFeeding the Problem?
Helen K. Ruddock 1,2, Michael Orwin 1,3, Emma J. Boyland 1, Elizabeth H. Evans 3 and
Charlotte A. Hardman 1,*
1 Department of Psychological Sciences, University of Liverpool, Liverpool L69 7ZX, UK2 School of Psychology, University of Birmingham, Birmingham B15 2TT, UK3 School of Psychology, Newcastle University, Newcastle NE1 7RU, UK* Correspondence: [email protected]
Received: 25 July 2019; Accepted: 30 August 2019; Published: 4 September 2019
Abstract: Obesity is often attributed to an addiction to high-calorie foods. However, the effect of“food addiction” explanations on weight-related stigma remains unclear. In two online studies,participants (n = 439, n = 523, respectively, recruited from separate samples) read a vignette about atarget female who was described as ‘very overweight’. Participants were randomly allocated to oneof three conditions which differed in the information provided in the vignette: (1) in the “medicalcondition”, the target had been diagnosed with food addiction by her doctor; (2) in the “self-diagnosedcondition”, the target believed herself to be a food addict; (3) in the control condition, there was noreference to food addiction. Participants then completed questionnaires measuring target-specificstigma (i.e., stigma towards the female described in the vignette), general stigma towards obesity(both studies), addiction-like eating behavior and causal beliefs about addiction (Study 2 only).In Study 1, participants in the medical and self-diagnosed food addiction conditions demonstratedgreater target-specific stigma relative to the control condition. In Study 2, participants in the medicalcondition had greater target-specific stigma than the control condition but only those with low levelsof addiction-like eating behavior. There was no effect of condition on general weight-based stigma ineither study. These findings suggest that the food addiction label may increase stigmatizing attitudestowards a person with obesity, particularly within individuals with low levels of addiction-likeeating behavior.
Keywords: food addiction; obesity; stigma; eating behavior; attitudes
1. Introduction
According to recent statistics, more than one-third of the world’s population is overweight orobesity. In the UK, these rates are even higher, with 64% of adults classed as having overweightor obesity [1]. Despite its prevalence, people with obesity frequently experience devaluation anddiscrimination (known as weight-related stigma) within educational, workplace, and healthcaresettings [2]. Evidence also suggests that people may be more likely to face discrimination because oftheir weight than because of their ethnicity, gender, or sexual orientation [3]. Weight-related stigma hasnegative consequences for individuals’ psychological and physical well-being [2,4,5] and may impedeweight-loss by prompting maladaptive eating patterns and exercise avoidance [2].
Negative attitudes towards people with obesity can be exacerbated by beliefs about the causes ofweight-gain. This is central to attribution theory, which suggests that people make judgements aboutthe cause of a condition; in turn, these judgements determine their attitudes towards an individual [6,7].For example, attributing obesity to factors that are within personal control (e.g., food choices) isthought to perpetuate obesity stigma [8]. Conversely, stigmatizing attitudes may be attenuated bythe belief that weight-gain is caused by uncontrollable factors (e.g., genetics). In support of this,
Nutrients 2019, 11, 2100; doi:10.3390/nu11092100 www.mdpi.com/journal/nutrients141

Nutrients 2019, 11, 2100
weight-related stigma was found to be most prevalent amongst individuals who believed that obesitywas within personal control and caused by a lack of willpower, inactivity, and overeating [9,10]. Similarfindings have been obtained from studies in which participants’ causal beliefs about obesity wereexperimentally manipulated. Specifically, participants who read an article that stated that obesity iscaused by overeating and a lack of exercise demonstrated more stigmatizing attitudes than participantsin a ‘no-prime’ control condition or those who read a neutral article about research into memoryskills [11,12]. Conversely, participants who were led to believe that obesity is caused by physiologicalfactors (i.e., factors that are beyond personal control) demonstrated less weight-related stigma thanthose in a control condition [8,13].
One increasingly prevalent etiological theory is that obesity is caused by an addiction to high-caloriefoods [14]. Proponents of this idea suggest that food and drugs have similar effects on the brain andargue that the clinical symptoms of substance abuse coincide with the behaviors and experiences ofpeople who engage in compulsive overeating [15,16]. While this idea is widely debated throughoutthe scientific community (e.g., [17–19]), the concept of food addiction has been readily accepted bythe general public [20]. Indeed, research suggests that the majority of people believe that obesity canbe caused by food addiction [21], and up to half of people believe that they are themselves addictedto food [22–24]. In light of its popularity, it is important to establish how food addiction models ofobesity might affect weight-related stigma.
A small number of studies have examined the effect of the food addiction label on obesity stigma.However, results to date have been inconsistent [25,26]. In one study [27], participants’ attitudestowards a person with ‘food addiction’ were compared with attitudes towards persons with obesity,drug addiction, and disability. The study reported similarly high levels of stigma towards the “obese”and “food addict” labels and, when combined, these labels together elicited greater stigma than eitherlabel alone. These findings align with those obtained by Lee et al. [21] who found that, while themajority (72%) of survey respondents believed that obesity could be caused by a ‘food addiction’, morethan half held the view that people with obesity are responsible for their condition (which would beexpected to perpetuate obesity stigma). However, in contrast, Latner et al. [28] found that providing afood addiction explanation for obesity appeared to reduce weight-stigma. In this study, participantsread one of two descriptions of a woman with obesity. In one condition (i.e., the ‘food addiction’condition), the woman was described as fitting “the typical profile of someone who is addicted to food”.In another condition (i.e., the ‘non-addiction’ condition), the woman was described as “someone whomakes unhealthy food choices”. The study found that participants in the food addiction conditiondisplayed lower levels of stigma towards the woman, and towards people with obesity more generally,compared with those in the non-addiction condition.
Inconsistent findings in previous studies may be explained by differences in participants’ causalbeliefs about food addiction. Specifically, the effect of the “food addiction” label on obesity stigma maydepend on the extent to which food addiction is perceived to be a legitimate medical condition. Onequalitative study found that people with overweight and obesity were reluctant to label themselvesas a food addict due to concerns that this would be viewed as an ‘excuse’ for overeating [29].Indeed, providing excuses for weight gain may exacerbate negative attitudes towards those withobesity [30]. In contrast, attributing obesity to a medically diagnosed ‘food addiction’ may legitimizethe condition and help to reduce weight-related stigma by removing personal responsibility from theindividual [31,32].
To test these ideas, across two studies, we examined the effect of medically-diagnosed andself-diagnosed food addiction on weight-related stigma. Using a similar technique to Latner et al. [28],participants read one of three vignettes which described a woman with obesity. In the ‘medical’condition, the vignette stated that the woman had been diagnosed with food addiction by her generalpractitioner (GP). In the ‘self-diagnosed’ condition, the vignette stated that the woman believed herselfto be a food addict. There was no reference to food addiction in the control condition. Subsequentattitudes towards the woman (i.e., target-specific stigma) and obesity in general (i.e., general stigma)
142

Nutrients 2019, 11, 2100
were then assessed. We hypothesized that weight-related stigma would be significantly lower in themedical condition, and higher in the self-diagnosed condition, relative to in the control condition.Based on previous findings [28], we predicted that the food addiction label would influence bothtarget-specific and general weight-related stigma.
2. Study 1 Method
2.1. Participants
Female participants were invited to take part in a study into ‘perceptions of employability amongstudents’. Participants were recruited via social media advertisements and on internal webpages at theUniversity of Liverpool, UK. Participants who were enrolled in the Psychology degree program at theUniversity received course credits in exchange for taking part. A total of 440 participants completedthe survey (533 participants started the study, but 93 did not complete all of the measures and sowere excluded from analyses). To be eligible to take part, participants were required to be aged over18 years old. The majority of participants were students (81%), and 90% of the sample were Caucasian.The mean age of participants was 21.2 y (SD = 7.1), and the mean self-reported body mass index (BMI)was 22.2 kg/m2 (SD = 3.4). Participants with a self-reported BMI over 30 kg/m2 (i.e., classified ashaving obesity) comprised 2.7% of the sample, 12.5% had a self-reported BMI between 25–29.9 kg/m2
(i.e., ‘overweight’), 76.8% had a self-reported BMI between 18.5–24.9 kg/m2 (i.e., healthy weight), and8.0% had a BMI below 18.5 kg/m2 (i.e., ‘underweight’). Participants provided informed consent prior tocompleting the study. Ethical approval was granted by the University of Liverpool’s ethics committee(approval code: IPHS-1516-SMc-259-Generic RETH000619).
2.2. Procedure
The study was delivered via the online survey platform, Qualtrics (Qualtrics, Provo, UT, USA).Participants were asked to read an information sheet and, if they wished to continue with the study,were required to tick a consent box. On the first screen of the survey, a picture of a woman with obesity(“Paulina”) was displayed, along with a short vignette which described her hobbies, family, andeducation (see online supplementary material). Paulina was also described as being ‘very overweight’.Participants were randomly allocated to view one of three versions of the vignette: (1) In the ‘medical’condition, the vignette stated that Paulina’s “GP had recently diagnosed her as having a food addiction”;(2) in the ‘self-diagnosed’ condition, the vignette stated that Paulina “believes herself to be addictedto food”; (3) in the ‘control’ condition, there was no mention of food addiction. After reading thevignette, participants completed the measures in the following order: Modified Fat-Phobia Scale(M-FPS) (to assess target-specific stigma towards Paulina), employability questionnaire (included aspart of the cover story), Anti-fat Attitudes (AFA; to assess general stigma towards people with obesity),and the Dutch Eating Behavior Questionnaire (DEBQ; to assess external, restrained, and emotionaleating behavior). Participants were then asked to indicate their gender, age, ethnicity, occupation,and height and weight (which were used to calculate BMI). They then completed the item aboutself-perceived food addiction. After completing the study, participants read a debrief sheet whichexplained the true aim of the study.
2.3. Measures
2.3.1. Target Specific Stigma: Modified Fat-Phobia Scale (M-FPS)
The 14-item Fat Phobia Scale [33] was modified such that participants were asked to indicatetheir beliefs about a fictional individual named Paulina (Paulina was the name of the target femalefeatured in the vignette. See Section 2.2). This scale consists of 14 pairs of antonyms which could beused to describe individuals with obesity (e.g., ‘lazy’ vs. ‘industrious’). Higher scores on the M-FPS(i.e., indicative of more negative attitudes) have been positively associated with beliefs that obesity
143

Nutrients 2019, 11, 2100
is within personal control [9]. Participants were required to indicate their perceptions of Paulinaby selecting one of five points between each pair of words. A mean score was calculated for eachparticipant. Higher scores on this measure indicated more negative attitudes towards Paulina. In thecurrent sample, the internal reliability of the M-FPS was high (Cronbach’s α = 0.834).
2.3.2. General Stigma: Anti-fat Attitudes (AFA)
The AFA [8] consists of 13 items which assess stigmatizing attitudes toward individuals withobesity (e.g., “I dislike people who are overweight or obese”). Responses are provided on a 9-pointscale ranging from ‘Very strongly disagree’ to ‘Very strongly agree’ (in Study 1, a 5-point Likert scalewas used, but this was corrected to a 9-point scale in Study 2). Higher scores indicate stronger anti-fatattitudes. The scale comprises three subscales which assess dislike (i.e., obesity stigma), willpower(i.e., beliefs about weight controllability), and fear of fat (i.e., concerns about personal weight gain)(Cronbach’s α = 0.796).
2.3.3. Dutch Eating Behavior Scale (DEBQ)
The DEBQ [34] consists of 33 items which assess eating behavior. The scale comprises threesubscales assessing Restrained Eating (DEBQ-R; 10 items), Emotional Eating (DEBQ-EM; 13 items),and External Eating (DEBQ-EX; 10-items). Previous research has demonstrated the ability of theDEBQ to predict restrictive eating tendencies [35], eating in response to external food-cues [36], andstress-induced eating [37]. Responses are recorded on a 5-point Likert-type scale ranging from ‘Never’to ‘Very often’. Higher scores indicate greater restrained, emotional, or external eating. The DEBQ wasincluded to ensure that participants did not differ, between conditions, with regards to their eatingbehavior. The internal reliability for each of the subscales was high (DEBQ-R: Cronbach’s α = 0.933;DEBQ-EX: Cronbach’s α = 0.869; DEBQ-EM Cronbach’s α = 0.932).
2.3.4. Self-Perceived Food Addiction (SPFA)
To assess whether or not participants believed themselves to be a food addict, participants werepresented with the statement “I believe myself to be a food addict” with response options “Yes” or“No”. Similar measures have been used in previous research, and positive responses on this assessmenthave been associated with greater food reward, overeating [23,38], and fear of being stigmatized byothers [22].
2.3.5. Employability Questions
For consistency with the study’s cover story, seven items were included which assessed participants’beliefs about Paulina’s employability (e.g., How likely would you be to employ Paulina?). Responseswere recorded using Visual Analogue Scales (VAS) ranging from 0 (not at all) to 100 (extremely). Higherscores indicated more positive attitudes towards Paulina’s employability. Analyses of the effect ofcondition on employability ratings are presented in the supplementary materials.
2.4. Data Analysis
A MANOVA was conducted to check whether participants differed between conditions on age,BMI, and DEBQ subscale scores. Chi-squared tests were conducted to check for any differences betweenthe proportion of students/non-students and Caucasian/non-Caucasian participants allocated to eachcondition. To examine the effect of condition on target-specific and general stigma, two ANOVAs wereconducted with the condition (i.e., control, medical, self-diagnosed) as the independent variable, andM-FPS (i.e., target specific stigma) and AFA (i.e., general stigma) scores as dependent variables. Wheresignificant main effects were identified, these were followed up by inspecting pairwise comparisons.
We conducted exploratory analyses to examine whether self-reported BMI moderated the effect ofcondition on mean Modified Fat Phobia Scale (M-FPS) and Anti-Fat Attitudes (AFA) scores. To do this,
144

Nutrients 2019, 11, 2100
we conducted two hierarchical multiple linear regression to examine the relative contributions of BMI(centered) and condition to mean M-FPS scores and AFA scores. All three conditions were dummycoded with the Control condition as the reference variable. To assign dummy codes, two dummyvariables were created: D1 (Medical) and D2 (Self-diagnosed). Participants in the medical conditionwere assigned ‘1’ to D1, and ‘0’ for D2. Participants in the self-diagnosed condition were assigned ‘0’ toD1 and 1 to D2. Participants in the control condition (i.e., the reference category) were assigned 0 toboth D1 and D2. (see [39] for more information about dummy coding). Dummy-coded conditions werethen entered into Step 1 of each regression model, along with BMI. The interaction terms (i.e., BMI ×medical vs. control/self-diagnosed vs. control) were entered into Step 2 of the model.
Additional exploratory analyses were conducted to examine whether the effect of condition ontarget-specific and general stigma was moderated by participants’ age or DEBQ subscales. Furtherdetails and results from these analyses are provided in the supplementary materials.
3. Results
3.1. Participant Characteristics
The MANOVA revealed that BMI differed significantly between conditions, F(2,434) = 4.80,p = 0.009, ηp2 = 0.022. This was due to a higher mean BMI in the medical condition relative to theself-diagnosed condition (p = 0.002). Participant characteristics as a function of condition are displayedin Table 1. Participants did not differ with regards to age or scores on DEBQ-subscales. Chi-squared tests(X2) revealed no difference in the proportion of students/non-students and Caucasian/non-Caucasianparticipants in each condition.
Table 1. Participant characteristics as a function of condition.
VariableMedical
(N = 148)Self-Diagnosed
(N = 144)Control
(N = 146)Between-Group
Differences
Age (y) 21.09 (±6.44) 21.07 (±7.45) 21.38 (±7.32) F(2,435) =0.09, p = 0.916BMI (kg/m2) 22.60 (±3.22) * 21.60 (±2.95) * 22.04 (±2.93) F(2,432) =3.64, p = 0.027
DEBQ-Restraint 2.94 (±0.96) 2.72 (±0.90) 2.89 (±0.86) F(2,436) =2.38, p = 0.094DEBQ-Emotion 2.97 (±0.90) 2.80 (±0.90) 2.84 (±0.86) F(2,436) =1.43, p = 0.240DEBQ-External 3.34 (±0.69) 3.21 (±0.59) 3.35 (±0.71) F(2,436) =1.95, p = 0.143
Ethnicity (% Caucasian) 93.3 91.0 86.4 X2(2) = 4.12, p = 0.127Occupation (% students) 83.2 83.3 81.6 X2(2) = 0.186, p = 0.911
Results are means (standard deviations) unless otherwise specified (* significant difference, p < 0.05).
3.2. Effect of Condition on Target-Specific and General Stigma
There was a main effect of condition on mean Modified Fat Phobia Scale (M-FPS) score(i.e., target-specific stigma), F(2,437) = 9.07, p < 0.001, ηp2 = 0.040. Pairwise comparisons revealed that,compared to those in the control condition, M-FPS scores were higher in the medical (p < 0.001) andself-diagnosed (p = 0.001) conditions (Figure 1) (Control condition: Mean = 3.47, SD = 0.47, range =2.29–4.71; Self-diagnosed: Mean = 3.66, SD = 0.48, range = 2.71–4.93; Medical: Mean = 3.68, SD = 0.52,range = 1.00–5.00). There was no difference in mean M-FPS scores between those in the medical andself-diagnosed conditions (p = 0.730). There was no effect of condition on Anti-Fat Attitudes (AFA)total scores (i.e., general stigma), F(2,437) = 0.754, p = 0.471, (Control condition: Mean = 1.78, SD = 0.56,range = 0.31–3.46; Self-diagnosed: Mean = 1.71, SD = 0.56, range = 0.23–3.00; Medical: Mean = 1.72,SD = 0.56, range = 0.38–3.38).
145

Nutrients 2019, 11, 2100
aa
b
Figure 1. Mean Modified Fat Phobia Scale (M-FPS) scores (i.e., target specific stigma) as a functionof condition. Different letters indicate significant differences. Higher scores indicate more negativeattitudes towards Paulina (i.e., higher levels of target-specific stigma). Error bars denote standard error.
3.3. Moderating Effect of BMI
Hierarchical linear regression analyses were conducted to examine whether BMI moderated theeffect of condition on target-specific (i.e., M-FPS scores) and general (AFA scores) stigma. Resultsfrom the exploratory analysis predicting M-FPS scores are provided in Table 2. In Step 1 and Step 2of the model, M-FPS scores were significantly predicted by both condition (medical vs. control andself-diagnosed vs. control) and BMI; higher BMI was associated with lower M-FPS scores. However,M-FPS scores were not significantly predicted by the BMI × Condition interaction terms in Step 2 ofthe model.
Neither BMI nor condition predicted AFA scores in Step 1 of the model (r2 = 0.005, p = 0.510), andthe inclusion of interaction terms in Step 2 did significantly improve the fit of the model r2 = 0.015,p= 0.124).
Table 2. Regression output with mean M-FPS (i.e., target-specific stigma) as the dependent variable.
Model B SE t p
Step 1
BMI −0.015 * 0.007 −2.119 0.035Medical 0.230 ** 0.056 4.109 <0.001Self-diagnosed 0.189 ** 0.056 3.360 0.001
Step 2
BMI −0.034 * 0.013 −2.547 0.011Medical 0.223 ** 0.056 3.992 <0.001Self-diagnosed 0.190 ** 0.056 3.360 0.001BMI ×Medical 0.031 0.017 1.816 0.070BMI ×Self-diagnosed 0.019 0.019 0.980 0.327
* p < 0.05, ** p < 0.01. Step 1: r2 = 0.051, p < 0.001; Step 2: r2 = 0.058, p = 0.194
4. Interim Discussion
Study 1 found that female participants who were exposed to medical and self-diagnosed foodaddiction vignettes exhibited more target-specific stigma towards a woman with obesity than those in
146

Nutrients 2019, 11, 2100
the control condition. This is consistent with previous research in which the food addiction label wasfound to exacerbate stigmatizing attitudes towards an individual with obesity and ‘food addiction’ [27].
One possibility is that ‘food addiction’ stigma may be particularly high amongst those whoperceive addiction to be within personal control [7]. This is supported by previous research in whichperceiving addiction as a disease, rather than due to personal choice, was associated with reducedstigma towards people with addictive disorders [40,41]. Similarly, biogenetic explanations havebeen found to reduce stigma towards obesity, problematic eating, and substance abuse, relative tobehavior-based explanations [10,31,42]. In Study 2, we examined whether the effect of food addictioncondition on stigma would be moderated by the extent that addiction is viewed as a ‘disease’ relativeto personal choice.
We also examined whether stigmatizing attitudes towards the target with food-addiction wouldbe moderated by individuals’ scores on a measure of addiction-like eating. Previous research hasfound that individuals with personal experience of addiction have less negative attitudes towardsothers with addiction [43]. Furthermore, social identity theory suggests that individuals view other‘in-group’ members more favorably than out-group members [44]. Therefore, we predicted that theeffect of condition on target-specific stigma would be attenuated in participants with greater levels ofaddiction-like eating behavior.
Finally, we examined whether the effect of condition on target-specific and general stigmawould differ between males and females. Previous research has found that females demonstrate lessobesity-related stigma and stigma towards the ‘food addiction’ label than males [27]. We, therefore,hypothesized that the exacerbating effect of the food addiction label on stigma would be mostpronounced in males.
To summarize, Study 2 examined the following hypotheses: (1) The effect of condition ontarget-specific and general stigma would be attenuated in those with greater support for the diseasemodel of addiction. (2) The effect of condition on stigma would be attenuated in those who scorehighly on a measure of addiction-like eating, relative to those who score lower on addiction-like eating.(3) The effect of condition on stigma would be attenuated in females, relative to males.
5. Study 2 Method
5.1. Participants
Male and female participants, aged over 18 years, were invited to take part in a study into‘employability perceptions’. A total of 523 (190 males; 314 females; 19 did not disclose their gender)participants completed the study. Six hundred and ten participants started the online survey, but87 either did not complete it or were aged under 18 years old and were excluded from analyses.Participants were recruited from the University of Liverpool (n = 333) and Newcastle University(n = 190) in the UK. The mean age of participants was 27.1 (SD = 11.3) years, and the mean self-reportedBMI was 23.6 kg/m2 (SD = 4.1). Participants with self-reported BMI over 30 kg/m2 (i.e., classified ashaving obesity) comprised 7.1% of the sample, 21.6% had a self-reported BMI between 25–29.9 kg/m2
(i.e., ‘overweight’), 64.4% had a self-reported BMI between 18.5–24.9 kg/m2 (i.e., healthy weight), and5.5% had a self-reported BMI below 18.5 kg/m2 (i.e., ‘underweight’). Just over half of the sample wereuniversity students (n = 275, 52.4%) and the majority were Caucasian (n = 465, 88.9%). Ethical approvalwas granted by the relevant ethics committee at each of the two sites (University of Liverpool approvalcode: IPHS-1516-SMc-259-Generic RETH000619; Newcastle University approval code 1485/4293).
5.2. Materials and Procedure
Study 2 used the same materials and procedure as Study 1 but with the followingadditional measures:
147

Nutrients 2019, 11, 2100
5.2.1. Addiction Belief Scale (ABS)
The ABS [39] was used to measure beliefs about addiction. Nine items assessed the belief thataddiction is a disease (disease subscale, Cronbach’s α = 0.590), and nine items assessed the belief thataddiction is within personal control (free will subscale, Cronbach’s α = 0.546). Items were rated on a5-point Likert scale ranging from ‘strongly disagree’ to ‘strongly agree’. Higher scores indicate greatersupport for the belief that addiction is akin to a disease (disease subscale), and a matter of personalchoice (free will subscale).
5.2.2. Addiction-Like Eating Behaviour Scale (AEBS)
The AEBS [45] consists of 15 items which assess the presence of behaviors that are commonlyassociated with addiction-like eating (e.g., ‘I continue to eat despite feeling full’). Responses areprovided on 5-point Likert Scales ranging from ‘Strongly disagree’ to ‘Strongly agree’, and from ‘Never’to ‘Always’. The scale comprises two subscales: appetitive drive (9 items, Cronbach’s α = 0.890) andlow dietary control (6 items, Cronbach’s α = 0.806). Higher scores indicate greater addiction-like eatingbehavior. Previous research suggests that this measure correlates positively with other measures ofdisinhibited eating (i.e., the Binge Eating Scale, [46]) and explains greater variance in BMI over andabove other measures of ‘food addiction’ such as the Yale Food Addiction Scale [47].
5.2.3. Data Analysis
A MANOVA was conducted to check whether participants differed, between conditions, withregards to age, BMI, DEBQ subscales scores, and scores on the Addiction-like Eating Behaviour Scale(AEBS) and Addiction Belief Scale (ABS). Chi-squared tests were conducted to check for any differencesbetween the proportion of students/non-students, Caucasian/non-Caucasian, and males/femalesallocated to each condition. As in Study 1, two univariate ANOVAs were conducted to examine theeffect of condition on Anti-fat Attitudes (AFA; general stigma) and Modified-Fat Phobia Scale (M-FPS)scores (target-specific stigma). Gender was also included in the model as a between-subjects variable.
Hierarchical multiple linear regression analyses were conducted to examine whether any effectsof condition on target-specific and general stigma were moderated by support for the ‘disease’ modelof addiction (i.e., ABS-disease scores), and addiction-like eating behavior (i.e., AEBS scores). All threeconditions were dummy coded with the Control condition as the reference variable. To assign dummycodes, two dummy variables were created: D1 (Medical) and D2 (Self-diagnosed). Participants inthe medical condition were assigned ‘1’ to D1, and ‘0’ for D2. Participants in the self-diagnosedcondition were assigned ‘0’ to D1 and 1 to D2. Participants in the control condition (i.e., the referencecategory) were assigned 0 to both D1 and D2. (see [48] for more information about dummy coding).Dummy-coded conditions were then entered into Step 1 of each regression model, along with AddictionBelief Scale (disease subscale) or AEBS scores. The interaction terms (i.e., AEBS/Addiction Belief Scale(disease subscale) × medical vs. control/self-diagnosed vs. control) were entered into Step 2 of themodel. Separate regression analyses were conducted to examine the ability of each interaction termto predict AFA scores (i.e., general stigma) and M-FPS scores (i.e., target-specific stigma). AddictionBelief Scale (disease subscale) and AEBS scores were centered prior to analyses.
6. Results
6.1. Participant Characteristics
Participants did not differ between conditions on any of the assessed characteristics (Table 3).
148
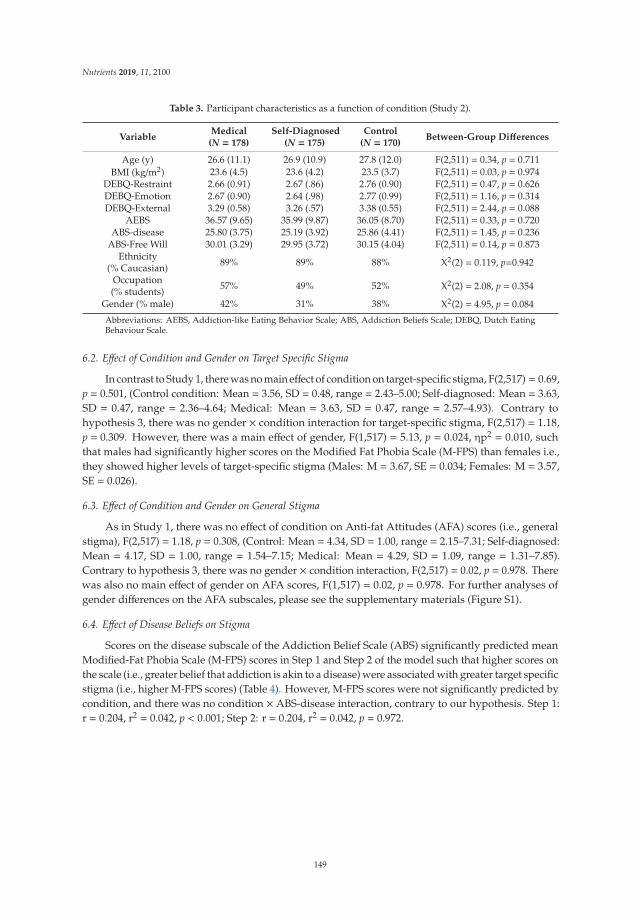
Nutrients 2019, 11, 2100
Table 3. Participant characteristics as a function of condition (Study 2).
VariableMedical
(N = 178)Self-Diagnosed
(N = 175)Control
(N = 170)Between-Group Differences
Age (y) 26.6 (11.1) 26.9 (10.9) 27.8 (12.0) F(2,511) = 0.34, p = 0.711BMI (kg/m2) 23.6 (4.5) 23.6 (4.2) 23.5 (3.7) F(2,511) = 0.03, p = 0.974
DEBQ-Restraint 2.66 (0.91) 2.67 (.86) 2.76 (0.90) F(2,511) = 0.47, p = 0.626DEBQ-Emotion 2.67 (0.90) 2.64 (.98) 2.77 (0.99) F(2,511) = 1.16, p = 0.314DEBQ-External 3.29 (0.58) 3.26 (.57) 3.38 (0.55) F(2,511) = 2.44, p = 0.088
AEBS 36.57 (9.65) 35.99 (9.87) 36.05 (8.70) F(2,511) = 0.33, p = 0.720ABS-disease 25.80 (3.75) 25.19 (3.92) 25.86 (4.41) F(2,511) = 1.45, p = 0.236
ABS-Free Will 30.01 (3.29) 29.95 (3.72) 30.15 (4.04) F(2,511) = 0.14, p = 0.873Ethnicity
(% Caucasian) 89% 89% 88% X2(2) = 0.119, p=0.942
Occupation(% students) 57% 49% 52% X2(2) = 2.08, p = 0.354
Gender (% male) 42% 31% 38% X2(2) = 4.95, p = 0.084
Abbreviations: AEBS, Addiction-like Eating Behavior Scale; ABS, Addiction Beliefs Scale; DEBQ, Dutch EatingBehaviour Scale.
6.2. Effect of Condition and Gender on Target Specific Stigma
In contrast to Study 1, there was no main effect of condition on target-specific stigma, F(2,517) = 0.69,p = 0.501, (Control condition: Mean = 3.56, SD = 0.48, range = 2.43–5.00; Self-diagnosed: Mean = 3.63,SD = 0.47, range = 2.36–4.64; Medical: Mean = 3.63, SD = 0.47, range = 2.57–4.93). Contrary tohypothesis 3, there was no gender × condition interaction for target-specific stigma, F(2,517) = 1.18,p = 0.309. However, there was a main effect of gender, F(1,517) = 5.13, p = 0.024, ηp2 = 0.010, suchthat males had significantly higher scores on the Modified Fat Phobia Scale (M-FPS) than females i.e.,they showed higher levels of target-specific stigma (Males: M = 3.67, SE = 0.034; Females: M = 3.57,SE = 0.026).
6.3. Effect of Condition and Gender on General Stigma
As in Study 1, there was no effect of condition on Anti-fat Attitudes (AFA) scores (i.e., generalstigma), F(2,517) = 1.18, p = 0.308, (Control: Mean = 4.34, SD = 1.00, range = 2.15–7.31; Self-diagnosed:Mean = 4.17, SD = 1.00, range = 1.54–7.15; Medical: Mean = 4.29, SD = 1.09, range = 1.31–7.85).Contrary to hypothesis 3, there was no gender × condition interaction, F(2,517) = 0.02, p = 0.978. Therewas also no main effect of gender on AFA scores, F(1,517) = 0.02, p = 0.978. For further analyses ofgender differences on the AFA subscales, please see the supplementary materials (Figure S1).
6.4. Effect of Disease Beliefs on Stigma
Scores on the disease subscale of the Addiction Belief Scale (ABS) significantly predicted meanModified-Fat Phobia Scale (M-FPS) scores in Step 1 and Step 2 of the model such that higher scores onthe scale (i.e., greater belief that addiction is akin to a disease) were associated with greater target specificstigma (i.e., higher M-FPS scores) (Table 4). However, M-FPS scores were not significantly predicted bycondition, and there was no condition × ABS-disease interaction, contrary to our hypothesis. Step 1:r = 0.204, r2 = 0.042, p < 0.001; Step 2: r = 0.204, r2 = 0.042, p = 0.972.
149

Nutrients 2019, 11, 2100
Table 4. Regression output for Addiction Belief Scale (ABS)-disease with M-FPS (target-specific stigma)as the dependent variable.
Model B SE t p
Step 1
Medical 0.072 0.050 1.427 0.154Self-diagnosed 0.091 0.051 1.797 0.073ABS-disease 0.023 ** 0.005 4.439 0.000
Step 2
Medical 0.071 0.050 1.415 0.158Self-diagnosed 0.090 0.051 1.781 0.076ABS-disease 0.022 ** 0.008 2.685 0.007ABS-Disease ×Medical 0.002 0.012 0.195 0.846ABS-Disease ×Self-diagnosed 0.000 0.012 −0.034 0.972
** p < 0.01. The control condition was used as the reference category against which medical and self-diagnosedconditions were compared. Abbreviations: ABS, Addiction Belief Scale. Step 1: r2 = 0.042, p < 0.001; Step 2:r2 = 0.042, p = 0.972).
Similarly, scores on the disease subscale of the ABS significantly predicted Anti Fat Attitude(AFA) scores (i.e., general stigma) in Step 1 and Step 2 of the model such that higher scores on theABS-disease subscale predicted higher AFA scores (Table 5). Contrary to hypothesis 1, AFA scoreswere not significantly predicted by condition, and there was no interaction between condition anddisease scores on AFA.
Table 5. Regression output for ABS-disease with Anti Fat Attitude (AFA; general stigma) as thedependent variable.
Model B SE t p
Step 1
Medical −0.056 0.109 −0.516 0.606Self-diagnosed −0.146 0.110 −1.331 0.184ABS-disease 0.047 ** 0.011 4.281 0.000
Step 2
Medical −0.053 0.109 −0.482 0.630Self-diagnosed −0.147 0.110 −1.337 0.182ABS-disease 0.059 ** 0.018 3.295 0.001ABS-Disease ×Medical −0.016 0.027 −0.582 0.560ABS-Disease ×Self-diagnosed −0.021 0.026 −0.791 0.429
** p < 0.01. The control condition was used as the reference category against which medical and self-diagnosedconditions were compared. Step 1: r = 0.198, r2 = 0.039, p < 0.001; Step 2: r = 0.201, r2 = 0.040, p = 0.707.
6.5. Addiction-Like Eating Behavior
Addiction-like Eating Behavior Scale (AEBS) scores and condition did not predict Modified FatPhobia Scale (M-FPS) (target-specific stigma) scores in Step 1 of the model. However, the inclusionof the interaction terms in Step 2 significantly improved the fit of the model. Regression coefficientsrevealed a significant interaction between AEBS scores and medical (vs. control) condition on M-FPSscores (Table 6).
150

Nutrients 2019, 11, 2100
Table 6. Regression output for Addiction-like Eating Behavior Scale (AEBS) scores with M-FPS(target-specific stigma) as the dependent variable.
Model B SE t p
Step 1
Medical 0.067 0.051 1.32 0.186Self-diagnosed 0.071 0.051 1.38 0.168AEBS 0.003 0.002 1.42 0.156
Step 2
Medical 0.067 0.051 1.32 0.187Self-diagnosed 0.071 0.051 1.39 0.165AEBS 0.008 0.004 1.90 0.058AEBS ×Medical −0.013 * 0.006 −2.35 0.019AEBS × Self-diagnosed 0.000 0.006 −0.065 0.948
* p < 0.05. The control condition was used as the reference category against which medical and self-diagnosedconditions were compared. Abbreviations: AEBS, Addiction-like Eating Behavior Scale. Step 1: r2 = 0.009, p = 0.214;Step 2: r2 = 0.023, p = 0.020.
To further examine the interaction between AEBS scores and condition on M-FPS scores, weused the Johnson–Neyman technique [49] to identify the levels of addiction-like eating (i.e., AEBSscores) at which condition elicited a significant difference on M-FPS scores [50]. Using PROCESS(Version 3.1., [51]), the Medical (dummy-coded) condition was entered as the predictor variable, AEBSscores were entered as the moderator variable, and Self-diagnosed condition (dummy-coded) and theSelf-diagnosed × AEBS interaction term were entered as covariates. Mean-FPS scores were enteredas the dependent variable. This analysis showed that the Medical condition resulted in significantlygreater M-FPS scores, relative to the Self-diagnosed and Control conditions (ps < 0.05), but only forthose with low AEBS scores (centered AEBS score ≤ –2.81) (Figure 2). Findings are, therefore, consistentwith our hypothesis that the effect of condition on stigma would be attenuated in those with higherlevels of addiction-like eating behavior.
Figure 2. The effect of condition on M-FPS scores at different levels of addiction-like eating behavior(assessed using the AEBS). The shaded area represents the region of significance identified using theJohnson-Neyman technique.
The condition × AEBS scores model predicting (general stigma) AFA scores was not significant(Step 1: r = 0.069, r2 = 0.005, p = 0.484; Step 2: r = 0.084, r2 = 0.007, p = 0.540).
151

Nutrients 2019, 11, 2100
7. Discussion
Across two studies, we examined the effect of the food addiction label on stigmatizing attitudestowards an individual with obesity (i.e., target specific), and towards people with obesity moregenerally (i.e., general stigma). In Study 1, participants in both the medical and self-diagnosed foodaddiction conditions demonstrated greater target-specific stigma relative to the control condition. Therewas no effect of condition on general stigmatizing attitudes towards people with obesity. However,findings from Study 1 were not replicated in Study 2, in which we included both male and femaleparticipants. That is, we found no overall differences between the food addiction conditions and thecontrol condition on target-specific stigma. The effect of condition on target-specific or general stigmawas also not moderated by addiction disease beliefs (i.e., the extent to which addiction is perceivedas a disease) or gender, in Study 2. However, there was a significant condition by addiction-likeeating behavior interaction on target-specific stigma; participants who scored low on a measure ofaddiction-like eating demonstrated greater target-specific stigma in the Medical condition relative toControl and Self-diagnosed conditions. In contrast, target-specific stigma did not differ as a function ofcondition for those with high levels of addiction-like eating.
Findings from Study 1 are consistent with previous findings in which the food addiction labeladded to the stigma of obesity [27]. Higher levels of stigma towards the ‘self-perceived’ food-addictedtarget in the current study may reflect perceptions of food addiction as an ‘excuse’ for overeating. Thisis supported by qualitative evidence that individuals with overweight or obesity may be reluctant tolabel themselves as food addicts due to concerns that this would be perceived as an ‘excuse’ for theirweight [29].
We predicted that the medical condition might legitimize the concept of food addiction andthereby reduce weight-related stigma (i.e., by removing personal responsibility from the individual).However, contrary to our hypothesis, in Study 1, we found that target-specific stigma was also higherin the medical condition compared to the control condition and did not differ from levels observed inthe self-diagnosed condition. This finding is inconsistent with predictions from attribution theory [7]in which undesirable behaviors that are perceived as beyond personal control are thought to elicit lessstigma than those that are perceived as controllable. One possibility is that food addiction explanationsincrease stigma by inadvertently emphasizing the behavioral aspect of obesity. That is, food addictionmay imply a loss of control over eating, and previous studies have found that this may increasestigmatizing attitudes towards obesity [52]. Another possible explanation is that food addiction, unlikeother biological causes of obesity, is believed to be within personal control and that medicalizing theterm does not remove perceptions of personal responsibility. Indeed, Lee et al. [21] reported thatalmost three-quarters of people supported food addiction as a cause of obesity, and yet obesity wasstill viewed as a condition that individuals need to take responsibility for. Therefore, it may be the casethat stigmatizing attitudes towards ‘food addicted’ individuals are dependent upon the extent thataddiction is perceived as being outside of personal control and/or akin to a disease. In relation to this,Study 2 examined whether the effect of food addiction condition on stigma would be attenuated inthose with greater support for the disease model of addiction (results discussed below).
Study 1 therefore suggests that the food addiction label exacerbated stigmatizing attitudestowards a woman with obesity, regardless of whether the food addiction was medically diagnosed orself-diagnosed. Notably, findings from Study 1 are inconsistent with those obtained in a previous studyin which a ‘food addiction’ explanation for obesity elicited lower levels of target-specific and generalstigma than a control explanation [28]. This inconsistency may be attributable to the control conditionsused in ours and Latner et al.’s [28] study; in the current study, participants in the control conditionwere not provided with any explanation for the target’s weight status. In contrast, participants inLatner et al.’s [28] study read that obesity is caused by repeatedly choosing to consume high-caloriefoods. By emphasizing the role of personal choice, it is possible that the control condition used byLatner et al. [28] may have elicited greater stigma than a ‘food addiction’ explanation for obesity.
152

Nutrients 2019, 11, 2100
In Study 2, we found that greater support for the disease model of addiction was associatedwith greater target-specific and general stigma towards obesity. This finding was unexpected andis contrary to predictions derived from attribution theory. One possibility is that the perception ofaddiction as a ‘disease’ encourages the view that addicts are abnormal and perpetuates an ‘us-them’distinction [53]. Holding disease views of addiction also suggests that the person’s condition isirrevocable and permanent [54]. Another possibility is that causal beliefs about food addiction do notcoincide with perceptions of other addictions. That is, individuals who support the ‘disease’ modelfor substance-based addictions may not necessarily attribute food addiction to a disease. Previousresearch supports this, indicating that addictions vary in the extent to which they are attributed todisease or personal choice. In particular, de Pierre et al. [40] found that food addiction was perceived asless of a disease and more within personal control compared with other addictions such as alcoholism.The measure of addiction beliefs (i.e., the ABS) used in the current study referred to addiction ingeneral, and thus may not have reflected participants’ beliefs about food addiction per se.
However, the moderating effect of addiction-like eating on target-specific stigma, observed inStudy 2, suggest that medically diagnosed food addiction could exacerbate weight-related stigmabut only for people with low levels of addiction-like eating tendencies. A possible explanation forthis finding is that individuals with personal experience of problematic eating (i.e., high AEBS scores)may have identified more with the target in the vignette and thereby displayed less negative attitudestowards her food addiction (e.g., see [43,44]) as opposed to participants with low AEBS scores.
In Study 2, male participants demonstrated significantly higher target-specific stigma, relativeto female participants. Males and females did not differ on a measure of general weight-relatedstigma. However, the lack of interaction between gender and condition is inconsistent with previousresearch [27] in which stigmatizing attitudes towards a ‘food addicted’ target were lower in females,relative to males. This null result may be explained by the fact that, in the current study, males hada significantly higher mean BMI than females (see Table S1). A previous study found that peoplewith higher BMI hold less stigmatizing attitudes towards the ‘food addict’ label, relative to those withlower BMI [27]. Consistent with this, in Study 1, we found that higher BMI was associated with lowertarget-specific weight stigma. It is therefore possible that, in the current study, any moderating effect ofgender on stigma may have been masked by the higher BMI of male, relative to female, participants.Future research should examine the moderating effect of gender on stigmatizing attitudes towards afood-addicted target in samples of males and females matched for BMI.
The inconsistent findings obtained across Studies 1 and 2 could not be attributable to the inclusionof males in Study 2 as the effect of condition on target-specific stigma was not moderated by gender.The sample tested in Study 2 comprised a larger proportion of older, non-students than the sampletested in Study 1. However, exploratory analyses revealed that the effect of condition on stigma wasnot moderated by student status or age (see online supplementary material). Differences betweenStudies 1 and 2 are, therefore, likely due to another (unknown) variable. Moreover, these findingssuggest that the effects of the food addiction label on weight-related stigma may not be generalizableacross populations.
There are several limitations to the current study that require consideration. Firstly, we note thatthe Addiction Belief Scale, used in Study 2, examined beliefs about the causes of addiction in general,and thus may not have captured individual differences in beliefs about the causes of food addiction.Future research could use an adapted version of the ABS (such as that used by de Pierre et al. [40])to test whether food addiction stigma is attenuated in individuals who have greater support for adisease model of food addiction. Secondly, we did not examine whether participants believed thefood addiction explanation for obesity, nor did we check whether participants had guessed the studyaims. It is, therefore, possible that the effect of the food addiction label on stigma, observed in Study 1,could be due to demand characteristics that were not present in Study 2. Thirdly, the use of a femaletarget in the current study precludes the generalizability of our findings to males. Previous researchsuggests that females are more likely than males to be stigmatized due to their weight [55], and so
153

Nutrients 2019, 11, 2100
attitudes towards the food addiction label may similarly differ as a function of the target’s gender.Finally, it is important to consider that the findings may have been affected by the order in which thequestionnaires were presented. In particular, the significant effect of condition on target-specific stigma(M-FPS) (in Study 1), and lack of effect of general stigma (AFA), may be due to the fact that participantscompleted the M-FPS immediately after reading the vignette, while general stigma (i.e., AFA scores)were assessed later in the study.
Future research should aim to clarify the effect of the food addiction label on weight-related stigma.This may be achieved by considering possible moderating effects of pre-existing beliefs about foodaddiction (e.g., the extent that it is a legitimate condition, whether it is controllable, etc.). There hasbeen much debate in the scientific literature about whether addiction-like eating should be considereda substance-based ‘food addiction’ or a behavioral ‘eating addiction’ (e.g., [11]). Therefore, it will alsobe important to compare attitudes elicited by a ‘food addiction’ label, with attitudes towards an ‘eatingaddiction’ label. It would also be interesting to compare the effect on the stigma of medically-diagnosedfood addiction, with other medical causes of weight gain (e.g., hypothyroidism). Doing so wouldprovide insight into whether the potential exacerbating effect of medicalization on stigma is specificto the food addiction label or whether it extends to the medical model per se. It is also possible thatemphasizing the non-behavioral aspect of food addiction (e.g., brain differences to food) may reduceany deleterious effect of a medical diagnosis on stigma. More broadly, the clinical implications of foodaddiction labels on weight-related stigma must now be considered. In particular, it is important toconsider whether the food addiction label may affect people’s approaches to treatment (e.g., seekingpharmacological solutions rather than psychotherapy). It is also possible that, by perpetuatingweight-related stigma, the food addiction label could be detrimental to psychological well-being andundermine people’s attempts to lose weight.
8. Conclusions
The results indicate that the food addiction label may exacerbate stigmatizing attitudes towardsan individual with obesity. Furthermore, there is preliminary evidence that this effect may be mostpronounced in people with pre-existing low levels of addiction-like eating behavior. Further researchis needed to determine the longer-term effects of the food addiction label on weight stigma andclinical implications.
Supplementary Materials: The following are available online at http://www.mdpi.com/2072-6643/11/9/2100/s1,Figure S1: Scores on AFA-Willpower subscale as a function of condition and gender. Table S1: Participantcharacteristics as a function of gender.
Author Contributions: Conceptualization, E.J.B. and C.A.H.; Data curation, H.K.R. and M.O.; Formal analysis,H.K.R. and M.O.; Methodology, M.O., E.J.B. and C.A.H.; Supervision, E.H.E. and C.A.H.; Writing—original draft,H.K.R. and C.A.H.; Writing—review & editing, M.O., E.J.B., E.H.E. and C.A.H.
Funding: The work reported in this manuscript received no external funding.
Acknowledgments: The authors thank Kerry Boult, Richard Ensell, Helena Leech, and Belen Valle-Metaxas forassistance with data collection.
Conflicts of Interest: C.A.H. receives research funding from the American Beverage Association and speaker feesfrom the International Sweeteners Association for work outside of the submitted manuscript.
References
1. NHS Digital. Available online: Digital.nhs.uk/data-and-information/publications/statistical/sand-diet/statistics-on-obesity-physical-activity-and-diet-england-2019 (accessed on 27 June 2019).
2. Puhl, R.M.; Heuer, C.A. The stigma of obesity: A review and update. Obesity 2009, 17, 941–964. [CrossRef][PubMed]
3. Brinsden, H.; Coltman-Patel, T.; Sievert, K. Weight Stigma in the Media. Available online: https://www.britishlivertrust.org.uk/wp-content/up (accessed on 27 June 2019).
154

Nutrients 2019, 11, 2100
4. Pearl, R.L.; Wadden, T.A.; Hopkins, C.M.; Shaw, J.A.; Hayes, M.R.; Bakizada, Z.M.; Alfaris, N.; Chao, A.M.;Pinkasavage, E.; Berkowitz, R.I.; et al. Association between weight bias internalization and metabolicsyndrome among treatment-seeking individuals with obesity. Obesity 2017, 25, 317–322. [CrossRef] [PubMed]
5. Nolan, L.J.; Eshleman, A. Paved with good intentions: Paradoxical eating responses to weight stigma.Appetite 2016, 102, 15–24. [CrossRef] [PubMed]
6. Rush, L.L. Affective reactions to multiple social stigmas. J. Soc. Psychol. 1998, 138, 421–430. [CrossRef]7. Weiner, B. An attributional theory of achievement motivation and emotion. Psychol. Rev. 1985, 92, 548–573.
[CrossRef] [PubMed]8. Crandall, C.S. Prejudice against fat people: Ideology and self-interest. J. Personal. Soc. Psychol. 1994, 66,
882–894. [CrossRef]9. Pearl, R.L.; Lebowitz, M.S. Beyond personal responsibility: Effects of causal attributions for overweight and
obesity on weight-related beliefs, stigma, and policy support. Psychol. Health 2014, 29, 1176–1191. [CrossRef]10. Hilbert, A.; Rief, W.; Braehler, E. Stigmatizing attitudes toward obesity in a representative population-based
sample. Obesity 2008, 16, 1529–1534. [CrossRef]11. Teachman, B.A.; Gapinski, K.D.; Brownell, K.D.; Rawlins, M.; Jeyaram, S. Demonstrations of implicit anti-fat
bias: The impact of providing causal information and evoking empathy. Health Psychol. 2003, 22, 68–78.[CrossRef]
12. Lewis, R.J.; Cash, T.F.; Jacobi, L.; Bubb-Lewis, C. Prejudice toward fat people: The development and validationof the antifat attitudes test. Obes. Res. 1997, 5, 297–307. [CrossRef]
13. Dejong, W. The stigma of obesity: The consequences of naive assumptions concerning the causes of physicaldeviance. J. Health Soc. Behav. 1980, 21, 75–87. [CrossRef] [PubMed]
14. Lerma-Cabrera, J.M.; Carvajal, F.; Lopez-Legarrea, P. Food addiction as a new piece of the obesity framework.Nutr. J. 2016, 15, 5. [CrossRef]
15. Schulte, E.M.; Avena, N.M.; Gearhardt, A.N. Which foods may be addictive? The roles of processing, fatcontent, and glycemic load. PLoS ONE 2015, 10, e0117959. [CrossRef]
16. Schulte, E.M.; Grilo, C.M.; Gearhardt, A.N. Shared and unique mechanisms underlying binge eating disorderand addictive disorders. Clin. Psychol. Rev. 2016, 44, 125–139. [CrossRef] [PubMed]
17. Rogers, P.J. Food and drug addictions: Similarities and differences. Pharmacol. Biochem. Behav. 2017, 153,182–190. [CrossRef]
18. Ziauddeen, H.; Farooqi, I.S.; Fletcher, P.C. Obesity and the brain: How convincing is the addiction model?Nat. Rev. Neurosci. 2012, 13, 279–286. [CrossRef] [PubMed]
19. Hebebrand, J.; Albayrak, Ö.; Adan, R.; Antel, J.; Dieguez, C.; de Jong, J.; Leng, G.; Menzies, J.; Mercer, J.G.;Murphy, M.; et al. “Eating addiction”, rather than “food addiction”, better captures addictive-like eatingbehavior. Neurosci. Biobehav. Rev. 2014, 47, 295–306. [CrossRef] [PubMed]
20. Ruddock, H.K.; Hardman, C.A. Food addiction beliefs amongst the lay public: What are the consequencesfor eating behaviour? Curr. Addict. Rep. 2017, 4, 110–115. [CrossRef]
21. Lee, N.M.; Lucke, J.; Hall, W.D.; Meurk, C.; Boyle, F.M.; Carter, A. Public views on food addiction and obesity:Implications for policy and treatment. PLoS ONE 2013, 8, e74836. [CrossRef]
22. Meadows, A.; Nolan, L.J.; Higgs, S. Self-perceived food addiction: Prevalence, predictors, and prognosis.Appetite 2017, 114, 282–298. [CrossRef]
23. Ruddock, H.K.; Dickson, J.M.; Field, M.; Hardman, C.A. Eating to live or living to eat? Exploring the causalattributions of self-perceived food addiction. Appetite 2015, 95, 262–268. [CrossRef] [PubMed]
24. Hardman, C.A.; Rogers, P.J.; Dallas, R.; Scott, J.; Ruddock, H.; Robinson, E. “Food addiction is real”: Theeffects of exposure to this message on self-diagnosed food addiction and eating behaviour. Appetite 2015, 91,179–184. [CrossRef] [PubMed]
25. Reid, J.; Brien, K.S.O.; Puhl, R.; Hardman, C.A.; Carter, A. Food addiction and its potential links with weightstigma. Curr. Addict. Rep. 2018, 5, 192–201. [CrossRef]
26. Cassin, S.E.; Buchman, D.Z.; Leung, S.E.; Kantarovich, K.; Hawa, A.; Carter, A.; Sockalingam, S. Ethical,stigma, and policy implications of food addiction: A scoping review. Nutrients 2019, 11, 710. [CrossRef][PubMed]
27. DePierre, J.A.; Puhl, R.M.; Luedicke, J. A new stigmatized identity? Comparisons of a “food addict” labelwith other stigmatized health conditions. Basic Appl. Soc. Psychol. 2013, 35, 10–21. [CrossRef]
155

Nutrients 2019, 11, 2100
28. Latner, J.D.; Puhl, R.M.; Murakami, J.M.; O’Brien, K.S. Food addiction as a causal model of obesity. Effects onstigma, blame, and perceived psychopathology. Appetite 2014, 77, 77–82. [CrossRef] [PubMed]
29. Cullen, A.J.; Barnett, A.; Komesaroff, P.A.; Brown, W.; O’Brien, K.S.; Hall, W.; Carter, A. A qualitative studyof overweight and obese Australians’ views of food addiction. Appetite 2017, 115, 62–70. [CrossRef]
30. Epstein, L.; Ogden, J. A qualitative study of GPs’ views of treating obesity. Br. J. Gen. Pract. 2005, 55, 750–754.[PubMed]
31. Kvaale, E.P.; Haslam, N.; Gottdiener, W.H. The “side effects” of medicalization: A meta-analytic review ofhow biogenetic explanations affect stigma. Clin. Psychol. Rev. 2013, 33, 782–794. [CrossRef] [PubMed]
32. Schulte, E.M.; Tuttle, H.M.; Gearhardt, A.N. Belief in food addiction and obesity-related policy support.PLoS ONE 2016, 11, e0147557. [CrossRef]
33. Bacon, J.; Scheltema, K.; Robinson, B. Fat phobia scale revisited: The short form. Int. J. Obes. 2001, 25, 252.[CrossRef] [PubMed]
34. Van Strien, T.; Frijters, J.E.R.; van Staveren, W.A.; Defares, P.B.; Deurenberg, P. The predictive validity of theDutch restrained eating scale. Int. J. Eat. Disord. 1986, 5, 747–755. [CrossRef]
35. Van Strien, T.; Bergers, G.P.A.; Defares, P.B. The Dutch eating behavior questionnaire (DEBQ) for assessmentof restrained, emotional, and external eating behavior. Int. J. Eat. Disord. 1986, 5, 295–315. [CrossRef]
36. Van Strien, T.; Peter Herman, C.; Anschutz, D. The predictive validity of the DEBQ-external eating scalefor eating in response to food commercials while watching television. Int. J. Eat. Disord. 2012, 45, 257–262.[CrossRef] [PubMed]
37. Oliver Georgina, L.; Wardle Jane, L.; Gibson, E.L. Stress and food choice: A laboratory study. Psychosom. Med.2000, 62, 853–865. [CrossRef] [PubMed]
38. Ruddock, H.K.; Field, M.; Hardman, C.A. Exploring food reward and calorie intake in self-perceived foodaddicts. Appetite 2017, 115, 36–44. [CrossRef] [PubMed]
39. Schaler, J.A. The addiction belief scale. Int. J. Addict. 1995, 30, 117–134. [CrossRef]40. DePierre, J.A.; Puhl, R.M.; Luedicke, J. Public perceptions of food addiction: A comparison with alcohol and
tobacco. J. Subst. Use 2014, 19, 1–6. [CrossRef]41. Cunningham, J.A.; Sobell, L.C.; Freedman, J.L.; Sobell, M.B. Beliefs about the causes of substance abuse:
A comparison of three drugs. J. Subst. Abus. 1994, 6, 219–226. [CrossRef]42. O’Brien, K.S.; Puhl, R.M.; Latner, J.D.; Mir, A.S.; Hunter, J.A. Reducing anti-fat prejudice in preservice health
students: A randomized trial. Obesity 2010, 18, 2138–2144. [CrossRef]43. Meurk, C.; Carter, A.; Partridge, B.; Lucke, J.; Hall, W. How is acceptance of the brain disease model of
addiction related to Australians’ attitudes towards addicted individuals and treatments for addiction?BMC Psychiatry 2014, 14, 373. [CrossRef] [PubMed]
44. Tajfel, H.; Turner, J. The Social Identity Theory of Intergroup Behaviour. U: Worchel S. i Austin WG (ur.) Psychologyof Intergroup Relations; Nelson Hall: Chicago, IL, USA, 1986.
45. Ruddock, H.K.; Christiansen, P.; Halford, J.C.G.; Hardman, C.A. The development and validation of theaddiction-like eating behaviour scale. Int. J. Obes. 2017, 41, 1710. [CrossRef] [PubMed]
46. Gormally, J.; Black, S.; Daston, S.; Rardin, D. The assessment of binge eating severity among obese persons.Addict. Behav. 1982, 7, 47–55. [CrossRef]
47. Gearhardt, A.N.; Corbin, W.R.; Brownell, K.D. Preliminary validation of the Yale food addiction scale.Appetite 2009, 52, 430–436. [CrossRef] [PubMed]
48. Alkharusi, H. Categorical variables in regression analysis: A comparison of dummy and effect coding.Int. J. Educ. 2012, 4, 202–210. [CrossRef]
49. Johnson, P.O.; Neyman, J. Tests of certain linear hypotheses and their application to some educationalproblems. Stat. Res. Mem. 1936, 1, 57–93.
50. Hayes, A.F.; Montoya, A.K. A tutorial on testing, visualizing, and probing an interaction involving amulticategorical variable in linear regression analysis. Commun. Methods Meas. 2017, 11, 1–30. [CrossRef]
51. Hayes, A.F. Introduction to Mediation, Moderation, and Conditional Process Analysis; The Guildford Press:New York, NY, USA, 2017.
52. Bannon, K.L.; Hunter-Reel, D.; Wilson, G.T.; Karlin, R.A. The effects of causal beliefs and binge eating on thestigmatization of obesity. Int. J. Eat. Disord. 2009, 42, 118–124. [CrossRef]
53. Phelan, J.C. Genetic bases of mental illness—A cure for stigma? Trends Neurosci. 2002, 25, 430–431. [CrossRef]
156

Nutrients 2019, 11, 2100
54. Phelan, J.C. Geneticization of deviant behavior and consequences for stigma: The case of mental illness.J. Health Soc. Behav. 2005, 46, 307–322. [CrossRef]
55. Puhl, R.M.; Andreyeva, T.; Brownell, K.D. Perceptions of weight discrimination: Prevalence and comparisonto race and gender discrimination in America. Int. J. Obes. 2008, 32, 992–1000. [CrossRef] [PubMed]
© 2019 by the authors. Licensee MDPI, Basel, Switzerland. This article is an open accessarticle distributed under the terms and conditions of the Creative Commons Attribution(CC BY) license (http://creativecommons.org/licenses/by/4.0/).
157


nutrients
Article
The Effect of a Food Addiction Explanation Model forWeight Control and Obesity on Weight Stigma
Kerry S. O’Brien 1,*, Rebecca M. Puhl 2, Janet D. Latner 3, Dermot Lynott 4, Jessica D. Reid 1,
Zarina Vakhitova 1, John A. Hunter 5, Damian Scarf 5, Ruth Jeanes 6, Ayoub Bouguettaya 1 and
Adrian Carter 7
1 School of Social Sciences, Faculty of Arts, Monash University, Melbourne 3800, Australia;[email protected] (J.D.R.); [email protected] (Z.V.);[email protected] (A.B.)
2 Department of Human Development and Family Sciences, Rudd Center for Food Policy & Obesity,University of Connecticut, Storrs, CT 06269, USA; [email protected]
3 Department of Psychology, College of Social Sciences, University of Hawaii, Manoa, HI 96822, USA;[email protected]
4 Department of Psychology, Faculty of Science and Technology University of Lancaster, Lancaster LA1 4YW,UK; [email protected]
5 Division of Sciences, Department of Psychology, University of Otago, Dunedin 9016, New Zealand;[email protected] (J.A.H.); [email protected] (D.S.)
6 Curriculum & Pedagogy, Faculty of Education, Monash University, Melbourne 3800, Australia;[email protected]
7 School of Psychology, Faculty of Medicine, Nursing, and Health Sciences, Monash University, Melbourne3800, Australia; [email protected]
* Correspondence: [email protected]
Received: 27 September 2019; Accepted: 7 January 2020; Published: 22 January 2020
Abstract: There is increasing scientific and public support for the notion that some foods may beaddictive, and that poor weight control and obesity may, for some people, stem from having afood addiction. However, it remains unclear how a food addiction model (FAM) explanation forobesity and weight control will affect weight stigma. In two experiments (N = 530 and N = 690), wetested the effect of a food addiction explanation for obesity and weight control on weight stigma. InExperiment 1, participants who received a FAM explanation for weight control and obesity reportedlower weight stigma scores (e.g., less dislike of ‘fat people’, and lower personal willpower blame)than those receiving an explanation emphasizing diet and exercise (F(4,525) = 7.675, p = 0.006; andF(4,525) = 5.393, p = 0.021, respectively). In Experiment 2, there was a significant group difference forthe dislike of ‘fat people’ stigma measure (F(5,684) = 5.157, p = 0.006), but not for personal willpowerweight stigma (F(5,684) = 0.217, p = 0.81). Participants receiving the diet and exercise explanationhad greater dislike of ‘fat people’ than those in the FAM explanation and control group (p values< 0.05), with no difference between the FAM and control groups (p > 0.05). The FAM explanationfor weight control and obesity did not increase weight stigma and resulted in lower stigma than thediet and exercise explanation that attributes obesity to personal control. The results highlight theimportance of health messaging about the causes of obesity and the need for communications that donot exacerbate weight stigma.
Keywords: stigma; obesity; food addiction; weight bias; weight stigma; obesity prejudice reduction
1. Introduction
Research on the extent, nature, and impact of weight stigma (also termed weight bias, obesitystigma) suggests that weight stigma has increased over time in adults [1] and children [2] and is
Nutrients 2020, 12, 294; doi:10.3390/nu12020294 www.mdpi.com/journal/nutrients159

Nutrients 2020, 12, 294
associated with a host of negative social and health outcomes [3]. For example, research showsthat women perceived to be overweight or obese encounter discrimination in education, health,and employment settings [4–6]. Similarly, experiences of weight stigma are associated with poorerpsychological and physical outcomes arising from stigma-related stress, including increased depressionand anxiety [7], emotional and stress-related eating [8], and avoidance of health care settings [9].As such, there is a need for research that seeks to understand factors that contribute to and reinforceweight stigma.
Attribution theories, and specifically, the attribution-value model [10] suggests that antipathytoward a specific group or target is maintained by beliefs about the controllability of specific groupbehaviours. In the case of overweight and obesity, studies show that weight stigma is increasedby attributions about controllability of weight and obesity [11,12]. That is, because people areexposed to public health and media messages that weight is under personal control, people concludethat obesity must be due to an individual’s personal failures, which in turn leads to greater weightstigma [13,14]. Dominant public health messages on the cause of overweight and obesity remain focused,if simplistically, on individual control of diet and physical activity [15]. This individualistic publichealth narrative is increasingly criticised [16], as it ignores research on the myriad of uncontrollablefactors contributing to weight control and obesity, such as neurophysiology, environment, andthe interplay with genetics/epigenetics. Experimental evidence suggests that changing people’sattributions about the causes of obesity away from individual blame, and to more biologically andenvironmentally pre-determined factors, can help to reduce weight stigma [11]. Accordingly, correctingpublic misattributions about weight has the potential not only to improve knowledge about thecomplex causes of obesity, but also the potential to reduce weight stigma and discrimination [17].
Recent research posits that some people may have a neurobiological addiction to certain foods,particularly ultra-processed hyper-palatable foods. This addiction may, in part, contribute to people’sfood choices and consumption behaviour, and in turn obesity rates [18,19]. Termed food addiction,neuropsychological and behavioural research on the addictive properties of food identifies considerableoverlap in the food and drug reward and addiction-related centres and pathways of the brain; as aresult, food can be as rewarding and addictive as other addictive substances such as drugs, which shareoverlapping brain reward pathways [20,21]. Large-scale studies suggest that a significant proportion(15%) of the general population [22], and a greater proportion of those with obesity (up to 30%) meetcriteria for a diagnosis of food addiction [23]. Furthermore, between 28% and 52% of the generalpopulation perceive themselves to be addicted to food [24].
The food addiction model (FAM) for weight control and obesity raises questions about whethera FAM explanation could be helpful or harmful in efforts to reduce weight stigma. While it couldbe argued that a FAM explanation might increase weight stigma as a result of labelling individualswith obesity as having an addiction, it is possible that a FAM explanation could instead reduce stigmatowards people perceived to have obesity by reducing attributions of individual controllability ofweight [25]. Research examining these questions is scarce [26]. Some research suggests that the additionof the addiction label to obesity is associated with increased vulnerability to stigmatization [27], andexperimental work suggests that the FAM explanation may increase stigma associated with obesity [28].In contrast, experimental research by Latner and colleagues [25] found that a FAM explanation forweight control and obesity resulted in less stigma and less blame for targets at both lower and higherbody weights. These mixed findings indicate the need for additional research to establish whether aFAM explanation increases or decreases weight stigma relative to current public health messaging thatsuggests diet and exercise as the primary drivers of weight and obesity [29,30].
The present study aimed to examine whether a food addiction explanation for weight controlwould exacerbate or ameliorate weight stigma relative to the dominant public health messagingemphasizing personal control of diet and exercise. We conducted two experiments to assess theimpact of a food addiction explanation for obesity on expressions of weight stigma. In line with
160

Nutrients 2020, 12, 294
previous research with the attribution value model [10] for weight stigma, we predicted that the FAMexplanation would result in less weight stigma towards people perceived to be obese or “fat”.
2. Methods (Experiment 1 and 2)
2.1. Participants
Table 1 details the demographic characteristics of participants in Experiment 1 and 2. ForExperiment 1, a sample of N = 652 university (college) students was invited to participate in theexperiment in return for course credit. Most students (86%; N = 561) agreed to participate, with N = 530(94%) of those agreeing to participate providing data on the outcome variables. For Experiment 2,university (college) students (N = 717) were invited to participate in the experiment in return for coursecredit. Most (96%; N = 696) agreed to participate, with N = 690 providing data on the outcome variables.
Table 1. Participant characteristics for Experiment 1 and Experiment 2.
Parameter Value
Experiment 1 (N = 530)
Age (years) M = 19.7, SD = 1.8 (range: 18–35)Gender (female/male) 73.8% (n = 391)/26.2% (n = 139)
Body Mass Index (BMI) M = 22.5, SD = 4.1Percentage underweight (BMI ≤ 18.5 kg/m2) 10.9% (n = 57)
Percentage normal weight (BMI = 18.5 < 25.0) 69.4% (n = 367)Percentage overweight or obese (BMI > 25+) 20% (n = 106)
Experiment 2 (N = 690)
Age (years) M = 19.7, SD = 2.51 (range: 18–52)Gender (female/male) 72.2% (n = 498)/27.7% (n = 191)
Body Mass Index (BMI) M = 22.4, SD = 4.1Percentage underweight (BMI ≤ 18.5 kg/m2) 11.1% (n = 77)
Percentage normal weight (BMI = 18.5 < 25.0) 68.0% (n = 469)Percentage overweight or obese (BMI > 25+) 20.9% (n = 144)
A priori sample size calculations indicated a required minimum sample of N = 142 for Experiment 1 and N = 216for Experiment 2 (72 per group) to detect a small to moderate effect size (d = 0.30) between experimental groupswith desired power at 0.80 and α set at 0.05 (two-sided). The present sample sizes were sufficient for experimentaldesigns and planned analyses.
2.2. Design (Experiments 1 and 2)
Experiment 1 used a between-subjects experimental design to test the effect of a food addictionexplanation (N = 263) for weight control and obesity vs. the diet and exercise explanation (N = 267)on weight stigma (prejudice towards “fat” people). The host university’s Qualtrics research platformrandomisation function with a 1:1 ratio was used for randomisation to conditions. Participants receivedeither a simulated news article from The Guardian on the food addiction explanation for weight controland obesity (food addiction condition) or an identically formatted news article positing the dominantpublic health message that weight control and obesity are due to poor dieting and/or exercise behaviour.Single-item post-manipulation measures were taken for all variables.
Experiment 2 (N = 690) was identical to Experiment 1, but introduced a control group that receivedno newspaper article. The randomisation ratio was set at 2:1:1 with the control condition (N = 346)having two participants for every one participant allocated to the food addiction (N = 167) and dietand exercise conditions (N = 175).
2.3. Manipulation (Food Addiction vs. Diet and Exercise News Articles, vs. Control/No News Article)
Two newspaper articles were constructed for the experiments. The two articles appeared authenticand were structurally identical, using The Guardian newspaper format, with identical author, date/time
161

Nutrients 2020, 12, 294
of publication, word length, and text/photo placement. Both articles contained identical text reportingon research from The Lancet suggesting that mortality from obesity-related diseases was high and, forthe first time, greater than mortality from starvation. However, the articles differed considerably in thetext regarding explanations for weight control and obesity.
The food addiction article described the concept of food addiction and explained how foods canbe addictive through the involvement of the pleasure/reward centres of the brain, and the release ofdopamine when eating some foods, which in turn leads to cravings and a vicious cycle of addiction.The article named the originator of the term food addiction, and stated that approximately 20% ofthe population may have a food addiction, particularly to highly processed or convenience foods.The article also suggested that food addiction was a key factor in weight control and overweightand obesity.
The diet and exercise news article made no reference to food addictions or cravings, but insteadfocused on people’s lack of physical exercise, sedentary lifestyles, and overconsumption of unhealthyfoods. The article stated that these personal behaviours were the cause of obesity. The article citedresearch from experts stating that more self-control was needed when choosing what foods to eat, andit concluded by stating that diet and exercise programs are our best chance at reducing the obesityepidemic and that people need to get moving more.
2.4. Measures
Along with demographic characteristics including age, sex, height in centimetres, weight inkilograms, and ethnicity, we assessed participant’s weight stigma (i.e., anti-fat prejudice, weight bias).We also included simple measures to assess whether the manipulations affected beliefs about thecauses of obesity and weight gain and loss and a food addiction condition manipulation check. Allparticipants received all of the measures summarized below.
2.4.1. Weight Stigma
To measure weight stigma we used the Anti-Fat Attitudes Test (AFAT), a psychometrically soundmeasure that has been widely used in the field to measure weight bias [31]. The AFAT is a 13-item scalecomprised of three subscales assessing dislike of “fat people” which assesses antipathy towards peopleperceived to be “fat” (Dislike: 7 items, e.g., “I really don’t like fat people much”), fear of becoming fat(Fear of Fat: 3 items, e.g., “I worry about becoming fat”), and belief that excess weight is due to a lackpersonal willpower (Willpower: 3 items, e.g., “Some people are fat because they have no willpower”).Participants indicate their agreement to items using a scale ranging from 0 = very strongly disagreeto 9 = very strongly agree. The mean of the subscale items is used for analyses. Previous work hasidentified that the ‘fear of fat’ subscale functions as a measure of personal body image rather thanweight stigma toward others per se, with one of the items lacking face validity, so this subscale was notanalysed in the present study [32]. Cronbach’s alpha’s for the dislike and willpower subscales weregood in the present sample: α = 0.87 and α = 0.79, respectively.
2.4.2. Belief in the Food Addiction Explanation
The food addiction support index (FASI) [24] was used to assess participant beliefs in, and supportfor, the food addiction explanation for eating, obesity, and weight gain, following exposure to thefood addiction vs. diet and exercise news articles (manipulation). Participants responded to thefive-item FASI (e.g., “Obesity should be treated as an addiction”), using a five-point scale rangingfrom 0 = strongly disagree to 4 = strongly agree with items summed to form a scale total from 0 to 20.Cronbach’s alpha’s in the present experiment was α = 0.83.
2.4.3. Belief in Diet and Exercise for Weight Control
Two items from the dieting beliefs scale [33] that directly capture beliefs about exercise and dietingfor the control of weight were used to assess the following exposure to the food addiction vs. diet and
162

Nutrients 2020, 12, 294
exercise news article (manipulation). Specifically, participants were asked to indicate their agreementusing a six-point scale ranging from 1 = not at all descriptive of my beliefs to 6 = very descriptive of my beliefsto the statements “By restricting what one eats, one can lose weight” and “By increasing the amountthat one exercises, one can lose weight”. The two items were combined to form a score ranging from1 to 12, with higher scores indicating greater belief that diet and exercise are responsible for weightcontrol and obesity.
2.5. Food Addiction Manipulation Check
To assess whether participants attended to the information in the food addition article, we askeda short question assessing recall for a specific piece of information in the food addiction article.Specifically, we asked participants to identify via a multi-choice recognition response (four answeroptions) “Who first introduced the term Food Addiction?” Participant responses were coded as eitherincorrect = 0 or correct = 1.
2.6. Procedure
Upon entering the experiment via a web-link to the host university’s Qualtrics research platform,participants in both experiments were provided with the title and description of the study, and thenwere asked to provide consent to participate. To limit bias in sampling and responding, the studyused deception in the advertising and description of the experiment. Participants were told thatthe experiment was interested in how cognitive information processing styles affect public opinionon a range of political, health, and social issues and that researchers were interested in how peopledeal with being saturated by the wide range of media messages they receive via TV, computer, andmobile devices.
Participants first answered demographic questions before being presented with one of the twonews articles (FAM condition vs. diet/exercise condition) or no article for those in the control group forExperiment 2. To enhance the authenticity of the experiment guise, a large set of distractor questionstaken from measures assessing experiential and analytical thinking styles [34] were interspersed inthe outcome and manipulation measures. These measures asked participants whether they enjoythe process of thinking deeply about issues, and they have been used successfully elsewhere [35].Finally, participants were presented with the outcome and manipulation measures. The experimenttook approximately 22 min on average to complete. Ethical approval for the study was sought andprovided by the host university’s Human Research Ethics Committee (Project ID: 8912).
2.7. Analysis
Chi-squared (X2) and t-tests were used to assess whether randomisation resulted in balancedgroups based on gender, age, and body mass index (BMI). Because weight stigma scores were notnormally distributed in either experiment, we adopted a two-step transformation to normalise thedata [36]. Subsequent normality checks showed the data to have no issues with skewness or kurtosis.ANCOVAs accounting for age, sex, and BMI as covariates were used to test for significant mean groupdifferences on the dislike and willpower weight stigma measures. A Chi-squared test assessed accuraterecognition of the food addiction originator in a probe question (manipulation check). ANOVA wasalso used to examine whether there were any differences on the manipulation measures (i.e., FASI,dieting/exercise beliefs, and food addiction article attention; i.e., who was the originator of foodaddiction term). We report adjusted means (M) and standard deviations (SD) along with F and p-values(significance was set at 0.05) for all primary outcomes.
163

Nutrients 2020, 12, 294
3. Results (Experiments 1 and 2)
3.1. Preliminary Analysis Experiment 1
Preliminary analyses (X2 and t-tests) assessing whether randomisation resulted in balanced groupson demographic characteristics showed there were no significant differences between groups for sex,age, or BMI scores (all p values > 0.27). A higher proportion of participants in the food addictioncondition (61%) correctly recalled the name of the originator of the term food addiction than did thosein the diet and exercise condition (39%, X2 = 23.663, p < 0.0005).
3.2. Experiment 1 Food Addiction vs. Diet and Exercise
ANCOVA found significant group difference for the ‘dislike’ weight stigma measure: F(4,525) = 7.675,p = 0.006. Participants exposed to the FAM explanation had significantly lower dislike of “fat people”(M = 1.82, SD = 1.46) scores than did the participants in the diet and exercise condition (M = 2.13,SD = 1.70). Similarly, participants in the FAM group endorsed significantly lower willpower stigmascores (M = 4.29, SD = 205) than participants in the diet and exercise explanation group (M = 4.68,SD = 1.97; F(4,525) = 5.393, p = 0.021), indicating that those in the FAM condition were less likely toattribute excess weight to a lack of personal willpower.
We examined whether there were differences between groups in the posited beliefs about the causesof weight control and obesity (i.e., FASI, dieting/exercise beliefs). There were statistically significantgroup difference on FASI scores. Participants receiving the FAM explanation for obesity and weightcontrol had greater belief in the FAM explanation for obesity and weight control (FASI) (M = 14.57,SD = 3.78) than participants receiving the traditional diet and exercise explanation (M = 13.66, SD = 3.80;F(4,525) = 8.823, p = 0.003). There was not a statistically significant group difference for the dieting andexercise beliefs measure (FAM, M = 8.60, SD = 2.04; diet and exercise M = 8.50, SD = 2.03; F(4,525) = 0.100,p = 0.75).
3.3. Preliminary Analysis Experiment 2
Preliminary analyses (X2 and t-tests) assessing whether randomisation resulted in balanced groupson demographic characteristics showed there were no significant differences between groups for sex,age, or BMI scores (all p values > 0.46). A higher proportion of participants in the food addictioncondition (58%) correctly recalled the name of the originator of the term food addiction than did thosein the diet and exercise condition (42%; X2 = 15.047, p < 0.0005).
3.4. Experiment 2 Food Addiction vs. Diet and Exercise vs. Control/No News Article
ANCOVA found significant group difference for the dislike of ‘fat people’ weight stigma scores(F(5,684) = 5.157, p = 0.006). Post-hoc tests showed that participants exposed to FAM explanation hadsignificantly lower dislike of ‘fat people’ (M = 1.85, SD = 1.57) than participants in the diet and exercisecondition (M = 2.23, SD = 1.76, p < 0.001). Participants in the diet and exercise condition also endorsedhigher weight stigma scores than those in the control condition (M = 1.70, SD = 1.54). There wasno significant difference in dislike of ‘fat people’ scores between the FAM condition and the controlgroup (p = 0.56). There was also no significant group difference for willpower weight stigma scores(F(5,684) = 0.217, p = 0.81), with the FAM, diet and exercise, and control groups having similar meanscores (M = 4.71, SD = 2.05, and M = 4.81, SD = 1.86, M = 4.62, SD = 2.16, respectively).
We examined whether there were differences between groups in the posited beliefs about thecauses of weight control and obesity (i.e., dieting/exercise beliefs, FASI). There was no significant groupdifference for the dieting/exercise beliefs measure (F(5,682) = 2.055, p = 0.13; diet and exercise conditionM = 4.62, SD = 0.95, control condition M = 4.38, SD = 1.06, FAM group M = 4.43, SD = 1.03). We foundno statistically significant group difference in FASI scores (F(5,680) = 1.764, p = 0.17; control M = 14.54,SD = 4.17, FAM M = 15.01, SD = 3.29, diet and exercise M = 13.99, SD = 3.90).
164
Nutrients 2020, 12, 294
4. Discussion
We examined whether the FAM explanation for weight control and obesity versus the traditionalpublic health messaging around control of diet and exercise would affect weight stigma. Relative tothe dominant public health narrative that obesity stems from lack of control over diet and exercise, theFAM explanation resulted in lower weight stigma. In Experiment 1, both dislike of ‘fat people’ andperceptions that excess weight is a result of lack of willpower were lower in people presented withthe FAM explanation. In a second experiment, we introduced a control group that was not exposedto information about obesity or causal models for obesity. Similar to Experiment 1, participants inExperiment 2 who received the FAM explanation for weight control and obesity displayed less weightstigma (dislike of “fat people”) than participants in the diet and exercise condition. Importantly,there was no difference between the FAM and control groups in levels of weight stigma. Contrary toExperiment 1, in Experiment 2 there was no significant group difference with respect to perceptionsthat excess weight is caused by a lack of willpower (blame). The results of these two experiments areconsistent with work by Latner and colleagues [25] who reported less stigma following exposure to afood addiction explanation. The results do not appear to support the notion that attaching an addictionlabel to people with obesity would exacerbate weight stigma. Accordingly, a simple interpretationof the results of both experiments is that the dominant public health messaging around the diet andexercise explanation for weight control and obesity exacerbates weight stigma, but the FAM explanationdoes not.
We found mixed support for the attribution value model of weight stigma [10]. Analysis of theFASI scores in Experiment 1 suggest that the difference in weight stigma scores between the FAMand diet and exercise conditions was due to changes in participants’ attributions about the causes ofobesity. However, we found no significant group difference on FASI scores in Experiment 2. Similarly,there was no group differences in participant beliefs about personal control of diet and exercise as aprimary cause for obesity and weight control in Experiment 1 or 2. This finding is unexpected, as it wasreasonable to predict a decrease in attributions of dieting and exercise as a causal explanation amongparticipants who received the FAM explanation. It is possible that the FAM explanation resulted inless stigma because of a greater understanding of, and/or empathy for, those facing the challenges ofweight management when one is addicted to food. As we did not assess constructs related to empathy,it will be important for future work to assess the relationship between perceptions of food addictionand levels of empathy towards people with obesity. It is apparent that those in the FAM condition didnot dismiss the notion of diet and exercise as contributors to weight control and obesity. Participantsmay already have firmly established beliefs about personal control of weight given pervasive societalmessages emphasizing this message. However, this possible pre-existing belief did not interfere withparticipants’ abilities to receive and incorporate a different message about the contributors to obesityemphasized in the FAM perspective.
The perception that weight is determined by the individual’s personal control of choices regardingdieting and exercise behaviours is widespread and accepted in society [37]. Belief in this dominantpublic health model for overweight and obesity is thought to be linked to weight stigma becauseit infers and/or attributes overweight and obesity to personal responsibility, lack of discipline, andlaziness. The FAM explanation for obesity and weight control is garnering attention in several researchfields [19,38,39] and is gaining traction in popular culture [40]. Indeed, studies suggest that around15% of people meet criteria for a food addiction and anywhere from 28–52% of people believe theymay be addicted to a food [22–24]. The present findings support suggestions that popular societalmessages of blame and personal responsibility for weight may be partly responsible for the prevalenceand rise of weight bias [1]. In contrast, an alternative explanation for obesity, the FAM explanation,may have a positive effect of reducing weight stigma. As our studies did not assess attitudes over time,it will be important for future work to examine whether changes in participants’ causal attributions forobesity can be maintained following brief interventions or information about alternative contributorsto obesity. It is likely that repeated exposure to FAM information and messages would be needed to
165
Nutrients 2020, 12, 294
sustain shifts in people’s perspectives over time, especially in the face of continued and prominentsocietal messages emphasizing personal behaviours as the primary cause of obesity. Nevertheless,findings from both of our studies suggest that it is possible to shift weight stigma attitudes with a briefintervention emphasizing a FAM narrative for obesity.
Several limitations of this research should be noted. First, study participants were mostly youngand female, with a majority who did not have overweight or obesity. Future studies should examinethe FAM explanation in a more representative population sample, including those with diverse bodysizes. Baseline data on weight stigma variables were not collected, which could otherwise have beenincluded as potential covariates in the analyses. However, the decision not to collect baseline dataon these variables was balanced against the importance of maintaining the study’s deception, toavoid tipping off participants to the nature of the study and cuing them in the direction of sociallydesirable responding. Still, future studies could employ within-participant designs to examine potentialchanges in weight stigma across subjects upon exposure to the FAM model of weight. In addition,future research should explore the longer-term outcomes of public health messages, particularly thosedelivered in real-world settings.
5. Conclusions
The present study found lower weight stigma after exposure to a food addiction model of weightand greater weight stigma after exposure to a diet and exercise model of weight. While several studieshave attempted to reduce weight stigma, with varying success, far more work is needed to addressthis prevalent and harmful societal problem. The improvement found in weight stigma following anaddiction explanation, and the worsening of weight stigma following a diet and exercise explanation,has implications for public health messages about body weight and obesity. The results support thegrowing popularity of the food addiction model for eating and associated body weight and obesity.Increasing public understanding of the role of a food addiction explanation for eating behaviour andweight may help to alleviate weight stigma, including, potentially, internalised weight bias/self-stigma.At the same time, our research suggests that the current dominant public health message that largelyattributes weight control and obesity to lack of personal control of, and responsibility for, diet andexercise needs to be changed as it appears to be supporting weight stigma [41]. Future research isneeded to explore ways to modify current public health messaging so that it is not exacerbating weightstigma. Such messaging could describe the interplay between biological (e.g., FAM, genes) and/orenvironmental factors (e.g., food security, access to healthy and affordable foods, exercise-facilitatingliving and work environments) contributing to weight, as well as the importance of healthy eating andphysical activity for all individuals, regardless of body size.
Author Contributions: Conceptualization: K.S.OB., A.C., J.D.R., J.D.L. data curation: K.S.OB., J.D.R., A.B.; formalanalysis: K.S.OB., J.D.R.; project administration: K.S.OB., A.C., J.D.R.; supervision: K.S.OB., A.C.; writing—originaldraft: K.S.OB., J.D.L., Z.V., R.M.P., A.B.; writing—review and editing: K.S.OB., A.B., R.J., J.A.H., Z.V., D.S., D.L. Allauthors have read and agreed to the published version of the manuscript.
Funding: This research received no external funding.
Conflicts of Interest: The authors declare no conflict of interest.
References
1. Andreyeva, T.; Puhl, R.M.; Brownell, K.D. Changes in perceived weight discrimination among Americans,1995–1996 through 2004–2006. Obesity 2008, 16, 1129–1134. [CrossRef]
2. Latner, J.D.; Stunkard, A.J. Getting worse: The stigmatization of obese children. Obes. Res. 2003, 11, 452–456.[CrossRef]
3. Puhl, R.M.; Heuer, C.A. The stigma of obesity: A review and update. Obesity 2009, 17, 941–964. [CrossRef]4. Nutter, S.; Ireland, A.; Alberga, A.S.; Brun, I.; Lefebvre, D.; Hayden, K.A.; Russell-Mayhew, S. Weight bias in
educational settings: A systematic review. Curr. Obes. Rep. 2019, 8, 185–200. [CrossRef] [PubMed]
166
Nutrients 2020, 12, 294
5. Phelan, S.M.; Burgess, D.J.; Yeazel, M.W.; Hellerstedt, W.L.; Griffin, J.M.; van Ryn, M. Impact of weightbias and stigma on quality of care and outcomes for patients with obesity. Obes. Rev. 2015, 16, 319–326.[CrossRef] [PubMed]
6. O’Brien, K.S.; Latner, J.D.; Ebneter, D.; Hunter, J.A. Obesity discrimination: The role of physical appearance,personal ideology, and anti-fat prejudice. Int. J. Obes. 2013, 37, 455–460. [CrossRef] [PubMed]
7. Papadopoulos, S.; Brennan, L. Correlates of weight stigma in adults with overweight and obesity: Asystematic literature review. Obesity 2015, 23, 1743–1760. [CrossRef]
8. O’Brien, K.S.; Latner, J.D.; Puhl, R.M.; Vartanian, L.R.; Giles, C.; Griva, K.; Carter, A. The relationship betweenweight stigma and eating behavior is explained by weight bias internalization and psychological distress.Appetite 2016, 102, 70–76. [CrossRef]
9. Mensinger, J.L.; Tylka, T.L.; Calamari, M.E. Mechanisms underlying weight status and healthcare avoidancein women: A study of weight stigma, body-related shame and guilt, and healthcare stress. Body Image 2019,25, 139–147. [CrossRef]
10. Crandall, C.S.; D’Anello, S.; Sakalli, N.; Lazarus, E.; Wieczorkowska, G.; Feather, N.T. An attribution-valuemodel of prejudice: Anti-fat attitudes in six nations. Pers. Soc. Psychol. Bull. 2001, 27, 30–37. [CrossRef]
11. O’Brien, K.S.; Puhl, R.M.; Latner, J.D.; Mir, A.S.; Hunter, J.A. Reducing anti-fat prejudice in preservice healthstudents: A randomized trial. Obesity 2010, 18, 2138–2144. [CrossRef]
12. Pearl, R.L.; Lebowitz, M.S. Beyond personal responsibility: Effects of causal attributions for overweight andobesity on weight-related beliefs, stigma, and policy support. Psychol. Health 2014, 29, 1176–1191. [CrossRef]
13. Barry, C.L.; Brescoll, V.L.; Brownell, K.D.; Schlesinger, M. Obesity metaphors: How beliefs about the causesof obesity affect support for public policy. Milbank Q. 2009, 87, 7–47. [CrossRef] [PubMed]
14. Barry, C.L.; Jarlenski, M.; Grob, R.; Schlesinger, M.; Gollust, S.E. News media framing of childhood obesity inthe United States from 2000 to 2009. Pediatrics 2011, 128, 132–145. [CrossRef] [PubMed]
15. World Health Organisation Fact Sheet. Available online: https://www.who.int/news-room/fact-sheets/detail/obesity-and-overweight#targetText=In%202016%2C%20more%20than%201.9,women)%20were%20obese%20in%202016 (accessed on 28 July 2019).
16. Kleinert, S.; Horton, R. Obesity needs to be put into a much wider context. Lancet 2019, 393, 724–726.[CrossRef]
17. Danielsdottir, S.; O’Brien, K.S.; Ciao, A. Anti-fat prejudice reduction: A review of published studies. Obes.Facts 2010, 3, 47–58. [CrossRef]
18. Gearhardt, A.N.; Davis, C.; Kuschner, R.; Brownell, K.D. The addiction potential of hyperpalatable foods.Curr. Drug Res. Rev. 2011, 4, 140–145. [CrossRef]
19. Adams, R.C.; Sedgmond, J.; Maizey, L.; Chambers, C.D.; Lawrence, N.S. Food addiction: Implications for thediagnosis and treatment of overeating. Nutrients 2019, 11, 2086. [CrossRef]
20. Alonso-Alonso, M.; Woods, S.C.; Pelchat, M.; Grigson, P.S.; Stice, E.; Farooqi, S.; Khoo, C.S.; Mattes, R.D.;Beauchamp, G.K. Food reward system: Current perspectives and future research needs. Nutr. Rev. 2015, 73,296–307. [CrossRef]
21. Volkow, N.D.; Wise, R.A.; Baler, R. The dopamine motive system: Implications for drug and food addiction.Nat. Rev. Neurosci. 2017, 18, 741–752. [CrossRef]
22. Gearhardt, A.N.; Corbin, W.R.; Brownell, K.D. Development of the yale food addiction scale version 2.0.Psychol. Addict. Behav. 2016, 30, 113–121. [CrossRef] [PubMed]
23. Meadows, A.; Nolan, L.J.; Higgs, S. Self-perceived food addiction: Prevalence, predictors, and prognosis.Appetite 2017, 114, 282–298. [CrossRef] [PubMed]
24. Latner, J.D.; Puhl, R.M.; Murakami, J.M.; O’Brien, K.S. Food addiction as a causal model of obesity. Effects onstigma, blame, and perceived psychopathology. Appetite 2014, 77, 79–84. [CrossRef] [PubMed]
25. Reid, J.; O’Brien, K.S.; Puhl, R.; Hardman, C.A.; Carter, A. Food addiction and its potential links with weightstigma. Curr. Addict. Rep. 2018, 5, 192–201. [CrossRef]
26. DePierre, J.D.; Puhl, R.M.; Luedicke, J. Public perceptions of food addiction: A comparison with alcohol andtobacco. J. Subst. Use 2013, 19, 1–6. [CrossRef]
27. DePierre, J.A.; Puhl, R.M.; Luedicke, J. A new stigmatized identity? Comparisons of a ‘Food Addict’ labelwith other stigmatized health conditions. Basic Appl. Soc. Psych. 2013, 35, 10–21. [CrossRef]
28. Eller, D. Are You Addicted to Food? Prevention magazine. Available online: http://www.prevention.com/(accessed on 30 November 2011).
167

Nutrients 2020, 12, 294
29. Micco, N. Addicted to Food? 5 Tips to Control Your Cravings. The Huffington Post. Available online: http://www.huffingtonpost.com/eatingwell/could-you-be-addicted-to-_b_828270.html (accessed on 27 February2011).
30. Crandall, C.S. Prejudice against fat people: Ideology and selfinterest. J. Pers. Soc. Psychol. 1994, 66, 882–894.[CrossRef]
31. O’Brien, K.S.; Hunter, J.A.; Banks, M. Implicit anti-fat bias in physical educators: Physical attributes, ideology,and socialisation. Int. J. Obes. 2007, 31, 308–314. [CrossRef]
32. Lee, N.M.; Lucke, J.; Hall, W.D.; Meurk, C.; Boyle, F.M.; Carter, A. Public views on food addiction and obesity:Implications for policy and treatment. PLoS ONE 2013, 8, e74836. [CrossRef]
33. Stotland, S.; Zuroff, D.C. A new measure of weight locus of control: The dieting beliefs scale. J. Pers. Assess.1990, 54, 191–203. [CrossRef]
34. Epstein, S.; Pacini, R.; Denes-Raj, V.; Heier, H. Individual differences in intuitive experiential andanalytical-rational thinking styles. J. Pers. Soc. Psychol. 1996, 71, 390–405. [CrossRef] [PubMed]
35. O’Brien, K.S.; Latner, J.D.; Halberstadt, J.; Hunter, J.A.; Anderson, J.; Caputi, P. Do antifat attitudes predictantifat behaviors? Obesity 2008, 16, S87–S92. [CrossRef] [PubMed]
36. Templeton, G.F. A two-step approach for transforming continuous variables to normal: Implications andrecommendations for IS research. Commun. Assoc. Inf. Syst. 2011, 28, 41–58. [CrossRef]
37. Brownell, K.D.; Kersh, R.; Ludwig, D.S.; Post, R.C.; Puhl, R.M.; Schwartz, M.B.; Willett, W.C. Personalresponsibility and obesity: A constructive approach to a controversial issue. Health Aff. 2010, 29, 379–387.[CrossRef]
38. Davis, C.; Curtis, C.; Levitan, R.D.; Carter, J.C.; Kaplan, A.S.; Kennedy, J.L. Evidence that ‘food addiction’is avalid phenotype of obesity. Appetite 2011, 57, 711–717. [CrossRef]
39. Schulte, E.M.; Joyner, M.A.; Potenza, M.N.; Grilo, C.M.; Gearhardt, A.N. Current considerations regardingfood addiction. Curr. Psychiatry Rep. 2015, 17, 19. [CrossRef]
40. Almendrala, A. Food Addiction vs. Eating Addiction: Why A Single Word Makes All The Difference[Internet]. HuffPost Australia. 2014. Available online: https://www.huffingtonpost.com.au/2014/09/23/food-addiction-eating-addiction_n_5844712.html?guccounter=1 (accessed on 23 November 2015).
41. Puhl, R.M.; Latner, J.D.; O’Brien, K.; Luedicke, J.; Forhan, M.; Danielsdottir, S. Cross-national perspectivesabout weight-based bullying in youth: Nature, extent and remedies. Pediatr. Obes. 2015, 11, 241–250.[CrossRef]
© 2020 by the authors. Licensee MDPI, Basel, Switzerland. This article is an open accessarticle distributed under the terms and conditions of the Creative Commons Attribution(CC BY) license (http://creativecommons.org/licenses/by/4.0/).
168

MDPISt. Alban-Anlage 66
4052 BaselSwitzerland
Tel. +41 61 683 77 34Fax +41 61 302 89 18
www.mdpi.com
Nutrients Editorial OfficeE-mail: [email protected]
www.mdpi.com/journal/nutrients


MDPI St. Alban-Anlage 66 4052 Basel Switzerland
Tel: +41 61 683 77 34 Fax: +41 61 302 89 18
www.mdpi.com ISBN 978-3-03936-359-9