A functional size measurement method for object-oriented conceptual schemas: design and evaluation...
48
FACULTEIT ECONOMIE EN BEDRIJFSKUNDE HOVENIERSBERG 24 B-9000 GENT Tel. : 32 - (0)9 – 264.34.61 Fax. : 32 - (0)9 – 264.35.92 WORKING PAPER Functional Size Measurement Method for Object-Oriented Conceptual Schemas: Design and Evaluation Issues Silvia Abrahão 1 Geert Poels 2 Oscar Pastor 1 March 2004 2004/233 1 Department of Computer Science and Computation, Valencia University of Technology 2 Management Informatics Research Unit, Department of Management Information, Operations Management and Technology Policy, Ghent University This paper has been written during a research stay of Silvia Abrahão at the Faculty of Economics and Business Administration, Ghent University (January 2004). D/2004/7012/19
Transcript of A functional size measurement method for object-oriented conceptual schemas: design and evaluation...

FACULTEIT ECONOMIE EN BEDRIJFSKUNDE
HOVENIERSBERG 24
B-9000 GENT Tel. : 32 - (0)9 – 264.34.61 Fax. : 32 - (0)9 – 264.35.92
WORKING PAPER
Functional Size Measurement Method for Object-Oriented
Conceptual Schemas: Design and Evaluation Issues
Silvia Abrahão 1
Geert Poels 2
Oscar Pastor 1
March 2004
2004/233
1 Department of Computer Science and Computation, Valencia University of Technology 2 Management Informatics Research Unit, Department of Management Information, Operations Management and Technology Policy, Ghent University This paper has been written during a research stay of Silvia Abrahão at the Faculty of Economics and
Business Administration, Ghent University (January 2004).
D/2004/7012/19

A Functional Size Measurement Method for Object-Oriented
Conceptual Schemas: Design and Evaluation Issues
Silvia Abrahão1, Geert Poels2, and Oscar Pastor1
1Department of Computer Science and Computation, Valencia University of Technology
Camino de Vera, s/n, 46022, Valencia, Spain {sabrahao, opastor}@dsic.upv.es
2Faculty of Economics and Business Administration, Ghent University
Hoveniersberg 24, 9000 Gent, Belgium [email protected]
Abstract. Functional Size Measurement (FSM) methods are intended to measure the size of
software by quantifying the functional user requirements of the software. The capability to
accurately quantify the size of software in an early stage of the development lifecycle is
critical to software project managers for evaluating risks, developing project estimates and
having early project indicators. In this paper we present OO-Method Function Points
(OOmFP), a new FSM method for object-oriented systems that is based on measuring
conceptual schemas. OOmFP is presented following the steps of a process model for
software measurement. Using this process model we present the design of the measurement
method, its application in a case study, and the analysis of different evaluation types that can
be carried out to validate the method and to verify its application and results.
Keywords. Conceptual Modeling, Object Orientation, Software Measurement, Functional
Size Measurement, Measure Validation, Measurement Verification.
1 Introduction
A functional size measurement (FSM) method measures the logical external view of the
software from the users’ perspective by evaluating the amount of functionality to be
delivered. The capability to accurately quantify the size of software in an early stage of the
development lifecycle is critical to software project managers for evaluating risks,

developing project estimates (e.g., effort, cost) and having early project indicators (e.g.,
productivity).
The most widely used FSM method is IFPUG Function Point Analysis (IFPUG FPA)
[17]. It is based on the method proposed by Alan Albrecht [6]. This technique was
developed specifically to measure the amount of data that each function accesses as an
indicator of functional size. However, this method assumes the use of traditional software
development methodologies such as structured analysis and design. One of the most serious
practical limitations of existing FSM methods is their inability to cope with object-oriented
systems. A number of approaches have been proposed in the literature to address this issue
[8], [9], [15], [16], [18], [27], [28], [30], [40], [42], [45], [48], [49], but so far, none of these
has been widely accepted in practice.
Some problems related to these proposals are: they focus on implementation aspects and
hence lack generalization [40], they do not consider all concepts of the OO paradigm
(inheritance, aggregation, etc.), and they take into account only the static dimension of an
OO system (i.e. the structural aspects commonly represented in an object model) [8] and do
not consider dynamic aspects like object interaction and object behaviour. Also, some
proposals do not use an ISO-standardized method like IFPUG FPA, but define new methods
of sizing. One disadvantage is that the functional size measured with these approaches is not
comparable with the standards accepted in practice. Apart from these problems, no
systematic evaluation of the ‘validity’ of the proposed FSM alternatives for OO systems
could be found in the literature.
In this paper we present a new method, OO-Method Function Points (OOmFP) [1], [35]
that has been developed to overcome the above mentioned difficulties in the specific context
of an automated software production method called OO-Method [36]. In an OO-Method
system specification two models are distinguished: the conceptual model (centered on the
problem space) and the execution model (centered on the solution space). The OO-Method
conceptual model uses UML-compliant diagrams [11] for specifying four orthogonal views
of an OO system:
• Object Model: static representation of the classes and their relationships.
• Dynamic Model: object lifes described in a State Transition Diagram and inter-
object interaction described in an Object Interaction Diagram.
• Functional Model: a description of the semantics associated to the changes of an
object’s state as a consequence of service occurrences.

• Presentation Model: patterns to describe user interaction with the system.
These four model views can subsequently be transformed into a formal system
specification which acts as a high-level system repository. Furthermore, using the execution
model, an OO software system which is functionally equivalent to the formal system
specification is generated in an automated way [36].
OOmFP was designed to conform to the IFPUG FPA counting rules [1]. It basically
redefines the IFPUG counting rules in terms of the concepts used in OO-Method. But apart
from this, the method was designed to overcome the difficulties that are usually encountered
when measuring the functional size of OO systems. The main features built into OOmFP
are:
• The functional size measurement is made at the conceptual schema level. As a
consequence, the functional size is measured in the problem space and is
independent of any implementation choices.
• All information related to functional size that is specified in the four OO-Method
conceptual model views is used for measurement.
• Object-oriented concepts like inheritance and aggregation are explicitly dealt with.
The purpose of this paper is to present the construction, application and evaluation of
OOmFP in a systematic way, using the process model for software measurement proposed
by Abran and Jacquet [4]. This model was used as the development framework in which
OOmFP can be evaluated and improved.
The rest of this paper is structured as follows: Section 2 discusses previous work on
functional size measurement of OO systems. Section 3 reviews the main steps of the process
model proposed for software measurement. Section 4 describes the design of OOmFP.
Section 5 presents a framework for applying OOmFP and a case study. Section 6 contains
an analysis of the different types of evaluation that can be carried out to ensure the validity
and efficacy of OOmFP. We discuss our findings and reflect upon our evaluation procedure
and make some suggestions as to how it might be improved for future investigations.
Finally, section 7 summarizes the conclusions and future work.

2 Previous Work
Function Point Analysis (FPA) proposed by Albrecht [6] can be considered as the first FSM
method. FPA’s view on functional size is that a software system consists of logical files and
functions that perform transactions using or altering the data in the logical files. The amount
of data (types) ‘handled’ by a logical file or transactional function determines the amount of
functionality that the software delivers, hence its functional size.
FPA has evolved from Albrecht’s method and is currently supported by the
International Function Point User Group (IFPUG), which has proposed detailed rules for
applying FPA [17]. Also a number of FPA variants have been proposed taking alternative
views on functional size, the most important of which are Mark II FPA [46], Full Function
Points (FFP) [43] and recently COSMIC FFP [3]. Moreover, in order to cope with object-
oriented systems measurement several approaches have been proposed. We can group these
approaches into three categories of FSM methods for OO systems.
A first category consists of methods that are compliant to IFPUG FPA. These methods
reformulate the IFPUG rules in terms of OO concepts to facilitate the function points
counting process. The final result of the function point count is the same as what would
have been obtained by directly applying IFPUG FPA. In this category we find an IFPUG
proposal for OO systems [18], and proposals by Lehne [28], Fetcke [15], and Uemura et al.
[45].
Lehne [28] presents an experience report in function points counting for object oriented
analysis and design using a method called OOram. Fetcke [15] demonstrates the
applicability of FPA as a FSM method for the OO-Jacobson method [22]. Uemura et al. [45]
propose FPA measurement rules for design specifications based on UML (Unified Modeling
Language) [11] and demonstrate a function point measurement tool, whose input products
are design specifications developed using the Rational Rose CASE tool.
Other FSM methods are not compliant to IFPUG FPA, but take a view on functional
size that is related to the IFPUG FPA view. For these methods, the underlying model of the
items that are considered to contribute to functional size is a data-oriented abstraction
similar to that of IFPUG FPA. The count that is obtained would, however, not be considered
a valid count according to the IFPUG FPA rules. In this category we find the proposals of
Whitmire [47], [48] ASMA [9], and Antoniol and Calzolari [8].
Apart from these two categories, there is a third category of methods that take a
fundamentally different view on functional size by no longer distinguishing between data

and transactions, but considering the object (actually the class definition of an object) as the
main item that contributes to functional size. In this category are the proposals of Laranjeira
[27], Rains [40], Zhao and Stockman [49], Sneed [42], Gupta and Gupta [16], and
Minkiewicz [30].
OOmFP is a first-category FSM method, since it is compliant to the IFPUG FPA rules
and consistent with the IFPUG view on functional system size. It was designed to improve
upon IFPUG FPA for the function point counting of OO systems that are developed using
the OO-Method approach [36], taking into account its specific modeling constructs in the
four complementary conceptual model views.
The quoted OO-Method approach provides a method to go from the conceptual schema
to the corresponding software product in an automated way, through a process of conceptual
model compilation. In accordance with that, a main contribution of this work is to provide a
concrete method for evaluating the functional size of a conceptual schema that is going to
become a kind of high-level source program. Anyway, the work presented here is not
entirely specific to OO-Method. It can be applied to any OO-based model that provides the
basic OO conceptual modeling primitives. It also differs from the related work in the sense
that we define and evaluate a new FSM method using a systematic approach. This approach
is based on a process model for software measurement, which we present and discuss in the
next section. The goal of this paper is therefore not only to present ‘yet another method’,
but also how a new FSM method can be systematically designed and evaluated using a
generic framework.
3 A Process Model for Software Measurement
Jacquet and Abran [4] [23], in their work as ISO editors for the Guide to the Verification of
FSM methods (ISO 14143-3) [21] suggest a process model for software measurement (see
Figure 1).
Figure 1. Measurement Process Steps (Source: Jacquet and Abran [23])
Design of the measurement
method
Application of the
measurement method rules
Analysis of the measurement
result
Exploitation of the
measurement result
Step 1 Step 2 Step 3 Step 4

In the first step, a measurement method is designed. In this step, the concept to be
measured is defined and the rules to measure it are conceived. In addition, all tasks
associated with a method’s measurement procedure are described.
In the second step, the measurement method is applied to measure the size of software
applications. In this step it is necessary to evaluate questions such as “Which level of
knowledge is required in order to be able to apply the rules of the measurement method?”,
“Can the data storage and the measurement rules application be automated?”.
In the third step, the results provided by the measurement method are presented and
verified (i.e. “Is the value that is produced the result of a correct application and
interpretation of the measurement rules?”). Finally, in the fourth step the results are
exploited. In this step the results of functional size measurement are used in different types
of models (e.g., productivity analysis models, effort estimation models, schedule estimation
models, budgeting models).
Only the first three steps of the measurement process are within the scope of this paper.
Figure 2 shows the substeps of the software measurement process model related to these
steps.
Figure 2. Measurement Process – Detailed Model (Source: Jacquet and Abran [23])
Definition of the objectives
Characterization of the concept to
be measured
Selection of the metamodel
Definition of the numerical
assignment rules
Step 1 Design of the Measurement Method
Step 2Measurement Method Application
Software documentation
gathering
Construction of the software
model
Application of the numerical assignment
rules
Step 3 Measurement Result
Analysis of the measurement
result

4 Design of the Measurement Method
Within step 1 of the process model described in Figure 2, four steps were suggested for a
complete design of the measurement method: definition of the objectives, design or
selection of a metamodel, the characterization of the concept to be measured, and finally,
the definition of the numerical assignment rules. The use of these steps in the development
of OOmFP is presented in the following subsections.
4.1 Definition of the Objectives
In terms of the Goal/Question/Metric (GQM) template for goal-oriented software
measurement [10], the goal pursued in this work is: define and evaluate a functional size
measurement method for the purpose of measuring object-oriented software systems with
respect to their functional size from the point of view of the researcher. The context
concerns a requirements specification of an object oriented system.
4.2 Characterisation of the Concept to be Measured
The entity to be measured consists of an OO-Method conceptual schema. The attribute to be
measured is functional size, defined by ISO/IEC 14143-1 [20] as “a size of the software
derived by quantifying the Functional User Requirements”. The Functional User
Requirements represent a subset of user requirements focusing on what the software must
do to fulfill the user's needs, without considering how this will be accomplished. They
exclude any non-functional or technical requirements.
4.3 Selection of the Metamodel
A metamodel can be defined as the set of concepts used to represent software or a piece of
software and its relationships. The metamodel of a FSM method provides a precise basis to
design the measurement rules that identify and measure these concepts.
A metamodel of a FSM method therefore reflects the particular view on functional size
taken by the FSM method. The elements in the abstract model of a software application that
is obtained through the instantiation of the metamodel are mapped by the measurement rules
into numbers. These numbers represent the (relative) amount of functionality that these

elements contribute to the functional size of the system. Finally these numbers are
aggregated into an overall functional size value for the system.
As OOmFP was designed to conform to the IFPUG FPA counting rules [17], it assumes
in essence the same metamodel as IFPUG FPA. Therefore, we first discuss the IFPUG FPA
metamodel and next we present a set of rules to map the concepts of this metamodel onto
the concepts used in the OO-Method conceptual schemas.
4.3.1 IFPUG FPA Metamodel
As described in Figure 3, IFPUG FPA’s view on functional size is that a software system
consists of logical data files (internal logical files and external interface files indicated
respectively by ‘ILF’ and ‘EIF’) and functions (external input functions, external output
functions and external inquiry functions indicated respectively by ‘EI’, ‘EO’ and ‘EQ’) that
perform transactions using or altering the data in the logical data files.
The amount and complexity of the data (types) ‘handled’ by a logical data file or
transactional function determines the amount of functionality that this piece of software
delivers, hence its functional size. The boundary separates the software system being
measured from its environment. Within this environment are the users of the system, which
may include other systems. Also systems that are used by the system within the scope of
measurement are identified.
Figure 3. IFPUG FPA view on functional size
Figure 4 shows the IFPUG FPA metamodel. It illustrates the information we need to
capture for representing a software system (called 'project' in IFPUG FPA terminology) that
will be measured. Measuring a Project includes the following activities: determination of
User
User
ILFsEIFs
External Inquiries (EQs)
External Outputs (EOs)
External Inputs (EIs) System beingMeasured
Other Systems EQs
EIs / EOs
Boundary
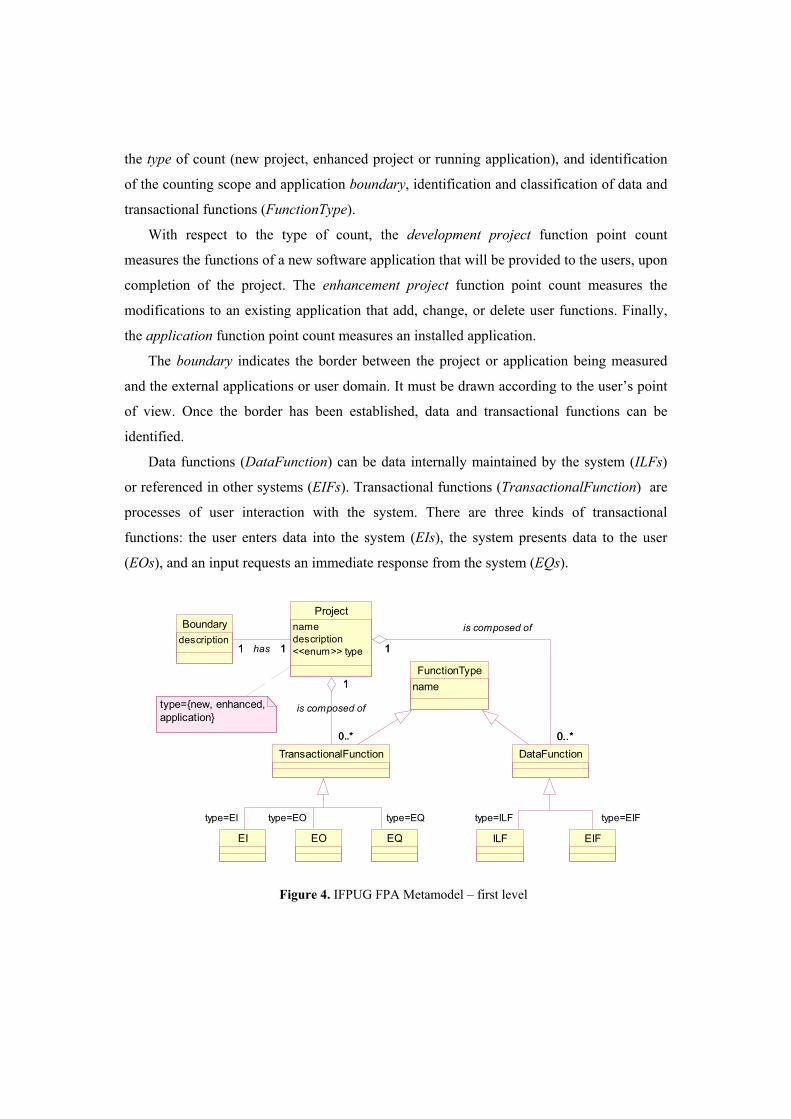
the type of count (new project, enhanced project or running application), and identification
of the counting scope and application boundary, identification and classification of data and
transactional functions (FunctionType).
With respect to the type of count, the development project function point count
measures the functions of a new software application that will be provided to the users, upon
completion of the project. The enhancement project function point count measures the
modifications to an existing application that add, change, or delete user functions. Finally,
the application function point count measures an installed application.
The boundary indicates the border between the project or application being measured
and the external applications or user domain. It must be drawn according to the user’s point
of view. Once the border has been established, data and transactional functions can be
identified.
Data functions (DataFunction) can be data internally maintained by the system (ILFs)
or referenced in other systems (EIFs). Transactional functions (TransactionalFunction) are
processes of user interaction with the system. There are three kinds of transactional
functions: the user enters data into the system (EIs), the system presents data to the user
(EOs), and an input requests an immediate response from the system (EQs).
EI EO EQ ILF EIF
FunctionTypename
type={new, enhanced, application}
DataFunction
Boundarydescription
Projectnamedescription<<enum>> type
0..*
1
0..*
1
is composed of
1 11 1has
TransactionalFunction
0..*
1
0..*
1
is composed of
type=EI type=EO type=EQ type=ILF type=EIF
Figure 4. IFPUG FPA Metamodel – first level
4.3.2 Mapping Between Concepts
As our objective is to measure OO-Method conceptual schemas, we need to define a
mapping between the concepts used in the IFPUG FPA metamodel and the conceptual
primitives of OO-Method. This mapping of concepts is an extension of IFPUG FPA that is
included in OOmFP.
As OOmFP is a FSM method for object-oriented systems, mapping rules must be
defined for the different perspectives of an OO system. These perspectives, along with their
corresponding OO-Method conceptual model views, are:
• Data: the information that is maintained by the system. This information is defined
in the Object Model.
• Process: the computations that a system performs as defined in the Object Model
with a precise definition of the semantics associated to state changes in the
Functional Model.
• Behaviour: the dynamic interactions of a system in terms of valid object lives and
inter-object interaction, defined in the Dynamic Model.
• Presentation: the user interactions with the system, defined in the Presentation
Model.
The measurement scope defines the functionality which will be included in a particular
measurement. The system boundary indicates the border between the project being
measured and the external systems and user domain. In OO-Method, the system boundary is
an imaginary line in the Object Model that can be identified applying the following rules:
• Accept each Agent as a user of the system.
• Accept each Legacy View as an external application.
Agent relationships are used to state that objects of a class (acting as client) are allowed
to activate services in other classes (acting as server). Legacy views are used to represent
external functionality (pre-existing software systems) that is used by the system being
specified.
As in IFPUG-FPA, we take into consideration data and transactional functions. The
main idea used to establish the mapping of concepts is to consider classes as internal logical
files (ILF) and legacy views as external interface files (EIFs). The services defined in a class
or legacy view can be classified as external inputs (EIs). Finally, the presentation patterns3
defined in the Presentation Model for visualizing the object society of a class can be
considered as or external outputs (EOs) or external inquiries (EQs).
Crucial to the mapping is that IFPUG FPA takes the perspective of the end user and
therefore only the functions that are visible to the end users contribute to the functional size.
This is expressed in OO-Method through the definition of agent relationships. Only the
functions that have at least one associated agent to interact with the class or legacy view via
a service or presentation pattern are considered when applying the mapping rules of Table 1.
Table 1. Mapping the IFPUG FPA concepts to OO-Method primitives
Function IFPUG FPA OO-Method ILF It is a user identifiable group of data or
control information maintained within the boundary of the system.
It is a class that encapsulates a set of data items (attributes) representing the state of the objects in each class.
EIF It is logical groups of data referenced by the system being measured but maintained by other system.
It is a legacy view that is defined as a filter placed on a class by a preexisting software system.
EI Processes data that enters from outside the boundary of the system. Its intent is to maintain one or more ILFs or to alter the behavior of the system through its processing logic.
It is a service defined in a class or legacy view since a service always changes the state of the class (altering the behaviour of the system).
EO Present information to a user through processing logic that must contain at least one calculation, creates derived data, or alters the behaviour of the system. The data exits the boundary of the system.
It is an Instance Interaction Unit, Population Interaction Unit and Master-detail Interaction Unit defined in the Presentation Model [31]. The intent is to present information to the user. The pattern must perform some calculations, or use some derived attribute.
EQ Retrieval data to send outside the system boundary. The intent is to present information to a user retrieving data from ILFs or EIFs. The processing logic contains no calculations and creates no derived data.
It is an Instance Interaction Unit, Population Interaction Unit and Master-detail Interaction Unit defined in the Presentation Model [31]. The intent is to present information to the user without altering the system behaviour.
4.4 Definition of the Numerical Assignment Rules
In this substep, the measurement rules that result in the assignment of a numerical value to
the functional size of an OO-Method conceptual schema are defined. The mapping of the
software system onto a number representing its functional size is accomplished by
weighting the transactional and data functions according to their complexity.
3 The presentation patterns are: Instance Interaction Unit (IIU), Population Interaction Unit (PIU) and
Master-detail Interaction Unit (MDIU) [25]. They describe different kinds of user interaction with the system where data generated within the system is presented to the user.

Figure 5 shows the detailed view of the IFPUG-FPA metamodel including the concepts
used for weighting functions. The complexity of a transactional function is a function of the
number of Data Element Types (DET_Transaction) and the number of File Types
Referenced (FTR). A FTR is a data function referenced during the execution of a
transactional function.
EI EO EQ ILF EIF
comp_level={low, average, high}
type={new, enhanced, application}
type=EI type=EO type=EQtype=ILF type=EIF
DETname
Boundarydescription
DET_Transaction
FTR
TransactionalFunctionname/DETs_quantity/FTRs_quantity 1..*1 1..*1
has
0..*
1..*
0..*
1..*
has
DET_DataRET
name
DataFunctionname/DETs_quantity/RETs_quantity1..* 11..* 1
has
1..*1 1..*1
has
Projectnamedescription<<enum>> type/ILFs_quantity/EIFs_quantity/EIs_quantity/EOs_quantity/EQs_quantity/functionalSize
1 11 1has
0..*
1
0..*
1
is composed of
0..*
1
0..*
1
is composed of
FunctionTypename<<enum>> comp_levelweight
Figure 5. IFPUG FPA Metamodel – second level
The complexity of a data function is a function of the number of Data Element Type
(DET_Data) and the number of Record Element Types (RET).
A DET is a unique, user recognizable, non-repeated field. For instance, an account
number that is stored in multiple fields is counted as one DET. A RET is a user recognizable
subgroup of data elements within a logical file (ILF or EIF). For instance, in a Human
Resources Application, information for an employee is added by entering some general
information. In addition to the general information, the employee is a salaried or hourly paid
employee. Then, two RETs are identified: salaried employee and hourly paid employee.
The IFPUG [17] provides several tables to determine the complexity levels of each
function type. In general, the more DETs and FTRs are identified for transactional
functions, and the more DETs and RETs are identified for logical data files, the higher their

complexity. For instance, an ILF with one RET and until nineteen DETs is classified as
having a low complexity.
An important constraint that arises from the analysis of the metamodel shown in Figure
5 is that only the candidate functions that have at least one DET are considered.
Accordingly, the following mapping rule is added:
• Reject candidate functions that have no DET.
Next, a weight (value) is assigned to each function depending on its type and complexity
level. Table 2 summarizes the weights provided in the IFPUG-FPA counting manual [17] .
For instance, the weight assigned to an ILF having low complexity is 7. Finally, the values
are summed to produce the functional size of the project in unadjusted function points.
Table 2. Complexity weights
Function types Low Average High ILF 7 10 15 EIF 5 7 10 EI 3 4 6 EO 4 5 7 EQ 3 4 6
Therefore, given a conceptual schema produced during the OO-Method conceptual
modeling step, OOmFP is calculated as follows:
nTransactioData OOmFPOOmFPOOmFP +=
Where:
∑∑==
+=m
jviewlegacy
n
iclassData ji
OOmFPOOmFPOOmFP11
∑∑==
+=m
jMDIUPIUIIU
n
iservicenTransactio jjji
OOmFPOOmFPOOmFP1
//1
The additional information represented in the detailed view of the metamodel is
captured by applying the measurement rules of OOmFP. Next, we introduce the proposed
measurement rules for each OO-Method conceptual model view.
4.4.1 Measurement Rules for the Object Model
As in IFPUG FPA the complexity of a class (i.e. ILF) or legacy view (i.e. EIF) is
determined by counting the number of Data Element Types (DET) and Record Element

Types (RET). Table 3 describes the measurement rules proposed to identify the DETs and
RETs for a class. According to Table 3, DETs correspond to attributes in the object classes
and RETs correspond to object classes. Data-valued attributes represent simple attributes
such as integers and strings.
Table 3. Measurement Rules for the Complexity of a Class
Data Element Type (DET) Record Element Type (RET) 1 DET for each data-valued attribute of the class
1 RET for the class
1 DET for each attribute in the IF4 of
a class or legacy view referred to by a univalued aggregation relationship
1 RET for each multivalued aggregation relationship (class or legacy view)
1 DET for each attribute in the IF of the superclasses of a class
We consider both aggregations5 and generalization/specialization relationships as
contributing to the complexity of a class. IFPUG suggests counting a DET for each piece of
data that exists because the user required a relationship with another ILF or EIF. It is also
suggested to identify a RET for each group of data.
Aggregations are measured according to the multiplicity property of the relationship.
This property specifies the lower/upper number of objects that must/can be associated to a
single object of the class.
Aggregations in OO-Method allow for bidirectional navigation. If the number of target
instances in the relationship is one (indicating a univalued aggregation) a DET is identified
for each attribute that is part of the IF of the class that is referred to. On the other hand, if
the number of target instances in the relationship is greater than one (indicating a
multivalued aggregation) a RET is identified. Note that these rules can be applied regardless
of the role of the class in the aggregation (i.e. “part” or “whole”). There is no danger of
“double counting” required functionality, as the aggregation relationships are bidirectional.
OO-Method allows defining aggregations with identification dependency. This means
that the identifier of the whole (or part) class is constructed using the identifier of the whole
(or part) class. The identification dependency is asymmetric and can be defined in the whole
4 The Identification Function (IF) is used to identify a class. A class can have 0, 1 or more IFs that are specified
by indicating the attributes that define it. Zero IF indicates a specialization with Identification Dependency, where the subclass uses the IF inherited from the superclass. In this paper, to aid understandability, the attributes that compose the IF of classes or legacy views are depicted with “id_”.
. 5 The concept of aggregation in OO-Method includes the concepts of association and composition provided by
UML [10].

or part class. The only constraint is that the multiplicity of the dependent class with respect
to the other class must be 1:1. For functional size measurement purposes, an aggregation
with identification dependency does not present a special case. The attributes of the IF of the
whole/part class were already counted as DETS because of the presence of the univalued
aggregation relationship.
If the aggregation is inclusive (the part is encapsulated in the whole, that is, the part can
only be accessed trough the whole), then both part and whole are considered as one data
group. Hence two RETs are identified when rating the complexity of the whole class.
From a user point of view, abstract classes are not explicitly differentiated from other
classes in OO-Method. Therefore object instances of any of the classes that participate in an
inheritance hierarchy can potentially exist. Thus, one ILF for each class involved in the
inheritance hierarchy is considered. Specialization relationships are measured in the
subclasses by adding DETs for attributes in the IF of their direct superclasses.
Figure 6 shows the measurement of a class Employee with a reflexive aggregation
relationship. The conceptual model follows the OO-Method notation. We denote a class by
a box with the class name in a gray compartment at the top of the box.
Applying the measurement rules shown in table 3, the data-valued attributes of the class
Employee are counted as DETs and the class itself is considered as a RET. Because the
relationship role of "manager" has a multiplicity of 0:1 and the IF is formed by only one
attribute (id_employee), one DET is counted. In the same way, because the relationship role
of "manages" has a multiplicity of 0:M, one RET is counted. Another DET is identified for
the attribute id_rate in the IF of the legacy view Rate, that is connected through univalued
aggregation relationship with Employee.
Table 4 describes the measurement rules proposed to measure the complexity of a
legacy view. A legacy view can be involved in aggregation relationships with classes. If this
occurs, it is necessary to define an identification function in order to identify the objects we
need to access in the legacy system. In fact, a legacy view represents a class in another
system. Thus, its complexity is measured in the same way as classes.
Table 4. Measurement Rules for the Complexity of a Legacy View
Data Element Type (DET) Record Element Type (RET) 1 DET for each non-derived attribute of the legacy view
1 RET for the legacy view
1 DET for each attribute in the IF the class related to by a univalued aggregation
1 RET for each multivalued aggregation relationship with a class
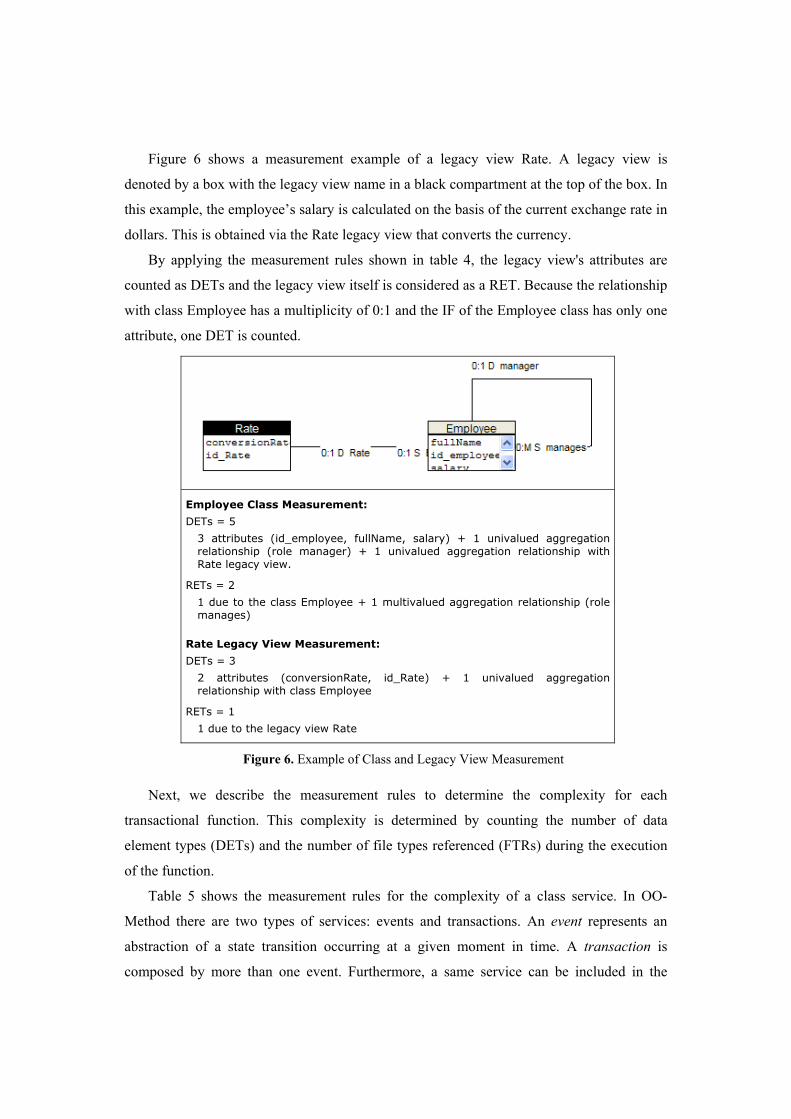
Figure 6 shows a measurement example of a legacy view Rate. A legacy view is
denoted by a box with the legacy view name in a black compartment at the top of the box. In
this example, the employee’s salary is calculated on the basis of the current exchange rate in
dollars. This is obtained via the Rate legacy view that converts the currency.
By applying the measurement rules shown in table 4, the legacy view's attributes are
counted as DETs and the legacy view itself is considered as a RET. Because the relationship
with class Employee has a multiplicity of 0:1 and the IF of the Employee class has only one
attribute, one DET is counted.
Employee Class Measurement:
DETs = 5
3 attributes (id_employee, fullName, salary) + 1 univalued aggregation relationship (role manager) + 1 univalued aggregation relationship with Rate legacy view.
RETs = 2
1 due to the class Employee + 1 multivalued aggregation relationship (role manages)
Rate Legacy View Measurement:
DETs = 3
2 attributes (conversionRate, id_Rate) + 1 univalued aggregation relationship with class Employee
RETs = 1
1 due to the legacy view Rate
Figure 6. Example of Class and Legacy View Measurement
Next, we describe the measurement rules to determine the complexity for each
transactional function. This complexity is determined by counting the number of data
element types (DETs) and the number of file types referenced (FTRs) during the execution
of the function.
Table 5 shows the measurement rules for the complexity of a class service. In OO-
Method there are two types of services: events and transactions. An event represents an
abstraction of a state transition occurring at a given moment in time. A transaction is
composed by more than one event. Furthermore, a same service can be included in the
specification of more than one class. These shared services represent a synchronous
communication mechanism between the objects involved in the event occurrence.
A service is measured once, even if it is inherited by several subclasses, or shared in
more than one class. In order to measure a service, consider each data-valued argument as a
DET and each object-valued argument (the type is an object) as a FTR. Also, the class in
which the service is defined is considered as a FTR.
We included two additional rules to be compliant to IFPUG FPA. IFPUG suggests
counting one DET for the capability of the system to send a system response message (error,
confirmation, control) outside the system boundary. Another suggestion is to count one DET
for the ability to specify an action to be taken even if there are multiple methods for
invoking the same logical process. In addition, we specify a set of measurement rules for
identifying FTRs in a service. These rules are associated with the class signature6 and
consist in verifying: whether in some formula (value by default, destroy event, transaction,
specialization by condition, specialization by event, integrity constraint) a new class is
referenced. If it occurs, one FTR for each new class is counted.
Table 5. Measurement Rules for the Complexity of a Class Service
Data Element Type (DET) File Type Referenced (FTR) 1 DET for each data-valued argument of the service
1 FTR for the class
1 DET for the capability to send messages 1 FTR for each new7 class referenced in the object-valued argument of the service.
1 DET for the action (Accept/Cancel) of the service execution.
If a value by default is defined, count one FTR for new class referenced in the formula.
If the service is a destroy event, count one FTR for each new class accessed in the cascade formula.
If the service is a transaction, count one FTR for each class referenced in the transaction formula.
If a specialization by condition is defined, count one FTR for each new class accessed in the specialization formula.
If a specialization by event is defined (carrier/liberator event), count one FTR for each new class for which the event is a carrier/liberator.
If integrity constraints are defined, count one FTR for new class referenced in the formula.
6 There are a set of well-formed formulas associated to the class signature defined according to a formal
language called OASIS [30].

In OO-Method, there are two kinds of inheritance hierarchies: permanent or temporal. In
the former case, the corresponding condition on constant attributes must characterize the
specialization relationship (specialization by condition)8; in the latter, a condition on
variable attributes or carrier/liberator events that activates/deactivates a child role for an
object of a class must be specified (specialization by event). The checking integrity
constraint verifies all the possible states of an object during its life.
Figure 7 shows an example of a service measurement. In this example, a Person is
specialized in a Student when the carrier event register occurs; and the object leaves this
class through the execution of the liberator event finish. A person can be identified using
his/her identifier or SSN and a Student using his/her identifier. Signatures for services
create_Person and register are shown in the right side of the box. By applying the
measurement rules shown in table 5, data-valued (DV) arguments are counted as DETs and
the class where the service is defined is considered one FTR.
In the carrier event Register, one additional FTR is identified due to the subclass
Student. Finally, for each service, two additional DETs (related to the system capability in
provide messages and actions) are considered to be compliant with the IFPUG-FPA
counting rules.
Services Signature:
create_Person(dv_id_Person, dv_id_SSN, dv_gender, dv_fullname)
register(ov_thisPerson, dv_id_Student, dv_school)
createPerson Event Measurement:
DETs = 6
4 DV attributes (dv_id_Person, dv_id_SSN, dv_gender, dv_fullname) + 1 capability to send messages + 1 action to execute the service
FTR = 1
1 due to the class Person
Register Event Measurement:
DETs = 4
2 DV arguments (dv_id_Student, dv_school) + 2 (system capability to send messages + actions)
FTRs = 2
1 due to the class Person+ 1 class Student
Figure 7. Example of Service Measurement
7 New in this context means that the class was not counted yet. 8 It denotes a permanent specialization. If a specialization condition holds at the moment of creating the object,
the object will belong to the superclass and subclass.
Table 6 shows the measurement rules for the complexity of a legacy view service. In a
legacy view a service is specified by defining a set of input and output arguments. Also, a
precondition or integrity constraints can be specified based on the input arguments.
Table 6. Measurement Rules for the Complexity of a Legacy View Service
Data Element Type (DET) File Type Referenced (FTR) 1 DET for each data-valued argument of the service
1 FTR for the legacy view
1 DET for the capability to send messages If preconditions are defined, 1 FTR for each new class referenced in the formula of a precondition definition.
1 DET for the action (Accept/Cancel) of the service execution.
If integrity constraints are defined, count one FTR for new class referenced in the formula.
In order to measure a legacy view service, consider each data-valued argument as a
DET and the legacy view in which the service is defined as a FTR. Two additional DETs are
considered to be compliant with the IFPUG-FPA counting rules (related to the system
capability in provide messages and actions). Finally, if a precondition or integrity constraint
is defined, consider a FTR for each class that are referenced in these formulas.
4.4.2 Measurement Rules for Dynamic and Functional Models
The measurement rules described here are defined taking into account the complementary
information for the Object Model, specified in the Dynamic and Functional models. We first
introduce these conceptual models views and then the proposed rules for measure them.
The Dynamic Model in OO-Method uses a State Transition Diagram (STD) and an
Interaction Diagram (ID) to represent object life cycles and interobject communication,
respectively. STD is used to describe the appropriate sequence of service occurrences that
characterizes the correct behavior of the objects that belong to a specific class. Also, every
service occurrence is labeled by the agent that is allowed to activate it. The syntax for
transitions is the following:
[ list_of_agents | * ] : [preconditions] service_name [ WHEN control_condition ]
where, preconditions are defined as conditions regarding the object attributes. They
must comply with the object’s current state before a specific service may be carried out.
Control conditions are conditions defined on object attributes to avoid the possible non-
determinism for a given service activation.
The interaction diagram (ID) specifies the interobject communication. Two basic
interactions are defined: triggers, which are object services that are activated in an
automated way when a condition is satisfied, and global interactions, which are transactions
involving services of different objects. Trigger specifications follow the syntax:
destination :: (trigger_condition) agent:service
The measurement rules for the Dynamic Model are defined taking into account the
formulas associated to the definition of a class. It consists in identifying new FTRs for
classes that are referenced in these formulas. The use of these rules can thus result in a
higher complexity rating for the services that are identified as external input functions (EIs).
The proposed measurement rules for the Dynamic Model are:
• 1 FTR for each new class referenced in the formula of a control condition, defined
in the state transition diagram.
• 1 FTR for each new class referenced in the formula of a trigger definition, defined
in the interaction diagram.
• 1 FTR for each new class referenced in the formula of a precondition definition,
defined in the state transition diagram.
In the Functional model, the semantics associated to any change of an object state is
captured as a consequence of a service occurrence. To do this, valuations are specified in
this model to define a specific event’s effect on the value of an attribute of the class. An
attribute can be categorized in the following types: push-pop, state-independent and
discrete-domain based. Each type will fix the pattern of information required to define its
functionality.
Push-pop attributes are those whose relevant services increase, decrease or reset their
value. State-independent attributes are those having a value that depends only on the latest
service that has occurred. Finally, discrete-domain valued attributes are those that take their
values from a limited domain. The object reaches a specific state, where the attribute value
can be specified, through the activation of carrier or liberator services. In addition, a control
condition can be used to indicate which valuation should be considered when the condition
fulfills. The proposed measurement rules for the Functional Model are:
• 1 FTR for each new class referenced in the formula of a valuation definition.
• 1 FTR for new class referenced in the formula of a control condition associated to
the valuations.
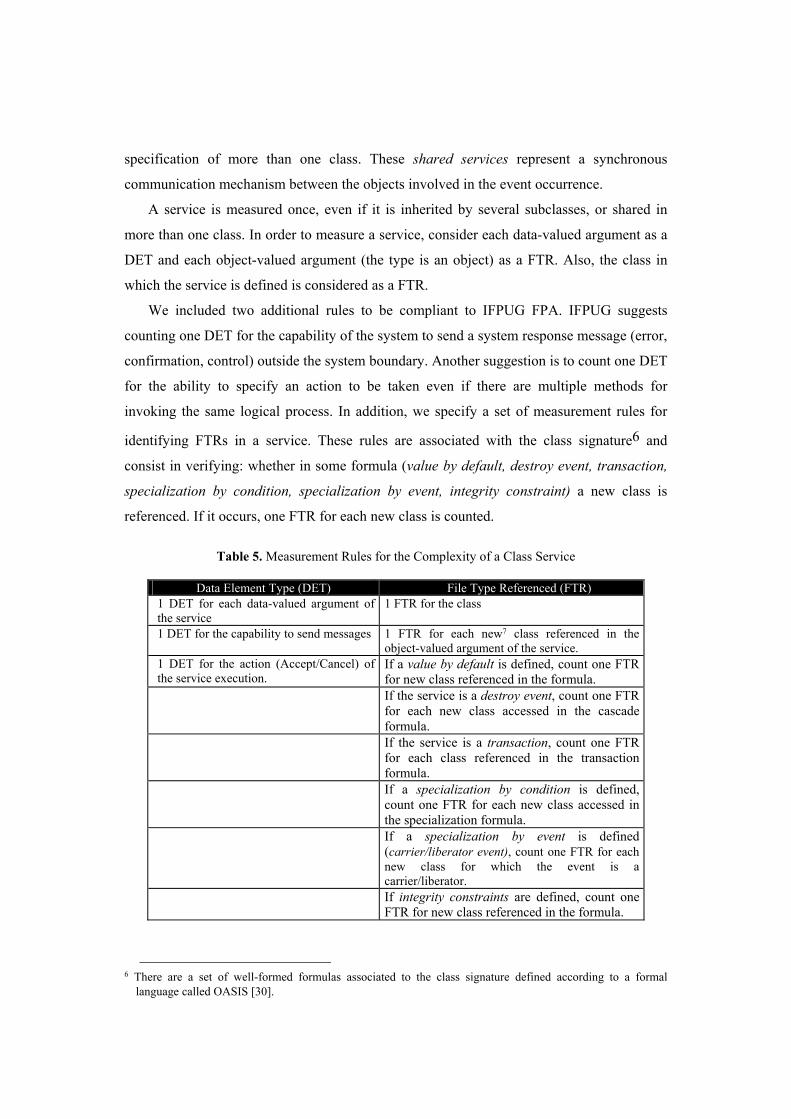
Figure 8 shows an example of a service measurement with a precondition. A
precondition is defined in the event finish of the class Student indicating that the object
leaves this class through the execution of the liberator event finish only whether the course
is closed.
State Transition Diagram:
Services Signature:
finish(ov_thisPerson, dv_id_Student, dv_school)
Event finish Measurement:
DETs = 4
2 DV arguments + 2 (system capability to send messages + actions)
FTRs = 3
1 due to the class Student + 1 class Person + 1 class Course (precondition)
Figure 8. Example of Event Measurement
4.4.3 Measurement Rules for Presentation Model
Finally, in this subsection the measurement rules for measuring the presentation patterns
Instance Interaction Unit (IIU), Population Interaction Unit (PIU), and Master-detail
Interaction Unit (MDIU) are presented. Table 7 describes the measurement rules proposed
to measure the complexity of an IIU. The aim of this pattern is to define the information that
will be presented to the user, the actions that can be performed and the additional
information that can be visualized for a class or legacy view.
The information to be presented is defined in terms of a display set with attributes of the
class/legacy view or from the classes or legacy views that can be reached from this
class/legacy view. One DET for each class/legacy view attribute and one FTR for each
referenced class/legacy view are counted. The actions that can be supplied for the object
constitute its services (by default all class/legacy view services). One DET is counted for
each service included in the offered action as the IFPUG counting rules suggest to count one
DET for the ability to specify an action for invoking a logical process.
: If course.closed=TRUE

Table 7. Measurement Rules for the Instance Interaction Unit Pattern
Data Element Type (DET) File Type Referenced (FTR) 1 DET for each attribute in the display set 1 FTR for each class or legacy view in the
display set 1 DET for each offered action (by default all class or legacy view services)
1 DET for each offered navigation (by default all inheritance/aggregation relationships in which the class or legacy view participates)
1 DET for the system capacity to display messages (error, control, etc.)
The additional information is obtained from navigations performed using the
inheritance/aggregation relationships in which the class participates. One DET is counted
for each class that can be reached because the IFPUG counting rules suggest to count a
DET for each piece of data required by the user to establish a relationship with
another ILF or EIF. Finally, one additional DET is considered for the capacity of
displaying messages.
An instance interaction unit pattern (IIU) is defined in the Figure 9. This pattern allows
us to review the information for a given employee depicted in Figure 6.
Presentation Pattern Definition
Name: IIU_Employee
Display Set: id_employee, firstName, lastName, salary.
Actions: create_instance, delete_instance, calcWage
Navigations: IIU_Rate
Presentation Pattern Measurement
DETs = 9
4 attributes in the display set + 3 actions + 1 navigation + 1 system capability to present messages
FTRs = 1
class Person in the display set
Figure 9. Example of an Instance Interaction Unit Measurement
Table 8 describes the measurement rules proposed to measure the complexity of a
Population Interaction Unit (PIU). Its main intention is to present information to the user
providing filtering and/or ordering mechanisms that facilitate object selection and
observation. A PIU is specified over a class defining: the information that will be presented,
the filtering/ordering mechanisms, the actions that can be invoked over objects and
additional information (by means of navigations) to facilitate the consultation of related
objects.
All measurement rules for an IIU are applicable for measuring a PIU. In addition, for
each defined filter, one DET for each data-valued variable and one FTR for each object-

valued variable of the filter are counted. Also, one FTR for each new class referenced in the
ordering criteria.
Table 8. Measurement Rules for the Population Interaction Unit Pattern
Data Element Type (DET) File Type Referenced (FTR) 1 DET for each attribute in the display set 1 FTR for each class or legacy view in the
display set 1 DET for each data-valued unique variable of a filter
1 FTR for each unique object-valued attribute of a filter
1 DET for each offered action (by default all class/legacy view services)
1 FTR for each new class referenced in the ordering criteria
1 DET for each offered navigation (by default all inheritance/aggregation relationships in which the class or legacy view participates)
1 FTR for each new class referenced in the filter formula
1 DET for the system capacity of presenting messages (error, control, etc.)
Finally, the intention of a Master-Detail Interaction Unit (MDIU) is to present
information using the master/detail logical components. In a pattern of this kind, the
information presented in the detail part depends on the selection made in the master part. It
is defined on a class and the master part can be an IIU or PIU, and the detail part can be one
or more IIU, PIU or MDIU. A MDIU is measured applying the measurement rules described
in tables 7 and 8 depending on the presentation patterns used in the definition of the
master/detail parts.
5 Measurement Method Application
Figure 10 contains a representation of the procedure that is used to apply OOmFP. This
model clarifies the relation between OOmFP, OO-Method, and IFPUG FPA.
As shown in the figure, OOmFP is used for the functional size measurement of systems
that are modeled with OO-Method. The metamodel and view on functional size
measurement is essentially that of IFPUG FPA. The OOmFP mapping rules help identifying
the elements in an OO-Method conceptual schema that contribute to the functional size of
the system. The OOmFP measurement rules support the IFPUG FPA counting rules in the
process of assigning numerical values to the identified elements. For each step in this
procedure we also show the equivalent step in the detailed process model proposed by
Jacquet and Abran [23] (see step 2 in Figure 2).

Figure 10. A model of the OOmFP Measurement Procedure
According to the process model of Jacquet and Abran [23] three steps were suggested
for an application of the measurement method: software documentation gathering,
construction of the software model, and application of the numerical assignment rules. In
the software documentation gathering step, an OO-Method conceptual schema is built using
the OO-Method approach based on the user requirements specification. This conceptual
model includes four complementary conceptual schemas: Object Model, Dynamic Model,
Functional Model and Presentation Model.
IFPUG FPA View on Functional Size
OO-Method Conceptual Schema
Jacquet and Abran’s measurement process
model [4], [23]
Applying OOmFP
User Requirements Specification
OO-Method
OOmFP mapping rules
(4.3.2)
OOmFP measurement
rules (4.4)
IFPUG counting rules
Functional size value (x)
Software Documentation
Gathering
Construction of the Software Model
Identification Step
Measurement Step
Measurement Abstract Model
Fetcke’s generalised representation of FSM [14]
Application of the Numerical
Assignment Rules
In the construction of the software model step, we use the OOmFP mapping rules to
obtain the IFPUG FPA view on the functional size of the modeled system. This step consists
in identifying the elements in the OO-Method conceptual schema that add to the functional
size of the system and to abstract from those that do not contribute to functional size. The
result of this step is a collection of data and transactional functions, which can be quantified
in the next step. Hence, in the application of the numerical assignment rules step, a
functional size value (x) is obtained through the application of two sets of rules. First, the
OOmFP measurement rules are used to identify the elements that add to the complexity of
the identified functions (e.g. DETs, RETs, FTRs). Next the standard IFPUG counting rules
are used to rate the complexity of the functions, to assign weights to the functions, and to
aggregate the assigned values into an overall functional size value for the system.
The OOmFP application procedure is also compared to the generalized representation of
functional size measurement of Fetcke et al. [14]. This representation was applied to
represent IFPUG-FPA [18] , Mark II FPA [46], and Full Function Points [43]. According to
this model, functional size measurement requires two steps of abstraction, called the
identification step and the measurement step.
The aim of the identification step is to identify the elements in the requirements
documentation that add to the functional size of the system. The result of this first
abstraction activity is an abstract model of the relevant elements for functional size
measurement, according to the metamodel of the FSM method that is used. During the
measurement step, the elements in the abstract model are mapped into numbers representing
the (relative) amount of functionality that is contributed to the functional size of the system.
Finally the numbers are aggregated into an overall functional size value.
As shown in the figure, OOmFP conforms to the generalized representation of
functional size measurement. During the identification step an abstraction of the modeled
system is made using the OOmFP mapping rules. This abstraction contains only those
elements of the system that are relevant for functional size measurement, according to the
IFPUG FPA metamodel. Next, during the measurement step, the OOmFP measurement
rules are used as part of the process of assigning numbers to the elements of the abstract
model.
In the remainder of this section, we illustrate the use of OOmFP with a case-study. To
organize the section we use the steps in the left column of Figure 10.

5.1 Software Documentation Gathering
The documentation used to apply OOmFP was a requirements specification document for
building a new Project Management System (PMS) for a company, the corresponding OO-
Method conceptual model specification as well as a set of guidelines explaining how to
apply the method.
5.1.1 User Requirements Specification
The system requirements are described in the format of the IEEE 830 standard [7]. Using
this standard a software requirements specification is described in terms of functionality
(what is the software supposed to do from the user's perspective), external interfaces
(interaction of the software with people, hardware and other software), performance (such as
availability, response time, etc.), quality attributes (such as portability, maintainability,
security, etc.), and design constraints imposed by implementation (required standards,
implementation language, policies for database integrity, operating environments, etc.).
The PMS is a new system that replaces the current manual hand drawing processes for
project management. The PMS will provide the following major functions: task
maintenance (create, change, delete), task type maintenance (create, change, delete), project
maintenance (create, change, delete, task assignment), project type maintenance (create,
change, delete), department maintenance (create, change, delete), user maintenance (create,
change, delete, change password), and inquiries (users, projects and type of tasks, etc.).
An example of a functional requirement is: when the company starts a new project the
responsible employee of the project must enter the data in the system. A project is created
with the following data: identification number, description, name of responsible employee,
start date, estimated duration, estimated final date, actual duration (sum of the duration of
the tasks made until now), cost (sum of all tasks costs associated to the project), situation
(0=developing, 1=little delay, <10% more than the estimated time, 2=very delay, >= 10%
more than the estimated time, 3=finished), observations.
The system should distinguish three kinds of user: employee, responsible and manager.
An employee works in a Department. A department in the company can have several
projects on which the employees are working. The types of project are: conceptual
modelling, implementation and consultancy. Employees must daily register their tasks
performed in the projects. These tasks can be classified according to a type of task such as
Requirements Engineering, Conceptual Modeling, Testing, etc.
An employee can be promoted to the function of responsible by the manager. A
responsible will be able to have three active projects simultaneously, and cannot be removed
from his status of responsible while involved in an active project. In general, the
responsibilities of the different types of user are: employee (task maintenance), responsible
(project maintenance, project type maintenance, task type maintenance, user maintenance)
and manager (promote employees, assign responsible to a project, demote responsible, and
access to all other functionality in the system).
The system should communicate with an external interface that will provide the
resources associated to the projects.
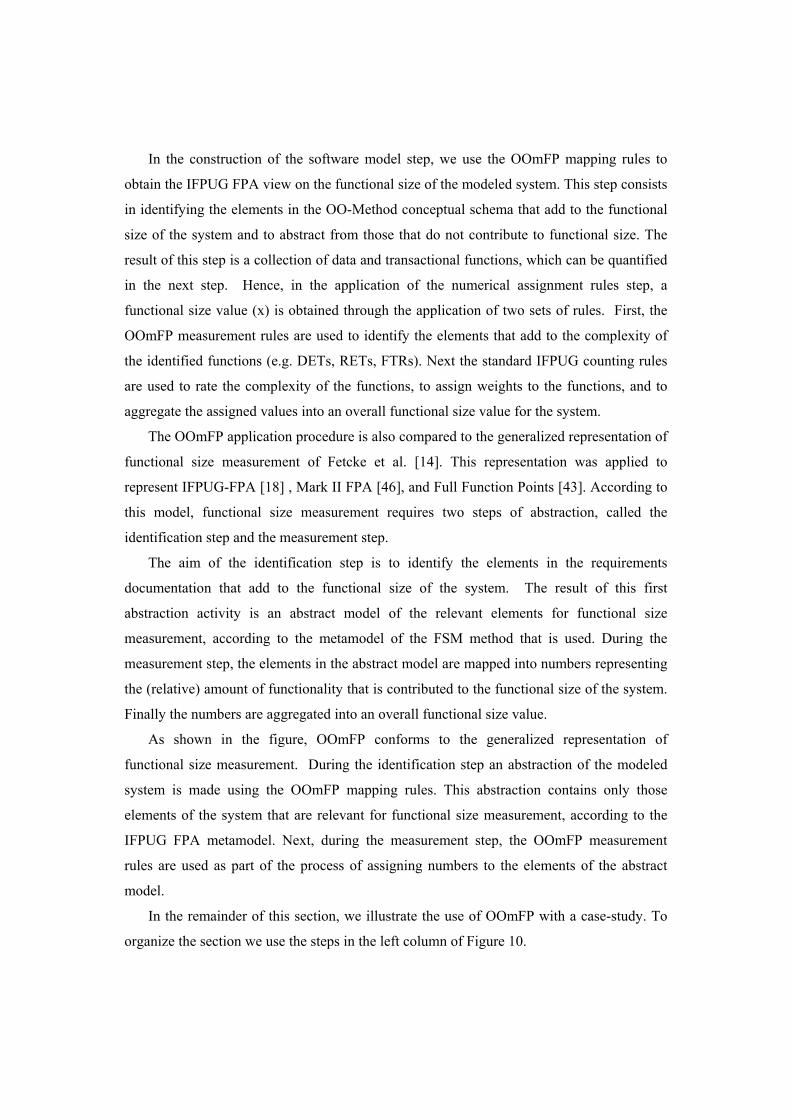
5.1.1 OO-Method Conceptual Schema
Figure 11 shows the Object Model for the PMS system. The dashed lines are agent
relationships that indicate the client/server behavior of the classes and legacy views.
Figure 11. Object Model for the PMS system
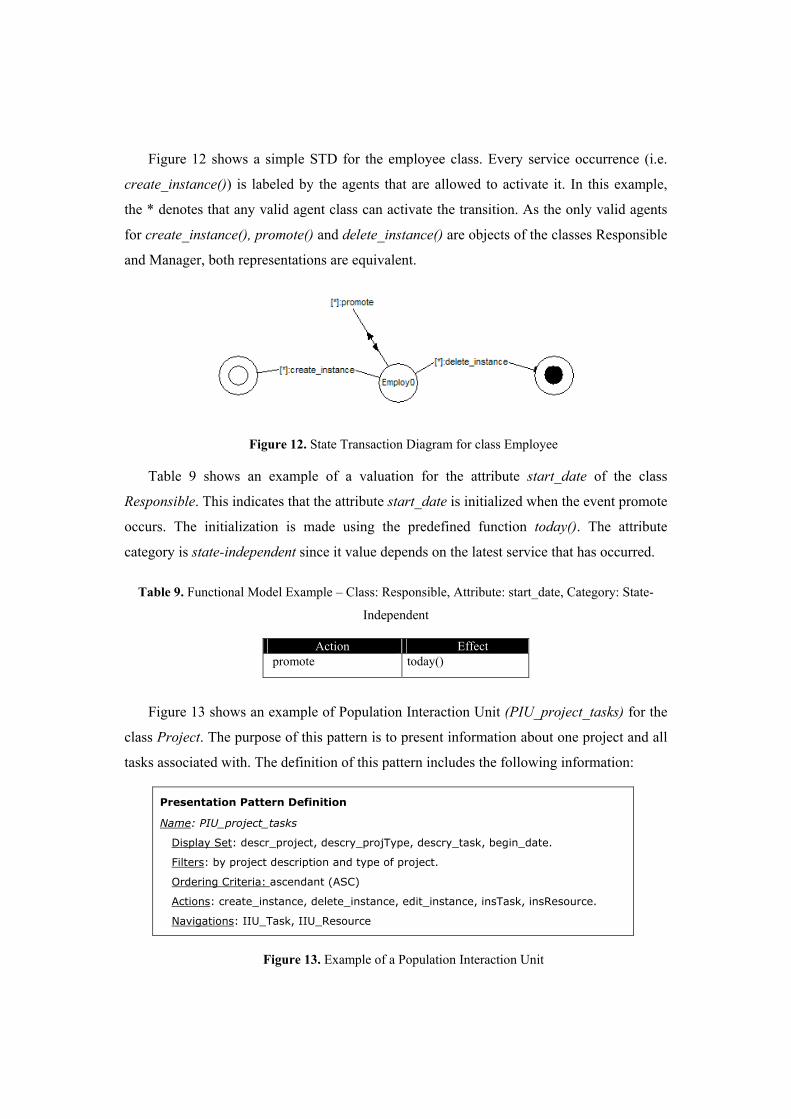
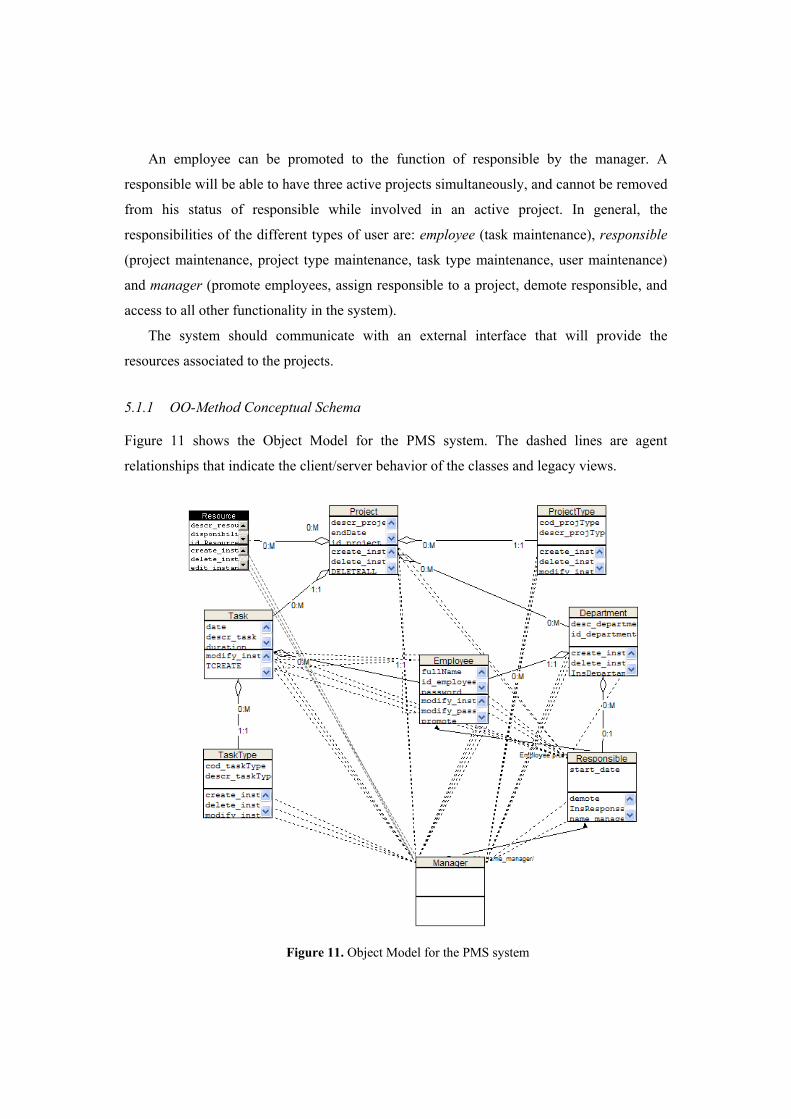
Figure 12 shows a simple STD for the employee class. Every service occurrence (i.e.
create_instance()) is labeled by the agents that are allowed to activate it. In this example,
the * denotes that any valid agent class can activate the transition. As the only valid agents
for create_instance(), promote() and delete_instance() are objects of the classes Responsible
and Manager, both representations are equivalent.
Figure 12. State Transaction Diagram for class Employee
Table 9 shows an example of a valuation for the attribute start_date of the class
Responsible. This indicates that the attribute start_date is initialized when the event promote
occurs. The initialization is made using the predefined function today(). The attribute
category is state-independent since it value depends on the latest service that has occurred.
Table 9. Functional Model Example – Class: Responsible, Attribute: start_date, Category: State-
Independent
Action Effect promote today()
Figure 13 shows an example of Population Interaction Unit (PIU_project_tasks) for the
class Project. The purpose of this pattern is to present information about one project and all
tasks associated with. The definition of this pattern includes the following information:
Presentation Pattern Definition
Name: PIU_project_tasks
Display Set: descr_project, descry_projType, descry_task, begin_date.
Filters: by project description and type of project.
Ordering Criteria: ascendant (ASC)
Actions: create_instance, delete_instance, edit_instance, insTask, insResource.
Navigations: IIU_Task, IIU_Resource
Figure 13. Example of a Population Interaction Unit

5.2 Construction of the Software Model
The software model for the PMS system is built by applying the OOmFP mapping rules
described in section 4.3.2. The measurement scope includes all the information specified in
the four OO-Method conceptual schema views. The system boundary is delineated by
identifying the users and external systems that interact with it. The users of the PMS system
are indicated by the classes Employee, Responsible and Manager since they are client
classes. However, as these classes are also information that will be maintained by the system
being build, they are included as part of functionality of the system. The legacy view
Resource is an external application that interacts with the PMS system.
As previously explained, logical data files can be internal (ILFs) or external (EIFs)
depending on whether they reside inside or outside the system boundary, respectively. For
the PMS system we therefore identify the following candidate data functions:
• ILFs: Project, ProjectType, Task, TaskType, Department, Employee, Responsible,
and Manager.
• EIF: Resource
Table 10 shows the client and server classes in the agent relationships declared in the
Object Model for the PMS system.
Table 10. EIs identification
Client Class Server Class Services Task TCREATE, modify_intance, delete_instance, InsTask* Employee Employee modify_password* Employee create_instance, modify_intance, modify_password Task TCREATE, modify_intance, delete_instance TaskType create_instance, modify_instance, delete_instance Project create_instance, modify_instance, InsDepartment*,
DelDepartment*, InsTask, DELETEALL
Responsible
Department create_instance, delete_instance, modify_instance, InsEmployee*, DelResponsible*
TaskType create_instance, modify_intance, delete_instance Task TCREATE, modify_intance, delete_instance ProjectType create_instance, modify_intance, delete_instance Project InsDepartment*, DelDepartment*, DELETEALL Department create_instance, modify_intance, delete_instance, InsEmployee,
InsResponsible*, DelResponsible*, InsDepartment, DelDepartment Resource create_instance, modify_intance, delete_instance Employee create_instance, modify_instance, modify_password , promote,
DELETEALL
Manager
Responsible demote, name manager, InsResponsible, DelResponsible
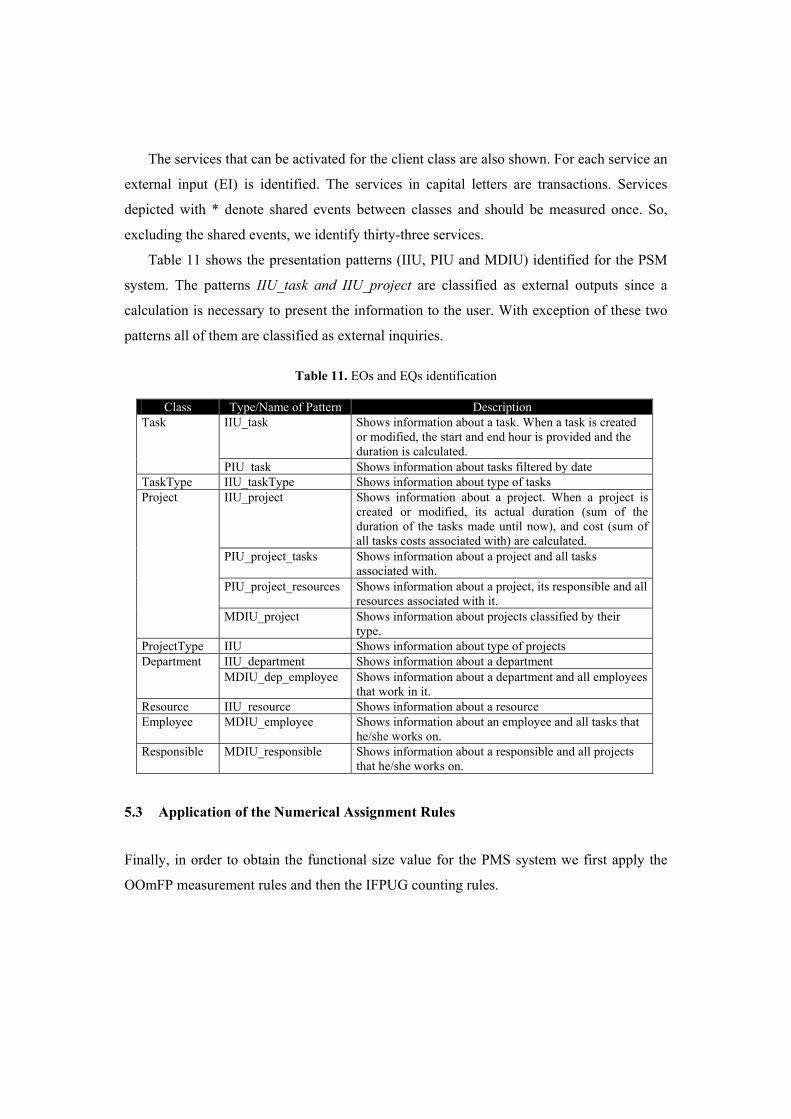
The services that can be activated for the client class are also shown. For each service an
external input (EI) is identified. The services in capital letters are transactions. Services
depicted with * denote shared events between classes and should be measured once. So,
excluding the shared events, we identify thirty-three services.
Table 11 shows the presentation patterns (IIU, PIU and MDIU) identified for the PSM
system. The patterns IIU_task and IIU_project are classified as external outputs since a
calculation is necessary to present the information to the user. With exception of these two
patterns all of them are classified as external inquiries.
Table 11. EOs and EQs identification
5.3 Application of the Numerical Assignment Rules
Finally, in order to obtain the functional size value for the PMS system we first apply the
OOmFP measurement rules and then the IFPUG counting rules.
Class Type/Name of Pattern Description IIU_task Shows information about a task. When a task is created
or modified, the start and end hour is provided and the duration is calculated.
Task
PIU task Shows information about tasks filtered by date TaskType IIU_taskType Shows information about type of tasks
IIU_project Shows information about a project. When a project is created or modified, its actual duration (sum of the duration of the tasks made until now), and cost (sum of all tasks costs associated with) are calculated.
PIU_project_tasks Shows information about a project and all tasks associated with.
PIU_project_resources Shows information about a project, its responsible and all resources associated with it.
Project
MDIU_project Shows information about projects classified by their type.
ProjectType IIU Shows information about type of projects IIU_department Shows information about a department Department MDIU_dep_employee Shows information about a department and all employees
that work in it. Resource IIU_resource Shows information about a resource Employee MDIU_employee Shows information about an employee and all tasks that
he/she works on. Responsible MDIU_responsible Shows information about a responsible and all projects
that he/she works on.
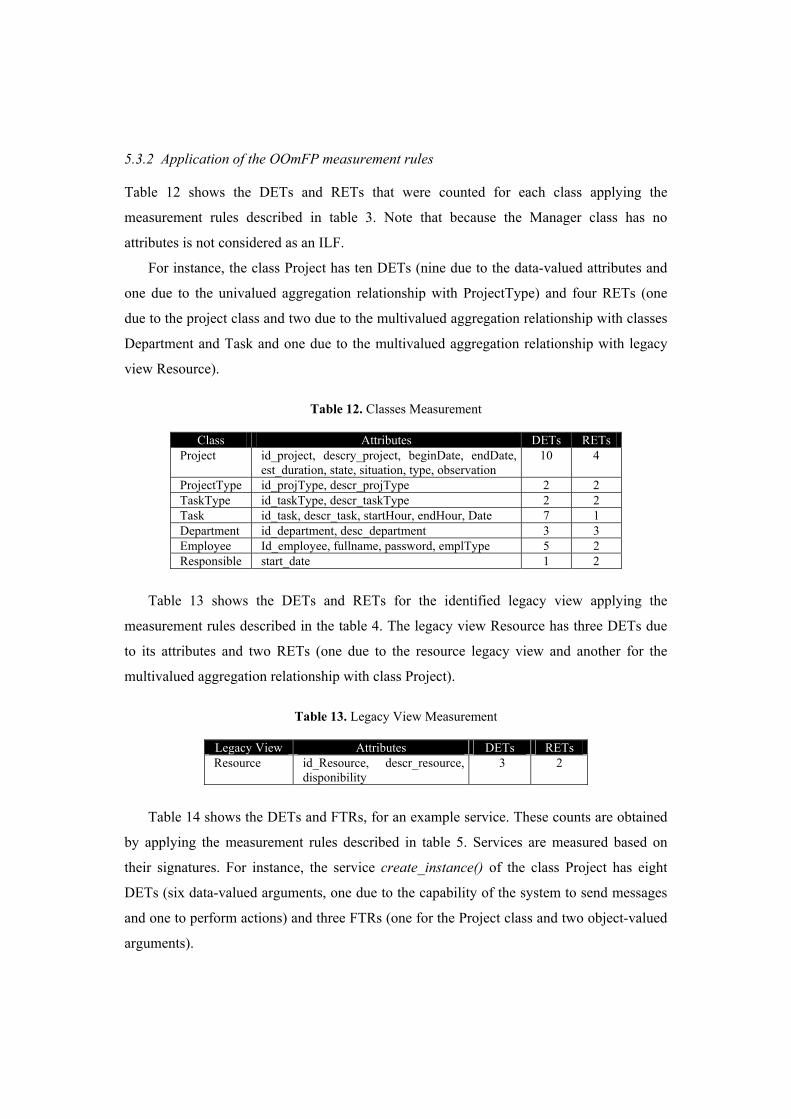
5.3.2 Application of the OOmFP measurement rules
Table 12 shows the DETs and RETs that were counted for each class applying the
measurement rules described in table 3. Note that because the Manager class has no
attributes is not considered as an ILF.
For instance, the class Project has ten DETs (nine due to the data-valued attributes and
one due to the univalued aggregation relationship with ProjectType) and four RETs (one
due to the project class and two due to the multivalued aggregation relationship with classes
Department and Task and one due to the multivalued aggregation relationship with legacy
view Resource).
Table 12. Classes Measurement
Class Attributes DETs RETs Project id_project, descry_project, beginDate, endDate,
est_duration, state, situation, type, observation 10 4
ProjectType id_projType, descr_projType 2 2 TaskType id_taskType, descr_taskType 2 2 Task id_task, descr_task, startHour, endHour, Date 7 1 Department id_department, desc_department 3 3 Employee Id_employee, fullname, password, emplType 5 2 Responsible start_date 1 2
Table 13 shows the DETs and RETs for the identified legacy view applying the
measurement rules described in the table 4. The legacy view Resource has three DETs due
to its attributes and two RETs (one due to the resource legacy view and another for the
multivalued aggregation relationship with class Project).
Table 13. Legacy View Measurement
Legacy View Attributes DETs RETs Resource id_Resource, descr_resource,
disponibility 3 2
Table 14 shows the DETs and FTRs, for an example service. These counts are obtained
by applying the measurement rules described in table 5. Services are measured based on
their signatures. For instance, the service create_instance() of the class Project has eight
DETs (six data-valued arguments, one due to the capability of the system to send messages
and one to perform actions) and three FTRs (one for the Project class and two object-valued
arguments).
Table 14. Example of Service Measurement
Service Signature DETs FTRs create_instance(ov_ProjectType, ov_Resource, dv_descr_project, dv_startDate, dv_endDate, dv_duration, dv_type, dv_observation)
8 3
Table 15 shows the DETs and FTRs for the PIU_project_tasks Population Interaction
Unit (shown in Figure 13) of the class Project. It is obtained applying the measurement rules
described in the table 8.
The pattern PIU_project_tasks of the class Project has fourteen DETs (four attributes in
the display set, two date-valued filter variables, five offered actions, two offered navigations
and one due to the capability of the system to send messages) and 3 FTRs due to three
classes referenced in the display set (Project, ProjectType and Task).
Table 15. Example of a PIU measurement
Pattern Type Pattern name DETs FTRs PIU PIU_project_tasks 14 3
5.3.2 Application of the IFPUG Counting Rules
Once the function elements (DETs, RETs and FTRs) have been identified, IFPUG tables
[17] are used to classify the data and transactional functions as having low, average or high
complexity.
With respect to the data functions (classes and legacy views) shown in tables 12 and 13,
all of them are found to be in the low complexity category. The service create_instance() of
the class Project shown in table 14 has a high complexity. Finally, the presentation pattern
PIU_project_tasks shown in table 15 is found to be of average complexity.
Then, the functional size is obtained by mapping the function types and complexity
ratings into numbers that represents the amount of functionality that these functions
contribute to the functional size of the system. The complexity levels are attributed by
applying the complexity weights described in table 2. Finally, these numbers are aggregated
into an overall functional size value for the OO system.
In order to illustrate this process the amount of functionality is first aggregated into
values for the data and transactional functions. For the PMS system seven classes (ILFs)
having low complexity and one legacy view (EIF) having low complexity are identified.

Applying the weights described in the table 2 the obtained functional size for data functions
is:
54
549=
+=
D
D
OOmFPOOmFP
The detailed measurement for all transactional functions of the PSM system is out of the
scope of this paper, however, we have identified nineteen services (EIs) having low
complexity, eight services having average complexity, and six services having high
complexity. In addition, two presentation patterns that represent EOs (one having low
complexity and another having high complexity) have been identified. Also, eleven
presentation patterns that represent EQs (five having low complexity, five having average
complexity, and one having high complexity) were identified. By applying the weights
described in the table 2 the obtained functional size for data functions is:
1774111125
=++=
T
T
OOmFPOOmFP
Finally, the partial functional sizes obtained for data and transactional functions are
summed to obtain the functional size value of the system. Thus, the functional size obtained
for the PMS system is 231.
6 Evaluation Issues
In software measurement, three types of validation are distinguished [24]: validation of the
design of a measurement method, validation of the application of a measurement method,
and validation of the use of the measurement results. In this section we analyse these types
of validation and discuss their role in the evaluation of OOmFP. We present our evaluation
strategy, the evaluation results obtained so far, as well as the planned work.
6.1 Validation of the Design of OOmFP
The first type of validation relates to the output of the first step in the measurement process
model of Jacquet and Abran [23] (see Figures 1 and 2). The objective is to demonstrate that
the measure that is defined by the measurement method, is measuring the concept it is
purporting to measure [13]. As the criteria that are used to verify this assertion are mostly
derived from theory (in particular from Measurement Theory [41]), this type of validation is
also known as the theoretical validation of a software measure [26]. In a broader context,
theoretical validation is part of the evaluation of the design of the measurement method
[24].
Apart from measure validity, the evaluation pertains to issues such as the definition of a
measurement unit, the preciseness and correctness of the measurement method rules, the
quality of the meta-model, and the soundness of the mathematical operations applied in the
measurement rules (e.g. dimensional analysis) [26].
The proper theoretical validation is performed by verifying whether the measure
satisfies the representation condition of measurement. Basically this means that the
semantics of the measured concept (here functional size) are preserved after the mapping
into numbers. It means, for instance, that a new version of the software system that is
developed as an enhancement of a previous version, should have a functional size value that
is at least as great as that of the previous version. In general, Measurement Theory offers
guidance (in the form of measurement structures and theorems) on how to check measure
validity.
Research on the theoretical validation of functional size measurement methods was
reported in the literature by Fetcke [14], Zuse [50] and Poels [37]. As OOmFP is designed to
conform to IFPUG FPA, its theoretical validity is determined by that of the function point
measure.
A number of studies identified serious drawbacks with the underlying structure of
Function Point Analysis with respect to the prescriptions of Measurement Theory [5], [38]
[26]. Abran and Robillard [5] have investigated the measurement scales used in the process
of counting FPA. They observe that functional size measurement is started with absolute
scales, to transform these into ordinal scales (losing information in this process). This is in
agreement with the findings of Poels [38] who notes that many of the scale transformations
within the FPA process are not allowed according to Measurement Theory. Also,
Kitchenham et al. [26] confirm these findings after applying their framework for
measurement validation to function points. This evidence suggests that since OOmFP
follows the underlying structure of IFPUG-FPA, it inherits all problems related with
function points.
Hence, from a theoretical point of view, the functional size measure defined by OOmFP
cannot be considered a measure according to Measurement Theory. From a pragmatic

standpoint, however, function points can be considered as an indicator of a complex web of
system and project factors having a marked impact on important management variables like
development cost, maintenance effort, productivity, etc. [38]. They have been successfully
applied in a number of application fields and they are considered as a significant
improvement over traditional ‘lines-of-code’-based measurements [29].
Nevertheless, these pragmatic considerations relate to step 4 in Jacquet and Abran’s
measurement process model (see Figure 1) and are therefore no evidence of the validity of
the functional size measure defined by OOmFP (i.e. step 1). As part of a comprehensive
evaluation effort for OOmFP we therefore need to address again the issue of theoretical
validation and the evaluation of the design of OOmFP in general.
In future work we will use a new Measurement Theory-based validation framework,
based on Poels and Dedene’s DISTANCE framework [39]. DISTANCE uses advanced
Measurement Theoretic constructs that are more suitable than the ones usually used in the
process of software measure validation. First results of applying DISTANCE to COSMIC-
FFP, another functional size measurement method, are promising (see [37]), though not
definitive, and can be used as a starting point to validate OOmFP. Apart from the theoretical
validation, we also plan to evaluate other issues related to the design of OOmFP (like the
definition of a measurement unit).
6.2 Validation of the Application of OOmFP
The second type of validation relates to the second and third steps in the measurement
process model of Jacquet and Abran [22] (see Figures 1 and 2). Even when the design of the
measurement method is validated and the theoretical validity of the measure is proven (step
1), there is no guarantee that the rules of the measurement method will always be applied
correctly (step 2). Therefore a verification (or audit) of the measurement result is a
recommended activity during the measurement process (as part of step 3). Such a
measurement audit (i.e. establishing the degree of quality of the data collection) is referred
to as an a posteriori validation by Desharnais and Morris [33]. They distinguish this type of
validation from the a priori validation, which aims at reviewing the procedures of the data
collection process.
Independent of a specific application, evaluating the use of OOmFP in general allows
assessing the degree of confidence in the measurement results and verifies whether the
method satisfies its intended use and the user needs.
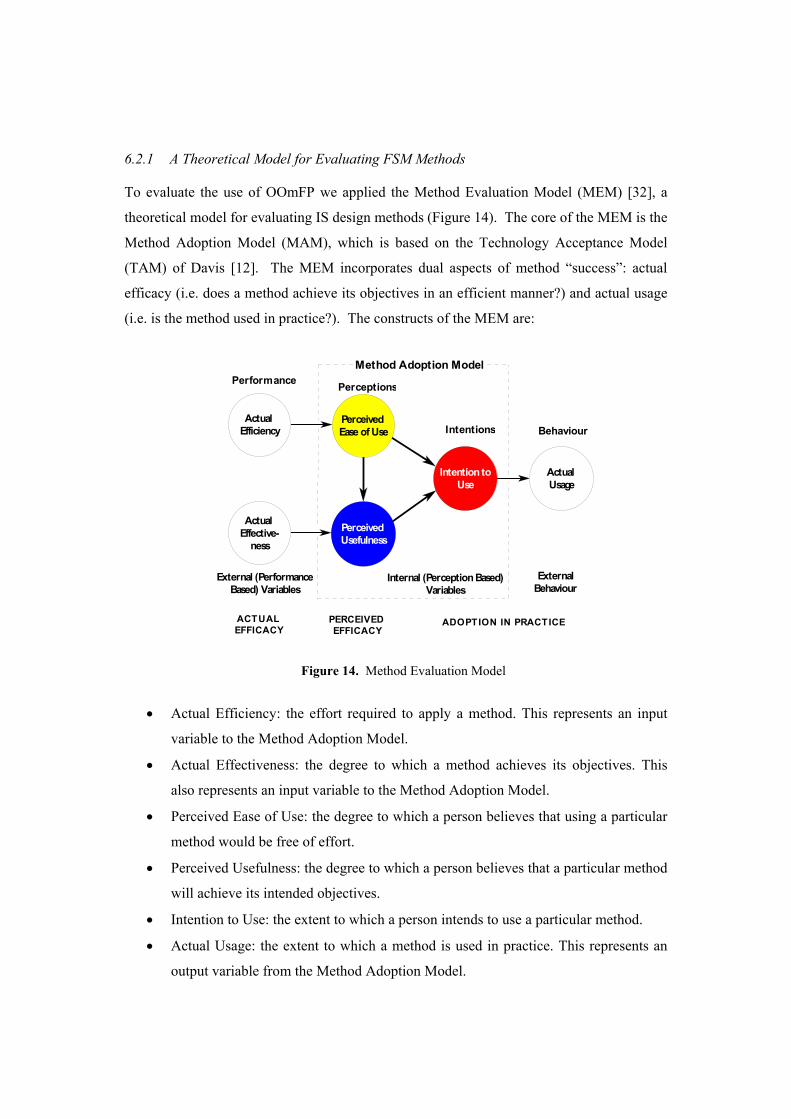
6.2.1 A Theoretical Model for Evaluating FSM Methods
To evaluate the use of OOmFP we applied the Method Evaluation Model (MEM) [32], a
theoretical model for evaluating IS design methods (Figure 14). The core of the MEM is the
Method Adoption Model (MAM), which is based on the Technology Acceptance Model
(TAM) of Davis [12]. The MEM incorporates dual aspects of method “success”: actual
efficacy (i.e. does a method achieve its objectives in an efficient manner?) and actual usage
(i.e. is the method used in practice?). The constructs of the MEM are:
Figure 14. Method Evaluation Model
• Actual Efficiency: the effort required to apply a method. This represents an input
variable to the Method Adoption Model.
• Actual Effectiveness: the degree to which a method achieves its objectives. This
also represents an input variable to the Method Adoption Model.
• Perceived Ease of Use: the degree to which a person believes that using a particular
method would be free of effort.
• Perceived Usefulness: the degree to which a person believes that a particular method
will achieve its intended objectives.
• Intention to Use: the extent to which a person intends to use a particular method.
• Actual Usage: the extent to which a method is used in practice. This represents an
output variable from the Method Adoption Model.
Perceived Ease of Use
Perceived Usefulness
Intention to Use
Actual Efficiency
Actual Effective-
ness
Performance
Actual Usage
External (Performance Based) Variables
Internal (Perception Based) Variables
External Behaviour
Method Adoption Model
Perceptions
Intentions Behaviour
ACTUAL EFFICACY
PERCEIVED EFFICACY
ADOPTION IN PRACTICE

To evaluate OOmFP, the constructs of the MEM must be operationalized for use on
FSM methods. Efficacy is then defined as the efficiency and effectiveness of a FSM method
in measuring the functional size of a system. Evaluation of the efficacy of a FSM method
requires measurement of effort required (inputs) and the quality of the measurement results
(outputs).
6.2.2 Evaluating OOmFP Through a Controlled Experiment
This theoretical evaluation model was applied in a laboratory experiment at the Valencia
University of Technology, using a group of Computer Science students. The students were
trained in OO-Method and were introduced to the principles of both IFPUG FPA and
OOmFP. They also practiced functional size measurement using these FSM methods.
As OOmFP was designed to be both compliant to and improving upon IFPUG FPA,
IFPUG FPA was treated as the benchmark FSM method against which OOmFP could be
evaluated. The basic idea of the experiment was therefore to assess if and how the functional
size measurement of a system is improved if OOmFP is used instead of the (standard)
IFPUG FPA method. Students were required to measure a same system using both methods
and afterwards their measurements were compared.
In terms of the GQM template [10] the goal pursued in the experiment was to analyze
functional size measurements for the purpose of evaluating OOmFP and IFPUG FPA with
respect to their efficacy and likely adoption in practice from the point of view of the
researcher. The context of the experiment is the OO-Method approach to the conceptual
modeling and development of object oriented systems as performed by students in the
Department of Computer Science at the Valencia University of Technology.
The broad research questions addressed by the experiment were:
1) Research Question 1: is the actual efficacy of OOmFP in measuring the functional
size of OO systems higher than that of IFPUG FPA?
a) Efficiency: how efficient is OOmFP compared to IFPUG FPA for sizing object-
oriented systems based on requirements specifications.
b) Effectiveness: how effective is OOmFP compared to IFPUG FPA for sizing
object-oriented systems based on requirements specifications?
Effectiveness is measured using the following criteria defined in ISO/IEC
14143-3 [21]:

i) Reproducibility: does OOmFP produce more consistent measurements of
functional size when used by different people than IFPUG FPA?
ii) Accuracy: does OOmFP produce more accurate measurements of
functional size from requirements specifications than IFPUG FPA?
2) Research Question 2: is the perceived efficacy of OOmFP and the intention to use
OOmFP higher than with IFPUG FPA?
3) Research Question 3: is OOmFP likely to be adopted in practice?
OOmFP and IFPUG FPA were compared using a range of performance-based and
perception-based variables, including efficiency (time required to apply the methods,
hereafter called measurement time), reproducibility, accuracy, perceived ease of use,
perceived usefulness and intention to use.
The reliability of the measurements produced by using a FSM method was assessed
using a practical statistic similar to that proposed by Kemerer [25]. This statistic is a ratio
where the numerator is the difference (in absolute value) between the count produced by a
subject and the average count produced by the other subjects for the same system and the
denominator is this average count. The accuracy of the measurements was measured by
comparing them with a supposedly 'right' functional size measurement that was produced by
a Certified Function Point Specialist (CFPS). The perception-based variables (perceived
ease of use, perceived usefulness and intention to use) were measured using a post-task
survey with 14 closed questions, that was based on similar measurement instruments used
with the MEM and TAM models ([32], [12]).
Figure 11 summarises the main differences found between OOmFP and IFPUG FPA.
The labels on the arrows show the variables on which significant differences were found,
while the arrowheads show the direction in which the difference was found (from superior
to inferior).
Regarding research question 1, OOmFP was less efficient (i.e. more time-consuming)
than IFPUG FPA. However, this problem can be solved by providing tool support to
automate the measurement process. Actually, OOmFP has now been automated in a tool
called Oliva Nova Function Points Counter [44] that obtains automatically the functional
size of OO systems from OO-Method conceptual schemas.

H2: Reproducibility ( p= 0,000 ) H3: Accuracy ( p= 0,000) H4: Perceived Ease of Use ( p= 0,016) H5: Perceived Usefulness ( p= 0,000) H6: Intention to Use ( p= 0,000)
OOmFPIFPUG FPA
H1: Measurement Time (p= 0,0015)
Figure 15. Comparison between methods results
The findings are very significant (α < 0,001) in terms of reproducibility, accuracy,
perceived usefulness and intention to use, and significant (α < 0,05) in terms of perceived
ease of use.9 It should be noted that even if OOmFP is perceived to be more efficacious than
IFPUG-FPA this does not indicate that it is likely to be adopted. Hence, the objective of
Research Question 3 was to evaluate the likely adoption in practice of OOmFP. The results
show that only the hypothesis of perceived ease of use was not confirmed. The statistical
significance was found to be very high (α < 0,001) for the perceived usefulness of OOmFP
as well as the intention to use this method.
Concluding, this experiment directed towards the evaluation of the use of OOmFP,
showed that the obtained measurement results were more consistent and accurate than those
obtained with IFPUG-FPA. Furthermore, OOmFP is perceived to be a useful FSM method
in the context of OO-Method systems development. A complete analysis of these findings
can be found in [2].
6.3 Validation of the Models that Use the Measurement Results
The third type of validation relates to the fourth step in the measurement process model of
Jacquet and Abran [23] (see Figure 1). It assesses the quality (e.g. causality, prediction
accuracy) of the descriptive and predictive models (e.g., productivity analysis models, effort
estimation models, schedule estimation models, budgeting models) that use the
measurement results.
This type of validation was extensively discussed in the literature. Some empirical
studies investigated the ability of a FSM method to produce a size value that can be used for
effort prediction. For instance, Moser et al. [34] present an empirical study using 36 projects
9 Note that the latter result is not supported by the performance-based measurements. So even when OOmFP
took on the average more time than IFPUG FPA, the subjects perceived OOmFP to be easier to use. Probably other factors than measurement time impacted the subjects' perceptions.
that demonstrate that the System Meter method, which explicitly takes reuse into account,
predicts effort substantially better than a model based on function points.
The use of OOmFP measurements in descriptive or predictive models was not the focus
of this paper. Currently, we are working on a web repository project to gather information
about projects that were developed using the OO-Method approach and measured using
OOmFP. Our goal is to build budget and productivity estimation models. As our approach is
applied in a model-based code generation environment, effort and schedule estimation
models are less relevant as the system is obtained in an automatic way.
Another goal of the project is to compare company-specific models with models based
on multi-company data. To do so, an industrial data set maintained by the International
Software Benchmarking Standards Group (ISBSG) [19] will be used.
7 Conclusions
We have presented a functional size measurement method, called OOmFP, for object-
oriented systems based on the information contained in conceptual schemas. This method
enables to quantify the functional size of OO systems in an early stage of the development
lifecycle. Furthermore, OOmFP is compliant to the IFPUG FPA counting rules, which is the
most widely FSM method used in practice and a standard for functional size measurement
approved by the ISO. Although OOmFP is designed to be used in conjunction with OO-
Method, an OO modeling and development method that allows automatic code generation,
many of the modeling primitives in its metamodel can also be found in other object-oriented
analysis methods.
The design of the method and its application procedure were presented using a generic
process model for software measurement proposed by Jacquet and Abran. It was also shown
that OOmFP adheres to Fetcke's generalized representation of functional size measurement
methods that have a data-oriented metamodel. As a proof of concept, the application of our
method was illustrated with a case study.
Furthermore, we discussed the different types of evaluation that could be performed to
validate OOmFP. A controlled experiment was carried out to evaluate the application of the
method. The results show that within the context of an OO-Method development process,
the proposed method produces more consistent and accurate assessments and it is more

likely to be accepted in practice than IFPUG FPA. This is an encouraging result as OOmFP
was developed to facilitate function point counting of OO systems.
OOmFP was adopted and automated by a local company in Spain and is now being
applied to several real-world applications. The experience gained has allowed us to put into
practice this method and to refine the proposed measurement rules. Future work will take
several directions: the investigation of the theoretical validation of OOmFP, the definition of
a measurement unit, and the construction of predictive models.
Acknowledgments
We would like to thank CARE Technologies for supporting the research project. This work
was partly funded by the Spanish National Agency, MCYT Project under grant TIC2001-
3530-C02-01.
References
1. Abrahão, S. and Pastor, O., Estimating the Applications Functional Size from Object-Oriented Conceptual Models. in International Function Points Users Group Annual Conference (IFPUG'01), Las Vegas, USA, 2001.
2. Abrahão, S., Poels, G. and Pastor, O. Comparative Evaluation of Functional Size Measurement Methods: An Experimental Analysis, Working Paper, Faculty of Economics and Business Administration, Ghent University, Belgium, 2004, 43 p.
3. Abran, A., Desharnais, J.M., Oligny, S., St.Pierre, D. and Symons, C. COSMIC-FFP Measurement Manual, Version 2.1, The Common Software Measurement International Consortium, May 2001.
4. Abran, A. and Jacquet, J.P., A Structured Analysis of the new ISO Standard on Functional Size Measurement - Definition of Concepts. in 4th IEEE Int. Symposium and Forum on Software Engineering Standards, 1999, 230-241.
5. Abran, A. and Robillard, P.N. Function Points: A Study of Their Measurement Processes and Scale Transformations. Journal of Systems and Software, 25, 1994, 171-184.
6. Albrecht, A.J., Measuring application development productivity. in IBM Application Development Symposium, 1979, 83-92.
7. ANSI/IEEE. Standard 830-1998, IEEE Recommended Practice for Software Requirements Specifications, The Institute of Electrical and Electronics Engineers, Ed., New York, NY: IEEE Computer Society Press, 1998.
8. Antoniol, G. and Calzolari, F., Adapting Function Points to Object Oriented Information Systems. in 10 th Conference on Advanced Information Systems Engineering (CAiSE'98), 1998.
9. ASMA. Sizing in Object-Oriented Environments, Australian Software Metrics Association (ASMA), Victoria, Australia, 1994.
10. Basili, V.R. and Rombach, H.D. The TAME Project: Towards Improvement-Oriented Software Environments. IEEE Transactions on Software Engineering, 14 (6), 1988, 758-773.
11. Booch, G., Rumbaugh, J. and Jacobson, I. The Unified Modeling Language Users Guide. Addison-Wesley, 1999.
12. Davis, F.D. Perceived Usefulness, Perceived Ease of Use and User Acceptance of Information Technology. MIS Quarterly, 3 (3), 1989.
13. Fenton, N. Software Metrics: A Rigorous Approach, 1991.
14. Fetcke, T., Abran, A. and Dumke, R., A Generalized Representation for Selected Functional Size Measurement Methods. in 11th International Workshop on Software Measurement, Montréal, Canada, 2001, Shaker Verlag, 1-25.
15. Fetcke, T., Abran, A. and Nguyen, T.H., Function point analysis for the OO-Jacobson method: a mapping approach. in FESMA'98, Antwerp, Belgium, 1998, 395-410.
16. Gupta, R. and Gupta, S.K., Object Point Analysis. in IFPUG 1996 Fall Conference, Dallas, Texas, USA, 1996.
17. IFPUG. Function Point Counting Practices Manual, Release 4.1, International Function Point Users Group, Westerville, Ohio, USA, 1999.
18. IFPUG. Function Point Counting Practices: Case Study 3 - Object-Oriented Analysis, Object Oriented Design (Draft), 1995.
19. ISBSG. International Software Benchmarking Standards Group, http://www.isbsg.org. 20. ISO. ISO/IEC 14143-1- Information Technology - Software measurement - Functional Size
Measurement. Part 1: Definition of Concepts, 1998. 21. ISO. ISO/IEC 14143-3 - Information technology -- Software measurement -- Functional size
measurement -- Part 3: Verification of functional size measurement methods, 2003. 22. Jacobson, I., Christerson, M., Jonsson, P. and Overgaard, G. Object-Oriented Software Engineering: A
Use--Case Driven Approach. Addison Wesley Longman, Inc., 1992. 23. Jacquet, J.P. and Abran, A., From Software Metrics to Software Measurement Methods: A Process
Model. in 3rd Int. Standard Symposium and Forum on Software Engineering Standards (ISESS'97), Walnut Creek, USA, 1997.
24. Jacquet, J.P. and Abran, A., Metrics Validation Proposals: A Structured Analysis. in 8th International Workshop on Software Measurement, Magdeburg, Germany, 1998.
25. Kemerer, C.F. Reliability of Function Points Measurement. Communications of the ACM, 36 (2), 1993, 85-97.
26. Kitchenham, B., Pfleeger, S. and Fenton, N. Towards a Framework for Software Measurement Validation. IEEE Transactions on Software Engineering, 21, 1995, 929-943.
27. Laranjeira, L. Software Size Estimation of Object-Oriented Systems. IEEE Transactions on Software Engineering, 16 (5), 1990, 510-522.
28. Lehne, O.A., Experience Report: Function Points Counting of Object Oriented Analysis and Design based on the OOram method. in Conference on Object-Oriented Programming Systems, Languages, and Applications (OOPSLA'97), 1997.
29. Matson, J.E., Barret, B.E. and Mellichamp, J.M. Software Development Cost Estimation Using Function Points. IEEE Transactions on Software Engineering, 20 (4), 1994, 275-287.
30. Minkiewicz, F. Measuring Object Oriented Software with Predictive Object Points. in Rob Kusters, A.C., Fred Heemstra and Erik van Veenendaal ed. Project Control for Software Quality, Shaker Publishing, 1999.
31. Molina, P.J. User Interface Specification: From Requirements to Code Generation, PhD. Thesis Departament of Information Systems and Computation, Valencia University of Technology, 2003.
32. Moody, D.L. Dealing with Complexity: A Practical Method for Representing Large Entity Relationship Models Department of Information Systems, University of Melbourne, Melbourne, Australia, 2001, 354p.
33. Morris, P. and Desharnais, J.M., Function Point Analysis. Validating the Results. in IFPUG Spring Conference, Atlanta, USA, 1996.
34. Moser, S., Henderson-Sellers, B. and Misic, V.B. Cost Estimation Based on Business Models. Journal of Systems and Software, 49, 1999, 33-42.
35. Pastor, O., Abrahão, S.M., Molina, J.C. and Torres, I., A FPA-like Measure for Object-Oriented Systems from Conceptual Models. in 11th International Workshop on Software Measurement (IWSM'01), Montréal, Canada, 2001, Shaker Verlag, 51-69.
36. Pastor, O., Gómez, J., Insfrán, E. and Pelechano, V. The OO-Method Approach for Information Systems Modelling: From Object-Oriented Conceptual Modeling to Automated Programming. Information Systems, 26 (7), 2001, 507-534.
37. Poels, G., Definition and Validation of a COSMIC-FFP Functional Size Measure for Object-Oriented Systems. in 7th ECOOP Workshop on Quantitative Approaches in Object-Oriented Software Engineering (QAOOSE 2003), Darmstadt, Germany, 2003.
38. Poels, G. Why Function Points Do Not Work: In Search of New Software Measurement Strategies. Guide Share Europe Journal, 1 (2), 1996, 9-26.
39. Poels, G. and Dedene, G. Distance-based software measurement: necessary and sufficient properties for software measures. Information and Software Technology, 42, 2000, 35-46.
40. Rains, E. Function Points in an ADA Object-Oriented Design. OOPS Messenger, 2 (4), 1991, 23-25.
41. Roberts, F.S. Measurement Theory with Applications to Decisionmaking, Ttility, and the Social Sciences. Reading, Mass, Addison-Wesley, 1979.
42. Sneed, H.M., Estimating the Development Costs of Object-Oriented Software. in 7th European Software Control and Metrics Conference, Wilmslow, UK, 1996, 135-152.
43. St.Pierre, D., Maya, M., Abran, A., Desharnais, J.M. and Bourque, P. Full Function Points: Counting Practices Manual., Software Engineering Management Research Laboratory and Software Engineering Laboratory in Applied Metrics, 1997.
44. Torres, I. and Calatrava, F. Function Points Counting on Conceptual Models, Whitepaper, CARE Technologies, http://www.care-t.com/html/whitepapers.html, 2003.
45. Uemura, T., Kusumoto, S. and Inoue, K., Function Point Measurement Tool for UML Design Specification. in 5th International Software Metrics Symposium (METRICS'99), Florida, USA, 1999, 62-69.
46. UKSMA. MK II Function Point Analysis Counting Practices Manual, Version 1.3.1, United Kingdom Software Metrics Association, September 1998.
47. Whitmire, S.A., 3D Function Points: Specific and Real-Time Extensions of Function Points. in Pacific Northwest Software Quality Conferene, 1992.
48. Whitmire, S.A. Applying Function Points to Object-Oriented Software Models. in Keyes, J. ed. Software Engineering Productivity Handbook, McGraw-Hill, 1992, 229-244.
49. Zhao, H. and Stockman, T., Software Sizing for OO software development - Object Function Point Analysis. in GSE Conference, Berlin, Germany, 1995.
50. Zuse, H. A Framework for Software Measurement. Walter de Gruyter, Berlin, Germany, 1998.
FACULTEIT ECONOMIE EN BEDRIJFSKUNDE HOVENIERSBERG 24 9000 GENT Tel. : 32 - (0)9 – 264.34.61 Fax. : 32 - (0)9 – 264.35.92
WORKING PAPER SERIES 9 02/159 M. VANHOUCKE, Optimal due date assignment in project scheduling, December 2002, 18 p. 02/160 J. ANNAERT, M.J.K. DE CEUSTER, W. VANHYFTE, The Value of Asset Allocation Advice. Evidence from the
Economist’s Quarterly Portfolio Poll, December 2002, 35p. (revised version forthcoming in Journal of Banking and Finance, 2004)
02/161 M. GEUENS, P. DE PELSMACKER, Developing a Short Affect Intensity Scale, December 2002, 20 p. (published in
Psychological Reports, 2002). 02/162 P. DE PELSMACKER, M. GEUENS, P. ANCKAERT, Media context and advertising effectiveness: The role of
context appreciation and context-ad similarity, December 2002, 23 p. (published in Journal of Advertising, 2002). 03/163 M. GEUENS, D. VANTOMME, G. GOESSAERT, B. WEIJTERS, Assessing the impact of offline URL advertising,
January 2003, 20 p. 03/164 D. VAN DEN POEL, B. LARIVIÈRE, Customer Attrition Analysis For Financial Services Using Proportional Hazard
Models, January 2003, 39 p. (forthcoming in European Journal of Operational Research, 2003) 03/165 P. DE PELSMACKER, L. DRIESEN, G. RAYP, Are fair trade labels good business ? Ethics and coffee buying
intentions, January 2003, 20 p. 03/166 D. VANDAELE, P. GEMMEL, Service Level Agreements – Een literatuuroverzicht, Januari 2003, 31 p. (published
in Tijdschrift voor Economie en Management, 2003).
03/167 P. VAN KENHOVE, K. DE WULF AND S. STEENHAUT, The relationship between consumers’ unethical behavior and customer loyalty in a retail environment, February 2003, 27 p. (published in Journal of Business Ethics, 2003).
03/168 P. VAN KENHOVE, K. DE WULF, D. VAN DEN POEL, Does attitudinal commitment to stores always lead to behavioural loyalty? The moderating effect of age, February 2003, 20 p.
03/169 E. VERHOFSTADT, E. OMEY, The impact of education on job satisfaction in the first job, March 2003, 16 p.
03/170 S. DOBBELAERE, Ownership, Firm Size and Rent Sharing in a Transition Country, March 2003, 26 p. (forthcoming in Labour Economics, 2004)
03/171 S. DOBBELAERE, Joint Estimation of Price-Cost Margins and Union Bargaining Power for Belgian Manufacturing,
March 2003, 29 p. 03/172 M. DUMONT, G. RAYP, P. WILLEMÉ, O. THAS, Correcting Standard Errors in Two-Stage Estimation Procedures
with Generated Regressands, April 2003, 12 p. 03/173 L. POZZI, Imperfect information and the excess sensitivity of private consumption to government expenditures,
April 2003, 25 p. 03/174 F. HEYLEN, A. SCHOLLAERT, G. EVERAERT, L. POZZI, Inflation and human capital formation: theory and panel
data evidence, April 2003, 24 p. 03/175 N.A. DENTCHEV, A. HEENE, Reputation management: Sending the right signal to the right stakeholder, April
2003, 26 p. 03/176 A. WILLEM, M. BUELENS, Making competencies cross business unit boundaries: the interplay between inter-unit
coordination, trust and knowledge transferability, April 2003, 37 p. 03/177 K. SCHOORS, K. SONIN, Passive creditors, May 2003, 33 p. 03/178 W. BUCKINX, D. VAN DEN POEL, Customer Base Analysis: Partial Defection of Behaviorally-Loyal Clients in a
Non-Contractual FMCG Retail Setting, May 2003, 26 p. (forthcoming in European Journal of Operational Research)
FACULTEIT ECONOMIE EN BEDRIJFSKUNDE HOVENIERSBERG 24 9000 GENT Tel. : 32 - (0)9 – 264.34.61 Fax. : 32 - (0)9 – 264.35.92
WORKING PAPER SERIES 10 03/179 H. OOGHE, T. DE LANGHE, J. CAMERLYNCK, Profile of multiple versus single acquirers and their targets : a
research note, June 2003, 15 p. 03/180 M. NEYT, J. ALBRECHT, B. CLARYSSE, V. COCQUYT, The Cost-Effectiveness of Herceptin® in a Standard Cost
Model for Breast-Cancer Treatment in a Belgian University Hospital, June 2003, 20 p. 03/181 M. VANHOUCKE, New computational results for the discrete time/cost trade-off problem with time-switch
constraints, June 2003, 24 p. 03/182 C. SCHLUTER, D. VAN DE GAER, Mobility as distributional difference, June 2003, 22 p. 03/183 B. MERLEVEDE, Reform Reversals and Output Growth in Transition Economies, June 2003, 35 p. (published in
Economics of Transition, 2003) 03/184 G. POELS, Functional Size Measurement of Multi-Layer Object-Oriented Conceptual Models, June 2003, 13 p.
(published as ‘Object-oriented information systems’ in Lecture Notes in Computer Science, 2003) 03/185 A. VEREECKE, M. STEVENS, E. PANDELAERE, D. DESCHOOLMEESTER, A classification of programmes and
its managerial impact, June 2003, 11 p. (forthcoming in International Journal of Operations and Production Management, 2003)
03/186 S. STEENHAUT, P. VANKENHOVE, Consumers’ Reactions to “Receiving Too Much Change at the Checkout”,
July 2003, 28 p. 03/187 H. OOGHE, N. WAEYAERT, Oorzaken van faling en falingspaden: Literatuuroverzicht en conceptueel verklarings-
model, July 2003, 35 p. 03/188 S. SCHILLER, I. DE BEELDE, Disclosure of improvement activities related to tangible assets, August 2003, 21 p. 03/189 L. BAELE, Volatility Spillover Effects in European Equity Markets, August 2003, 73 p. 03/190 A. SCHOLLAERT, D. VAN DE GAER, Trust, Primary Commodity Dependence and Segregation, August 2003, 18 p 03/191 D. VAN DEN POEL, Predicting Mail-Order Repeat Buying: Which Variables Matter?, August 2003, 25 p.
(published in Tijdschrift voor Economie en Management, 2003) 03/192 T. VERBEKE, M. DE CLERCQ, The income-environment relationship: Does a logit model offer an alternative
empirical strategy?, September 2003, 32 p. 03/193 S. HERMANNS, H. OOGHE, E. VAN LAERE, C. VAN WYMEERSCH, Het type controleverslag: resultaten van een
empirisch onderzoek in België, September 2003, 18 p. 03/194 A. DE VOS, D. BUYENS, R. SCHALK, Psychological Contract Development during Organizational Socialization:
Adaptation to Reality and the Role of Reciprocity, September 2003, 42 p. (published in Journal of Organizational Behavior, 2003).
03/195 W. BUCKINX, D. VAN DEN POEL, Predicting Online Purchasing Behavior, September 2003, 43 p.
(forthcoming in European Journal of Operational Research, 2004) 03/196 N.A. DENTCHEV, A. HEENE, Toward stakeholder responsibility and stakeholder motivation: Systemic and holistic
perspectives on corporate sustainability, September 2003, 37 p. 03/197 D. HEYMAN, M. DELOOF, H. OOGHE, The Debt-Maturity Structure of Small Firms in a Creditor-Oriented
Environment, September 2003, 22 p. 03/198 A. HEIRMAN, B. CLARYSSE, V. VAN DEN HAUTE, How and Why Do Firms Differ at Start-Up? A Resource-
Based Configurational Perspective, September 2003, 43 p.

FACULTEIT ECONOMIE EN BEDRIJFSKUNDE HOVENIERSBERG 24 9000 GENT Tel. : 32 - (0)9 – 264.34.61 Fax. : 32 - (0)9 – 264.35.92
WORKING PAPER SERIES 11 03/199 M. GENERO, G. POELS, M. PIATTINI, Defining and Validating Metrics for Assessing the Maintainability of Entity-
Relationship Diagrams, October 2003, 61 p. 03/200 V. DECOENE, W. BRUGGEMAN, Strategic alignment of manufacturing processes in a Balanced Scorecard-based
compensation plan: a theory illustration case, October 2003, 22 p. 03/201 W. BUCKINX, E. MOONS, D. VAN DEN POEL, G. WETS, Customer-Adapted Coupon Targeting Using Feature
Selection, November 2003, 31 p. (forthcoming in Expert Systems with Applications). 03/202 D. VAN DEN POEL, J. DE SCHAMPHELAERE, G. WETS, Direct and Indirect Effects of Retail Promotions,
November 2003, 21 p. (forthcoming in Expert Systems with Applications). 03/203 S. CLAEYS, R. VANDER VENNET, Determinants of bank interest margins in Central and Eastern Europe.
Convergence to the West?, November 2003, 28 p. 03/204 M. BRENGMAN, M. GEUENS, The four dimensional impact of color on shoppers’ emotions, December 2003, 15 p.
(forthcoming in Advances in Consumer Research, 2004)
03/205 M. BRENGMAN, M. GEUENS, B. WEIJTERS, S.C. SMITH, W.R. SWINYARD, Segmenting Internet shoppers based on their web-usage-related lifestyle: a cross-cultural validation, December 2003, 15 p. (forthcoming in Journal of Business Research, 2004)
03/206 M. GEUENS, D. VANTOMME, M. BRENGMAN, Developing a typology of airport shoppers, December 2003, 13 p.
(forthcoming in Tourism Management, 2004) 03/207 J. CHRISTIAENS, C. VANHEE, Capital Assets in Governmental Accounting Reforms, December 2003, 25 p. 03/208 T. VERBEKE, M. DE CLERCQ, Environmental policy uncertainty, policy coordination and relocation decisions,
December 2003, 32 p. 03/209 A. DE VOS, D. BUYENS, R. SCHALK, Making Sense of a New Employment Relationship: Psychological Contract-
Related Information Seeking and the Role of Work Values and Locus of Control, December 2003, 32 p. 03/210 K. DEWETTINCK, J. SINGH, D. BUYENS, Psychological Empowerment in the Workplace: Reviewing the
Empowerment Effects on Critical Work Outcomes, December 2003, 24 p. 03/211 M. DAKHLI, D. DE CLERCQ, Human Capital, Social Capital and Innovation: A Multi-Country Study, November
2003, 32 p. (forthcoming in Entrepreneurship and Regional Development, 2004). 03/212 D. DE CLERCQ, H.J. SAPIENZA, H. CRIJNS, The Internationalization of Small and Medium-Sized Firms: The
Role of Organizational Learning Effort and Entrepreneurial Orientation, November 2003, 22 p (forthcoming in Small Business Economics, 2004).
03/213 A. PRINZIE, D. VAN DEN POEL, Investigating Purchasing Patterns for Financial Services using Markov, MTD and
MTDg Models, December 2003, 40 p. 03/214 J.-J. JONKER, N. PIERSMA, D. VAN DEN POEL, Joint Optimization of Customer Segmentation and Marketing
Policy to Maximize Long-Term Profitability, December 2003, 20 p. 04/215 D. VERHAEST, E. OMEY, The impact of overeducation and its measurement, January 2004, 26 p. 04/216 D. VERHAEST, E. OMEY, What determines measured overeducation?, January 2004, 31 p. 04/217 L. BAELE, R. VANDER VENNET, A. VAN LANDSCHOOT, Bank Risk Strategies and Cyclical Variation in Bank
Stock Returns, January 2004, 47 p. 04/218 B. MERLEVEDE, T. VERBEKE, M. DE CLERCQ, The EKC for SO2: does firm size matter?, January 2004, 25 p.

FACULTEIT ECONOMIE EN BEDRIJFSKUNDE HOVENIERSBERG 24 9000 GENT Tel. : 32 - (0)9 – 264.34.61 Fax. : 32 - (0)9 – 264.35.92
WORKING PAPER SERIES 12 04/219 G. POELS, A. MAES, F. GAILLY, R. PAEMELEIRE, The Pragmatic Quality of Resources-Events-Agents Diagrams:
an Experimental Evaluation, January 2004, 23 p. 04/220 J. CHRISTIAENS, Gemeentelijke financiering van het deeltijds kunstonderwijs in Vlaanderen, Februari 2004, 27 p.
04/221 C.BEUSELINCK, M. DELOOF, S. MANIGART, Venture Capital, Private Equity and Earnings Quality, February
2004, 42 p. 04/222 D. DE CLERCQ, H.J. SAPIENZA, When do venture capital firms learn from their portfolio companies?, February
2004, 26 p. 04/223 B. LARIVIERE, D. VAN DEN POEL, Investigating the role of product features in preventing customer churn, by
using survival analysis and choice modeling: The case of financial services, February 2004, 24p. 04/224 D. VANTOMME, M. GEUENS, J. DE HOUWER, P. DE PELSMACKER, Implicit Attitudes Toward Green Consumer
Behavior, February 2004, 33 p. 04/225 R. I. LUTTENS, D. VAN DE GAER, Lorenz dominance and non-welfaristic redistribution, February 2004, 23 p. 04/226 S. MANIGART, A. LOCKETT, M. MEULEMAN et al., Why Do Venture Capital Companies Syndicate?, February
2004, 33 p. 04/227 A. DE VOS, D. BUYENS, Information seeking about the psychological contract: The impact on newcomers’
evaluations of their employment relationship, February 2004, 28 p. 04/228 B. CLARYSSE, M. WRIGHT, A. LOCKETT, E. VAN DE VELDE, A. VOHORA, Spinning Out New Ventures: A
Typology Of Incubation Strategies From European Research Institutions, February 2004, 54 p. 04/229 S. DE MAN, D. VANDAELE, P. GEMMEL, The waiting experience and consumer perception of service quality in
outpatient clinics, February 2004, 32 p. 04/230 N. GOBBIN, G. RAYP, Inequality and Growth: Does Time Change Anything?, February 2004, 32 p. 04/231 G. PEERSMAN, L. POZZI, Determinants of consumption smoothing, February 2004, 24 p. 04/232 G. VERSTRAETEN, D. VAN DEN POEL, The Impact of Sample Bias on Consumer Credit Scoring Performance
and Profitability, March 2004, 24 p. 04/233 S. ABRAHAO, G. POELS, O. PASTOR, Functional Size Measurement Method for Object-Oriented Conceptual
Schemas: Design and Evaluation Issues, March 2004, 43 p. 04/234 S. ABRAHAO, G. POELS, O. PASTOR, Comparative Evaluation of Functional Size Measurement Methods: An
Experimental Analysis, March 2004, 45 p.