A framework for analysing the usage of mobile services
15
A framework for analysing the usage of mobile services Timo Smura, Antero Kivi and Juuso To ¨yli Abstract Purpose – Collecting and analysing data on mobile service usage is increasingly complex as usage diverges between different types of devices and networks. The purpose of this paper is to suggest and apply a holistic framework that helps in designing mobile service usage research as well as in communicating, positioning, and comparing research results. Design/methodology/approach – The framework was constructed based on longitudinal and cross-sectional mobile service usage measurements carried out in Finland annually in 2005-2008, covering 80-90 percent of all mobile users and service usage. Broad use of multiple data collection methods and measurement points enabled data and method triangulation, as well as analysis and comparison of their scopes and limitations. Findings – The paper suggests a holistic framework for analysing mobile services, relying on service science approach. For measurements and analysis, mobile services are decomposed into four technical components: devices, applications, networks, and content. The paper further presents classifications for each component and discusses their relationships with possible measurement points. The framework is applied to mobile browsing usage studies. Research limitations/implications – Future work includes adding an actors dimension to the framework in order to analyse their roles in the value networks providing mobile services. Extending the framework to Internet services more generally is also possible. Originality/value – The paper presents an original, broadly applicable framework for designing mobile service usage research, and communicating, positioning, and comparing research results. The framework helps academics and practitioners to design and to recognise the limitations of mobile service usage studies, and to avoid misinterpretations based on insufficient data. Keywords Mobile communications systems, Internet, Finland Paper type Research paper 1. Introduction The internet is of growing importance for businesses, enabling a virtual supply chain for marketing and delivering products and services, as well as in facilitating the production of digital services and content. Using internet as a distribution and marketing channel is widely expected to increase companies’ performance (Geyskens et al., 2002) as well as consumer surplus (Brynjolfsson et al., 2003) and it is increasingly important for competitiveness in most industries and markets today. Advances in mobile technologies are promising further benefits by decreasing the spatial and temporal constraints of service provisioning and use (Balasubramanian et al., 2002). In most developed countries, mobile phones have become an inseparable part of everyday life and a majority of people carry them all the time. In addition to complementing and expanding the use of various internet-based services, the evolution of mobile devices also enables entirely new types of services to be introduced, utilising, e.g. location and context-specific information and higher degree of personalization of the devices. Furthermore, aside from their role as a channel to services, mobile devices are also DOI 10.1108/14636690910970973 VOL. 11 NO. 4 2009, pp. 53-67, Q Emerald Group Publishing Limited, ISSN 1463-6697 j info j PAGE 53 Timo Smura and Antero Kivi are both Research Scientists based at TKK Helsinki University of Technology, Espoo, Finland. Juuso To ¨yli is a Professor based at the Turku School of Economics, Turku, Finland. Received 2 October 2008 Revised 6 March 2009 Accepted 10 March 2009
-
Upload
khangminh22 -
Category
Documents
-
view
1 -
download
0
Transcript of A framework for analysing the usage of mobile services

A framework for analysing the usage ofmobile services
Timo Smura, Antero Kivi and Juuso Toyli
Abstract
Purpose – Collecting and analysing data on mobile service usage is increasingly complex as usagediverges between different types of devices and networks. The purpose of this paper is to suggest andapply a holistic framework that helps in designing mobile service usage research as well as incommunicating, positioning, and comparing research results.
Design/methodology/approach – The framework was constructed based on longitudinal andcross-sectional mobile service usage measurements carried out in Finland annually in 2005-2008,covering 80-90 percent of all mobile users and service usage. Broad use of multiple data collectionmethods and measurement points enabled data and method triangulation, as well as analysis andcomparison of their scopes and limitations.
Findings – The paper suggests a holistic framework for analysing mobile services, relying on servicescience approach. For measurements and analysis, mobile services are decomposed into fourtechnical components: devices, applications, networks, and content. The paper further presentsclassifications for each component and discusses their relationships with possible measurement points.The framework is applied to mobile browsing usage studies.
Research limitations/implications – Future work includes adding an actors dimension to theframework in order to analyse their roles in the value networks providing mobile services. Extending theframework to Internet services more generally is also possible.
Originality/value – The paper presents an original, broadly applicable framework for designing mobileservice usage research, and communicating, positioning, and comparing research results. Theframework helps academics and practitioners to design and to recognise the limitations of mobileservice usage studies, and to avoid misinterpretations based on insufficient data.
Keywords Mobile communications systems, Internet, Finland
Paper type Research paper
1. Introduction
The internet is of growing importance for businesses, enabling a virtual supply chain for
marketing and delivering products and services, as well as in facilitating the production of
digital services and content. Using internet as a distribution and marketing channel is widely
expected to increase companies’ performance (Geyskens et al., 2002) as well as consumer
surplus (Brynjolfsson et al., 2003) and it is increasingly important for competitiveness in most
industries and markets today. Advances in mobile technologies are promising further
benefits by decreasing the spatial and temporal constraints of service provisioning and use
(Balasubramanian et al., 2002).
In most developed countries, mobile phones have become an inseparable part of everyday
life and a majority of people carry them all the time. In addition to complementing and
expanding the use of various internet-based services, the evolution of mobile devices also
enables entirely new types of services to be introduced, utilising, e.g. location and
context-specific information and higher degree of personalization of the devices.
Furthermore, aside from their role as a channel to services, mobile devices are also
DOI 10.1108/14636690910970973 VOL. 11 NO. 4 2009, pp. 53-67, Q Emerald Group Publishing Limited, ISSN 1463-6697 j info j PAGE 53
Timo Smura and Antero Kivi
are both Research
Scientists based at TKK
Helsinki University of
Technology, Espoo,
Finland. Juuso Toyli is a
Professor based at the
Turku School of Economics,
Turku, Finland.
Received 2 October 2008Revised 6 March 2009Accepted 10 March 2009

utilised for various other purposes, including, e.g. advertising (Leppaniemi and Karjaluoto,
2005) as well as collecting behavioural data from the users (Gonzalez et al., 2008; Eagle and
Pentland, 2006).
Because of the rapid pace of development, the need for measuring and analysing how
people adopt and use the existing and emerging mobile services is evident, to support
different stakeholders, including service providers, content creators, mobile operators,
handset manufacturers, and regulators in their decision-making. At the same time, however,
collecting and analysing the required information is becoming increasingly complex as
usage diverges between different types of devices and networks. Statistics collected and
disseminated by companies, policy-makers, consultants, and academics are often
narrow-focused and miss a holistic view on service usage. Comparing the findings is
difficult, and even the use of key terms such as ‘‘mobile’’ and ‘‘service’’ is often ambiguous
and context-dependent.
Mobile services are typically (and often implicitly) understood as services that make use of
mobile devices and/or mobile networks. In reality, however, it is often difficult to draw a line
between mobile and non-mobile networks, as, e.g. wireless local area networks (WLANs)
offer more limited mobility compared to cellular networks. Furthermore, mobile networks are
increasingly utilised by devices other than mobile phones, including less mobile devices
such as laptop PCs or even home alarm systems. In the future of ‘‘ubiquitous’’ technologies
and computing, the variety of wirelessly connected devices as well as the importance of
machine-to-machine communications is expected to grow significantly, adding to this
complexity (see, e.g. Uusitalo, 2006).
Additional ambiguity is related to the term service having many incompatible definitions.
This paper relies on a service science view. In general, Vargo and Lusch (2004) argue for a
service-dominant logic to replace the traditional goods-dominant logic in marketing, and
define service as the application of resources (competences, skills, and knowledge) for the
benefit of another entity or the entity itself. Furthermore, service systems are defined as
value-co-creation configurations of people, technology, other internal and external service
systems, and shared information (Maglio and Spohrer, 2007; Spohrer et al., 2007).
According to these definitions, service systems include businesses, government agencies
as well as individual people, and both the client and provider of service are considered as
service systems.
A wide variety of mobile services exists, each fulfilling different types of needs (e.g. Anckar
and D’Incau, 2002; Bouwman et al., 2008). Thus, organizing, structuring, and analysing
mobile service usage data raises a need for classifying the services. Ideally, classification
should be based on consistent use of relevant criteria, and should produce categories that
are mutually exclusive and jointly exhaustive. Mobile service classifications have been
proposed by many authors, for different purposes and using different criteria. Velez and
Correia (2002) take a network viewpoint and classify mobile broadband services and
applications based on the characteristics of the traffic produced by them
(Interactive/Conversational, Interactive/Messaging, Interactive/Retrieval, Distributed/
Broadcast, Distributed/Cyclical). Holma et al. (2007) divide UMTS services to five main
categories (person-to-person circuit switched services, person-to-person packet switched
services, content-to-person services, business connectivity, and location services), and
further to twelve subcategories. Pura and Heinonen (2007) take an end-user point-of-view to
classification, identifying four dimensions of mobile services: type of consumption (hedonic
vs. utilitarian use), temporal and spatial context, social setting, and relationship between the
user and the service provider.
The purpose of this paper is to construct a holistic framework that supports designing mobile
service usage research as well as communicating, positioning, and comparing research
results. The framework helps academics and practitioners to design and to recognise the
limitations of mobile service usage studies, and to avoid misinterpretations based on
insufficient data. By mapping research settings and results to the framework, it is possible to
recognise areas where further data collection and analysis might be required. The
PAGE 54 j infoj VOL. 11 NO. 4 2009

framework also helps in selecting the most appropriate methods and measurement points
for different research questions.
The paper is structured as follows. First, we discuss the research process that resulted in the
proposed framework and identify four relevant measurement points that can be used to
collect data on mobile service usage. Then, we introduce our framework, comprising of the
measurement points and technical components of mobile services, together with suitable
classification criteria and resulting categories. We then proceed to discuss the relations
between the measurement points and service components. Finally, after introducing the
framework, we apply it to the analysis of mobile browsing studies, an important and timely
topic area in the convergence point of mobile and Internet services. The paper is then closed
with discussion and suggestions for further research.
2. Research process and methods
The framework presented aggregates our experiences from a series of longitudinal and
cross-sectional mobile service usage measurements carried out in Finland annually in
2005-2008, covering 80-90 per cent of all mobile users and service usage. Although relatively
small and remotely located in Northern Europe, Finland is well-suited for studies concerning
advanced mobile services for a number of reasons. With a population of 5.3 million, it ranks
among the 12 richest countries in the world using GDP/capita as a measure. Finland is a highly
industrialised open economy, and was No. 6 in World Economic Forum’s Global
Competitiveness Index in 2007-2008 and 2008-2009 (www.weforum.org). It was also the
first country in the world to launch GSM-based digital mobile communications networks in
1991, and led the global mobile service penetration statistics throughout the 1990s.
Furthermore, the world’s largest mobile manufacturer Nokia has its home and origin in Finland.
Our mobile service usage measurements have taken place annually in 2005-2008.
Descriptive results from these measurements have been published in Kivi (2008) and
Verkasalo (2008). The measurements were carried out in close collaboration with the key
players of the industry, including all three mobile network operators and Nokia. This wide
support of the national mobile industry allowed us to collect data of comprehensive scope.
Broad use of multiple data collection methods and measurement points has enabled data
and method triangulation, as well as analysis and comparison of their scopes and limitations.
Information on the usage of internet and mobile services can be collected from a range of
different sources (see, e.g. Kivi, 2009). In our measurements, data were collected by:
B capturing the IP traffic from mobile operator’s central network nodes;
B by utilizing the usage accounting systems of mobile operators;
B by monitoring end-users’ mobile handsets.
Furthermore, the handset-based measurements were complemented with questionnaires
filled by the participating users. To our knowledge, synchronised data of the same detail and
scope have not been earlier available to researchers from any other mobile market.
In general, mobile service usage data can be collected from four main sources, as illustrated
in Figure 1.
1. End-users. Surveys are a commonly used data collection method for studying mobile
user behaviour and service usage. Surveys are conducted on samples of real end-users,
and can be implemented using various methods. Time series data can be produced by
repeating a certain set of questions. Continuous panel studies, where the participating
panellists register usage events manually to an online or paper diary often result in data of
higher accuracy and granularity.
2. Usage monitoring systems. Usage monitoring includes both user monitoring as well as
device monitoring systems. Device monitoring is common in studying PC and Internet
usage, and is also used in TV audience measurements. The evolution of mobile phones
towards computer-like devices has made it possible to conduct device monitoring also at
mobile handsets (see, e.g. Verkasalo and Hammainen, 2007), regardless of whether any
VOL. 11 NO. 4 2009 j infoj PAGE 55

traffic is generated in the mobile networks. Device monitoring is typically conducted as
panel studies, where the manual registering of usage events is replaced with the logging
functionality of monitoring software or hardware installed in the device. In mobile handset
monitoring, a software agent in a monitored device records what the user does with the
device, and sends that information further.
3. Network nodes. The accounting systems that register the usage of chargeable services
by individual users are natural sources of information for any service provider. In
GSM/UMTS networks, this function is typically called charging and billing, whereas for an
IP network access provider, the accounting function is a part of the AAA (Authentication,
Authorization, and Accounting) system. More specific TCP/IP traffic measurements
(a.k.a. ‘‘network sniffing’’ or ‘‘packet sniffing’’) can be also conducted at various
intermediary network nodes between terminals and servers. Network architecture is in an
important role, as points of convergence of mobile data traffic should be found at the
network to attain comprehensive and representative measurements. In contrast to
GSM/UMTS networks that provide a centralised point for traffic measurements, efficient
measurement in WLAN networks is more challenging because of the small size of
individual WLAN hot spots and lack of centralised routing in larger deployments.
4. Servers. At the server side, in addition to the above-mentioned TCP/IP traffic and usage
accounting system-based methods, service usage and behavioural patterns can be
studied by collecting log files. The various servers where usage of many end-users
converges include, e.g. portals and individual Web/WAP sites/servers, search engines,
and proxy servers.
3. The framework
The framework for analysing the usage of mobile services is depicted in Figure 2. The
framework consists of two layers: measurement points, and technical components of mobile
service systems. The technical components comprise of devices, applications, networks,
and content. In addition, the framework presents classifications for each component and the
relationships between the components and available measurement points.
As our focus is specifically on the technical components of mobile service systems, the
value network and actors responsible for offering each of the service components, including,
e.g. mobile operators, device vendors, and content providers, are not visible in the
framework. These aspects are omitted to avoid unnecessary complexity, but if needed can
be taken into account by adding an additional actors dimension to the framework.
3.1 Devices
End-users, both consumers and corporate, have a number of digital, network connected
devices in use, partly for different and partly for the same tasks. From the end-user
point-of-view, different devices are complementary as each one is preferred in different
contexts and for different applications. The devices are, however, also competing with each
other in order to be the preferred ones in as many situations as possible.
Figure 1 Sources of usage data in mobile service systems
PAGE 56 j infoj VOL. 11 NO. 4 2009

Regarding mobility, a question arises how to distinguish between mobile and ‘‘non-mobile’’
devices. In addition to basic mobile phones and smartphones, a number of other devices
are offering some degree of mobility to the users. Current laptops offer WLAN and Bluetooth
connectivity, possibly complemented by, e.g. 3G mobile network interfaces. In addition,
personal digital assistants (PDAs, like HP iPaq) and ‘‘Internet tablets’’ or ‘‘Ultra-mobile PCs’’
(Nokia N810, Microsoft UMPC) are available in the market, each one with different strengths
in different applications. The variety of wirelessly connected devices is expected to extend
further, and to include, e.g. more narrowly focused devices such as digital cameras and
gaming devices.
Convergence of multiple features and functionalities in the same device makes it harder to
make the distinction between device classes. For example, advanced mobile devices such
as Nokia N97 or Apple iPhone, although often classified as mobile phones, also integrate a
music/video player, a digital camera, as well as PDA functionalities into the same device.
Mutual exclusiveness between feature/functionality-centric device classes is therefore
difficult to achieve.
Previously, mobile devices have been classified based on criteria such as mobile
technology generation (2G vs. 3G) or, e.g. the capability of installing third party applications
to the device (Sugai, 2007). Our classification of mobile devices is based on three
classification criteria; the physical size of the device, the capability to make 2G/3G
circuit-switched (CS) voice calls with the device, and the type of operating system running in
the device. Based on these criteria, we have recognised the following, sufficiently well
disintegrated mobile device classes:
B mobile phones;
B smartphones and PDAs;
B ultra-mobile PCs;
B laptops and tablet PCs; and
B other devices.
The classification criteria, together with examples for each of the classes, are presented in
Table I.
Figure 2 A framework for analysing the usage of mobile services
VOL. 11 NO. 4 2009 j infoj PAGE 57

3.2 Applications
Mobile phones are essentially small computers capable of running a number of softwareapplications, each required for delivering certain services, such as voice calls, SMSmessages, or e-mail. Voice calling and SMS messaging applications are typically deeplyintegrated into the software platform of mobile phones. New, more advanced mobile devicessupport also various other functionalities, and applications for mobile phones are gettingcloser to computer software. The emergence of more open mobile operating systems such asSymbian, WindowsMobile, and GoogleAndroidmakes itpossible to run softwareapplicationsdeveloped by third parties in the devices, much in the same way as in the PC domain.Applications can be running independently only in one device, or be distributed betweenmultiple computers communicating over a network. An emerging trend towards ‘‘cloudcomputing’’ is shifting computing from locally installed programs to large, centralised serversin the internet (see e.g. Hayes, 2008).
Consequently, when classifying applications, we are effectively classifying computersoftware. Examples of software classification frameworks include, e.g. the North AmericanProduct Classification System (NAPCS), which divides application software into generalbusiness productivity and home use applications, cross-industry application software,vertical market application software, utilities software, and other application software (USCensus Bureau, 2007). Classification on this level is, however, not sufficiently fine-grained togive insight to the developments taking place in the dynamic mobile marketplace.
In our classification, the key classification criteria are the nature of interactivity that theapplication provides (person-to-person communications, content retrieval, contentviewing/playback, synchronization, or standalone), as well as the type of content handledby the application. The resulting classification is similar to those used by major PC softwarelibraries such as Download.com, or Versiontracker.com, and includes ten mobile deviceapplication classes:
1. calling;
2. messaging;
3. browsers;
4. infotainment clients;
5. servers and file sharing;
6. multimedia;
7. games;
8. business/productivity;
9. system/utilities; and
10. other applications (Table II).
Table I Device classes
Classification criteria
Class Size2G / 3G
circuit-switched calls Operating system Examples
Mobile phones Pocket-sized YesMobile-optimised, closed
from third party appsNokia 3100,
Motorola RAZR V3Smartphones andPDAs Pocket-sized Yes
Mobile-optimised, open forthird party apps
Nokia N97, Apple iPhone,RIM Blackberry
Ultra-Mobile PCs Pocket-sized No Full PC OS Nokia N810Laptops andtablet PCs Portable No Full PC OS Apple iBook
Other devices Various No Limited, for specific purposeSony PSP, Apple iPod, Canon
Ixus
PAGE 58 j infoj VOL. 11 NO. 4 2009

The classification is seen to be relatively stable, covering the essential applications available
and in use today. In the future, as mobile devices and available applications evolve, the
classification may need to be updated to include new classes.
3.3 Networks
Mobile networks based on, e.g. GSM/GPRS, EDGE, and WCDMA/HSPA radio technologies
provide are central in providing wireless network connectivity to mobile devices. In addition,
WLAN technologies provide a low-cost alternative mostly in indoor areas, such as homes,
offices, and certain hotspot locations such as hotels, airports, or cafes. Alternative wireless
access network technologies such as WiMAX may become an option in the future.
One way to classify wireless networks is based on their geographical range, resulting into
such classes as WWAN (Wireless Wide Area Network), WMAN (Wireless Metropolitan Area
Network), WLAN (Wireless Local Area Network), and WPAN (Wireless Personal Area
Network). In our classification, we use the term ‘‘mobile networks’’ instead of WWAN. To
complete the wireless network classification, we have included two additional classes:
‘‘offline’’ to account for those use cases where only local device features are used and no
network connections are required (e.g. taking photos with a camera phone), and ‘‘other
networks’’ to account for, e.g. fixed connections or mesh technologies. In sum, our six
wireless network classes are:
1. mobile networks;
2. wireless MANs;
3. wireless LANs;
4. wireless PANs;
5. offline; and
6. other networks (Table III).
Table II Application classes
Classification criteriaClass Nature of interactivity Type of content Examples
Calling Person-to-personcommunication
Real-time voice/video Applications for circuit- and packet-switchedvoice calls, video calls, Push-to-Talk overCellular, and ‘‘rich calls’’
Messaging Person-to-personcommunication
Non-real-timevoice/video/text/images
Software clients for SMS, MMS, instantmessaging, and e-mail
Browsers Content retrieval Generic HTML/WAP pages Clients providing an access to HTML/WAPpages
Infotainment clients Content retrieval Client-specific data Specialised clients to information orentertainment content, e.g. weather,navigation, RSS clients, widgets
Servers and file sharing Content retrieval andsharing
Various Web servers, Bittorrent, FTP, media servers
Multimedia Content creation, editing,and playback
Music/video/image files orstreams
Offline or online/streaming multimediaplayers, image viewers, recording/capturingand editing software
Games Offline/data synchronization Game data Offline and network gamesBusiness/productivity Offline/server access Office documents Calendars, personal information
management, word processors,spreadsheet and presentation applications,enterprise systems
System/utilities Offline/server access Local data/files File managers, configuration, security,system updates, compression
Other applications Various Various Uncategorised applications
VOL. 11 NO. 4 2009 j infoj PAGE 59

3.4 Content
As the fourth mobile service component, we consider the content transmitted via the wireless
networks and/or consumed with the mobile devices and applications. Traditionally, and
dominantly today, the majority of mobile operator revenues are collected from voice calls
and short message services (SMS). Rapid evolution of handset and network technologies is,
however, enabling new types of Internet and multimedia contents to be delivered to the
users.
Classification of content could be done on a purely technical level, separating between
voice/audio, video, images, and text/data. In this case, information about the file formats, i.e.
filename extensions (e.g. html, .mp3, .jpg, .wmv) could be used to distinguish between
content classes. Another option is to use servers where content resides as a proxy for the
content, and classify the servers. Servers can be recognised by their IP addresses or URLs
(e.g. cnn.com, youtube.com) and classified, e.g. based on the nature of content they are
holding (e.g. news, entertainment).
In our framework, content classification is strongly linked both to the applications as well as
to the utilised networks. An important criterion in our classification is whether the content is
mobile-specific or generic internet content (e.g. WAP vs Web pages). Furthermore, content
classification is based on the application accessing and transferring the content. The
classification is based on our view on the most relevant and widely accessed types of
content, and includes the following ten content classes:
1. mobile calls;
2. mobile messaging;
3. mobile portals and sites;
4. personalization and applications;
5. multimedia;
6. internet calls;
7. internet messaging;
8. web sites;
9. web search and portals; and
10. other content (Table IV).
3.5 Relationships between measurement points and service components
Table V illustrates the relations between measurement points and the technical components
of mobile service systems. Each measurement point can provide data on several
components, and the quality of the collected data differs between the measurement points.
In Table I, these differences are presented, separately in two dimensions: data coverage and
granularity.
Table III Network classes
Classification criterionClass Geographical coverage Examples
Mobile networks Nationwide, worldwide GSM, CDMA, WCDMAWireless MANs Citywide/regional WiMAX (IEEE 802.16)Wireless LANs Local, e.g. inside a home, office, cafe Wi-Fi (IEEE 802.11)Wireless PANs Short-range Bluetooth (IEEE 802.15)Offline None Use of phone cameraOther networks Various Fixed networks, uncategorised networks
PAGE 60 j infoj VOL. 11 NO. 4 2009
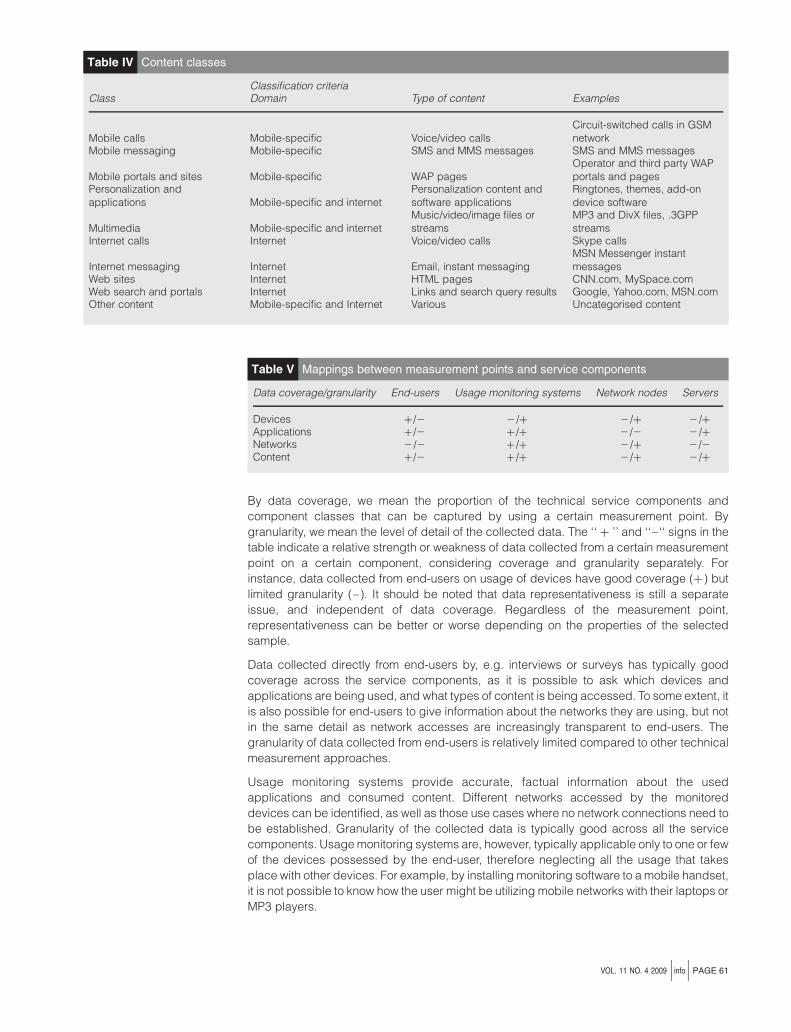
By data coverage, we mean the proportion of the technical service components and
component classes that can be captured by using a certain measurement point. By
granularity, we mean the level of detail of the collected data. The ‘‘ þ ’’ and ‘‘– ‘‘ signs in the
table indicate a relative strength or weakness of data collected from a certain measurement
point on a certain component, considering coverage and granularity separately. For
instance, data collected from end-users on usage of devices have good coverage (þ ) but
limited granularity (–). It should be noted that data representativeness is still a separate
issue, and independent of data coverage. Regardless of the measurement point,
representativeness can be better or worse depending on the properties of the selected
sample.
Data collected directly from end-users by, e.g. interviews or surveys has typically good
coverage across the service components, as it is possible to ask which devices and
applications are being used, and what types of content is being accessed. To some extent, it
is also possible for end-users to give information about the networks they are using, but not
in the same detail as network accesses are increasingly transparent to end-users. The
granularity of data collected from end-users is relatively limited compared to other technical
measurement approaches.
Usage monitoring systems provide accurate, factual information about the used
applications and consumed content. Different networks accessed by the monitored
devices can be identified, as well as those use cases where no network connections need to
be established. Granularity of the collected data is typically good across all the service
components. Usage monitoring systems are, however, typically applicable only to one or few
of the devices possessed by the end-user, therefore neglecting all the usage that takes
place with other devices. For example, by installing monitoring software to a mobile handset,
it is not possible to know how the user might be utilizing mobile networks with their laptops or
MP3 players.
Table IV Content classes
Classification criteriaClass Domain Type of content Examples
Mobile calls Mobile-specific Voice/video callsCircuit-switched calls in GSMnetwork
Mobile messaging Mobile-specific SMS and MMS messages SMS and MMS messages
Mobile portals and sites Mobile-specific WAP pagesOperator and third party WAPportals and pages
Personalization andapplications Mobile-specific and internet
Personalization content andsoftware applications
Ringtones, themes, add-ondevice software
Multimedia Mobile-specific and internetMusic/video/image files orstreams
MP3 and DivX files, .3GPPstreams
Internet calls Internet Voice/video calls Skype calls
Internet messaging Internet Email, instant messagingMSN Messenger instantmessages
Web sites Internet HTML pages CNN.com, MySpace.comWeb search and portals Internet Links and search query results Google, Yahoo.com, MSN.comOther content Mobile-specific and Internet Various Uncategorised content
Table V Mappings between measurement points and service components
Data coverage/granularity End-users Usage monitoring systems Network nodes Servers
Devices þ /2 2 /þ 2 /þ 2 /þApplications þ /2 þ /þ 2 /2 2 /þNetworks 2 /2 þ /þ 2 /þ 2 /2Content þ /2 þ /þ 2 /þ 2 /þ
VOL. 11 NO. 4 2009 j infoj PAGE 61

Measurements at network nodes provide accurate and fine-grained data on the usage of the
networks, and the devices used within those networks are accurately identifiable. However,
all usage out of the scope of the operator’s usage accounting system or the central network
point selected for traffic measurements can not be observed with these methods, ignoring,
e.g. WLAN and offline use. This leads to relatively poor coverage of data across the service
components. Typically, applications and content, especially those that are not controlled by
the operator, are not easily identified by the accounting systems. Traffic measurements
enable the use of more advanced (and more resource consuming) analysis methods than
those available in the accounting systems, resulting in better knowledge about, e.g. the
accessed content.
Measurements done at network servers provide accurate information about the devices
and applications used to access the content on those particular servers. Regarding
devices, data granularity is rather good, as it is possible for servers to accurately
recognise, e.g. the operating systems of the devices connected to them. Unfortunately,
single server based measurements cannot give a holistic view on the usage of mobile
services as the usage is typically fragmented over many servers. Even the most central
servers, such as Google’s search engine or operators’ portals, can capture only a portion
of the mobile service usage.
4. Application of the framework to mobile browsing usage studies
In the PC-centric internet, Web browsers are the dominant way of accessing content and
services. Increasingly, also the audio and video content is played using the browser
application, instead of dedicated media players. Similarly, as mobile devices are becoming
internet-capable, mobile web browsing is expected to be in central role when accessing the
internet while on the move.
Web browsing on mobile devices has attracted the interest of many academics. The
success of NTT DoCoMo’s i-mode service in Japan compared to the poor acceptance of
Wireless Application Protocol (WAP) services in Europe in the early 2000’s resulted in many
studies comparing the two. Lindmark and Bohlin (2003) find many of the common
explanations for i-mode’s success (Japan’s low fixed line penetration, socio-cultural
differences, technology choices) inadequate, and propose a systems explanation of
co-evolving technical and actor systems. Haas (2006) compares the innovation strategies
and processes of Japanese and European companies, and their effects on the success of
mobile internet services. Numerous other contributions can be found related to the technical
network architectures and protocols designed for mobile Web browsing, as well as usability
of mobile browsing software (e.g. Roto, 2006). In this paper, however, our focus is on
empirical measurements and analysis of the actual usage of mobile services.
Regarding service usage, a number of studies on mobile browsing can be found in the
literature. In our literature review, we have identified four groups of studies with relatively
different scopes and viewpoints on mobile browsing. The four groups include studies
utilizing data from end-users, handset monitoring systems, network traffic measurements,
and server measurements.
Figure 3 illustrates the differences in the scopes of the groups of studies, making use of our
framework.
Figure 3A maps two survey-based studies to our framework. The scope of survey-based
studies is defined by the questions asked from the respondents. Ishii (2004) compares the
mobile internet and PC internet use in Japan, whereas Habuchi et al. (2005) collected data
on mobile phone and mobile web usage in order to describe the recent conditions of mobile
communication in Japan. Considering devices, the use of PCs is differentiated from mobile
phones in the former study, while only mobile phones are in the scope of the latter. Mobile
networks and wireless LANs are presumably in the scope of both studies, but not separately
identified or treated. Regarding content, the authors of both studies have identified and
differentiated between a large number of web site categories.
PAGE 62 j infoj VOL. 11 NO. 4 2009

Figure
3Applicationoftheframework
tomobile
browsingusagestudies
VOL. 11 NO. 4 2009 j infoj PAGE 63

Figure 3B brings out the different characteristics of handset monitoring compared to
surveys. Kivi (2007) analyses the diffusion and usage of mobile browsing services in Finland
utilizing handset measurement data from panels of smartphone users. M:Metrics, Inc.
(2008), an analyst company specializing in measuring the consumption of mobile content
and applications, also monitors a panel of smartphone users, and publishes mobile
browsing statistics from, e.g. the United States and the United Kingdom. The scope of the
measurement and coverage of the data is limited to those smartphones where the device
monitoring system can be installed (Nokia’s Symbian S60-based devices for the former and
Windows, Symbian, and Palm handsets for the latter study). Generally, the use of various
browser applications can be accurately identified by the monitoring systems, and also the
usage of WLAN networks can be separately measured and analysed. All relevant content
categories are identifiable and measurable from the data.
Figure 3C presents the characteristics of network traffic measurements. In his mobile
browsing study, Kivi (2007) uses also traffic measurement data collected from mobile
operators’ networks. The measurements are limited to Internet-bound traffic in the mobile
networks of Finnish operators, and, e.g. data on browsing that takes place via wireless LANs
is not available. The identification of browser applications is based on transport protocol port
numbers, possibly resulting in some inaccuracies in the results. Regarding devices, all
categories are in the scope of the study as long as they are using mobile networks for data
transmission. Content-wise, generic web sites and portals are within the scope of the
measurements, whereas mobile operators’ portals are not.
Finally, Figure 3D maps three different server based measurements in the framework.
Kamvar and Baluja (2007) examine mobile web search queries, by analysing data collected
from Google’s server logs in the US. Similarly, utilizing query log data collected from Yahoo!
Japan’s servers, Baeza-Yates et al. (2007) study the characteristics of search queries on
mobile phones in Japan. Both studies represent relatively central points in the network, but
still the measurements are capturing only a small subset of browsing traffic generated by
mobile devices. All devices capable of running browser applications are in the scope of the
studies, and have been also identified and categorised as phones, PDAs, and PCs. Opera
Software ASA (2008), the company developing the popular Opera Mini mobile browser,
collects data from proxy servers routing all Opera Mini traffic and publishes statistics on the
mobile browsing patterns of users from different countries. Opera’s content adaptation proxy
servers provide a central point in the network, but only for users utilizing the Opera Mini
mobile browser. All three measurements capture mobile browsing regardless of the used
access network, but differentiation of, e.g. WLAN usage from mobile network usage cannot
be made.
As Figure 3 and the discussion above shows, existing studies on mobile browsing usage
differ considerably in many aspects. Due to these differences, the results of the separate
studies are not directly comparable, without taking into account the limitations of collected
data. Studies relying on data from technical measurements (Figures 3B, 3C, and 3D) are
able to give a detailed view on a limited subset of mobile browsing usage (i.e. with specific
type of phones, via a specific mobile network, or to a specific server). On the other hand,
studies utilizing end-user survey data are more flexible in their scope, but same level of data
granularity is not achievable.
Our framework brings out the scopes and limitations of the different studies illustratively, and
aids in comparing the coverage and results of the studies and in recognizing the
complementarities between them. Evidently, to create a holistic view on the usage of mobile
browsing services, a combination of measurement points and methods is needed. The
ability to collect data simultaneously with several or all of the available methods improves the
overall reliability of the findings. If and when this is not possible, proper care should be taken
when interpreting and generalizing the findings based on data of limited scope.
5. Summary and discussion
In this paper, we have constructed a framework for analysing the usage of mobile services
and applied it to mobile browsing studies. Analysis of mobile service usage requires a
PAGE 64 j infoj VOL. 11 NO. 4 2009

holistic view taking into account the wide selection of devices, applications, network
technologies, and content. The value of the suggested framework lies in its systematic,
explicit and comprehensive way of treating mobile services. As such, the framework helps in
interpreting and comparing the results of various service usage studies and in deterring from
too broad generalizations based on data that does not provide sufficient basis for it. By
mapping research settings and results to the framework, it is also possible to recognise
those areas where further data collection and analysis might be required. The framework is
valuable for researchers in selecting the most appropriate methods and measurement
points for given research problem and in designing and communicating the scope of their
studies and measurement settings.
The framework consists of two layers: measurement points and technical service
components. Regarding these, the framework is considered to be generic enough to be
applicable in mobile service usage studies in general. Since the general architecture and
building blocks of mobile services are expected to remain the same in the foreseeable
future, new measurement points or service components are not likely to be needed in the
framework. Regarding the classifications of service components, the situation differs due to
the fast evolution and innovations in mobile devices and networks, as well as in application
software and content. For all service components, new categories are expected to emerge,
requiring changes and additions in the framework.
Future work includes adding an actors dimension to the framework in order to analyse the
roles of different players in the value networks that provide mobile services. Extending the
framework to Internet services more generally is also possible; measurement points and
service components are seen to be suitable as such, while the classifications of the service
components necessitate modifications.
References
Anckar, B. and D’Incau, D. (2002), ‘‘Value creation in mobile commerce: findings from a consumer
survey’’, The Journal of Information Technology Theory and Application, Vol. 4 No. 1, pp. 43-64.
Baeza-Yates, R., Dupret, G. and Velasco, J. (2007), ‘‘A study of mobile search queries’’, Proceedings of
the Sixteenth International World Wide Web Conference (Banff, Alberta, Canada, 2007).
Balasubramanian, S., Peterson, R.A. and Jarvenpaa, S.L. (2002), ‘‘Exploring the implications of
m-commerce for markets and marketing’’, Journal of the Academy of Marketing Science, Vol. 30 No. 4,
pp. 348-61.
Bouwman, H., Carlsson, C., Walden, P. and Molina-Castillo, F.J. (2008), ‘‘Trends in mobile services in
Finland 2004-2006: from ringtones to mobile internet’’, Info: the Journal of Policy, Regulation and
Strategy for Telecommunications, Information and Media, Vol. 10 No. 2, pp. 75-93.
Brynjolfsson, E., Yu, H. and Smith, M.D. (2003), ‘‘Consumer surplus in the digital economy: estimating
the value of increased product variety at online booksellers’’, Management Science, Vol. 49 No. 11,
pp. 1580-96.
Eagle, N. and Pentland, A. (2006), ‘‘Reality mining: sensing complex social systems’’, Personal and
Ubiquitous Computing, Vol. 10 No. 4, pp. 255-68.
Gonzalez, M.C., Hidalgo, C.A. and Barabasi, A-L. (2008), ‘‘Understanding individual human mobility
patterns’’, Nature, Vol. 453 No. 7196, pp. 779-82.
Geyskens, I., Gielens, K. and Dekimpe, M.G. (2002), ‘‘The market valuation of internet channel
additions’’, Journal of Marketing, Vol. 66 No. 2, pp. 102-19.
Haas, M. (2006), Management of Innovation in Network Industries: The Mobile Internet in Japan and
Europe, Deutscher Universitats-Verlag, Wiesbaden.
Habuchi, I., Dobashi, S., Tsuji, I. and Iwata, K. (2005), ‘‘Ordinary usage of new media: internet usage via
mobile phone in Japan’’, International Journal of Japanese Sociology, Vol. 14 No. 1, pp. 94-108.
Hayes, B. (2008), ‘‘Cloud computing’’, Communications of the ACM, Vol. 49 No. 3, pp. 76-81.
Holma, H., Kristensson, M., Salonen, J. and Toskala, A. (2007), ‘‘UMTS services’’, in Holma, H. and
Toskala, A. (Eds), WCDMA for UMTS: HSPA Evolution and LTE, Wiley, New York, NY, pp. 9-38.
VOL. 11 NO. 4 2009 j infoj PAGE 65

Ishii, K. (2004), ‘‘Internet use via mobile phone in Japan’’, Telecommunications Policy, Vol. 28 No. 1,
pp. 43-58.
Kamvar, M. and Baluja, S. (2007), ‘‘Deciphering trends in mobile search’’, IEEE Computer, Vol. 40 No. 8,
pp. 58-62.
Kivi, A. (2007), ‘‘Diffusion and usage of mobile browsing in Finland 2005-2006’’, Proceedings of the
4th CICT Conference (Copenhagen, Denmark, 2007).
Kivi, A. (2008), ‘‘Mobile data service usage measurements – results 2005-2007, project report’’,
Department of Communications and Networking, TKK Helsinki University of Technology, Finland.
Kivi, A. (2009), ‘‘Measuring mobile service usage: methods and measurements points’’, International
Journal of Mobile Communications, forthcoming.
Leppaniemi, M. and Karjaluoto, H. (2005), ‘‘Factors influencing consumers’ willingness to accept mobile
advertising: a conceptual model’’, International Journal of Mobile Communications, Vol. 3 No. 3,
pp. 197-213.
Lindmark, S. and Bohlin, E. (2003), ‘‘The i-mode success story – towards a system explanation’’,
Communications & Strategies, Vol. 52, pp. 193-213.
Maglio, P.P. and Spohrer, J. (2007), ‘‘Fundamentals of service science’’, Journal of the Academy of
Marketing Science, Vol. 36 No. 1, pp. 18-20.
M:Metrics, Inc. (2008), Americans Spend More than 4.5 hours per Month Browsing on Smartphones,
Nearly Double the Rate of the British, press release, 21 May.
Opera Software ASA (2008), ‘‘State of the mobile web’’, June 2008, available at: www.opera.com/
mobile_report/ (accessed 30 July 2008).
Pura, M. and Heinonen, K. (2007), ‘‘Exploring mobile service business opportunities from a
customer-centric perspective’’, in Huang, W.W. (Ed.), Global Mobile Commerce: Strategies,
Implementation and Case Studies, Information Science Reference, London, pp. 111-33.
Roto, V. (2006), ‘‘browsing on mobile phones – Characteristics of user experience’’, Doctoral
dissertation, TKK Helsinki University of Technology.
Spohrer, J., Maglio, P.P., Bailey, J. and Gruhl, D. (2007), ‘‘Steps toward a science of service systems’’,
IEEE Computer, Vol. 40 No. 1, pp. 71-7.
Sugai, P. (2007), ‘‘Exploring the impact of handset upgrades on mobile content and service usage’’,
International Journal of Mobile Communications, Vol. 5 No. 3, pp. 281-99.
US Census Bureau (2007), ‘‘North American product classification system’’, available at: www.census.
gov/eos/www/napcs/napcs.htm (accessed 30 July 2008).
Uusitalo, M.A. (2006), ‘‘Global vision for the future wireless world from the WWRF’’, IEEE Vehicular
Technology Magazine, Vol. 1 No. 2, pp. 4-8.
Vargo, S.L. and Lusch, R.F. (2004), ‘‘Evolving to a new dominant logic for marketing’’, Journal of
Marketing, Vol. 68 No. 1, pp. 1-17.
Velez, F.J. and Correia, L.M. (2002), ‘‘Mobile broadband services: classification, characterization, and
deployment scenarios’’, IEEE Communications Magazine, Vol. 40 No. 4, pp. 142-50.
Verkasalo, H. and Hammainen, H. (2007), ‘‘A handset-based platform for measuring mobile service
usage’’, Info: the Journal of Policy, Regulation and Strategy for Telecommunications, Information and
Media, Vol. 9 No. 1, pp. 80-96.
Verkasalo, H. (2008), Summary of the Annual Finnish Smartphone Study 2007, project report,
Department of Communications and Networking, TKK Helsinki University of Technology, Finland.
Further reading
Halvey, M., Keane, M.T. and Smyth, B. (2006), ‘‘Mobile web surfing is the same as web surfing’’,
Communications of the ACM, Vol. 51 No. 7, pp. 9-11.
UMTS Forum (2001), The UMTS Third Generation Market – Phase II: Structuring the Service Revenue
Opportunities, Report No. 13, April 2001.
PAGE 66 j infoj VOL. 11 NO. 4 2009

About the authors
Timo Smura, MSc (Tech.), is a research scientist and a post-graduate student in theDepartment of Communications and Networking at the TKK Helsinki University ofTechnology. His research work has been published in a variety of journals, books, andconference proceedings. His research interests include techno-economic modelling ofemerging mobile technologies and services, competition between technologies andstandards in mobile communications, and mobile operator business models and strategies.Timo Smura is the corresponding author and can be contacted at: [email protected]
Antero Kivi works as a research scientist at the Department of Communications andNetworking, TKK Helsinki University of Technology, Finland. His research interests includeusage and diffusion of mobile services, and mobile consumer behaviour. Antero Kivi holds aMSc (Technology) from Helsinki University of Technology, and a MSc (Engineering) fromEcole Centrale Paris (France).
Juuso Toyli, DrSc (Econ. & Bus. Adm.), DrSc (Tech.), is acting Professor of logistics at TurkuSchool of Economics. Earlier he has served as Professor and post-doctoral researcher atHelsinki School of Economics as well as senior researcher at Helsinki University ofTechnology. He is also the founder of Oy J&AT Management Ltd. specialising on strategyconsulting and executive education. His research areas include logistics performance,management of services and technology, complex social systems, networking business,and business simulation games.
VOL. 11 NO. 4 2009 j infoj PAGE 67
To purchase reprints of this article please e-mail: [email protected]
Or visit our web site for further details: www.emeraldinsight.com/reprints