A DMAIC Framework to Improve Quality and Sustainability in ...
18
Citation: Rodriguez Delgadillo, R.; Medini, K.; Wuest, T. A DMAIC Framework to Improve Quality and Sustainability in Additive Manufacturing—A Case Study. Sustainability 2022, 14, 581. https:// doi.org/10.3390/su14010581 Academic Editor: Antonella Petrillo Received: 1 December 2021 Accepted: 1 January 2022 Published: 5 January 2022 Publisher’s Note: MDPI stays neutral with regard to jurisdictional claims in published maps and institutional affil- iations. Copyright: © 2022 by the authors. Licensee MDPI, Basel, Switzerland. This article is an open access article distributed under the terms and conditions of the Creative Commons Attribution (CC BY) license (https:// creativecommons.org/licenses/by/ 4.0/). sustainability Article A DMAIC Framework to Improve Quality and Sustainability in Additive Manufacturing—A Case Study Rodrigo Rodriguez Delgadillo 1 , Khaled Medini 2, * and Thorsten Wuest 3 1 Grenoble INP, 38031 Grenoble, France; [email protected] 2 Mines Saint-Etienne, University Clermont Auvergne, INP Clermont Auvergne, CNRS, UMR 6158 LIMOS, 42023 Saint-Etienne, France 3 Industrial and Management Systems Engineering, West Virginia University, Morgantown, WV 26506, USA; [email protected] * Correspondence: [email protected] Abstract: Additive manufacturing as a key Industry 4.0 technology brings radical changes to how we execute production and services operations. However, this innovative technology has not reached maturity and research and development are still in progress to unleash its full sustainability potential. This paper aims to provide operational guidance to decision makers to jointly improve quality and sustainability performance of additive manufacturing processes. We propose a framework based on the DMAIC (Define/Measure/Analyze/Improve/Control) methodology and comprehensive pool of targeted key performance indicators (KPIs) and illustrate this framework through a single case study. The paper evidences the feasibility of extending DMAIC to the growing additive manufacturing domain to achieve quality and sustainability objectives. The case study uncovered some challenges, e.g., the need for customization to a company/industry context, which must be addressed in order to widely apply the proposed framework successfully. Keywords: additive manufacturing; smart manufacturing; quality; sustainability; six sigma; agile manufacturing 1. Introduction Market volatility and tough, global competition put forth various challenges ahead of companies in manufacturing and service sectors alike. At the heart of these challenges is manufacturing agility, cost-efficiency, and sustainability. In response, innovative methods and technologies are continuously developed to meet said challenges. Currently, one of the most promising technologies is Additive Manufacturing (AM), gathering significant attention from both academics and industry. This can be mainly attributed to its potential to ensure both agility and sustainability, as well as cost-efficiency in low volume production scenarios. AM is one of the key technologies of Industry 4.0 [1], and significantly influences the production environment of products/services with radical changes in the execution of operations [2]. Many companies that are using or providing this emerging technology are not only interested in obtaining economic benefits, but they want to achieve a sustained competitive advantage to stand out in the competitive market, while also addressing environmental and social challenges [3]. However, AM technology is not yet mature, and research and development is still in progress to ensure these objectives are met when implementing AM for various use cases. One of the major challenges related to the introduction of AM technology, is the lack of knowledge about the process and the (direct and indirect) impact on the value chain. In order to improve the process performance and ramp-up of the production, sev- eral methodologies are presented in the literature, representing various different foci and Sustainability 2022, 14, 581. https://doi.org/10.3390/su14010581 https://www.mdpi.com/journal/sustainability
-
Upload
khangminh22 -
Category
Documents
-
view
2 -
download
0
Transcript of A DMAIC Framework to Improve Quality and Sustainability in ...
�����������������
Citation: Rodriguez Delgadillo, R.;
Medini, K.; Wuest, T. A DMAIC
Framework to Improve Quality and
Sustainability in Additive
Manufacturing—A Case Study.
Sustainability 2022, 14, 581. https://
doi.org/10.3390/su14010581
Academic Editor: Antonella Petrillo
Received: 1 December 2021
Accepted: 1 January 2022
Published: 5 January 2022
Publisher’s Note: MDPI stays neutral
with regard to jurisdictional claims in
published maps and institutional affil-
iations.
Copyright: © 2022 by the authors.
Licensee MDPI, Basel, Switzerland.
This article is an open access article
distributed under the terms and
conditions of the Creative Commons
Attribution (CC BY) license (https://
creativecommons.org/licenses/by/
4.0/).
sustainability
Article
A DMAIC Framework to Improve Quality and Sustainability inAdditive Manufacturing—A Case StudyRodrigo Rodriguez Delgadillo 1, Khaled Medini 2,* and Thorsten Wuest 3
1 Grenoble INP, 38031 Grenoble, France; [email protected] Mines Saint-Etienne, University Clermont Auvergne, INP Clermont Auvergne, CNRS, UMR 6158 LIMOS,
42023 Saint-Etienne, France3 Industrial and Management Systems Engineering, West Virginia University, Morgantown, WV 26506, USA;
[email protected]* Correspondence: [email protected]
Abstract: Additive manufacturing as a key Industry 4.0 technology brings radical changes to howwe execute production and services operations. However, this innovative technology has not reachedmaturity and research and development are still in progress to unleash its full sustainability potential.This paper aims to provide operational guidance to decision makers to jointly improve quality andsustainability performance of additive manufacturing processes. We propose a framework based onthe DMAIC (Define/Measure/Analyze/Improve/Control) methodology and comprehensive pool oftargeted key performance indicators (KPIs) and illustrate this framework through a single case study.The paper evidences the feasibility of extending DMAIC to the growing additive manufacturingdomain to achieve quality and sustainability objectives. The case study uncovered some challenges,e.g., the need for customization to a company/industry context, which must be addressed in order towidely apply the proposed framework successfully.
Keywords: additive manufacturing; smart manufacturing; quality; sustainability; six sigma;agile manufacturing
1. Introduction
Market volatility and tough, global competition put forth various challenges ahead ofcompanies in manufacturing and service sectors alike. At the heart of these challenges ismanufacturing agility, cost-efficiency, and sustainability. In response, innovative methodsand technologies are continuously developed to meet said challenges. Currently, one ofthe most promising technologies is Additive Manufacturing (AM), gathering significantattention from both academics and industry. This can be mainly attributed to its potentialto ensure both agility and sustainability, as well as cost-efficiency in low volume productionscenarios. AM is one of the key technologies of Industry 4.0 [1], and significantly influencesthe production environment of products/services with radical changes in the execution ofoperations [2].
Many companies that are using or providing this emerging technology are not onlyinterested in obtaining economic benefits, but they want to achieve a sustained competitiveadvantage to stand out in the competitive market, while also addressing environmentaland social challenges [3]. However, AM technology is not yet mature, and research anddevelopment is still in progress to ensure these objectives are met when implementingAM for various use cases. One of the major challenges related to the introduction of AMtechnology, is the lack of knowledge about the process and the (direct and indirect) impacton the value chain.
In order to improve the process performance and ramp-up of the production, sev-eral methodologies are presented in the literature, representing various different foci and
Sustainability 2022, 14, 581. https://doi.org/10.3390/su14010581 https://www.mdpi.com/journal/sustainability
Sustainability 2022, 14, 581 2 of 18
areas of emphasis. Examples include but are not limited to, PDCA (Plan–Do–Check–Act), known as the Deming circle/cycle/wheel [4], and the 8D problem solving pro-cess known as a team-oriented approach to solving critical problems in manufactur-ing systems in a general. Another methodology within this spectrum is DMAIC (De-fine/Measure/Analyze/Improve/Control) [5] which offers to gain a complete and deepunderstanding of the process at hand based on quantitative and qualitative data. Thisallows decision makers to take action with proven and meaningful indicators to improvethe process performance and satisfy consumer needs.
Another related area of literature related to our work focusses on analyzing thesustainability of processes and manufacturing systems. In this domain, one of the mostwidely used methodologies is Life Cycle Assessment (LCA) which allows evaluating thelife cycle environmental impact of a product systems [6]. A set of standards have beendeveloped to support the LCA methodology. In the same line, several recent papersextended the life cycle thinking by adding the social dimension of sustainability givingraise to concepts such as Social Life Cycle Assessment (S-LCA) [7]. Others investigated theintegration of all three sustainability pillars of the Triple Bottom Line (TBL) by focusing thegaps between these concepts [8]. A common feature of these methodologies is the key roleof indicators to measure and improve sustainability performance.
Recently, there was a push to unleash the potential of quality management tools andsustainability. The basic principle is to use or adapt quality and lean management tools forsustainability measurement and improvement with a major focus on the environmentalpillar of sustainability [9]. This gave rise to new concepts such as Green Six Sigma [10]. Thecurrent paper is positioned in the continuum of this research line by specifically addressingthe AM domain.
Research focusing on sustainability in the AM domain is emerging at a fast pace. Itbenefits from endeavors made in the broad manufacturing and service industries. Theauthors of [11] report on performance indicators for AM following the life cycle thinkingand explain how to use each indicator depending on product type, application, and decisionmaker’s goal. The literature also emphasizes the role of data-driven methods to enhancesustainability in AM [6]. From a value-driven perspective, concepts such as CircularEconomy have been put forth as potential drivers of sustainability in AM [12].
The underlying research question of this study research is “how can manufactur-ing companies integrate quality and sustainability objectives in additive manufacturing”.Following this guiding research question leads to additional objectives to make the in-vestigation actionable and valuable to practitioners: How can we provide guidelinesfor manufacturing companies to address quality and sustainability performance throughDMAIC methodology? In addition, to make that more specific, we will investigate thisthrough a case study with a manufacturing company dedicated to providing 3D printingtechnology that has the basic know-how and associated process set-up to align with AMtechnological innovation.
Thus, our research methodology is comprised of a combined literature analysis andsingle case study to address the research question of this paper. The literature reviewoutlines the challenges for AM and provides the conceptual foundations of the proposedframework. The case study derives insights on the applicability of the DMAIC-inspiredframework based a joint work with a national company that offers innovative solutionsin the field of AM in a Business-to-Business context (B2B). During the case study, threesemi-structured interviews were conducted to obtain information and explore specific areasof interest.
The remainder of the paper is organized as follows: Section 2 presents the literature re-view, Section 3 describes the proposed framework for improving quality and sustainability,Section 4 presents a case study carried out in an AM. The importance and relevance of thestudy is discussed in Section 4. Sections 5 and 6 highlight some discussions and concludingremarks from the present study and some proposals for future research.
Sustainability 2022, 14, 581 3 of 18
2. Literature Review2.1. AM and Metal Binder Jetting
AM has often been associated with 3D printing technology, which consists of buildinga product by deposition of material layer by layer based on a digital CAD (Computer-AidedDesign) model. One of the seminal studies in this area [13] emphasizes that the adventof commercial AM systems has enabled the fabrication of parts with complex geometrydirectly from CAD models with minimal intervening steps. Previously, AM parts wereprimarily restricted to prototype demonstrator roles. Today, the viability of AM partshas evolved to the extent that they are used in production and final assemblies [13], evenin the most demanding environments such as rocket nozzles and jet engines. Therefore,AM offers distinct competitive advantages such as eliminating specialized tooling costs,reducing material waste and life-cycle costs, enabling the creation of many shapes ofgeometries, and expanding product functionality for a variety and growing number ofindustrial applications.
For this study, we focus on a Binder Jetting (BJ) process relying on metal raw materialas a reference. BJ is commonly used for the AM of fully functional parts with powderedmaterials as input. BJ is a 3D printing process that uses a liquid binding agent depositedonto a build platform to bond layers of powder material and form a part [14]. Thistechnology can be used to print a variety of materials including metals, polymers, andceramics. Common applications and markets for this process and its products includeindustrial applications of dental and medical devices, aerospace components, part casting,and luxury applications [15].
The origins of BJ technology date back to 1993, when the Massachusetts InstituteTechnology (MIT), developed an inkjet-based 3D printing to create three-dimensionalobjects using metal powders. Indeed, the term “3D printing” was originally coined by MITin reference to the BJ technology. A manufacturing company, Extrude Hone Corporation,obtained an exclusive license for the MIT technology in 1996. Since then, the company hasdeveloped and commercialized BJ processes, with the first 3D printer, ProMetal RTS-300Vdelivered to Motorola in 1999 [14]. This short summary of the technology’s history showsthat more than 25 years have passed since this powerful and innovative way to manufactureproducts was introduced. Ex-one, which spun off from Extrude Hone Corporation in 2005,remained the only company to offer BJ services and systems until the early 2010s. Sincethen, the early patents for the technology began to expire, allowing new companies intothe market. There are many companies nowadays that provide this technology.
Most of the recent studies focused on BJ technology concur on its potential benefits.Hence, it is reasonable to suggest that manufacturing companies within the target audiencemust explore its applications within their manufacturing processes to ensure competitiveadvantage against the global competition. However, modern manufacturing technologiessuch as BJ are inherently complex and contain many process factors with significant effectson resulting products. Further, AM, and specifically BJ, presents some specific challengesand issues that may lead to quality discrepancies [16]. Many of these challenges are causedby missing methodological approaches to control quality, and limited empirical studiesand analysis of the AM systems to obtain a high level of quality of products. Accordingto [17], the complexity of modern manufacturing technologies reinforces difficulty inoperations management and quality control. Furthermore, in recent years sustainabilityhas been become more and more important, especially in the industrial sector where thetransformation of raw materials to finished products is a key. Understanding that changeis inevitable, in this sense, existing quality improvement systems such as Design for SixSigma, Six Sigma, lean principles, and other process improvement models must be adaptedto integrate sustainability and complexity of modern manufacturing technologies in orderto improve industrial adoption [18].
Sustainability 2022, 14, 581 4 of 18
2.2. Quality and Six Sigma Overview
According to the ASCM Dictionary (Association for Supply Chain Management),quality has two major components: (i) quality of conformance, or the quality defined bythe absence of defects; and (ii) quality of design, or the quality measured by the degree ofcustomer satisfaction with a product’s characteristics and features [18]. In this sense, qualitycan be defined as a dynamic state associated with products, services, people, processes,and environments that meets or exceeds expectations and helps produce superior value.
One of the key concepts related to quality management is Six Sigma. The Six Sigmamethodology focuses on process standardization and variability reduction, in accordancewith the Lean thinking approach, aiming at reducing various wastes. Six Sigma projectsfollow a practical roadmap called DMAIC, which is the classical cyclical process of fivestages known as Define, Measure, Analyze, Improve, and Control [19]. These logical stepsare used to identify and solve several kinds of problem and are reinforced through the toolsoffered by Industry 4.0.
The Define phase aims at identifying problems and defects within processes early onthrough proper data visualization tools [20]. Following the steps involved in this phase,problems can be detected including their root cause, which greatly increases the abilityfor analysis and optimization. In the Measure phase, data collection and analysis are thefocal points. They must represent the actual situation in the field, but in many cases a lot ofrelevant information is lost [21,22]. In order to better exploit the collected information, itis a best practice to select and structure appropriate performance indicators. This allowsconducting more target-oriented analysis where indicators are selected according to theproject goals and data is collected specifically with these indicators in mind. One of the keypoints of Six Sigma is the versatility and the reliability of its results and in this case, the useof Key Performance Indicators (KPIs) that are well defined will help with the relevance andvalue of the results obtained.
In the Analyze phase, the goal is to identify and prioritize the root causes of theproblem. Most of the time satisfactory analysis can be achieved with the Root CauseAnalysis (also commonly known as Ishikawa or Fishbone diagram). During the Improvephase, it is essential that the action plan taken is based on the removal of real and relevantroot causes and that it is monitored and sustained [20]. This analysis is crucial to fix theidentified problem and/or improve the overall performance. Indicators’ selection is a keyfor orienting and initiating improvement actions towards the achievement of the projectgoals. Finally, in the Control phase, the CTQs (Critical to Quality) are monitored to ensurethat the performance is improving and processes are stable. This relies heavily on efficientdata collection and information sharing as well as on information systems and tools suchas spreadsheets or other specific software solutions. Once again, KPIs are very helpful toenable these monitoring processes and improve their efficiency.
2.3. Six Sigma and Sustainability
The term “sustainability” first appeared in the literature at the beginning of the 1980s.Lester R. Brown published his work “Building a Sustainable Society” in 1981 which statesthat in a sustainable society, harmony must exist among population growth, social welfare,financial needs, utilization of natural resources, and the minimization of pollution [23].Sustainability means meeting our own needs without compromising the ability of futuregenerations to meet their own needs, linking three main dimensions—economic, environ-mental, and social. Sustainable manufacturing is defined as the “creation of goods andservices using processes and systems that are non-polluting, conserving energy and naturalresources, economically viable, safe and healthful for employees, communities and con-sumers, and socially and creatively rewarding for all working people” [24]. This definitionis aligned with the popular TBL concept promoting People, Planet, and Profit as pillarsof sustainability [24]. In the last decades, concerns about sustainability have caught theattention of researchers and decision makers in industry alike. One of the most cited studiesis the one by The Organization for Economic Co-operation and Development (OECD), an
Sustainability 2022, 14, 581 5 of 18
international organization that developed a Sustainable Manufacturing Toolkit providinga guideline to better manage environmental performance in manufacturing processes It“aims to provide a practical starting point for businesses around the world to improvethe efficiency of their production processes and products enabling them to contribute tosustainable development and green growth” [25].
Achieving the desired quality should not overlook sustainability objectives whichmight even bring additional drivers of competitiveness [26]. In fact, not only CorporateSocial Responsibility (CSR) brands sustainability a priority but also customer’s awarenessand requirements increase the pressure to include these measures in the company’s targets.Therefore, considering jointly quality and sustainability in Six Sigma projects is an oppor-tunity for achieving higher added value. This research orientation started to gain moreattention during the last few years [9,10,27–30].
DMAIC cycle has the potential to manage not only quality but also sustainabilityperformance. According to [29] “DMAIC-based approach can be effectively applied tosystematize the Sustainable Value Stream Mapping towards sustainable manufacturing,which includes metrics to evaluate the economic, environmental, and societal sustainabilityperformance of a manufacturing line”. In line with this definition, there are some emergentresearch endeavors promoting Six Sigma as powerful methodology tool to improve thesustainability performance of today’s production systems [30]. A recent study stresses theimportance of Green Lean Six Sigma, which is the combination of green principles withlean thinking through a Six Sigma approach [30]. The study concludes that this approachreduces negative environmental impacts and delivers high specification products.
3. Proposed Framework
In this section, the rationale behind the proposed framework is described, and thenrelevant KPIs are identified for the specific development of the framework.
3.1. Framework Rationale
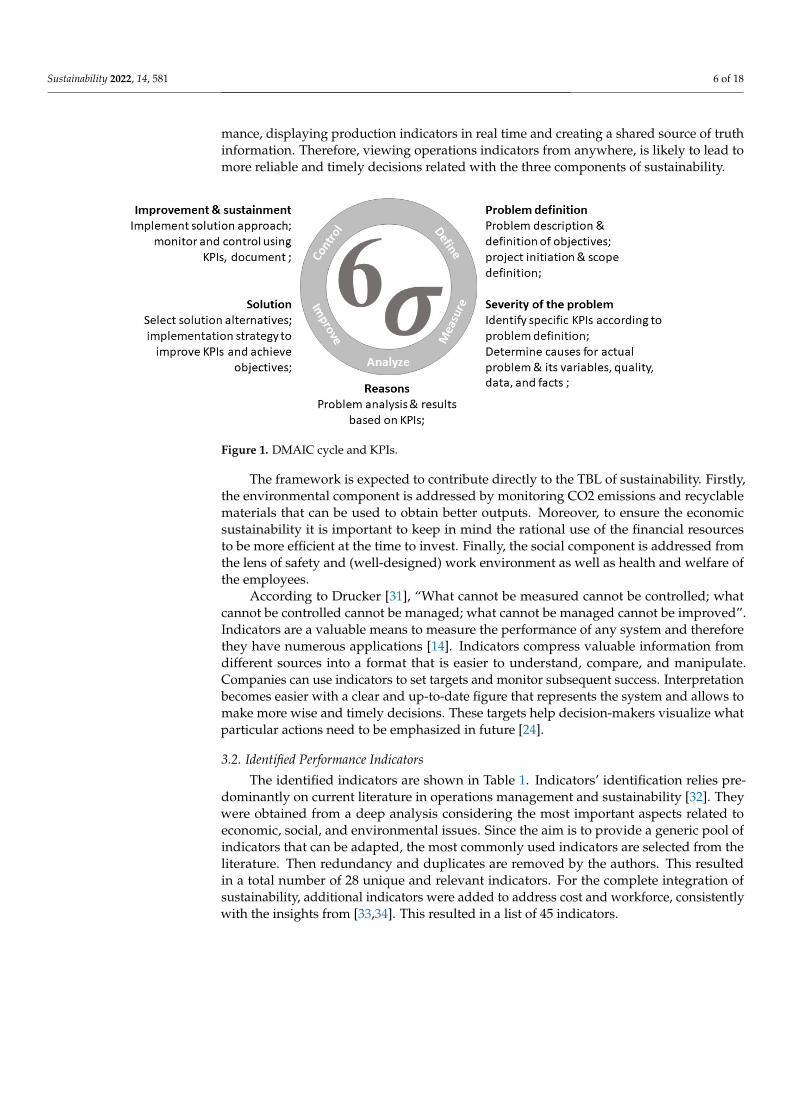
The proposed framework is built around DMAIC to jointly improve quality andsustainability performance of AM processes. To this end, several performance indicatorsare identified and structured to be used mainly during the Control and Measure phasesof DMAIC. The selection of the KPIs is based on a preliminary study with a company inAM and most importantly literature analysis. The preliminary study relied on informa-tional interviews and some reports from the company. This led to identifying the generalkey aspects related to performance measurement within the company and its suppliers,customers, and partners. This helped derive a set of generic performance attributes (seeTable 1, column 1). Then, for each of the performance attributes, a set of KPIs was selectedfrom literature. This was based on a review of recent studies related to the identified,most important components of quality and sustainability found in academics papers andindustry sources within the domain of AM (see Table 1, columns 2 to 4). We can seethe sequence of the use of the KPIs inside the DMAIC cycle in Figure 1 presenting theproposed framework.
The KPIs identified follow some essential features namely, accuracy (reliability), rele-vance to decision-making (easy to understand and manage), and improvement potential(providing guidance for improving system performance). This is crucial, as most of thestakeholders involved in the DMAIC projects have to know and sympathize with theproject meaning and purpose to subsequently develop and provide possible solutions.Complementarily, using these KPIs throughout the DMAIC cycle is a useful and effectiveway to improve a system (see Figure 1).
As a matter of fact, improving sustainability depends on a variety of interrelatedfactors such as democratizing the shop floor, giving frontline workforce control over theirprocesses, empowering employees at all levels to improve processes and collaboration indecision making with better data, improving visibility, finding capacity means, objectivelymeasuring manufacturing systems, bringing machines online, measuring human perfor-
Sustainability 2022, 14, 581 6 of 18
mance, displaying production indicators in real time and creating a shared source of truthinformation. Therefore, viewing operations indicators from anywhere, is likely to lead tomore reliable and timely decisions related with the three components of sustainability.
Sustainability 2022, 14, x FOR PEER REVIEW 6 of 18
performance, displaying production indicators in real time and creating a shared source of truth information. Therefore, viewing operations indicators from anywhere, is likely to lead to more reliable and timely decisions related with the three components of sustaina-bility.
Figure 1. DMAIC cycle and KPIs.
The framework is expected to contribute directly to the TBL of sustainability. Firstly, the environmental component is addressed by monitoring CO2 emissions and recyclable materials that can be used to obtain better outputs. Moreover, to ensure the economic sus-tainability it is important to keep in mind the rational use of the financial resources to be more efficient at the time to invest. Finally, the social component is addressed from the lens of safety and (well-designed) work environment as well as health and welfare of the employees.
According to Drucker [31], “What cannot be measured cannot be controlled; what cannot be controlled cannot be managed; what cannot be managed cannot be improved”. Indicators are a valuable means to measure the performance of any system and therefore they have numerous applications [14]. Indicators compress valuable information from dif-ferent sources into a format that is easier to understand, compare, and manipulate. Com-panies can use indicators to set targets and monitor subsequent success. Interpretation becomes easier with a clear and up-to-date figure that represents the system and allows to make more wise and timely decisions. These targets help decision-makers visualize what particular actions need to be emphasized in future [24].
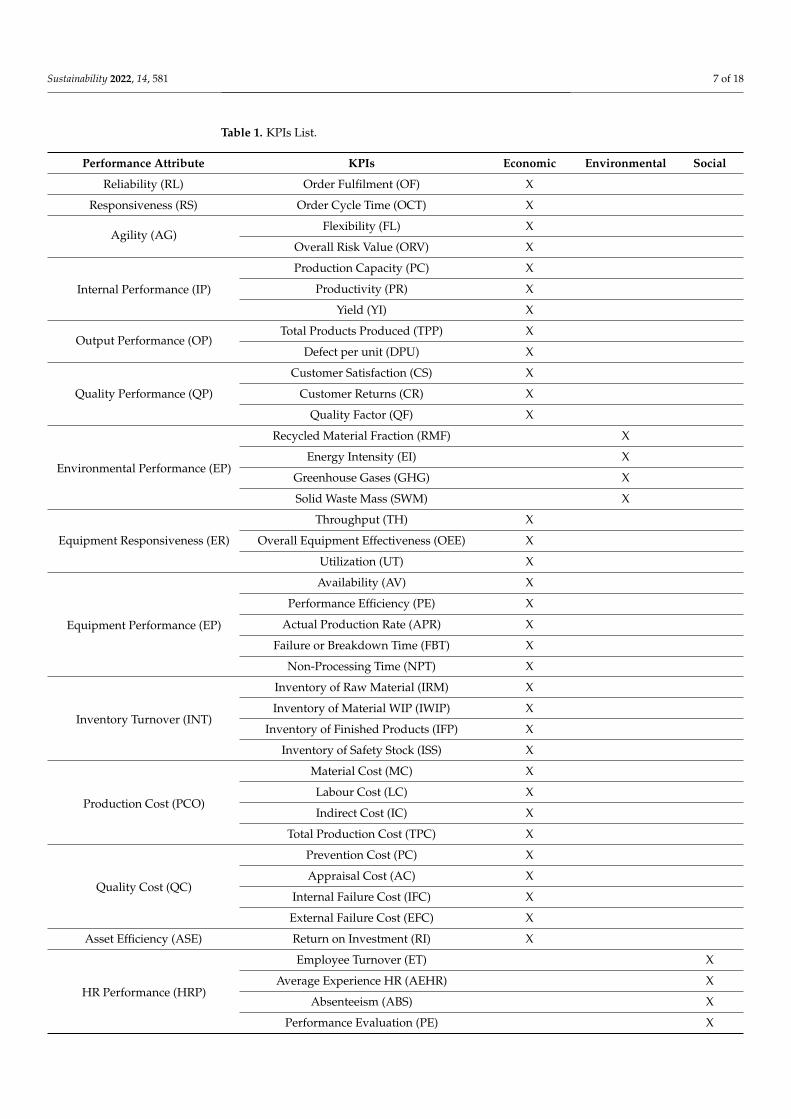
3.2. Identified Performance Indicators The identified indicators are shown in Table 1. Indicators’ identification relies pre-
dominantly on current literature in operations management and sustainability [32]. They were obtained from a deep analysis considering the most important aspects related to economic, social, and environmental issues. Since the aim is to provide a generic pool of indicators that can be adapted, the most commonly used indicators are selected from the literature. Then redundancy and duplicates are removed by the authors. This resulted in a total number of 28 unique and relevant indicators. For the complete integration of sus-tainability, additional indicators were added to address cost and workforce, consistently with the insights from [33,34]. This resulted in a list of 45 indicators.
Figure 1. DMAIC cycle and KPIs.
The framework is expected to contribute directly to the TBL of sustainability. Firstly,the environmental component is addressed by monitoring CO2 emissions and recyclablematerials that can be used to obtain better outputs. Moreover, to ensure the economicsustainability it is important to keep in mind the rational use of the financial resourcesto be more efficient at the time to invest. Finally, the social component is addressed fromthe lens of safety and (well-designed) work environment as well as health and welfare ofthe employees.
According to Drucker [31], “What cannot be measured cannot be controlled; whatcannot be controlled cannot be managed; what cannot be managed cannot be improved”.Indicators are a valuable means to measure the performance of any system and thereforethey have numerous applications [14]. Indicators compress valuable information fromdifferent sources into a format that is easier to understand, compare, and manipulate.Companies can use indicators to set targets and monitor subsequent success. Interpretationbecomes easier with a clear and up-to-date figure that represents the system and allows tomake more wise and timely decisions. These targets help decision-makers visualize whatparticular actions need to be emphasized in future [24].
3.2. Identified Performance Indicators
The identified indicators are shown in Table 1. Indicators’ identification relies pre-dominantly on current literature in operations management and sustainability [32]. Theywere obtained from a deep analysis considering the most important aspects related toeconomic, social, and environmental issues. Since the aim is to provide a generic pool ofindicators that can be adapted, the most commonly used indicators are selected from theliterature. Then redundancy and duplicates are removed by the authors. This resultedin a total number of 28 unique and relevant indicators. For the complete integration ofsustainability, additional indicators were added to address cost and workforce, consistentlywith the insights from [33,34]. This resulted in a list of 45 indicators.
Sustainability 2022, 14, 581 7 of 18
Table 1. KPIs List.
Performance Attribute KPIs Economic Environmental Social
Reliability (RL) Order Fulfilment (OF) X
Responsiveness (RS) Order Cycle Time (OCT) X
Agility (AG)Flexibility (FL) X
Overall Risk Value (ORV) X
Internal Performance (IP)
Production Capacity (PC) X
Productivity (PR) X
Yield (YI) X
Output Performance (OP)Total Products Produced (TPP) X
Defect per unit (DPU) X
Quality Performance (QP)
Customer Satisfaction (CS) X
Customer Returns (CR) X
Quality Factor (QF) X
Environmental Performance (EP)
Recycled Material Fraction (RMF) X
Energy Intensity (EI) X
Greenhouse Gases (GHG) X
Solid Waste Mass (SWM) X
Equipment Responsiveness (ER)
Throughput (TH) X
Overall Equipment Effectiveness (OEE) X
Utilization (UT) X
Equipment Performance (EP)
Availability (AV) X
Performance Efficiency (PE) X
Actual Production Rate (APR) X
Failure or Breakdown Time (FBT) X
Non-Processing Time (NPT) X
Inventory Turnover (INT)
Inventory of Raw Material (IRM) X
Inventory of Material WIP (IWIP) X
Inventory of Finished Products (IFP) X
Inventory of Safety Stock (ISS) X
Production Cost (PCO)
Material Cost (MC) X
Labour Cost (LC) X
Indirect Cost (IC) X
Total Production Cost (TPC) X
Quality Cost (QC)
Prevention Cost (PC) X
Appraisal Cost (AC) X
Internal Failure Cost (IFC) X
External Failure Cost (EFC) X
Asset Efficiency (ASE) Return on Investment (RI) X
HR Performance (HRP)
Employee Turnover (ET) X
Average Experience HR (AEHR) X
Absenteeism (ABS) X
Performance Evaluation (PE) X
Sustainability 2022, 14, 581 8 of 18
Table 1. Cont.
Performance Attribute KPIs Economic Environmental Social
HR TrainingCompliance with Training Schedule (CTS) X
Effectiveness of Trainings (ET) X
Health & Safety (H&S)Labor Accidents (LAC) X
Training in Safety (TSF) X
Prior to an in-depth analysis of the manufacturing system, each indicator has to showthat is provides a meaningful contribution to each stage. The selection of the KPIs for aspecific application is closely related to the particular problem the company is facing [34–37].Therefore, it is important to clearly define the real problem and the goals for a specificsituation, and then select the KPIs that are useful to measure and then interpret the results.This supports a better understanding of the real and actual situations and thus determiningand prioritizing possible actions to optimize the system [34].
According to Einstein “Everything should be as simple as possible, but not simpler”. There-fore, it is recommended that a company first begins with simple, easy to implementmeasures of compliance and resource efficiency, and only then moves toward more com-plex indicators, such as those addressing supply chain, social effects, and life-cycle impacts.Using indicators of sustainable production is one part of the process towards continuousimprovements, where the goal is to move the organization from adopting primarily low-level measures to using all levels of indicators of sustainable production. The criteria forthe sustainability assessment of the company have to reflect several key aspects such asresources, product, environment, economic aspects, quality, and social aspects [24].
4. Case Study
This section applies and evaluates the proposed framework in a case study centeredaround an innovative company experienced in the use of AM technologies and interestedin improving their quality and sustainability.
4.1. Case Study Overview
The aim of the case study is to illustrate the application of the DMAIC framework andthe identified indicators (see Section 3) pool to improve AM performance. Therefore, wefocus on a SME (Small and Medium-Sized Enterprise) given its untapped improvementpotential and more agile decision making, compared to many larger manufacturing com-panies that are governed by a lot of standards, often already have an established set ofindicators and reporting procedures. In addition, the case study aims to focus on a processwhich is not yet mature enough and for which ramp-up is still to be conducted to show thefull potential of the proposed framework.
The involved SME is recognized as a well-known center of expertise for manufactur-ing, created in 1965 at the request of the manufacturing industry. The aim is to providecompanies with the means and skills to increase their competitiveness, participate in stan-dardization, create a link between scientific research and industry, promote technologicaladvancement, help improve efficiency, and ensure quality.
The case company is developing AM processes using the BJ technology. Given theeconomic and environmental potential of this technology, the ambition is to rapidly andefficiently support-manufacturing companies in implementing it and ramping up theirAM processes.
Therefore, it is important to address any issues from the start and standardize theprocesses as much as feasible in order to ease the scale-up of production. To this end, theDMAIC framework and identified KPIs pool are used to improve quality and sustainabilityof the AM process using BJ technology.
Sustainability 2022, 14, 581 9 of 18
BJ enables production of complex components for numerous applications. BJ is theonly powered bed AM process that is not fusion-based, thus manufactured parts haveno residual stresses as opposed to laser-based AM, particularly the widely used powderbed fusion processes. After the design phase of the 3D model, the manufacturing processfollows six distinct phases, which are depicted here:
1. 3D Printing. The actual printing process, while fascinating to watch, should actuallybe the process stage that requires the least attention and interaction. Ideally, the 3Dprinter is able to run “lights out” without requiring constant operator monitoringor intervention.
2. Cleaning. This phase is mainly composed by two substages that are complementary:build removal that removes excess material from the build inside the printer (e.g., inpowder bed processes), and removing the build from the printer and part separationthat removes parts from the build plate.
3. Sintering. This phase consists of bonding the individual particles through solid-statediffusion at a temperature below the melting point of the material. However, sinteringmay involve liquid phase formation, also known as liquid phase sintering [14].
4. Surface Finishing. This phase utilizes machining processes to remove remainingsupports, smooth surfaces, add critical features, and hit critical tolerances, polishingsurfaces, coating etc.
5. Heat Treatment. This phase is set after sintering and build removal to help relieveany residual stresses that might have been introduced. Powder processes oftenuse Hot Isostatic Pressing after part separation to decrease porosity and furtherrelieve stresses.
6. Measurement. Also referred to as quality assurance for AM. This is not a singleand one-shot activity, but instead it represents a set of inspections, measurements,analyses, and documentation performed throughout the workflow in the AM process.
4.2. Applying the DMAIC Cycle in AM
The Six Sigma methodology is developed through six dedicated steps (DMAIC), whichseek to establish causes for the variations that occur throughout the manufacturing process.Figure 2 depicts a brief description of each step as a basis for the following application inthe case study. While we introduced the basics in Section 3.2, in the following we presentspecific tools and methods for the proposed framework’s application in the case study.
4.2.1. Define
For the Define phase, three key aspects are taken into account when defining the SixSigma objectives of the particular case study. These are Voice of Customer (VOC), Criticalto Quality (CTQ), and SIPOC (suppliers, inputs, process, outputs, customers) analysis. Toobtain pertinent and first-hand information, a semi-structured interview was conductedwith the Lead Manager of Product Development of the company. The questionnaire wasdesigned to understand the core of the company’s business and the main issues they arefacing. This will enable the development of a clear picture of the potential issues thecompany and industry is struggling with and ultimately, support the identification of themost critical aspects to define the problems and continue with the subsequent steps.
• Voice of Customer (VOC): The main problem identified during the interview is the lackof standardized process to quality control and the big quantity of defective productsobtained after all the manufacturing processes.
• Critical to Quality (CTQ): Problems with the recyclable raw material is an issue that ismentioned as a key point because this influences in the final product. In fact, if theproportion between virgin and recyclable material is not correct, the quality could berejected with a considerable waste of material. Furthermore, the number of operatorswith special skills in critical steps inside the process is a problem that the company iscurrently faced by. A great part of the manufacturing process requires manual taskswhere skills of operators is very important to ensure quality of the final products. In
Sustainability 2022, 14, 581 10 of 18
this sense, CTQ involves raw material recycled, skills of operators at key stages ofthe process.
• SIPOC: To have a clear vision of the SIPOC model of company, two main phases areidentified: first, the design phase where the 3D model is obtained to be manufactured,second, the manufacturing phase once the design is done. The 3D printer equipmentengages in the process until obtaining the final product (see Figure 2).
Sustainability 2022, 14, x FOR PEER REVIEW 10 of 18
manufactured, second, the manufacturing phase once the design is done. The 3D printer equipment engages in the process until obtaining the final product (see Figure 2).
Figure 2. SIPOC Analysis of the company.
Based on the insights drawn from the interview, the case study’s project goal can be defined as follows: Establish a deep analysis, considering skills in the workforce and iden-tify actions and to minimize the quantity of defective final products within the manufac-turing process using Metal Binder Jetting technology.
4.2.2. Measure Once the main problems have been identified and project goal is defined, relevant
KPIs are selected from the established pool (see Section 3.2) during the Measure phase. These indicators are selected and picked according to the specific problem that was iden-tified by the case company. Table 2 presents the selected KPIs as well as their formulas, input data and calculated values.
Figure 2. SIPOC Analysis of the company.
Based on the insights drawn from the interview, the case study’s project goal can be de-fined as follows: Establish a deep analysis, considering skills in the workforce and identifyactions and to minimize the quantity of defective final products within the manufacturingprocess using Metal Binder Jetting technology.
4.2.2. Measure
Once the main problems have been identified and project goal is defined, relevant KPIsare selected from the established pool (see Section 3.2) during the Measure phase. Theseindicators are selected and picked according to the specific problem that was identified bythe case company. Table 2 presents the selected KPIs as well as their formulas, input dataand calculated values.
Sustainability 2022, 14, 581 11 of 18
Table 2. Indicator’s calculation.
Indicator Formula Input Data Value
Defect per unit (DPU) DPU = Defects Observed/# unitsprocessed per stage
14 observed defects per 100 unitsprocessed. 0.14
Recycled material fraction(RMF)
RMF = (Weight of recycledmaterials consumed/Total weight
of all material inputs) × 100
5 kg of powder recycled out ofaverage of 12 kg of raw
material used.41.6%
Availability (AV) AV = Runtime/PlannedProduction Time
1 h is spent for cleaning and othermaintenance activities every 10 h
of runtime.0.9
Performance of Equipment PE = (Parts produced × Cycletime)/Available Time × 100
Cycle time is 0.1 h/unit and totalparts produced is 86 every 10 h. 0.955
Quality Q = (# produced parts—# defectiveparts)/# produced parts
14 observed defects per100 units processed. 0.86
Overall EquipmentEffectiveness (OEE) OEE = AV × PE × Q
AV, PE, and Q values arecalculated previously (0.9, 0.955,
and 0.86).73.92%
Inventory of Raw MaterialTurnover (IRMT)
IRMT = (Amount of raw materialused in a month/amount of raw
material available in the inventory)× 100
240 kg of raw material used permonth and average 300 kg of
inventory level.80%
HR Training (HRT)EOT = (Number of trainings
evaluated as positive/Total peopletrained) × 100
12 training out of 18 in averageare evaluated as positive. 66.67%
4.2.3. Analysis
In this phase, the system is evaluated based on the data obtained during the conductedinterviews. The process was broken down into steps and diagnosed accordingly (seeFigure 3). This allows to collect the necessary data to determine the quality of the productand identify the stages with the greatest probability for defective products and qualityissues. This data is analyzed to determine the DPU (Defect Per Unit) and identify whichstages are the most critical to act on (see Table 3).
Sustainability 2022, 14, x FOR PEER REVIEW 11 of 18
Table 2. Indicator’s calculation.
Indicator Formula Input Data Value
Defect per unit (DPU) DPU = Defects Observed/# units
processed per stage 14 observed defects per 100 units
processed. 0.14
Recycled material fraction (RMF)
RMF = (Weight of recycled materials consumed/Total weight of all material
inputs) × 100
5 kg of powder recycled out of average of 12 kg of raw material used. 41.6%
Availability (AV) AV = Runtime/Planned Production Time
1 h is spent for cleaning and other maintenance activities every 10 h of
runtime. 0.9
Performance of Equipment
PE = (Parts produced × Cycle time)/Available Time × 100
Cycle time is 0.1 h/unit and total parts produced is 86 every 10 h.
0.955
Quality Q = (# produced parts—# defective parts)/# produced parts
14 observed defects per 100 units processed.
0.86
Overall Equipment Effectiveness (OEE) OEE = AV × PE × Q
AV, PE, and Q values are calculated previously (0.9, 0.955, and 0.86). 73.92%
Inventory of Raw Material Turnover
(IRMT)
IRMT = (Amount of raw material used in a month/amount of raw material
available in the inventory) × 100
240 kg of raw material used per month and average 300 kg of inventory level. 80%
HR Training (HRT) EOT = (Number of trainings evaluated as positive/Total people trained) × 100
12 training out of 18 in average are evaluated as positive.
66.67%
4.2.3. Analysis In this phase, the system is evaluated based on the data obtained during the con-
ducted interviews. The process was broken down into steps and diagnosed accordingly (see Figure 3). This allows to collect the necessary data to determine the quality of the product and identify the stages with the greatest probability for defective products and quality issues. This data is analyzed to determine the DPU (Defect Per Unit) and identify which stages are the most critical to act on (see Table 3).
Figure 3. Stages of process.
Table 3. Percentage of contribution by stage.
Process Stage DPU Contribution by Stage of
Process % Contribution by stage of
the DPU % Accumulated DPU
E 0.26 30.95% 30.10%
C 0.21 25.00% 58.02%
B 0.12 14.29% 72.84%
D 0.11 13.10% 86.42%
Figure 3. Stages of process.
Table 3. Percentage of contribution by stage.
Process Stage DPU Contribution by Stageof Process
% Contribution by Stage ofthe DPU % Accumulated DPU
E 0.26 30.95% 30.10%
C 0.21 25.00% 58.02%
B 0.12 14.29% 72.84%
D 0.11 13.10% 86.42%
A 0.08 9.52% 93.83%
F 0.06 7.14% 100%
Sustainability 2022, 14, 581 12 of 18
Stage analysis: The stages must be analyzed in order to determine the defects andtheir root causes. We can observe in Table 3 that the highest DPUs occur at stages E (HeatTreatment), C (Sintering), and B (Cleaning). Heat Treatment (E) requires a good knowledgeof operators on the correct temperature and time needed to obtain a good quality in thefinal step. Furthermore, due to the mechanical characteristics of the equipment it is alsoimportant to manage this stage from the design phase to avoid any undesired result at thislevel. In the case of Sintering (C), which provides cohesion of the powders through creatingstrong bonds between the particles, the raw material is critical. Therefore, it is importantto ensure raw material quality. Cleaning (B), which consists of removing excess materialfrom the build inside the printer, is closely related to the effectiveness of the maintenanceconducted inside the equipment which should be in optimal conditions.
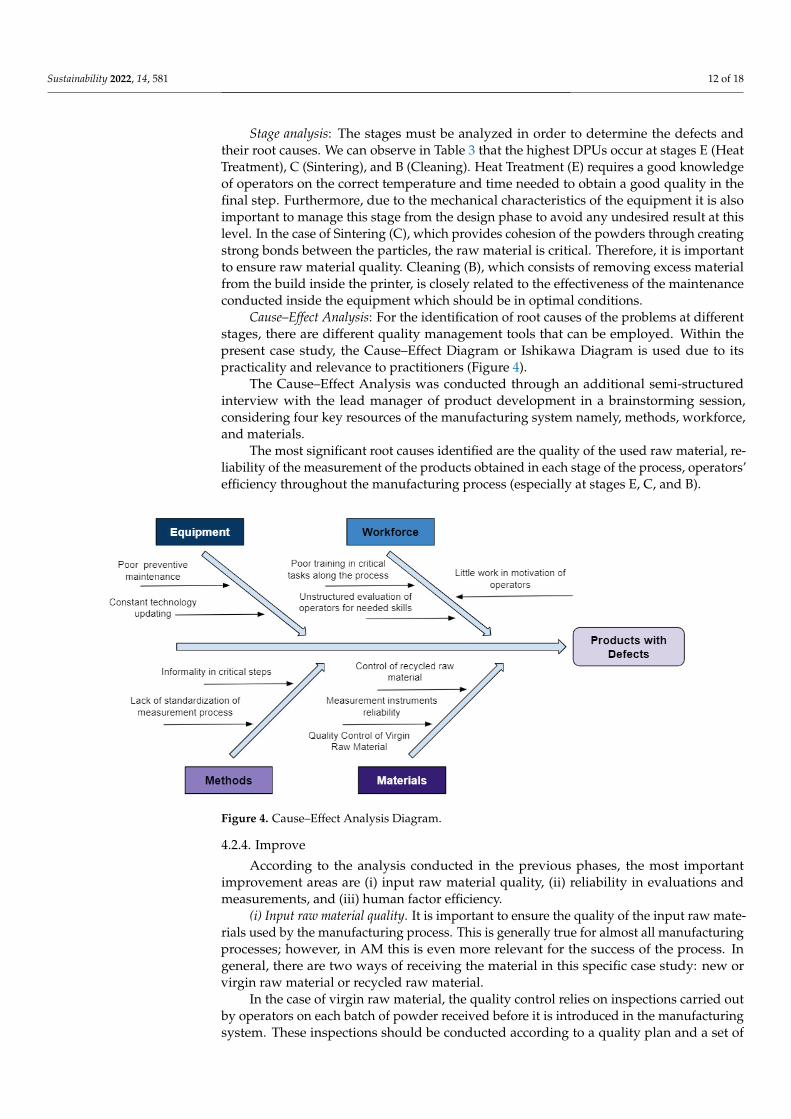
Cause–Effect Analysis: For the identification of root causes of the problems at differentstages, there are different quality management tools that can be employed. Within thepresent case study, the Cause–Effect Diagram or Ishikawa Diagram is used due to itspracticality and relevance to practitioners (Figure 4).
The Cause–Effect Analysis was conducted through an additional semi-structuredinterview with the lead manager of product development in a brainstorming session,considering four key resources of the manufacturing system namely, methods, workforce,and materials.
The most significant root causes identified are the quality of the used raw material, re-liability of the measurement of the products obtained in each stage of the process, operators’efficiency throughout the manufacturing process (especially at stages E, C, and B).
Sustainability 2022, 14, x FOR PEER REVIEW 12 of 18
A 0.08 9.52% 93.83%
F 0.06 7.14% 100%
Stage analysis: The stages must be analyzed in order to determine the defects and their root causes. We can observe in Table 3 that the highest DPUs occur at stages E (Heat Treat-ment), C (Sintering), and B (Cleaning). Heat Treatment (E) requires a good knowledge of operators on the correct temperature and time needed to obtain a good quality in the final step. Furthermore, due to the mechanical characteristics of the equipment it is also im-portant to manage this stage from the design phase to avoid any undesired result at this level. In the case of Sintering (C), which provides cohesion of the powders through creat-ing strong bonds between the particles, the raw material is critical. Therefore, it is im-portant to ensure raw material quality. Cleaning (B), which consists of removing excess material from the build inside the printer, is closely related to the effectiveness of the maintenance conducted inside the equipment which should be in optimal conditions.
Cause–Effect Analysis: For the identification of root causes of the problems at different stages, there are different quality management tools that can be employed. Within the present case study, the Cause–Effect Diagram or Ishikawa Diagram is used due to its prac-ticality and relevance to practitioners (Figure 4).
The Cause–Effect Analysis was conducted through an additional semi-structured in-terview with the lead manager of product development in a brainstorming session, con-sidering four key resources of the manufacturing system namely, methods, workforce, and materials.
The most significant root causes identified are the quality of the used raw material, reliability of the measurement of the products obtained in each stage of the process, oper-ators’ efficiency throughout the manufacturing process (especially at stages E, C, and B).
Figure 4. Cause–Effect Analysis Diagram.
4.2.4. Improve According to the analysis conducted in the previous phases, the most important im-
provement areas are (i) input raw material quality, (ii) reliability in evaluations and meas-urements, and (iii) human factor efficiency.
Figure 4. Cause–Effect Analysis Diagram.
4.2.4. Improve
According to the analysis conducted in the previous phases, the most importantimprovement areas are (i) input raw material quality, (ii) reliability in evaluations andmeasurements, and (iii) human factor efficiency.
(i) Input raw material quality. It is important to ensure the quality of the input raw mate-rials used by the manufacturing process. This is generally true for almost all manufacturingprocesses; however, in AM this is even more relevant for the success of the process. Ingeneral, there are two ways of receiving the material in this specific case study: new orvirgin raw material or recycled raw material.
In the case of virgin raw material, the quality control relies on inspections carried outby operators on each batch of powder received before it is introduced in the manufacturingsystem. These inspections should be conducted according to a quality plan and a set of
Sustainability 2022, 14, 581 13 of 18
defined specifications, complying with the standards established in AM processes. In thecase of recycled raw material, a rigorous and more detailed control must be carried outon the material that is intended to be reintroduced into the manufacturing process, sinceit must be ensured that this material meets the necessary requirements to be able to bereused again.
(ii) Reliability in evaluations and measurements. The reliability of the evaluations car-ried out strongly impacts the efficiency of the whole quality management system, sincethe information collected from each inspection point will be used to evaluate the totalquality of the final product. Therefore, quality attributes should be clearly defined and mea-sured at different stages of the process (e.g., dimensions of the parts and surface quality).Measurement procedures should be described and made available to the operators.
(iii) Human factor efficiency. The key to improve operator’s efficiency is adequate train-ing in the activities carried out by each individual who participates directly or indirectlyin this process. It is convenient to develop a training matrix per position that covers thetechnical and administrative needs to perform adequately given tasks. In the case of opera-tions’ personnel, developing different levels of knowledge in the product will help to givethe opportunity to people who have the interest and the ability to move up in the companyand seek better opportunities. The other aspect that plays an important role when it comesto the human factor is the motivation of staff at all levels. Finally, the work environment isvery important for employees to perform their jobs in an efficient way. Additionally, factorssuch as cleanliness, safety, occupational health, lighting, and temperature play a vital rolewhen analyzing the performance of the human factor.
4.2.5. Control
During the Control phase, the success of the implemented actions related to quality isevaluated. It is necessary to be clear and transparent about the way in which compliancewith the expected quality standards will be evaluated. The indicators selected for thecontrol phase are part of the proposed framework and must have a clear and objectivemeasure, this is in order to make a comparison and measure the impact of the reduction invariability in a simple way. Table 4 summarizes the KPIs used for this purpose.
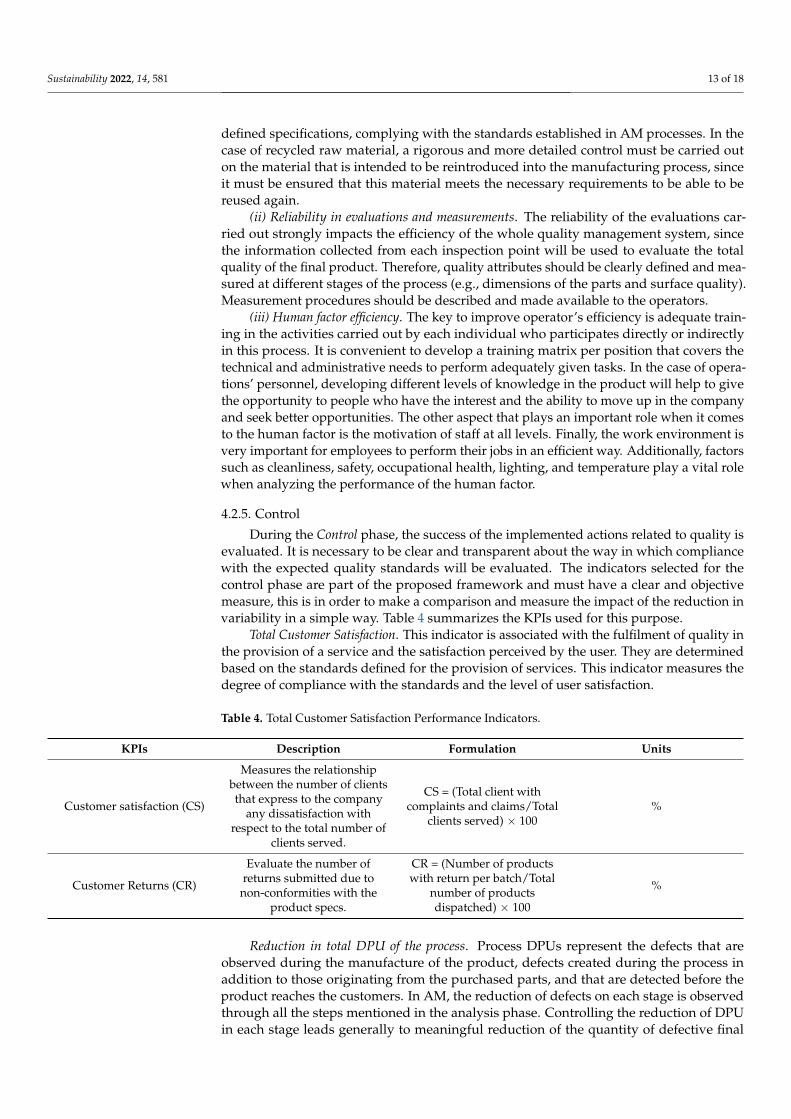
Total Customer Satisfaction. This indicator is associated with the fulfilment of quality inthe provision of a service and the satisfaction perceived by the user. They are determinedbased on the standards defined for the provision of services. This indicator measures thedegree of compliance with the standards and the level of user satisfaction.
Table 4. Total Customer Satisfaction Performance Indicators.
KPIs Description Formulation Units
Customer satisfaction (CS)
Measures the relationshipbetween the number of clientsthat express to the company
any dissatisfaction withrespect to the total number of
clients served.
CS = (Total client withcomplaints and claims/Total
clients served) × 100%
Customer Returns (CR)
Evaluate the number ofreturns submitted due to
non-conformities with theproduct specs.
CR = (Number of productswith return per batch/Total
number of productsdispatched) × 100
%
Reduction in total DPU of the process. Process DPUs represent the defects that areobserved during the manufacture of the product, defects created during the process inaddition to those originating from the purchased parts, and that are detected before theproduct reaches the customers. In AM, the reduction of defects on each stage is observedthrough all the steps mentioned in the analysis phase. Controlling the reduction of DPUin each stage leads generally to meaningful reduction of the quantity of defective final
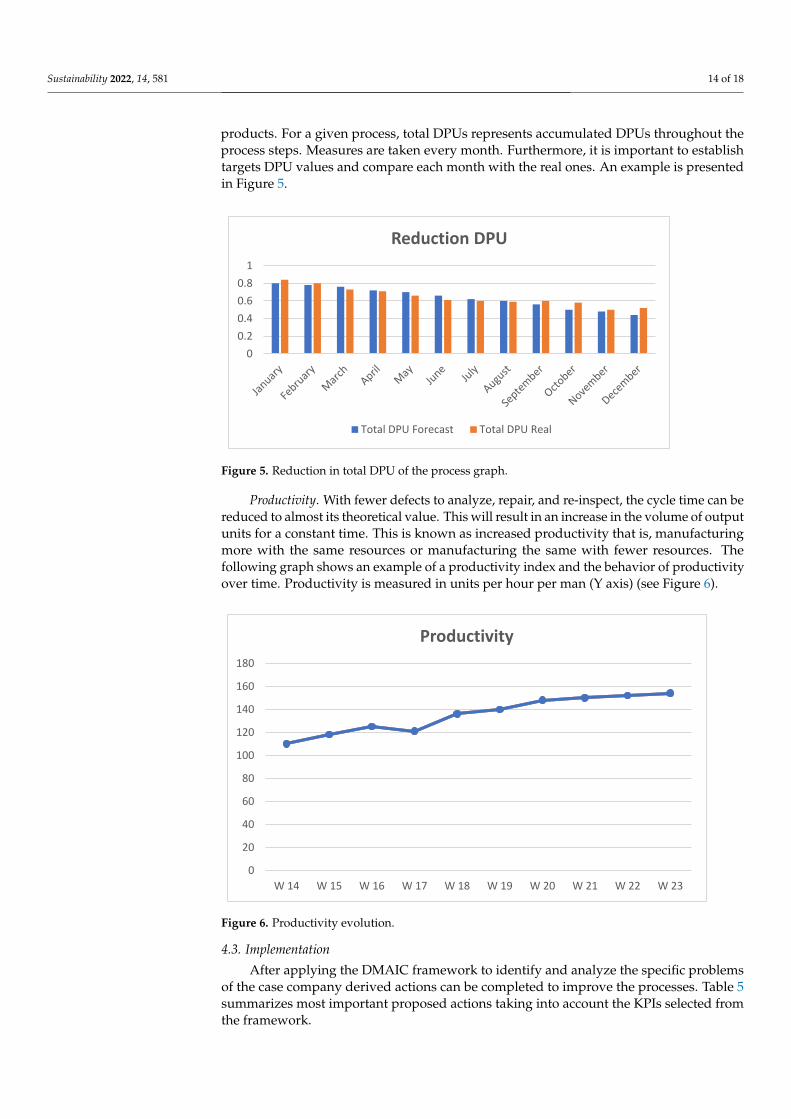
Sustainability 2022, 14, 581 14 of 18
products. For a given process, total DPUs represents accumulated DPUs throughout theprocess steps. Measures are taken every month. Furthermore, it is important to establishtargets DPU values and compare each month with the real ones. An example is presentedin Figure 5.
Sustainability 2022, 14, x FOR PEER REVIEW 14 of 18
Reduction in total DPU of the process. Process DPUs represent the defects that are ob-served during the manufacture of the product, defects created during the process in ad-dition to those originating from the purchased parts, and that are detected before the product reaches the customers. In AM, the reduction of defects on each stage is observed through all the steps mentioned in the analysis phase. Controlling the reduction of DPU in each stage leads generally to meaningful reduction of the quantity of defective final products. For a given process, total DPUs represents accumulated DPUs throughout the process steps. Measures are taken every month. Furthermore, it is important to establish targets DPU values and compare each month with the real ones. An example is presented in Figure 5.
Figure 5. Reduction in total DPU of the process graph.
Productivity. With fewer defects to analyze, repair, and re-inspect, the cycle time can be reduced to almost its theoretical value. This will result in an increase in the volume of output units for a constant time. This is known as increased productivity that is, manu-facturing more with the same resources or manufacturing the same with fewer resources. The following graph shows an example of a productivity index and the behavior of productivity over time. Productivity is measured in units per hour per man (Y axis) (see Figure 6).
Figure 6. Productivity evolution.
00.20.40.60.8
1
Reduction DPU
Total DPU Forecast Total DPU Real
0
20
40
60
80
100
120
140
160
180
W 14 W 15 W 16 W 17 W 18 W 19 W 20 W 21 W 22 W 23
Productivity
Figure 5. Reduction in total DPU of the process graph.
Productivity. With fewer defects to analyze, repair, and re-inspect, the cycle time can bereduced to almost its theoretical value. This will result in an increase in the volume of outputunits for a constant time. This is known as increased productivity that is, manufacturingmore with the same resources or manufacturing the same with fewer resources. Thefollowing graph shows an example of a productivity index and the behavior of productivityover time. Productivity is measured in units per hour per man (Y axis) (see Figure 6).
Sustainability 2022, 14, x FOR PEER REVIEW 14 of 18
Reduction in total DPU of the process. Process DPUs represent the defects that are ob-served during the manufacture of the product, defects created during the process in ad-dition to those originating from the purchased parts, and that are detected before the product reaches the customers. In AM, the reduction of defects on each stage is observed through all the steps mentioned in the analysis phase. Controlling the reduction of DPU in each stage leads generally to meaningful reduction of the quantity of defective final products. For a given process, total DPUs represents accumulated DPUs throughout the process steps. Measures are taken every month. Furthermore, it is important to establish targets DPU values and compare each month with the real ones. An example is presented in Figure 5.
Figure 5. Reduction in total DPU of the process graph.
Productivity. With fewer defects to analyze, repair, and re-inspect, the cycle time can be reduced to almost its theoretical value. This will result in an increase in the volume of output units for a constant time. This is known as increased productivity that is, manu-facturing more with the same resources or manufacturing the same with fewer resources. The following graph shows an example of a productivity index and the behavior of productivity over time. Productivity is measured in units per hour per man (Y axis) (see Figure 6).
Figure 6. Productivity evolution.
00.20.40.60.8
1
Reduction DPU
Total DPU Forecast Total DPU Real
0
20
40
60
80
100
120
140
160
180
W 14 W 15 W 16 W 17 W 18 W 19 W 20 W 21 W 22 W 23
Productivity
Figure 6. Productivity evolution.
4.3. Implementation
After applying the DMAIC framework to identify and analyze the specific problemsof the case company derived actions can be completed to improve the processes. Table 5summarizes most important proposed actions taking into account the KPIs selected fromthe framework.

Sustainability 2022, 14, 581 15 of 18
Table 5. Proposed actions related with indicators selected.
Problem (KPIs) Proposed Action
Quantity of defect products obtainedafter manufacturing process Defect per Unit (DPU)
Verify the proportion of raw materialvirgin and recycled is needed to ensure
the reduction of defective final products.
Quality of raw material that is mixedwith recyclable raw material as input in
the manufacturing systemRecycled Material Fraction (RMF)
Implement a new step at the moment toverify the quality of the recycled raw
material that is pretended to use again.
Problems of effectiveness of theequipment when is processing Overall Equipment Effectiveness (OEE)
Reduce the idle time of equipment anduse this idle time to improve steps inside
the production process.
Quantity of virgin raw material needed toobtain a consistent product
Inventory of Raw MaterialTurnover (IRMT)
Increase the stock of virgin raw material,to use more percentage at the time tointroduce it in the production system.
Number of operators with special skillsin manual tasks throughout the
manufacturing processEffectiveness of Trainings (EOT)
Implement new ways to develop thetraining, to be more personalized andensure the learning of each operator,
especially in critical steps.
5. Discussion
AM gained significant momentum in recent years because it offers many potentialbenefits. When focusing mainly on the efficiency compared to traditional manufacturingprocesses, AM stands out with its low tooling cost and fast ramp-up especially for smallerbatch sizes that become more common with the dawn of Industry 4.0 batch-size-1. However,research is still needed to explore this potential in relation to other aspects such as qualityand sustainability in a big picture, involving the whole value chain.
While several studies address the question of how to bridge the gap between qualityand sustainability, only a few papers focus on the specific domain of AM. The proposedframework provides a means to structure the process of identifying, analyzing, and im-plementing pressing issues unique to a company currently utilizing or planning to utilizeAM processes. The framework articulates KPIs with DMAIC to reinforce its practicality.The KPIs can cover various sustainability pillars and thus allow to holistically addresssustainability and quality within operations from procurement to distribution.
The framework is kept purposely simple in a sense that it utilizes established tech-niques and clear guidance on how to apply it—thus ensuring broad applicability andtransparency. At the same time, the proposed framework’s success does rely on the willing-ness, motivation, and skill set at the company in question (or associated consultants).
The implementation of the proposed framework in the long run requires a multidisci-plinary team, with knowledge of business managers, industrial/manufacturing engineers,and systems engineers, quality managers, etc. Improvement projects should also be sup-ported by a suitable information system to keep all the stakeholders connected, increasedata and information reliability, and optimize the process of decision-making.
Furthermore, how the proposed framework should be implemented depends in a greatway on the characteristics of each company, in terms of its operations and its organizationalstructure. Therefore, it the presented framework is not seen as a closed recipe to follow;rather it is only a guide that should be tailored to the specific context of the companies.However, this also allows the adaptation to a variety of industries and potentially other(manufacturing) processes outside of the AM spectrum.
Knowing that one crucial aspect when a company deals with quality issues is to havereal- and on-time information about the manufacturing system, Industry 4.0 exhibits apotential to support quality management systems. For instance, Industry 4.0 helps inaccelerating data collection via sensor systems and IT/OT integration while reducinghuman error in collecting data. Furthermore, the power of advanced data analytics can
Sustainability 2022, 14, 581 16 of 18
improve the performance of Six Sigma projects. In particular, notable reduction of thetime for the data collection and for conducting the relative analysis of the associatedphenomenon can be achieved. In other words, these technologies allow to accelerate the socalled “filters” to know in depth the process in order to highlight the root-causes whichinfluence variations from the standard and have to be removed to optimize the process [2].
More generally, the current paper contributes to a relatively recent literature streamfocusing on the synergies of agility and sustainability [10,27,28,38,39]. In fact, the papershows how quality management, as a key practice in agile companies, could articulatewith sustainability assessment through coupling DMAIC methodology and KPIs. Thisis evidenced through a single case study in AM domain. In this research orientation,sustainability requirements are not considered as a constraint but rather as an opportunityfor additional value creation [27,28,40]. Customers play a major role at this point as adriving force for increasing companies’ awareness of their CSR and ultimately improvingtheir sustainability on the long run. In this line, strategies coupling customer centricity andsustainability improvement started to gain more attention as a means to ensure sustainedcompetitiveness [28]. Future research in this area could benefit from recent technologicaldevelopment related Industry 4.0 such as big data analytics [41].
6. Conclusions
Sustainability is a generational challenge that encompasses the manufacturing in-dustry. Sustainability performance of manufacturing systems had become in one of themost important tasks that most of the companies across all sectors thrive to implement.Manufacturing companies have to develop innovative solution to reduce their footprintto ensure their alignment with the needs of the future generations. Only selected studieshave been developed that focus on the integration of quality and sustainability in AMto-date. The presented study contributes to bridging this gap by combining a preselectedset of KPIs/indicators with DMAIC and evaluating the implementation in an industrialcase study.
First, after a deep analysis of the most pertinent indicators, this study proposed a setof KPIs in a structured way, stressing that two areas are responsible to lead this phase:Operations and Human Resources Management. Therefore, a well-structured training planningwill help to achieve better results in the outputs of the manufacturing system. This studyhighlights a step-by-step guide to conduct this process and achieve the objective.
Second, this study presents via single case study the practical implementation of theproposed framework by coupling Six Sigma and KPIs that have some mandatory featuressuch as reliability, meaningful to decision making, and easy to understand. The frameworkcould be very useful to improve quality and sustainability by following the DMAIC cycleand using pre-selected KPIs.
Finally, the present study provides a step forward towards the integration of qual-ity and sustainability considerations in AM. This is likely to support production ramp-up due to standardization and improved performance of the processes, taking into ac-count the improvement of the manufacturing systems identifying key areas inside theorganizational structure.
However, the work also has some limitations that the reader needs to carefully considerwhen interpreting the presented results. First and foremost, the case study is based on asingle case study, therefore, the generalizability beyond the case company and the focalprocess (Metal Binder Jetting) cannot be guaranteed. Furthermore, the KPIs and inputfeeding in the analysis is heavily dependent on the qualitative data obtained from thecompany’s stakeholders at this point. In future work, the application of more quantitativemeasures and inclusion of sensor data in the analysis phase is an interesting option.
Author Contributions: Conceptualization, R.R.D. and K.M.; methodology, R.R.D., K.M. and T.W.;validation, R.R.D., K.M. and T.W.; formal analysis, R.R.D., K.M. and T.W.; investigation, R.R.D., K.M.and T.W.; writing—original draft preparation, R.R.D., K.M.; writing—review and editing, R.R.D.,
Sustainability 2022, 14, 581 17 of 18
K.M. and T.W.; supervision, K.M.; project administration, K.M. and T.W.; funding acquisition, K.M.and T.W. All authors have read and agreed to the published version of the manuscript.
Funding: This work is partly supported by Face Foundation through SUSTAIN project (https://sustainproject.wp.imt.fr/, accessed on 25 November 2021), and by Auvergne Rhône Alpes (AURA)Region through VARIETY project (https://variety.wp.imt.fr/, accessed on 25 November 2021).
Informed Consent Statement: Not applicable.
Conflicts of Interest: The authors declare no conflict of interest.
References1. Mittal, S.; Kahn, M.; Romero, D.; Wuest, T. Smart Manufacturing: Characteristics, Technologies and Enabling Factors. Part B J.
Eng. Manuf. 2019, 233, 1342–1361. [CrossRef]2. Dombrowski, U.; Wullbrandt, J.; Krenkel, P. Industrie 4.0 in production ramp-up management. In Proceedings of the 28th
International Conference on Flexible Automation and Intelligent Manufacturing, Columbus, OH, USA, 11–14 June 2018; Volume17, pp. 1015–1022.
3. Abdalla, H.; Fattah, K.P.; Abdallah, M.; Tamimi, A.K. Environmental Footprint and Economics of a Full-Scale 3D-Printed House.Sustainability 2021, 13, 11978. [CrossRef]
4. Milgram, L.; Spector, A.; Treger, M. Plan, Do, Check, Act: The Deming or Shewhart Cycle. In Managing Smart; Milgram, L.,Spector, A., Treger, M., Eds.; Gulf Professional Publishing: Woburn, MA, USA, 1999.
5. De Mast, J.; Lokkerbol, J. An analysis of the Six Sigma DMAIC method from the perspective of problem solving. Int. J. Prod. Econ.2012, 139, 604–614. [CrossRef]
6. Li, T.; Yeo, J. Strengthening the Sustainability of Additive Manufacturing through Data-Driven Approaches and WorkforceDevelopment. Adv. Intell. Syst. 2021, 3, 12. [CrossRef]
7. Huarachi, D.A.R.; Piekarski, C.M.; Puglieri, F.N.; de Francisco, A.C. Past and future of Social Life Cycle Assessment: Historicalevolution and research trends. J. Clean. Prod. 2020, 264, 121506. [CrossRef]
8. Hoogmartens, R.; Van Passel, S.; Van Acker, K.; Dubois, M. Bridging the gap between LCA, LCC and CBA as sustainabilityassessment tools. Environ. Impact Assess. Rev. 2014, 48, 27–33. [CrossRef]
9. Garza-Reyes, J.A.; Romero, J.T.; Govindan, K.; Cherrafi, A.; Ramanathan, U. A PDCA-based approach to Environmental ValueStream Mapping (E-VSM). J. Clean. Prod. 2018, 180, 335–348. [CrossRef]
10. Sagnak, M.; Kazancoglu, Y. Integration of green lean approach with six sigma: An application for flue gas emissions. J. Clean.Prod. 2016, 127, 112–118. [CrossRef]
11. Taddese, G.; Durieux, S.; Duc, E. Sustainability performance indicators for additive manufacturing: A literature review based onproduct life cycle studies. Int. J. Adv. Manuf. Technol. 2020, 107, 3109–3134. [CrossRef]
12. Colorado, H.; Gutierrez, E.; Neves, S. Sustainability of additive manufacturing: The circular economy of materials and environ-mental perspectives. J. Mater. Res. Technol. 2020, 9, 8221–8234. [CrossRef]
13. Yang, H.; Rao, R.; Simpson, T.; Lu, Y.; Witherell, P.; Nassar, A.; Reutzel, E.; Kumara, S. Six-sigma quality management of additivemanufacturing. Proc. IEEE Conf. 2020, 109, 347–376. [CrossRef] [PubMed]
14. Erazo, A.L.; Apaltegui, N.A.; Agote, I.; Zuza, E. A review on recent developments in binder jetting metal additive manufacturing:Materials and process characteristics. Powder Metall. 2019, 62, 24–28.
15. Ziaee, M.; Crane, N.B. Binder jetting: A review of process, materials, and methods. Addit. Manuf. 2019, 28, 781–801. [CrossRef]16. Li, M.; Du, W.; Elwany, A. Metal Binder Jetting Additive Manufacturing: A Literature Review. Manuf. Sci. Eng. 2020, 142, 35–42.
[CrossRef]17. Elmaraghy, W.; Elmaraghy, H.; Tomiyama, T. Complexity in engineering design and manufacturing. Manufaturing Technol. 2012,
61, 793–814. [CrossRef]18. Blackstone, H.; Jonah, J. APICS Dictionary, 13th ed.; The Association for Operations Management: Chicago, IL, USA, 2010; pp.
45–46.19. Kaswan, M.S.; Rathi, R. Green Lean Six Sigma for sustainable development: Integration and framework. Environ. Impact Assess.
Rev. 2020, 83, 106396. [CrossRef]20. Antony, J.; Vijaya, S.; Chad, L.; Elizabeth, C. Lean Six Sigma Sustainability. In The Ten Commandments of Lean Six Sigma; Emerald
Publishing Limited: Bingley, UK, 2019; pp. 83–89.21. Erdil, N.O.; Arani, O.M. Embedding sustainability in lean six sigma efforts. J. Clean. Prod. 2018, 198, 520–529. [CrossRef]22. Albliwi, S.; Antony, J. A systematic review of Lean Six Sigma for the manufacturing industry. Comput. Sci. 2015, 21, 79–84.
[CrossRef]23. Brown, L.R. Building a Sustainable Society; United Nations Fund for Population Activities: New York, NY, USA, 1981; pp. 15–16.24. Krajns, D.; Glavic, P. Indicators of Sustainable Production. Clean Technol. Environ. Policy 2003, 9, 519–549.25. Organization for Economic Cooperation and Development (OECD). OECD Sustainable Manufacturing Toolkit; Directorate for
Science and Technology and Industry (DCTI): Paris, France, 2011; pp. 17–26.
Sustainability 2022, 14, 581 18 of 18
26. Rousseau, M.; Medini, K.; Romero, D.; Wuest, T. Configurators as a mean to Leverage Customer-Centric Sustainable Systems—Evidence from the 3D-Printing Domain. In Proceedings of the 8th CIRP Global Web Conference-Flexible Mass Customization,Leuven, Belgium, 14–16 October 2020; Volume 96, pp. 103–108.
27. Medini, K.; Wuest, T.; Romero, D.; Laforest, V. Integrating Sustainability Considerations into Product Variety and PortfolioManagement. In Proceedings of the 53rd CIRP Conference on Manufacturing Systems, Chicago, IL, USA, 1–3 July 2020; Volume93, pp. 605–609.
28. Pardo-Jaramillo, S.; Muñoz-Villamizar, A.; Osuna, I.; Roncancio, R. Mapping research on customer centricity and sustainableorganizations. Sustainability 2020, 12, 7908. [CrossRef]
29. Jarnil, N.; Gholami, H.; Mat Saman, M.Z.; Streimikiene, D.; Sharif, S. DMAIC-based approach to sustainable value streammapping: Towards a sustainable manufacturing system. Econ. Res.-Ekon. 2020, 33, 331–360.
30. Farrukh, A.; Mathrani, S.; Taskin, N. Investigating the Theoretical Constructs of a Green Lean Six Sigma Approach towardsEnvironmental Sustainability: A Systematic Literature Review and Future Directions. Sustainability 2020, 12, 8247. [CrossRef]
31. Drucker, P.; Maciariello, J. Management; Harper Collins, The Drucker Institute: Claremont, CA, USA, 1999; Volume 91711,pp. 345–352.
32. Azapagic, A.; Perdan, S. Indicators of Sustainable Development for Industry. Process Saf. Environ. Prot. 2000, 78, 243–261.[CrossRef]
33. Carlson, K.; Kavanagh, M. HR metrics and Workforce analysis. In Human Resources Information Systems: Basics, Applications, andFuture Directions; Sage Publications Inc.: Newbury Park, CA, USA, 2008; pp. 166–198.
34. Leffakis, Z.M. A Framework to Identify Best Quality Management Practices and Techniques for Diverse Production Ramp-upEnvironments: Propositions for Future Research. Qual. Manag. J. 2017, 23, 20–44. [CrossRef]
35. Medini, K.; Da Cunha, C.; Bernard, A. Tailoring performance evaluation to specific industrial contexts—Application to sustainablemass customization enterprises. Int. J. Prod. Res. 2015, 53, 2439–2456. [CrossRef]
36. Peng, T.; Chen, C.; Kellens, K. Sustainability of Additive Manufacturing: An overview on its energy demand and environmentalimpact. Addit. Manuf. 2018, 21, 694–704. [CrossRef]
37. Hristov, I.; Chirico, A. The Role of Sustainability Key Performance Indicators (KPIs) in Implementing Sustainable Strategies.Sustainability 2019, 11, 5742. [CrossRef]
38. Geyi, D.G.; Yusuf, Y.; Menhat, M.S.; Abubakar, T.; Ogbuke, N.J. Agile capabilities as necessary conditions for maximisingsustainable supply chain performance: An empirical investigation. Int. J. Prod. Econ. 2020, 222, 107501. [CrossRef]
39. Chambers, J.M.; Wyborn, C.; Klenk, N.L.; Ryan, M.; Serban, A.; Bennett, N.J.; Brennan, R.; Charli-Joseph, L.; Fernández-Giménez,M.E.; Galvin, K.A.; et al. Co-productive agility and four collaborative pathways to sustainability transformations. Glob. Environ.Chang. 2022, 72, 102422. [CrossRef]
40. SUSTAIN. Steering Variety and Complexity in Operations Management towards Sustainability. 2021. Available online: https://sustainproject.wp.imt.fr/ (accessed on 29 November 2021).
41. Raut, R.D.; Mangla, S.K.; Narwane, V.S.; Dora, M.; Liu, M. Big Data Analytics as a mediator in Lean, Agile, Resilient, and Green(LARG) practices effects on sustainable supply chains. Transp. Res. Part E Logist. Transp. Rev. 2021, 145, 102170. [CrossRef]