
Osteoclast-associated intracellular ITAM signalling molecules ...
Upload
hms-harvardCategory
view
0download
0
(189), rs8. [DOI: 10.1126/scisignal.2001699] 4Science SignalingErich E. Wanker (6 September 2011) Martina Zenkner, Jan Timm, Heike E. Assmus, Miguel A. Andrade-Navarro and Arunachalam Vinayagam, Ulrich Stelzl, Raphaele Foulle, Stephanie Plassmann,Transduction
A Directed Protein Interaction Network for Investigating Intracellular Signal`
This information is current as of 6 September 2011. The following resources related to this article are available online at http://stke.sciencemag.org.
Article Tools http://stke.sciencemag.org/cgi/content/full/sigtrans;4/189/rs8
Visit the online version of this article to access the personalization and article tools:
MaterialsSupplemental
http://stke.sciencemag.org/cgi/content/full/sigtrans;4/189/rs8/DC1 "Supplementary Materials"
Related Content
http://stke.sciencemag.org/cgi/content/abstract/sigtrans;2/81/ra40 http://stke.sciencemag.org/cgi/content/abstract/sigtrans;4/189/mr7 http://stke.sciencemag.org/cgi/content/abstract/sigtrans;4/189/eg8
's sites:ScienceThe editors suggest related resources on
References http://stke.sciencemag.org/cgi/content/full/sigtrans;4/189/rs8#otherarticles
This article cites 65 articles, 24 of which can be accessed for free:
Glossary http://stke.sciencemag.org/glossary/
Look up definitions for abbreviations and terms found in this article:
Permissions http://www.sciencemag.org/about/permissions.dtl
Obtain information about reproducing this article:
the American Association for the Advancement of Science; all rights reserved. byAssociation for the Advancement of Science, 1200 New York Avenue, NW, Washington, DC 20005. Copyright 2008
(ISSN 1937-9145) is published weekly, except the last week in December, by the AmericanScience Signaling
on Septem
ber 6, 2011 stke.sciencem
ag.orgD
ownloaded from

R E S E A R C H R E S O U R C E
S Y S T E M S B I O L O G Y
A Directed Protein Interaction Network forInvestigating Intracellular Signal TransductionArunachalam Vinayagam,1*† Ulrich Stelzl,1,2*‡ Raphaele Foulle,1
Stephanie Plassmann,1 Martina Zenkner,1 Jan Timm,1 Heike E. Assmus,3
Miguel A. Andrade-Navarro,1 Erich E. Wanker1‡
stke.sD
ownloaded from
Cellular signal transduction is a complex process involving protein-protein interactions (PPIs) that trans-mit information. For example, signals from the plasma membrane may be transduced to transcriptionfactors to regulate gene expression. To obtain a global view of cellular signaling and to predict potentialsignal modulators, we searched for protein interaction partners of more than 450 signaling-related pro-teins by means of automated yeast two-hybrid interaction mating. The resulting PPI network connected1126 proteins through 2626 PPIs. After expansion of this interaction map with publicly available PPI data,we generated a directed network resembling the signal transduction flow between proteins with a naïveBayesian classifier. We exploited information on the shortest PPI paths from membrane receptors totranscription factors to predict input and output relationships between interacting proteins. Integrationof directed PPI with time-resolved protein phosphorylation data revealed network structures that dynam-ically conveyed information from the activated epidermal growth factor and extracellular signal–regulatedkinase (EGF/ERK) signaling cascade to directly associated proteins and more distant proteins in thenetwork. From the model network, we predicted 18 previously unknownmodulators of EGF/ERK signaling,which we validated in mammalian cell-based assays. This generic experimental and computational ap-proach provides a framework for elucidating causal connections between signaling proteins and facili-tates the identification of proteins that modulate the flow of information in signaling networks.
cien
on September 6, 2011
cemag.org
INTRODUCTION
Studies of cellular signal transduction processes indicate that classicalsignaling pathways are integrated parts of larger molecular interaction net-works (1–3). For instance, receptor tyrosine kinase (RTK) signaling path-ways can signal through extracellular signal–regulated kinases (ERKs), andsignaling by these receptors affects differentiation, proliferation, survival,and migration. Mutations in RTKs or in downstream proteins, such asRas and Raf, lead to abnormal RTK signaling through the ERK pathway,which contributes to the development of disease (4–6). Although the coreelements of the RTK to ERK (RTK-ERK) signaling cascade have been wellcharacterized, functional genomic and proteomic studies have shown thatsignal propagation through this pathway is more complex than previouslythought. In a genome-wide RNA interference (RNAi) study, more than1000 annotated genes, including those encoding the core RTK-ERKpathway components, were identified as influencing ERK phosphorylation(7). A proteomics study demonstrated that >600 proteins are dynamicallyphosphorylated after stimulation of HeLa cells with epidermal growthfactor (EGF) (8), a ligand for the RTK EGF receptor (EGFR). This proteo-mics analysis indicated that in addition to the known EGF and ERKpathway components, such as Ras, the mitogen-activated protein kinase ki-
1AG Neuroproteomics and Computational Biology and Data Mining Group,Max Delbrück Centrum for Molecular Medicine, Robert-Rössle-Strasse 10,D-13125 Berlin-Buch, Germany. 2Otto-Warburg Laboratory, Max Planck Institutefor Molecular Genetics, Ihnestrasse 63-73, D-14195 Berlin, Germany. 3AG Sys-tems Biology and Bioinformatics, Department of Computer Science, University ofRostock, Ulmenstrasse 69, D-18051 Rostock, Germany.*These authors contributed equally to this work.†Present address: Department of Genetics, Harvard Medical School, 77 AvenueLouis Pasteur, Boston, MA 02115, USA.‡To whom correspondence should be addressed. E-mail: [email protected](U.S.); [email protected] (E.E.W.)
www
nase kinase (MAPKKK) Raf, the MAPKKMEK (mitogen-activated or ex-tracellular signal–regulated protein kinase kinase), and the MAPK ERK1, alarge number of other proteins, including transcription factors, cytoskeletalproteins, and ubiquitin ligases, are phosphorylated in response to EGF.These studies reinforce the fact that to comprehensively understand signaltransduction processes in mammalian cells, it is not sufficient to simplyinvestigate the core components of a signaling cascade. Instead, a networkview capturing the dynamics of signaling events is necessary to elucidatemore completely the molecular alterations of activated cells (1, 3).
Large protein-protein interaction (PPI) networks can be generated bysystematic yeast two-hybrid (Y2H) studies (9) or protein complex isolationand mass spectrometry approaches (10). These networks can advance ourunderstanding of how proteins interact to form large molecular assembliesand cellular machines and how the cell responds to changes in the intra-cellular or extracellular environment (2). However, two problems hamperthe use of PPI networks to study signaling networks. PPI networks forsignaling proteins are incomplete (11), and the links in PPI networksgenerated from Y2H, complex isolation, or mass spectrometry lack di-rectionality of signal flow and sign (activation or inhibition) (12). Suchinformation is necessary to obtain a complete understanding of the dy-namics of cellular signaling processes and would strengthen the predic-tions that can be made from PPI network analyses about key steps insignaling processes and their alterations in disease (13–15).
Here, we investigated intracellular signaling networks with a combinedexperimental and computational approach. Using a set of ~450 signaling-related proteins as baits, we identified ~2500 PPIs through repeated Y2Hinteraction screens. By combining this experimentally derived informationwith publicly available interaction data, we constructed a more comprehen-sive PPI network. Because this PPI network lacked information about thedirectionality of signal flow, we developed a bioinformatic strategy for edgedirection prediction and used this to assign the potential direction of signal
.SCIENCESIGNALING.org 6 September 2011 Vol 4 Issue 189 rs8 1

R E S E A R C H R E S O U R C E
flow along protein interactions from membrane receptors to transcriptionfactors. Whereas previous studies combined heterogeneous information,such as gene expression data, to identify potential signaling pathways inPPI data, here, we predicted directed signaling networks solely from thePPI data. We used the directed PPI network model to analyze the dynamicsof protein phosphorylation during EGF signaling, as well as to identify pro-teins that modulate ERK phosphorylation in mammalian cells.
on Septem
ber 6, 2011 stke.sciencem
ag.orgD
ownloaded from
RESULTS
Generating a Y2H PPI network for signaling proteinsWe used a combination of experimental and computational strategies tocreate a PPI network for cellular signaling. We selected 473 human full-length open reading frames (ORFs) (16) on the basis of annotation asmembers of Kyoto Encyclopedia of Genes and Genomes (KEGG) signaltransduction pathways or as direct interaction partners of such proteins(Table 1 and table S1). The ORFs were then used as baits for an interactionmating screen against an array of ~7800 MATayeast prey strains (17). In-teractions were identified by spotting yeast colonies onto selective platesfollowed by b-galactosidase membrane filter assays (18). Screens were re-peated two to six times to detect weak or transient PPIs, such as interactionsbetween kinases and their substrates that are often missed in a single Y2Hscreen (19). We systematically examined ~10million potential interactionsand generated a Y2H-based PPI data set, linking 1126 human proteinsthrough 2626 unique interactions (Fig. 1A, table S2, and fig. S1). Morethan half of the PPIs (1457)were identified twoormore times in the successiveY2H screens, indicating that the interaction data were reliable.
We established benchmarks for Y2H data quality assessment that in-cluded measures for domain-domain interactions, common neighborhood(shared interaction partners), clustering (co-occurrence of interacting pro-teins in network clusters), biological process similarity, localization similar-ity, and coexpression (Fig. 1B and table S2). Different measures forbenchmarking are needed because PPI data are heterogeneous; for example,different interactions exhibit unique biophysical properties. Therefore, dif-ferent benchmarks address different subsets of interactions (20). For eachmeasure, we calculated relative precision values (the fraction of interactionsthat matched those already known; see Materials and Methods for details)with PPIs from the Human Protein Reference Database [HPRD (21)]. As apositive PPI data set, we selected 10,000 interactions that were either re-ported in two independent publications or identified with two different ex-perimental techniques. As a negative set, we selected 10,000 random
S
www
protein pairs for which we did not find any evidence for interaction inthe literature. The precision values for the Y2H PPIs identified in this study(between 0.56 and 0.76) are similar to Y2H interactions collected from var-ious small- and large-scale studies in HPRD [13,798 PPIs from 2625 pub-lications (21)] (Fig. 1B), indicating that high-quality interaction data wereproduced by interaction mating. This result is in agreement with a previousstudy that used empirical measures to show that interactions detected withour screening approach have a precision of ~80% when tested with anindependent PPI assay (19).
Predicting edge directions from PPI dataY2H PPI screens, even when repeated several times, detect only about 10to 20% of all possible biophysical interactions (19). To perform a compre-hensive bioinformatic analysis, we extended the Y2H-based PPI data withpublicly available interaction information. We combined interactions from10 experimental data sets, each containing more than 80 binary PPIs (tableS3), with our Y2H data to create the human PPI network 1 (HPPI1), con-necting 9832 proteins through 39,641 interactions.
Although HPPI1 contains information about key components involvedin cellular signaling pathways (fig. S2), it does not provide informationabout the direction of signal flow. Therefore, we developed a naïveBayesian learning strategy (22, 23) to add directionality to individual PPIs(Fig. 2A and fig. S3). Because a major component of signal flow in cellularsignaling cascades is mediated by PPIs, we hypothesized that the shortestpaths between receptors and transcription factors could be used to predictthe direction of information flow (24, 25). Using human KEGG regulatorypathways, we independently tested this hypothesis and learned that theshortest path connections (SPCs) recall the correct edges from a KEGGPPI network with high frequency at various thresholds (fig. S4).
We computed all 637,099 SPCs between 554 plasma membrane–associated receptors and 1150 transcription factors in the HPPI1 networkwith the direction of signal flow set as from activated membrane receptorsto transcription factors. On average, each interaction was contained in about20 different SPCs. Because some SPCs between certain families of recep-tors and transcription factors were strongly overrepresented (fig. S5), wealso partitioned the data into subsets by grouping membrane receptorsand transcription factors according to 23 and 47 known protein families,respectively. We then constructed a total of 1081 “grouped SPCs,” eachgroup representing the union of all SPCs between closely related membranereceptor to transcription factor signaling paths. Using a naïve Bayesian clas-sifier, we derived the directionality of each interaction from the populationof shortest paths (SPCs and grouped SPCs) in which they were contained.
Table 1. Bait selection. The 473 baits are individually listed in tableS1 with details about their classification. Pathways are as definedTable 1. Bait selection. The 473 baits are individually listed in tableKEGG.
by XXX.1 with details about their classification. Pathways are as defined by
Bait class
BaitsscreenedBaits withinteractions
Number ofinteractions
.SCIENCESIG
Average linkper bait
NALING.org 6 Sep
Literatureoverlap
tember 2011 Vo
Previouslyunknown
interactions (%)
Signal transduction pathways
257 139 1376 9.9 91 93.4 MAPK 77 43 394 9.2 29 92.6 Insulin 44 19 193 10.2 10 94.8 Apoptosis 13 5 44 8.8 12 72.7 Jak_STAT 10 5 40 8.0 1 97.5 Wnt 8 5 107 21.4 1 99.1 Disease pathway 27 18 89 4.9 11 87.6 Metabolic pathway 33 24 379 15.8 37 90.2 Other cellular process 118 82 801 9.8 58 92.8 Unknown biological process 38 23 180 7.8 15 91.7l 4 Issue 189 rs8 2

R E S E A R C H R E S O U R C E
The learning algorithm predicted the causal relationships between interact-ing proteins (edge direction) from eight features on the basis of the shortestPPI path connections and topological network properties (table S4). We
www
on Septem
ber 6, 2011 stke.sciencem
ag.orgD
ownloaded from
trained the classifier by using 828 interactions with a defined direction as-signment from KEGG pathways (26).
We evaluated the predictive performance of the classifier on the basis ofits receiver operating characteristic (ROC) curve, which shows sensitivity asa function of the false-positive rate (1 − specificity) (Fig. 2B). With an areaunder the ROC curve (AUC) of 0.73, the result of a 10-fold cross-validationindicates that the classifier exhibited good performance. We obtained simi-lar performances with other classifying algorithms (table S5), showing thatthe naïve Bayesian classifier was as effective as alternative methods in pre-dicting edge direction. Thus, our studies indicate that potential causal rela-tionships between signaling proteins can be predicted with high precisionand recall (Fig. 2C), suggesting that the naïve Bayesian classifier approachreveals biologically meaningful edge directions.
We applied the trained classifier for predicting edge directions of inter-actions to the HPPI1 data set, using a threshold that results in 70%precision and 69% recall for direction assignment (Fig. 2C, dotted line).We generated a filtered network, termed HPPI2, which contained 32,706directed PPIs connecting 6339 human proteins, representing potential inputand output relationships between interacting proteins that follow the poten-tial information flow from activated membrane receptors to transcriptionfactors (table S6). Because the proteins could not be connected to knownmembrane receptors and transcription factors, 6935 interactions (17.5%) inthe HPPI1 data set remained without direction assignment. Comparison ofthe properties of the HPPI1 and HPPI2 networks showed that both exhibitedknown topological features of biological networks, and these characteristicsdid not differ substantially (fig. S6).
Computational validation of edge directionsTo validate the predictive power of the Bayesian classifier, we tested wheth-er the classifier showed similar performance with an independent dataset containing 475 directed PPIs from 51 annotated signal transductionpathways from the Database of Cell Signaling (27). AUC analysis showedthat the results obtained with independent direction information fromthe Database of Cell Signaling (27) and the KEGG (26) data were sim-ilar (Fig. 2B), confirming that this computational approach revealedmeaningful edge directions.
We examined whether the HPPI2 network with directed PPIs containednetwork motifs characteristic of biological information-processing networks(28). We applied the Mfinder algorithm to find recurring interactionpatterns (29). Particular three-node and four-node motifs, such as thefeed-forward loop or the biparallel motif, were observed more frequently(Z scores >10) in the HPPI2 network than in randomized networks (fig.S7). Such motifs were previously also found in other signal transductionand directed information-processing networks (30), indicating that theHPPI2 network with inferred interaction directions shows similar designprinciples.
We performed a full triad significance profile analysis (31) bycalculating the statistical significance of all 13 possible triad motifs inHPPI2 in comparison to randomized networks with the same size andconnectivity properties (29). We found that three of the triad motifs wereoverrepresented and that five were underrepresented in the HPPI2 network(Fig. 2D). This pattern of both enriched and depleted local structurescorresponds to triad profiles that structurally define a distinct group ofinformation-processing networks, including signal transduction networks(31), thus providing independent validation of our computational networkmodeling strategy.
Analysis of EGF-induced phosphorylation dynamicsThe HPPI2 network defines 1183 input and output relationships for 733proteins that are directly linked to the 28 core components of the
Domain-
domain
interaction
Common
neighborhood
Clustering Biological
process
similarity
Localization
similarity
Co-
expression
0.5
00.5
50.6
00.6
50.7
00.7
5
Precis
ion
Y2H network
Y2H PPIs from HPRD
Random network
A
B
Fig. 1. A Y2H PPI network for signaling proteins. (A) Network view of thePPI data. The network contains 1126 human proteins linked by 2626unique interactions; 94% of these interactions have not been identifiedpreviously. MAPK pathway members are shown as dark blue nodes, an-notated members of other signaling pathways are light blue, and pro-teins that had not been annotated as members of signaling pathwaysare yellow nodes [drawn with Cytoscape (68)]. (B) Confidence profilesfor PPI data sets. Six different measures were used to estimate the rel-ative precision of the Y2H data in comparison to literature-curated Y2HPPIs from HPRD. To obtain relative precision values, we benchmarkedmeasures against a set of 10,000 PPIs in HPRD with either two papersreporting an interaction or two experimental methods detecting a PPI.
.SCIENCESIGNALING.org 6 September 2011 Vol 4 Issue 189 rs8 3

R E S E A R C H R E S O U R C E
EGF/ERK signaling pathway (Fig. 3A). To analyze the potential chain ofevents during EGF-stimulated signal propagation, we integrated the PPIdata with a time-resolved protein phosphorylation data set from a large-scale, mass spectrometry–based proteomics study (8). We mapped 327 of591 proteins that are dynamically phosphorylated or dephosphorylatedupon EGF treatment (EGF-responsive phosphoproteins) in mammaliancells (8) onto the HPPI2 network. We determined whether the proteinswith altered phosphorylation were output nodes that receive signalsfrom the 28 core proteins of the EGF/ERK pathway (edge directionspointing away from the core pathway) or were input nodes that signalto the core pathway (edge directions pointing to the core pathway pro-teins). We found that the number of proteins with altered EGF-inducedphosphorylation was significantly enriched in the set of output nodesbut not in the set of input nodes (Table 2), suggesting that informationflows preferentially along the predicted edge directions from the corepathway proteins to their neighbors in the PPI network. We also ana-
A
Undire
intera
Undirected
HPPI1 network
1 – specif
0.0 0.2 0.4 0
0.0
0.2
0.4
0.6
0.8
1.0
Sen
sitivity
10-fo
(AUC
Sci. S
(AUC
0
–150
150
1 2 3
HPPI2 Network
SIGNAL-TRAN
TRANSC-DRO
TRANSC-SEA-
NEURONS
B
D
sc
ore
Z
www
lyzed the frequency of appearance of proteins with altered phosphoryl-ation (8) in first-, second-, or third-degree neighbors of core pathwayproteins. In contrast to third-degree output neighbors (Table 2), the fre-quency of EGF-responsive phosphoproteins among first- and second-degreeoutput neighbors was significantly higher than expected by chance (P <0.05), supporting the observation that information flows from core path-way proteins through the output edges also to more distant proteins inthe network.
We classified the interacting proteins according to their annotation asKEGG (26) signaling molecules (for example, kinases and transcriptionfactors) and examined enrichment of EGF-responsive phosphoproteins inthese classes. We found that known signaling molecules of other pathwayswere generally enriched in EGF-responsive phosphoproteins in both theinput and the output groups. Kinases with altered phosphorylation wereenriched among first- and second-degree output neighbors, and transcrip-tion factor phosphoproteins were enriched only in the second-degree output
Directed
HPPI2 network
A B
A B?
Features from network topology
and 637,099 shortest path
connections between
receptors to transcription factors
B
cted
ction
Directed
interaction
Naïve Bayesian
classifier
A B
icity
.6 0.8 1.0
ld cross-validation
= 0.73)
ignal. test set
= 0.69)
0
–0.5
0.5
SDUCTION
SOPHILA
URCHIN
20
40
60
80
10
0
Precision
Recall
0
0
20 40 60 80 100
C
ZN
orm
alize
d s
co
re
on Septem
ber 6, 2011 stke.sciencem
ag.orgD
ownloaded from
Fig. 2. Predicting the potential directions ofsignal flow in PPI networks. (A) Inferringedge directions from PPI data. For each in-teraction in the undirected PPI network(HPPI1), a naïve Bayesian classifier wasused to predict the edge direction fromtopological network properties as well asshortest PPI paths connecting membranereceptors and transcription factors. An ac-tivated signaling network (HPPI2) wasassembled from all interactions that had adirection assigned. (B) ROC analysis as anindication of the performance of the naïveBayesian classifier. The red ROC curve rep-resents results from 10-fold cross-validation.The blue ROC curve is calculated for anindependent set of directed signaling inter-actions from the Database of Cell Signaling(27). The discontinuous line represents ran-dom performance in the ROC analysis. (C)Precision-recall curve as an estimation ofthe performance of the naïve Bayesianclassifier. The optimal cutoff on the scoreresulted in a 70% precision and 69% recalland was chosen to construct the HPPI2network (dotted line). (D) Three-node sub-network profiles of the HPPI2, the signal-transduction interactions in mammaliancells from STKE (SIGNAL-TRANSDUCTION),transcription networks that guide develop-ment in fruit fly (TRANSC-DROSOPHILA),endomesoderm development in sea urchin(TRANSC-SEA-URCHIN), and synaptic con-nections between neurons in Caenorhabditiselegans (NEURONS). The Z scores of eachtriad from HPPI2 were compared against thenormalizedZscoresof information-processingnetworks [reference triad significance pro-files are taken from (31)].
?
Direction of signal flow ?A
4 5 6 7 8 9 10 11 12 13
Subgraphs
.SCIENCESIGNALING.org 6 September 2011 Vol 4 Issue 189 rs8 4

R E S E A R C H R E S O U R C E
www
on Septem
ber 6, 2011 stke.sciencem
ag.orgD
ownloaded from
nodes (table S7). This suggests that activation of the core pathway influencesother pathways and various cellular processes through phosphorylation ofa subset of direct (first degree), as well as indirect (second degree), corepathway neighbors.
We used the network model to analyze the number of EGF-responsivephosphorylation sites in direct and indirect neighbors of the core pathwayproteins. Proteins phosphorylated at a single site were frequently foundamong first-degree core pathway neighbors, whereas proteins phosphory-lated at more than one site were significantly enriched among second-degree output neighbors (Fig. 3Band tableS8). Togetherwith the observationthat first- and second-degree core pathway neighbors are connected with alarger number of output links than core pathway proteins are connected withfirst-degree neighbors, this suggests that core pathway proteins initially acti-vate a relatively small number of directly linked kinases,which then activate alarger number of proteins that are indirectly linked to the core pathway pro-teins. In this analysis, we can differentiate between first-order and second-order phosphorylation events, supporting the observation that second-sitephosphorylation occurs frequently atmore distant proteins receivingmultipleinputs from the activated core pathway (32, 33).
To investigate the dynamics of EGF-mediated signal propagation, weanalyzed time-resolved protein phosphorylation data (8) by annotatingthe proteins according to the highest degree of phosphorylation after 1,5, 10, or 20 min of EGF stimulation and then determining their frequencyof appearance among first-, second-, and third-degree core pathwayneighbors. We found that proteins phosphorylated 5 and 10 min afterEGF stimulation were significantly enriched among first-degree corepathway output neighbors, whereas proteins phosphorylated after 10 and20 min were detected significantly more often among second-degree outputneighbors (Fig. 3C and table S9). Thus, this correlation confirms that directneighbors of the activated pathway are phosphorylated faster after EGFstimulation than indirect neighbors.
Notably, such an effect was not observed when the phosphorylation ofupstream and downstream core pathway interacting proteins was analyzedin a time-dependent manner. We investigated whether phosphorylation ofnetwork proteins correlated with the activation of core pathway membersafter EGF stimulation. The 28 core pathway proteins were divided into fourgroups representing upstream to downstream members of the pathway: (i)receptor and adaptor proteins; (ii) Ras, Raf, and MEK; (iii) ERK, Mnk, andRsk; and (iv) transcription factors. The frequency of phosphorylation ofdirect and indirect neighbors of proteins belonging to these groups was ana-lyzed in a time-dependent manner with the EGF-responsive phosphoproteindata. We found that neighbors of upstream core pathway proteins were notphosphorylated significantly faster upon EGF stimulation than were
GRB2
EGFR
SOS1
SOS2
RRAS
RRAS2
NRAS
KRAS
MRAS
HRAS
RAF1
BRAF
MOS
MAP2K1
MAP2K2
MAPK1
MAPK3
RPS6KA1
RPS6KA2
RPS6KA3
RPS6KA6
MKNK1
MKNK2
ELK1
ELK4
ATF4
MYC
SRF
EGF/ERK
core-pathway
First-degree
output neighbor
Second-degree
output neighbor
Enrichment of single-site
EGF-responsive phosphoproteins
(P = 0.001)
Enrichment of multiple-site
EGF-responsive phosphoproteins
(P = 0.008)
First
output neighbors
-degree Second-
output neighbors
degree
0' 1'
5'
10'
20'
EGF
stimulation
time
Time point
of maximal
phosphorylation
Time point
of maximal
phosphorylation
0' 1'
5'
10'
20'
EGF
stimulation
time
A
B
C
Fig. 3. Integration of directed PPIs with dynamic protein phosphorylationdata. (A) A network view of core pathway EGF/ERK proteins with 733direct-interacting partners. Dark gray nodes represent the 28 knownEGF/ERK core pathway proteins (labeled with their Entrez Official GeneSymbols) from EGFR downstream in a counterclockwise arrangement.Blue and green nodes correspond to potential input and output nodes,respectively, that are linked to the core pathway. Proteins that are bothinput and output nodes are shown in purple. (B) Schematic representa-tion of the EGF-responsive phosphoproteins in data sets of first- andsecond-degree core pathway neighbors. Arrows indicate that the num-ber of output relationships increases with the distance to the corepathway. (C) Schematic representation showing the relationship amongthe kinetics of EGF-responsive phosphorylation and the distance fromthe core EGF/ERK core pathway proteins.
.SCIENCESIGNALING.org 6 September 2011 Vol 4 Issue 189 rs8 5

R E S E A R C H R E S O U R C E
on Septem
ber 6, 2011 stke.sciencem
ag.orgD
ownloaded from
neighbors of downstream proteins (fig. S8 and table S10), indicating thattransmission of information through the core pathway is not resolvable withthe available proteomics data covering time points of 1, 5, 10, and 20 minafter EGF stimulation (5, 8).
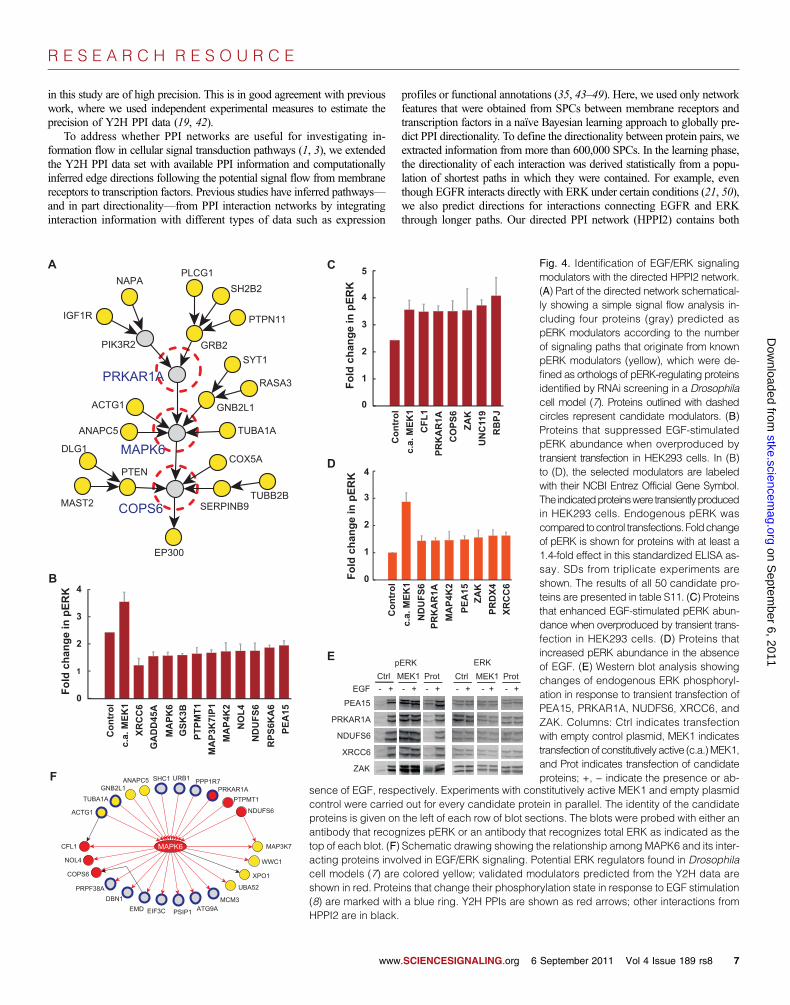
Predicting potential modulators of phosphorylatedERK from the directed PPI networkUsing the input- and output-node specifications in the HPPI2 network, weinvestigated whether potential modulators of EGF/ERK signaling can bepredicted. In a genome-wide RNAi screen, more than 1000 Drosophilaproteins were identified as modulators of phosphorylated ERK (pERK)(7). We mapped 337 from the set of 606 human orthologs of those mod-ulators onto the HPPI2 network and used these as source nodes in asimple flow model (34, 35) to predict potential previously unknown mod-ulators downstream of known pERK modulators in the directed HPPI2network (Fig. 4A; see Materials and Methods). With this approach, weprioritized 50 proteins (table S11) mostly on the basis of our Y2H PPIdata set and subsequently tested their activity in cell-based EGF/ERK sig-naling assays.
To investigate whether the selected proteins influenced EGF/ERKsignaling under conditions where the core pathway is activated withEGF, we transiently transfected human embryonic kidney (HEK) 293 cellswith constructs encoding the potential modulator proteins, treated the cellswith EGF, and, after 10 min, quantified pERK in cell extracts with a stan-dardized enzyme-linked immunosorbent assay (ELISA) (36). We foundthat 11 of the 50 selected proteins significantly reduced EGF-mediatedERK phosphorylation in HEK293 cells (Fig. 4B and table S11), whereas6 proteins, similar to constitutively activated MEK1, increased ERK phos-phorylation (Fig. 4C). Some of the proteins exhibiting a strong inhibitoryeffect, such as GADD45A and MAP3K7IP1, had not been previouslylinked to EGF/ERK signaling [candidate proteins are named according toNational Center for Biotechnology Information (NCBI) Entrez OfficialGene Symbol].
We assayed whether transient overproduction of the selected target pro-teins stimulated ERK phosphorylation in the absence of EGF. We used con-stitutively activated MEK1 to promote ERK phosphorylation in HEK293cells as a positive control, and we observed an increase in pERK when theproteins PRDX4, XRCC6, NDUFS6, MAP4K2, PEA15, PRKAR1A, orZAK were overproduced (Fig. 4D). PRKAR1A and ZAK also increasedpERK abundance in the presence of EGF, whereas XRCC6, NDUFS6,and PEA15 showed an inhibitory effect in the presence of EGF. In agree-ment with this observation, it has been reported that PEA15 preferentiallyinteracts with and sequesters pERK in the cytoplasm of mammalian cells(37). The effects of a subset of the previously unknownmodulators of ERK
www
phosphorylationwere confirmed by immunoblottingwith antibodies recog-nizing either total ERK1 and ERK2 or pERK1 and pERK2 (Fig. 4E),supporting the results obtained with ELISA assays.
Selecting 50 proteins at random from either the list of proteins in thedirected network, the starting baits, the interacting baits, or the interactingpreys would on average yield 2.6 (5.3% of the selected proteins), 4.3(8.6%), 4.2 (8.4%), or 3.1 (6.2%) of known pERKmodulators, respectively.Thus, the detection of 18 of 50 (36%) pERK modifiers with our cell-basedassays indicates that network-based strategies can be useful for predictingmodulators of cell signaling proteins.
Our cell-based assays revealed that overproduction of MAPK6, anatypical chordate-specific MAPK of largely unknown function (38, 39),significantly reduced ERK phosphorylation after EGF activation (Fig.4B), suggesting that MAPK6 is linked to EGF/ERK signaling in mamma-lian cells. Further network analysis revealed 151 interaction partners forMAPK6, a large fraction of which (24 proteins) was also identified as po-tential modulators of ERK signaling (Fig. 4F). We found that six MAPK6interaction partners influenced ERK phosphorylation when overproduced,whereas another study showed that eight proteins influence the signalingpathway when their concentrations were reduced with small interferingRNA (siRNA) (7). Collectively, our data and the previous data (summarizedin table S12) provide evidence that MAPK6 and its interacting partnersmodulate EGF/ERK signaling in mammalian cells.
DISCUSSION
We present a human PPI data set of ~2600 interactions, which was gener-ated by Y2H matrix screening of 450 signaling-related bait proteins against~7800 prey proteins. Our interaction data are largely complementary to aY2H PPI network for MAPKs and associated proteins (40), indicating thatPPI data for signaling proteins are still incomplete, and additional studieswith different genetic as well as biochemical methods are required to obtaina more comprehensive picture of protein associations involved in signaltransduction. However, our investigations also indicate that the reliabilityof the Y2H PPIs identified in this study is high, suggesting that they area valuable resource for further detailed functional experiments as well aspredictive network analyses (2, 9).
For benchmarking, we used six independent features that were previous-ly applied to assign confidence scores to PPIs (20, 41). More than 90% ofthe interactions scored positive for at least one of the six features, such ascommon network neighborhood, localization similarity, or coexpression(table S2). The benchmarking of our interaction data set in comparisonto a filtered literature-curated data set showed that the Y2H PPIs identified
Table 2. EGF/ERK signal flow in the HPPI2 network. Proteins in theEGF-responsive phosphoprotein data set were mapped to first-,second-, and third-degree neighbors of the EGF/ERK core pathway.The proteins were further grouped into input or output neighbors onthe basis of the edge direction relative to the core pathway. For eachset of neighbors, the total number of nodes (neighborhood size) and
number of mapped proteins were computed. We generated 1000 ran-dom sets with the same number of nodes as the respective neighbor-hood size. Enrichment was measured by comparing the data sets ofassociated proteins with the 1000 equal-size random sets of simulatedinteracting proteins (P < 0.05). The mean, SD, and P values werecalculated on the basis of the overlap within each random set.
Data set
Degree ofseparationNeighborsize
Input neighbors
.SCIENC
P
ESIGNAL
Output neighbors
ING.org 6 September 2011
Randommean ± SD
Vol 4 Issue 18
P
Phospho-proteinsRandommean ± SD
Neighborsize
Phospho-proteins
EGF-responsivephosphoproteins(327 proteins)
First
424 26 22 ± 4.3 0.21 436 39 23 ± 4.4 <0.001 Second 1875 102 96 ± 7.9 0.25 1963 121 102 ± 8.3 0.016 Third 2254 123 116 ± 8.2 0.221 1622 90 84 ± 7.6 0.2749 rs8 6
R E S E A R C H R E S O U R C E
in this study are of high precision. This is in good agreement with previouswork, where we used independent experimental measures to estimate theprecision of Y2H PPI data (19, 42).
To address whether PPI networks are useful for investigating in-formation flow in cellular signal transduction pathways (1, 3), we extendedthe Y2H PPI data set with available PPI information and computationallyinferred edge directions following the potential signal flow from membranereceptors to transcription factors. Previous studies have inferred pathways—and in part directionality—from PPI interaction networks by integratinginteraction information with different types of data such as expression
0
1
2
3
4
Fo
ld
ch
an
ge in
p
ER
K
XRCC6
PRKAR1A
Ctrl M
p
EGF - +
PEA15
NDUFS6
ZAK
0
1
2
3
4
Co
ntro
l
Fo
ld
ch
an
ge in
p
ER
K
0
1
2
3
4
Co
ntro
l
c.a. M
EK
1
XR
CC
6
GA
DD
45A
MA
PK
6
GS
K3B
PT
PM
T1
MA
P3K
7IP
1
MA
P4K
2
NO
L4
ND
UF
S6
RP
S6K
A6
PE
A15
Fo
ld
ch
an
ge in
p
ER
K
B
D
E
F
www
profiles or functional annotations (35, 43–49). Here, we used only networkfeatures that were obtained from SPCs between membrane receptors andtranscription factors in a naïve Bayesian learning approach to globally pre-dict PPI directionality. To define the directionality between protein pairs, weextracted information from more than 600,000 SPCs. In the learning phase,the directionality of each interaction was derived statistically from a popu-lation of shortest paths in which they were contained. For example, eventhough EGFR interacts directly with ERK under certain conditions (21, 50),we also predict directions for interactions connecting EGFR and ERKthrough longer paths. Our directed PPI network (HPPI2) contains both
Co
ntro
l
c.a. M
EK
1
CF
L1
PR
KA
R1A
CO
PS
6
ZA
K
UN
C119
RB
PJ
EK1 Prot
ERK
- + - + - + - + - +
Ctrl MEK1 Prot
ERK
c.a. M
EK
1
ND
UF
S6
PR
KA
R1A
MA
P4K
2
PE
A15
ZA
K
PR
DX
4
XR
CC
6
.SCIENCESIGNALING.org 6
on Septem
ber 6, 2011 stke.sciencem
ag.orgD
ownloaded from
Fig. 4. Identification of EGF/ERK signalingmodulators with the directed HPPI2 network.(A) Part of the directed network schematical-ly showing a simple signal flow analysis in-cluding four proteins (gray) predicted aspERK modulators according to the numberof signaling paths that originate from knownpERK modulators (yellow), which were de-fined as orthologs of pERK-regulating proteinsidentified by RNAi screening in a Drosophilacell model (7). Proteins outlined with dashedcircles represent candidate modulators. (B)Proteins that suppressed EGF-stimulatedpERK abundance when overproduced bytransient transfection in HEK293 cells. In (B)to (D), the selected modulators are labeledwith their NCBI Entrez Official Gene Symbol.The indicatedproteinswere transientlyproducedin HEK293 cells. Endogenous pERK wascompared tocontrol transfections. Foldchangeof pERK is shown for proteins with at least a1.4-fold effect in this standardized ELISA as-say. SDs from triplicate experiments areshown. The results of all 50 candidate pro-teins are presented in table S11. (C) Proteinsthat enhanced EGF-stimulated pERK abun-dance when overproduced by transient trans-fection in HEK293 cells. (D) Proteins thatincreased pERK abundance in the absenceof EGF. (E) Western blot analysis showingchanges of endogenous ERK phosphoryl-ation in response to transient transfection ofPEA15, PRKAR1A, NUDFS6, XRCC6, andZAK. Columns: Ctrl indicates transfectionwith empty control plasmid, MEK1 indicatestransfection of constitutively active (c.a.)MEK1,and Prot indicates transfection of candidateproteins; +, − indicate the presence or ab-
5A C
sence of EGF, respectively. Experiments with constitutively active MEK1 and empty plasmidcontrol were carried out for every candidate protein in parallel. The identity of the candidateproteins is given on the left of each row of blot sections. The blots were probed with either anantibody that recognizes pERK or an antibody that recognizes total ERK as indicated as thetop of each blot. (F) Schematic drawing showing the relationship among MAPK6 and its inter-acting proteins involved in EGF/ERK signaling. Potential ERK regulators found in Drosophilacell models (7) are colored yellow; validated modulators predicted from the Y2H data areshown in red. Proteins that change their phosphorylation state in response to EGF stimulation(8) are marked with a blue ring. Y2H PPIs are shown as red arrows; other interactions fromHPPI2 are in black.
September 2011 Vol 4 Issue 189 rs8 7

R E S E A R C H R E S O U R C E
on Septem
ber 6, 2011 stke.sciencem
ag.orgD
ownloaded from
shortcuts, such as the EGFR to ERK relationship, and longer paths, such asinteractions from SHC to GRB2 to SOS1 to HRAS, which are in agree-ment with the known MAPK signal flow (51). Thus, our computationalstrategy does not define a single signaling path with a certain biologicalfunction but predicts directed PPIs that might play a role in various cellularpathways and processes. Once the directionality is defined for each inter-action, the directed network can be used as a resource to extract flow pathsor signaling pathways by applying additional constrains. Although the in-teractions lack sign (12), the directed PPI network supports variousmodeling strategies and improves the power of predictions made fromPPI network analyses (13, 14, 52).
Changes in protein phosphorylation are crucial for signal transductionand phenotypic alterations in mammalian cells (53–55). We therefore inves-tigated whether our PPI network with computationally predicted linkdirections enabled analysis of the dynamics of protein phosphorylation incellular signaling processes. We integrated the directed PPI informationwith experimental phosphoproteomics data from EGF-stimulated mamma-lian cells (8) and examined the potential flow of information by monitoringthe phosphorylation state of direct and indirect neighbors of EGF/ERK corepathway members. We observed that an EGF-triggered signal spreads fromthe activated EGF/ERK core signaling pathway through direct and indirectoutput links to more distant proteins in the network. With this analysis, wecould distinguish between first- and second-order events in the signal trans-duction pathway, as well as resolve protein phosphorylation events in atime-dependent manner (Fig. 3 and Table 2). The results suggested thatearly first-order phosphorylation events represent specific signals due todirect interactions with pathway members, whereas later, second-orderevents are less specific due to activation of a multitude of different kinases(32, 33). Therefore, we propose that on the basis of our static, directed PPInetwork, sequential phosphorylation events can now be predicted in the PPInetwork. This may enhance our understanding of how the information floworiginating from an activated cellular signaling cascade leads to certaincellular phenotypes.
We also identified potential modulators of ERK phosphorylation bycombining the directed PPI information with knowledge from knownpERK modifiers identified previously in a Drosophila cell model (7).By following the signal flow from human orthologs of known pERKmodulators along the predicted directions through the edges in the PPInetwork, we inferred previously unknown candidate pERK modulators.We then validated this finding by analyzing the effects of individual over-expression of 50 candidate human proteins on endogenous ERK phospho-rylation in cultured cells. These cell-based studies showed that 36% (18 of50) of the predicted potential modifier proteins altered ERK phosphoryl-ation, and this success rate was substantially higher than that observedwith random selections of proteins of equal-size groups (<9%). Althoughin many cases, overproduction of proteins causes phenotypic effects thatare different from those of gene knockdown studies, there is no obviousreason why the overall success rate between unbiased under- andoverproduction screens should differ (56). In a genome-wide screen inyeast, overproduction of <15% of proteins resulted in a growth defect,and only 3.5% of the proteins produced morphological changes associatedwith this phenotype (57). In another protein overproduction study, only1.6% of all yeast proteins showed a growth defect upon moderate geneoverexpression (58). In a screen of ~1000 genes in the developing eyeof Drosophila, overexpression of less than 6% of the genes produced aphenotype (59). These rates are comparable to RNAi knockdown or genedeletion screens (60). Our data thus indicate that a network-based predic-tion of modifier proteins has a higher success rate than can be achievedwith unbiased genome-wide protein overproduction or RNAi knockdownscreens.
www
Here, we identified human PPIs that are relevant for signal transductionby systematic Y2H interaction screening, and then, after integrating thesedata with others, we assigned probable signaling directions to otherwiseundirected protein interactions, thus constructing a directed PPI networkmodel for further bioinformatic investigations as well as for hypothesis gen-eration. We suggest that our network strategy is a step toward the generationof more comprehensive, dynamic cellular signaling networks, which willenable better understanding of how receptor-mediated signal flow connectsproteins in core signaling pathways with the various other cellular machinesand processes.
MATERIALS AND METHODS
Y2H analysisY2H interaction screening was performed as described previously (17, 18).In brief, the L40ccU MATa yeast strain was individually transformed withplasmids (pBTM116-D9) encoding bait proteins (table S1) and tested forautoactivation of reporter genes after mating with a MATa strainproducing a control Gal4-activation domain fusion protein. Eight clonesproducing baits that did not self-activate were pooled and mated with thearrayed library of prey L40cca MATa yeast strains. Our existing preylibrary (17) was extended by subcloning ~2000 additional complementaryDNAs (cDNAs) in a Gal4-activation domain Y2H vector (pACT4). Intotal, prey strains encoding ~7800 human proteins were tested in thisscreen for interaction. Positive clones were identified by growth on selec-tive plates (-Leu-Trp-Ura-His), lacZ reporter gene activation assays, orboth. Subsequently, preys identified in the pooled mating screens wereindividually tested for interactions with individual baits in a second matingassay with fresh yeast cells. The two-step interaction mating screen wasrepeated two to six times for different baits (table S2) to identify weakinteractions, which are not well sampled in single Y2H screens (19). Inparticular, we repeatedly screened batches of individual baits two, three, orfour times. A subset of proteins was screened even more often because theproteins were represented with two different clones in either the bait set orthe prey matrix (table S2).
Quality assessment of Y2H dataThe frequency of occurrence of six features (domain-domain interactions,common neighborhood, clustering, biological process similarity, cellular lo-calization similarity, and coexpression) in our Y2H PPI data was measured,and precision was calculated for each measure with positive and negativereference PPI sets, each containing 10,000 PPIs. The positive set consists ofPPIs from HPRD (21) that were either detected by two different assays orreported in two different publications. The negative set contains randomlyselected PPI pairs that had not been reported previously. Raw scores wereconverted into relative precision scores as follows: PSBP = PBP/(PBP +NBP), with PSBP being the precision score corresponding to the raw score,PBP being the number of PPIs in the positive set above the given raw scorethreshold, and NBP being the number of PPIs in the negative set above theraw score threshold. Relative precision values for each interacting pair andeach measure can be found in table S2.
Protein domains were annotated with the InterPro database (version26.0), and all potential domain-domain interactions in the Y2H data werecounted when they matched interacting domain pairs in the DOMINEdatabase (version 1.1) (61). Domain-domain interaction information fromthe DOMINE database includes known and predicted interacting domain-domain pairs. Common neighborhood measure refers to the number ofcommon neighbors (defined as shared direct-interacting partners) in HPPI1between two interacting proteins. The HPPI1 data set was clustered with
.SCIENCESIGNALING.org 6 September 2011 Vol 4 Issue 189 rs8 8

R E S E A R C H R E S O U R C E
on Septem
ber 6, 2011 stke.sciencem
ag.orgD
ownloaded from
the program Cfinder, which uses the clique percolation method (62). Foreach interacting pair, we counted the number of network clusters that con-tained the two proteins. To determine whether interacting proteins in thenetwork were clustered according to their molecular function (biologicalprocess similarity score), we analyzed for every pair of interacting proteinsall of their assigned “biological process” Gene Ontology (GO) terms in the(GO Annotation database) to identify the most detailed level of shared GOterm, that is, the common parent nodes that have the maximum distancefrom the root GO nodes. The distance is then used as a raw score of biolog-ical process similarity (41). We obtained protein localization informationfrom the LOCATE database (human version 6), which is mapped to GOcellular component annotation (63). To measure the localization similarity,we used the deepest level of shared GO term (see biological process simi-larity score). We obtained the expression similarity data from COXPRESdb(human version 6) (64). COXPRESdb provides mutual rank and Pearson’scorrelation coefficient values for all possible gene pairs (data available for19777 human genes). We used Pearson’s correlation coefficient values asthe expression similarity score.
Extraction of SPCs and its assessment for the relevancein signaling networksThe SPCs between membrane receptors and transcription factors have beenproven useful in the construction of receptor signaling pathways (24, 25).We first systematically analyzed the relevance of SPCs in PPI networks forcellular signal transduction cascades with KEGG pathway data only. Wecollected all PPIs from human KEGG pathways [PPrel in KEGG (26)]and merged them to create one large KEGG PPI network. The KEGGPPI network consists of 7963 interactions between 1744 proteins, 281 ofwhich are membrane receptors and 92 are transcription factors. Using abreadth-first search algorithm (65), we then extracted all SPCs between ev-ery pair of membrane receptor and transcription factor, resulting in 25,852SPCs from the KEGG PPI data. A total of 1961 KEGG-SPCs could becompared with known KEGG pathways, because both the receptor andthe transcription factor of the KEGG-SPCs were present in the same KEGGpathway. We assessed the fraction of overlapping edges between theKEGG-SPCs and known KEGG pathways in comparison to 100 randomSPCs. For random SPCs, edges were scrambled, preserving the number andthe degree of the nodes. In comparison to randomized SPCs, the approachrecalls the correct edges from the KEGG PPI network with higher fre-quency at various thresholds (fig. S3). This independent analysis indicatesthat SPCs correlate well with known signaling pathways and can thusbe potentially useful to make edge direction assignments in undirectedPPI networks.
HPPI1 combines the Y2H PPI data with other sets of experimental-ly determined human protein interactions (table S3) and contains 39,641interactions between 9832 proteins. This includes 576 plasma membrane–localized receptor proteins (collected from Human Plasma MembraneInteractome project) (66) and 1166 transcription factors (67). Using abreadth-first search algorithm (65), we computed all possible shortestpaths between a receptor and a transcription factor. We constructed637,099 SPCs between 554 membrane receptors and 1150 transcriptionfactors (fig. S4). These SPCs connect 6369 proteins through 33,857 inter-actions. Similar to the characteristic path length of the HPPI1 (4.14), theaverage length of the SPCs is 4.12. However, we found that SPCs for cer-tain families of membrane receptors (66) and transcription factors (67)were highly overrepresented (fig. S5). For example, 36,503 SPCs wereconstructed between the seven-transmembrane receptor family and thezinc finger domain–containing transcription factor family. In contrast, onlya single SPC was constructed between the Netrin receptor family and theGlia cell missing transcription factor family. To overcome such biases, we
www
partitioned the data set into subsets grouping membrane receptors andtranscription factors according to 23 and 47 known protein families, re-spectively. A total of 1081 grouped SPCs were constructed as a unionof the SPCs connecting receptors and transcription factors of the samefamilies. Each group thus represents closely related membrane receptorto transcription factor signaling paths. Individual interactions contributeto 19 SPCs on average. Within every linear SPC and grouped SPC, theedge directions of the contained interactions were set as from membranereceptor to transcription factor.
Predicting causal interactions with a naïveBayesian classifierTo predict causal relationships between interacting proteins (edge direc-tions) in HPPI1, we considered each interaction as two different instances,where the interaction between A and B is defined twice, as A→B andB→A. We used the naïve Bayesian classifier available at Weka, version3.4.11 (22, 23), for classification. As a training set, we selected 828 inter-actions from the SPCs that overlap with the KEGG pathways (26). Fromthese interactions, we created 1656 instances. The instances were thenclassified as “positive” or “negative” on the basis of their agreement withthe directions in the KEGG database. In case of bidirectional interactions,both instances were labeled as positive.
We then computed eight different features from the SPCs, groupedSPCs, and network topological properties (table S4). The features are fur-ther discretized with a supervised discretization method that is binningguided by the information in the training data. Using a leave-one-out ap-proach, we tested the classifier’s performance with 10-fold validation. Weestimated the performance of the classifier with a ROC analysis calculat-ing sensitivity [TP/(TP + FN)] and specificity [TN/(TN + FP)] with dif-ferent cutoff values on the Bayesian score (Fig. 1B). For the prediction, weused the classifier that was trained with the complete training set includingall 1656 instances. The precision [TP/(TP + FP)] and recall [= sensitivity,TP/(TP + FN)], which are measures that do not require a true negative set(TN), were computed at different cutoff values on the Bayesian score. Toconstruct the HPPI2 network (Fig. 1C), we chose 70% precision and 69%recall. It contains 32,706 PPIs with direction assignments connecting 6339human proteins (table S6).
Network motif analysisTo find the network motifs in HPPI2, we used the Mfinder program (29).This software uses a directed network as input and detects network motifsthat occur more often in the real network than in random networks with thesame size and connectivity properties. We searched for the significantlyenriched network motifs with default cutoffs in the HPPI2 compared to100 random networks. For the triad significance analysis, we used the Zscore values obtained from the Mfinder program.
Network dynamicsWe analyzed the dynamics of signal propagation with a phosphorylatedprotein data set (8) that measured the phosphorylation status of proteinsat different time points, such as 0, 1, 5, 10, and 20 min after EGF stimu-lation. These data contain 883 phosphorylation sites in 591 proteins thatexhibited a change in response to EGF treatment over the time period of20 min. Three hundred and twenty-seven proteins were present in theHPPI2 network and were grouped according to the time point when thechanging phosphorylation sites were maximally phosphorylated. Proteinswith multiple sites phosphorylated upon EGF treatment could be part ofmore than one time-responsive data set. Enrichment was measured against1000 equal-size protein sets picked randomly from the respective group ofinteracting proteins (P < 0.05).
.SCIENCESIGNALING.org 6 September 2011 Vol 4 Issue 189 rs8 9

R E S E A R C H R E S O U R C E
on Septem
stke.sciencemag.org
Dow
nloaded from
Signal flow analysis to infer ERK modulatorsTo predict potential pERK modulators, we traced the downstream signalingpaths of 337 human orthologs of known Drosophila pERK modulatorswith a signal-flow model. To rank the downstream nodes, the model as-sumed a signal flow that originates from each of the known pERK regula-tors and flows through the output edges. The signal coming from the inputnodes is equally distributed among all connected output nodes. Thus, theflow model propagates a signal originating from each of the known pERKmodulator proteins through the output edges in HPPI2 for three consecutivesteps with a breadth-first search algorithm (65). The downstream nodeswere ranked according to the amount of signal that they received from thevarious source nodes. Potential signal flow pathswere inferred by connectingthe nodes with high signal flow. For experimental validation, we selectedhigh-scoring candidate proteins for which full-length cDNAswere available.
ELISA and Western blot–based pERK assaysWe established an ELISA-based assay to test the effect of selected proteinson phosphorylation of endogenous ERK in HEK293 cells (36). After tran-sient production of FLAG-tagged target proteins in HEK293 cells for48 hours, cells were serum-starved overnight and then treated with EGF(150 ng/ml) for 10 min. Cells were fixed with 5% paraformaldehyde inmicrotiter plates and permeabilized for 10 min with 100% MeOH at−20°C. Cells were blocked in 5% bovine serum albumin, immunolabeledwith an antibody that recognizes pERK (Cell Signaling #9101, 1:200), andthen stained with 4′,6-diamidino-2-phenylindole (DAPI) (1:200) and asecondary Alexa-conjugated antibody (Alexa Fluor 594 goat anti-rabbit an-tibody, Molecular Probes #A11012, 1:500). The fluorescence (Alexa; exci-tation, 590 nm; emission, 617 nm) was measured in a fluorescence platereader and normalized to cell number (DAPI; excitation, 358 nm; emission,461 nm). Each experiment was performed in triplicates. Data are presentedin table S11.
For Western blot analysis, cells were lysed after EGF treatment for20 min on ice in Hepes buffer containing a phosphatase inhibitor cocktail(Sigma). Soluble extracts were prepared, and pERK (Cell Signaling,#9101, 1:1000) and ERK (Cell Signaling, #9102, 1:1000) proteins weredetected by SDS–polyacrylamide gel electrophoresis (SDS-PAGE) andimmunoblotting.
ber 6, 2011SUPPLEMENTARY MATERIALSwww.sciencesignaling.org/cgi/content/full/4/189/rs8/DC1Fig. S1. Topological properties of the Y2H PPI network.Fig. S2. Gene Ontology annotation of interacting proteins.Fig. S3. Predicting causal interactions using a naïve Bayesian classifier.Fig. S4. Extracting canonical signaling pathways as shortest path connections (SPCs)from a KEGG PPI network.Fig. S5. Distribution of SPCs in groups of SPCs that connect receptor and transcriptionfactor families (grouped SPCs).Fig. S6. Topological comparison of the undirected HPPI1 and the directed HPPI2.Fig. S7. Enriched motifs identified with Mfinder.Fig. S8. Dynamics of EGF/ERK signal flow from receptor to transcription factors.Table S1. Baits selected for Y2H screening.Table S2. Y2H interactions in the Y2H PPI network.Table S3. Human PPI interaction data sets used to construct the HPPI1 network.Table S4. Features used by a naïve Bayesian classifier to predict edge directions.Table S5. Comparison of different classifier performance for edge direction prediction.Table S6. Directed interactions in HPPI2 network.Table S7. EGF/ERK signal flow mediated by different functional proteins.Table S8. Enrichment of single- and multisite EGF-responsive phosphoproteins.Table S9. Dynamics of EGF/ERK signal flow in HPPI2 network.Table S10. Dynamics of EGF/ERK signal flow from receptor to transcription factors.Table S11. Proteins tested in an ERK phosphorylation ELISA assay.Table S12. Characterization of MAPK6-interacting proteins.References
www.
REFERENCES AND NOTES1. A. Friedman, N. Perrimon, Genetic screening for signal transduction in the era of
network biology. Cell 128, 225–231 (2007).2. T. Ideker, R. Sharan, Protein networks in disease. Genome Res. 18, 644–652 (2008).3. C. Jørgensen, R. Linding, Simplistic pathways or complex networks? Curr. Opin.
Genet. Dev. 20, 15–22 (2010).4. E. S. Henson, S. B. Gibson, Surviving cell death through epidermal growth factor
(EGF) signal transduction pathways: Implications for cancer therapy. Cell. Signal.18, 2089–2097 (2006).
5. W. Kolch, Coordinating ERK/MAPK signalling through scaffolds and inhibitors. Nat.Rev. Mol. Cell Biol. 6, 827–837 (2005).
6. P. J. Roberts, C. J. Der, Targeting the Raf-MEK-ERK mitogen-activated protein ki-nase cascade for the treatment of cancer. Oncogene 26, 3291–3310 (2007).
7. A. Friedman, N. Perrimon, A functional RNAi screen for regulators of receptor tyrosinekinase and ERK signalling. Nature 444, 230–234 (2006).
8. J. V. Olsen, B. Blagoev, F. Gnad, B. Macek, C. Kumar, P. Mortensen, M. Mann,Global, in vivo, and site-specific phosphorylation dynamics in signaling networks. Cell127, 635–648 (2006).
9. U. Stelzl, E. E. Wanker, The value of high quality protein–protein interaction networksfor systems biology. Curr. Opin. Chem. Biol. 10, 551–558 (2006).
10. M. Gstaiger, R. Aebersold, Applying mass spectrometry-based proteomics to genet-ics, genomics and network biology. Nat. Rev. Genet. 10, 617–627 (2009).
11. A. Elefsinioti, M. Ackermann, A. Beyer, Accounting for redundancy when integratinggene interaction databases. PLoS One 4, e7492 (2009).
12. L. J. Lu, A. Sboner, Y. J. Huang, H. X. Lu, T. A. Gianoulis, K. Y. Yip, P. M. Kim,G. T. Montelione, M. B. Gerstein, Comparing classical pathways and modern networks:Towards the development of an edge ontology. Trends Biochem. Sci. 32, 320–331(2007).
13. S. I. Berger, A. Ma’ayan, R. Iyengar, Systems pharmacology of arrhythmias. Sci. Signal.3, ra30 (2010).
14. S. Bornholdt, Systems biology. Less is more in modeling large genetic networks. Science310, 449–451 (2005).
15. R. Samaga, J. Saez-Rodriguez, L. G. Alexopoulos, P. K. Sorger, S. Klamt, The logicof EGFR/ErbB signaling: Theoretical properties and analysis of high-throughput data.PLoS Comput. Biol. 5, e1000438 (2009).
16. J. F. Rual, T. Hirozane-Kishikawa, T. Hao, N. Bertin, S. Li, A. Dricot, N. Li, J. Rosenberg,P. Lamesch, P. O. Vidalain, T. R. Clingingsmith, J. L. Hartley, D. Esposito, D. Cheo,T. Moore, B. Simmons, R. Sequerra, S. Bosak, L. Doucette-Stamm, C. Le Peuch,J. Vandenhaute, M. E. Cusick, J. S. Albala, D. E. Hill, M. Vidal, Human ORFeome version1.1: A platform for reverse proteomics. Genome Res. 14, 2128–2135 (2004).
17. U. Stelzl, U. Worm, M. Lalowski, C. Haenig, F. H. Brembeck, H. Goehler, M. Stroedicke,M. Zenkner, A. Schoenherr, S. Koeppen, J. Timm, S. Mintzlaff, C. Abraham, N. Bock,S. Kietzmann, A. Goedde, E. Toksoz, A. Droege, S. Krobitsch, B. Korn, W. Birchmeier,H. Lehrach, E. E. Wanker, A human protein-protein interaction network: A resource forannotating the proteome. Cell 122, 957–968 (2005).
18. H. Goehler, M. Lalowski, U. Stelzl, S. Waelter, M. Stroedicke, U. Worm, A. Droege,K. S. Lindenberg, M. Knoblich, C. Haenig, M. Herbst, J. Suopanki, E. Scherzinger,C. Abraham, B. Bauer, R. Hasenbank, A. Fritzsche, A. H. Ludewig, K. Bussow,S. H. Coleman, C. A. Gutekunst, B. G. Landwehrmeyer, H. Lehrach, E. E. Wanker, A pro-tein interaction network links GIT1, an enhancer of huntingtin aggregation, to Huntington’sdisease. Mol. Cell 15, 853–865 (2004).
19. K. Venkatesan, J. F. Rual, A. Vazquez, U. Stelzl, I. Lemmens, T. Hirozane-Kishikawa,T. Hao, M. Zenkner, X. Xin, K. I. Goh, M. A. Yildirim, N. Simonis, K. Heinzmann, F. Gebreab,J. M. Sahalie, S. Cevik, C. Simon, A. S. de Smet, E. Dann, A. Smolyar, A. Vinayagam, H. Yu,D. Szeto, H. Borick, A. Dricot, N. Klitgord, R. R. Murray, C. Lin, M. Lalowski, J. Timm, K. Rau,C. Boone, P. Braun, M. E. Cusick, F. P. Roth, D. E. Hill, J. Tavernier, E. E. Wanker,A. L. Barabási, M. Vidal, An empirical framework for binary interactome mapping.Nat. Methods 6, 83–90 (2009).
20. S. Suthram, T. Shlomi, E. Ruppin, R. Sharan, T. Ideker, A direct comparison of proteininteraction confidence assignment schemes. BMC Bioinformatics 7, 360 (2006).
21. T. S. Prasad, K. Kandasamy, A. Pandey, Human Protein Reference Database andHuman Proteinpedia as discovery tools for systems biology. Methods Mol. Biol. 577,67–79 (2009).
22. P. Domingos, M. Pazzani, On the optimality of the simple Bayesian classifier underzero-one loss. Machine Learning 29, 103–130 (1997).
23. E. Frank, M. Hall, L. Trigg, G. Holmes, I. H. Witten, Data mining in bioinformatics usingWeka. Bioinformatics 20, 2479–2481 (2004).
24. K. D. Bromberg, A. Ma’ayan, S. R. Neves, R. Iyengar, Design logic of a cannabinoidreceptor signaling network that triggers neurite outgrowth. Science 320, 903–909(2008).
25. A. Ma’ayan, S. L. Jenkins, S. Neves, A. Hasseldine, E. Grace, B. Dubin-Thaler,N. J. Eungdamrong, G. Weng, P. T. Ram, J. J. Rice, A. Kershenbaum, G. A. Stolovitzky,R. D. Blitzer, R. Iyengar, Formation of regulatory patterns during signal propagation in aMammalian cellular network. Science 309, 1078–1083 (2005).
SCIENCESIGNALING.org 6 September 2011 Vol 4 Issue 189 rs8 10

R E S E A R C H R E S O U R C E
on Septem
ber 6, 2011 stke.sciencem
ag.orgD
ownloaded from
26. M. Kanehisa, S. Goto, M. Hattori, K. F. Aoki-Kinoshita, M. Itoh, S. Kawashima,T. Katayama, M. Araki, M. Hirakawa, From genomics to chemical genomics: New devel-opments in KEGG. Nucleic Acids Res. 34, D354–D357 (2006).
27. Sci. Signal. (Database of Cell Signaling, as seen April 23, 2009). http://stke.sciencemag.org/cm/
28. U. Alon, Network motifs: Theory and experimental approaches. Nat. Rev. Genet. 8,450–461 (2007).
29. R. Milo, S. Shen-Orr, S. Itzkovitz, N. Kashtan, D. Chklovskii, U. Alon, Network motifs:Simple building blocks of complex networks. Science 298, 824–827 (2002).
30. R. Zaidel-Bar, S. Itzkovitz, A. Ma’ayan, R. Iyengar, B. Geiger, Functional atlas of theintegrin adhesome. Nat. Cell Biol. 9, 858–867 (2007).
31. R. Milo, S. Itzkovitz, N. Kashtan, R. Levitt, S. Shen-Orr, I. Ayzenshtat, M. Sheffer, U. Alon,Superfamilies of evolved and designed networks. Science 303, 1538–1542 (2004).
32. L. J. Holt, B. B. Tuch, J. Villen, A. D. Johnson, S. P. Gygi, D. O. Morgan, Global analysisof Cdk1 substrate phosphorylation sites provides insights into evolution. Science 325,1682–1686 (2009).
33. S. Matsuoka, B. A. Ballif, A. Smogorzewska, E. R. McDonald III, K. E. Hurov, J. Luo,C. E. Bakalarski, Z. Zhao, N. Solimini, Y. Lerenthal, Y. Shiloh, S. P. Gygi, S. J. Elledge,ATM and ATR substrate analysis reveals extensive protein networks responsive to DNAdamage. Science 316, 1160–1166 (2007).
34. K. Okada, K. Asai, M. Arita, Flow model of the protein-protein interaction network forfinding credible interactions, in Proceedings of the 5th Asia-Pacific BioinformaticsConference, Hong Kong, 15 to 17 January 2007 (Imperial College Press, London,2007), pp 317–326.
35. E. Yeger-Lotem, L. Riva, L. J. Su, A. D. Gitler, A. G. Cashikar, O. D. King, P. K. Auluck,M. L. Geddie, J. S. Valastyan, D. R. Karger, S. Lindquist, E. Fraenkel, Bridging high-throughput genetic and transcriptional data reveals cellular responses to a-synuclein tox-icity. Nat. Genet. 41, 316–323 (2009).
36. A. Friedman, N. Perrimon, High-throughput approaches to dissecting MAPK signalingpathways. Methods 40, 262–271 (2006).
37. E. Formstecher, J. W. Ramos, M. Fauquet, D. A. Calderwood, J. C. Hsieh, B. Canton,X. T. Nguyen, J. V. Barnier, J. Camonis, M. H. Ginsberg, H. Chneiweiss, PEA-15mediates cytoplasmic sequestration of ERK MAP kinase. Dev. Cell 1, 239–250(2001).
38. M. A. Bogoyevitch, N. W. Court, Counting on mitogen-activated protein kinases—ERKs 3, 4, 5, 6, 7 and 8. Cell. Signal. 16, 1345–1354 (2004).
39. P. Coulombe, S. Meloche, Atypical mitogen-activated protein kinases: Structure, reg-ulation and functions. Biochim. Biophys. Acta 1773, 1376–1387 (2007).
40. S. Bandyopadhyay, C. Y. Chiang, J. Srivastava, M. Gersten, S. White, R. Bell,C. Kurschner, C. H. Martin, M. Smoot, S. Sahasrabudhe, D. L. Barber, S. K. Chanda,T. Ideker, A human MAP kinase interactome. Nat. Methods 7, 801–805 (2010).
41. J. Yu, R. L. Finley Jr., Combining multiple positive training sets to generate confi-dence scores for protein–protein interactions. Bioinformatics 25, 105–111 (2009).
42. A. Vinayagam, U. Stelzl, E. E. Wanker, Repeated two-hybrid screening detects tran-sient protein–protein interactions. Theor. Chem. Acc. 125, 613–619 (2010).
43. M. Steffen, A. Petti, J. Aach, P. D’haeseleer, G. Church, Automated modelling of sig-nal transduction networks. BMC Bioinformatics 3, 34 (2002).
44. C. H. Yeang, H. C. Mak, S. McCuine, C. Workman, T. Jaakkola, T. Ideker, Validationand refinement of gene-regulatory pathways on a network of physical interactions.Genome Biol. 6, R62 (2005).
45. G. Bebek, J. Yang, PathFinder: Mining signal transduction pathway segments fromprotein-protein interaction networks. BMC Bioinformatics 8, 335 (2007).
46. O. Ourfali, T. Shlomi, T. Ideker, E. Ruppin, R. Sharan, SPINE: A framework forsignaling-regulatory pathway inference from cause-effect experiments. Bioinformatics23, i359–i366 (2007).
47. W. Liu, D. Li, J. Wang, H. Xie, Y. Zhu, F. He, Proteome-wide prediction of signal flowdirection in protein interaction networks based on interacting domains. Mol. Cell.Proteomics 8, 2063–2070 (2009).
48. N. Yosef, L. Ungar, E. Zalckvar, A. Kimchi, M. Kupiec, E. Ruppin, R. Sharan, Towardaccurate reconstruction of functional protein networks. Mol. Syst. Biol. 5, 248 (2009).
49. S. S. Huang, E. Fraenkel, Integrating proteomic, transcriptional, and interactome data re-veals hidden components of signaling and regulatory networks. Sci. Signal. 2, ra40 (2009).
50. A. A. Habib, S. J. Chun, B. G. Neel, T. Vartanian, Increased expression of epidermalgrowth factor receptor induces sequestration of extracellular signal-related kinasesand selective attenuation of specific epidermal growth factor-mediated signal trans-duction pathways. Mol. Cancer Res. 1, 219–233 (2003).
51. K. S. Ravichandran, Signaling via Shc family adapter proteins.Oncogene 20, 6322–6330(2001).
www.S
52. M. K. Morris, J. Saez-Rodriguez, P. K. Sorger, D. A. Lauffenburger, Logic-basedmodels for the analysis of cell signaling networks. Biochemistry 49, 3216–3224(2010).
53. P. Beltrao, J. C. Trinidad, D. Fiedler, A. Roguev, W. A. Lim, K. M. Shokat, A. L. Burlingame,N. J. Krogan, Evolution of phosphoregulation: Comparison of phosphorylation patternsacross yeast species. PLoS Biol. 7, e1000134 (2009).
54. C. R. Landry, E. D. Levy, S. W. Michnick, Weak functional constraints on phospho-proteomes. Trends Genet. 25, 193–197 (2009).
55. C. S. Tan, C. Jørgensen, R. Linding, Roles of “junk phosphorylation” in modulatingbiomolecular association of phosphorylated proteins? Cell Cycle 9, 1276–1280(2010).
56. T. Vavouri, J. I. Semple, R. Garcia-Verdugo, B. Lehner, Intrinsic protein disorder andinteraction promiscuity are widely associated with dosage sensitivity. Cell 138, 198–208(2009).
57. R. Sopko, D. Huang, N. Preston, G. Chua, B. Papp, K. Kafadar, M. Snyder, S. G. Oliver,M. Cyert, T. R. Hughes, C. Boone, B. Andrews, Mapping pathways and phenotypes bysystematic gene overexpression. Mol. Cell 21, 319–330 (2006).
58. D. M. Gelperin, M. A. White, M. L. Wilkinson, Y. Kon, L. A. Kung, K. J. Wise, N. Lopez-Hoyo,L. Jiang, S. Piccirillo, H. Yu, M. Gerstein, M. E. Dumont, E. M. Phizicky, M. Snyder,E. J. Grayhack, Biochemical and genetic analysis of the yeast proteome with amovable ORF collection. Genes Dev. 19, 2816–2826 (2005).
59. P. Rørth, A modular misexpression screen in Drosophila detecting tissue-specificphenotypes. Proc. Natl. Acad. Sci. U.S.A. 93, 12418–12422 (1996).
60. S. J. Dixon, M. Costanzo, A. Baryshnikova, B. Andrews, C. Boone, Systematic map-ping of genetic interaction networks. Annu. Rev. Genet. 43, 601–625 (2009).
61. B. Raghavachari, A. Tasneem, T. M. Przytycka, R. Jothi, DOMINE: A database ofprotein domain interactions. Nucleic Acids Res. 36, D656–D661 (2008).
62. G. Palla, I. Derényi, I. Farkas, T. Vicsek, Uncovering the overlapping communitystructure of complex networks in nature and society. Nature 435, 814–818 (2005).
63. J. L. Fink, R. N. Aturaliya, M. J. Davis, F. Zhang, K. Hanson, M. S. Teasdale, C. Kai,J. Kawai, P. Carninci, Y. Hayashizaki, R. D. Teasdale, LOCATE: A mouse proteinsubcellular localization database. Nucleic Acids Res. 34, D213–D217 (2006).
64. T. Obayashi, S. Hayashi, M. Shibaoka, M. Saeki, H. Ohta, K. Kinoshita, COXPRESdb:A database of coexpressed gene networks in mammals. Nucleic Acids Res. 36,D77–D82 (2008).
65. T. H. Cormen, C. E. Leiserson, L. Ronald, C. Rivest Stein (MIT Press, 2001).66. I. Ben-Shlomo, S. Yu Hsu, R. Rauch, H. W. Kowalski, A. J. Hsueh, Signaling recep-
tome: A genomic and evolutionary perspective of plasma membrane receptorsinvolved in signal transduction. Sci. STKE 2003, RE9 (2003).
67. D. N. Messina, J. Glasscock, W. Gish, M. Lovett, An ORFeome-based analysis ofhuman transcription factor genes and the construction of a microarray to interrogatetheir expression. Genome Res. 14, 2041–2047 (2004).
68. P. Shannon, A. Markiel, O. Ozier, N. S. Baliga, J. T. Wang, D. Ramage, N. Amin,B. Schwikowski, T. Ideker, Cytoscape: A software environment for integratedmodels of biomolecular interaction networks. Genome Res. 13, 2498–2504 (2003).
69. Acknowledgments: We thank K. Rau, I. Hoyer, and A. Redel for experimental as-sistance; S. Schnoegl for editorial support and critical reading of the manuscript; andA. Großmann and M. Lalowski for discussions. Funding: The work was supported bythe Deutsche Forschungsgemeinschaft (SFB618 and SFB740), the Bundesministeriumfür Bildung, Wissenschaft, Forschung und Technologie (NGFN2 KB-P04T03/T05,01GR0471, 01GR0475; NGFNp NeuroNet-TP1/TP3/TP8, 01GS08170, and 01GS08171),and the Helmholtz Association (MSBN, TP3, and TP5). Author contributions: A.V.,U.S., and E.E.W. conceived the idea, designed the project, and wrote the manuscript.A.V. performed all computational analyses. U.S. designed the experimental part andcoordinated the project. E.E.W. coordinated and supervised the project. U.S., R.F.,and S.P. performed the cell culture experiments. U.S., M.Z., and J.T. performed theY2H screening. H.E.A. and M.A.A.-N. contributed with analysis and discussion.Competing interests: The authors declare that they have no competing interests.Accession numbers: The PPI data are available in a searchable form from the PPIdatabase MINT (MINT publication id: MINT-8089645).
Submitted 19 November 2010Accepted 18 August 2011Final Publication 6 September 201110.1126/scisignal.2001699Citation: A.Vinayagam,U. Stelzl, R. Foulle, S. Plassmann,M. Zenkner, J. Timm,H.E. Assmus,M. A. Andrade-Navarro, E. E. Wanker, A directed protein interaction network for investigatingintracellular signal transduction. Sci. Signal. 4, rs8 (2011).
CIENCESIGNALING.org 6 September 2011 Vol 4 Issue 189 rs8 11
Copyright © 2022 FDOKUMEN