A diffusion model analysis of developmental changes in children's task switching
20
A diffusion model analysis of developmental changes in children’s task switching Wouter D. Weeda a,b,⇑ , Maurits W. van der Molen c , Francisco Barceló d , Mariëtte Huizinga b a Department of Clinical Neuropsychology, VU University, 1081 BT Amsterdam, The Netherlands b Department of Educational Neuroscience and LEARN! Research Institute, VU University, 1081 BT Amsterdam, The Netherlands c Department of Psychology, University of Amsterdam, 1018 XA Amsterdam, The Netherlands d Department of Psychology, University of the Balearic Islands, 07122 Palma de Mallorca, Spain article info Article history: Received 17 December 2013 Revised 8 May 2014 Keywords: Task switching Diffusion model analysis Development Cognitive flexibility Task-set reconfiguration Inertia abstract This study aimed to investigate the underlying processes of the development of cognitive flexibility between childhood and young adulthood. We performed a diffusion model analysis on the reaction time and accuracy data from four age groups (7-, 11-, 15-, and 21- year-olds), who performed a task-switching task. We decomposed the data into processes related to the reconfiguration of the cognitive system to a new goal (i.e., task-set reconfiguration) and processes related to the interference of the previous task (i.e., task-set inertia). The developmental patterns of both processes indicated a relatively early maturing mechanism, associated with task-set inertia, and a later maturing mechanism, relating to task-set reconfiguration. This pattern of results was interpreted in terms of the development of the neural mechanisms involved in task switching, that is, the (pre-)sup- plementary motor area and the ventrolateral prefrontal cortex. Ó 2014 Elsevier Inc. All rights reserved. Introduction Cognitive flexibility refers to the ability to flexibly adjust behavior to the changing demands of the environment and is a key component of human behavior (e.g., Miller & Cohen, 2001; Monsell, 2003). http://dx.doi.org/10.1016/j.jecp.2014.05.001 0022-0965/Ó 2014 Elsevier Inc. All rights reserved. ⇑ Corresponding author at: Department of Clinical Neuropsychology and Department of Educational Neuroscience, VU University, 1081 BT Amsterdam, The Netherlands. E-mail address: [email protected] (W.D. Weeda). Journal of Experimental Child Psychology 126 (2014) 178–197 Contents lists available at ScienceDirect Journal of Experimental Child Psychology journal homepage: www.elsevier.com/locate/jecp
-
Upload
leidenuniv -
Category
Documents
-
view
0 -
download
0
Transcript of A diffusion model analysis of developmental changes in children's task switching

Journal of Experimental Child Psychology 126 (2014) 178–197
Contents lists available at ScienceDirect
Journal of Experimental ChildPsychology
journal homepage: www.elsevier .com/locate/ jecp
A diffusion model analysis of developmentalchanges in children’s task switching
http://dx.doi.org/10.1016/j.jecp.2014.05.0010022-0965/� 2014 Elsevier Inc. All rights reserved.
⇑ Corresponding author at: Department of Clinical Neuropsychology and Department of Educational NeuroscieUniversity, 1081 BT Amsterdam, The Netherlands.
E-mail address: [email protected] (W.D. Weeda).
Wouter D. Weeda a,b,⇑, Maurits W. van der Molen c, Francisco Barceló d,Mariëtte Huizinga b
a Department of Clinical Neuropsychology, VU University, 1081 BT Amsterdam, The Netherlandsb Department of Educational Neuroscience and LEARN! Research Institute, VU University, 1081 BT Amsterdam, The Netherlandsc Department of Psychology, University of Amsterdam, 1018 XA Amsterdam, The Netherlandsd Department of Psychology, University of the Balearic Islands, 07122 Palma de Mallorca, Spain
a r t i c l e i n f o
Article history:Received 17 December 2013Revised 8 May 2014
Keywords:Task switchingDiffusion model analysisDevelopmentCognitive flexibilityTask-set reconfigurationInertia
a b s t r a c t
This study aimed to investigate the underlying processes of thedevelopment of cognitive flexibility between childhood and youngadulthood. We performed a diffusion model analysis on the reactiontime and accuracy data from four age groups (7-, 11-, 15-, and 21-year-olds), who performed a task-switching task. We decomposedthe data into processes related to the reconfiguration of the cognitivesystem to a new goal (i.e., task-set reconfiguration) and processesrelated to the interference of the previous task (i.e., task-set inertia).The developmental patterns of both processes indicated a relativelyearly maturing mechanism, associated with task-set inertia, and alater maturing mechanism, relating to task-set reconfiguration. Thispattern of results was interpreted in terms of the development of theneural mechanisms involved in task switching, that is, the (pre-)sup-plementary motor area and the ventrolateral prefrontal cortex.
� 2014 Elsevier Inc. All rights reserved.
Introduction
Cognitive flexibility refers to the ability to flexibly adjust behavior to the changing demands of theenvironment and is a key component of human behavior (e.g., Miller & Cohen, 2001; Monsell, 2003).
nce, VU

W.D. Weeda et al. / Journal of Experimental Child Psychology 126 (2014) 178–197 179
Cognitive flexibility can be examined using experimental tasks that require flexible switching betweentask demands. A particularly useful task is the task-switching paradigm (for a review of adult litera-ture on task switching, see Monsell, 2003; see also Kiesel et al., 2010; Vandierendonck, Liefooghe, &Verbruggen, 2010). The task-switching paradigm requires the participant to make a choice betweentwo response alternatives such as deciding between the shape (e.g., circle, triangle) and color (e.g.,yellow, blue) of a stimulus. The shape and color tasks are presented in mixed blocks, allowing the com-parison of performance on task repetitions and task alternations. In adults, longer response latenciesand increased error rates are typically observed on trials that require a task switch (e.g., a shape–colorsequence of trials) compared with repeating trials (e.g., a shape–shape sequence of trials). The differ-ence in performance between task-switch trials and task-repeat trials is referred to as switch costs(Monsell, 2003).
Two major theories have been invoked for the explanation of switch costs. One account suggests thatswitch costs can be attributed to the reconfiguration of the task set (De Jong, 2000; Meiran, 1996; Rogers& Monsell, 1995). More specifically, it is assumed that once a task set is implemented, it stays active untilit has been replaced by another task set. Consequently, it has been argued that task-switching costs arisefrom an executive or control process that reconfigures the cognitive system such that the relevant taskset is active for execution (e.g., Rogers & Monsell, 1995). The other account asserts that, once imple-mented, a task set persists and interferes with new task-set configurations. This residual activation ofa task set from the recent performance of a task, dubbed ‘‘task-set inertia,’’ may interfere with the per-formance of the new task. This account assumes that switch costs reflect interference from the previoustask at the level of stimulus–response associations, stimulus–stimulus associations, or response–response associations (e.g., Allport, Styles, & Hsieh, 1994; Wylie & Allport, 2000).
One line of evidence for an executive control process account comes from studies showing that atleast part of the task-switching costs, ‘‘residual switch costs’’, persist even when participants haveample time between trials to prepare for the upcoming task. It is hypothesized that residual switchcosts reflect the time taken by executive control processes, which must await stimulus presentationand, therefore, are insensitive to the preparation interval (e.g., Monsell, Yeung, & Azuma, 2000). Incontrast, the ‘‘task carryover’’ account is supported by findings showing that switching from a difficulttask to an easy task takes longer to complete than vice versa. This observation is consistent with thenotion that the time needed for a task switch is determined primarily by the nature of the previoustask. Thus, it is argued that greater inhibition is required to the easy task set when performing the dif-ficult one, and this inhibition carries over to the next trial requiring the performance of the easy task.Overcoming this inhibition prolongs the selection of the appropriate response (e.g., Allport et al.,1994). An alternative explanation of the ‘‘task carryover effect’’ concerns the effect of inhibitory con-trol when switching between tasks (for a review, see Koch, Gade, Schuch, & Philipp, 2010). Thisaccount assumes the involvement of an inhibitory mechanism that reduces the activation of thecurrent task in order to switch to a different task. Evidence for the effect of inhibition during taskswitching was obtained in negative priming studies (e.g., Koch et al., 2010) and in n – 2 repetition costs(e.g., Mayr & Keele, 2000).
Initially, task-switching costs have been explained in terms of single factor models, emphasizingeither task-set inertia or task carryover effects. More recently, most authors seem to entertainaccounts of task-switching costs based on a plurality of causes (cf. Monsell, 2003, p. 137). Thus,Ruthruff, Remington, and Johnston (2001) proposed that both top-down and bottom-up processesmight be active during a task switch; the former are required for programming mental operationsinvolved in the upcoming task, whereas the latter are required for the actual execution of these oper-ations. Similarly, Mayr and Kliegl (2003) suggested the existence of two processing stages during atask switch; the first processing stage is associated with the retrieval of task rules from long-termmemory, and the second relates to the automatic application of rules to the stimulus at hand.
The notion of multiple mechanisms involved in task switching has stimulated research aimed atidentifying the mechanisms active in a particular paradigm as well as their temporal dynamics duringthe task switch (for a review, see Vandierendonck et al., 2010). Recently, Schmitz and Voss (2012)applied diffusion modeling for isolating mechanisms involved in different task-switching paradigms.Diffusion modeling (Ratcliff, 1978) takes into account both latency and accuracy of reaction time (RT)data and allows for decomposing the effects on both in meaningful underlying constructs. The
180 W.D. Weeda et al. / Journal of Experimental Child Psychology 126 (2014) 178–197
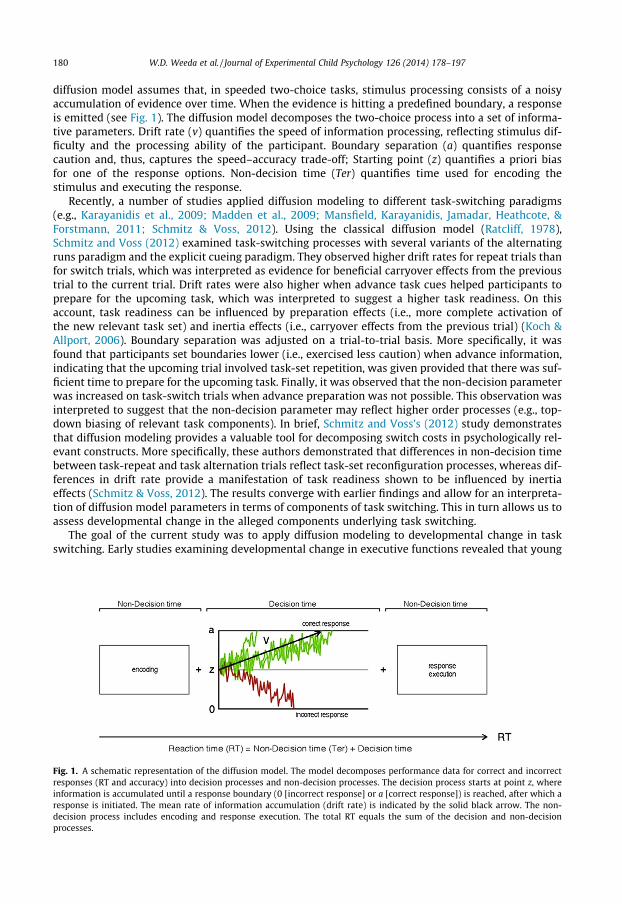
diffusion model assumes that, in speeded two-choice tasks, stimulus processing consists of a noisyaccumulation of evidence over time. When the evidence is hitting a predefined boundary, a responseis emitted (see Fig. 1). The diffusion model decomposes the two-choice process into a set of informa-tive parameters. Drift rate (v) quantifies the speed of information processing, reflecting stimulus dif-ficulty and the processing ability of the participant. Boundary separation (a) quantifies responsecaution and, thus, captures the speed–accuracy trade-off; Starting point (z) quantifies a priori biasfor one of the response options. Non-decision time (Ter) quantifies time used for encoding thestimulus and executing the response.
Recently, a number of studies applied diffusion modeling to different task-switching paradigms(e.g., Karayanidis et al., 2009; Madden et al., 2009; Mansfield, Karayanidis, Jamadar, Heathcote, &Forstmann, 2011; Schmitz & Voss, 2012). Using the classical diffusion model (Ratcliff, 1978),Schmitz and Voss (2012) examined task-switching processes with several variants of the alternatingruns paradigm and the explicit cueing paradigm. They observed higher drift rates for repeat trials thanfor switch trials, which was interpreted as evidence for beneficial carryover effects from the previoustrial to the current trial. Drift rates were also higher when advance task cues helped participants toprepare for the upcoming task, which was interpreted to suggest a higher task readiness. On thisaccount, task readiness can be influenced by preparation effects (i.e., more complete activation ofthe new relevant task set) and inertia effects (i.e., carryover effects from the previous trial) (Koch &Allport, 2006). Boundary separation was adjusted on a trial-to-trial basis. More specifically, it wasfound that participants set boundaries lower (i.e., exercised less caution) when advance information,indicating that the upcoming trial involved task-set repetition, was given provided that there was suf-ficient time to prepare for the upcoming task. Finally, it was observed that the non-decision parameterwas increased on task-switch trials when advance preparation was not possible. This observation wasinterpreted to suggest that the non-decision parameter may reflect higher order processes (e.g., top-down biasing of relevant task components). In brief, Schmitz and Voss’s (2012) study demonstratesthat diffusion modeling provides a valuable tool for decomposing switch costs in psychologically rel-evant constructs. More specifically, these authors demonstrated that differences in non-decision timebetween task-repeat and task alternation trials reflect task-set reconfiguration processes, whereas dif-ferences in drift rate provide a manifestation of task readiness shown to be influenced by inertiaeffects (Schmitz & Voss, 2012). The results converge with earlier findings and allow for an interpreta-tion of diffusion model parameters in terms of components of task switching. This in turn allows us toassess developmental change in the alleged components underlying task switching.
The goal of the current study was to apply diffusion modeling to developmental change in taskswitching. Early studies examining developmental change in executive functions revealed that young
Fig. 1. A schematic representation of the diffusion model. The model decomposes performance data for correct and incorrectresponses (RT and accuracy) into decision processes and non-decision processes. The decision process starts at point z, whereinformation is accumulated until a response boundary (0 [incorrect response] or a [correct response]) is reached, after which aresponse is initiated. The mean rate of information accumulation (drift rate) is indicated by the solid black arrow. The non-decision process includes encoding and response execution. The total RT equals the sum of the decision and non-decisionprocesses.

W.D. Weeda et al. / Journal of Experimental Child Psychology 126 (2014) 178–197 181
children lack flexibility on the Wisconsin Card Sorting Test (e.g., Chelune & Baer, 1986; Levin et al.,1996; Welsh, Pennington, & Groisser, 1991). More recent developmental studies have applied varioustask-switching paradigms to provide a more detailed view on age-related changes in cognitive flexi-bility (for a review, see Cragg & Chevalier, 2012). These studies typically reveal an age-related decreasein switching costs (Cepeda, Kramer, & Gonzalez de Sather, 2001; Chevalier & Blaye, 2009; Cragg &Nation, 2009; Crone, Bunge, van der Molen, & Ridderinkhof, 2006; Davidson, Amso, Anderson, &Diamond, 2006; Deak, Ray, & Pick, 2004; Ellefson, Shapiro, & Chater, 2006; Gupta, Kar, & Srinivasan,2009; Huizinga, Burack, & van der Molen, 2010; Huizinga & van der Molen, 2011; Reimers &Maylor, 2005).
A prominent interpretation of developmental change in task switching refers to carryover effects ofthe previous task interfering with the implementation of the current task. Several studies suggest thatcarryover effects are larger in children compared with adults, children have greater difficulty in inhi-bition of carryover effects when switching to currently intended actions, or both (Cepeda et al., 2001;Crone, Somsen, Zanolie, & Van der Molen, 2006; Gupta et al., 2009; Huizinga & van der Molen, 2011;Kray, Karbach, & Blaye, 2012). An early illustration was provided by Cepeda and colleagues (2001),who required their participants to perform two tasks; deciding whether the number 1 or 3 waspresent and deciding whether a single number (e.g., 1, 3) or three numbers (e.g., 111, 333) was presenton the screen. Participants received a cue indicating which task needed to be performed on the nexttrial, and both the ‘‘response-to-cue’’ and ‘‘cue-to-stimulus’’ intervals were manipulated to examine,respectively, the decay of task-set inertia and the preparation of the task set to be performed. Cepedaand colleagues observed larger switch costs for children relative to adults, but only adults benefitedfrom a lengthening of the response-to-cue interval. In contrast, a lengthening of the cue-to-stimulusinterval reduced switching costs in both children and adults. This pattern of findings was interpretedto suggest that children benefit from increased preparation time but, in contrast to adults, show littleevidence for a rapid decay of task-set inertia. The adult literature, however, indicates that taskswitching cannot be reduced to a single mechanism. Most likely, task switching in children involvesmultiple mechanisms similar to adult task switching. Unfortunately, little is known about thedevelopmental course of these mechanisms (cf. Cragg & Chevalier, 2012). The goal of this study, there-fore, was to assess the mechanisms that are involved in developmental change in task switching. Tothis end, we applied diffusion modeling to the data reported in Huizinga, Dolan, and van der Molen(2006).
In Huizinga and colleagues’ (2006) study, participants performed a battery of experimental tasksexamining developmental change in executive function. The task battery included the Dots and Trian-gles task adopted from Rogers and Monsell (1995). In this task, participants were presented with a4 � 4 grid containing three to eight dots or triangles per half of the grid. During the ‘‘dots’’ task, par-ticipants needed to decide whether there were more dots on the left or right side of the grid; duringthe ‘‘triangles’’ task, they needed to decide whether there were more triangles in the upper or lowerhalf of the grid. Within trial blocks, participants received alternating runs consisting of four dots ortriangle trials. Four age groups performed the task: 7-, 11-, 15-, and 21-year-olds. The results showedthat switch costs decreased with advancing age until 15 years. The current application of diffusionmodeling should allow for identifying the mechanisms involved in switching between the dots andtriangles tasks as well as tracking their developmental course.
Method
A brief presentation of the method can be found in the original study (Huizinga et al., 2006). Thecurrent presentation provides more detail needed to fully appreciate the results reported below.
Participants
The study included four age groups: 95 7-year-olds, 107 11-year-olds, 108 15-year-olds, and 93 21-year-olds. The descriptive characteristics of the participants are shown in Table 1.

Table 1Participant characteristics for the initial sample (top) and final sample after outlier removal (bottom).
n Age Gender (F) Raven quartile
Min Mean Max n % Mean SD
7 years 95 6.27 7.16 7.95 50 53 3.44 0.9311 years 107 10.47 11.19 12.47 64 60 3.18 0.9315 years 108 14.24 15.33 16.78 57 53 3.10 1.0021 years 93 17.52 20.81 26.51 71 76 3.77 0.53Total 403 242 60
7 years 63 6.27 7.16 7.89 33 52 3.63 0.8411 years 102 10.47 11.18 12.47 61 60 3.25 0.9015 years 107 14.24 15.32 16.78 56 52 3.10 1.0021 years 91 17.52 20.79 26.51 70 77 3.77 0.53Total 363 220 61
Note. Characteristics include number of participants (n), age (minimum [Min], mean, and maximum [Max]), gender (numberand percentage of female [F] participants), and Raven quartile (mean and standard deviation).
182 W.D. Weeda et al. / Journal of Experimental Child Psychology 126 (2014) 178–197
Apparatus and stimuli
The Dots and Triangles task was presented on a Toshiba Satellite 1600 laptop (Intel Celeron 800-MHz processor, 15-inch 60-Hz monitor, 1024 � 768 pixels). The task required only left hand and righthand responses. The response button for the left hand was the ‘‘z’’ key on the computer keyboard, andthe response button for the right hand was the ‘‘/’’ key (responses were counterbalanced across par-ticipants). Target stimuli were red circles and green triangles. The size of the target stimuli covered18.43� visual angle (horizontally and vertically).
Design
The task-switching paradigm required participants to respond to either dots (dots task) or triangles(triangles task) with a left or right button press, depending on the instruction of the task. The mappingof the responses onto the stimuli was counterbalanced across participants and kept fixed during theexperiment—with the constraint that for each participant responding to dots (or triangles) was relatedto one task and responding to triangles (or dots) was related to the other task. Half of the trialsrequired a right hand response, and half of the trials required a left hand response.
Varying numbers of either green dots or green triangles were presented in a 4 � 4 grid on thescreen (i.e., three to eight dots or triangles per half of the grid, equally distributed) covering 78.69�visual angle. The dots (or triangles) task required participants to decide whether there were more dots(or triangles) in the left or right part of the grid (the ‘‘left–right’’ task). The triangles (or dots) taskrequired participants to decide whether there were more triangles (or dots) in the top or bottom partof the grid (the ‘‘up–down’’ task). The number of dots (or triangles) presented on the left/right (top/bottom) side of the grid varied pseudo-randomly between three and eight. The difference in the num-ber of stimuli on both sides of the grid was set to three. A schematic of the task is depicted in Fig. 2.
Procedure
The Dots and Triangles task is part of a battery to assess the development of executive function fromchildhood to young adulthood (Huizinga et al., 2006). This battery was composed of 11 tasks (three tasksto assess working memory, three tasks to assess cognitive flexibility, three tasks to assess inhibition, andtwo more complex executive functioning tasks). These tasks were presented in pseudo-random order.
The Dots and Triangles task required participants to perform on two ‘‘pure-task’’ blocks and one‘‘task-switch’’ block. The pure-task blocks served to familiarize participants with the left–right andup–down tasks. The task-switch block required participants to perform a switch task consisting of seriesof four left–right trials and series of four up–down trials that were alternately presented to participants.A task-switch block consisted of 160 trials comprising series of four dots trials and series of four triangles

Fig. 2. A trial sequence. In the first display (from left to right), a target stimulus of the ‘‘dots’’ task appears and a response isrequired; participants need to respond by pressing the left key when there are more dots on the top half of the grid and bypressing the right key when there are more dots on the bottom half of the grid. The second and third displays show a dots task.The fourth and fifth displays show target stimuli of the ‘‘triangles’’ task; participants need to respond by pressing the left keywhen there are more dots on the left half of the grid and by pressing the right key when there are more triangles on the righthalf of the grid. The first, second, and third displays are task repetitions (dots), the fourth display is a task alternation (the taskswitches from dots to triangles), and the fifth display is a task repetition (triangles).
W.D. Weeda et al. / Journal of Experimental Child Psychology 126 (2014) 178–197 183
trials that were alternately presented to the participants. Before a switch block, participants received apractice block consisting of 60 trials.
There was a fixed delay of 1000 ms between the start of a trial block and the presentation of thestimulus. A stimulus remained on the screen until a response was given. Participants had 3500 msto respond. The time interval between the response and the next stimulus varied pseudo-randomlybetween 900 and 1100 ms in steps of 10 ms.
Instructions
Prior to performing the task-switch block, participants were instructed that the left–right and up–down tasks would alternate: ‘‘Now the tasks will alternate, and the stimuli will tell you which task toperform. As before, if you see dots [triangles] in the grid, you decide on which half of the grid there aremore dots [triangles] and press left if the left half of the grid contains more dots [triangles] or rightwhen the right half of the grid contains more dots [triangles]. When you see triangles [dots] in thegrid, you decide on which half of the grid there are more triangles [dots] and press left if the upperhalf of the grid contains more triangles [dots] or right when the lower half of the grid contains moretriangles [dots].’’
Data analyses
The focus of analyses was on reactions that could be preceded by a trial requiring the same task(i.e., task-repeat trials) and reactions requiring a switch to the alternative task (i.e., task-switch trials).

184 W.D. Weeda et al. / Journal of Experimental Child Psychology 126 (2014) 178–197
The difference between task-repeat trials and task-switch trials provides an estimate of the costsinvolved in switching between tasks. Switch costs were subjected to two sets of analyses. The firstset included analyses of variance (ANOVAs) to assess the developmental trajectory of cognitive flexi-bility in terms of response accuracy and response latency. The second set included a diffusion modelanalysis to assess the developmental trajectory of the underlying components of switch costs, the rel-ative contribution of these components to switch costs, and the effects of trial sequence. Prior to theANOVAs, participants for whom the left–right and/or up–down tasks proved too difficult, as indicatedby accuracy scores of 54% or less, were excluded. In addition, all trials with RTs shorter than 120 ms,and all error and post-error trials as well as trials on which no response was given (misses), wereexcluded (see also Steinhauser & Huebner, 2006). The first five responses of each block were consid-ered warm-up trials and excluded from analysis. Finally, extreme RT outliers were removed for eachparticipant and age group separately. An extreme RT outlier was identified as a response with alatency exceeding the individual’s mean by more than 2.5 standard deviations (both sides) or aresponse with a latency higher than 3 times the interquartile range from the 75% percentile of allRTs within an age group or lower than 3 times the interquartile range from the 25% percentile of allRTs within an age group.
The same pre-analysis procedures were followed for the diffusion model analyses except that RTsof both correct and error responses were included. Note that post-error trials were not included in thediffusion model analyses. To obtain a detailed view on possible effects of task-set preparation andtask-set inertia, trials were divided into four types: task switch, first task repetition, second task rep-etition, and third task repetition. The main parameters of the diffusion model, except starting point,1
were allowed to vary freely over these conditions (i.e., all parameters were estimated separately for eachcondition). The starting point was fixed halfway between boundaries (Schmitz & Voss, 2012). To obtainstable parameter estimates given the relatively low number of trials available in each condition, variabil-ity parameters were fixed to zero2 (Voss, Nagler, & Lerche, 2013). Parameters were estimated using‘‘fast-dm’’ (Voss & Voss, 2007) with the Kolmogorov–Smirnov (KS) method for each condition of eachindividual participant separately. Fast-dm uses an efficient algorithm to reliably estimate all diffusionmodel parameters (Voss & Voss, 2008). The main parameters of interest were boundary separation, driftrate, and non-decision time. Developmental changes in task switching are assessed for each of theparameter values. In addition, trial repetition effects are examined across age groups. Finally, the resultsthat emerged from the diffusion modeling analyses are used to assess the developmental time course oftask-switching mechanisms (i.e., task-set inertia and task-set reconfiguration).
Results
In the analyses, age group (7-, 11-, 15-, or 21-year-olds) was included as a between-participantsfactor. After exclusion of the participants following the above-mentioned procedure, the final sampleof the current study was composed of 63 7-year-olds, 102 11-year-olds, 107 15-year-olds, and 9121-year-olds. Descriptive characteristics of the remaining participants are given in Table 1. The exclu-sion of trials in the remaining sample amounted to 23.8% in 7-year-olds, 14.5% in 11-year-olds, 11.5%in 15-year-olds, and 10.3% in 21-year-olds. The specification of outliers and the remaining number oftrials in each age group are given in Table 2. The mean Raven quartile scores differed between groups,F(3,337) = 11.81, p < .001. Post hoc tests (Bonferroni corrected) indicated significant differencesbetween the 7- and 21-year-olds compared with the 11- and 15-year-olds.
Preliminary analyses, with Raven quartile (IQ) as an additional factor, did not qualitatively changeany of the main effects or interactions involving the task manipulations. The gender distributionacross groups differed significantly. This was caused by a relatively larger proportion of women inthe young adult group, v2(3) = 15.03, p = .002. The addition of gender as a factor in the analysesreported below indicated no relationship between gender and task switching, both within groups
1 Because the diffusion model was set up using the ‘‘correct’’ and ‘‘incorrect’’ response boundaries and correct/incorrectresponses were randomly assigned to the left or right side of the grid, the starting point is assumed to be equidistant from the tworesponse boundaries.
2 We thank one of the reviewers for this suggestion.

Table 2Percentage of trials removed per age group (total, percentage post-errors removed, and percentage RT outliers removed) andaverage number of remaining trials (mean and standard deviation).
Outliers Remaining trials
Total (%) Post-error (%) RT (%) Mean SD
7 years 23.8 19.5 4.3 108 2211 years 14.5 10.6 3.8 120 1715 years 11.5 7.7 3.8 123 1721 years 10.3 6.2 4.0 133 13
W.D. Weeda et al. / Journal of Experimental Child Psychology 126 (2014) 178–197 185
and between groups. Therefore, Raven IQ scores and gender were not included in the analysesreported below.
Analysis of variance
The performance on trials where the current task was similar to the previous response (taskrepetitions) was compared with the performance on trials where the current task was different fromthe previous response (task switches). The square root of the proportion correct and median RTs weresubmitted to separate repeated measures ANOVAs with trial type (task repetition vs. task switch) andtask rule (left–right vs. up–down) as within-participants factors. Descriptive statistics are shown inTable 3.
AccuracyThe ANOVA revealed a main effect of age group, indicating increased accuracy when children get
older (78% [SE = 1.1] in 7-year-olds, 85% [SE = 0.9] in 11-year-olds, 88% [SE = 0.9] in 15-year-olds,and 90% [SE = 1.0] in 21-year-olds), F(3,359) = 23.26, p < .001, gp
2 = .163; a main effect of trial type,reflecting switch costs, as indicated by a larger proportion of correct responses on task repetitionscompared with task switches (91% [SE = 0.4] vs. 80% [SE = 0.7]), F(1,359) = 314.35, p < .001,gp
2 = .467; and a main effect of task rule, indicating that the up–down task was more difficult comparedwith the left–right task (80% [SE = 0.6] in up–down task vs. 90% [SE = 0.6] in left–right task),F(1,359) = 183.42, p < .001, gp
2 = .338. In addition, the interaction between age group and trial typeshowed a trend, indicating decreasing switch costs when children are getting older (11% in 7-year-olds, 12% in 11-year-olds, 9% in 15-year-olds, and 10% in 21-year-olds), F(3,359) = 2.16, p = .092,gp
2 = .018 (see Fig. 3).Follow-up analyses indicated that the effect of trial type in 7-year-olds did not differ from the effect
of trial type in 11-year-olds (p = .510), who differed from 15-year-olds (p = .024), who did not differfrom 21-year-olds (p = .895). The ANOVA also yielded a significant interaction between age groupand task rule, indicating a decrease of the task rule effect when children get older (11% in 7-year-olds,11% in 11-year-olds, 9% in 15-year-olds, and 6% in 21-year-olds), F(3,359) = 4.81, p = .003, gp
2 = .039,Follow-up analyses indicated that the effect of task rule in 7-year-olds did not differ from the effectof task rule in 11-year-olds (p = .750), who differed from 15-year-olds (p = .004), who did not differfrom 21-year-olds (p = .213).
Finally, the interaction between task rule and trial type reached significance, F(1,359) = 104.49,p < .001, gp
2 = .225, suggesting that switching to the left–right task was easier (93% [SE = 0.5] in task-repeat trials vs. 88% [SE = 0.7] in task-switch trials) compared with switching to the up–down task(88% [SE = 0.5] in task-repeat trials vs. 73% [SE = 0.9] in task-switch trials). This effect was equal acrossage groups.
Response latenciesThe ANOVA performed on median RTs yielded a significant main effect of age group, indicating
shorter RTs with advancing age (1422 ms [SE = 26] in 7-year-olds, 939 ms [SE = 21] in 11-year-olds,670 ms [SE = 20] in 15-year-olds, and 635 ms [SE = 22] in 21-year-olds), F(3,359) = 220.09, p < .001,

Fig. 3. Task preparation time (in milliseconds) as a function of trial type for each age group. ‘‘Repetition’’ refers to repeatingtasks, and ‘‘alternation’’ refers to switching between tasks (i.e., ‘‘left–right’’ task and ‘‘up–down’’ task or vice versa). Error barsindicate 1 standard error from the mean. (*) Indicates a significant follow-up test for switch-costs (latency) at p < .001.
Table 3Estimated marginal means (M) and standard errors (SE) for median reaction time in milliseconds (Median RT) and percentagecorrect responses (accuracy) across conditions (task rule and trial type) and age groups.
Median RT Repetition Alternation Total
Left–right Up–down Total Left–right Up–down Total Left–right Up–down Total
M SE M SE M SE M SE M SE M SE M SE M SE M SE
7 years 1058 21 1273 23 1166 21 1595 33 1760 43 1677 35 1326 25 1516 31 1422 2611 years 693 17 834 18 764 17 1057 26 1170 34 1114 28 875 20 1002 24 939 2115 years 538 16 622 18 580 16 716 26 804 33 760 27 627 19 713 24 670 2021 years 513 18 578 20 545 18 686 28 764 36 725 29 600 21 671 26 635 22Total 701 9 827 10 764 9 1013 14 1124 18 1069 15 857 11 976 13 916 11
Accuracy % SE % SE % SE % SE % SE % SE % SE % SE % SE
7 years 88 1.2 80 1.2 84 1.0 81 1.7 66 2.1 73 1.5 84 1.3 73 1.4 78 1.111 years 94 1.0 88 1.0 91 0.8 89 1.4 70 1.7 79 1.2 92 1.1 79 1.2 85 0.915 years 95 1.0 91 1.0 93 0.8 90 1.4 78 1.8 84 1.2 93 1.1 84 1.2 88 0.921 years 95 1.0 94 1.1 95 0.9 91 1.5 80 1.9 85 1.4 93 1.2 87 1.3 90 1.0Total 93 0.5 88 0.5 91 0.4 88 0.7 73 0.9 80 0.7 90 0.6 80 0.6 85 0.5
186 W.D. Weeda et al. / Journal of Experimental Child Psychology 126 (2014) 178–197
gp2 = .648. There was a main effect of trial type, reflecting switch costs, as indicated by shorter RTs on
task-repeat trials compared with task-switch trials (764 ms [SE = 9] vs. 1069 ms [SE = 15]),F(1,359) = 889.50, p < .001, gp
2 = .712; and a main effect of task rule, indicating faster responses tothe left–right task compared with the up–down task (857 ms [SE = 11]) vs. 976 ms [SE = 13]),F(1,359) = 209.60, p < .001, gp
2 = .369. As expected, age groups differed with respect to the effect of trialtype, as indicated by a decrease of switch costs with age (511 ms in 7-year-olds, 350 ms in 11-year-olds, 180 ms in 15-year-olds, and 180 ms in 21-year-olds), F(3,359) = 53.66, p < .001, gp
2 = .310 (seeFig. 3).

W.D. Weeda et al. / Journal of Experimental Child Psychology 126 (2014) 178–197 187
Follow-up analyses indicated that the effect of trial type in 7-year-olds differed from the effect oftrial type in 11-year-olds (p < .001), who differed from 15-year-olds (p < .001), who did not differ from21-year-olds (p = .988). In addition, there was a significant interaction between age group and taskrule, indicating a decrease of the effect of task rule when children grow older (190 ms in 7-year-olds,127 ms in 11-year-olds, 86 ms in 15-year-olds, and 71 ms in 21-year-olds), F(3,359) = 9.06, p < .001,gp
2 = .070. The effect of task rule in 7-year-olds differed slightly from the effect in 11-year-olds(p = .062), who differed from 15-year-olds (p = .016), who did not differ from 21-year-olds(p = .213). There was no relationship between task rule and trial type, suggesting that switchingbetween the left–right task and the up–down task takes as much time as switching between theup–down task and the left–right task. This effect was equal in all age groups.
Interim conclusionThe results indicated that performance on task-repeat trials was faster than that on task-switch tri-
als. This is consistent with the task-switching literature (e.g., Monsell, 2003). Most important, task-switching costs decreased with advancing age in accord with the literature on developmental changein task switching (e.g., Cragg & Chevalier, 2012). Finally, switching from the left–right task to the up–down task took as long as switching from the up–down task to the left–right task. Although switchingto the left–right task was easier than switching to the up–down task, the interaction between trialtype and task rule was not altered by age group. Hence, the factor task rule was not included in thediffusion modeling analyses reported below.
Diffusion modeling analyses
The model fitted the data fairly well,3 allowing for a meaningful interpretation of the parameter val-ues (see Appendix Fig. A1 and Appendix Table A1 for model fits and model parameter estimates). Theparameter values were then submitted to ANOVAs with age group as a between-participants factorand trial type as a within-participants factor. The levels of the factor trial type consisted of the averageparameter value of the first, second, and third task-repeat trials versus task-switch trials. Finally,separate analyses were performed on task repetition trials.
Boundary separationThe ANOVA revealed a main effect of age group, indicating a decrease in boundary separation with
advanced age (1.86 [SE = 0.06] in 7-year-olds, 1.64 [SE = 0.05] in 11-year-olds, 1.41 [SE = 0.05] in 15-year-olds, and 1.44 [SE = 0.05] in 21-year-olds), F(3,358) = 14.64, p < .001, gp
2 = .109. Follow-up analy-ses showed that 7-year-olds differed from 11-year-olds (p = .003), who differed from 15-year-olds(p = .001), who did not differ from 21-year-olds (p = .656). A main effect of trial type was absent.The interaction between age group and trial type was also absent. See Fig. 4 (left panel).
Drift rateThe ANOVA yielded a main effect of age group showing an age-related increase in drift rate (0.81
[SE = 0.07] in 7-year-olds, 1.38 [SE = 0.06] in 11-year-olds, 1.94 [SE = 0.06] in 15-year-olds, and 2.16[SE = 0.06] in 21-year-olds), F(3,358) = 87.37, p < .001, gp
2 = .423. There was a significant main effectof trial type, indicating a higher drift rate on task-repeat trials (1.99 [SE = 0.04]) compared withtask-switch trials (1.15 [SE = 0.04]), F(1,358) = 515.42, p < .001, gp
2 = .590. The interaction betweenage group and trial type was also significant (0.48 in 7-year-olds, 0.87 in 11-year-olds, 1.03 in15-year-olds, and 0.99 in 21-year-olds), F(3,358) = 9.25, p < .001, gp
2 = .072. Follow-up analysesshowed that the trial type effect in 7-year-olds differed from the trial type effect in 11-year-olds(p = .001), who marginally differed from 15-year-olds (p = .087), who did not differ from 21-year-olds(p = .689). See Fig. 4 (middle panel).
3 For the diffusion model analyses, one additional participant was excluded because the number of trials for this participant wastoo low (< 10) for estimating diffusion model parameters.
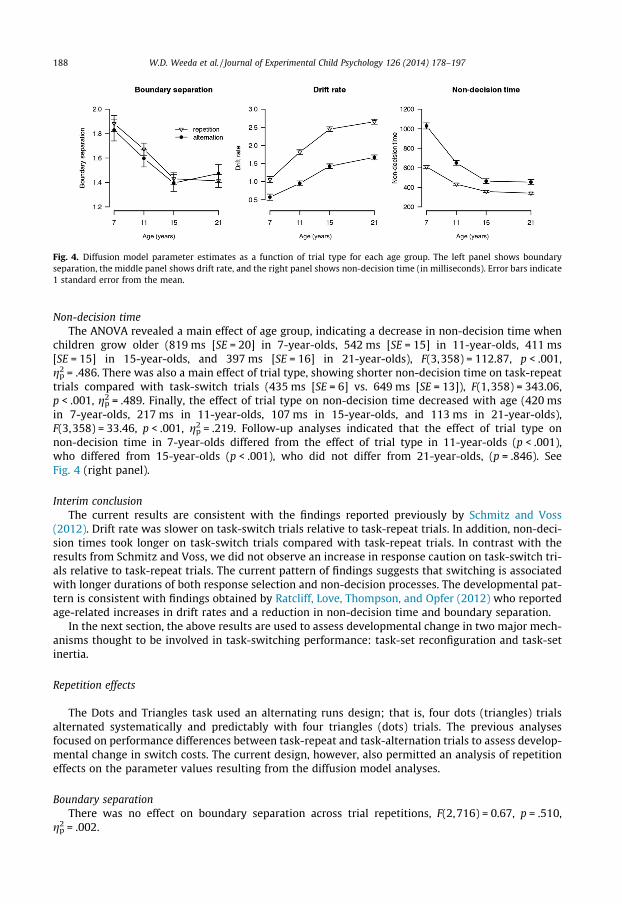
Fig. 4. Diffusion model parameter estimates as a function of trial type for each age group. The left panel shows boundaryseparation, the middle panel shows drift rate, and the right panel shows non-decision time (in milliseconds). Error bars indicate1 standard error from the mean.
188 W.D. Weeda et al. / Journal of Experimental Child Psychology 126 (2014) 178–197
Non-decision timeThe ANOVA revealed a main effect of age group, indicating a decrease in non-decision time when
children grow older (819 ms [SE = 20] in 7-year-olds, 542 ms [SE = 15] in 11-year-olds, 411 ms[SE = 15] in 15-year-olds, and 397 ms [SE = 16] in 21-year-olds), F(3,358) = 112.87, p < .001,gp
2 = .486. There was also a main effect of trial type, showing shorter non-decision time on task-repeattrials compared with task-switch trials (435 ms [SE = 6] vs. 649 ms [SE = 13]), F(1,358) = 343.06,p < .001, gp
2 = .489. Finally, the effect of trial type on non-decision time decreased with age (420 msin 7-year-olds, 217 ms in 11-year-olds, 107 ms in 15-year-olds, and 113 ms in 21-year-olds),F(3,358) = 33.46, p < .001, gp
2 = .219. Follow-up analyses indicated that the effect of trial type onnon-decision time in 7-year-olds differed from the effect of trial type in 11-year-olds (p < .001),who differed from 15-year-olds (p < .001), who did not differ from 21-year-olds, (p = .846). SeeFig. 4 (right panel).
Interim conclusionThe current results are consistent with the findings reported previously by Schmitz and Voss
(2012). Drift rate was slower on task-switch trials relative to task-repeat trials. In addition, non-deci-sion times took longer on task-switch trials compared with task-repeat trials. In contrast with theresults from Schmitz and Voss, we did not observe an increase in response caution on task-switch tri-als relative to task-repeat trials. The current pattern of findings suggests that switching is associatedwith longer durations of both response selection and non-decision processes. The developmental pat-tern is consistent with findings obtained by Ratcliff, Love, Thompson, and Opfer (2012) who reportedage-related increases in drift rates and a reduction in non-decision time and boundary separation.
In the next section, the above results are used to assess developmental change in two major mech-anisms thought to be involved in task-switching performance: task-set reconfiguration and task-setinertia.
Repetition effects
The Dots and Triangles task used an alternating runs design; that is, four dots (triangles) trialsalternated systematically and predictably with four triangles (dots) trials. The previous analysesfocused on performance differences between task-repeat and task-alternation trials to assess develop-mental change in switch costs. The current design, however, also permitted an analysis of repetitioneffects on the parameter values resulting from the diffusion model analyses.
Boundary separationThere was no effect on boundary separation across trial repetitions, F(2,716) = 0.67, p = .510,
gp2 = .002.

Fig. 5. Task repetition effects of drift rate as a function of age group. The solid line indicates the first repetition trial, the dashedgray line indicates the second repetition trial, and the dotted gray line indicates the third repetition trial. Error bars indicate 1standard error from the mean.
W.D. Weeda et al. / Journal of Experimental Child Psychology 126 (2014) 178–197 189
Drift rateDrift rate tended to increase across trial repetitions, F(2,716) = 2.63, p = .073, gp
2 = .009. There wasno interaction between trial repetition and age group. Follow-up analyses revealed a significant linearincrease across trial repetitions (p = .032) (see Fig. 5).
Non-decision timeTrial repetitions did not alter non-decision time, F(2,716) = 0.48, p = .608, gp
2 = .001. In addition,there was no interaction between trial repetition and age group.
Interim conclusionDifferences in the drift rate parameter between task repetitions indicate that on the first repetition
task readiness is lower than on the second and third repetition tasks. Lower task readiness on the firstrepetition could be due to proactive interference from the previous task set. That is, the task set asso-ciated with the trial before the switch is still active, leading to a lower drift rate on the first repetition.Alternatively, the decrease in task readiness could be due to proactive interference from the currenttask set. Thus, on the second and third repetition trials, the new task set is more active than on thefirst repetition, leading to a higher drift rate on the second and third repetitions relative to the firstrepetition.
Analysis of task-switching mechanisms
Inspired by Schmitz and Voss’s (2012) study, and based on the current findings, developmentalchange in task-set reconfiguration and task-set inertia was examined using the parameter values fromthe diffusion modeling analysis of the RTs that emerged from the task-switch paradigm. The primary

190 W.D. Weeda et al. / Journal of Experimental Child Psychology 126 (2014) 178–197
focus of the analyses reported below is on non-decision time. Schmitz and Voss demonstrated thattask-set reconfiguration is captured by non-decision time. Differences in non-decision time betweenalternation and repetition trials, therefore, can be interpreted in terms of the duration of task-setreconfiguration. In addition, differences in drift rate between alternation and repetition trials can beinterpreted in terms of task-set inertia. It should be noted, however, that because both boundary sep-aration and drift rate influence decision time, this measure does not provide a ‘‘pure’’ estimate of deci-sion time. Therefore, we performed simulations where each individual’s boundary separationparameter of the alternation trials was set to the value of this parameter in the repetition trials.Differences in response latencies of these simulations between repetition and alternation trials thenprovide an estimate of decision time that is driven by differences in drift rate alone (see alsoWagenmakers, 2009).
Finally, differences in non-decision times and decision times were computed between task-repeatand task-alternation trials. According to Schmitz and Voss (2012), the former should provide anestimate of task-set reconfiguration, assuming that other processes (e.g., stimulus encoding, responseexecution) involving non-decision times do not differ between task-repeat and task-alternation trials.The latter were thought to provide an estimate of task-set inertia because the effects of boundaryseparation have been partialled out.
Non-decision timeThe results for non-decision time have been reported above and are not presented here again for
reasons of conciseness. Importantly, the results showed a developmental decrease in switch costson non-decision times, suggesting an age-related increase in the efficiency of task-set reconfigurationprocesses. See Fig. 6 (left panel).
Decision timeThe ANOVA performed on decision times yielded a main effect of age group, showing an age-
related decrease (572 ms [SE = 21] in 7-year-olds, 387 ms [SE = 16] in 11-year-olds, 264 ms [SE = 16]in 15-year-olds, and 245 ms [SE = 17] in 21-year-olds), F(3,358) = 60.73, p < .001, gp
2 = .337. Therewas also a main effect of trial type, indicating shorter decision times on task-repeat trials relativeto task alternation trials (319 ms [SE = 7] vs. 415 ms [SE = 12]), F(1,358) = 153.89, p < .001, gp
2 = .301.A marginally significant interaction between age group and trial type indicated that switch costs ondecision times tended to decrease with advancing age (101 ms in 7-year-olds, 125 ms in 11-year-olds,82 ms in 15-year-olds, and 76 ms in 21-year-olds), F(3,358) = 2.29, p = .078, gp
2 = .019. Follow-up
Fig. 6. Processing time of non-decision and decision-related components as a function of age group. The left panel shows non-decision time and decision time for task-repeat and task-switch trials as a function of age group. The right panel shows thedevelopmental trajectory of task-set inertia and task-set reconfiguration effects. Error bars indicate 1 standard error from themean. (*) Indicates a significant Time x Age group interaction (p < .001).
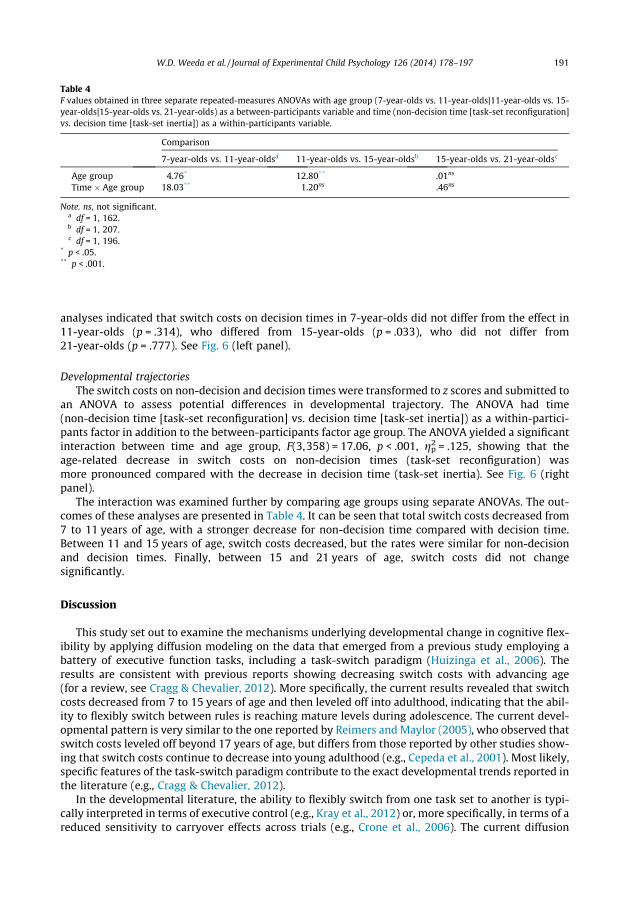
Table 4F values obtained in three separate repeated-measures ANOVAs with age group (7-year-olds vs. 11-year-olds|11-year-olds vs. 15-year-olds|15-year-olds vs. 21-year-olds) as a between-participants variable and time (non-decision time [task-set reconfiguration]vs. decision time [task-set inertia]) as a within-participants variable.
Comparison
7-year-olds vs. 11-year-oldsa 11-year-olds vs. 15-year-oldsb 15-year-olds vs. 21-year-oldsc
Age group 4.76* 12.80** .01ns
Time � Age group 18.03** 1.20ns .46ns
Note. ns, not significant.a df = 1, 162.b df = 1, 207.c df = 1, 196.
* p < .05.** p < .001.
W.D. Weeda et al. / Journal of Experimental Child Psychology 126 (2014) 178–197 191
analyses indicated that switch costs on decision times in 7-year-olds did not differ from the effect in11-year-olds (p = .314), who differed from 15-year-olds (p = .033), who did not differ from21-year-olds (p = .777). See Fig. 6 (left panel).
Developmental trajectoriesThe switch costs on non-decision and decision times were transformed to z scores and submitted to
an ANOVA to assess potential differences in developmental trajectory. The ANOVA had time(non-decision time [task-set reconfiguration] vs. decision time [task-set inertia]) as a within-partici-pants factor in addition to the between-participants factor age group. The ANOVA yielded a significantinteraction between time and age group, F(3,358) = 17.06, p < .001, gp
2 = .125, showing that theage-related decrease in switch costs on non-decision times (task-set reconfiguration) wasmore pronounced compared with the decrease in decision time (task-set inertia). See Fig. 6 (rightpanel).
The interaction was examined further by comparing age groups using separate ANOVAs. The out-comes of these analyses are presented in Table 4. It can be seen that total switch costs decreased from7 to 11 years of age, with a stronger decrease for non-decision time compared with decision time.Between 11 and 15 years of age, switch costs decreased, but the rates were similar for non-decisionand decision times. Finally, between 15 and 21 years of age, switch costs did not changesignificantly.
Discussion
This study set out to examine the mechanisms underlying developmental change in cognitive flex-ibility by applying diffusion modeling on the data that emerged from a previous study employing abattery of executive function tasks, including a task-switch paradigm (Huizinga et al., 2006). Theresults are consistent with previous reports showing decreasing switch costs with advancing age(for a review, see Cragg & Chevalier, 2012). More specifically, the current results revealed that switchcosts decreased from 7 to 15 years of age and then leveled off into adulthood, indicating that the abil-ity to flexibly switch between rules is reaching mature levels during adolescence. The current devel-opmental pattern is very similar to the one reported by Reimers and Maylor (2005), who observed thatswitch costs leveled off beyond 17 years of age, but differs from those reported by other studies show-ing that switch costs continue to decrease into young adulthood (e.g., Cepeda et al., 2001). Most likely,specific features of the task-switch paradigm contribute to the exact developmental trends reported inthe literature (e.g., Cragg & Chevalier, 2012).
In the developmental literature, the ability to flexibly switch from one task set to another is typi-cally interpreted in terms of executive control (e.g., Kray et al., 2012) or, more specifically, in terms of areduced sensitivity to carryover effects across trials (e.g., Crone et al., 2006). The current diffusion

192 W.D. Weeda et al. / Journal of Experimental Child Psychology 126 (2014) 178–197
model analysis should shed more light on the mechanisms contributing to the developmental changein task switching. Interpretations of task switching converged on the notion that multiple mechanismsmust be involved during the various processing stages on a task-switch trial (e.g., Vandierendoncket al., 2010). The diffusion model seems well suited to identify some of the mechanisms that are activeduring these processing stages, as shown by Schmitz and Voss (2012). In the following, we discusshow parameters of the diffusion model allow for a decomposition of the mechanisms implicated intask switching.
Non-decision time (Ter)
Previous research has demonstrated that non-decision time refers to stimulus encoding andresponse-related processes outside the decision process proper (Ratcliff, 1978). Therefore, it seemslikely that stimulus encoding and response-related processes are active on both task-repeat andtask-switch trials. The current findings showed a substantial developmental trend in non-decisiontime, suggesting that stimulus encoding and response-related processes become more efficientwhen children grow older. This finding is consistent with a previous application of a diffusionmodel analysis to developmental change in speeded responding (e.g., Ratcliff et al., 2012). Theobserved developmental decrease in non-decision time is also consistent with electrophysiologicalstudies showing age-related reductions in the latency of brain potential components related to earlyperceptual processes, namely N1 and P2 (for a review, see Taylor & Baldeweg, 2002). The findingsare also consistent with observations showing a developmental decrease in the efficiency ofresponse-related processes, including response preparation (e.g., Flores, Digiacomo, Meneres,Trigo, & Gomez, 2009; Killikelly & Szucs, 2013) and response activation and execution (e.g.,Graziadio et al., 2010; van de Laar, van den Wildenberg, van Boxtel, Huizenga, & van der Molen,2012).
Non-decision time was considerably prolonged on task-switch trials relative to task-repeat trials,consistent with the results reported by Schmitz and Voss (2012). In the absence of cues that signalthe upcoming task set, the current lengthening of the non-decision time might be due to task recon-figuration processes and, more specifically, with the retrieval of the task set from memory (e.g.,Mayr & Kliegl, 2003; for a review, see Schmitz & Voss, 2012). Importantly, the increase in non-deci-sion time on task-switch trials decreased with advancing age, suggesting a developmental increasein the efficiency of the retrieval of task sets from memory, which would be consistent with previousstudies demonstrating developmental change in active memory retrieval (e.g., Dionne & Cadoret,2013).
Drift rate (v)
The drift rate parameter in the diffusion model reflects the speed with which information from thestimulus accumulates over time toward one of the response boundaries. Consistent with previousreports (Ratcliff et al., 2012), the current results showed an increase in drift rate with advancingage, indicating that the rate of information processing increases when children are growing older. Driftrate was more pronounced on task-repeat trials compared with task-switch trials, consistent with thefindings reported previously by Schmitz and Voss (2012), who interpreted this effect to suggest thatdrift rate is influenced by task readiness. Importantly, the difference in drift rate between task-repeatand task-switch trials differentiated between age groups; that is, the difference in drift rate was largerin the youngest children compared with the other age groups. This finding is interpreted to suggestthat the efficiency with which stimulus information is sampled reaches mature levels relatively earlyin development.
The analysis focusing on task-set repetitions revealed an increase in drift rate across repetitions.The observation that the information sampling rate is lower on the first task-set repetition comparedwith subsequent repetitions might be due to proactive interference from the previous task set, whichwould be more pronounced for young children compared with older children and young adults. This

W.D. Weeda et al. / Journal of Experimental Child Psychology 126 (2014) 178–197 193
interpretation is consistent with the findings reported previously by, for example, Crone andcolleagues (2006) (see also Gupta et al., 2009), who observed that young children suffer more thanolder participants from carryover effects between trials.
Boundary separation (a)
In the diffusion model, boundary separation refers to response caution. When the separation ofresponse boundaries is large, there is more information needed from the stimulus to generate aresponse (Ratcliff, 1978). The current results showed a developmental decrease in boundary separa-tion, suggesting that children respond with less caution when they are growing older. This patternis consistent with the results observed by Ratcliff and colleagues (2012), who likewise observed thatyoung children entertain a more conservative response style. The current findings did not reveal aneffect of task switching on boundary separation. Previously, Schmitz and Voss (2012) observed largerboundary separations on task-switch trials compared with task-repeat trials, indicating that partici-pants exercised more caution on the former relative to the latter. But this effect was observed onlywhen participants were able to prepare for the new task set. When participants could not predictthe task transition, they seemed to be cautious by default. In this regard, the current findings suggestthat participants did not dynamically adjust their response boundaries based on the regularities in thetrial sequences (i.e., the task set changed every 4 trials).
Additional analyses
A final set of analyses was conducted to examine the developmental trajectories of non-decisiontime versus decision time. Decision time was assumed to capture task-set inertia, whereas non-deci-sion time was taken to reflect task-set reconfiguration (e.g., Schmitz & Voss, 2012). The results thatemerged from these analyses showed that task-set inertia and task-set reconfiguration have differentdevelopmental trajectories. That is, task-set inertia decreased during mid-adolescence (from 11 to15 years of age), whereas task-set reconfiguration decreased during early and mid-adolescence (from7 to 15 years of age). This pattern of findings makes at least two important points. First, the observa-tion of different developmental trajectories associated with task-set inertia and task-set reconfigura-tion contributes to the literature suggesting that multiple mechanisms are implicated in switchingbetween tasks (e.g., Vandierendonck et al., 2010). Second, this pattern is consistent with the develop-mental literature suggesting that top-down mechanisms, such as task-set reconfiguration, take longerto mature than bottom-up mechanisms such as task-set inertia (e.g., Crone, Zanolie, Van Leijenhorst,Westenberg, & Rombouts, 2008).
Before closing, it should be noted that a relatively small number of trials was available for diffusionmodel analysis. Typically, diffusion model analysis is performed on a large number of trials per con-dition (e.g., Voss et al., 2013). Although the number of trials was relatively low in some conditions, thecurrent study yielded a data pattern that is overall consistent with the findings of previous studies.Moreover, additional analyses (e.g., constraining parameters, EZ-diffusion model analysis) revealedthat the current data pattern is quite robust, further heightening our confidence in the outcomes ofthe current study.
Conclusion
The current results are consistent with the literature showing a pronounced developmental trendin flexible rule switching (e.g., Cragg & Chevalier, 2012). The application of diffusion model analysisallowed for a decomposition of the developmental trend in task switching into a relatively earlymaturing mechanism, associated with task-set inertia, and a later maturing mechanism, relating totask-set reconfiguration. This pattern is consistent with neuroimaging results reported previouslyby, for example Crone, Donohue, Honomichl, Wendelken, and Bunge (2006), who observed two neuralmechanisms involved in task switching: an early maturing mechanism, relying on the (pre-)supple-

194 W.D. Weeda et al. / Journal of Experimental Child Psychology 126 (2014) 178–197
mentary motor area (see also Mansfield et al., 2011) and presumably related to task-set inertia, and alater maturing mechanism, implicating the ventrolateral prefrontal cortex and most likely associatedwith task-set reconfiguration. It would be of considerable interest to combine diffusion modeling andneuroimaging in future developmental studies investigating the mechanisms underlying flexible ruleuse and their developmental trajectories.
Acknowledgment
This work was supported by a grant from the National Initiative Brain and Cognition (NIHC 056-34-016, M. Huizinga).
Appendix
Fig. A1. Fits for the diffusion model. Observed RT (x axis) and estimated RT based on diffusion model parameters (y axis) of allparticipants for all trial types (first, second, and third repetitions and alternation) are shown. Solid black dots indicate correctresponses, and gray crosses indicate error responses. Perfect fit would be obtained if a dot (or a cross) falls on the diagonal line.Fits are given for fast RTs (first row), median RTs (second row), and slow RTs (third row). The bottom row shows observed andestimated accuracy data (percentage correct) for all trial types.

Table A1Diffusion model parameter estimates.
Parameter Drift rate (v) Boundary separation (a) Non-decision time (Ter)
Mean SD Mean SD Mean SD
Age 7 yearsRepetition 1 1.03 0.47 1.94 0.63 0.60 0.20Repetition 2 1.05 0.40 1.82 0.42 0.61 0.16Repetition 3 1.09 0.62 1.89 0.76 0.62 0.20Alternation 0.57 0.41 1.83 0.34 1.03 0.39
Age 11 yearsRepetition 1 1.71 0.80 1.73 1.01 0.43 0.16Repetition 2 1.92 0.87 1.72 0.97 0.43 0.14Repetition 3 1.82 0.64 1.57 0.51 0.43 0.12Alternation 0.95 0.48 1.60 0.46 0.65 0.25
Age 15 yearsRepetition 1 2.38 0.94 1.37 0.64 0.37 0.11Repetition 2 2.48 0.97 1.46 0.85 0.36 0.10Repetition 3 2.49 0.91 1.46 0.72 0.35 0.10Alternation 1.42 0.68 1.40 0.73 0.46 0.16
Age 21 yearsRepetition 1 2.60 0.97 1.41 0.76 0.35 0.11Repetition 2 2.63 1.06 1.48 0.86 0.33 0.09Repetition 3 2.74 0.95 1.34 0.45 0.34 0.08Alternation 1.67 0.94 1.47 1.01 0.45 0.19
Note. Estimates of diffusion model parameters per trial type and age group are shown. We calculated mean values by averagingparameter estimates for each trial type over all participants within an age group. The standard deviations of these values areshown in the SD columns. The parameters v, a, and Ter indicate drift rate, boundary separation, and non-decision time (inseconds), respectively. Note that estimates of z (starting point) are omitted because this parameter is fixed to a/2.
W.D. Weeda et al. / Journal of Experimental Child Psychology 126 (2014) 178–197 195
References
Allport, D. A., Styles, E. A., & Hsieh, S. (1994). Shifting intentional set: Exploring the dynamic control of tasks. In C. Umilta & M.Moscovitch (Eds.), Attention and performance XV: Conscious and nonconscious information processing (pp. 421–452).Cambridge, MA: MIT Press.
Cepeda, N. J., Kramer, A. F., & Gonzalez de Sather, J. C. M. (2001). Changes in executive control across the life span: Examinationof task-switching performance. Developmental Psychology, 37, 715–730.
Chelune, G. J., & Baer, R. A. (1986). Developmental norms for the Wisconsin Card Sorting Test. Journal of Clinical and ExperimentalNeuropsychology, 8, 219–228.
Chevalier, N., & Blaye, A. (2009). Setting goals to switch between tasks: Effect of cue transparency on children’s cognitiveflexibility. Developmental Psychology, 45, 782–797.
Cragg, L., & Chevalier, N. (2012). The processes underlying flexibility in childhood. Quarterly Journal of Experimental Psychology,65, 209–232.
Cragg, L., & Nation, K. (2009). Shifting development in mid-childhood: The influence of between-task interference.Developmental Psychology, 45, 1465–1479.
Crone, E. A., Bunge, S. A., van der Molen, M. W., & Ridderinkhof, K. R. (2006). Switching between tasks and responses: Adevelopmental study. Developmental Science, 9, 278–287.
Crone, E. A., Donohue, S. E., Honomichl, R., Wendelken, C., & Bunge, S. A. (2006). Brain regions mediating flexible rule use duringdevelopment. Journal of Neuroscience, 26, 11239–11247.
Crone, E. A., Somsen, R. J., Zanolie, K., & Van der Molen, M. W. (2006). A heart rate analysis of developmental change in feedbackprocessing and rule shifting from childhood to early adulthood. Journal of Experimental Child Psychology, 95, 99–116.
Crone, E. A., Zanolie, K., Van Leijenhorst, L., Westenberg, P. M., & Rombouts, S. A. R. B. (2008). Neural mechanisms supportingflexible performance adjustment during development. Cognitive Affective & Behavioral Neuroscience, 8, 165–177.
Davidson, M. C., Amso, D., Anderson, L. C., & Diamond, A. (2006). Development of cognitive control and executive functions from4 to 13 years: Evidence from manipulations of memory, inhibition, and task switching. Neuropsychologia, 44, 2037–2078.
De Jong, R. (2000). An intention–activation account of residual switch costs. In S. Monsell & J. Driver (Eds.), Attention andperformance XVIII: Control of cognitive performance (pp. 357–376). Cambridge, MA: MIT Press.
Deak, G. O., Ray, S. D., & Pick, A. D. (2004). Effects of age, reminders, and task difficulty on young children’s rule-switchingflexibility. Cognitive Development, 19, 385–400.
Dionne, J., & Cadoret, G. (2013). Development of active controlled retrieval during middle childhood. DevelopmentalPsychobiology, 55, 443–449.

196 W.D. Weeda et al. / Journal of Experimental Child Psychology 126 (2014) 178–197
Ellefson, M. R., Shapiro, L. R., & Chater, N. (2006). Asymmetrical switch costs in children. Cognitive Development, 21, 108–130.Flores, A. B., Digiacomo, M. R., Meneres, S., Trigo, E., & Gomez, C. M. (2009). Development of preparatory activity indexed by the
contingent negative variation in children. Brain and Cognition, 71, 129–140.Graziadio, S., Basu, A., Tomasevic, L., Zappasodi, F., Tecchio, F., & Eyre, J. A. (2010). Developmental tuning and decay in
senescence of oscillations linking the corticospinal system. Journal of Neuroscience, 30, 3663–3674.Gupta, R., Kar, B. R., & Srinivasan, N. (2009). Development of task switching and post-error slowing in children. Behavioral and
Brain Functions, 5, 38. http://dx.doi.org/10.1186/1744-9081-5-38.Huizinga, M., Burack, J. A., & van der Molen, M. W. (2010). Age-related change in shifting attention between global and local
levels of hierarchical stimuli. Journal of Cognition and Development, 11, 408–436.Huizinga, M., Dolan, C. V., & van der Molen, M. W. (2006). Age-related change in executive function: Developmental trends and a
latent variable analysis. Neuropsychologia, 44, 2017–2036.Huizinga, M., & van der Molen, M. W. (2011). Task switching and shifting between stopping and going: Developmental change
in between-trial control adjustments. Journal of Experimental Child Psychology, 108, 484–503.Karayanidis, F., Mansfield, E. L., Galloway, K. L., Smith, J. L., Provost, A., & Heathcote, A. (2009). Anticipatory reconfiguration
elicited by fully and partially informative cues that validly predict a switch in task. Cognitive Affective & BehavioralNeuroscience, 9, 202–215.
Kiesel, A., Steinhauser, M., Wendt, M., Falkenstein, M., Jost, K., Philipp, A. M., et al (2010). Control and interference in taskswitching: A review. Psychological Bulletin, 136, 849–874.
Killikelly, C., & Szucs, D. (2013). Delayed development of proactive response preparation in adolescents: ERP and EMG evidence.Developmental Cognitive Neuroscience, 3, 33–43.
Koch, I., & Allport, A. (2006). Cue-based preparation and stimulus-based priming of tasks in task switching. Memory & Cognition,34, 433–444.
Koch, I., Gade, M., Schuch, S., & Philipp, A. M. (2010). The role of inhibition in task switching: A review. Psychonomic Bulletin &Review, 17, 1–14.
Kray, J., Karbach, J., & Blaye, A. (2012). The influence of stimulus-set size on developmental changes in cognitive control andconflict adaptation. Acta Psychologica, 140, 119–128.
Levin, H. S., Fletcher, J. M., Kufera, J. A., Harward, H., Lilly, M. A., Mendelsohn, D., et al (1996). Dimensions of cognition measuredby the Tower of London and other cognitive tasks in head-injured children and adolescents. Developmental Neuropsychology,12, 17–34.
Madden, D. J., Spaniol, J., Costello, M. C., Bucur, B., White, L. E., Cabeza, R., et al (2009). Cerebral white matter integrity mediatesadult age differences in cognitive performance. Journal of Cognitive Neuroscience, 21, 289–302.
Mansfield, E. L., Karayanidis, F., Jamadar, S., Heathcote, A., & Forstmann, B. U. (2011). Adjustments of response threshold duringtask switching: A model-based functional magnetic resonance imaging study. Journal of Neuroscience, 31, 14688–14692.
Mayr, U., & Keele, S. W. (2000). Changing internal constraints on action: The role of backward inhibition. Journal of ExperimentalPsychology: General, 129, 4–26.
Mayr, U., & Kliegl, R. (2003). Differential effects of cue changes and task changes on task-set selection costs. Journal ofExperimental Psychology: Learning, Memory, and Cognition, 29, 362–372.
Meiran, N. (1996). Reconfiguration of processing mode prior to task performance. Journal of Experimental Psychology: Learning,Memory, and Cognition, 22, 1423–1442.
Miller, E. K., & Cohen, J. D. (2001). An integrative theory of prefrontal cortex function. Annual Review of Neuroscience, 24,167–202.
Monsell, S. (2003). Task switching. Trends in Cognitive Sciences, 7, 134–140.Monsell, S., Yeung, N., & Azuma, R. (2000). Reconfiguration of task-set: Is it easier to switch to the weaker task? Psychological
Research [Psychologische Forschung], 63, 250–264.Ratcliff, R. (1978). A theory of memory retrieval. Psychological Review, 85, 59–108.Ratcliff, R., Love, J., Thompson, C. A., & Opfer, J. E. (2012). Children are not like older adults: A diffusion model analysis of
developmental changes in speeded responses. Child Development, 83, 367–381.Reimers, S., & Maylor, E. A. (2005). Task switching across the life span: Effects of age on general and specific switch costs.
Developmental Psychology, 41, 661–671.Rogers, R. D., & Monsell, S. (1995). Costs of a predictible switch between simple cognitive tasks. Journal of Experimental
Psychology: General, 124, 207–231.Ruthruff, E., Remington, R. W., & Johnston, J. C. (2001). Switching between simple cognitive tasks: The interaction of top-down
and bottom-up factors. Journal of Experimental Psychology: Human Perception and Performance, 27, 1404–1419.Schmitz, F., & Voss, A. (2012). Decomposing task-switching costs with the diffusion model. Journal of Experimental Psychology:
Human Perception and Performance, 38, 222–250.Steinhauser, M., & Huebner, R. (2006). Response-based strengthening in task shifting: Evidence from shift effects produced by
errors. Journal of Experimental Psychology: Human Perception and Performance, 32, 517–534.Taylor, M. J., & Baldeweg, T. (2002). Application of EEG, ERP, and intracranial recordings to the investigation of cognitive
functions in children. Developmental Science, 5, 318–334.van de Laar, M. C. V., van den Wildenberg, W. P. M., van Boxtel, G. J. M., Huizenga, H. M., & van der Molen, M. W. (2012). Lifespan
changes in motor activation and inhibition during choice reactions: A Laplacian ERP study. Biological Psychology, 89,323–334.
Vandierendonck, A., Liefooghe, B., & Verbruggen, F. (2010). Task switching: Interplay of reconfiguration and interference control.Psychological Bulletin, 136, 601–626.
Voss, A., Nagler, M., & Lerche, V. (2013). Diffusion models in experimental psychology: A practical introduction. Experimentalpsychology, 60, 385–402.
Voss, A., & Voss, J. (2007). Fast-dm: A free program for efficient diffusion model analysis. Behavior Research Methods, 39,767–775.
Voss, A., & Voss, J. (2008). A fast numerical algorithm for the estimation of diffusion model parameters. Journal of MathematicalPsychology, 52, 1–9.

W.D. Weeda et al. / Journal of Experimental Child Psychology 126 (2014) 178–197 197
Wagenmakers, E. J. (2009). Methodological and empirical developments for the Ratcliff diffusion model of response times andaccuracy. European Journal of Cognitive Psychology, 21, 641–671.
Welsh, M. C., Pennington, B. F., & Groisser, D. B. (1991). A normative-developmental study of executive function: A window onprefrontal function in children. Developmental Neuropsychology, 7, 131–149.
Wylie, G., & Allport, A. (2000). Task switching and the measurement of ‘‘switch costs’’. Psychological Research [PsychologischeForschung], 63, 212–233.