A descriptive theory of information
11
Originally the mathematical theory of information was developed in the context of “selective information;” that is, information was assumed to have been transmitted when the uncertainty (as to which of a number of possible messages was sent) was reduced by the receipt of a message. This theory, eminently suitable as the basis of telecommunication technology, runs into conceptual difficulties when applied to the content of the message received. A descriptive theory of information deals with the problem of specifying quan- titatively the amount of information about something. A DESCRIPTIVE THEORY OF INFORMATION by Bury1 Payne Goddard College NFORMATION theory has stimulated a great I deal of research in the behavioral sci- ences, but attempts to apply the strict mathematical techniques to particular prob- lems have not been too successful. (See Hardy and Kurtz, 1963, for a review and appraisal.) The basic ideas are useful but the theory does not seem to be flexible enough for work in the behavioral sciences. A more general type of information theory is briefly discussed in this paper. The basis for it was found in the work of MacKay (1950; 1955) and modified by the author. It may be applied in many different fields, although the author used it primarily in developing a measure of organization for visual figures.’ MacKay distinguishes two major kinds of information ; the first (Shannon’s measure) he calls “selective information,” which is a measure of the unexpectedness of the event. It is not related to the structure or organiza- tion of the event per se. The second type he calls “structural information.” It depends upon the number of items necessary to de- scribe or reconstruct the event. Each dis- tinguishable component in the logical de- scription of a given pattern, event, system, or configuration, is called a logon and the total number of components is called the logon content. 1 MacKay’s formulation grew out of applica- tions in electrical and physics. MacKay (1955) used the term “descriptive information theory” (Payne, 1962), although it is not actually a theory in the sense of having explicit postulates and axioms-rather, it might be called a metatheory. In general, the magnitude of each com- ponent will not be exactly known. The un- certainty associated with its value is called the varon content? Other terms for the varon content are : divergence, variance, scatter, dispersion, or amount of detail. The variance can be identified as the varon content when it can be computed; in other situations it may not be possible to formulate a precise measure of the varon content. These two terms and the relationship be- tween them constitute the basis of descrip- tion theory ; however, the applications and implications appear amazingly broad. The term logon may refer to any kind of unit, depending on the descriptive language used. Logons may be very sharp, or broad and ill- defined. The term may be applied to the descriptive, specialized languages of many different fields and at different language strata, levels of analysis, or orders of abstrac- tion. In a sense, measurement may be taken as a special kind of description. Four kinds of measurement are distinguished : nominal, ordinal, interval, and ratio, and the term logon can be applied to the units on any one of these scales. A few examples illustrate the formulation of description theory. A filing system An office filing system is a simple illustra- tion of description theory. The folders which A related measure, called the metron con- tent, was originally used by MacKay (1950). The measure defined in this paper is called “varon content” in order to avoid confusion with MacKay’s term. 295
Transcript of A descriptive theory of information

Originally the mathematical theory of information was developed in the context of “selective information;” that is, information was assumed to have been transmitted when the uncertainty (as to which of a number of possible messages was sent) was reduced by the receipt of a message. This theory, eminently suitable as the basis of telecommunication technology, runs into conceptual difficulties when applied to the content of the message received. A descriptive theory of information deals with the problem of specifying quan- titatively the amount of information about something.
A DESCRIPTIVE THEORY OF INFORMATION
by Bury1 P a y n e
Goddard College
NFORMATION theory has stimulated a great I deal of research in the behavioral sci- ences, but attempts to apply the strict mathematical techniques to particular prob- lems have not been too successful. (See Hardy and Kurtz, 1963, for a review and appraisal.) The basic ideas are useful but the theory does not seem to be flexible enough for work in the behavioral sciences. A more general type of information theory is briefly discussed in this paper. The basis for it was found in the work of MacKay (1950; 1955) and modified by the author. It may be applied in many different fields, although the author used it primarily in developing a measure of organization for visual figures.’
MacKay distinguishes two major kinds of information ; the first (Shannon’s measure) he calls “selective information,” which is a measure of the unexpectedness of the event. It is not related to the structure or organiza- tion of the event per se. The second type he calls “structural information.” It depends upon the number of items necessary to de- scribe or reconstruct the event. Each dis- tinguishable component in the logical de- scription of a given pattern, event, system, or configuration, is called a logon and the total number of components is called the logon content.
1 MacKay’s formulation grew out of applica- tions in electrical and physics. MacKay (1955) used the term “descriptive information theory” (Payne, 1962), although it is not actually a theory in the sense of having explicit postulates and axioms-rather, it might be called a metatheory.
In general, the magnitude of each com- ponent will not be exactly known. The un- certainty associated with its value is called the varon content? Other terms for the varon content are : divergence, variance, scatter, dispersion, or amount of detail. The variance can be identified as the varon content when it can be computed; in other situations it may not be possible to formulate a precise measure of the varon content.
These two terms and the relationship be- tween them constitute the basis of descrip- tion theory ; however, the applications and implications appear amazingly broad. The term logon may refer to any kind of unit, depending on the descriptive language used. Logons may be very sharp, or broad and ill- defined. The term may be applied to the descriptive, specialized languages of many different fields and at different language strata, levels of analysis, or orders of abstrac- tion. In a sense, measurement may be taken as a special kind of description. Four kinds of measurement are distinguished : nominal, ordinal, interval, and ratio, and the term logon can be applied to the units on any one of these scales. A few examples illustrate the formulation of description theory.
A filing system An office filing system is a simple illustra-
tion of description theory. The folders which A related measure, called the metron con-
tent, was originally used by MacKay (1950). The measure defined in this paper is called “varon content” in order to avoid confusion with MacKay’s term.
295

296 BURYL PAYNE
hold papers represent the logons. When each new paper is tiled one must decide in which folder to place it. It is not always easy to decide where to put some papers; and this uncertainty, which represents the varon content, is evident when one goes to loolc for a particular paper. As the file grows it be- comes necessary to make more folders for specialized subjects, thereby increasing the logon content and decreasing the varon content, or the difficulty of finding a particu- lar paper. This process of increasing the logon content in order to reduce the varon content or vice versa can be illustrated in every example. In the case of the filing system, the number of folders could be in- creased to the point a t which each folder contained only one paper. This would elimi- nate any varon content (assuming one- dimensional filing were possible), but would not be very satisfactory.
Measurement of an object
Description theory may be more aptly illustrated in the case of the measurement of a simple physical object, such as the trunk of a fallen tree. One person may measure the diameter a t several points and exclaim : “It is a circle approximately 20 inches in diameter.” The logon content would be one, since oiily the radius is needed to define a circle, and the varon content could be identified as the variance in this case and calculated from the actual measurements. It might be one in this case, indicating that two thirds of the measurements made fell in the interval of 19 to 21 inches.
A second person might disagree, claiming that the tree trunk is elliptical, not circular. He might then make some measurements and report that the length of the major axis is 20.5 inches with a variance of 0.4, and the length of the minor axis is 18.5 inches with a variance of 0.5. The logon content would be two in this case, and there would be a separate variance measure associated with each logon. The total varon content would be the sum of the separate variances. If it were less than the varon content obtained by the first person, there would be justification for describing the tree trunk as elliptical rather than circular. It is possible that 8
third person might assert that, for greater accuracy, the log should be described by a number of arcs, each with its separate radius and variance. In the limiting case the num- ber of logons would be determined by the resolving power of one’s measuring instru- ments (or one’s patience!). The logon con- tent would be very large, while the total varon content would decrease, leveling off at some minimum value.
An example from optics
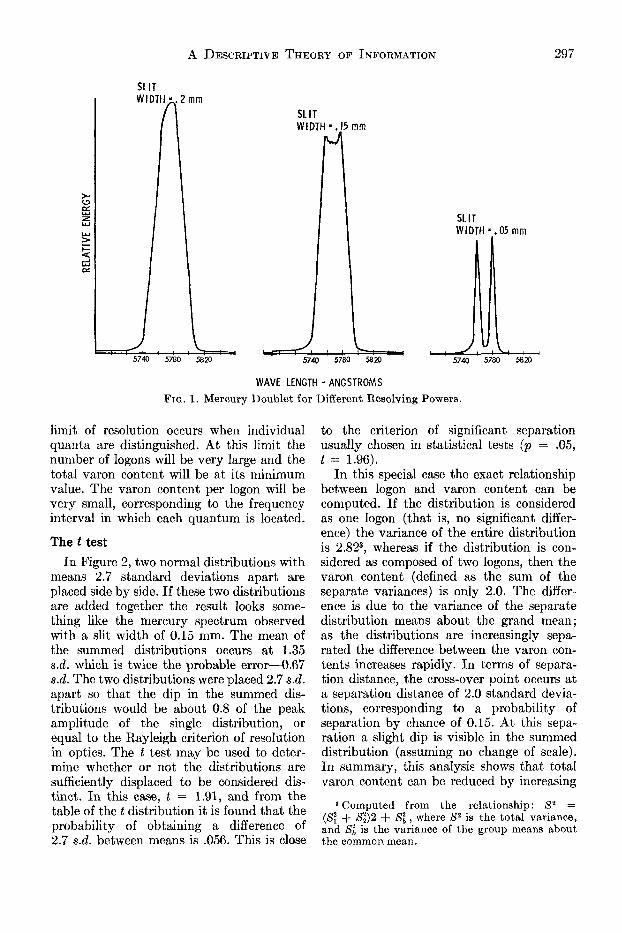
Figure 1 shows the radiation spectrum from a mercury light source which was ob- tained with a Perkin Elmer Spectrometer, Rlodel 98, using a glass prism. The spectrum was measured at three different levels of resolution. The single, wide distribution a t the left of Figure 1 was obtained when the spectrometer was used at a low level of resolution (wide slit width). The middle curve was obtained from the same spectral region, but the resolving power of the spectrometer was increased by narrowing the slit width. The appearance of the two [‘ears” suggests that there may be two separate or distinct line spectra present. In optics it is customary to consider that two line spectra are resolved if the energy level a t the mid- point is 0.8 of the energy level of the peaks. This is known as Rayleigh’s criterion; and by this criterion, the two ears cannot be considered as separate, but if the slit width is again decreased the two line spectra arc distinctly resolved (the double distribution at the right of Figure 1). These spectra constitute the mercury doublet a t 5770 and 5790 angstroms.
In these optical measurements the number of peaks is taken to be the logon content, and the varon content may be defined as the square of the half-width (half-width, measured at the half-power point, is similar to the square root of the variance, or stand- ard deviation of a normal distribution). It is clear in this case that as the resolving power, and hence logon content, increases the half- width decreases rapidly. Still higher re- solving power would have shown that th;: peak on the right of the doublet a t 5790 A is composed of two distinctJines, with poalis a t 5789.66 and 5790.65 A. The ultimate
A DESCRIPTIVE THEORY OF INFORMATION 297
SLIT
SLIT WIDTH -. 15 mm
I WIDTH = .05 mm
WAVE LENGTH - ANGSTROMS FIG. 1. Mercury Doublet for Different Resolving Powers.
limit of resolution occurs when individual quanta are distinguished. At this limit the number of logons will be very large and the total varon content will be at its minimum value. The varon content per logon will be very small, corresponding to the frequency interval in which each quantum is located.
The t test
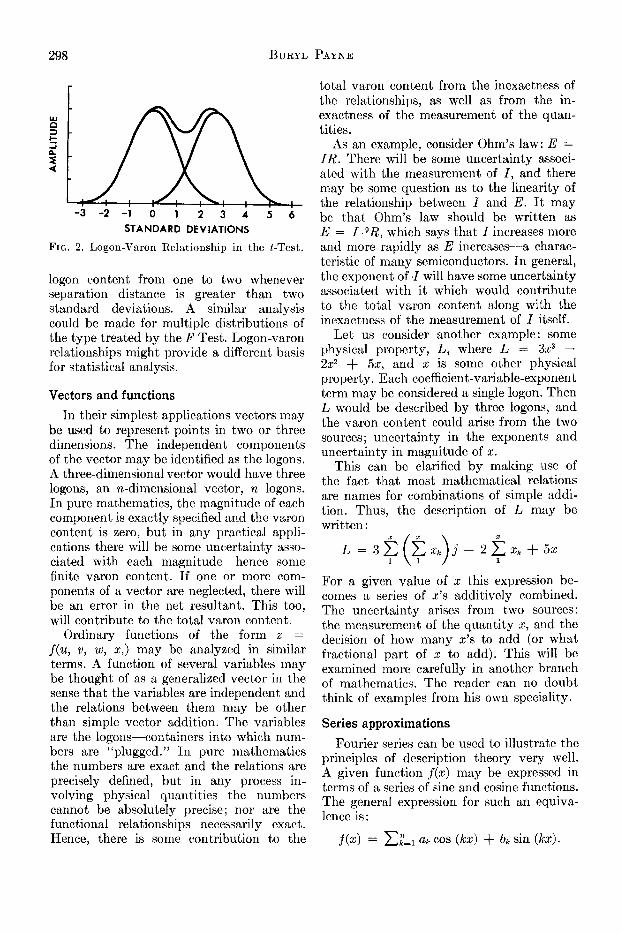
In Figure 2, two normal distributions with means 2.7 standard deviations apart are placed side by side. If these two distributions are added together the result looks some- thing like the mercury spectrum observed with a slit width of 0.15 mm. The mean of the summed distributions occurs a t 1.35 s.d. which is twice the probable e r ro r4 .67 s.d. The two distributions were placed 2.7 s.d. apart so that the dip in the summed dis- tributions would be about 0.8 of the peak amplitude of the single distribution, or equal to the Rayleigh criterion of resolution in optics. The t test may be used to deter- mine whether or not the distributions are sufficiently displaced to be considered dis- tinct. In this case, t = 1.91, and from the table of the t distribution it is found that the probability of obtaining a difference of 2.7 s.d. between means is -056. This is close
to the criterion of significant separation usually chosen in statistical tests (p = .05, t = 1.96).
In this special case the exact relationship between logon and varon content can be computed. If the distribution is considered as one logon (that is, no significant differ- ence) the variance of the entire distribution is 2.823, whereas if the distribution is con- sidered as composed of two logons, then the varon content (defined as the sum of the separate variances) is only 2.0. The differ. ence is due to the variance of the separate distribution means about the grand mean; as the distributions are increasingly sepa- rated the difference between the varon con- tents increases rapidly. In terms of separa- tion distance, the cross-over point occurs at a separation distance of 2.0 standard devia- tions, corresponding to a probability of separation by chance of 0.15. At this sepa- ration a slight dip is visible in the summed distribution (assuming no change of scale). In summary, this analysis shows that total varon content can be reduced by increasing
3 Computed from the relationship: S2 = (S; + 8 3 2 + SZ, , where S2 is the total variance, and 8: is the variance of the group means about the common mean.
298 BURYL PAYNE
r
STANDARD DEVIATIONS
FIG. 2. Logon-Varon Relationship in the &Test.
logon content from one to two whenever separation distance is greater than two standard deviations. A similar analysis could be made for multiple distributions of the type treated by the F Test. Logon-varon relationships might provide a different basis for statistical analysis.
Vectors and functions In their simplest applications vectors may
be used to represent points in two or three dimensions. The independent components of the vector may be identified as the logons. A three-dimensional vector would have three logons, an n-dimensional vector, n logons. In pure mathematics, the magnitude of each component is exactly specified and the varon content is zero, but in any practical appli- cations there will be some uncertainty asso- ciated with each magnitude-hence some finite varon content. If one or more com- ponents of a vector are neglected, there will be an error in the net resultant. This too, will contribute to the total varon content.
Ordinary functions of the form z = f(u, v, w, 2,) may be analyzed in similar terms. A function of several variables may be thought of as a generalized vector in the sense that the variables are independent and the relations between them may be other than simple vector addition. The variables are the logons-containers into which num- bers are “plugged.” In pure mathematics the numbers are exact and the relations are precisely defined, but in any process in- volving physical quantities the numbers cannot be absolutely precise; nor are the functional relationships necessarily exact. Hence, there is some contribution to the
total varon content from the inexactness of the relationships, as well as from the in- exactness of the measurement of the quan- tities.
As an example, consider Ohm’s law: E = IR. There will be some uncertainty associ- ated with the measurement of I , and there may be some question as to the linearity of the relationship between I and E. It may be that Ohm’s law should be written as E = I .9R, which says that I increases more and more rapidly as E increases-a charac- teristic of many semiconductors. In general, the exponent of I will have some uncertainty associated with it which would contribute to the t,otal varon content along with the inexactness of the measurement of I itself.
Let us consider another example: some physical property, L, where L = 3x3 - 2x2 + 5x, and x is some other physical property. Each coefficient-variable-exponent term may be considered a single logon. Then L would be described by three logom, and the varon content could arise from the two sources; uncertainty in the exponents and uncertainty in magnitude of x.
This can be clarified by making use of the fact that most mathematical relations are names for combinations of simple addi- tion. Thus, the description of L may be written:
For a given value of x this expression be- comes a series of x’s additively combined. The uncertainty arises from two sources: the measurement of the quantity x, and the decision of how many x’s to add (or what fractional part of x to add). This will be examined more carefully in another branch of mathematics. The reader can no doubt think of examples from his own speciality.
Series approximations Fourier series can be used to illustrate the
principles of description theory very well. A given function f(x) may be expressed in terms of a series of sine and cosine functions. The general expression for such an equiva- lence is:
A DESCRIPTIVE THEORY OF INFORMATION 299
In this case, the components are specific independent functions rather than variables, vector components, or numbers, and the relationship between the functions is re- stricted to that of addition. The number of logons is just the number of component functions in the series, and it is possible to use other functions besides sines and cosines if they meet the requirements of orthogonal- ity (independence). The general expression for a series expansion may be written as:
f(x> = CL e&), where the &(x) are orthonormal functions. The goodness of the approximation of the series to the function may be represented by a least squares expression :
[f(x) - k=l 5 &(x) lz dx.
Usually, as the logon content (n) increases, the fit becomes.bctter. If there is no un- certainty in the orthonormal functions, the total varon content for the series de- pends upon n, the number of orthonormal functions used. If the least squares expres- sion is divided by n, the result is similar to a variance measure, although about a func- tion, rather than a point, and it may be defined as the total varon content.
If the orthonormal functions are con- sidered to be approximate rather than exact, then there will be a contribution to the total varon content from them.
The orthonormal functions may in turn be decomposed into subfunctions; for example, sines and cosines may be expressed as series of polynomials. In this form the logical description of the function would become lengthy and the logon content would be large. The relations would be reduced to the elementary one of addition. The varon content would be transferred to the end of the series, so to speak. That is, the un- certainty could be expressed as a decision t o add or not add one more term or n more terms to the sequence.
Logon reduction and logon-varon THEORETICAL CONSIDERATIONS
compromise We often try to reduce logon content in
our symbolic activities. We make abbrevia-
tions, we abstract, round numbers, truncate series, and in other ways “cut problems down to size.” There may be basic physiological reasons for this. Miller (1956) describes some studies which indicate that the human organism can only handle a limited amount of data. He maintains that humans do not work with the bits of information theory, but with “chunks.” Logons, as described in this paper, may be considered equivalent to Miller’s chunks. When the amount of information which must be processed is uncomfortably large, the human reduces it by chunking or recoding, according to Miller.
The daily language abounds with examples of logon reduction. Abbreviations and word clipping continuously take place as in L‘com- mie” for “communist,” “VA” for “Veteran’s Administration,” “phono” for “phonograph,” “doc” for doctor,” ‘letc.’’ for “et cetera.”
Probably the cleanest illustration of logon reduction is seen in the language of mathe- matics. In the examples discussed pre- viously we saw that the logons could be numbers, variables, or functions. Each higher unit represents a compactness of logon content. In fact, much of mathematics pro- ceeds by naming complex combinations of variables and relations with some new sym- bol, thereby greatly reducing the logon content and making easy problems out of hard ones. For example, determinants evolved from simultaneous equations and represent a considerable symbolic simplifi- cation. Matrices, in turn, evolved from determinants, and matrix algebra represents a still greater simplification of symbol usage. Such simplifications make it easier for hu- mans to perceive new relations or properties which would otherwise be obscured. The reader can probably think of numerous other examples.
The human organism operates automati- cally to reduce logon content. The maximum logon content possible for perception of a visual field may be up to six million, cor- responding to the number of visual receptors (cones) of the eye, yet this is greatly reduced before the nerve impulses reach the visual area of the cortex. A similar reduction oc- curs in the input from other receptors.
Logon reduction is often possible, but is

300 BURYL PAYNE
usually obtained a t the price of increasing the varon content. When great precision is required, a large logon content should be maintained, but this demands more time, effort, or money. In most situations a com- promise must be made between precision and economy. In ordinary language we can either describe something very precisely and take a long time in doing so, or we can make our point quickly and risk being mis- understood. If the cost of precision is known, then the optimum trade-off point may be determined.
In ordinary English this process of com- promise is neatly carried out by using terms with multivalued meanings. By making the meaning of the terms partiaIIy dependent upon context, fewer terms (logons) are needed, our memories are not unduly bur- dened, and yet the descriptive power is not diminished. In fact, the 500 most commonly used words have over 14,000 different mean- ings. Not all languages have done this. The use of letters to represent sounds rather than ideas is an ingenious way of reducing logon content while still maintaining great flexi- bility. Cultures which have not made this step are burdened with extremely large alphabets.
Humans are free to vary the relationship between logon and varon content within wide limits. For example, a person can choose to look at a wall (one logon), a t the bricks making up the wall (several hundred logons), at patterns on the brick surfaces (thousands of logons), or a t minute granules of the bricks (tens of thousands of logons). He is limited at the upper logon content by the resolving power of his eyes, his instruments, and his time or energy. At the lower limit he is limited only by his ingenuity or willingness to cognize larger andlarger “units,” “chunks,” or “elements” into wholes.
Is there a conservative property?
The above considerations suggest that a conservative property-some invariant rela- tionship between logon and varon contents- could be found. (If so, it would be a logon reduction in description theory, an applica- tion of the theory to itself.)
If the logon content is taken as one, the
varon content will be a t its maximum value; when the logon is maximum, the varon content will be minimum. One of the simplest relations that could hold between the two is:
Vn = G, where c is a constant, n 2 1.
This particular relationship can be ex- amined for the special case of the series ap- proximation to a function. In this case the product of V and n is not equal to a con- stant, but to a function of n. By the defini- tion of total varon content given above :
The simple relation must be modified to an expression of the form: Vn = c(n). Although c(n) is not defined in general, for any ap- propriate set of orthonormal functions, ek(z), the integral, or the function c(n), ap- proaches zero as n increases. That is, c(n) is a monotonically decreasing funct,ion whose maximum occurs when n = 1. This at least sets an upper bound for the relation between varon and logon contents.
The relationship between logon and varon contents was determined for a set of six normal distributions placed 2.7 standard deviations apart, analogous to the dis- tributions shown in Figure 2 . The variances were calculated assuming resolution of 1 to 6 logons in systematic fashion and the result- ing relationship is plotted in Figure 3.
The varon content decreases as the logon content increases, leveling off a t 6. The dashed line represents the function: Vn = 22, where 22 is the maximum varon content, that is when n = 1. The figure shows how far the simple expression I’n = c is from the more exact relationship in this special case. Increasing the separation distances between the distributions would have the effect of producing a steeper drop in varon content as logon content increases. More separate distributions would merely extend the curve in both directions, and it appears possible to obtain a general function ex- pressing the change in varon content as a function of logon content and separation distance, but this is probably of only aca- demic value.

A DESCRIPTIVE THEORY OF INFORMATION
25
20
15
c C Q,
U
c s
>” 10
5
C
301
I I I 1 - 1 I
1 2 3 4 5 6 Logon Content
FIG. 3. Logon-Varon Relationship for Six Normal Distributions.
Optimum language Since logon content refers to the number
of categories in the descriptive framework or language used, it is logical to suppose that the logon-varon relationship would vary with this factor. The descriptive framework that is most appropriate should, ideally, result in minimum logon content and mini- mum varon content. The search for such optimum LLlanguages” or symbolic models is one of the chief tasks of science. Usually this means adapting one of the existing special languages, or mathematical models, to the
new situation; but it may require the inven- tion of a new “language”-a specialized symbolism or terminology.
The process of finding a language can be clearly illustrated in the case of the series approximation where
If the orthonormal functions are selected which are most appropriate for representing a particular function, then the expression under the integral sign will approach zero

302 BURYL PAYNE
more quickly as n increases. Or, on the contrary, for the same number of terms (logon content), the varon content may be considerably decreased by using appropriate orthonormal functions. Thus, one uses Bessel functions for problems involving caylindrical coordinates, Legendre polyiiomials for spher- ical problems, Fourier series for harmonic problems, and so on. Indeed much of mathe- matics consists of finding transformations which will make the problems easier to formulate and solve. The transformation may be a simple change from rectangular to spherical coordinates, a Laplace transforma- tion, a change from real to complex variables, or any of dozens of others. The genius is the one who can find the transformation which will turn a seemingly complex problem into a rimple one.
Optimum languages exist within our ordi- nary language. In fact there is no one ordi- nary language, but many diff ererit special- ized languages. Some have claimed that other languages are more suitable than English or western-Indo-European for cer- tain types of problems. (For example, Whorf says the Hopi Indian language is “natural” for relativity and other formu- lations of physics.) In certain simple cases it is possible to identify the terms (nouns) of ordinary English as logons, but usually there is too much variety, ambiguity, and so on-in fact, too much varon content. Furthermore, the relational and connective words are difficult to analyze.
The author attempted to determine an optimum language of description in a simple special case of pattern perception, and this research will be briefly described.
AN EXPERIMENT I N PATTERN PERCEPTION
If humans work with logon content, rather than bits as Miller has suggested (1956), it seems reasonable to assume that the logon measure could be used for studying sub- jective judgments of pattern complexity. The focus is then placed upon a suitable descriptive language for the patterns, rather than the patterns themselves. Other re- searchers (Attneave, 1959; Glanzer and Clark, 1964; Attneave and Arnoult, 1956) have suggested that organization is relative to the language used by the observer, but
experimental work has been scarce. Attempts to use information theory and the bit as a measure of pattern organization have not been satisfactory. In order to test logon content as a measure of complexity the author did an experiment in the judgment of simple line patterns. The results have been described in detail elsewhere (Payne, 1962).
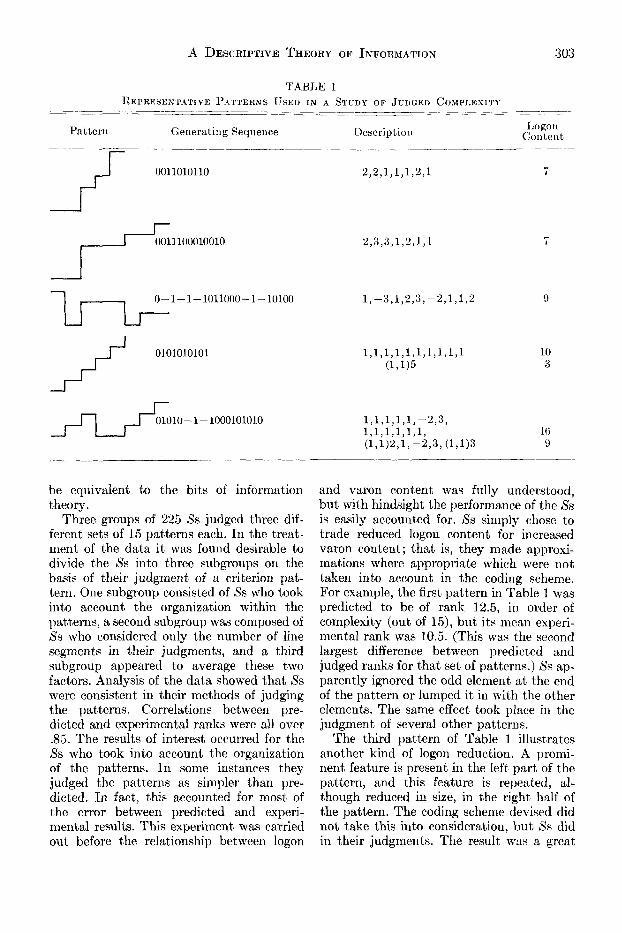
Patterns constructed of straight lines meeting at right angles were generated from binary sequences by letting “0” be rep- resented by a horizontal line segment of unit length arid “1” be represented by a vertical line segment directed upwards. Ternary se- quences were also used to generate a greater variety of figures by letting the additional element (- I ) be represented by a downward directed vertical line segment. Some of the patterns used are illustrated in Table 1.
Since binary sequences formed the basis of the patterns, the number of bits was readily determined. But, this is the limiting case: whenever some repetition of groups of bits was present, it was possible to recode the patterns using fewer items. Such repeti- tion served as the basis for a descriptive language. For example, a sequence such as 001001001000101 requires 15 bits, but since the group 001 is repeated three times the sequence can be recoded in a shorter form. Let A = 001, then we have AAA000101, and if we use subscripts to denote the length of a run, the sequence may be shortened to A303101. The number of items required is five plus an additional two to specify the components of the unit ‘A’. The use of subscripts is justified since the Ss see only the line patterns, not the generating se- quence, and a run generates an unbroken straight line. The number of items in the recorded sequence is taken as the logon content, and in this artificial case the varon content is zero. The details of the experi- ment are reported elsewhere (Payne, 1962). Table I shows a few of the generating sc- quences, coded descriptions, and logon con- tents along with the patterns. In description theory, organization of a pattern may be defined as being analogous to redundancy in information theory: Namely, Org = 1 - L,,,,n/L,nax ; that is, one minus the ratio of minimum to maximum logon content. In some cases, maximum logon content would
A DESCRIPTIVE THEORY O F INFORiVATION 303
0011100010010 f- 0- 1- 1- 1011000- 1- 10100 1,-3,1,2,3,-2,1,1,2
0101010101 ii r 4 #01010-1-1000101010
10 3
10 9
be equivalent to the bits of information theory.
Three groups of 225 Ss judged three dif- ferent sets of 15 patterns each. In the treat- ment of the data it was found desirable to divide the Ss into three subgroups on the basis of their judgment of a criterion pat- tern. One subgroup consisted of Ss who took into account the organization within the patterns, a second subgroup was composed of Ss who considered only the number of line segments in their judgments, and a third subgroup appeared to average these two factors. Analysis of the data showed that Ss were consistent in their methods of judging the patterns. Correlations between pre- dicted and experimental ranks were all over .85. The results of interest occurred for the Ss who took into account the organization of the patterns. In some instances they judged the patterns as simpler than pre- dicted. In fact, this accounted for most of the error between predicted and experi- mental results. This experiment was carried out before the relationship between logon
and varon content was fully understood, but with hindsight the performance of the Ss is easily accounted for. Ss simply chose to trade reduced logon content for increased varon content ; that is, they made approxi- mations where appropriate which were not taken into account in the coding scheme. For example, the first pattern in Table 1 mas predicted to be of rank 12.5, in order of complexity (out of 15), but its mean experi- mental rank was 10.5. (This was the second largest difference between predicted and judged ranks for that set of patterns.) Ss ap- parently ignored the odd element a t the end of the pattern or lumped it in with the other elements. The same effect took place in the judgment of several other patterns.
The third pattern of Table 1 illustrates another kind of logon reduction. A promi- nent feature is present in the left part of the pattern, and this feature is repeated, al- though reduced in size, in the right half of the pattern. The coding scheme devised did not take this into consideration, but Ss did in their judgments. The result was a great
304 BURYL PAYNE
difference between experimental and pre- dicted ranks. This effect, too, occurred with other patterns.
It would be possible to explore this be- havior of Ss to trade varon content for re- duced logon content in other situations, perhaps with more complex stimuli arid in other sensory dimensions.
Recently Glanzer and Clark (1964) re- ported an experiment in pattern perception along similar lines. They had Ss describe outline figures and correlated the length of the verbal descriptions with both the ac- curacy of reproduction after brief exposure, and with ratings of complexity. They ob- tained correlations greater than 0.8 in each case. In terms of description theory, Glanzer and Clark used words of ordinary English as logons rather than items in some artificial coding scheme. This permits greater flexi- bility, but reduces precision.
DISCUSSION
The idea of minimum logon content may be derived from a principle of least neural energy. Any neural model presupposes that some physical structure, some material substance, must be altered, modified, or created from some other substance. This may involve altering molecular or atomic energy levels, ionizing molecules, setting up reverberating circuits of nerve impulses, or changing cell structure, but whatever the process, some physical energy is certainly required for its occurrence. If the organism uses a particular coding scheme to store each stimulus in the brain, it is reasonable to assume that a certain finite amount of energy is required to store each element of the code. There would be a tendency for the organism to recode lengthy patterns into simpler form simply to reduce the amount of energy required for storage (Payne, 1966).
Presumably it takes some energy to recode stimuli, and equilibrium would occur when the energy to recode and store a given stimu- lus equals the storage energy of the un- recoded stimulus. There would be a tendency to be sloppy in recoding; that is, to let varon content increase in order to save neural energy. Another possibility is that a new stimulus would be readily identified aL one more case of an already familiar one and
stored as such. This too, would be economical of storage energy, but entails risk.
The formulation of logon reduction as discussed above may serve as a basis for certain gestalt phenomena such as closure, leveling, or the concept of a “good” figure. In terms of description theory, a good figure would be one that could be described with minimum logon content in some suitable descriptive “language.”
Description theory may also be of use in the construction of pattern recognition de- vices. Indeed, principles such as those dis- cussed in this paper have been stated in different ways by others. For example, Goodall (1960, 363) says:
“There is not much interest, at this stage of the game, in a device that merely recog- nizes nearness to some preconceived pattern. What one wants is something which con- structs its own categories for a given universe of patterns in such a way as to obtain a generalization. If fact, the basic philosophy of pattern recognition could be stated as that of obtaining minimal description. To do this in the present case one has to ortho- gonalize both the discriminant functions and the discriminate matrix; this is well known in multivariate statistics as the principle axis solution. The extremal property allows one to throw out components below a certain level of significance and thus obtain a dimension-reducing transformation, which is an essential feature of generalization.”
Some preliminary work in the mathe- niatics of pattern recognition based on a descriptive theory of information has been done by Lowitz (1964).
In a sense, description theory may be con- sidered as a generalized information theory. The logons may be identified as bits in the limit, and the varon content is reduced to zero. In most instances, however, the units are more than simple bits, and they nearly always have some finite varon content asso- ciated with them. The present paper simply outlines some of the basic formulations. Many problems remain to be worked out. These include the following:
( I ) The definition of varon content. Is variance a suitable measure in all cases where it can be computed? Would it be use-

A DESCRIPTIVE THEORY OF INFORMATION 305
ful to define the isolated term “varon” re- ferring to one element of varon content as RlacKay (1950) has defined the term “me- tron?”
(2) Is it possible, or worthwhile, to de- velop particular expressions for the rela- tionship between logon and varon content?
(3) The study of “relations” and “things.” The logon measure only applies to discrete categories in the descriptive language, yet each language has a grammar. The descrip- tive categories are related according to certain rules. How is this to be taken into account?
REFERENCES
Attneave, F. Applications of information theory to psychology. New York: Henry Holt, 1959.
Attneave, F., & Arnoult, M. D. The quantitative study of shape and pattern perception.
Glanzer, M., & Clark, W. H. The verbal-loop hypothesis: Conventional figures. Amer. J.
Goodall, M. C. Information theory. In C. Cherry,
Psych. Bull., 1956, 53, 452-471.
Psychol., 1964, 77, 621-626.
(Ed.), Fourth London Symposium, 1960,
Hardy, R., & Kurtz, P. A current appraisal of the behavioral sciences. Behav. Res. coun. Bull., 1963, Sec. 6, 99-105.
Lowitz, G. E. La reconnaissance des structures par la thdorie descriptive de l’information. Doctoral dissertation, Institut Blaise Pascal, Universitb de Paris, 1964.
MacKay, D. C. Quanta1 aspects of scientific in- format,ion. Phil. Mag., 1950, 41, 289-311.
MacKay, D. M. Quant.al aspects of scientific in- formation‘ I .R .E . Rep. of Proc., Symposium on Information Theory, 1955, PGIT-1,
Miller, G. A. The magical number seven, plus or minus two: Some limits on our capacity for processing information. Psychol. Rev., 1956,
Payne, B. The relationship between judged com- plexity and amount of descriptive informa- tion for visual patterns generated from binary and ternary sequences. Unpublished doctoral dissertation, University of Wash- ington, 1962.
Payne, B. Abstracting, identification, and the principle of least action. Gem. Semantics
Pp. 361-373.
60-80.
63, 81-97.
Bull. , 1966, 31 & 32, 56-62.
(Manuscript received July 28, 1965)
It is reasonably plain. . . that however able psychologists may be, i t is not their function to decide upon educational goals any more than the ablest general decides whether a nation should or should not be a t war. . . technicians and scientists often lack the kind of follow-up coniniitment that is the requisite of wise social policy. . . .
Yet it is also clear that generals do in fact have a strong influence on the polit,ics of war and peace and that scientists have had and will have a powerful influence on our defense and other policies. What is not so clear is the distinction between ends and means, between goals and their implementation. And perhaps it is just as well, for there is an intuitive familiarity that generals have with what is possible and what is not possible in war and in con- taining its threat, and there is a certain familiarity that psychol- ogists have with how one can get somebody to learn or to pay attention or to stay free of anxiety. While these are not ends in the strict sense, they shape our ends in educational policy as in defense policy. It i s . . . the psychologist’s lively sense of what is possible that can make him a powerful force. If he fails to fill his role as a diviner and delineator of the possible, then he does not serve the society wisely. If he confuses his function and narrows his vision of the possible to what he counts as desirable, then we shall all be the poorer. He can and must provide the full range of alterna- tives to challenge the society to choice.
JEROME BRUNER