Mass victimization and restorative justice in Colombia - Lirias
Upload
independentCategory
view
6download
0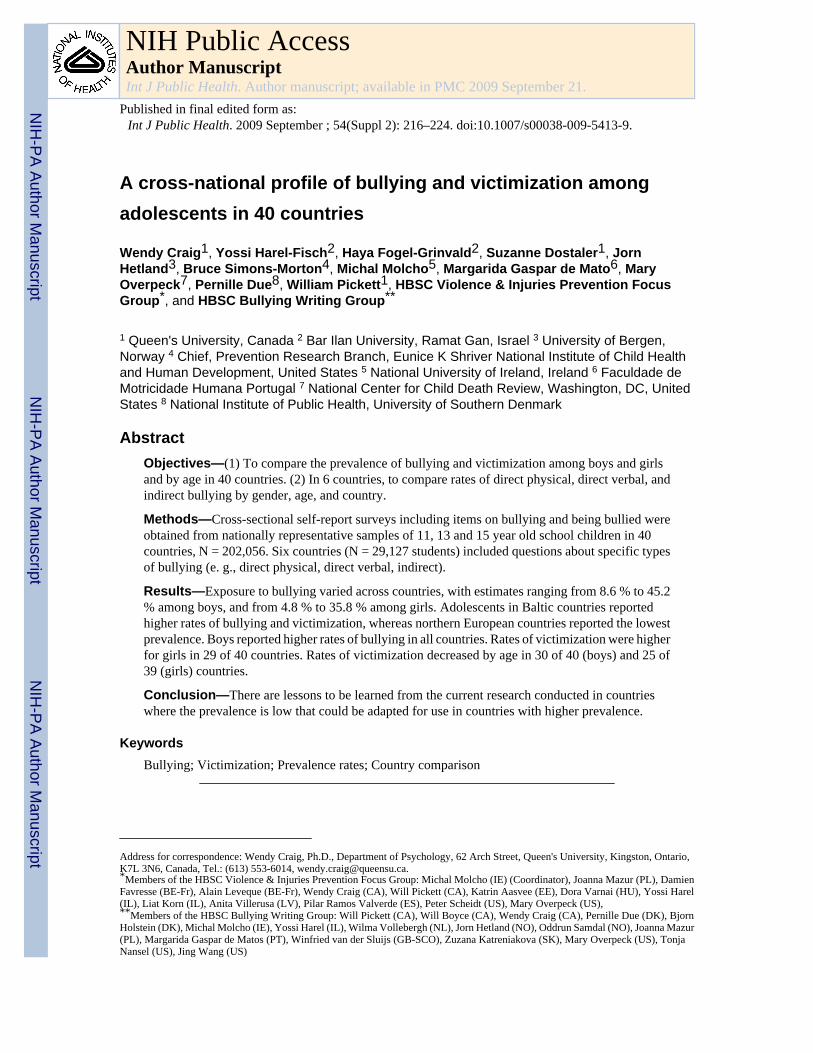
A cross-national profile of bullying and victimization amongadolescents in 40 countries
Wendy Craig1, Yossi Harel-Fisch2, Haya Fogel-Grinvald2, Suzanne Dostaler1, JornHetland3, Bruce Simons-Morton4, Michal Molcho5, Margarida Gaspar de Mato6, MaryOverpeck7, Pernille Due8, William Pickett1, HBSC Violence & Injuries Prevention FocusGroup*, and HBSC Bullying Writing Group**
1 Queen's University, Canada 2 Bar Ilan University, Ramat Gan, Israel 3 University of Bergen,Norway 4 Chief, Prevention Research Branch, Eunice K Shriver National Institute of Child Healthand Human Development, United States 5 National University of Ireland, Ireland 6 Faculdade deMotricidade Humana Portugal 7 National Center for Child Death Review, Washington, DC, UnitedStates 8 National Institute of Public Health, University of Southern Denmark
AbstractObjectives—(1) To compare the prevalence of bullying and victimization among boys and girlsand by age in 40 countries. (2) In 6 countries, to compare rates of direct physical, direct verbal, andindirect bullying by gender, age, and country.
Methods—Cross-sectional self-report surveys including items on bullying and being bullied wereobtained from nationally representative samples of 11, 13 and 15 year old school children in 40countries, N = 202,056. Six countries (N = 29,127 students) included questions about specific typesof bullying (e. g., direct physical, direct verbal, indirect).
Results—Exposure to bullying varied across countries, with estimates ranging from 8.6 % to 45.2% among boys, and from 4.8 % to 35.8 % among girls. Adolescents in Baltic countries reportedhigher rates of bullying and victimization, whereas northern European countries reported the lowestprevalence. Boys reported higher rates of bullying in all countries. Rates of victimization were higherfor girls in 29 of 40 countries. Rates of victimization decreased by age in 30 of 40 (boys) and 25 of39 (girls) countries.
Conclusion—There are lessons to be learned from the current research conducted in countrieswhere the prevalence is low that could be adapted for use in countries with higher prevalence.
KeywordsBullying; Victimization; Prevalence rates; Country comparison
Address for correspondence: Wendy Craig, Ph.D., Department of Psychology, 62 Arch Street, Queen's University, Kingston, Ontario,K7L 3N6, Canada, Tel.: (613) 553-6014, [email protected].*Members of the HBSC Violence & Injuries Prevention Focus Group: Michal Molcho (IE) (Coordinator), Joanna Mazur (PL), DamienFavresse (BE-Fr), Alain Leveque (BE-Fr), Wendy Craig (CA), Will Pickett (CA), Katrin Aasvee (EE), Dora Varnai (HU), Yossi Harel(IL), Liat Korn (IL), Anita Villerusa (LV), Pilar Ramos Valverde (ES), Peter Scheidt (US), Mary Overpeck (US),**Members of the HBSC Bullying Writing Group: Will Pickett (CA), Will Boyce (CA), Wendy Craig (CA), Pernille Due (DK), BjornHolstein (DK), Michal Molcho (IE), Yossi Harel (IL), Wilma Vollebergh (NL), Jorn Hetland (NO), Oddrun Samdal (NO), Joanna Mazur(PL), Margarida Gaspar de Matos (PT), Winfried van der Sluijs (GB-SCO), Zuzana Katreniakova (SK), Mary Overpeck (US), TonjaNansel (US), Jing Wang (US)
NIH Public AccessAuthor ManuscriptInt J Public Health. Author manuscript; available in PMC 2009 September 21.
Published in final edited form as:Int J Public Health. 2009 September ; 54(Suppl 2): 216–224. doi:10.1007/s00038-009-5413-9.
NIH
-PA Author Manuscript
NIH
-PA Author Manuscript
NIH
-PA Author Manuscript
IntroductionCountries throughout the world have identified bullying as a leading adolescent healthconcern1–3. Studies from individual countries such as Canada4, the United States5,Lithuania6, Israel7, Poland8 and Greenland9 have described the prevalence of bullying andvictimization. Several studies have examined correlates of bullying, including its associationwith mental and physical health problems10, academic problems11, and delinquency andcrime12. National and more local studies have also examined the epidemiology of bullying andprofiled its psychosocial correlates1,4,5, yet few cross-national studies have been conducted.Existing studies have either involved a limited number of countries, or have not consideredspecific types of bullying and developmental (or age) changes13.
The Health Behavior in School-Aged Children (HBSC) survey 2005/06 provided anopportunity to study bullying in a large multinational sample of school-aged children. In thisstudy, there are over 200 000 school children from 40 different European, North-Americancountries and Israel that were questioned about bullying and being bullied. This goal of thispaper is to compare contemporary estimates of the prevalence of bullying and victimizationamong adolescents across countries, using standard measures. In a subset of countries weexamine these changes for specific subtypes of bullying.
Bullying is defined as the use of power and aggression to cause distress or control another1–3. The use of power and aggression may be carried out through direct and indirect forms ofaggression. Direct bullying can include physical aggression (hitting, kicking) and verbalaggression (insults, racial or sexual harassment, threats). Indirect bullying is the manipulationof social relationships to hurt (gossiping, spreading rumors) or exclude the individual beingvictimized. With evolving developmental capacities the nature of bullying and victimizationmay change with age. Direct aggression of a physical or verbal nature is common in youngchildren14,15. As children age, physical aggression tends to decrease and verbal aggressionincreases16. As children develop in their social understanding, they become more capable ofindirect forms of aggression. To date no study has examined a multi-country comparison ofage related changes in forms of bullying. We hypothesize that physical bullying andvictimization will decrease with age and verbal and indirect bullying will increase. There arealso gender-specific differences in the developmental progression of aggressive strategies, withgirls implementing indirect aggression more than boys16. Since the forms of aggression varywith age and differ by gender, we expect that the type of victimization that children experiencewould reflect a similar developmental pattern.
If these age-or gender related patterns of bullying are consistent in our cross-country analyses,we can begin to speculate on the associated universal developmental processes that are themechanisms of these differences. The use of “age group” in this study will serve as a proxyfor investigating the importance of these varying psychosocial and developmental contexts ininfluencing bullying typology among adolescents. If the age and gender patterns are notconsistent, we will need to consider the cultural contributions to these variations.
This paper aims to compare estimates of the prevalence of bullying and associatedvictimization, and how these patterns change with age in adolescence and across countriesusing standard measures and methods. In addition, the relevance of the developmental contextwas investigated and the occurrence of direct physical, direct verbal, and indirect types ofbullying is described in a subsample of 6 countries. Finally, age and gender differences inbullying across countries will be examined. We expect that the age-related patterns will besimilar across countries, although the prevalence will likely vary due to larger cultural factors.
Craig et al. Page 2
Int J Public Health. Author manuscript; available in PMC 2009 September 21.
NIH
-PA Author Manuscript
NIH
-PA Author Manuscript
NIH
-PA Author Manuscript

MethodsStudy population and procedures
School-based anonymous surveys were conducted during the 2005/06 school year accordingto a common HBSC research protocol17. Each participating country surveyed a representativesample of school children ages 11, 13 and 15 (approximately grades 6th, 8th and 10th) usingidentical sampling methods18. Sampling unit was a classroom within schools selected by aweighted probability technique to ensure that students were equally likely to be included. Allstudents belonging to a sampled classroom (and present on survey day) were included in thesample. Some countries stratified by local relevant demographic characteristics such asethnicity, religion, language of instruction, etc. To address clustering effects within classroom,the sample requirements were for a minimum of 1,500 respondents for each of the three agegroups, totaling approximately n = 4,500 per country and resulting in a total of N = 202,056sampled children across all 40 countries. This inflated sample size made it possible to obtainsufficient confidence intervals of ±3 % for representative estimates with sample design effectsno more than 1.4 times greater than would be obtained from a simple random sample.
Study measuresTwo mandatory questions on bullying and victimization were included in the survey and wereused by all 40 participating countries (N = 202,056). Six countries, Italy, Luxembourg,Macedonia, Israel, Canada, and the United States (N = 29,127 students), included optionalquestions about specific types of bullying, enabling to asses the typology of bullying acrossthose countries.
Children who are bullied, victimized, and who have dual status (bully-victims)In all 40 countries, participants were asked to report how many times they had been bullied atschool in the past 2 months and how often they had taken part in bullying another student(s)at school in the past 2 months18. Possible responses were: never, once or twice, 2 or 3 times amonth, about once a week, or several times a week. Those who reported taking part in bullying≥ 2 or 3 times a month and did not report being victimized were classified as “children whobully others”. Those who reported being bullied ≥ 2 or 3 times a month and did not reportbullying others were classified as children who were “victimized by bullying”. Those whoreported bullying ≥ 2 or 3 times a month and being bullied ≥ 2 or 3 times a month were classifiedas having dual status, “bully-victims”. These were mutually exclusive categories because wewere interested in understanding the unique patterns associated with each role.
Specific Types of Bullying—Participants in the six countries using optional bullying itemsreported the frequency of different types of bullying and victimization19. Specific types ofreported bullying were: 1) physical: “have you hit, kicked, pushed, shoved around, or lockedanother student indoors?”; 2) verbal: “have you called another student(s) mean names, madefun of, or teased him or her in a hurtful way?”; 3) social: “have you kept another student outof things on purpose, excluded him or her from a group of friends, or completely ignored himor her?”; 4) sexual harassment: “have you made sexual jokes, comments, or gestures to anotherstudent(s)?”; 5) racial: “have you made fun of another student because of his or her race orcolor?”; 6) religious: “have you made fun of another student because of his or her religion?”.Questions about victimization asked about the same forms of bullying. Similar cutoff that wereimplemented with the general questions were used.
Consistent with existing classification systems18, different types of bullying and victimizationwere further sub-divided into 6 general categories: direct physical bullying (physical type);direct verbal bullying (any of verbal, sexual harassment, racial, or religious type); indirectbullying (social type), direct physical victimization, direct verbal victimization, and indirect
Craig et al. Page 3
Int J Public Health. Author manuscript; available in PMC 2009 September 21.
NIH
-PA Author Manuscript
NIH
-PA Author Manuscript
NIH
-PA Author Manuscript
victimization. Due to the overlap of these specific types of behaviours we did not look at thebully-victim role.
Statistical analysisData analyses were conducted with SPSS 14 (SPSS Inc, Chicago, IL). A conservative designeffect of 1.4 was used in the inflation of SE estimates to account for the cluster-basedsampling18. The prevalence of adolescents that reported bullying others, being victimized, ordual status was estimated for each age group (11, 13, and 15 years) and by sex within each ofthe 40 countries. For each of the six age/sex strata, medians and the range of reported prevalencevalues were estimated. Chi-square tests for linear trend were used to identify statisticallysignificant (p < 0.001) differences in age-specific prevalence estimates by sex within eachcountry. Fisher's exact test was used to test for significant differences in reported prevalenceby sex. Results were summarized into overall cross-national trends. Specific types of bullyingand victimization were described for 6 countries.
ResultsAdolescents (N = 202,056) in 40 countries participated in the 2005/06 HBSC survey. Of these,10.7 % (N = 21,192) reported bullying others, 12.6 % (N = 24,919) reported being bullied and3.6 % (N = 7,138) reported being both a bully and a victim of bullying.
Geographic patterns in bullying and associated victimization (40 countries)Involvement of boys in all 3 categories of bullying combined (i. e., bullying others, beingbullied and being both a bully and a victim), ranged from 8.6 % in Sweden to 45.2 % inLithuania (Fig. 1). This represents a 5 – fold difference across countries with an overall medianof 23.4 %. Among girls, the prevalence of involvement in bullying ranged from 4.8 % inSweden to 35.8 % in Lithuania (Fig. 2), a 7 – fold difference across countries with an overallmedian of 15.8 %. Seven countries were notable in that boys and girls both reported highprevalence rates of victimization from bullying relative to other countries (both genders werein “top 10” of 40 countries by rank: Lithuania, Latvia, Greece, Greenland, Romania, Turkey,and Ukraine). For bullying others, 9 countries were among the “top 10” countries for bothgenders (Latvia, Estonia, Greece, Lithuania, Romania, Greenland, Ukraine, Russia, andAustria). With respect to the lowest reported rates, 8 countries (Hungary, Norway, Ireland,Finland, Sweden, Iceland, Czech Republic, and Wales) were among the “bottom 10” countriesfor both genders. In general, countries in north-west Europe (primarily Scandinavian countries)reported lower prevalence of bullying and victimization compared to eastern Europeancountries.
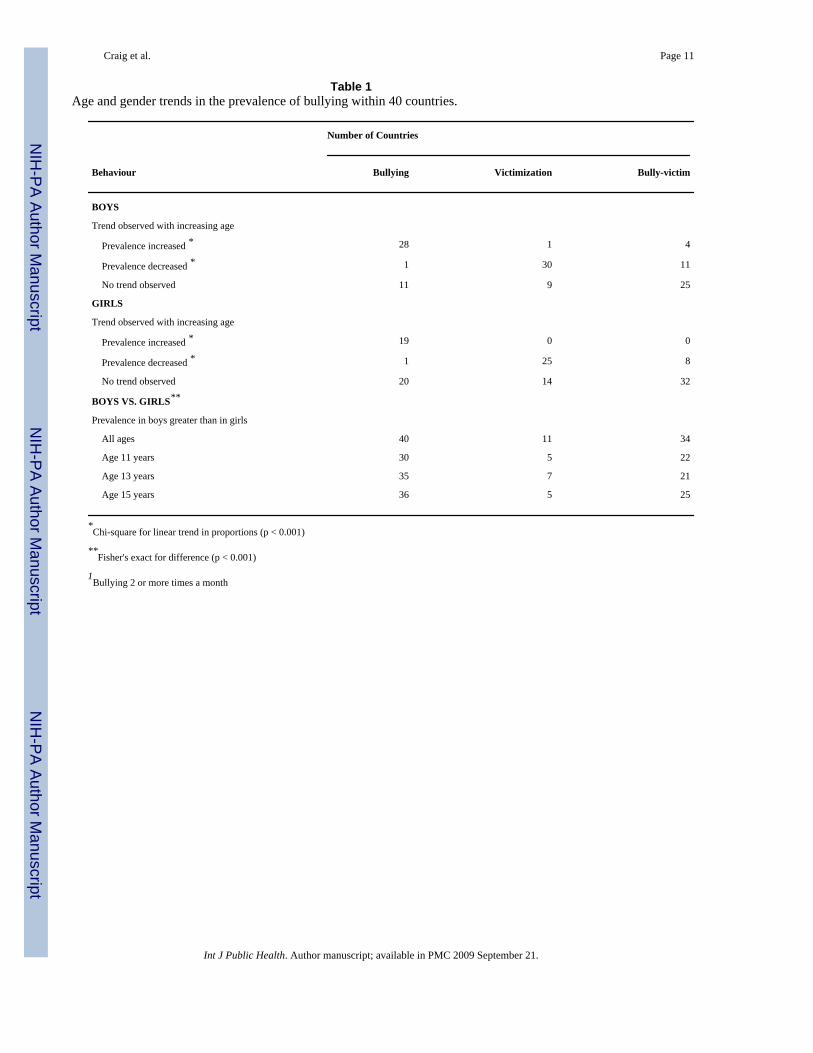
Trends in bullying and associated victimization by age and gender (40 countries)Consistent age-related patterns were observed among boys (Tab. 1), with a significant increasein the prevalence of bullying by age in 28 of 40 countries, and a significant decline in reportedprevalence of boys who were victimized by bullying in 30 of 40 countries. Age-related patternswere less consistent for girls, although in 25 of 40 countries victimization from bullyingdecreased with increasing age and the prevalence of girls involved in bullying increased in 19countries. In 20 countries no trend was observed.
There were clear differences observed in prevalence reported for boys vs. girls. For bullying,reported rates were statistically higher (p < 0.001) among boys vs. girls in 40/40 countries;these differences were observed in each age group in a majority of countries (Tab. 1). Girlsreported being victimized more than boys; p < 0.001 in most countries but this trend wasinconsistent across age. Boys reported being both bullying and being victimized more often in
Craig et al. Page 4
Int J Public Health. Author manuscript; available in PMC 2009 September 21.
NIH
-PA Author Manuscript
NIH
-PA Author Manuscript
NIH
-PA Author Manuscript
the two older age groups in most countries (p < 0.001). The same trend was only observed forgirls in the oldest age group.
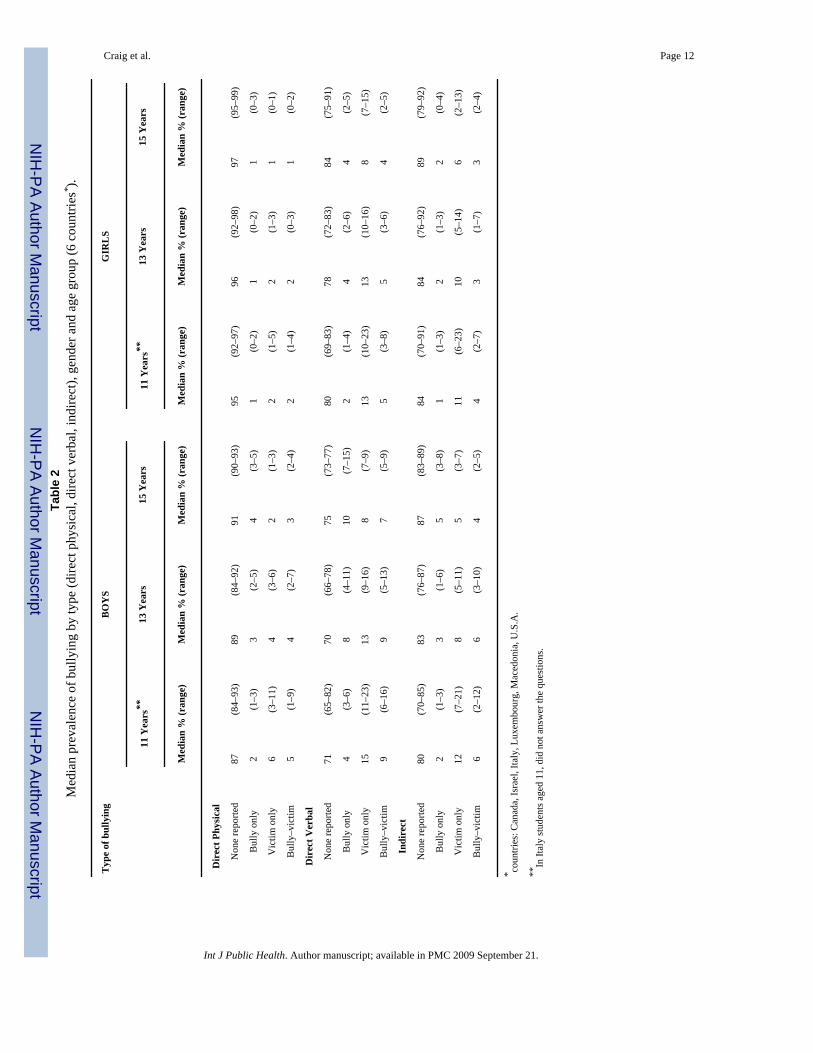
Specific types of bullying and associated victimization (6 countries)For these analyses, we utilized participants who first reported on general bullying orvictimization and then reported on the type of bullying or victimization. The majority ofadolescents in each country did not engage in each of the specific types of bullying (Tab. 2).Boys reported higher rates than girls of each of direct physical, direct verbal, and indirect typesof bullying, and this pattern was apparent in each age group in most countries. For boys whobully, there was an increase in reported prevalence in Canada and Luxembourg with age, butno trend in Israel, Italy, and the United States. In Macedonia, there was a decrease with age indirect physical and indirect bullying for boys. For girls, with the exception of Macedonia, therewere no age trends in direct bullying. For verbal bullying in girls, there was a decrease in Israel,but no age trend in the other five countries. For indirect bullying in girls, there was a decreasein Macedonia, but no age trend in the other five countries. In the majority of countries, therewere limited or no changes by age group in the prevalence of the different forms of bullyingamong both genders.
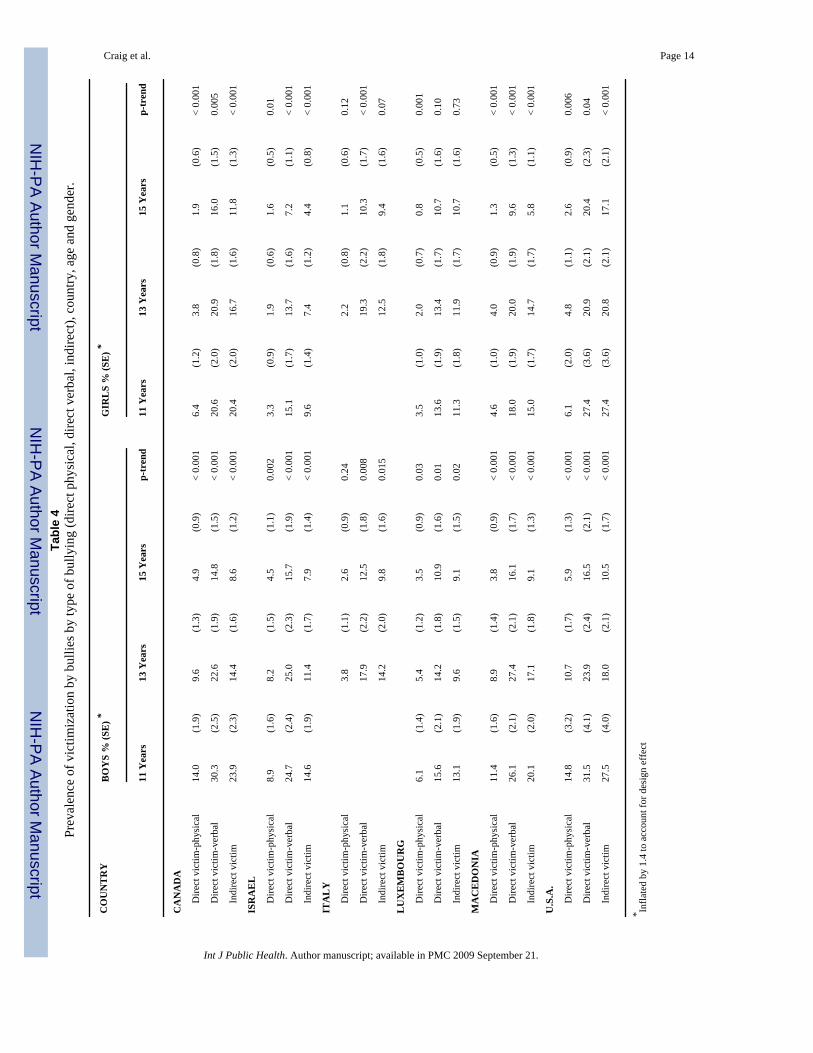
Similar country-specific analyses of being bullied are described in Tab. 3. The vast majorityof children in most countries were not victimized. As children aged from 11 to 15 years, theprevalence of being victimized by each of the 3 types typically declined among both boys andgirls. This finding was true for all countries for all types of bullying. Patterns of the types ofvictimization were highly consistent gender, with no observed changes by age group.
DiscussionBullying and victimization is a universal public health problem and impacts large numbers ofadolescents. In our 40-country analysis, 26 % participating adolescents (n = 53,249) reportedinvolvement in bullying. Bullying involvement transcends cultural and geographic boundaries.Age differences found in bullying and victimization may be a distal proxy for investigating theimpact of varying social contexts (school, peer) and developmental transitions (i. e., social,psychological, and biological). Given the significant psychological, physical, academic, andsocial implications of these behaviours1–5, there is a clear need to address this universalproblem and increase understanding of the more proximal developmental mechanisms thatmay promote or inhibit bullying including cultural influences, school climate, peer processes,adult attitudes and behaviours, and family interactions12,13,20.
Adolescents in different countries reported strikingly different rates of involvement in bullyingand victimization, with 5-fold differences reported between countries by boys, and 7-folddifference reported between countries for girls. These variations may reflect important culturaland social differences or differences in the implementation of national policy and programs.For example, in countries where the prevalence was relatively low (mainly Scandinavian) thereare national programs in place to address bullying whereas in the countries with the highestprevalence (eastern European) there are no country-wide national campaigns. The disparity inprevalence rates of bullying involvement may in fact reflect the success of these nationalinitiatives that have been ongoing for many years (e. g., Olweus, 1993)19. A more systemicreview of bullying prevention initiative by country is required. This variation across countriesmay also reflect cultural differences in the definitions of bullying. Smith et al.21 reported thatdue to cultural variations in the conceptualization and understanding of bullying, pictures arethe only reliable method to collect cross-national comparable data. Thus, the interpretation ofour findings on cross-national differences should be interpreted cautiously as the observedlarge difference in prevalence might be due to cross-cultural differences in the understandingor it may be methodological in that the scale assessing bullying did not utilize pictures.
Craig et al. Page 5
Int J Public Health. Author manuscript; available in PMC 2009 September 21.
NIH
-PA Author Manuscript
NIH
-PA Author Manuscript
NIH
-PA Author Manuscript
However, it is less likely that the association between bullying and age or gender is largelyaffected by such cross-cultural differential functioning in the indicators.
Some observed trends suggested universal patterns of involvement in bullying by gender andage, yet less than hypothesized. Bullying rates across all ages were higher in boys than in girls,consistent with previous studies, suggesting a possible reflection of bullying as a dominancestrategy in boys or potentially boys are more willing to report their bullying behaviours. Thesame pattern was not true for adolescents victimized by bullying. Girls, in the majority ofcountries, were more likely to report higher levels of victimization than boys and this patternwas relatively similar for each age group. For both boys and girls, the prevalence ofvictimization from bullying decreased in half the countries with increasing age. However, inthe other half of the counties, no such trend was identified. This inconsistent country patternsuggests cultural specific interpretations.
There are three possible mechanisms that may influence age variations in bullying typology.(1) Development of psychological, cognitive and physical capabilities, (2) changes in socialskills and experience, and (3) changes in social activities and academic demands associatedwith elementary school (age 11), middle school (age 13, and high school (age 15) educationalstages and settings.
Boys were more likely than girls to be involved in both bullying others and being bullied.According to the “gateway theory”21, children develop risk behaviours in stages from minorto more severe involvements. This model might apply to the development of bullyingbehaviour. Children who are victimized by bullying might get involved in bullying others,which places them at risk to increase their involvement so that bullying becomes part of theirsocial lifestyle (e. g., more than twice a month). A chronic involvement in both bullying andbeing bullied might be viewed as a step further in the gateway progression of risk, and placethe bully-victim in even a higher risk that might have long term psychosocial anddevelopmental consequences. According to our cross-sectional data the prevalence of bully-victims remained stable across age in 25 of 40 countries (boys) respectively in 32 out of 40countries (girls). Longitudinal studies need to address this hypothesis.
The sub-analyses on type of bullying with the six countries may clarify the gender and age-related patterns. Stereotypical patterns of bullying suggest that boys are more likely to useverbal and physical aggression while girls bully more often with indirect and verbalaggression15. Similarly, research suggests that girls increase in their indirect bullying withage15. The observed patterns of bullying did not reflect these stereotypes. Boys reportedengaging in more of all forms of bullying than girls and this finding was relatively consistentacross age and country. The reported prevalence of indirect bullying was relatively low forboth genders. There was consistency with the literature on physical bullying which was muchless prevalent than other forms of bullying. There were limited age-related differences in theform of bullying. The lack of developmental trends suggest that youth who bully are morelikely to be generalist (e. g., they do not specialize on one form of bullying over another) andthey do not change this pattern with age.
The prevalence of victimization in the 6 country analyses was consistent for both genders:Victimization generally declined with age for all types. The reduction in victimization by agecould be attributable to age related changes in youth adapting socially as they develop or reflectequalization in physical sizes and consequently, increased effectiveness at inhibiting bullyingor reflect the differences in circumstances of elementary, middle and high school in theirrespective social climate and academic demands. Adolescents who bully may be targeting afewer number of students with increasing age or targeting younger children. It would beimportant to identify who is bullying who to further understanding of the bully-victim
Craig et al. Page 6
Int J Public Health. Author manuscript; available in PMC 2009 September 21.
NIH
-PA Author Manuscript
NIH
-PA Author Manuscript
NIH
-PA Author Manuscript
relationship. Those youth who continue to be victimized at older ages are likely to be veryvulnerable to long-term problems. These hypotheses require national and longitudinal study.Finally, for both boys and girls, in the majority of countries, there were no clear age-relateddifferences in the prevalence for those youth with dual status.
The strengths of this research include standard survey methodology employed and thecomparison of prevalence across 40 countries. Limitations of this analysis warrant comment.They include our use of self-reported data and the cross-sectional nature of the survey. TheHBSC questionnaire items have been subjected to extensive piloting and validation efforts, yetthe possibility of biased reporting motivated by a desire to provide socially desirable responsesmust be recognized. The cross-sectional design limits our ability to infer causal relationshipsand our analyses must be viewed as exploratory in the absence of longitudinal data. Becausethese findings are based upon classroom samples, they will not be representative of adolescentsin out of school settings and it is these adolescents who may be at the highest risk forinvolvement in bullying.
ImplicationsBullying is a global social health problem and requires intervention at a population level. Anunderstanding of the problem begins with prevalence estimates and national and cross-nationalcomparisons, such as provided in this paper. More knowledge about the etiology of bullyingand the psychosocial and behavioural determinants, and the role of contextual factors is needed,including national, prospective, and cross-national studies of etiology. There is a growing needfor more intensive international collaboration in both research and the development andevaluation of prevention strategies so that we can be more effective in reducing this publichealth problem. There may be valuable lessons to be learned from current research conductedin countries where the reported prevalence is low that could be adapted for use in countrieswith higher prevalence. Health promotion and prevention strategies need to address bullyingproblems to make the world safer for all adolescents.
AcknowledgmentsHBSC is an international study carried out in collaboration with WHO/EURO. The international coordinator of the2001–2002 and 2005–2006 study was Candace Currie, University of Edinburgh, Scotland; and the data bank managerwas Oddrun Samdal, University of Bergen, Norway. A complete list of the participating researchers can be found onthe HBSC website (www.HBSC.org).
This research was supported in part by the intramural program of the NICHD (Contract # N01-HD-5-3401).
References1. Nansel TR, Overpeck MD, Haynie DL, Ruan J, Scheidt PC. Relationships between bullying and
violence among US youth. Arch Pediatr Adolesc Med 2003;157:348–53. [PubMed: 12695230]2. Craig WM, Pepler DJ. Identifying and targeting risk for involvement in bullying and victimization.
Can J Psychiatry 2003;48:577–82. [PubMed: 14631877]3. Due P, Holstein PE, Lynch J, et al. Health Behavior in School-Aged Children. Bullying Working
Group. Bullying and symptoms among school-aged children: international comparative cross sectionalstudy in 28 countries. Eur J Public Health 2005;15:128–32. [PubMed: 15755782]
4. Volk A, Craig WM, Boyce W, King M. Perceptions of parents, mental health, and school amongstCanadian adolescents from the provinces and the northern territories. Can J School Psychol2006;21:33–46.
5. Nansel TR, Overpeck M, Pilla RS, Ruan WJ, Simons-Morton B, Scheidt P. Bullying behaviors amongUS youth: prevalence and association with psychosocial adjustment. J Am Med Assoc 2001;285:2094–100.
Craig et al. Page 7
Int J Public Health. Author manuscript; available in PMC 2009 September 21.
NIH
-PA Author Manuscript
NIH
-PA Author Manuscript
NIH
-PA Author Manuscript
6. Zaborskis A, Cirtautiene L, Žemaitiene N. Bullying in Lithuanian schools in 1994–2002. Medicina(Kaunas) 2005;41:614–20. [PubMed: 16062030]
7. Molcho M, Harel Y, Dina LO. Substance use and youth violence. A study among 6th to 10th gradeIsraeli school children. Int J Adolesc Med Health 2004;16:239–51. [PubMed: 15551841]
8. Mazur J, Malkowska A. Bullies and victims among Polish school-aged children. Med Wieku Rozwoj2003;7:121–34. [PubMed: 14704495]
9. Schnohr C, Niclasen BV. Bullying among Greenlandic schoolchildren: development since 1994 andrelations to health and health behavior. Int J Circumpolar Health 2006;654:305–12. [PubMed:17131968]
10. Kumpulainen K, Rasanen E. Children involved in bullying at elementary school age: their psychiatricsymptoms and deviance in adolescence: an epidemiological sample. Child Abuse Negl2000;24:1567–77. [PubMed: 11197035]
11. Pellegrini, A. Bullying during the middle school years. In: Sanders, CE.; Phye, GD., editors. Bullying:implications for the classroom. New York, New York: Elsevier; 2004. p. 177-202.
12. Pepler D, Jiang D, Craig W, Connolly J. Developmental trajectories of bullying and associated factors.Child Dev 2008;79:325–38. [PubMed: 18366426]
13. Nansel T, Craig WM, Overpeck M, Saluja G, Ruan J, Health Behavior in School-aged ChildrenBullying Analyses Working Group. Cross-national consistency in relationship between bullyingbehaviors and psychosocial adjustment. Arch Ped Adoles Med 2004;158:730–46.
14. Ayers CD, Williams JH, Hawkins JD, Peterson PL, Abbott RD. Assessing correlates of onset,escalation, deescalation, and desistance of delinquent behavior. J Quant Criminol 1999;15:277–306.
15. Bjorkqvist, K.; Osterman, K.; Kaukiainen, A. The development of direct and indirect aggressivestrategies in males and females. In: Bjorkqvist, K.; Niemela, P., editors. Of mice and women: aspectsof female aggression. New York, New York: Academic Press; 1991. p. 51-64.
16. Nishina A, Juvonen J, Witkow M. Sticks and stones may break my bones, but names will make mefeel sick: the psychosocial, somatic, and scholastic consequences of peer harassment. J Clin ChildAdolesc Psychol 2005;34:37–48. [PubMed: 15677279]
17. Currie, C.; Nic Gabhainn, S.; Godeau, E., et al., editors. Inequalities in young people's health: HBSCinternational report from the 2005/2006 Survey. Copenhagen, Denmark: WHO Regional Office forEurope; 2008.
18. Currie, C., et al., editors. 2005/06 Survey Protocol for the Health Behaviour in School-Aged ChildrenSurvey. Edinburgh: University of Edinburgh, Child and Adolescent Health Research Unit; 2007.
19. Olweus, D. Bullying at School: what we know and what we can do. Cambridge, MA: BlackwellPublishers; 1993.
20. Spriggs AL, Iannotti RJ, Nansel TR, Haynie DL. Adolescent bullying involvement and perceivedfamily, peer and school relations: commonalities and differences across race/ethnicity. J AdolescHealth 2007;41:283–93. [PubMed: 17707299]
21. Smith PK, Cowie H, Olafsson R, Liefooghe APD, et al. Definitions of bullying: a comparison ofterms used, and age and sex differences, in a 14-country international comparison. Child Dev2002;73:1119–33. [PubMed: 12146737]
Craig et al. Page 8
Int J Public Health. Author manuscript; available in PMC 2009 September 21.
NIH
-PA Author Manuscript
NIH
-PA Author Manuscript
NIH
-PA Author Manuscript
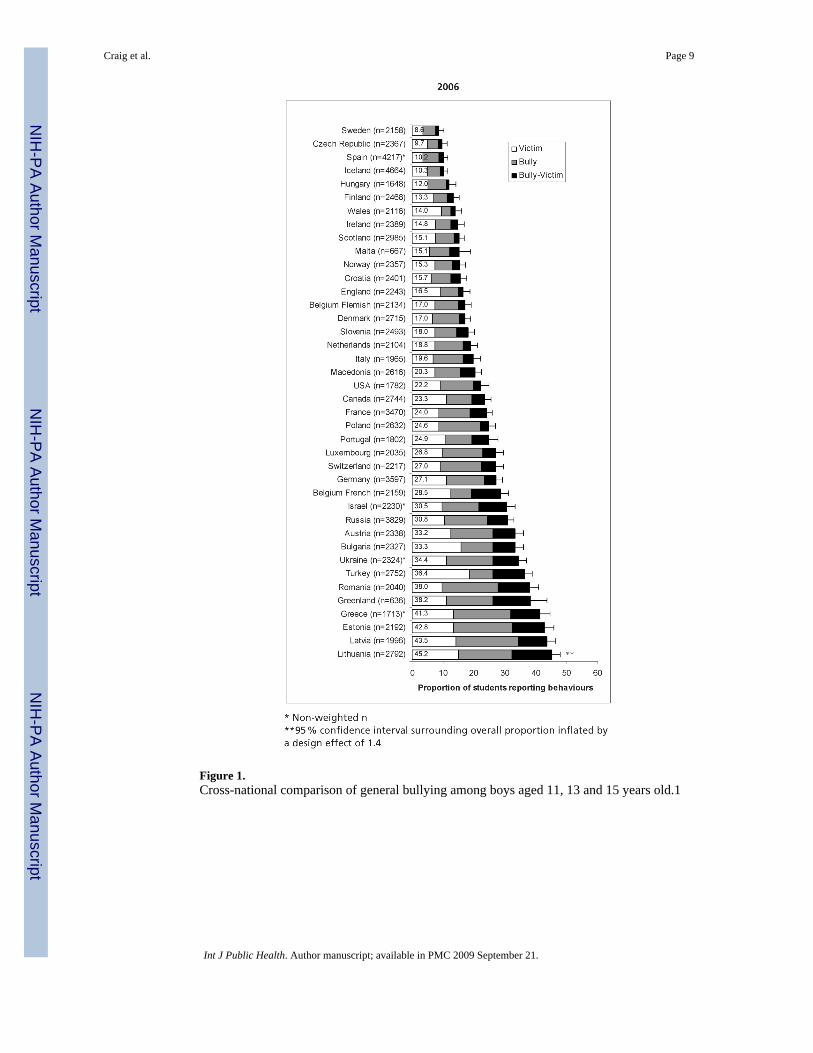
Figure 1.Cross-national comparison of general bullying among boys aged 11, 13 and 15 years old.1
Craig et al. Page 9
Int J Public Health. Author manuscript; available in PMC 2009 September 21.
NIH
-PA Author Manuscript
NIH
-PA Author Manuscript
NIH
-PA Author Manuscript

Figure 2.Cross-national comparison of general bullying among girls aged 11, 13 and 15 years old.
Craig et al. Page 10
Int J Public Health. Author manuscript; available in PMC 2009 September 21.
NIH
-PA Author Manuscript
NIH
-PA Author Manuscript
NIH
-PA Author Manuscript
NIH
-PA Author Manuscript
NIH
-PA Author Manuscript
NIH
-PA Author Manuscript
Craig et al. Page 11
Table 1Age and gender trends in the prevalence of bullying within 40 countries.
Number of Countries
Behaviour Bullying Victimization Bully-victim
BOYS
Trend observed with increasing age
Prevalence increased * 28 1 4
Prevalence decreased * 1 30 11
No trend observed 11 9 25
GIRLS
Trend observed with increasing age
Prevalence increased * 19 0 0
Prevalence decreased * 1 25 8
No trend observed 20 14 32
BOYS VS. GIRLS**
Prevalence in boys greater than in girls
All ages 40 11 34
Age 11 years 30 5 22
Age 13 years 35 7 21
Age 15 years 36 5 25
*Chi-square for linear trend in proportions (p < 0.001)
**Fisher's exact for difference (p < 0.001)
1Bullying 2 or more times a month
Int J Public Health. Author manuscript; available in PMC 2009 September 21.
NIH
-PA Author Manuscript
NIH
-PA Author Manuscript
NIH
-PA Author Manuscript
Craig et al. Page 12Ta
ble
2M
edia
n pr
eval
ence
of b
ully
ing
by ty
pe (d
irect
phy
sica
l, di
rect
ver
bal,
indi
rect
), ge
nder
and
age
gro
up (6
cou
ntrie
s* ).
Typ
e of
bul
lyin
gB
OY
SG
IRL
S
11 Y
ears
**13
Yea
rs15
Yea
rs11
Yea
rs**
13 Y
ears
15 Y
ears
Med
ian
% (r
ange
)M
edia
n %
(ran
ge)
Med
ian
% (r
ange
)M
edia
n %
(ran
ge)
Med
ian
% (r
ange
)M
edia
n %
(ran
ge)
Dir
ect P
hysi
cal
N
one
repo
rted
87(8
4–93
)89
(84–
92)
91(9
0–93
)95
(92–
97)
96(9
2–98
)97
(95–
99)
B
ully
onl
y2
(1–3
)3
(2–5
)4
(3–5
)1
(0–2
)1
(0–2
)1
(0–3
)
V
ictim
onl
y6
(3–1
1)4
(3–6
)2
(1–3
)2
(1–5
)2
(1–3
)1
(0–1
)
B
ully
–vic
tim5
(1–9
)4
(2–7
)3
(2–4
)2
(1–4
)2
(0–3
)1
(0–2
)
Dir
ect V
erba
l
N
one
repo
rted
71(6
5–82
)70
(66–
78)
75(7
3–77
)80
(69–
83)
78(7
2–83
)84
(75–
91)
B
ully
onl
y4
(3–6
)8
(4–1
1)10
(7–1
5)2
(1–4
)4
(2–6
)4
(2–5
)
V
ictim
onl
y15
(11–
23)
13(9
–16)
8(7
–9)
13(1
0–23
)13
(10–
16)
8(7
–15)
B
ully
–vic
tim9
(6–1
6)9
(5–1
3)7
(5–9
)5
(3–8
)5
(3–6
)4
(2–5
)
Indi
rect
N
one
repo
rted
80(7
0–85
)83
(76–
87)
87(8
3–89
)84
(70–
91)
84(7
6–92
)89
(79–
92)
B
ully
onl
y2
(1–3
)3
(1–6
)5
(3–8
)1
(1–3
)2
(1–3
)2
(0–4
)
V
ictim
onl
y12
(7–2
1)8
(5–1
1)5
(3–7
)11
(6–2
3)10
(5–1
4)6
(2–1
3)
B
ully
–vic
tim6
(2–1
2)6
(3–1
0)4
(2–5
)4
(2–7
)3
(1–7
)3
(2–4
)
* coun
tries
: Can
ada,
Isra
el, I
taly
, Lux
embo
urg,
Mac
edon
ia, U
.S.A
.
**In
Ital
y st
uden
ts a
ged
11, d
id n
ot a
nsw
er th
e qu
estio
ns.
Int J Public Health. Author manuscript; available in PMC 2009 September 21.

NIH
-PA Author Manuscript
NIH
-PA Author Manuscript
NIH
-PA Author Manuscript
Craig et al. Page 13Ta
ble
3Pr
eval
ence
of b
ully
ing
by ty
pe (d
irect
phy
sica
l, di
rect
ver
bal,
indi
rect
), co
untry
, age
and
gen
der.
CO
UN
TR
YB
OY
S %
(SE
) *G
IRL
S %
(SE
) *
11 Y
ears
13 Y
ears
15 Y
ears
p-tr
end
11 Y
ears
13 Y
ears
15 Y
ears
p-tr
end
CA
NA
DA
D
irect
bul
lyin
g-ph
ysic
al5.
6(1
.3)
6.1
(1.1
)6.
7(1
.1)
0.34
1.9
(0.7
)1.
8(0
.6)
1.6
(0.5
)0.
57
D
irect
bul
lyin
g-ve
rbal
8.7
(1.6
)13
.4(1
.5)
14.0
(1.5
)0.
003
4.0
(1.0
)7.
5(1
.1)
8.0
(1.1
)<
0.00
1
In
dire
ct b
ully
ing
4.4
(1.1
)5.
9(1
.1)
6.4
(1.0
)0.
083.
9(1
.0)
3.9
(0.8
)3.
9(0
.8)
0.99
ISR
AE
L
D
irect
bul
lyin
g-ph
ysic
al10
.1(1
.7)
10.0
(1.6
)8.
2(1
.5)
0.26
2.9
(0.8
)1.
9(0
.6)
2.7
(0.7
)0.
94
D
irect
bul
lyin
g-ve
rbal
17.7
(2.1
)21
.4(2
.2)
18.0
(2.0
)0.
948.
0(1
.3)
8.0
(1.2
)5.
1(0
.9)
0.00
8
In
dire
ct b
ully
ing
8.3
(1.5
)9.
6(1
.6)
7.3
(1.4
)0.
452.
9(0
.8)
2.9
(0.8
)2.
4(0
.6)
0.40
ITA
LY
D
irect
bul
lyin
g-ph
ysic
al6.
8(1
.4)
6.8
(1.4
)0.
990.
9(0
.5)
0.8
(0.5
)0.
75
D
irect
bul
lyin
g-ve
rbal
19.2
(2.2
)17
.4(2
.1)
0.40
7.6
(1.5
)6.
9(1
.4)
0.64
In
dire
ct b
ully
ing
10.0
(1.7
)7.
8(1
.5)
0.18
6.2
(1.3
)6.
2(1
.3)
0.95
LU
XE
MB
OU
RG
D
irect
bul
lyin
g-ph
ysic
al2.
7(0
.9)
4.3
(1.0
)6.
8(1
.3)
< 0.
001
1.4
(0.7
)1.
3(0
.6)
2.0
(0.7
)0.
43
D
irect
bul
lyin
g-ve
rbal
6.1
(1.4
)13
.0(1
.7)
19.4
(2.0
)<
0.00
15.
4(1
.3)
5.9
(1.2
)7.
5(1
.4)
0.11
In
dire
ct b
ully
ing
3.7
(1.1
)6.
9(1
.3)
9.9
(1.5
)<
0.00
13.
2(1
.0)
3.0
(0.9
)5.
0(1
.1)
0.07
MA
CE
DO
NIA
D
irect
bul
lyin
g-ph
ysic
al9.
2(1
.4)
7.4
(1.3
)5.
9(1
.1)
0.01
4.0
(0.9
)2.
8(0
.8)
1.0
(0.4
)<
0.00
1
D
irect
bul
lyin
g-ve
rbal
17.8
(1.9
)16
.0(1
.8)
14.9
(1.6
)0.
108.
7(1
.4)
8.6
(1.3
)6.
8(1
.2)
0.14
In
dire
ct b
ully
ing
13.4
(1.7
)9.
8(1
.4)
7.4
(1.2
)<
0.00
17.
7(1
.3)
6.0
(1.1
)3.
2(0
.8)
< 0.
001
U.S
.A.
D
irect
bul
lyin
g-ph
ysic
al4.
8(1
.9)
9.7
(1.7
)7.
2(1
.4)
0.67
3.1
(1.4
)4.
9(1
.1)
4.0
(1.1
)0.
71
D
irect
bul
lyin
g-ve
rbal
11.6
(2.9
)17
.9(2
.1)
18.8
(2.2
)0.
068.
1(2
.2)
12.8
(1.7
)9.
8(1
.7)
0.86
In
dire
ct b
ully
ing
8.8
(2.5
)12
.2(1
.8)
10.5
(1.7
)0.
786.
8(2
.0)
9.3
(1.5
)7.
2(1
.5)
0.87
* SE in
flate
d by
1.4
to a
ccou
nt fo
r des
ign
effe
ct
Int J Public Health. Author manuscript; available in PMC 2009 September 21.
NIH
-PA Author Manuscript
NIH
-PA Author Manuscript
NIH
-PA Author Manuscript
Craig et al. Page 14Ta
ble
4Pr
eval
ence
of v
ictim
izat
ion
by b
ullie
s by
type
of b
ully
ing
(dire
ct p
hysi
cal,
dire
ct v
erba
l, in
dire
ct),
coun
try, a
ge a
nd g
ende
r.
CO
UN
TR
YB
OY
S %
(SE
) *G
IRL
S %
(SE
) *
11 Y
ears
13 Y
ears
15 Y
ears
p-tr
end
11 Y
ears
13 Y
ears
15 Y
ears
p-tr
end
CA
NA
DA
D
irect
vic
tim-p
hysi
cal
14.0
(1.9
)9.
6(1
.3)
4.9
(0.9
)<
0.00
16.
4(1
.2)
3.8
(0.8
)1.
9(0
.6)
< 0.
001
D
irect
vic
tim-v
erba
l30
.3(2
.5)
22.6
(1.9
)14
.8(1
.5)
< 0.
001
20.6
(2.0
)20
.9(1
.8)
16.0
(1.5
)0.
005
In
dire
ct v
ictim
23.9
(2.3
)14
.4(1
.6)
8.6
(1.2
)<
0.00
120
.4(2
.0)
16.7
(1.6
)11
.8(1
.3)
< 0.
001
ISR
AE
L
D
irect
vic
tim-p
hysi
cal
8.9
(1.6
)8.
2(1
.5)
4.5
(1.1
)0.
002
3.3
(0.9
)1.
9(0
.6)
1.6
(0.5
)0.
01
D
irect
vic
tim-v
erba
l24
.7(2
.4)
25.0
(2.3
)15
.7(1
.9)
< 0.
001
15.1
(1.7
)13
.7(1
.6)
7.2
(1.1
)<
0.00
1
In
dire
ct v
ictim
14.6
(1.9
)11
.4(1
.7)
7.9
(1.4
)<
0.00
19.
6(1
.4)
7.4
(1.2
)4.
4(0
.8)
< 0.
001
ITA
LY
D
irect
vic
tim-p
hysi
cal
3.8
(1.1
)2.
6(0
.9)
0.24
2.2
(0.8
)1.
1(0
.6)
0.12
D
irect
vic
tim-v
erba
l17
.9(2
.2)
12.5
(1.8
)0.
008
19.3
(2.2
)10
.3(1
.7)
< 0.
001
In
dire
ct v
ictim
14.2
(2.0
)9.
8(1
.6)
0.01
512
.5(1
.8)
9.4
(1.6
)0.
07
LU
XE
MB
OU
RG
D
irect
vic
tim-p
hysi
cal
6.1
(1.4
)5.
4(1
.2)
3.5
(0.9
)0.
033.
5(1
.0)
2.0
(0.7
)0.
8(0
.5)
0.00
1
D
irect
vic
tim-v
erba
l15
.6(2
.1)
14.2
(1.8
)10
.9(1
.6)
0.01
13.6
(1.9
)13
.4(1
.7)
10.7
(1.6
)0.
10
In
dire
ct v
ictim
13.1
(1.9
)9.
6(1
.5)
9.1
(1.5
)0.
0211
.3(1
.8)
11.9
(1.7
)10
.7(1
.6)
0.73
MA
CE
DO
NIA
D
irect
vic
tim-p
hysi
cal
11.4
(1.6
)8.
9(1
.4)
3.8
(0.9
)<
0.00
14.
6(1
.0)
4.0
(0.9
)1.
3(0
.5)
< 0.
001
D
irect
vic
tim-v
erba
l26
.1(2
.1)
27.4
(2.1
)16
.1(1
.7)
< 0.
001
18.0
(1.9
)20
.0(1
.9)
9.6
(1.3
)<
0.00
1
In
dire
ct v
ictim
20.1
(2.0
)17
.1(1
.8)
9.1
(1.3
)<
0.00
115
.0(1
.7)
14.7
(1.7
)5.
8(1
.1)
< 0.
001
U.S
.A.
D
irect
vic
tim-p
hysi
cal
14.8
(3.2
)10
.7(1
.7)
5.9
(1.3
)<
0.00
16.
1(2
.0)
4.8
(1.1
)2.
6(0
.9)
0.00
6
D
irect
vic
tim-v
erba
l31
.5(4
.1)
23.9
(2.4
)16
.5(2
.1)
< 0.
001
27.4
(3.6
)20
.9(2
.1)
20.4
(2.3
)0.
04
In
dire
ct v
ictim
27.5
(4.0
)18
.0(2
.1)
10.5
(1.7
)<
0.00
127
.4(3
.6)
20.8
(2.1
)17
.1(2
.1)
< 0.
001
* Infla
ted
by 1
.4 to
acc
ount
for d
esig
n ef
fect
Int J Public Health. Author manuscript; available in PMC 2009 September 21.
Copyright © 2022 FDOKUMEN