A CRITICAL ASSESSMENT OF CNG AS AN ALTERNATIVE ...
230
A CRITICAL ASSESSMENT OF CNG AS AN ALTERNATIVE FUEL IN PUBLIC BUS TRANSIT IN DELHI, INDIA by CHRISTIAN T. KRELLING School of Urban Planning McGill University, Montreal June 2019 A thesis submitted to McGill University in partial fulfillment of the requirements of the degree of Doctor of Philosophy © Christian T. Krelling, 2019
-
Upload
khangminh22 -
Category
Documents
-
view
1 -
download
0
Transcript of A CRITICAL ASSESSMENT OF CNG AS AN ALTERNATIVE ...

A CRITICAL ASSESSMENT OF CNG AS AN ALTERNATIVE FUEL IN PUBLIC BUS TRANSIT IN DELHI, INDIA
by
CHRISTIAN T. KRELLING
School of Urban Planning
McGill University, Montreal
June 2019
A thesis submitted to McGill University in partial fulfillment of the requirements of the
degree of
Doctor of Philosophy
© Christian T. Krelling, 2019

i
ABSTRACT The rapid motorization of transport in Indian cities has led to the implementation of
several policies to address motor vehicle emissions, including the conversion of city buses to
run on compressed natural gas (CNG) from around the year 2000. As part of this conversion,
Delhi Transport Corporation’s (DTC) more than 3,000 diesel buses were replaced by Standard
(high-floor) CNG buses, and from 2007-08, nearly 4,000 low-floor CNG buses have replaced the
Standard CNG buses. CNG has also been implemented in the public bus fleets in other Indian
cities.
To help assess the long-term desirability of replacing diesel with CNG in India and
similar contexts, and for informing techno-economic and environmental analyses of CNG bus
transit operations, I assess the operational and financial performance consequences of, and the
cost-effectiveness of emissions reductions due to CNG implementation in Delhi, India.
My research shows that CNG implementation caused a significant reduction in DTC’s
capacity to deliver transit service in the initial stages of the fuel transition, and also necessitated
investments in buses at a considerable cost premium relative to their diesel counterparts.
Further, bus life-cycle costs (LCCs) are higher for CNG than for diesel, but CNG negatively
affects the LCC of Standard buses proportionately more than for the low-floor buses, for which
the LCC is already high. The cost-effectiveness analysis of CNG bus emissions reductions
showed that, while Standard CNG buses, relative to their diesel counterparts, offered the most
potential in reducing PM and CO2(e) emissions in the early 2000s, the most cost-effective
choice in tackling these emissions would have been to upgrade to a new fleet of diesel buses
running on lower sulphur fuel and using improved exhaust aftertreatment systems. Also,
considering the current implementation of CNG in other Indian cities, my analysis suggests that
the higher costs of CNG may not justify the environmental benefits compared to available
cleaner diesel bus technologies.
The broader question I raise is that the financial situation resulting from these effects
due to CNG implementation in Delhi may have detracted from the ability to enhance transit
capacity and provide transit service overall. My research also shows the critical importance of
the fuel price and fuel economy of CNG, for the competitiveness of CNG relative to diesel
buses, and demonstrates the need for careful fuel pricing policies when CNG is implemented in
bus transit. Finally, I also demonstrated the need to analyze policies such as CNG
implementation broadly, in terms of conflicts and trade-offs between environmental, and other
(transit operation, socio-economic and equity) objectives, rather than narrowly in terms of only
environmental outcomes.

ii
RÉSUMÉ La rapide motorisation des transports dans les villes indiennes a engendré l’implémentation de
plusieurs politiques pour répondre au problème des émissions de gaz véhiculaire, y inclus la conversion
des autobus au gaz naturel comprimé (GNC), aux alentours de l’an 2000. Partie impliquée dans cette
conversion, Delhi Transports Corporation (DTC) a remplacé plus de 3.000 autobus roulant au diesel par
des autobus standard (plancher haut) roulant au GNC et à partir de 2007-2008, près de 4000 autobus à
plancher surbaissé ont remplacé les autobus standard roulant au GNC. Les autobus au GNC ont aussi
été implémentés dans d’autres villes indiennes.
Pour aider à calculer le taux souhaitable de remplacement à long terme du diesel par le GNC en
Inde et dans des contextes similaires, j’examine les conséquences opérationnelles et financières des
changements et le coût-avantage des réductions des émissions dû à l’implantations du GNC à Delhi, en
Inde.
Ma recherche montre que l’implémentation du GNC a engendré une réduction significative dans
la capacité de la DTC de pourvoir le service de transit dans les premiers stages de la transition u
combustible, et a aussi demandé des investissements en autobus avec un coût considérablement plus
élevés que leurs équivalents roulant au diesel. Plus, le coût du cycle de vie (CCV) des autobus est plus
élevé pour les autobus roulant au GNC que pour ceux utilisant le diesel, mais le GNC affecte
négativement le CCV des autobus standard proportionnellement plus que ceux au plancher surbaissé,
pour lesquels le CCV est déjà haut. L’analyse du coût-avantage des bus roulant au GNC a montré que,
alors que les autobus standard roulant au GNC, relativement à leurs équivalents roulant au diesel,
offraient le plus grand potentiel à réduire les émissions de matières particulaires (PM) et CO2(e) au début
des années 2000, le choix le plus effectif considérant le coût pour faire face au problème des émissions
aurait été de passer à des nouveaux bus roulant au diesel avec un taux plus bas de soufre et améliorer
les systèmes de post-traitement des gaz d’échappement. Aussi, considérant la courante implantation de
GNC dans d’autres villes indiennes, mon analyse suggère que les coûts plus élevés du GNC peuvent ne
pas justifier les bénéfices environnementaux, comparés à des technologies des autobus roulant au diesel
plus propre.
La question plus élargie que je pose est que la situation financière résultante des actions dues à
l’implantation du GNC à Delhi peut avoir endommagé la possibilité d’améliorer la capacité du transport et
d’offrir un service de transport en général. Ma recherche montre aussi l’importance critique du prix du
combustible et de l’économie de combustible due résultante du GNC pour la compétitivité des bus roulant
au GNC relative à ceux utilisant le diesel et montre le besoin d’une politique soigneuse lors de
l’implantation du GNC aux autobus. Finalement, je montre aussi le besoin de l’analyse des politiques tels
que la large implémentation du GNC en termes de conflits et compensations parmi les objectifs
environnementaux et autres (gestion du transport, socio-économique et équité), plutôt que de se limiter
seul aux résultats environnementaux.

iii
TABLE OF CONTENTS
ABSTRACT ................................................................................................................................................ i RÉSUMÉ ................................................................................................................................................... ii TABLE OF CONTENTS ............................................................................................................................ iii LIST OF TABLES .................................................................................................................................... vi LIST OF FIGURES ................................................................................................................................. viii LIST OF TERMS AND ABBREVIATIONS ............................................................................................... ix AUTHOR CONTRIBUTIONS .................................................................................................................. xv CONTRIBUTIONS TO ORIGINAL KNOWLEDGE ................................................................................. xvi ACKNOWLEDGEMENTS ...................................................................................................................... xvii
Chapter 1: Review of issues related to alternative transport fuel use .................................. 1
1.1 Introduction ......................................................................................................................................... 1 1.2 Motorization and impacts .................................................................................................................... 2 1.3 The role of alternative transport fuels in addressing urban transport emissions ................................ 8 1.4 Barriers to alternative transport fuel use ........................................................................................... 10 1.5 Compressed natural gas for urban bus transit fleets ........................................................................ 13 1.6 CNG in public bus transit in Delhi ..................................................................................................... 16
Chapter 2: Research objectives and methodological framework ........................................20
Chapter overview .................................................................................................................................... 20 2.1 Motivation, knowledge gaps and research needs ............................................................................ 20 2.2 Research objectives ......................................................................................................................... 25 2.3 Thesis structure, analytical framework, and methodological approach ............................................ 26 2.4 Data and issues ................................................................................................................................ 29
Chapter 3: Natural gas fueled urban bus transit: US and Latin American experience and
lessons for rapidly motorizing countries ............................................................31
Chapter overview .................................................................................................................................... 31 3.1 Methodology and outline ................................................................................................................... 32 3.2 Analysis of CNG experience ............................................................................................................. 34
3.2.1 Rationale for CNG implementation in urban bus transit ............................................................ 34 3.2.2 Evaluation of CNG performance on urban bus transit fleets ..................................................... 35 3.2.3 Vehicle and fuelling infrastructure ............................................................................................. 39 3.2.4 Vehicle and fuel systems performance ..................................................................................... 44
3.3 Discussion and policy implications ................................................................................................... 67 3.3.1 Summary of key findings ........................................................................................................... 67

iv
3.3.2 Conclusion and policy implications ........................................................................................... 71
Chapter 4: Operational and financial performance of Delhi's CNG-fueled public bus
transit fleet: A critical evaluation .........................................................................74
Chapter overview .................................................................................................................................... 74 4.1 Introduction ....................................................................................................................................... 74
4.1.1 CNG implementation on DTC’s bus fleet .................................................................................. 77 4.2 Analytic framework, methodology and data ...................................................................................... 80 4.3 Results and discussion ..................................................................................................................... 82
4.3.1 Operational performance ........................................................................................................... 82 4.3.2 Financial performance ............................................................................................................... 89
4.4 Conclusions and implications ........................................................................................................... 97
Chapter 5: CNG and diesel urban buses in India: A life-cycle cost comparison .............. 100
Chapter overview .................................................................................................................................. 100 5.1 Introduction ..................................................................................................................................... 100
5.1.1 CNG implementation on DTC’s bus fleet ................................................................................ 101 5.1.2 Rationale and objectives ......................................................................................................... 102
5.2 Analytic framework, methods, and data ......................................................................................... 105 5.2.1 Bus and fuel systems evaluated ............................................................................................. 105 5.2.2 Analytic framework .................................................................................................................. 107
5.3 Results and discussion ................................................................................................................... 115 5.3.1 LCCs for CNG-Std. versus CNG-LF versus CNG-LF/AC in the Indian context ...................... 115 5.3.2 LCCs for CNG versus diesel buses for Std., LF and LF/AC bus configurations in the Indian
context .............................................................................................................................................. 117 5.3.3 LCCs of CNG and diesel LF/AC buses in India, with US fuel prices ...................................... 118 5.3.4 Sensitivity analysis .................................................................................................................. 120
5.4 Conclusions, limitations, and implications ...................................................................................... 123
Chapter 6: Cost-effectiveness of CNG implementation in the public bus transit fleet in
Delhi ..................................................................................................................... 126
Chapter overview .................................................................................................................................. 126 6.1 Introduction ..................................................................................................................................... 126 6.2 Analytic framework, methods and data .......................................................................................... 130
6.2.1 Bus and fuel technologies evaluated ...................................................................................... 130 6.2.2 Cost-effectiveness analysis ..................................................................................................... 132 6.2.3 Scenario analysis .................................................................................................................... 139

v
6.3 Results and analysis ....................................................................................................................... 145 6.3.1 Analysis of emissions results for the three scenarios ............................................................. 145 6.3.2 CE ratio analysis ..................................................................................................................... 148
6.4 Conclusions and implications ......................................................................................................... 153 6.4.1 Summary of key results ........................................................................................................... 153 6.4.2 Implications.............................................................................................................................. 154
Chapter 7: Conclusion and policy implications .................................................................. 158
7.1 Introduction ..................................................................................................................................... 158 7.2 Key research findings ..................................................................................................................... 160 7.3 Policy implications of research ....................................................................................................... 166
7.3.1 Other issues ............................................................................................................................ 168 7.4 Scope for future research ............................................................................................................... 171
7.4.1 Trade-off between costs and public transit capacity and its impacts ...................................... 171 7.4.2 CNG feasibility ......................................................................................................................... 172 7.4.3 Fuel supply constraints ............................................................................................................ 174 7.4.4 Natural gas supply scalability .................................................................................................. 175
References ............................................................................................................................ 178
Appendix A: List of sites visited in Delhi for data collection ............................................. 200
Appendix B: Supplementary material for Chapter 5 ........................................................... 202
Appendix C: Supplementary material for Chapter 6 ........................................................... 206
C.1: Methane (CH4): tailpipe and fugitive emissions ............................................................................ 206 C.2: Black Carbon (BC) ........................................................................................................................ 206 C.3: Carbon Dioxide (CO2) ................................................................................................................... 208 C.4: CO2 equivalent (GWP for BC, CH4, CO2)...................................................................................... 208

vi
LIST OF TABLES
Table 1.1: Key energy, demographic and economic statistics, 2016 .......................................... 6
Table 1.2: Transit bus fleet numbers, India, 2015 ......................................................................14
Table 2.1: Dimensions and perspectives reflected in dissertation .............................................27
Table 3.1: Summary of cases evaluated ...................................................................................33
Table 3.2: Summary of selected bus system specifications .......................................................42
Table 3.3: Summary of selected performance parameters of buses ..........................................43
Table 3.4: WMATA chassis dynamometer-based emissions, 2000-2004 vintage buses, CBD
drive cycle .................................................................................................................................43
Table 3.5: WMATA chassis dynamometer-based emissions, 2003-2006 vintage buses, various
test cycles. ................................................................................................................................51
Table 3.6: Simulated fuel costs based on Table 3.3 parameters ...............................................65
Table 4.1: CNG bus technologies at DTC .................................................................................79
Table 5.1: Summary of key bus systems evaluated in India .................................................... 106
Table 5.2: LCC model parameters in Equation (1) .................................................................. 108
Table 5.3: Operating and financial assumptions used in LCC model ....................................... 109
Table 5.4: Comparison of bus life-cycle costs ($/km) .............................................................. 115
Table 5.5: Differential life-cycle costs, by bus type and cost category ..................................... 116
Table 6.1: Potential CE ratio outcomes ................................................................................... 133
Table 6.2: Present value of bus LCCs, $-per-bus, 12-yr service life, 12% disc.rate ................. 135
Table 6.3: Choice of greenhouse gas equivalent emission pollutants ...................................... 136
Table 6.4: Emission factors for buses, g/km. ........................................................................... 138
Table 6.5: Emission factors for cars, M2Ws, and M3Ws, g/km. ............................................... 138
Table 6.6: Impact of bus ridership migration to private modes of transport (Scenario 3) .......... 143
Table 6.7: Annual vehicles emissions in Delhi, g/pass-km....................................................... 144

vii
Table 6.8: Cost-effectiveness ratio calculation breakdown, Scenario 1 ................................... 149
Table A1: Sites visited for data collection at DTC in Delhi, India ............................................. 200
Table B1: Description of parameter assumptions used in the LCC model ............................... 202
Table C1: Heavy-duty vehicle emission norms, India vs. European Union .............................. 209
Table C2: CO2 emission factor estimation for CE analysis, g/km ............................................. 210
Table C3: CO2(e) emission factor estimation ........................................................................... 210

viii
LIST OF FIGURES Figure 1.1: Vehicle fleet numbers. .............................................................................................. 3
Figure 1.2: Total petroleum demand, by sector, World ............................................................... 7
Figure 1.3: Uncompressed natural gas buses in China .............................................................12
Figure 2.1: Trip modal shares in India, by city size. ...................................................................22
Figure 3.1: CNG versus diesel retail fuel prices in the US .........................................................63
Figure 4.1: Service provision and utilization ..............................................................................84
Figure 4.2: Fleet fuel economy ..................................................................................................86
Figure 4.3: Reliability.................................................................................................................87
Figure 4.4: Key operating expenses ..........................................................................................92
Figure 4.5: Comparative fuel prices – diesel and CNG ..............................................................92
Figure 4.6: Maintenance costs, key categories, per kilometre ...................................................95
Figure 4.7: Operating costs per passenger kilometre and operating ratio ..................................96
Figure 5.1: Annual maintenance costs .................................................................................... 112
Figure 5.2: Comparison of bus life-cycle costs ........................................................................ 117
Figure 5.3: CNG and diesel fuel prices and ratios, India and USA, 2002-2015 ........................ 120
Figure 5.4: Sensitivity of LCC to fuel economy and fuel price in India ..................................... 121
Figure 5.5: Sensitivity of LCC to fuel economy and fuel price – effect of discount rate ............ 123
Figure 6.1: Comparison of passengers carried and load factor at DTC ................................... 139
Figure 6.2: Cost-effectiveness ratio, $-per-emissions reduction, Scenario 1 ........................... 151
Figure 7.1: Natural gas supply and demand, India, 2016 ........................................................ 176
Figure A1: DTC bus depot layout, Sukhdev Vihar depot, 2010-11........................................... 201

ix
LIST OF TERMS AND ABBREVIATIONS
$ United States Dollar ($), or USD; unless stated otherwise, all financial figures
with $ symbol are expressed in US Dollars
$/L United States Dollars ($) per litre
% wt. Percentage with respect to weight
AMC Annual Maintenance Contract (DTC); see Footnote (3) of Table 5.3.
AVTA Advanced Vehicle Testing Activity, US Department of Energy
BC Black Carbon
BEST Brihan Mumbai Electric Supply & Transport Undertaking
BMTC Bangalore Metropolitan Transport Corporation
BRT Bus Rapid Transit
BS-I to IV Bharat Stage I (to IV); specifications for emissions from new vehicles set by the
Bureau of Indian Standards, and equivalent to Euro-I (to IV) emission
standards (CPCB, 2010)
BTU British Thermal Unit
BTU/cu.ft. British Thermal Unit per cubic feet
BTU/GAL British Thermal Unit per Gallon
CAPKM Passenger Carrying Capacity-Kilometres
CBD Central Business District Cycle; a chassis dynamometer emissions testing
procedure for heavy-duty vehicles
CE Cost-effectiveness
CH4 Methane
CI Compression Ignition (engine)
CIRT Central Institute of Road Transport, Pune, India
CNG Compressed Natural Gas
CNG-LF Low-Floor CNG bus (see Table 4.1 and Table 5.1 for vehicle specifications)
CNG-LF/AC Low-Floor air-conditioned CNG bus (see Table 4.1 and Table 5.1 for vehicle
specifications)

x
CNG-Std. Standard CNG bus (see Table 4.1 and Table 5.1 for vehicle specifications)
CO Carbon Monoxide
CO2 Carbon Dioxide
CO2(e) CO2-equivalent emissions
CPI and CPI-IW Consumer Price Index; In India, CPI-IW for Industrial Workers
CWI Cummins Westport Inc.
D15 Diesel with sulphur content of 15 ppm (or 0.0015% on a weight basis, of
Sulphur in diesel; 15 mg/kg)
D30 Diesel sulphur content of 30 ppm (or 0.003% on a weight basis, of Sulphur in
diesel; 30 mg/kg)
D500 Diesel sulphur content of 500 ppm (or 0.05% on a weight basis, of Sulphur in
diesel; 500 mg/kg)
DDC Detroit Diesel Corporation
DDC S50 Detroit Diesel Corp. engine model
Diesel-LF Low-Floor diesel bus (see Table 5.1 for vehicle specifications)
Diesel-LF/AC Low-Floor air-conditioned diesel bus (see Table 5.1 for vehicle specifications)
Diesel-Std. Standard diesel bus (see Table 4.1 and Table 5.1 for vehicle specifications)
DMRC Delhi Metro Rail Corporation
DOC Diesel Oxidation Catalyst; exhaust aftertreatment system
DPF Diesel Particulate Filter; exhaust aftertreatment system
DTC Delhi Transport Corporation
E85 Ethanol; high-level ethanol-gasoline blend containing 51%-83% ethanol
EF Emission factor(s); for vehicles (e.g., in g/km)
EFS Engine and Fuel System
EGR Exhaust Gas Recirculation System
EPA US Environmental Protection Agency
EPA 1998, 2004 US-EPA Emission Standards for Heavy-Duty Diesel Engines
Est. Estimated

xi
ETC European Transient Cycle; a chassis dynamometer emissions testing
procedure for heavy-duty vehicles
EU European Union
EURO (I to VI) European emission standards for new vehicles (implemented in stages over
the years; stages I to VI) set by the European Committee for Standardization,
CEN. For concise information see <www.dieselnet.com>
FE Fuel Economy
GDP (PPP) Gross Domestic Product measured in Purchasing Power Parity terms
GEF Global Environment Facility Program (trust-funded grant financing scheme,
World Bank)
GHG Greenhouse Gas
GPS Global Positioning System
GVW Gross Vehicle Weight
GWP Global Warming Potential
HC Hydrocarbon
HP Horsepower, measure of power
IGL Indraprastha Gas Limited, Delhi
INR Indian Rupee
IPCC Intergovernmental Panel on Climate Change
IPT Intermediate Public Transit; for example, auto rickshaws, taxis, and for hire
minibuses.
JD John Deere
JNNURM Jawaharlal Nehru National Urban Renewal Mission (India)
kg Kilogram
km/diesel eq. L Kilometres-per-diesel equivalent litre
km/h Kilometres-per-hour
km/L Kilometres-per-litre
L litre
LCC Life-Cycle Cost

xii
LF Low-Floor (bus)
LF/AC Low-Floor Air Conditioned (bus)
LWV Light-weight Vehicles (GVW < 3850 kg)
m2 Metres squared
M2W Motorized Two-wheeled Vehicles (e.g., motorbike)
M3W Motorized Three-wheeled Vehicles (e.g., auto rickshaws)
Man Bus Manhattan Bus Test Cycle; a chassis dynamometer emissions testing
procedure for heavy-duty vehicles
MB Mercedes Benz
MBRC Miles between roadcalls
MCMA Mexico City Metropolitan Area
MCS Mexico City Schedule: chassis dynamometer testing procedure for heavy-duty
vehicles
MJ Mega joule
MT Metric Tonnes
MTC-CNI Metropolitan Transport Corp. Ltd., Chennai
Mtoe Million tonnes of oil equivalent
MX1
MX2
MX3
Chassis dynamometer testing procedure; part of MCS cycle (see MCS)
Chassis dynamometer testing procedure; part of MCS cycle (see MCS)
Chassis dynamometer testing procedure; part of MCS cycle (see MCS)
MY (e.g., MY05) Model Year; that is, the year of a vehicle's model
N2O Dinitrogen Oxide (nitrous oxide)
NCR (Delhi) National Capital Region (of Delhi)
NG Natural Gas
NMHC Non-Methane Hydrocarbons
non-OECD Non-OECD (countries); see OECD
NOX Nitrogen Oxides
NREL National Renewable Energy Laboratory (US Department of Energy)

xiii
NY Bus New York Bus Cycle; a chassis dynamometer emissions testing procedure for
heavy-duty vehicles
NYCT New York City Transit, New York, NY
O3 Ozone
OC Organic Carbon
OECD Organisation for Economic Co-operation and Development of 36 member
countries, most with high income per-capita
OEM Original Equipment Manufacturer
pass-km Passenger-kilometre(s)
PKMS Passenger-kilometre(s)
PM Particulate Matter (typically defined by size in aerodynamic diameter)
PM0.1 PM with aerodynamic diameter of 0.1 microns and smaller
PM2.5 PM with aerodynamic diameter of 2.5 microns and smaller
PM10 PM with aerodynamic diameter of 10 microns and smaller
ppm Parts per million
PPP Purchasing Power Parity (see GDP-PPP)
RAVEM™ Ride-Along Vehicle Emission Measurement system by Engine, Fuel, and
Emissions Engineering Inc. of Sacramento, California
RTP Red de Transportes de Pasajeros del D.F., Mexico
SCR Selective Catalytic Reduction (SCR) catalyst; exhaust aftertreatment system
SI Spark-Ignited (engine)
SO2 Sulphur Dioxide
Std. or Std. bus Standard [size bus]; applicable in the Indian context; see Tables 4.1 and 5.1 for
standard CNG and diesel bus specifications
SunLine SunLine Transit Agency, Palm Springs, CA
TERI The Energy and Resource Institute
Therm Unit of heat energy (= 100,000 BTU)
TRIPP Transportation Research and Injury Prevention Programme, IIT-Delhi

xiv
ULSD Ultra-Low-Sulphur Diesel; US-EPA defines ULSD as a diesel fuel with sulphur
content lower than 15 ppm; e.g., see <https://www.epa.gov/diesel-fuel-
standards>
US or USA United States of America
USD United States Dollar or $ (see $, above); unless stated otherwise, all financial
figures with $ or USD are expressed in US Dollars
USDoE US Department of Energy
USDoT US Department of Transportation
VKMS Vehicle-Kilometre(s)
VOC Volatile Organic Compounds
WHO World Health Organization (United Nations)
WMATA Washington Metropolitan Area Transit Authority
WMATA Cycle Washington Metropolitan Area Transit Authority Cycle; a chassis dynamometer
emissions testing procedure for heavy-duty vehicles
μg/m3 Micro-grams per cubic metre

xv
AUTHOR CONTRIBUTIONS
My doctoral dissertation is structured following a manuscript-based format and
integrates four analytical Chapters (3 to 6), in addition to the review of issues related to
alternative transport fuel use and the overall problem statement (Chapter 1), the thesis
research objectives and methodological framework (Chapter 2), and a synthesis of the
key conclusions and policy implications (Chapter 7). Chapters 4 and 5 have been
published in peer-reviewed journals. I provide here details of my contributions to the
research activities related to and the writing of the chapters in my dissertation.
Chapter 4 is a co-authored paper titled “Operational and financial performance of Delhi's
CNG-fueled public bus transit fleet: A critical evaluation” that has been published in the
Transport Policy journal (Krelling & Badami, 2016). I was the primary author of this
publication; conceptualization of the paper was done collaboratively with the second
author, Madhav G. Badami, while I designed the analytic framework, carried out the
fieldwork for data collection, conducted the analysis, and wrote the paper. Madhav G.
Badami provided extensive and detailed feedback and comments for the revision and
editing of the final paper.
Chapter 5 is a co-authored paper titled “CNG and diesel urban buses in India: A life-
cycle cost comparison” that has been published in the International Journal of
Sustainable Transportation (Krelling & Badami, 2019). I was the primary author of this
paper, and conceptualized the research project, designed the analytic framework,
determined data needs, carried out the fieldwork for data collection, conducted the
analysis, and wrote the paper; Madhav G. Badami provided extensive and detailed
feedback and comments for the revision and editing of the final paper.
I conceptualized the research, designed the analytic framework, collected the data, and
conducted the analysis for all of the other chapters in my dissertation, as well as writing
them. Madhav G. Badami contributed to their conceptualization, and provided extensive
and detailed feedback and comments for revising and editing them.

xvi
CONTRIBUTIONS TO ORIGINAL KNOWLEDGE
The elements of my thesis that are original scholarship and contributions to knowledge,
center on the fact that most research published to date on the implementation of CNG in
Delhi's public vehicles has focused on its emissions outcomes with little attention
devoted to its operational or financial aspects. Particularly, analyzing the operational
and financial performance of CNG-fueled buses in Delhi’s public bus transit fleet -- as I
have done in Chapters 4 and 5 -- is important because it is this performance that
critically determines the vehicle operator’s policy responses, which in turn will crucially
determine the extent to which implementation, and the associated emissions reductions,
actually occur and are successful. This work will help assess how the conversion from
diesel to CNG affected bus fleet operations and finances. In addition, I contribute to an
important policy-analytic objective when I evaluate the cost-effectiveness of the
implementation of CNG in Delhi in Chapter 6. This is an important contribution to
knowledge, because I use a framework that integrates operational and financial
dimensions with the existing emissions performance research in comparing the related
life-cycle costs against their respective emissions outcomes. As a whole, the analyses I
conduct in this dissertation will hopefully be useful to policy and decision makers and
urban bus transit operators in contexts similar to India’s, by drawing lessons for the
long-term desirability of large-scale conversions of bus fleets to CNG, for comparison
with other CNG bus transit fleets, and for informing techno-economic and environmental
analyses of CNG bus transit operations.

xvii
ACKNOWLEDGEMENTS
I am very grateful to my supervisor, Professor Madhav G. Badami, for sharing his
invaluable knowledge, his advising and backing throughout my PhD. Also, I want to
thank all the members of my PhD advisory committee -- Professors Murtaza Haider,
Milind Kandlikar and Christopher Green -- for their inputs, constructive critiques and
suggestions, which were also invaluable in shaping the direction of my research.
Moreover, I am grateful to all of the faculty members in the School of Urban Planning,
for their constant encouragement and many opportunities to broaden my academic
horizons, and to Gladys Chan and Anand Sood for their kind support.
For my PhD fieldwork, with the access provided through Prof. Badami’s professional
network of colleagues in India, I was able to count on various people and institutions for
logistical support. This support included sponsoring of research visas, providing office
space and network access, helping in gathering of data, being available for extensive
discussions and meetings, and providing access to seminars and conferences, all of
which helped me understand the complexity of the research problems being
investigated and thus helped shape my research. In this respect, I would like to thank
Professors Geetam Tiwari and Dinesh Mohan of the Transportation Research and Injury
Prevention Programme (TRIPP), IIT Delhi, Professor Sanjivi Sundar of The Energy and
Resource Institute (TERI), and Dr. Rajiv Seth of TERI University, for hosting me during
my field-work. In addition, I owe a debt of gratitude to Mr. V.K. Sehgal and Mr. S.P.
Sethi for providing access to data at Delhi Transport Corporation (DTC). Finally, I would
not have been able to conduct my field-work in India, if not for Suparna, Manna and
Zorro, who kindly opened their home to me for the long duration of my stays in Delhi;
their friendship and help were priceless.
I would like to acknowledge the funding I received during my doctoral studies, through
Prof. Badami’s Social Sciences and Humanities Research Council of Canada grant
(SSHRC Grant no. 410-2005-2390). I am also grateful to McGill University (GREAT

xviii
Travel Grant) and the International Development Research Centre, Ottawa,
Canada (Award no. 105938-99906075-056) for funding to support my fieldwork in India.
Lastly, I would like to thank my wife, Nadja, for encouraging me throughout this
endeavour.

xix
This work is dedicated to my wife and son,
Nadja and Matthew.

1
Chapter 1: Review of issues related to alternative transport fuel use
1.1 Introduction
The principal motivation guiding this research is the significant impact of urban transport
on air pollution in rapidly motorizing low- and middle-income countries, with serious
health and welfare effects for urban populations and the environment, and the prospect
of continued and fast growth in vehicle activity, which will tend to aggravate these
impacts. The central objective of this dissertation is to assess the operational and
financial impacts of, and the cost-effectiveness of emissions reductions due to,
replacing diesel bus fleets with compressed natural gas (CNG) in India, in order to
support decision- and policy-making related to the use of alternative transport fuel
systems in low- and middle-income country contexts. To this end, my doctoral thesis
entitled “A Critical Assessment of CNG as an Alternative Fuel in Public Bus Transit in
Delhi, India,” will address a range of dimensions concerning CNG implementation. For
this research, I have focused mostly on the particular case of Delhi Transport
Corporation (DTC) in Delhi, but also have drawn on the experiences of other public
transit bus operators in India, and even internationally, for comparison and critical
evaluation.
Over the past 30 years, many high-income countries, as well as low- and middle-income
countries, have implemented a number of alternative transport fuel technologies. These
actions were mainly driven by the rapid rise in urban transport activity and the negative
impacts associated with this trend, especially in terms of deteriorating urban air quality
due to the increase in transport emissions. The rapid increase in motorization coupled
with the heavy dependence of road transport on petroleum-based fuels raises a number
of questions, not only in terms of the impacts of vehicle activity on urban air quality, but
also in terms of a range of other issues, such as the capacity of countries in obtaining
petroleum in the future (e.g., what are energy security implications of no
diversification?), the challenges associated with oil substitution in the transportation
sector, and the economic and other implications of fuel systems choices. Moreover,

2
despite the many policy efforts across the globe to diversify transport energy sources,
transportation continues to be predominantly dependent on oil for supply of most of its
energy needs. For low- and middle-income countries, transportation energy challenges
are even more critical, since rapid economic development and increased preference for
personal mobility has significantly pushed up personal motor vehicle use, and with this,
the impacts of motorization have grown even more. Yet, despite the challenges and
incremental costs associated with alternative transport fuel use, a few large developing
nations, such as India and Brazil, have already adopted them at a significant scale in
attempts to address urban air pollution, and to promote energy security.
Below, I present a detailed discussion of the above and other issues, in order to justify
public policy attention to the use of CNG in India, which forms the focus of my
dissertation. In Chapter 2, I present the rationale, objectives, and methods adopted
across my dissertation; in Chapter 3, I present a comprehensive and critical review of
the literature concerning the implementation of CNG in public bus transit fleets in the US
and Latin America; in Chapters 4 to 6, I critically analyze various aspects of CNG
implementation in India; and, in Chapter 7, I conclude my research, discussing the
broader policy implications of my findings.
1.2 Motorization and impacts
The global motor vehicle fleet has grown substantially from 246 million vehicles in 1970
to 1.3 billion in 2015 (Davis et al., 2017). Moreover, the magnitude of these figures is
only compounded by the fact that this data does not include motorized two-wheeled
vehicles (M2W), which account for a substantial portion of vehicle stocks in many
rapidly motorizing low- and middle-income countries. For example, in India, M2Ws
accounted for approximately 75% of all registered motor vehicles in 2016 (MoRTH,
2018). Figure 1.1 shows the trend in worldwide vehicle fleet numbers since 1990, when
detailed information is available for selected countries.

3
Figure 1.1: Vehicle fleet numbers.
Analysis of data from Figure 1.1 shows that low- and middle-income countries are the
main contributors to the growth in worldwide motor vehicles in the past couple of
decades. From 1990 to 2015, the motor vehicle fleet in nations like Brazil, Argentina,
Russia and Pakistan increased approximately 3 times; Asian countries such as India,
Indonesia, and Malaysia saw motor vehicle numbers grow 8 times, and China by 25
times (Davis et al., 2017). During this same period, vehicle fleet numbers in the US,
Japan, France, UK, Germany and Canada grew only 1.4 times (Figure 1.1). Particularly
India and China accounted for 28% of worldwide fleet growth from 1990 to 2015, but
only represented 16% of the world's vehicle fleet in 2015 (Davis et al., 2017).
While the challenges in road transport are many, in areas as diverse as road safety,
energy security and climate change, the impacts of air pollution and congestion caused
by increased motorization have attracted much policy attention. There is a significant,
and increasing, contribution from motor vehicles to total air pollution loads, especially in
0
200
400
600
800
1,000
1,200
1,400
1990 1995 2000 2005 2010 2015
Car
, tru
ck a
nd b
usre
gist
ratio
ns (m
illion
s)
Source: Davis et al. (2017): Table 3.2 and Table 3.3.
Rest of the world

4
urban areas (CAA, 2012), and substantial evidence that exposure to various air
pollutants emitted by vehicles are directly linked to increased human morbidity and
mortality risks (WHO, 2013). High concentrations of fine particulate matter of 2.5
microns or less in diameter (PM2.5), a key component of motor vehicle emissions, are
strongly associated with adverse health outcomes (Pope et al., 2011), and data shows
that ambient particulate matter levels in large cities of low- and middle-income
countries, and particularly in East and South Asia, are far higher than those observed in
high-income countries, and vastly exceed international air quality guidelines (WHO,
2014a). In 2012, air pollution was estimated to have caused approximately 3.7 million
premature deaths, with a high portion of these deaths (88%) having occurred in low-
and middle-income countries, with the greatest number of these deaths in the Western
Pacific and South-East Asia regions (WHO, 2014b).
In India, 78% of cities had PM10 levels that were at or above the annual national
ambient standard of 60 μg/m3 in 2010, with 63% of this group exceeding the standard
by at least 1.5 times (CPCB, 2012: Tables 2.4 and 2.11). In the case of Delhi, the focus
of this dissertation, the annual average PM10 concentration in 2010 was 261 μg/m3
(CPCB, 2012: Table 2.7), which is 4.4 and 13 times the Indian and WHO standards1,
respectively. What is also very concerning is evidence showing that populations located
along roadways receive exposure levels that can be on average 1.5 times greater than
those reported by centrally located measuring stations (Apte et al., 2011). This suggests
an uneven distribution of air pollution impacts. The populations most exposed and at
greater risk -- that is, those with lower incomes, such as people working or living near
roads, such as non-motorized commuters, rickshaw operators and users, and street
vendors -- who are also least able to cope with illness are the ones most exposed to
and affected by health effects due to air pollution.
What is alarming is that the outlook for urban air quality is bleak in regions such as East
and South Asia since many cities continue to experience an increasing trend in
1 WHO's air quality guideline is an annual mean of 20 μg/m3 for PM10 and 10 μg/m3 for PM2.5 (WHO, 2014a).

5
particulate matter concentrations, primarily due to increased vehicle activity (CAA, 2012;
WHO, 2014a; Guttikunda & Mohan, 2014). Further, while local air pollution impacts are
very important, there are other important global consequences of road transport
emissions, as this sector is the fastest growing contributor to global CO2 emissions,
most of which will increasingly be emitted by China and India over the next 25 years
(CAA, 2012). It is for all these reasons, but mainly for local air quality effects, that
natural gas -- as well as other alternative fuels -- has been considered as a petroleum
substitute in urban areas.
Another important consequence of rapid increase in motor vehicle activity is the
increase in road traffic congestion. Rapidly motorizing developing countries typically
lack adequate road infrastructure capacity to support the increase in vehicle activity,
and therefore a key consequence is the rapid increase in congestion. The outlook on
congestion for countries like India is not positive, since, while car ownership rates still
lag those observed in richer countries, public transport systems have not been able to
meet growing urban passenger trip demand, only exacerbating motorization trends
(WSA, 2008a). Congestion has serious implications for the efficiency and effectiveness
of transport systems, with broad impacts on living conditions of urban populations,
access of people to economic opportunities, flow of goods within cities, and economic
activity. Also, emissions and fuel consumption are seriously exacerbated by congestion.
In terms of aggregate energy use, the transportation sector represents 28% of total
global energy consumption, with most of this energy (75%) accounted for by road
transport (IEA, 2018). A comparison of countries at different stages of economic
development shows that there is a significant rich-poor energy dichotomy in road
transport, considering that the per-capita road transport energy use in OECD countries
is 5.4 times greater than non-OECD countries (Table 1.1). In the future, this gap will
likely narrow as non-OECD countries develop their economies, and GDP-per-capita
increases; a trend that is corroborated by the rapid increase in vehicle numbers in low-
and middle-income countries. This trend will enhance the importance of road transport

6
as a major energy-consuming sector of developing economies, which in turn will push
demand for energy resources significantly upward.
Table 1.1: Key energy, demographic and economic statistics, 2016
Total Final Energy
Consumption (Mtoe)*
Transport Energy
(Mtoe)*
Road Transport
Energy (Mtoe)*
Road Trpt. Energy
per-capita (1,000 toe)**
Population
(millions)
GDP (PPP)
per capita (US $)
World 9,555 2,748 2,055 277 7,429 14,703 OECD 3,669 1,238 1,091 849 1,284 49,034 non-OECD 5,488 1,112 964 157 6,145 9,796 China 1,978 299 246 178 1,379 19,450 India 572 90 82 62 1,324 7,905 (*) Mtoe = Million tonnes of oil equivalent (**) toe = Tonne of oil equivalent Source: IEA (2018)
Coupled with the prospect of a significant increase in road transport energy demand in
low- and middle-income countries, there is the challenge of the substantial dependence
on oil in this sector, as petroleum accounted for roughly 94% of all energy needs of road
transport, worldwide (IEA, 2018). This oil dependence is quite significant with road
transport consuming nearly half of all petroleum used by all sectors of the global
economy (IEA, 2018). More importantly, as shown in Figure 1.2, the share of road
transport in oil consumption has grown considerably over the last four decades; thus,
these trends in oil consumption by road transport establish an important nexus between
rapid motorization and energy security issues, in addition to urban air quality and
climate change challenges mentioned. As countries like India continue to experience
this process of rapid motorization, given rapid economic development and structural
transformation of their economies, road transport energy challenges and constraints will
only continue to be exacerbated.

7
Figure 1.2: Total petroleum demand, by sector, World
India With 1.3 billion people, India is home to around 18% of the world
population but only consumes 6% of total world energy (Table 1.1: Total Final Energy
Consumption vs. Population). India’s share of global road transport energy consumption
is even lower, at 4% (Table 1.1), despite India's road transport energy consumption
having increased more than 700% from 1981 to 2013 (OECD/IEA, 2015). Within India,
the share of road transport in total oil consumption is 44%, compared to 59% in OECD
countries (IEA, 2018). But with the importance of road transport only expected to grow
as India continues its rapid motorization trend, the country’s dependence on foreign oil
imports is expected to be exacerbated; India, which is the fourth largest consumer of oil
in the world, has increased its total net oil imports from 42% of total domestic oil
demand in 1990 to approximately 76% of total domestic demand in 2015 (EIA, 2016).
This oil-dependency shows the immense challenges for India, in terms of energy
security and associated economic vulnerabilities, given oil price fluctuations. All of this
demonstrates the strategic importance of road transport from an energy security
perspective, and highlights the challenges to policymakers considering continued rapid
0
400
800
1,200
1,600
2,000
2,400
2,800
3,200
3,600
4,000
1971
1973
1975
1977
1979
1981
1983
1985
1987
1989
1991
1993
1995
1997
1999
2001
2003
2005
2009
2011
2013
Oil
cons
umpt
ion
(milli
on to
nnes
of o
il eq
uiva
lent
)
Road transport
Other transport
Other(including non-energy use)
Industry
Source: OECD/IEA (2015)

8
expansion of vehicle activity with little to no meaningful diversification to other energy
sources.
While the reasons for India's current low relative level of road transport energy
consumption may be multifaceted and complex, key factors constraining energy usage
are poverty, low average incomes, and the large proportion of rural populations with low
access to motor vehicles (Goldemberg et al., 2000). India's per-capita GDP is less than
half of China's (Table 1.1), while the percentage of India's urban population (32%) is
significantly lower than China's (53%) (World Bank, 2015). China's per-capita road
transport energy consumption is almost 2.8 times greater than India's, with per-capita
road transport energy figures for OECD countries being 13 times greater than India's
(Table 1.1).
As India's economy continues to grow, the scale of its future transport energy needs,
and particularly oil needs, will be quite substantial, both in absolute terms and relative to
the rest of the world, with significant domestic and global implications in terms of a
range of issues, as outlined and discussed above, but especially in terms of economic
(i.e., pressure on global petroleum demand) and environmental impacts (i.e.,
greenhouse gas (GHG) emissions and deterioration of urban air quality), similar to the
profound way in which China's rapid economic growth and shift from rural to urban
populations has impacted its domestic economy and along with it that of the entire world
(e.g., see China: Building the dream, 2014).
1.3 The role of alternative transport fuels in addressing urban transport emissions
It is for the purpose of addressing urban transport impacts, such as mitigating urban air
pollution and enhancing energy security that alternative transport fuels -- predominantly
ethanol and compressed natural gas (CNG), but also, biofuels, hydrogen gas (H2), and
electricity -- have been studied and used throughout the world (IEA, 2013). Today,
biofuels represent the highest proportion of alternative transport fuel use followed by

9
CNG. The US, for example, which has the largest vehicle fleet globally, had
approximately 1.2 million vehicles running on alternative fuels in 2011, the majority
(72%) of which were regularly using high-ethanol gasoline blends (E85), but also a
sizable fleet of electric (6%) and CNG (10%) vehicles (Davis et al., 2015). The large
share of ethanol powered vehicles in the US, reflects policies targeted at promoting
ethanol, dating back to the oil crisis in the early 1980s, when an incentive was
introduced and 300 million litres of ethanol were produced in 1981 for use as a
transportation fuel; ethanol consumption then accelerated in the 1990s with various air
quality concerns requiring the use of re-formulated gasoline (blended with ethanol) in
order to reduce vehicle tail pipe emissions and improve air quality (Wang et al., 2007).
By 2017, annual ethanol consumption in road transport in the US had increased to
approximately 54 billion litres, showing the scale and magnitude of US ethanol policy
(EIA, 2018).
During the same period, Brazil also promoted a large-scale biofuels program, initially
driven in the late 1970s and early 1980s, by energy security and economic concerns,
given the oil crisis of the period; by 2010, ethanol consumption in road transport had
reached 22 billion litres annually, accounting for approximately 22% of all road transport
energy use in Brazil (UNICA, 2014; OECD/IEA, 2015). Meanwhile, India has also taken
substantial measures to promote the use of alternative transport fuels, which were
largely driven by deteriorating urban air quality. In India, natural gas has been the most
prevalent fuel alternative used in road transport with its share of road transport energy
being 2.6%, compared to 2% globally; in 2016, natural gas consumption in road
transport in India corresponded to 5.1% of all natural gas consumed globally within road
transport (IEA, 2018).
Specifically looking at natural gas, there are many benefits for its use in road transport.
In addition to reducing petroleum consumption, natural gas has been widely used for its
ability in reducing motor vehicle emissions of critical air pollutants that adversely impact
human health. Natural gas has excellent technical qualities as a spark-ignition (SI)
engine fuel, with a higher mass-based energy content than gasoline and a much higher

10
octane rating than gasoline, enabling higher compression ratios, and therefore higher
thermal efficiencies than with gasoline in SI engines (Faiz et al., 1996). These
properties, coupled with the lower carbon-to-hydrogen ratio of natural gas, potentially
allow lower carbon dioxide emissions to be achieved per unit of energy than with the
liquid petroleum fuels (Faiz et al., 1996; MJB, 2007).
Natural gas is a cleaner burning fuel compared to gasoline or diesel, and above all
particulate matter (PM) mass emissions are significantly reduced, as air-fuel mixing is
not an issue. Additionally, because no cold start enrichment is required, natural gas
significantly reduces carbon monoxide (CO) and reactive non-methane hydrocarbons
(NMHC) emissions (Kathuria, 2005; Narain & Krupnick, 2007). On the other hand, since
natural gas is predominantly methane, emissions of this significant climate-forcing
agent, which include fugitive emissions due to fuel system leakage, are higher than with
gasoline or diesel (Reynolds & Kandlikar, 2008). Meanwhile, higher nitrogen oxides
(NOX) emissions from natural gas engines could be expected due to higher combustion
temperatures and because catalytic control is difficult owing to the exhaust gas having
low reactivity (because of low NMHC emissions); however, lower NOX levels can be
achieved relative to gasoline and diesel engines with lean burn natural gas engines with
advanced technology such as electronic fuel injection and three-way catalysts (Posada,
2009).
1.4 Barriers to alternative transport fuel use
Despite their technical advantages, potential benefits, and policy actions promoting
alternative transport fuels, they account for only 6% of energy used in road transport
globally, with the remainder 94% of energy needs in road transport being provided by
petroleum based fuels (i.e., mostly gasoline and diesel) (IEA, 2018). Specifically for
natural gas, usage still represents a mere 2% of total world road transport energy use,
on an energy basis (IEA, 2018). In the US, despite the substantial number of vehicles
running on alternative fuels (1.2 million) they represent only a small fraction of the
estimated 269 million registered vehicles in that country (Davis et al., 2015; FHWA,

11
2017). Thus, alternative transport fuel use continues to be extremely limited,
representing only a niche within road transport. These low adoption rates demonstrate
that there are still significant barriers preventing wider use of fuel alternatives. Key
adoption barriers are mostly related to higher costs of fuel production, storage,
distribution, and end-use systems; as well as various considerations such as changes
required to existing fuel distribution systems, and the availability of alternative fuels and
vehicles (Faiz et al., 1996; IEA, 2013).
For natural gas, its low adoption rates in road transport raise questions on why this is
so, since natural gas is an abundant energy source, with vast upstream, downstream
and distribution networks already set up, and it is widely used in providing energy to
other sectors of the economy. Natural gas is a feedstock for 15% of all worldwide final
energy needs, in all sectors of the economy combined, and in particular is a feedstock
for 23% of all global electricity generation (IEA, 2018). Therefore, one has to reflect on
the specific challenges preventing natural gas from being more widely adopted in road
transport. From a technical perspective, an important barrier is that natural gas has a
significantly lower volumetric energy density, despite having a higher mass-based
energy content relative to gasoline and diesel, under normal atmospheric conditions
(e.g., see Figure 1.3). This is a key disadvantage for a fuel in road transport
applications, since a high volumetric energy density is needed in order to maximize
payload and range. In order to overcome this critical constraint for road transport
applications, natural gas has to be compressed to a pressure of 200 bar in order to
make it portable, thus the term compressed natural gas (CNG). This increases fuel
storage system weight, with critical trade-offs in terms of decreased fuel economy,
decreased vehicle range, increased refuelling frequency, reduced payload capacity, and
cost implications.
12
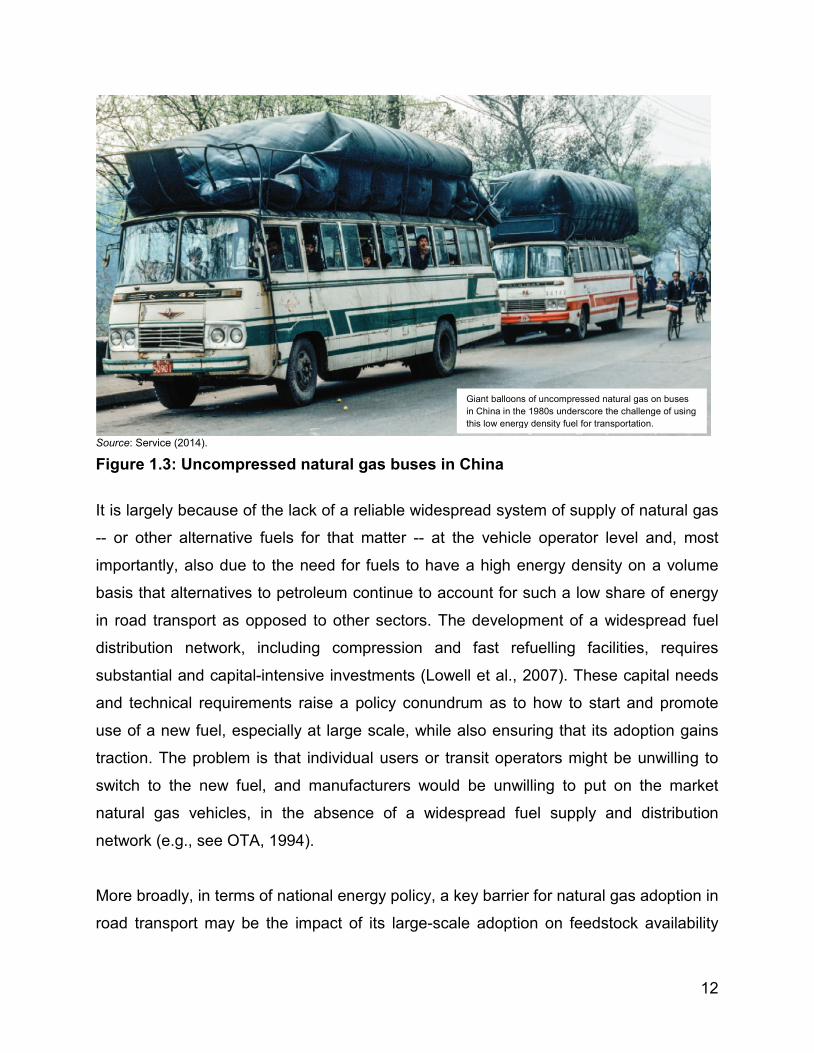
Source: Service (2014).
Figure 1.3: Uncompressed natural gas buses in China
It is largely because of the lack of a reliable widespread system of supply of natural gas
-- or other alternative fuels for that matter -- at the vehicle operator level and, most
importantly, also due to the need for fuels to have a high energy density on a volume
basis that alternatives to petroleum continue to account for such a low share of energy
in road transport as opposed to other sectors. The development of a widespread fuel
distribution network, including compression and fast refuelling facilities, requires
substantial and capital-intensive investments (Lowell et al., 2007). These capital needs
and technical requirements raise a policy conundrum as to how to start and promote
use of a new fuel, especially at large scale, while also ensuring that its adoption gains
traction. The problem is that individual users or transit operators might be unwilling to
switch to the new fuel, and manufacturers would be unwilling to put on the market
natural gas vehicles, in the absence of a widespread fuel supply and distribution
network (e.g., see OTA, 1994).
More broadly, in terms of national energy policy, a key barrier for natural gas adoption in
road transport may be the impact of its large-scale adoption on feedstock availability
Giant balloons of uncompressed natural gas on buses in China in the 1980s underscore the challenge of using this low energy density fuel for transportation.

13
(say for electricity generation), given the large scale of road transport energy needs. A
key macro energy policy challenge is in balancing competing uses for the fuel in terms
of electricity generation, transport, heating, and other needs. Consider that, of total
global natural gas supplied in 2016, approximately 41% was used for electricity and
heating generation, with the remainder of this feedstock being mostly used for industrial
purposes (18%) and residential, commercial and other uses (26%) (IEA, 2018).
For low- and middle-income countries, the challenges of substituting petroleum with
alternative transport fuels are especially significant, because of the incremental costs
associated with replacing existing and complex fuel supply chains and the financing that
is required. However, despite these challenges and incremental costs associated with
alternative fuels, a few developing nations have already resorted to them, as was shown
by the examples of Brazil and India discussed above.
1.5 Compressed natural gas for urban bus transit fleets
Given the barriers discussed in the preceding section, natural gas use has been largely
restricted to captive urban bus transit fleets that are operated within a limited range from
a centralized depot or depots, where it is more feasible to establish and operate capital-
intensive refuelling infrastructures and where buses return every day to be re-fueled.
From an emissions perspective, urban buses are well suited for using CNG fuel
systems, since industry standard buses are usually diesel-operated, and typically
account for the bulk of PM from urban transport, even though they account for a small
share of total vehicle-kilometres (Bose & Sundar, 2005).
For these reasons, notwithstanding the low share of natural gas in road transport, it is a
significant alternative fuel used in urban transit buses; adoption rates have actually
increased over the years, relative to traditional diesel bus numbers. For example, in
2002 in the US, 88% of large buses (i.e., with length 35 feet and over, which account for
the bulk of all public transit buses) were diesel powered, 10% were CNG, while other
fuel/propulsion technologies accounted for just 2% of buses; in 2016, large diesel-

14
powered buses in the US accounted for 65% of all buses, CNG 19%, hybrid-diesel 12%,
and other fuel/propulsion technologies 4% (NTD, 2017). Meanwhile, roughly, 8% of all
buses operated by publicly-owned bus transit fleets in India used CNG in 2015 (Table
1.2).
Table 1.2: Transit bus fleet numbers, India, 2015 Type of bus fuel system Rural + Hill Urban Total All types 117,179 25,166 142,345 CNG powered 1,734 9,619 11,353 CNG % of All types 1.5% 38.2% 8.0%
Source: CIRT (2017): “Fleet strength as on March 2015” (p.19).
Since bus transit fleets are almost invariably diesel powered, and natural gas is a poor
diesel engine fuel, natural gas engines on buses are typically spark-ignited (SI), being
either retro-fitted or dedicated, along with an on-board natural gas fuel system. Natural
gas has a higher octane rating, and therefore enables a higher compression ratio (and
fuel economy) than gasoline in SI engines, but which is still much lower than in
compressed-ignited (CI) diesel engines. Furthermore, SI engines, unlike CI diesel
counterparts, are characterized by poor part-load efficiencies because of throttling
losses. Consequently, thermal efficiency (and related vehicle fuel economy) can be
considerably lower for SI CNG engines relative to equivalent performance CI diesel
engines. This is especially so in the case of vehicles on which existing diesel engines
are converted to CNG, and engine conversion and emission control technologies are
sub-optimal, and because of other factors such as the additional weight of the CNG fuel
tanks (Faiz et al, 1996).
Notwithstanding the above, optimized and technologically improved lean-burn heavy-
duty natural gas SI engines can in fact achieve diesel efficiencies and CO2 levels
(Posada, 2009). Further, the use of natural gas in engines significantly reduces black
carbon (BC) emissions, which is a strong climate-forcing agent and when accounted for,
can potentially enable net GHG emissions reductions -- nearly 20% GHG emissions
reductions for CNG-based buses -- relative to their diesel counterparts, in contexts such

15
as India (Reynolds & Kandlikar, 2008). Lastly, according to Rabl (2002), while CH4 and
CO2 emissions are typically higher for CNG buses relative to an equivalent EURO II
diesel engine, PM, NOX and air toxics are significantly reduced, with important social
benefits (primarily due to reduced health costs) on CNG bus systems.
More broadly, with respect to the use of alternative transport fuels in bus transit
systems, it should be considered that over the past couple of decades, fuel and
emission standards in the US and Europe have become increasingly more stringent,
which in turn has pushed fuel and vehicle technological improvements forward in terms
of diesel bus emissions (Barnitt, 2008; Posada, Chambliss, & Blumberg, 2016), and
thus reduced the justification for CNG bus use (Hesterberg et al., 2008). In contrast,
many low- and middle-income countries continue to extensively use higher polluting
diesel buses without any effective aftertreatment technologies. While more stringent
diesel engine and fuel regulations have been enacted in some of these countries, it is
very easy and sometimes quite common for fuels to be adulterated with additives or
emission-control systems to be removed for better vehicle driving performance, thus
severely compromising the emissions results sought. This is another advantage of
natural gas over liquid fuels such as diesel, since natural gas adulteration is difficult (or
costly) to accomplish, as opposed to liquid fuels. The consequence of diesel fuel
adulteration is the adverse impact on vehicle emissions. Fuel adulteration is usually
driven by the economic incentive operators have, in light of potential fuel cost savings,
and is a challenge that could be present in any country context, as was the case in
Japan until the early 2000s (Wagner & Rutherford, 2013). In the Indian context, the
widespread availability of highly subsidized kerosene, intended as a cooking fuel, is a
major challenge, given the economic incentive for adulteration of diesel with this fuel.
Whether or not this is (or was) a pressing issue, fuel adulteration in Delhi is not
commonly cited in the literature as a motivation (or benefit) leading to the adoption of
natural gas policy that will be later discussed, but is nonetheless occasionally discussed
in India (CSE, 2002a; Gandhi, 2011).

16
Therefore, in contexts where natural gas is accessible at lower costs and where less
stringent vehicle and fuel emissions standards are in place, and where refining and
supply of low-sulphur diesel not adequate to meet demand for fuel, there is likely to be
more interest in CNG vehicles (Posada, 2009). Under these circumstances, cleaner
fuels, such as CNG, still play a role, and can result in substantial emissions reductions
and thus help in mitigating air pollution problems relative to diesel. For example, while
methane emissions will be higher for CNG systems compared to diesel, particulate
matter (PM) emissions will likely be considerably lower (Hesterberg et al., 2008) but,
proper vehicle maintenance is important for achieving these results. Indeed, PM
emissions reduction is normally among the key justifications for pursuing CNG, as was
the case in Delhi, India, discussed in this dissertation.
1.6 CNG in public bus transit in Delhi
Indian cities have been characterized by poor air quality since the 1990s. In Delhi,
suspended particulate matter levels have exceeded World Health Organization (WHO)
guideline limits almost daily since the 1990s. Levels of PM10 (particulates below 10 μm
diameter), which are strongly linked with respiratory and cardio-vascular illnesses and
deaths, also exceed the WHO limits (CPCB, 2015). A global survey of urban air
pollution (WHO, 2014a) showed that Delhi had the highest annual average levels of fine
particulates (PM2.5), which pose the most serious health risk. In response to this
problem, a wide range of policies has been implemented since the early 1990s to
address air emissions from urban transport. Delhi being the national capital, and given
its serious air quality problems, many of these policies were first implemented there and
in the other major metropolitan centres, and then in the rest of the country in a phased
manner. These policies have included increasingly stringent vehicle emission and fuel
quality standards, vehicle inspection and maintenance (I&M) to control in-use
emissions, and the phasing out of old commercial vehicles (CSE, 2002b; BIS, 2002;
TERI, 2002; Kojima, Brandon & Shah, 2000). A Supreme Court of India ruling in 1998
mandated that all public and for-hire motor vehicles (buses, taxis and auto rickshaws) in
Delhi be powered by compressed natural gas (CNG) (Supreme Court of India, 1998).

17
As a consequence of this ruling2, all of the city’s urban transit buses had to be
converted to run on CNG over a highly compressed time frame, by March 31, 2001.
However, because of resource, logistical, and institutional challenges, CNG
implementation on Delhi’s buses began only in 1999-2000. Significant implementation
challenges were mostly linked to the need to establish upstream and downstream fuel
networks in the city, with reasonable quality and reliability of supply in addition to
providing vehicles and parts. Domestic bus manufacturers were unable to supply the
required numbers of conversion kits in time, due to logistical, cost, and institutional
constraints, and as a result, the Supreme Court of India had no choice but to extend the
original deadline for implementation of its order several times. In the process, millions of
commuters were stranded on several occasions, as buses in non-compliance were
forced to cease operating, and bus, taxi and M3W vehicle operators went on strike, to
protest the costs of implementing the order, and difficulties such as the lack of
widespread availability of CNG for refuelling (Bell et al., 2004; Kathuria, 2005; Narain &
Bell, 2005). A key implementation issue related to the proverbial “chicken-and-egg”
problem, discussed above, was referred to in Delhi's context as a "sequencing problem"
by Bell et al. (2004). In the case of bus fleet conversion to CNG in Delhi, this
sequencing problem occurred since demand for buses was dependent on the
availability of financial resources for conversion as well as the availability of reliable
refuelling infrastructure and vehicle technology; meanwhile, the suppliers of the new
vehicle technology and infrastructure wanted assurances of demand for the technology,
without which they were reluctant to invest in production, despite government legislation
requiring such conversion.
Accomplishing the CNG policy mandate in Delhi required a close collaboration and
coordination of key stakeholders in this process, such as vehicle manufacturers, fuel
distributors and retailers, the environmental protection agency, and various government
2 According to the ruling (Supreme Court of India, 1998), no 8-year old buses could ply in Delhi except on CNG (or “other clean fuels”) beyond April 1, 2000, and further, the entire bus fleet in Delhi was required to be “steadily converted” to run on CNG by March 31, 2001.

18
ministries, among others. In order to break the supply-demand vicious-cycle, bus transit
operators, vehicle manufacturers, and refuelling infrastructure providers created a task
force to set a timeline for cooperation and bus test trials, thus resulting in a successful
transition to the new fuel system (details of the CNG implementation experience, from
the perspective of Delhi's principal bus transit operator, is described in detail in Chapter
4). Notwithstanding the many difficulties, by 2004, more than 85,000 public vehicles of
buses, taxis and M3Ws in Delhi were reportedly operating on CNG (Patankar &
Patwardhan, 2006).
Delhi, with around 20,000 buses, has one of India’s largest bus fleets; also, the publicly
owned Delhi Transport Corporation (DTC) has the second largest publicly operated
urban bus fleet in the country, with around 4,700 CNG buses (CIRT, 2017). DTC serves
the National Capital Territory of Delhi, as well as neighbouring cities in surrounding
states, and carried approximately 4 million passengers daily in 2014-15 (CIRT, 2017).
CNG implementation caused a significant reduction in the capacity to deliver transit
service at DTC in the initial stages of the mandated fuel transition, as noted. The first
CNG buses in DTC’s fleet -- the standard CNG buses -- replaced more than 3,000
diesel buses of similar configuration from around 2000 to 2004. Starting in 2007-08,
DTC introduced low-floor CNG buses to replace the standard CNG buses, 10% of which
were over DTC’s target service age of eight years in 2006-07 (CIRT, 2008). The low-
floor CNG buses were introduced to offer improved accessibility and quality of service.
Between 2007 and 2011, 3,700 low-floor CNG buses were put into operation, of which
33% were air-conditioned, on which higher fares were charged. Of DTC’s operational
buses in 2015-16, around 13% were standard CNG, 87% were low-floor CNG buses
(GNCTD, 2017).
In conclusion, given the many issues discussed in this chapter, which outlined a
rationale for CNG use in bus transit, the challenges and constraints this alternative fuel
system faces, and considering the particular long-term and large-scale case of CNG
use in Delhi, I have chosen in this dissertation to explore the use of natural gas-fueled
urban bus fleets with a focus on the Indian context, and particularly Delhi given its

19
natural gas ruling. The focus of this dissertation is all the more significant and timely
since the impacts of rapid motorization are shared by many other developing countries
similar to India and alternative fuels are increasingly seen in India, as well as other
countries, as part of the solution to a cleaner and less carbon intensive future.
Alternative transport fuels have the potential to contribute to reductions in emissions of
local air pollutants and energy security. As was discussed here, the central issue is that
increased motorization has also raised the need for significant expansion of supporting
transport infrastructure capacity, which requires massive investment expenditures in
capital scarce contexts, and a need for rapid increase in supply of energy services, all of
which create tremendous challenges for developing countries and therefore merit
careful and comprehensive policy-relevant research.
Therefore, many important issues need to be considered when contemplating use of
related alternative transport fuel technologies, such as the feasibility and cost-
effectiveness of large-scale implementation and use of alternative transport fuels vis-à-
vis traditional fuels, given the scale of road transport energy needs (Table 1.1) and
expected continual growth in these needs, as discussed in the previous section.
Furthermore, considerations have to also be contextually sensitive to issues important
to low- and middle-income countries, such as technology availability, reliability,
performance, serviceability, and affordability, as well as infrastructural capabilities, and
government policies and regulations relating to energy, fuels and vehicles.

20
Chapter 2: Research objectives and methodological framework
Chapter overview
In this chapter I outline the overall motivation, knowledge gaps, research needs and
objectives, analytic framework, and methodological approaches used in the dissertation.
The key problem motivating my dissertation research is the significant impact of
transportation on urban air pollution, with serious consequences for urban populations
and the environment, and the prospect of continued and fast growth in vehicle activity in
developing countries, which will tend to aggravate these impacts. While Chapter 1
described this problem in broad terms, this chapter presents a rationale for public policy
attention to a specific set of issues concerning compressed natural gas-fueled public
bus transit fleets in India. Given the dissertation's structure, written as four independent
but related substantive chapters that address different aspects of CNG use in bus
transit systems, the methodology section of this chapter will discuss the overall
methodological approach used in the dissertation as a whole and the four independent
research projects carried out in terms of questions and tasks addressed. Detailed
descriptions of the methodologies and analytic frameworks used are presented in each
of the substantive analytical chapters (3 to 6).
2.1 Motivation, knowledge gaps and research needs
As I argued in Chapter 1, India is an important context for the study of transportation-
energy issues given the rapid growth in motorization the country continues to
experience and the resulting range of negative impacts, amongst which a special cause
for concern is poor urban air quality, and associated human health and environmental
impacts. Since the 1990s, in response to the urban air pollution problem caused by
motor vehicle emissions, substantial policy measures have been applied nationally.
Also, targeted policy measures have been applied in Delhi, including the implementation
of CNG in the early 2000s, since the city is the country's political capital and one of its
largest metropolitan areas.

21
The implementation of CNG in Delhi was a significant achievement not only because of
the scale of conversion of its public vehicle fleet to run on an alternative transport fuel,
but also the limited timeframe in which the conversion was carried out, the various
competing stakeholder interests that had to be reconciled in order to get the goal
accomplished, the limited logistical capacity available to build a fuel supply
infrastructure for CNG (e.g., natural gas distribution and refuelling), and the lack of an
established market for CNG fuel and vehicles. In 2000, there were 30 CNG filling
stations supplying approximately 8,000 kg/day of natural gas, and by 2004 Delhi had a
public CNG fleet of nearly 85,000 vehicles that consumed approximately 772,000
kg/day of natural gas through 124 filling stations (Patankar & Patwardhan, 2006).
For my PhD research, Delhi's CNG policy outcomes were evaluated specifically for bus
transit in the city, given the importance of buses in Delhi in providing affordable
transport and economic opportunity to a majority of urban passengers. Though bus
transit shares have been adversely affected by personal modes of motorized transport
in recent years in Delhi, public transit accounts for 43% of all trips in the city, while car
and motorcycle modal share of all passenger trips are still relatively low at 19% (WSA,
2008a); this pattern is also shared by other large Indian cities (i.e., with populations > 8
million) which are characterized by a good supply of formal public transit in the form of
buses, metro, and/or trains (Figure 2.1). Further, the focus of my dissertation research
on CNG in bus transit systems is justified, as discussed in Chapter 1, by the fact that
captive urban bus transit fleets that operate within a limited range from centralized
depots are ideally suited to CNG implementation, making CNG-fueled urban bus transit
worthy of policy attention. Finally, as also discussed, the bulk of urban transport PM
emissions come from diesel heavy-duty vehicles, including bus transit.

22
Figure 2.1: Trip modal shares in India, by city size.
Broadly speaking, a large-scale conversion to an alternative transport fuel system, as
was the case of CNG in Delhi, depends on a wide range of issues and must contend
with many constraints that can vary significantly from context to context, such as the
technology's reliability, performance and serviceability. Conceptually, Faiz et al. (1996)
argue that typical constraints and issues related to alternative transport fuel adoption
include: (i) higher costs associated with fuel production, storage, distribution, and
vehicle purchase and operation; (ii) end-use considerations, such as changes required
to fuel distribution system, marketing, availability of end-use systems or user
acceptance of new alternative transport fuel adoption; and (iii) the abundance of the
alternate fuel, technology and infrastructural capabilities, relative prices across the
different road transport fuels, fuel safety, the technical quality of vehicles, and
government policies and regulations relating to energy, fuel and vehicle taxation, and
emission standards.
The literature on the implementation of CNG in Delhi’s public vehicles has focused
almost exclusively on its emissions effects (e.g., Kathuria, 2005; Chelani & Devotta,
2007; Narain & Krupnick, 2007; Reynolds & Kandlikar, 2008; Reynolds Grieshop, &
Kandlikar, 2011); there is also literature on the emissions effects of a wider range of
22
25
25
24
41
8
11
18
19
8
44
21
10
13
7
19
36
41
36
41
7
7
6
8
3
0% 20% 40% 60% 80% 100%
> 8 million
4 - 8 million
2 - 4 million
1 - 2 million
< 1 million *C
ity s
ize
(pop
ulat
ion)
*Average for Category 1 and 2 cities in Fig.2.9 from WSA (2008a).Source: WSA (2008a): Fig. 2.9 (p.36).
PublicWalk Cycle Transport Car + motorcycle IPT

23
policy measures (e.g., Jalihal & Reddy, 2006; Kumar & Foster, 2009; Goel &
Guttikunda, 2015; Aggarwal & Jain, 2016; and Jain, Aggarwal, Sharma, & Kumar,
2016). However, little if any attention has been devoted to systematically analyzing
other critical issues, such as those related to CNG’s operational or financial
performance; the cost-effectiveness of emissions outcomes; and the long-term financial
viability of CNG systems in Delhi. In this regard, see also Khan (2015), an international
review of CNG implementation in transport, which focuses exclusively on the emissions
outcomes of CNG. As well, much of the literature on this topic in China also focuses on
the environmental outcomes of CNG, and issues such as bus emissions estimation,
total emissions inventory estimation, and well-to-wheels emissions assessments (e.g.,
Karman, 2006; Wang et al., 2015a; Qiu et al., 2016; Wang et al., 2018). Further, while
there is limited published research related to other aspects of CNG implementation
(e.g., Wang et al., 2015b; and Hao et al., 2016), it focuses mainly on issues of logistics,
infrastructure requirements, and vehicle and fuel pricing, but lacks attention to the
operational and financial aspects of CNG. The recent experience with CNG
implementation in Pakistan highlights the importance of looking at other important
issues, such as those related to fuel supply logistics and fuel costs. The government
there has promoted the use of natural gas in transport, and the number of vehicles
running on CNG is approximately 3 million (Khan, 2014). However, due to the
importance of natural gas feedstock for other uses, such as in energy generation and
industry (e.g., for fertilizer production), and since natural gas demand far exceeds
supply, the government started to ration natural gas supply for CNG transport in 2010,
creating immense hardship for the many transport users that rely on CNG (Khan, 2014).
Furthermore, this is an ongoing problem, given the increased reliance on natural gas for
the country’s total energy needs on the one hand, since this fuel is important for various
sectors of the economy (and not just transport), and the continued shortage of natural
gas supply vis-à-vis demand, on the other (Rehman, 2019).
In the Indian context, Sen et al. (2007) point to the lack of sufficient focus on the role of
decision-makers in the creation of financially viable and self-supporting urban transport
systems. Further, it can be argued that, while the emissions outcomes of CNG

24
implementation are important from a societal perspective, and are an important focus
for policy evaluation, it is also important and useful to critically evaluate this, and indeed,
any such policy from the perspective of vehicle users and operators, because it is the
policy responses of these actors that crucially determine the extent to which
implementation, and the associated emissions reductions, actually occur and are
successful.
More particularly, analyzing the operational and financial performance of bus fleets on
CNG or any other alternative fuel is important because it is this performance that
critically determines the bus operator’s policy responses. Such an analysis is also useful
from a policy perspective, given the need to provide quality, convenient and affordable
bus services within the constraints of limited budgets on which public transit operators
typically rely, to prevent the migration of ridership to private motor vehicles, with all of
their negative impacts. In this regard, note that, while buses and other public transit
modes still account for a significant share of passenger trips in Delhi, their mode share
has been declining significantly, due to the growing role of personal motor vehicles.
Delhi has a population of approximately 17 million and a vehicle fleet (including
motorcycles) of more than 10 million (GNCTD, 2017). Because Delhi now has many
years of experience with CNG, and at such a large scale, this policy is a unique case for
investigation of challenges and evaluation of outcomes related to this decision. Delhi’s
use of CNG shows that there are many issues related to policy implementation that are
not always anticipated, but that had a profound impact on policy outcomes (CSE, 2001;
Sanghi et al., 2001; Bell et al., 2004; Patankar & Patwardhan, 2006). Thus, the need for
systematic and comprehensive assessment is important, especially in low- and middle-
income countries where the priorities are many, governmental and transit agencies
financial resources are constrained, and with lower per-capita disposable incomes of
transit users, which only increase the importance of finding affordable, cost-effective,
and financially sustainable solutions to transport challenges. This dissertation will use
Delhi’s experience with CNG bus transit in order to fulfill this important research need,
especially since no systematic post-implementation studies have been conducted to

25
critically analyze this experience in an integrated manner covering the range of issues
discussed above.
2.2 Research objectives
Given all of the above, the overall objective of my PhD research is to assess the
operational and financial performance consequences of, and the cost-effectiveness of
emissions reductions due to, replacing diesel bus fleets with CNG in Delhi, India, in
order to support decision- and policy-making related to the use of alternative transport
fuel systems in low- and middle-income country contexts, like India, and help inform
whether this alternative transport fuel system can cost-effectively mitigate urban air
quality problems. Based on this assessment, it is hoped that key lessons can be drawn
for the long-term viability of a large-scale conversion to CNG in other bus transit fleets,
and for informing techno-economic and environmental analyses of CNG bus transit
operations. Following are the key research questions that I address in my PhD
dissertation:
- What are the key lessons that can be learned from the international experience with
CNG in urban bus transit fleets for rapidly motorizing low- and middle-income countries
contemplating use of natural gas in order to address urban air quality, energy security or
climate change concerns?
- What were the CNG implementation issues in Delhi in terms of the associated
infrastructure, logistical and institutional challenges, and what was the operational and
financial performance of its natural gas-fueled public bus transit fleet? Furthermore, and
related to the prior question, what are the implications of CNG implementation for the
ability to provide convenient and affordable public transit service?
- What are the long-term financial implications of CNG implementation in the bus transit
fleet, and what are the key influencing factors? What are the lessons for the long-term
viability of large-scale conversions of bus fleets to CNG?

26
- What was the cost-effectiveness of CNG implementation on bus public transit in Delhi?
Was the conversion of the bus public transit fleet to CNG for achieving emissions
reduction justified from this perspective? Further, considering Delhi and the broader
Indian context, in terms of its cost-effectiveness, would CNG merit adoption today vis-à-
vis cleaner diesel technological options currently available?
2.3 Thesis structure, analytical framework, and methodological approach
My doctoral dissertation is structured following a manuscript-based format and
integrates four analytical Chapters (3 to 6), in addition to the review of issues related to
alternative transport fuel use and the overall problem statement (Chapter 1), the thesis
research objectives and methodological framework (Chapter 2), and a synthesis of the
key conclusions and policy implications (Chapter 7). As previously indicated, two of the
analytical chapters (Chapters 4 and 5) have been published in peer-reviewed journals.
Overall, each analytical chapter explores key dimensions of and perspectives on CNG
implementation in Delhi’s public bus transit fleet, as shown in Table 2.1, and taken
together, address the above research questions. Each of the analytical chapters --
besides Chapter 2 -- starts with an overview, which provides a logical progression
between chapters, and contains an introduction, literature review, methodology,
research results and analysis, and conclusion.

27
Table 2.1: Dimensions and perspectives reflected in dissertation
Analytical chapter:
(Chapter 3) Natural gas fueled
urban bus transit: US and Latin American
experience and lessons for rapidly
motorizing countries
(Chapter 4) Operational and
financial performance of Delhi's CNG-fueled public bus transit fleet:
A critical evaluation
(Chapter 5) CNG and Diesel Urban Buses in
India: A Life-cycle Cost Comparison
(Chapter 6) Cost-effectiveness
of CNG implementation in
the public bus transit fleet in Delhi
Perspective: Policy & planning / Bus fleet operator
Policy & planning / Bus fleet operator
Policy & planning / Bus fleet operator Policy / Societal
Dimension: Technological x x x
Institutional x Operational / infrastructure x x x
Economic / financial x x x x
Environmental x x
Research projects - Description In the first analytical chapter (Chapter
3), I conduct a comprehensive critical review of the literature concerning the
performance of CNG as an alternative fuel system in urban bus transit fleets based on
the experience of different fleet operators in the US and Latin America. Drawing on the
key lessons from this review for CNG evaluation and the important issues raised, I
analyze in Chapter 4 the operational and financial performance of DTC with CNG in
Delhi to assess how the switch from diesel to natural gas affected this performance.
Both these research projects, in turn, helped provide the basis for modelling the life-
cycle costs of operating CNG in the Indian context, in Chapter 5. Lastly, based on the
life-cycle costs estimated in Chapter 5 and coupled with my estimation of the emissions
outcomes of CNG implementation in Delhi, I conducted a systematic evaluation of the
cost-effectiveness of reducing key pollutants in this city in Chapter 6. Specifically, these
are the four independent research projects that were carried out for each of the
analytical chapters:
(i) In Chapter 3, I investigate key lessons that can be drawn from the experience related
to CNG implementation in bus transit in the US, Mexico, and Chile, which was then
critically analyzed in terms of the motivations for CNG implementation from the
operator’s perspective; the process of evaluation that was used, in terms of the criteria
and issues that were considered; the choice of and rationale for the vehicle and
refuelling infrastructure configurations selected; and CNG fleet performance, in terms of

28
parameters such as vehicle performance, fuel economy, exhaust emissions, and bus
fleet and fuel system costs. The outcome of this research was to identify key challenges
and draw lessons for rapidly motorizing developing countries also contemplating use of
natural gas in order to address urban air quality, energy security or climate change
concerns. Particularly, in this research project I sought to outline the requirements for a
successful CNG fuel system implementation in bus transit fleets and how its viability can
be more effectively evaluated based on the critical study of international experiences.
This research also helped to identify critical issues for policy analysis, related to CNG
implementation in urban bus transit, which were investigated in the subsequent
substantive chapters.
(ii) In Chapter 4, I evaluate the operational and financial performance of DTC's bus fleet
from 1989-90 to 2010-11 -- that is, from ten years prior to CNG implementation until 10
years after -- to assess how this performance was affected by the fuel switch, as well as
the introduction of low-floor CNG buses. Key lessons from this research are drawn to
see how CNG affected DTC's financial situation and as a result its overall capacity to
provide transit services. I explore and raise questions on how policies, such as CNG in
Delhi, may affect important trade-offs between environmental, and other transit
operation, socio-economic and equity objectives.
(iii) In Chapter 5, I evaluate the life-cycle costs (LCCs) of Standard, Low-floor and Low-
floor air-conditioned (AC) CNG buses and their diesel counterparts in India. These
evaluations were based on actual (on-road) bus performance data for DTC and other
public bus transit agencies, in order to closely reflect fuel and bus technologies,
operating conditions, and costs that are prevalent in urban India. Given the importance
of fuel economy and fuel price for fuel costs, I analyze the sensitivity of the LCCs to
these factors. Also, to assess what might happen if fuel prices were largely market
driven, I evaluate the LCCs of Low-floor AC CNG and diesel buses in India, but with US
fuel prices. Lastly, I analyze how the discount rate affects these assessments.

29
(iv) In Chapter 6, I analyze the cost-effectiveness of Standard, Low-floor and Low-floor
AC CNG buses, relative to diesel, to evaluate Delhi's natural gas directive of the early
2000s and the continuation of CNG policy in urban bus fleets in this city, given newer
natural gas and diesel bus technologies available in India today. Using cost and
emissions estimations, I quantify the incremental cost-effectiveness (CE) ratio of CNG
and cleaner diesel buses relative to standard diesel buses in the form of dollars-per-
avoided emissions ratios. The CE numerator includes the total cost of ownership of
each bus technology, thus reflecting incremental life-cycle costs from Chapter 5, of
CNG and cleaner diesel buses over baseline Standard diesel buses. The CE
denominator reflects incremental emissions reductions, based on the differences
between emissions of baseline conventional Standard diesel buses and emissions of
CNG and cleaner diesel buses in India. I evaluate emissions impacts in terms of PM
and NOX, -- which are health critical pollutants -- and CO2 equivalent emissions. In
addition to the CE analysis, I also use scenarios to evaluate the broader impact of CNG
policy measures on ridership across the transit system as a whole. With use of these
scenarios, I evaluate how higher life-cycle costs of CNG may affect the supply of buses,
and as consequence, the impact on the overall effectiveness of emissions reductions
due to these incremental costs.
2.4 Data and issues
Chapters 4 to 6 focus on the Indian experience, for which much information, both
quantitative and qualitative, was needed and gathered during two field visits to India
(Jan-Apr/2010 and May-Aug/2011). These field visits took place predominantly in the
Indian capital region, Delhi, to determine (at a first instance) information availability,
identify information sources, and gather data that was needed to accomplish the
specific research goals of the analytical chapters; but also, the visits enabled the
establishment of contacts with experts and decision makers in government, research
and teaching institutions, and industry, in the subject areas that were relevant to this
dissertation. In this first assessment trip, preliminary information was collected in the
areas pertaining to the specific research outputs in Chapters 4 to 6 but also, in this

30
connection, a number of CNG-related stakeholder organizations were visited, mostly in
Delhi, that allowed for the contextualization of the dissertation research in a broader
policy-oriented perspective.
During the second field visit, information gathering was finalized. Detailed data
pertaining to operational and financial statistics of DTC’s performance was collected
from secondary sources. Also, various visits were conducted at DTC to gather key
operational and financial statistics that are representative of the performance of diesel
and CNG use in bus transit operations in Delhi (used in Chapters 4, 5 and 6). Data on
CNG implementation was also collected directly at DTC. Most information collected at
DTC was quantitative, such as time-series performance statistics, collected either via
access to reports from the company or via select field visits to a representative sample
of bus. Details of DTC sites visited, their location in Delhi, and the typical depot layout
can be found in Appendix A. Descriptions of methods and data collection are also
provided in each analytical chapter (4 to 6).
Lastly, it should be noted that, while I reviewed a wealth of (quantitative and qualitative)
information for this dissertation research and that most of the data required to achieve
specific research objectives was available for the context of interest (India), in certain
cases data were not available and had to be estimated. Since collecting these data
through primary data collection methods was beyond the intended scope of individual
research projects or even for the dissertation as a whole, as discussed in each
analytical chapter, in these circumstances, parameter estimation was based on best
available evidence for similar contexts, for which details of the assumptions used are
clearly outlined and referenced in the methodological sections of each analytical
chapter.

31
Chapter 3: Natural gas fueled urban bus transit: US and Latin American experience and lessons for rapidly motorizing countries
Chapter overview
As discussed in preceding chapters, India mandated the implementation of CNG to
mitigate urban air pollution problems. However, carrying out such a mandate requires
massive investments in vehicles, fuel systems, and refuelling infrastructure, and
therefore presents a substantial challenge (or even barrier) to CNG adoption, especially
from a transit operator's perspective, if they have to bear these costs. In addition to
these implementation challenges and costs, there are also important operational issues
regarding the use of CNG in providing transit services, such as vehicle performance on
the road -- including its reliability -- emissions performance, and the operating costs,
among others. Specifically, analyzing the operational and financial performance of bus
fleets on CNG is important because this performance will be a key determinant the
operator's policy responses. In Delhi's case, no systematic post-implementation study
has been carried out, in terms of these range of aspects, as most research to-date has
focused largely, if not exclusively, on emissions outcomes. Most importantly, as will be
shown in later chapters, despite CNG implementation, Delhi urban air quality has been
deteriorating significantly, all of which raises important questions, such as the
effectiveness of CNG in reducing pollution; the cost-effectiveness of CNG measures; if
the same outcomes, and other objectives, could have been achieved by other means;
and, how viable CNG is, given investments and the socio-economic context. All these
are important questions, especially when considering the issues discussed in Chapter 1,
such as existing barriers to alternative fuel implementation, the proverbial "chicken and
egg situation" to initiate these policies, and the fact that even now alternative fuels only
account for 5-6% of all fuels consumed in road transport globally. With respect to
alternative transport fuel use, even though the share of natural gas is small relative to
petroleum, CNG propulsion system is the most prevalent alternative to diesel
(particularly for urban public bus transit fleets).

32
In view of the foregoing, the objective of this chapter is to investigate the lessons that
can be learned from international experience with CNG use in urban bus transit fleets,
and to explore the particular relevance of these lessons for rapidly motorizing low- and
middle-income countries which are implementing, or might wish to implement, this fuel
for addressing urban air quality concerns. To this end, this chapter comprises a critical
review of the performance of CNG based on the experiences of five urban bus transit
fleet operators in the US, Mexico, and Chile, in order to see how CNG implementation
can be more effectively evaluated, with respect to the bus fleet operator's financial,
emissions, and operational goals, and what is required for this implementation to be
successful.
3.1 Methodology and outline
Three US and two Latin American CNG urban bus transit fleets are used for the
analysis (Table 3.1). While the fleets in New York (NYCT), Palm Springs (SunLine
Transit Agency) and Washington D.C. (WMATA) were chosen because they have been
operational for a decade or more, the Mexican (MCMA) and Chilean cases were chosen
for being part of a limited group of countries in the global South in which alternative fuel
systems, including CNG, were evaluated for application in urban bus fleets. These
cases are relevant to CNG in the Indian context, the primary focus of my dissertation,
because the CNG bus technologies implemented in the US and Latin America that I
discuss are similar to the bus technologies that were implemented in India in the early
2000s, which will be analyzed in Chapters 4, 5 and 6. More importantly, I will use the
US and Latin American experiences to draw lessons for the evaluation and
implementation of CNG in the Indian context. For each of the US and Latin American
cases, the following issues are critically discussed: the motivation for CNG
implementation from the bus fleet operator’s perspective; the process of evaluation that
was conducted, in terms of the criteria and issues that were considered; the choice of
and rationale for the vehicle and fuelling infrastructure configurations selected; and
CNG fleet performance, in terms of parameters such as vehicle performance, fuel
economy, air pollutant and GHG emissions, and bus fleet and fuel system costs. Finally,

33
note that these cases were selected also because of the comprehensive, published
literature on the assessments conducted therein, along the range of dimensions that I
am focusing on.
Although this chapter focuses on the performance of CNG relative to diesel as a fuel for
urban bus transit, evaluations of diesel-hybrids are also discussed, because they have
been implemented, in some instances for quite a while and to a considerable extent,
including in the cases discussed here, and will likely become more prevalent in the
future, including in low- and middle-income countries like India. Also, note the focus on
comparisons between different fuel systems on similar configuration buses under similar
operating conditions in the US fleets, with additional comments on the performance of
these systems in the Mexican case, in which these conditions are different (for example,
while the absolute capital and operating costs for the different fuel systems are lower for
MCMA relative to the US fleets, useful cost comparisons can still be made among these
systems).
Table 3.1: Summary of cases evaluated CASE No. of CNG buses(1) % of fleet 1st adoption
1. New York City Transit, New York, NY (NYCT) 481 12% 1995
2. SunLine Transit Agency, Palm Springs, CA (SunLine) 66 96% 1994
3. Washington Metropolitan Area Transit Authority (WMATA) 459 31% 2002
4. Mexico City, Mexico (MCMA) 30 n/a evaluation(2) 5. Santiago, Chile 0 0 evaluation(3) (1) Fleet numbers source as follows: NYCT (NYCT, 2011), Sunline (SunLine, 2011), WMATA (WMATA, 2010), MCMA (RTP, 2010), Santiago (Universidad de Chile, 2007); (2) Project: climate-friendly measures in transport; (3)
Project: sustainable transport and air quality
Finally, while this chapter seeks to learn from the international experience with CNG in
urban bus fleets, there is of course the more fundamental question of whether CNG is
worth implementing in urban transport, to address urban air quality, energy security and
climate change concerns, specifically in the LIC context (and whether urban transport is
the best sector in which to implement CNG, given the other important sources of air
pollution, and related health and welfare concerns). While these larger questions are
beyond the scope of this chapter, CNG, diesel and diesel-hybrid urban buses were

34
evaluated in terms of operating costs, based on fuel price sensitivity analysis of selected
cases. The conclusion contains a summary of the key lessons from the experience in
the five cases, and the results of the sensitivity analysis.
3.2 Analysis of CNG experience
3.2.1 Rationale for CNG implementation in urban bus transit
In the US, transit operators have been under pressure, from the public and the EPA, to
reduce bus emissions in urban areas; EPA have progressively tightened emissions
requirements for urban transit buses, particularly for NOx and PM, the pollutants of
primary concern, since 1990 (e.g., see Barnitt, 2008; EPA, 2011). For the WMATA, the
rationale was primarily to reduce NOx emissions, given Washington DC’s ozone
problems (Melendez et al., 2005). In NYCT’s case, they created their Clean Bus
Program in 1992, and stopped buying new diesel buses in 1999. NYCT introduced CNG
through a small pilot project in 1995, as part of a clean fuel bus program, with a fleet of
486 CNG buses in two bus depots in 2011 (NYCT, 2011). Since 2000, they decided to
purchase only low emission buses, including those operating on CNG, and -- motivated
by fuel economy and operating costs as well -- diesel-hybrids, besides other actions
(Barnitt, 2008). It may be that funding, such as by that from the US Department of
Energy, was also a motivating factor for conversion to CNG.
In Mexico, the Third Air Quality Management Plan prepared by state and city authorities
identified the significant role of the transport sector in air pollution and the likely cost-
effectiveness of focusing on this sector to improve air quality and minimize health
impacts (SMA, 2006b; World Bank, 2002a; World Bank, 2002b). A comprehensive
strategy for addressing vehicular air pollutant and GHG emissions, including the
evaluation of clean fuels, was therefore developed. In Santiago, the environmental and
economic impacts of clean bus technologies were evaluated, and, as in Mexico, this
effort was intimately linked to both the city’s urban transport plan and the metropolitan
region’s Air Pollution Prevention and Clean-up Plan that sought to reduce PM10 and

35
NOx emissions from transport (OECD, 2005; SECTRA, Plan de Transporte Urbano
para el Gran Santiago 2000-2010). In both cities, the CNG evaluation was conducted as
part of a comparison of different fuel and vehicle technologies to improve urban air
quality and reduce greenhouse gas (GHG) emissions. Pre-evaluation and field tests for
CNG fuel systems in both cities were funded by the Global Environment Facility (GEF),
in conjunction with local government sources (Graftieaux et al., 2003).
3.2.2 Evaluation of CNG performance on urban bus transit fleets
It is important to highlight the different objectives and contexts of the evaluations
conducted in the five cases reviewed. In the three US cases, performance evaluations
were sponsored by the US Department of Energy’s (USDoE) Advanced Vehicle Testing
Activity (AVTA) programme to assess advanced propulsion technologies, including
CNG, based on the actual experience and costs of selected bus transit operators
(Barnitt, 2008). While the Mexican and Chilean cases were both pre-implementation
evaluations of CNG and other alternative fuel systems for buses, field tests were
actually conducted for determining their feasibility under city operating conditions in
Mexico City. The evaluation of CNG in Santiago, Chile only relied on desk studies,
despite initial plans for field tests. Nevertheless, this evaluation is also useful to look at
for the criteria that were considered. Finally, note that though the evaluations analyzed
in this chapter are from the mid-2000s, for buses of vintages ranging from mid-1990s to
mid-2000s (Table 3.2), they are very relevant for the purpose of this thesis since these
buses, with corresponding emissions standards, are still pertinent and in use in
countries like India3. Furthermore, it is for these vintages of vehicles that long-term
performance information and insights are available in terms of fuel economy, reliability
and operating cost parameters, and how performance changes over longer periods of
time, in these evaluations.
The purpose of the in-use performance evaluations of alternative fuel and advanced
technology vehicles in bus fleet applications sponsored by USDoE’s AVTA programme - 3 For example, in India, only in 2017 was Bharat Stage IV (BS-IV) emission standard applied nationally (Posada et al., 2016).

36
- including those conducted by Barnitt and Chandler (2006) and Barnitt (2008) at NYCT,
Chandler (2006) and Chandler and Eudy (2007) at SunLine, and by Chandler, Eberts
and Melendez (2006) and Melendez, et al. (2005) at WMATA, which are the studies
used in this chapter -- was to "provide comprehensive, unbiased evaluations" in order to
enable "fleet owners and operators make informed purchasing decisions" regarding
these technologies (Barnitt & Chandler, 2006); therefore, these assessments should be
of interest to any bus fleet operator considering a fuel system change. The AVTA
initiative was carried out by the National Renewable Energy Laboratory (NREL), and
followed standardized procedures of data collection and analysis developed there
(NREL, 2002; Barnitt, 2008). It was a pre-requisite for all buses being assessed to have
been in operation for at least a year in their fleets.
The evaluation of the bus fleet performance referenced above at NYCT focused on the
key issues of reliability, fuel economy, vehicle maintenance, and vehicle and fuel
infrastructure capital and operating costs, for a statistically significant sample of CNG
and hybrid buses during a 12-month period during 2004-05 (Barnitt & Chandler, 2006;
Barnitt, 2008). Data was collected for the various parameters which importantly
influence performance outcomes, listed in Table 3.2. While the evaluation frameworks in
the assessments of the CNG bus fleets at WMATA and SunLine referenced above
essentially included identical parameters, the time period of evaluation was 2000-04 for
SunLine, and 2003-04 for WMATA. In WMATA's case, the performance evaluation was
supplemented with a measurement of emissions from lean burn CNG and ultra-low
sulphur diesel (ULSD) buses on a chassis dynamometer (Melendez et al., 2005).
While the evaluations of the US bus fleets conducted by Barnitt (2008), Barnitt and
Chandler (2006), Chandler (2006), and Chandler et al. (2006) considered infrastructure
capital costs, and vehicle capital and operating costs (including fuel and maintenance
costs), as well as factors such as miles between road calls, all of which are helpful in
analyzing the performance of alternative fuels, these parameters were assessed at a
given point in time; the evaluations did not include an assessment of life-cycle costs,
which the AVTA programme did not require. Consideration of the costs (and other

37
impacts) related to the purchase, operation, maintenance, servicing and replacement of
engines, vehicles, and fuelling infrastructure (or in the case of hybrids, batteries and
battery conditioning stations) on a life-cycle basis is important for assessing the long-
term viability and cost-effectiveness of, and therefore enabling informed fleet operator
decision-making related to, alternative fuel systems, which is after all the primary
objective in conducting such evaluations. These factors are particularly important, given
that the challenge for transit operators considering an alternative fuel to mitigate
vehicular emissions is that that fuel must be proven to be superior to cleaner diesel
options combined with exhaust treatment, which do not require major changes or
incremental costs to operator’s refuelling infrastructure. Indeed, exhaust gas treatment
technologies such as diesel particulate filters (DPFs) and exhaust gas recirculation
(EGR) have already been implemented in conjunction with ULSD, in order to meet
increasingly stringent EPA emission standards for PM and NOx (Barnitt, 2008; EPA,
2011).
Also, note in this regard that incremental costs associated with the purchase of new
CNG buses compared to diesel buses can range from $25,000 to $50,000 in OECD
countries (IEA, 2002) and approximately $40,000 in the US (Lowell et al., 2007). Most of
the incremental vehicle costs, whether for retrofitting or buying new vehicles, relate to
the on-board CNG tanks. Yang et al. (1997) estimate that these tanks can represent
two-thirds of total retrofit costs. Furthermore, as discussed in Chapter 1, CNG fuel tank
technology has important implications for vehicle performance factors such as payload,
fuel economy, refuelling frequency and range, as well as for the refuelling infrastructure.
Natural gas compression speed is one of the major factors in determining total refuelling
infrastructure costs (Heath et al., 1996). For an urban bus fleet of 100 buses using a
fast-fill system comparable to diesel in an indoor refuelling facility, additional costs can
amount to $2 million, which represents an incremental cost of $20,000 per bus just for
the refuelling infrastructure (Heath et al., 1996; ARCADIS, 1998; Lowell et al., 2007).
In the Mexican case, following on from the Third Air Quality Management Plan
discussed earlier, field tests were conducted to evaluate the performance of various

38
alternative bus fuel systems, under real operating conditions, for the overall purpose of
assessing the cost-effectiveness of each option in mitigating air pollutant emissions in
Mexico City’s Metropolitan Area (MCMA) (Vergara & Haeussling, 2007; SMA, 2006a).
The field tests included a total of 22 buses of varying dimensions, emission standards
and fuel systems, including lean burn CNG, diesel-hybrid, and diesels, with the diesels
using a fuel of varying sulphur content ranging from the standard 350 to 15 ppm (parts
per million), and additional emission controls (specifically, catalytic DPFs). Note that fuel
cells and LPG were eliminated from the field tests, the former because of capital cost
considerations, and the latter due to fugitive emission concerns. Of interest for this
chapter are the two CNG bus models supplied for the field tests by Ankai from China
and Busscar from Brazil (Table 3.2) and the two diesel buses (Volvo 12 and Mercedes
Benz 12) from Mexico City's operating fleet of buses at RTP (Red de Transportes de
Pasajeros del D.F.), that were used as a baseline with which to contrast the emissions
and operating performance of the alternative fuel systems. The main issues that were
evaluated included bus and engine performance, fuel consumption and economy,
capital and operating costs, noise, and PM, NOx, CO, HC, VOC and CO2 emissions
(SMA, 2006a). The evaluation also included on-board vehicle emissions measurements
conducted by Weaver and Almanza (2006) along a BRT (Bus Rapid Transit) test route
for a year during 2004-05, and chassis dynamometer tests in 2004 conducted by
Western Virginia University (WVU, 2005). Note, however, that no particular attention
was given to refuelling infrastructure requirements or costs.
For Santiago, while the GEF funded project specifically required that CNG buses be
field-tested (World Bank, 2003; Graftieaux et al., 2003) in order to integrate a thorough
environmental-economic assessment of them as part of transportation decision-making
(Deuman, 2003; Universidad de Chile et al., 2003; Universidad de Chile, 2007), only
desk surveys were conducted to evaluate CNG. Data for the desk studies came from
two sources, prior field tests conducted in 1999 in Santiago by the Chilean Ministry of
Environment Commission, results of which are available in “Anexo C.2” of Universidad
de Chile (2007), and the Mexican field tests discussed in this chapter (SMA, 2006a).

39
To date, there is no evidence of CNG adoption in Santiago (AGN, 2016), though the
public transit system operator, Transantiago, was considering this fuel system closely
and looking for adequate public funding for a potential project as recently as 2010 (NGV
Journal, 2010). In the case of Santiago, which had sought to promote CNG, an
ineffective incentive structure for private fleet operators prevented the technology from
being adopted; a group of experts critiqued the fuel tax structure, which favored diesel
over CNG (MTT, 2008). MTT (2008) argued that distortions in the tax structure should
be eliminated in order to promote a more efficient transport system, by incorporating all
externalities of each fuel option in the decision-making process. According to MTT
(2008), the transport fuel tax structure gave no incentives for fleet operators to explore
lower emission technologies and so was mostly unsuccessful because of the low
economic feasibility of the proposed changes. Meanwhile, in Mexico City, the public
transit operator RTP introduced 30 CNG buses in November of 2010, at the
approximate cost $270,000 per bus (RTP, 2010). An interesting aspect of the Mexico
City CNG project is that while RTP has not yet invested in a dedicated CNG refuelling
infrastructure, which is currently being provided by a third-party supplier outside the bus
depot, they are considering such infrastructure if CNG adoption were to gain “scale”
(RTP, 2010; NGV Journal, 2011a, 2011b).
3.2.3 Vehicle and fuelling infrastructure
The space needed for high-powered compressors and buffer tanks that ensure fast
refuelling of buses can be quite substantial; additionally, compliance with building and
fire safety codes has to be considered in densely populated areas. At both NYCT and
WMATA, CNG buses are operated from two carefully selected bus depots, since not all
depots are suitable given these considerations (Chandler et al., 2006; Barnitt, 2008).
Despite implementing CNG, WMATA has maintained a diversified approach, by
including standard diesel buses (55% of the bus fleet), clean diesel buses that combine
ULSD with DPFs (8%) and diesel-hybrids (6%) along with CNG buses (31%) in its fleet
in 2010 (WMATA, 2010). Note that while this data relates to buses used in the dates
described, these technologies are still widely available and used today in contexts such
as India, and which will be analyzed in detail in the following chapters.

40
Similarly, CNG buses represented 12% of NYCT’s fleet (Table 3.1), with other
technologies, particularly diesel-hybrids, also being used to achieve its air quality
objectives. Note that this diversified approach, and the use of hybrids in particular has
been motivated not only by the infrastructure and space constraints discussed above,
but also by the fact that hybrids offer significant fuel economy advantages relative to
both diesel and CNG, while also producing low emissions. In the case of SunLine, it
opted for a full fleet conversion in 1992 and 46 new CNG buses were put into service in
1994. In 2011, SunLine had 66 CNG and 3 hydrogen fuel-cell powered buses (SunLine,
2011).
NYCT’s two depots operating CNG buses had 163 and 318 buses running on this fuel
respectively in 2011 (NYCT, 2011). The capital cost for the refuelling station and
facilities improvement at the first depot was $7.4 million, of which $2 million was spent
on blasting through solid rock in order to cover high-pressure gas lines (Barnitt, 2008).
WMATA’s nearly 400 CNG buses were equally distributed between two separate
facilities. The costs for one of these facilities was $15.6 million (Chandler et al., 2006),
but most of this amount is likely not fuel related, as the 40-year-old facility had to be
upgraded. The cost for the refuelling infrastructure at this WMATA depot alone was $4
million. At SunLine, meanwhile, no modifications were necessary in their outdoor bus
storage facility, showing that CNG refuelling infrastructure investments are climate and
space dependent.
All three US fleets outsourced the operation of their refuelling infrastructure. NYCT has
a fast-fill system which allows buses to be fueled in 3-10 minutes; its operation and
maintenance was outsourced at a variable cost of $0.25 per therm of natural gas
consumed, which amounted to 25% of fuel feedstock price. WMATA also outsourced
fuel infrastructure operations, but at a fixed rather than at a variable rate, in addition to
paying the related electricity charges. Interestingly, WMATA’s refuelling costs also
amounted to roughly 25% of feedstock fuel price. Given the magnitude of refuelling
costs, operators should consider, in addition to the natural gas price, the refuelling
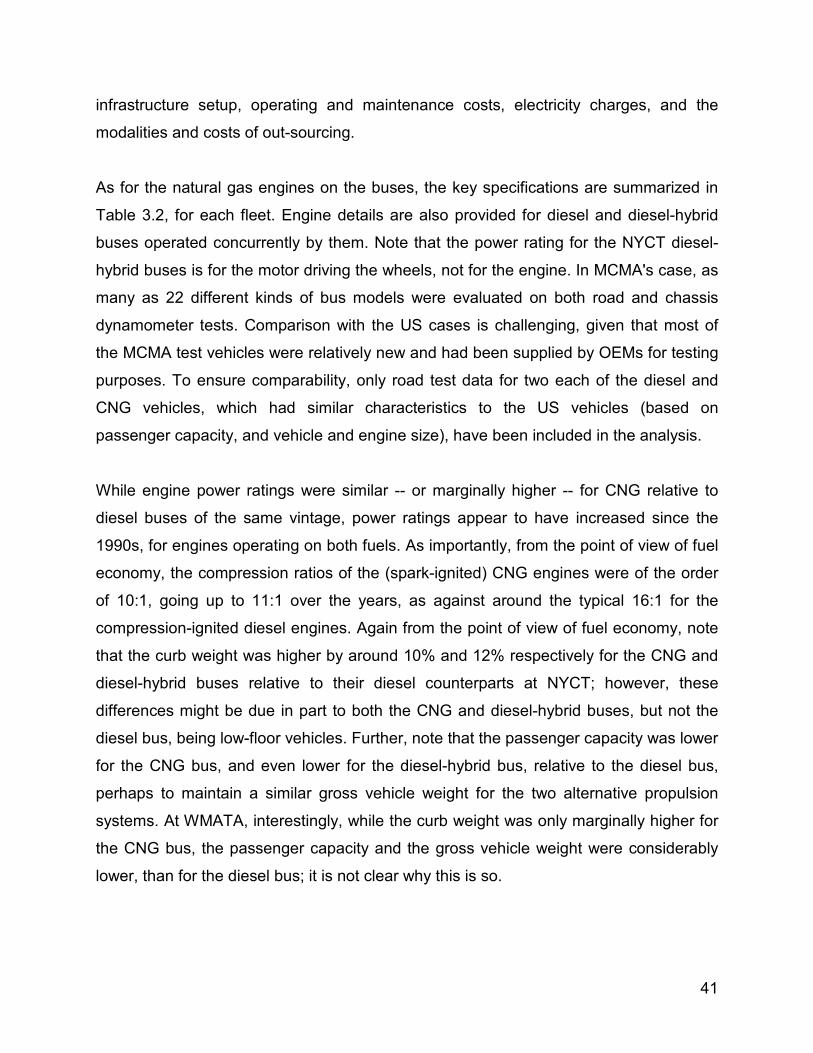
41
infrastructure setup, operating and maintenance costs, electricity charges, and the
modalities and costs of out-sourcing.
As for the natural gas engines on the buses, the key specifications are summarized in
Table 3.2, for each fleet. Engine details are also provided for diesel and diesel-hybrid
buses operated concurrently by them. Note that the power rating for the NYCT diesel-
hybrid buses is for the motor driving the wheels, not for the engine. In MCMA's case, as
many as 22 different kinds of bus models were evaluated on both road and chassis
dynamometer tests. Comparison with the US cases is challenging, given that most of
the MCMA test vehicles were relatively new and had been supplied by OEMs for testing
purposes. To ensure comparability, only road test data for two each of the diesel and
CNG vehicles, which had similar characteristics to the US vehicles (based on
passenger capacity, and vehicle and engine size), have been included in the analysis.
While engine power ratings were similar -- or marginally higher -- for CNG relative to
diesel buses of the same vintage, power ratings appear to have increased since the
1990s, for engines operating on both fuels. As importantly, from the point of view of fuel
economy, the compression ratios of the (spark-ignited) CNG engines were of the order
of 10:1, going up to 11:1 over the years, as against around the typical 16:1 for the
compression-ignited diesel engines. Again from the point of view of fuel economy, note
that the curb weight was higher by around 10% and 12% respectively for the CNG and
diesel-hybrid buses relative to their diesel counterparts at NYCT; however, these
differences might be due in part to both the CNG and diesel-hybrid buses, but not the
diesel bus, being low-floor vehicles. Further, note that the passenger capacity was lower
for the CNG bus, and even lower for the diesel-hybrid bus, relative to the diesel bus,
perhaps to maintain a similar gross vehicle weight for the two alternative propulsion
systems. At WMATA, interestingly, while the curb weight was only marginally higher for
the CNG bus, the passenger capacity and the gross vehicle weight were considerably
lower, than for the diesel bus; it is not clear why this is so.

42
Table 3.2: Summary of selected bus system specifications NYCT
WMATA
SunLine
MCMA(1)
Diesel CNG Hybrid Diesel CNG CNG CNG Diesel CNG
Model Year (MY) 1994 & 1999 2002 2002 2000 2001 2004 1994 2004 2004
Fuel Type D30 CNG D30 D15 CNG CNG CNG D15 CNG
Manufacturer / Model Orion V (high floor)
Orion VII
(low floor)
Orion VII (low floor)
Orion VI (low floor)
NewFlyer (LF) C40
NewFlyer (LF) C40
Orion V (high floor)
Mercedes & Volvo
Busscar + Ankai
Engine (model / max HP) DDC S50 DDC
S50G Cummins
ISB DDC S50 CWI C Gas Plus
Deere 6081HFN04
Cummins L10-240G
OM924-LA & D7C
Cummins B5.9-230G
275 275 270 275 280 280 240 280 & 300 230 Compression ratio 16.5:1 10:1 16.3:1 15:1 10.1:1 11:1 N/A 19.5:1(3) 10.5:1 No. of cylinders 4 4 6 4 6 6 6 6(3) 6 Engine displacement 8.5L 8.5L 5.9L 8.5L 8.3L 8.1L N/A 7.3L(3) 5.9L Air system Turbocharged Turbocharged N/A Turbocharged(3)
Emissions control / Standards Retrofit DPF
(Johnson Matthey)
None Engelhard DPX
Engelhard DPX
Oxidation catalyst
Oxidation catalyst N/A
EPA1998 & EUROIII
EPA'04 + 2WC
Fuel Capacity (litres) 473 473(2) 379 473 606(2) 606(2) 473(2) 300(3) 480 & 580(2)(4)
Curb Weight (metric tonnes) 12.9 14.2 14.4 13.3 13.6 13.6 13.4 10.2 10.5 Gross Vehicle Weight (GVW) 18.1 19.3 19.3 19.3 18.4 18.4 18.4 16.0 15.9 Payload 5.2 5.1 4.9 6.0 4.8 4.8 5.0 5.8 5.4 Length (metres) 12.2 12.2 12.2 12.2 12.2 12.2 12.2 12.0 11.2 Passenger capacity 75 73 70 88 60 60 67 90 91 Bus purchase cost ($ '000) 290 313 385 300 340 340 225 74(5) 134(5) Average operating speed (km/h) 10.2 10.2 9.9 18.7 18.7 18.7 23.5
Avg.(slow)=17 to Avg.(fast)=65(6)
(1) Various models were used in MCMA evaluations. CNG buses include Busscar & Ankai models. Diesel includes Volvo 12m D7C engine and Mercedes Benz 12.4m OM924-LA engine model. The two diesel buses were selected to match passenger capacity of two selected CNG buses. (2) CNG fuel capacity expressed as diesel energy equivalent litres. (3) For diesel buses, data refers only to Volvo 12m bus. (4) 480L for Busscar model; 580L for Ankai model. (5) Dollar amounts converted from Mexican pesos. (6) Average slow and fast speeds: route speeds varied from 17km/h near commercial/industrial areas to 65km/h (Weaver & Almanza, 2006). Sources (NYCT, WMATA & SunLine converted from imperial system): NYCT (Barnitt & Chandler, 2006); SunLine (Chandler, 2006); WMATA (Chandler et al., 2006); MCMA (SMA, 2006a).

43
Table 3.3: Summary of selected performance parameters of buses NYCT
WMATA
SunLine
MCMA(1)
Diesel Diesel CNG Hybrid Diesel CNG CNG CNG Diesel CNG
Number of buses evaluated 9 9 10 10 5 5 5 31 2 2 Model Year (MY) 1994 1999 2002 2002 2000 2001 2004 1994 2004 2004 Fuel economy (km/l)(2) 0.97 1.01 0.72 1.36
1.21 0.99 1.02
1.42
2.32 1.78
Fuel price ($/diesel litre equivalent)(2) 0.47 0.47 0.46 0.47
0.35 0.35 0.35
0.29
0.67 0.42 Total operating costs ($/km) N/A N/A 1.44 1.11
0.66 0.68 0.71
0.44
0.33 0.28
Fuel costs ($/km) 0.48 0.47 0.64 0.35
0.29 0.35 0.35
0.22
0.29 0.25 Maintenance costs ($/km) N/A N/A 0.80 0.76
0.37 0.32 0.36
0.22
0.04 0.03
Engine and Fuel system costs ($/km) N/A N/A 0.19 0.23
0.08 0.08 0.08
N/A
N/A N/A Reliability (kms between roadcalls) 4,275 9,213 9,235 8,323 5,223 7,709 8,449 21,185 N/A N/A
Engine and fuel system related roadcalls (kms between roadcalls)(3) 8,794 19,743 15,285 13,079 20,458 28,909 29,573 N/A N/A N/A
(1) Average performance of select models for three sets of field tests conducted at MCMA (Tables 7.2 & 7.3 from SMA, 2006a). All dollar figures were converted from Mexican pesos. Diesel buses were selected to match CNG passenger capacity: Two CNG buses (Busscar & Ankai); Two diesel buses (Volvo 12m with D7C engine; Mercedes Benz 12.4m with OM924-LA engine). (2) CNG calculated on an energy equivalent basis of diesel litres. (3) Engine and fuel system related breakdowns include engine, fuel system, exhaust, non-lighting electrical, air intake and cooling, but not transmission; for hybrid, electric propulsion is also included. Sources (NYCT, WMATA & SunLine converted from imperial system): NYCT (Barnitt & Chandler, 2006); SunLine (Chandler, 2006); WMATA (Chandler et al., 2006); MCMA (SMA, 2006a).
Table 3.4: WMATA chassis dynamometer-based emissions, 2000-2004 vintage buses, CBD drive cycle Vehicle No. of buses CO NOx NO CH4 NMHC** PM CO2 FE
Configuration tested (g/km) (g/km) (g/km) (g/km) (g/km) (g/km) (g/km) km/l*** MY 2000 / DDC S50 w/ DPF (DIESEL) 2 0.12 15.29 11.00 0.00 0.00 0.01 1,963 1.30 MY 2001 CNG–CWI w/ oxidation catalyst (CNG) 4 0.34 11.81 9.76 10.75 0.68 0.01 1,403 1.28 MY 2004 DDC S50 w/ EGR and DPF (DIESEL) 3 0.21 11.12 7.21 0.00 0.00 0.02 2,079 1.23 MY 2004 CNG–Deere w/ oxidation catalyst (CNG) 3 0.09 5.64 4.78 6.59 0.34 0.00 1,350 1.34 CBD = Central Business District Drive Cycle ** Non-methane hydrocarbons; THC for Diesel buses *** km per energy equivalent diesel litre. Fuel economy was computed using a carbon balance, fuel properties, and measured emissions data. The carbon compounds (CO2, CO and HC) emitted in the exhaust were measured, and the fuel consumption was calculated using a carbon balance equation. Source: Average testing results per vehicle model converted to metric, Table 7 in Melendez et al. (2005).

44
As for emissions ratings, presumably, the engines in the various cases shown in Table
3.2 for NYCT, WMATA and SunLine conformed to the EPA transit bus emissions
requirements that applied to the relevant model year, or even a later year. Note that the
EPA emission requirements for transit buses, which have been tightened since the early
1990s, became especially stringent for NOx and PM since around the mid-1990s
(Barnitt, 2008; Lowell & Kamakate, 2012). Further, the EURO requirements for these
two critical pollutants have generally lagged behind the EPA’s (on the other hand, the
EURO requirements have been considerably more stringent than EPA’s, for CO)
(Lowell & Kamakate, 2012; Posada, 2009). In any case, the increasingly stringent EPA
requirements for PM and NOx since 1996, and even more particularly, those for 2007-
2010, required DPFs, and ULSD (30 and 15 ppm sulphur since 1998 and 2006,
respectively), in addition to EGR, on diesel buses (Barnitt, 2008). Finally, it appears
(Table 3.2) that CNG requires simpler (and less expensive) emission control measures
to achieve these stringent requirements than diesel (or even diesel-hybrids).
The CNG buses in the US cases (Table 3.2) vary considerably in relation to their cost.
NYCT’s 73-passenger capacity CNG bus was approximately 8% more expensive than a
comparable baseline diesel bus, but 19% less so than a diesel-hybrid produced by the
same manufacturer in the same year. At WMATA, CNG buses cost 13% more than a
diesel bus of comparable dimensions and weight in its fleet, but also 8% more than
NYCT’s CNG models of equivalent age. The incremental cost for CNG buses relative to
their diesel counterparts at WMATA and NYCT was very close to the 9% average for
US bus transit operators (Lowell et al., 2007). Besides, note the lower passenger
capacity on the CNG buses.
3.2.4 Vehicle and fuel systems performance
i) Fuel economy
Natural gas characteristics have a significant impact on vehicle performance. CNG high-
pressure storage tanks incrementally increase a vehicle's curb weight by up to 1.4
metric tons, or by roughly 10% of a vehicles curb weight, depending on materials used,
and reduce its payload capacity (ARCADIS, 1998; Barnitt & Chandler, 2006; Chandler

45
et al., 2006). In turn, the increased vehicle weight negatively affects fuel economy and
driving range in comparison to diesel, while also requiring buses to have their
suspensions modified, with possibly increased road damage. While the Otto cycle, on
which the spark-ignited (SI) CNG engines operate, has a higher thermal efficiency than
the diesel cycle at the same compression ratio, diesel engines use much higher
compression ratios in practice (Table 3.2), because they compress only air, and are
thus not susceptible to auto-ignition (as in the case of SI engines), and are therefore
able to achieve higher thermal efficiencies than SI CNG engines. Further, SI CNG
engines have lower part-load efficiency relative to CI diesel engines, due to throttling
losses, also with negative implications for CNG fuel economy. All of these factors
combined, lower the potential fuel economy performance of CNG buses, on a per-unit
energy basis, relative to comparable diesel buses.
Under similar conditions of vehicle age, weight and speed, the CNG buses were 29%
and 18% less fuel economical, on an equivalent energy basis, than their diesel
counterparts at NYCT and WMATA respectively (Table 3.3). Note that the same EPA
emission standards applied in all these cases, since they did not change between 1998
and 2003; further, while the GVW was slightly higher for CNG relative to the diesel bus
at NYCT, the situation was reversed at WMATA; and finally, while the engine platforms
for the two fuels differed in the case of WMATA, they were the same in the case of
NYCT. At MCMA, the two CNG buses (Ankai and Busscar) on average had a 34%
lower fuel economy than their two diesel counterparts (Volvo 12 and Mercedes Benz
12) of the same 2004 vintage (Table 3.3).
The significantly better fuel economy for the diesel buses was despite a higher level of
exhaust control to achieve the same emission standard (even the 2004 vintage CNG
engines at WMATA required only an oxidation catalyst, whereas even the 1994 diesels
at NYCT called for particulate filters), and a higher GVW than for the CNG buses at
WMATA, and in the case of NYCT, despite being of much older vintage relative to CNG.
Even the more advanced 2004 vintage CNG buses had a fuel economy 16% lower than
the 2000 vintage diesel buses at WMATA. On average, the fuel economy of CNG buses

46
was reported to be 25% lower than for diesel buses in the US (Lowell et al., 2007). This
significant fuel economy gap may in part be due to the characteristics of the SI cycle on
which the CNG engines operate, as discussed earlier.
While engine type and vintage are undoubtedly important factors, operating conditions
make a significant difference to fuel economy for both diesel and CNG vehicles4. The
fuel economy figures were higher -- by 20% for the diesel buses of similar vintage, and
by as much as 38% for the CNG buses of similar vintage -- at WMATA relative to
NYCT, which had lower average speeds than WMATA. Note that the NYCT driving
cycle is characterized by significantly lower speeds, significantly more stops per
kilometre, and more acceleration and deceleration, relative to that at WMATA (Nylund et
al., 2007). At SunLine, the CNG buses, which operated at a much higher average speed
than those in the other two fleets, had a much higher fuel economy, despite their 1994
vintage, than the diesel buses operated by NYCT and WMATA, and even the hybrid bus
at NYCT.
So, it appears that higher average speeds significantly improve performance for both
diesel and CNG buses, but much more for CNG buses; this is likely because the SI
cycle on which the CNG engines operate performs poorly at low speeds and loads, as
in the case of the NYCT bus cycle, which is characterized by low average speeds
(below 10 km/h) and frequent stop-and go operation. As well, therefore, improved
operating conditions narrow the fuel economy gap between diesel and CNG. This effect
(and the importance of operating conditions, more generally) is further borne out by the
chassis dynamometer tests conducted on the WMATA buses by Melendez et al. (2005)
(results from this study is summarized in Table 3.4, above), which in several instances
were performed on the same buses as in the on-road tests (Chandler et al. 2006,
reported in Table 3.3). Considering only the buses common to these two tests, the fuel
economy performance on the dynamometer tests was consistently higher than on the
on-road tests, for both fuels. However, the fuel economy improvement on the 4 For example, see comparative fuel economy performance of buses under different city driving cycles in Nylund et al. (2007).

47
dynamometer tests was considerably higher (30%) for CNG than for diesel (only around
7%), suggesting that CNG-SI engines are far more sensitive to, and are more affected
by, changes in operating conditions than are diesel engines.
Similarly, the fuel economy for both diesel and CNG buses at MCMA was significantly
higher than for their counterparts at NYCT as well as WMATA, and even the hybrid at
NYCT, demonstrating the important role of higher operating speeds but also lower
vehicle weight. Further, the fuel economy gap for CNG relative to diesel buses at
MCMA was significantly lower on the dynamometer tests, as for WMATA. The MCMA
performance figures in Table 3.3 were obtained on the RAVEM cycle, reflecting actual
road performance along a BRT route (Weaver & Almanza, 2006); as noted, the two
CNG buses (Ankai and Busscar) on average had a 34% lower fuel economy than their
two diesel counterparts (Volvo 12 and Mercedes Benz 12) on this cycle. The diesel and
CNG buses were also tested on a chassis dynamometer (WVU, 2005), on the Mexico
City Schedule (MCS), representing "average" driving conditions there (WVU, 2004), and
the European Transient Cycle (ETC); overall, the ETC cycle has a much higher average
speed, with significantly lower stop and go, than MCS. For both diesel and CNG, fuel
economy was significantly higher (double) on ETC than on MCS; further, the fuel
economy penalty for CNG relative to diesel reduced to around 19% on both cycles, from
the 34% on-road. Barnitt (2008) also reported higher fuel economy on a chassis
dynamometer relative to road tests because of higher speeds, and the lack of air-
conditioning load, in the former case. All of the foregoing demonstrates the critical
importance of making comparative evaluations under operating conditions that are
similar and as close as possible to real-life conditions, in terms of vehicle vintage,
weight, speed, and engine power among other factors.
Also importantly, while the on-road fuel economy of buses with CNG engines operating
on the SI cycle can be inferior to diesel buses, on an energy basis, especially at low
operating speeds, Table 3.4 shows that buses with advanced CNG engines can be
better in this regard than diesel buses, especially at higher operating speeds and as
diesels increasingly require advanced exhaust control to meet stringent emission

48
standards, in particular relating to PM. On the dynamometer tests (Table 3.4), fuel
economy on the dynamometer was much higher than on-road for both fuels. Besides,
the 2001 CNG buses had only 1.5% worse fuel economy than their diesel counterparts,
and the 2004 CNG buses were actually 9% better than their diesel counterparts (Table
3.4). These results are partly due to the improvement in CNG engine technology, but
also the significantly tightened EPA emission standards for 2004 (especially in terms of
HC and NOx) having called for more advanced exhaust treatment (in terms of EGR and
DPF systems) on diesels, with significant negative implications for fuel economy. Similar
results were also observed in other chassis dynamometer tests for newer CNG and
diesel buses in Wayne et al. (2008). But it is important to keep in mind that,
notwithstanding these dynamometer test results, on-road fuel economy might still be
better for diesel than for CNG, given the significantly higher fuel economy gap between
dynamometer and road tests for CNG relative to diesel.
At the same time, as a comparison of the NYCT hybrid and the WMATA buses in Table
3.3 shows, buses with diesel hybrids have a significantly higher economy than
advanced CNG, and indeed, conventional diesels, despite similar exhaust control
requirements as the latter, and even at a lower operating speed, and higher vehicle
weight -- with this advantage being gained, of course, without any of the costs and other
implementation issues related to a change in fuel infrastructure.
ii) Vehicle emissions
Table 3.4 compares the emissions (and fuel economy) performance, based on chassis
dynamometer testing, of 12 40-foot, low-floor WMATA buses representing diesel and
lean-burn NG (natural gas) technologies, of 2000/01 and 2004 vintage, using West
Virginia University (WVU)’s Transportable Heavy-Duty Vehicle Emission Testing
Laboratory (Melendez et al., 2005); the project was led by USDoE’s National
Renewable Energy Laboratory (NREL).
The test bus configuration details are in Table 3.4. Both the 2000 diesel buses, and all
but one of the 2001 and 2004 CNG buses in Table 3.4 were the same as the on-road

49
WMATA test buses in Tables 3.2 and 3.3. New EPA emission standards came into
force for transit buses in 2004, for NOx and HC. Both the 2000 and 2004 diesel buses
used a DDC S50 platform, which was the mainstay of the transit bus industry, but was
discontinued in 2004, because it could not meet the prospective 2007 emission
standards (Barnitt, 2008). Whereas only a catalyzed particulate filter was required to
meet the applicable standard in 2000, the 2004 diesel required EGR additionally, to
meet the 2004 NOx + NMHC standard. Meanwhile, CNG engines needed an oxidation
catalyst to meet both the 2000 and 2004 standards; indeed, the CNG buses in 2001 met
the 2004 NOx + NMHC standard (Melendez et al., 2005). The buses were tested on the
WMATA cycle, which simulates the on-road operation of WMATA buses. The test buses
had GVWs ranging from 18.1 to 19.3 MT (metric tonnes), similar to the US buses in
Table 3.2; also, the test weights (curb weight plus half the maximum passenger load)
fell within a narrow range, but the NG buses were tested at a higher weight than diesel.
The diesel fuel used was ULSD (15 ppm sulphur).
NOx was lower for the 2004 relative to the 2000 diesel bus (because of EGR in
response to 2004 emission standard), but CO, PM and CO2 (and fuel economy)
deteriorated, reflecting emission and performance trade-offs due to control
technologies. The 2004 (John Deere) CNG was much better than the 2001 (DDC S50)
CNG bus on both emissions and fuel economy, with CO, HC, CH4, and NOx in
particular having improved significantly, without a change in emission controls.
Therefore, the overall performance gap between the two fuels widened in favour of NG
in 2004, relative to 2000/01. Overall, both PM and NOx, the principal focus of the US-
EPA standards, were lower for CNG; in the case of NOx, even more so in 2004 than in
2001, despite EGR on the diesel engine. Diesel fuel economy was slightly (1.5%) better
relative to NG in 2001, but considerably (9%) worse in 2004, perhaps because of the
additional EGR. CO2 was considerably lower for NG, by as much as 35% in 2004. On
the other hand, HC, particularly CH4 (important from a GHG perspective), was vastly
higher for CNG (both CH4 and NMHC were zero for diesel).

50
The dynamometer tests on the WMATA buses show the superiority of NG relative to
diesel, with regard to PM, NOx, fuel economy and CO2, but note that the 2004 John
Deere NG engine was more advanced than its DDC S50 counterpart, which was
phased out in that year; besides, the diesel EGR likely affected fuel economy. It is
possible that the superior fuel economy for NG might not have been observed on-road;
whereas the fuel economy of the 2000 diesel was only 1.5% better than for its NG
counterpart on the dynamometer, it was 18% better on the on-road test in Table 3.3,
demonstrating the importance of test conditions. Lastly, if NG engine technology has
been improving, so has diesel (and diesel hybrid) technology. It is therefore important to
compare advanced diesel versus NG technology, as done in Wayne et al. (2008), which
also involves dynamometer testing of (2005/06 vintage) WMATA buses.
Table 3.5 compares the emissions and fuel economy performance, based on chassis
dynamometer testing, of 12 40-foot WMATA buses representing diesel, CNG, and
hybrid-electric diesel technologies, of 2004-06 vintage, using West Virginia University
(WVU)’s Transportable Heavy-Duty Vehicle Emission Testing Laboratory (Translab); the
project was sponsored by USDoE and USDoT (US Department of Transportation), and
conducted in co-operation with WMATA (Wayne et al., 2008). The test buses, details of
which are in Table 3.5, comprised two with 2006-year Cummins diesels, six buses with
an equal number of Cummins and John Deere lean-burn NG engines of 2004/05
vintage, two buses with 2005/06-year Cummins hybrid-electric diesels, and one diesel
bus of 1992 vintage, retrofitted with a DDC S50 engine of 2003 vintage. None of the
above buses were common with the 2000-04 WMATA buses used in the dynamometer
tests in Melendez et al. (2005) (Table 3.4), or the on-road tests in Chandler et al. (2006)
(Tables 3.2 and 3.3). However, as in the case of the dynamometer tests on 2000-04
vintage WMATA buses reported by Melendez et al. (2005), the buses in these tests had
GVWs (17.9-19.3 MT) similar to the US buses in Table 3.2; also, the test weights (curb
weight plus half the maximum passenger load) fell within a narrow range, and the NG
and hybrid buses were tested at a higher weight than diesel.

51
One bus each from the diesel, (lean burn) CNG, hybrid-electric diesel, and retrofitted
diesel groups was tested on 17 different driving cycles, and the other buses in these
groups on six of these cycles. In Table 3.5, test results are excerpted from Wayne et al.
(2008) for the different technologies, on the NY Bus (the most severe in terms of
average speed and frequency of stops), the Manhattan Bus, WMATA, and the ETC-
Urban cycles; the average speeds and stops per kilometre, drawn from Nylund et al.
(2007), are indicated for each cycle. All the diesels were tested with ULSD (15 ppm
sulphur). The Cummins and John Deere lean-burn NG engines were catalytically
controlled; the hybrid-electric diesels used a particulate filter; and the DDC S50 on the
retrofitted bus for which results are reported in Table 3.5 used a catalyzed particulate
filter.
Table 3.5: WMATA chassis dynamometer-based emissions, 2003-2006 vintage buses, various test cycles.
Diesel Cummins
2006
CNG Cummins
2005 CNG
JD 2005
Diesel-Hybrid Cummins 2005/06
Diesel (retrofit) DDC S50
2003 No. of buses tested 2 3 3 3 2 CO Emissions (Avg., g/km)
NY Bus(1) 5.95 1.44 0.23 0.21 N/A
Man Bus(1) 2.74 1.03 0.21 0.03 0.07
WMATA Cycle(1) 2.84 0.35 0.11 0.30 0.04
ETC Urban Cycle(1) 1.58 0.07 0.02 0.01 N/A
NOx Emissions (Avg., g/km)
NY Bus 11.71 39.01 23.08 10.37 28.03
Man Bus 7.52 22.00 14.32 6.95 15.04
WMATA Cycle 5.65 13.80 8.54 6.12 13.05
ETC Urban Cycle 4.32 8.64 7.83 4.20 6.90
HC Emissions (Avg., g/km)
NY Bus 1.45 47.09 33.89 0.13 N/A
Man Bus 0.65 33.75 15.97 0.09 0.19
WMATA Cycle 0.61 18.44 11.18 0.02 0.14
ETC Urban Cycle 0.52 14.73 11.06 0.02 0.07
PM Emissions (Avg., g/km)
NY Bus 0.25 0.03 0.06 0.03 0.04
Man Bus 0.15 0.01 0.02 0.01 0.01
WMATA Cycle 0.10 0.01 0.01 0.00 0.01
ETC Urban Cycle 0.06 0.01 0.01 0.01 0.02
Fuel Economy (Avg., km/L equiv.)(2)
NY Bus 0.67 0.56 0.57 1.07 0.56
Man Bus 1.19 0.89 1.00 1.66 0.91
WMATA Cycle 1.39 1.14 1.28 1.85 1.09
ETC Urban Cycle 2.36 1.78 1.92 2.66 2.13 (1) Average speeds for the driving cycles are: NY Bus, 5.9 km/h; Man Bus, 10.9 km/h; WMATA Cycle, 13.4 km/h; ETC Urban, 22.7 km/h (2) Fuel economy Data for Diesel Cummins 2006 and Hybrid Cummins 2005/06 obtained through direct correspondence with authors (Wayne et al. 2008) Source: Wayne et al. (2008)

52
In comparing the NG with the diesel buses, the first point to note is the significant
differences in the emissions profile between the two NG engines; while the Cummins
engine had lower PM, it had considerably higher NOx, CO, CH4 and HC levels than the
John Deere NG engine, especially on the lower average speed cycles, demonstrating
the emissions trade-offs as a result of technological strategies to meet emission
standards, on engines of similar configuration, exhaust control, and vintage. The diesel
engine had very low HC levels, as expected, and NOx nearly as low as the hybrid, but
by far the highest PM and CO emissions of all the technologies. Even on the John
Deere engine, which was the better performing NG engine overall, HC (around 90% of
which was CH4), NOx and aldehydes were significantly higher relative to the diesel
engine (18-25 times in the case of HC, and 1.5-2 times for NOx). On the other hand, the
NG engines had very low PM and CO emissions -- 10-25% and 4-25% respectively of
the levels on the Cummins 2006 diesel, on the worse performing NG engine in each
case. While the emissions results on the NG engines were mixed relative to the diesel,
the emission levels on the Cummins hybrid engine were either competitive with or lower
-- particularly in terms of HC -- than on the best of the other technologies. Most
interestingly, the 2003-year DDC S50 diesel (discontinued in 2004) retrofitted on a 1992
chassis, had -- besides the lowest HC emissions apart from the hybrid -- similar PM and
lower CO emissions relative to NG, and indeed, significantly lower PM than the 2006
Cummins diesel -- thereby showing the benefit of DPFs -- and NOx emissions between
the levels for the NG buses.
The fuel economy figures in Table 3.5, excerpted from Wayne et al. (2008) for the NY
Bus, Manhattan, WMATA and the ETC-urban cycles, were inferred from a carbon
balance, and do not account for air-conditioning loads nor road grade in actual
operation. The Cummins NG buses had a 16-25% worse fuel economy relative to the
Cummins 2006 diesel across these cycles; the John Deere NG engine was also inferior
to diesel across these cycles, but about 8-12% better than the Cummins NG engine at
higher speeds. The hybrid-electric diesel was on average 25% and 45% better than the
diesel and NG engines on all the cycles tested by Wayne et al. (2008). Finally, the
retrofitted 2003 DDC S50 diesel was 16-24% worse on the slow speed cycles in Table

53
3.5, but only 4% worse on the ETC-Urban cycle, relative to diesel; and 2-15% worse at
slow speeds, but actually 11% better on the ETC-Urban cycle, relative to John Deere
NG engine, which was the better performing of the two NG engines.
Operating conditions, and therefore driving cycles, profoundly affect emissions and fuel
economy for all technologies. Emission levels were significantly higher (particularly for
CO), and fuel economy was significantly lower, on cycles with low average speeds, high
frequency of stops, and high percentage of idling. In the case of PM, however, while
emissions were the highest on the NY Bus cycle, the most severe cycle in terms of
these parameters, PM showed a mixed trend with respect to speed. In the case of fuel
economy, the effect of driving cycle average speed was the highest for the NG and
diesel engines; for these two technologies, the fuel economy on the ETC-Urban cycle
was over 200% higher than on the NY Bus cycle. This effect was the lowest for the
hybrid engine -- the corresponding improvement on the ETC-Urban cycle was 149%. At
the same time, even a small increase in average speed produced a considerable FE
improvement for all technologies -- fuel economy on the Manhattan cycle (with less than
twice the speed, and half the stops per kilometre relative to the NY Bus cycle) was
improved by 55% for the hybrid, and by 60-80% for the diesels and NG engines.
Operating conditions by way of test cycles also affect the relative emissions and fuel
economy performance of various technologies (Wayne et al., 2008). The performance
of the retrofitted DDC S50 diesel relative to the 2006 Cummins diesel and the NG
engines at slow versus high speeds, and the differential emissions performance of the
two NG engines at low speeds, has already been referred to. In the case of the hybrid,
its fuel economy advantage is higher on cycles with lower speeds with frequent stops
and a high percentage of idling, since regenerative braking and energy storage are
most beneficial under these conditions. Relative to the John Deere engine, the better
performing NG engine, the hybrid was 39 and 45% more fuel economical on the ETC-
urban and WMATA cycles, but 88% more so on the NY Bus cycle -- that the effect of
speed on fuel economy is lowest for the hybrid, as noted earlier, is also related to this
differential FE advantage relative to other technologies at various speeds.

54
Lastly, as noted, the Mexico City study sought to measure emissions from public transit
buses with current and advanced engine control, aftertreatment technologies, and low
emission fuels, for the purpose of introducing climate friendly and low emission
transport measures. The study involved the measurement of emissions in-use, as well
as on a chassis dynamometer.
The in-use RAVEM (Ride-along vehicle emission measurement) tests (Weaver &
Almanza, 2006) were conducted on 17 buses of 2002-04 vintage -- a sub-set of the 22
buses selected for evaluation in SMA (2006a), as described above -- and of varying
dimensions and GVWs, ranging from 14 to 29.5 MT. The buses comprised 10 diesels,
including the MB 12 and Volvo 12 in Table 3.2, conforming to EPA 1998 or EURO III
emission standards, except one, which conformed to EPA 2004; two diesels conforming
to EPA 1998 but with emission controls (catalytic DPFs); three lean burn CNG buses
conforming to EPA 2004, and with 2-way catalysts, including the Busscar and Ankai in
Table 3.2; and two diesel-hybrids, one equipped with a DPF. The tests were conducted
during 2004-05, in normal traffic, and on a traffic-free BRT corridor, at average speeds
of 17.1 and 21.4 km/h respectively.
Eight of the RAVEM vehicles were also tested on the West Virginia University (WVU)
chassis dynamometer system (WVU, 2005) -- six diesels (including the Volvo 12 in
Table 3.2, and another equipped with a DPF); two CNG buses with the same emission
controls as above (the Busscar in Table 3.2, and an FAW, of high GVW); and one DPF-
equipped hybrid. The diesels were tested with fuels of varying sulphur content (350, 50
and 15 ppm on RAVEM, and 350, 150, and 15 ppm on the dynamometer). The
dynamometer tests were conducted on the MCS driving cycle, as well as on its
constituent MX1 (low speed), MX2 (medium speed), and MX3 (high-speed, BRT bus
only corridor) cycles, and on the European Transient Cycle (ETC). Comparisons of
emissions (and fuel economy) across different buses were made on a distance, as well
as a passenger-mile and ton-mile basis.

55
On the RAVEM tests, PM levels were the lowest (0.01-0.04 g/km) for the CNG buses;
while they were 0.07-0.45 g/km for the diesels without DPFs, they were only 0.01-0.08,
not very different from NG, except for a higher maximum, for the two diesels with DPF,
and 0.03 g/km -- competitive with NG -- for the DPF-equipped diesel-hybrids. While
NOx levels were the lowest for the CNG buses, they varied widely, and were 30-80%
higher than the applicable EPA 1998/2004 standards for the diesels, which yet again
shows the importance of in-use testing under real life conditions. CO was very low (0-6
g/km) from the diesel and NG buses. Total VOCs were virtually zero from the diesels;
meanwhile, the three NG buses emitted 5-52 g/km CH4, but only 0.1-3 g/km ethane,
and much lower levels of higher carbon VOCs. Lastly, two 1991-vintage buses from
RTP's transit fleet were tested, one with original model engine and the other with a
repowered engine meeting the EPA 1998 standard; on the retrofitted bus, PM, CO, and
NOx were 88, 86, and 59% lower than for the non-modified 1991-vintage bus;
retrofitting old buses with engines with advanced emission controls can achieve
significant emission reductions cost-effectively.
On the WVU (2005) dynamometer tests, as in the case of RAVEM, PM on the MCS
cycle was by far the lowest (<0.013 g/km) for the CNG buses, followed by the DPF-
equipped hybrid (0.025 g/km). Among the diesels, the DPF-equipped bus had the
lowest PM level (0.09 g/km); meanwhile, the other diesels (without DPFs) had PM levels
ranging from around 0.3 to as high as 1.25 g/km (on the Volvo 12 bus). An interesting
point (WVU, 2005) is that sulphur content made little difference to PM. A small fraction
of sulphur is converted to sulphates and sulphuric acid, which accounts for a small
proportion of PM mass; thus, sulphates may be significant for high sulphur fuels, but not
at the levels tested5. While NOx levels were the lowest for the hybrid bus, they were the
highest for one of the CNG buses, contrary to the RAVEM case; as for the diesels, NOx
levels varied widely, as for RAVEM. CO levels were low for the CNG and the DPF
hybrid buses; for the diesels, CO levels ranged widely, from even lower than for the
5 WVU (2005), note in this respect that the benefit of low-sulphur diesel is to "allow the use of catalyzed PM filters on the exhaust. This is important, because these catalyzed filters will generally not function well without the low sulphur diesel" (p.33).

56
CNG buses on the DPF-equipped bus to as much as 20 times higher on the heavier
buses and the Volvo 12, showing yet again the importance of technology and
maintenance. While HC emissions were expectedly low even for the heaviest diesel
buses, they were close to zero for the DPF-equipped diesel and hybrid bus,
demonstrating the important role of DPFs in reducing not only diesel PM but also CO
and HC. As in the RAVEM case, HC, the bulk of which was CH4, was very high (6.3-9.4
g/km) for the CNG buses; but even their NMHC emissions, around 0.63 g/km, were
higher than for the diesels.
On the WVU (2005) dynamometer tests, the fuel economy of the diesels declined with
increasing weight. The Busscar NG, despite a similar GVW to Volvo 12, the worst
performing diesel in its weight class, had a 19% worse FE, and indeed, diesel buses
with significantly higher (by 50-70%) GVW had FE similar to the Busscar. Also, the FAW
CNG bus, with a much higher GVW, but lighter than the heaviest diesels tested, had a
FE 24% lower, and the lowest FE of all vehicles. Meanwhile, the hybrid bus, despite a
9% higher GVW than the Volvo 12, had a 19% better FE, and a 30% better FE than the
Busscar NG vehicle, of similar GVW. FE over the ETC was significantly higher than
over MCS, which involved the same average speed but 40% fewer stops than MCS; on
the ETC, the improvement over the MCS cycle was greatest for the Busscar NG bus, for
which FE doubled, lower for the heavy diesels and the hybrid (around 70%), and lowest
for the lightest (and most fuel economical) diesels (43%). On the low speed MX1, the
NG bus had the lowest FE, as low or lower than the heaviest diesels; on the higher
speed MX2, FE was generally higher than on MX1, but the FE advantage for the hybrid
was lost somewhat; and FE was the lowest overall on the MX3, the most severe cycle
with many stops, despite its high average speed.
All of this shows again the FE deficit for NG relative to diesel; the important role of
operating conditions, and that lean-burn NG performs particularly badly under low
speed, and transient conditions; and that the advantage for hybrids is the highest at low
speeds. Finally, on a passenger-kilometre and tonne-kilometre basis, there is far lower

57
FE difference between buses than when distance based measures are used; and the
hybrid and the heaviest diesel buses had the highest FE on a tonne-kilometre basis.
Importantly, there were large differences in emissions (besides fuel economy) between
individual diesel as well as CNG vehicles with similar engine and control technologies,
showing the importance of technology and maintenance. Secondly, just as for fuel
economy, operating conditions affect emissions significantly. For example, PM was
higher on the MX3 cycle relative to MCS; and the FAW CNG bus, which had the highest
NOx level on the MCS cycle, performed even worse in this regard on the slow speed
MX1, demonstrating the poor low speed NG performance, already noted. Further,
emissions on the MX3 cycle were generally 30% higher than on RAVEM; note that while
the average speeds are the same, the MX3 cycle involves 66% more stops, and is
therefore far more severe, than RAVEM. Lastly, emissions were significantly lower on
the ETC, which has much fewer transients, than on the MCS cycle; in the case of PM
for example, by as much as 80% for the diesels; and by 50% or more for NOx, for all
bus technologies. Similarly, the significant reduction in CO2 emissions (discussed
below) on the ETC was in the same proportion as the improvement in fuel economy.
CO2 emissions reflect fuel economy, as well as the carbon-hydrogen ratio of the fuel. At
the same time, because fuel economy is strongly determined by vehicle weight, which
varied widely, from 14 to 29.5 MT, as noted, it is desirable to compare CO2 emissions
(and fuel economy) on a passenger-kilometre, or even better, on a ton-kilometre basis.
On a per-kilometre basis, the three lightest vehicles, all diesels, including the one
equipped with the DPF, had the lowest CO2 levels, followed by the heavier Busscar
CNG and the hybrid buses; the three heaviest vehicles, including the FAW CNG
vehicle, had the highest CO2 emissions. On a tonne-kilometre basis, however, the
heaviest vehicle, a 29.5 MT diesel bus, had the lowest CO2, followed by the FAW CNG,
despite its fuel economy being the lowest on a per-kilometre basis. All other things
being equal, distance-based emission (and fuel economy) measures favour lighter
vehicles, while passenger-kilometre and tonne-kilometre measures favour larger and

58
heavier vehicles, since fuel consumption and emissions do not increase in the same
proportion as vehicle weight (WVU, 2005).
iii) Reliability and operating costs
This section discusses the reliability and maintenance costs, focusing particularly on
engine and fuel system (EFS) related maintenance costs, which are the most important
from the perspective of this chapter, for analysis of the chosen cases. At NYCT,
reliability in terms of MBRC (miles between roadcalls) -- for which Table 3.3 shows data
converted to kilometres between roadcalls -- was the same for the 2002 CNG and 1999
diesel fleets; however, EFS-related reliability was considerably lower for the CNG
vehicle, despite the diesel fleet being a few years older at the time of the evaluation.
Further, as many as 61% of all road calls were EFS-related for the 2002 CNG fleet, as
against 47% for the 1999 diesel fleet. In particular, the non-lighting electrical system
(spark plugs, battery, and alternator) was the most responsible for EFS road calls for
the CNG 2002 fleet (44%), followed by the engine (31%), and the fuel system (21%).
The corresponding shares were 28%, 19% and 19% for the 1999 diesel fleet. In the
case of the 2002 diesel-hybrid fleet, both vehicular and EFS reliability were poorer than
for the CNG and diesel fleets of similar vintage. The electric propulsion system was the
primary cause of failures, accounting for as many as 62% and 39% of EFS-related and
total vehicular road calls respectively. Overall, a higher proportion of vehicular road calls
were EFS-related, for the CNG and hybrid fleets, relative to the similar vintage 1999
diesel fleet. Incidentally, the 1994 diesel fleet had a significantly lower reliability relative
to the 1999 diesel fleet, which had the same engine platform, and was evaluated over
the same period, demonstrating the significant deterioration in this regard, for both the
vehicle and for EFS, with vehicle age.
At WMATA, both vehicle and EFS reliability was much better for the CNG fleet relative
to its slightly older diesel counterpart; the 2004 CNG fleet, powered by a John Deere
engine subject to a more stringent emission standard, had a slightly better vehicle as
well as EFS reliability than even the 2001 CNG (note however that the fleets had
different engine platforms; also, whereas the 2001 CNG fleet was evaluated June 2003-

59
May 2004, the 2004 CNG fleet was considerably younger when it was evaluated in
May-October 2004). The engine was a major cause of EFS roadcalls for both the 2001
and 2004 CNG fleets (50% and 75% respectively); for the latter fleet, the non-lighting
electrical system was also an important cause.
Comparing the performance of CNG and diesel fleets of similar vintage under different
operating conditions at different operators shows that, whereas vehicular reliability was
significantly worse for both fuel systems at WMATA relative to NYCT, EFS reliability
was significantly better for WMATA relative to NYCT, especially for CNG. This is also
reflected in the fact that EFS accounted for a significantly lower share of total road calls
(26-29%) for the diesel and CNG fleets at WMATA, as against 47% and 60% at NYCT.
This suggests that higher operating speeds perhaps help EFS, but not necessarily
vehicle reliability. However, note that the vehicular reliability of the SunLine CNG fleet
was more than double that for its considerably older NYCT and WMATA counterparts
(unfortunately, there is no information on the EFS reliability for the SunLine fleet).
Fuel costs (in $/km) are of course a function of fuel economy as well as fuel price (Table
3.3 shows fuel price in $/diesel litre equivalent for all fuel systems). In the case of both
NYCT and WMATA, the fuel cost for the CNG fleet is higher in the same proportion as
its fuel economy is lower, relative to its diesel counterpart, given very similar prices
during the relevant evaluation periods for each fuel for each operator. However, note
that the fuel cost is significantly lower for both fuel systems for WMATA relative to
NYCT, because of the much higher fuel economy (likely due to more favourable
operating conditions) plus the significantly lower fuel price at WMATA. In the case of
MCMA, the fuel cost in $/km is slightly lower for CNG, despite a significantly poorer fuel
economy relative to diesel, because of a much lower CNG price relative to diesel in
Mexico City.
Next, maintenance costs are presented, again focusing particularly on EFS-related
maintenance costs, in $/km, for the selected cases; note that a $50/hr labour rate was
assumed across the US studies, in order to enable comparison. The WMATA data in

60
Table 3.3 (Chandler, Eberts & Melendez, 2006) allows the comparison of the
maintenance cost performance of CNG and diesel fleets of similar vintage; this is not
possible for NYCT, for which maintenance costs are not available for the diesel fleet,
because of its age (Barnitt & Chandler, 2006; Barnitt, 2008).
Even though the EFS-related MBRC figures for the 2001 and 2004 CNG fleets at
WMATA were much higher than for their diesel counterpart, the EFS-related
maintenance cost in $/km was interestingly the same for all these cases, implying more
costly though less frequent repairs for the CNG fleets. The total maintenance cost in
$/km was slightly lower for CNG compared to diesel. The EFS share of total
maintenance cost was similar (22-25%) for the diesel and CNG fleets at WMATA;
interestingly, the EFS shares of total road calls and maintenance costs were also
similar. For NYCT’s 2002 CNG fleet, on the other hand, EFS cost was 24% of total
maintenance cost, even though EFS accounted for 60% of total road calls. Even so,
EFS, along with transmission, was the highest maintenance cost category, followed by
the cab, body and accessories. Importantly, preventive maintenance inspection (PMI)
accounted for a major share (23-29%) of total maintenance cost at WMATA.
At both NYCT and WMATA, the non-lighting electrical system and the engine were the
most important EFS-related maintenance cost categories for the CNG fleets. At NYCT,
the non-lighting electrical system accounted for 29% of EFS maintenance cost, followed
by the engine (18%), the fuel system (17%), and cooling (15%); these were also the
most important causes of EFS road calls, in the same order. At WMATA, the top two
categories accounted for 29% and 23% of the EFS maintenance cost for the 2001 CNG
fleet, whereas for the 2004 CNG fleet, the engine was the most important component,
accounting for 40%; in both cases, however, the engine was the most important cause
of road calls, as noted. For the 2000 diesel fleet, the predominant EFS cost category
was the cooling system, followed by the engine. Labour was the most important cause
of costs, and the above components were generally ranked similarly in labour hours as
for EFS cost, for each fleet.

61
Finally, for the NYCT hybrid fleet, EFS maintenance cost accounted for 29% of total
maintenance cost, even though 63% of total road calls. Within EFS, the electric
propulsion system was by far the most important cost category (49%), followed by
engine (17%), and the non-lighting electric system (12%). EFS maintenance cost was
higher for the hybrid than for the CNG fleet because, though the parts costs were
similar, labour costs were considerably higher for the hybrid fleet, mainly related to the
electric propulsion, followed by the engine. Overall, however, the total maintenance cost
for hybrid was lower than for CNG, despite the higher EFS cost, and the lower vehicular
MBRC, relative to CNG.
Some interesting trends emerge when comparing the reliability and operating cost
performance across the US operators. In the case of EFS maintenance cost, WMATA’s
reliability (in MBRC) was much better than NYCT’s, for both CNG and diesel, and
correspondingly, WMATA’s EFS costs in $/km were also much lower. However,
WMATA’s vehicular maintenance costs in $/km were also much lower than NYCT’s,
despite WMATA’s much more frequent road calls relative to NYCT’s. At the same time,
even though WMATA’s EFS and vehicle maintenance cost was much lower than
NYCT’s, WMATA’s EFS share of vehicle maintenance cost was the same as for NYCT
(22-25%).
In carefully examining the detailed cost breakdowns by vehicle systems for NYCT and
WMATA (Barnitt & Chandler, 2006; Chandler, Eberts & Melendez, 2006) it turns out that
the labour hours as well as parts expenditure per kilometre are significantly lower for the
latter, both for EFS as well as the vehicle as a whole. This factor, which implies effective
cost management, as well as the considerably larger role for preventive maintenance
inspection at WMATA, as already discussed, might explain the significantly lower
maintenance costs for WMATA, even for the vehicle as a whole, despite much more
frequent road calls, relative to NYCT. Finally, SunLine’s maintenance costs, which are
considerably lower than even WMATA’s, despite its being a much older CNG fleet,
demonstrate the considerable scope for cost control, through effective management,
preventive maintenance, and training.

62
At WMATA, CNG had a higher total operating cost in $/km, even though lower
maintenance cost, relative to diesel; this was due to the higher fuel cost, because of the
lower fuel economy, for CNG relative to diesel. At MCMA, on the other hand, while CNG
had a similar maintenance cost, the total operating cost per kilometre was significantly
lower, despite a 23% poorer fuel economy than diesel, mainly because of a significantly
lower unit price of CNG relative to diesel.
In the case of SunLine, CNG operating cost was much lower even than for WMATA, not
only because of low maintenance costs, as discussed, but also because of significantly
lower fuel cost, both due to a high fuel economy and a very low unit fuel price for CNG.
In the US, a survey of bus transit operators showed that fleet managers using CNG
considered having a reliable and in-house refuelling system one of the top reasons for a
successful CNG experience, along personnel training, commitment to the new fuel
system, and a deep understanding of the costs involved (Eudy, 2002). Finally, in the
case of the hybrid fleet at NYCT, the total operating cost was considerably (23%) lower
than for CNG, due to a lower maintenance cost (despite slightly higher EFS cost), but
mainly because of a considerably lower fuel cost, on account of a significantly higher
fuel economy for hybrid relative to CNG.
Overall, it appears that variation in the total operating cost across fuel systems for a
given operator is due primarily to variation in fuel cost, since maintenance cost varies
considerably less. The variation in operating cost across operators is due to variations
in fuel economy (due to operating conditions) and fuel unit price, and variations in
maintenance costs due to cost management, preventive maintenance, and training.
iv) Fuel cost sensitivity analysis at NYCT and WMATA
Since the variation in total operating costs across fuel systems is due primarily to
variation in fuel costs, this section simulated the impact of changes to CNG and diesel
prices (a primary determinant of fuel costs) on total operating costs at NYCT and
WMATA. For consistency in comparisons between operators, only the US context was

63
included in this analysis; NYCT was chosen since it allows for a comparison of costs
between CNG and diesel-hybrid buses; WMATA was chosen since it allows for a
comparison between CNG and diesel buses; finally, SunLine was not included since it
does not operate diesel buses. The sensitivity analysis was based on the original cost
estimates for the two selected operators, as provided in Table 3.3.
An overview of CNG and diesel prices in the US, calculated in inflation-adjusted US
dollars is presented in Figure 3.1. It can be seen that, the price of each fuel fluctuates
substantially, not only over time, but also relative to each other. The average retail fuel
price from 2010-2015 was $0.97-per-litre for diesel and $0.63-per-diesel-litre-equivalent
for CNG (EERE, 2016). If the prices of these two fuels are compared in terms of their
difference (ratio), diesel was sold at an average premium of 1.55 times the energy
equivalent unit price of CNG in the US over the past five years, from 2010-2015 (Figure
3.1).
* Price ratio = [diesel price ÷ CNG energy equivalent price] Source: Fuel Prices (EERE, 2016), Inflation-adjustment (BLS, 2016)
Figure 3.1: CNG versus diesel retail fuel prices in the US
0
0.4
0.8
1.2
1.6
2
Apr-0
0
Apr-0
1
Apr-0
2
Apr-0
3
Apr-0
4
Apr-0
5
Apr-0
6
Apr-0
7
Apr-0
8
Apr-0
9
Apr-1
0
Apr-1
1
Apr-1
2
Apr-1
3
Apr-1
4
Apr-1
5
Apr-1
6
Fuel
Pric
e ($
/L)
infla
tion-
adju
sted
dol
lars
(201
5 =
100)
Diesel ($/litre)
CNG ($/diesel equivalent litre)
Diesel-to-CNG price ratio*

64
To analyze the impact of CNG and diesel price changes on total operating costs at
NYCT and WMATA, bus fleet fuel and operating costs from Table 3.3 were updated
using various hypothetical changes to fuel prices. The results of this analysis are
presented in Table 3.6. Case 1 reproduces the original fuel and maintenance costs
reported for NYCT and WMATA in Table 3.3, but with inflation-adjusted 2015 values
using the Consumer Price Index (CPI) (BLS, 2016). Given the significant differences in
diesel and CNG prices in Case 1 (Table 3.6), in Case 2, I considered that both
operators paid the same fuel price. For Case 2, diesel and CNG fuel prices were taken
from the 2010-2015 five-year period (EERE, 2016), as shown in Figure 3.1, and used as
the basis of further comparisons6. For further comparisons, alternate scenarios were
created in Cases 3 and 4, which considered more extreme differences in the price ratio
of diesel-to-CNG, based on the historical variations in CNG and diesel prices.
Cases 3 and 4 in Table 3.6 were constructed on likely range of estimates of relative fuel
prices7, from lower to upper bound values for diesel and CNG prices, in turn, which
were based on observed variations in diesel and CNG prices in the US from 2000 to
2015 (Figure 3.1); this was measured by taking the diesel-to-CNG fuel price ratio.
Figure 3.1 shows that, over a 15-year time period, the price premium of diesel relative to
CNG fluctuates from a minimum of 0.8 to a maximum of 1.8, with an average of 1.4.
Based on these variations in the fuel price ratio over the 15-year period, a statistical
confidence interval was constructed, that took average diesel-to-CNG price ratio of 1.55
(given diesel at 0.975 $/litre; and CNG at 0.629 $/diesel equiv. litre) as the center-point
for the sensitivity analysis. The variance observed in the 15-year period (2000-2015) for
the diesel-to-CNG ratio was used in constructing confidence interval values, and
resulted in a 1.4x lower bound ratio and a 1.7x upper bound ratio8. The lower bound
6 This five-year period was chosen, given the substantial variations observed in the ratio of diesel-to-CNG over the years, as shown in Figure 3.1. Further, note that these updated prices are based on retail fuel pump prices, and it could be expected that fleet operators may pay a discounted price to this, given the long-term commitment and bulk quantities of fuel purchased on a regular basis. 7 For this analysis, relative fuel price (i.e., fuel price ratio) is defined as the ratio of the price of diesel ($/litre) to the price of CNG ($/diesel equiv. litre), on an energy equivalence basis; historical data for this ratio is available in Figure 3.1. 8 See Footnotes (4) to (6) of Table 3.6 on the methodological details on the construction of these confidence intervals.

65
(Case 4) represents a price scenario that is less advantageous for CNG (that is, when
the price difference of diesel relative to CNG smaller), whereas the upper bound (Case
3) represents the price scenario that is more advantageous to CNG operations (that is,
when diesel is relatively more expensive than CNG).
Table 3.6: Simulated fuel costs based on Table 3.3 parameters NYCT WMATA
Hybrid % Diff to Case 1(1) CNG % Diff to
Case 1(1) Diesel % Diff to Case 1(1) CNG % Diff to
Case 1(1) CNG % Diff to Case 1(1)
Model Year (MY) 2002 2002 2000 2001 2004 Fuel economy (km/L)(2) 1.36
0.72
1.21
0.99
1.02
CASE 1: Original data from Table 3.3, but inflation-adjusted to 2015 prices using average CPI for 2015 (BLS, 2016) Fuel price ($/diesel litre equivalent)(2) 0.58
0.56
0.47
0.45
0.44
Total operating costs ($/km) 1.36
1.77
0.87
0.87
0.88 Fuel costs ($/km) 0.42
0.78
0.39
0.45
0.44
Maintenance costs ($/km) 0.94
0.99
0.49
0.41
0.45
CASE 2: Fuel prices averaged over 2010-2015 period(3) [assumed same in NYCT and WMATA] Fuel price ($/diesel litre equivalent)(2) 0.97
0.63
0.97
0.63
0.63
Total operating costs ($/km) 1.66 22% 1.86 5%
1.29 48% 1.05 21% 1.07 21% Fuel costs ($/km) 0.72 69% 0.87 11%
0.81 109% 0.64 41% 0.62 42%
Maintenance costs ($/km) 0.94
0.99
0.49
0.41
0.45
CASE 3: 95% Confidence Interval(4) for diesel-to-CNG price ratio (Upper Bound)(5) Fuel price ($/diesel litre equivalent)(2) 1.04
0.60(5)
1.04
0.60(5)
0.60(5)
Total operating costs ($/km) 1.71 25% 1.82 3%
1.35 55% 1.03 19% 1.04 18% Fuel costs ($/km) 0.77 81% 0.84 7%
0.86 123% 0.61 35% 0.59 37%
Maintenance costs ($/km) 0.94
0.99
0.49
0.41
0.45
CASE 4: 95% Confidence Interval(4) for diesel-to-CNG price ratio (Lower Bound)(6) Fuel price ($/diesel litre equivalent)(2) 0.91
0.65(6)
0.91
0.65(6)
0.65(6)
Total operating costs ($/km) 1.60 18% 1.89 7%
1.24 42% 1.08 24% 1.09 23% Fuel costs ($/km) 0.67 57% 0.90 15%
0.75 94% 0.66 46% 0.64 47%
Maintenance costs ($/km) 0.94
0.99
0.49
0.41
0.45 (1) The percentage difference to Case 1 was calculated by dividing the value of each item in their respective case by the value of the same item
in the Case 1; e.g., for diesel-hybrids in Case 3, the 25% in Total operating costs was calculated by talking the percentage difference from 1.36 $/km (total operating costs in Case 1) to 1.71 $/km (total operating costs in Case 3). (2) CNG calculated on an energy equivalent basis of diesel litres: Diesel 128,700 BTU/GAL and CNG 960 BTU/cu.ft (EERE, 2016) (3) Average fuel from EERE (2016), from 2010 to 2015 (inclusive). (4) 95% Conf. Interval (C.I.) calculated from time series sample variance for each individual fuel (source: EERE, 2016; Reports from Apr/2000 to Apr/2016) and the center point of C.I. based on average prices from 2010-15 (Case 2); i.e., for diesel price, the center value was assumed to be 0.97 $/L (Case 2) for a range of [0.91,1.04] (based on diesel price sample variance from 2000 to 2015); for CNG price, the center was assumed to be 0.63 $/L (Case 2) for a range of [0.61,0.66]. (5) The Upper Bound scenario took the following values: Diesel (UB) = center value (0.97) + confidence interval (0.069); CNG = center value (0.63) – confidence interval (0.024); the subtraction from CNG's mean price is intentional, in order to convey an increase in relative fuel prices (i.e., increase in the diesel-to-CNG ratio); and not a decrease, if CNG center value + confidence interval had been used. (6) The Lower Bound scenario took the following values: Diesel (LB) = mean value (0.97) - confidence interval (0.069); whereas CNG = mean value (0.63) + confidence interval (0.024); the addition to CNG's center price was intentional, as per logic discussed in (5) above.

66
Analysis of Table 3.6 shows that, for WMATA, the total operating costs for diesel which
are approximately on par with the two CNG bus types in Case 1 (original inflation-
adjusted data), changes to a cost penalty of $0.31 to 0.32-per-km when using 2010-
2015 fuel prices, since diesel prices increased much more than CNG from Case 1 to
Case 2. Even when considering the upper and lower bound estimates, operating costs
for diesel buses at WMATA are more likely to be higher than CNG buses by $0.15 to
$0.16-per-km more expensive in the lower bound Case 4, and by $0.31 to $0.32-per-km
in the upper bound Case 3 (Table 3.6).
For NYCT, given 2010-2015 fuel prices, total operating costs increase by 5% for CNG
systems and 22% for diesel-hybrid systems comparing Case 2 to Case 1 (Table 3.6).
As a result, the reported cost advantage of the hybrid over CNG of $0.41-per-km in
Case 1, owing to better fuel economy and lower maintenance costs, decreases to a cost
advantage $0.20-per-km using 2010-2015 fuel prices. For both the lower and upper
bound range estimates, diesel-hybrid operating costs were still consistently lower than
CNG's. However, it should be noted that hybrid bus purchase costs were 23% higher
than CNG buses at NYCT (Table 3.2). Given this discrepancy of lower operating costs
but higher bus purchase costs of hybrids over CNG buses at NYCT, it would be
interesting to evaluate if diesel-hybrid operating costs are low enough to offset the
higher bus procurement costs over the service life of the bus. Considering that the
average annual mileage for NYCT buses is around 45,000 km per year (Barnitt &
Chandler, 2006), and the expected bus service life is 12 years (Lowell et al., 2007), the
hybrid purchase cost premium of $88,2009 can be divided into a $0.16-per-km cost over
its expected service life. For NYCT buses, when adding capital cost premium in the
various cases in Table 3.6, the lower operating costs hybrids diminish greatly, and are
actually less advantageous in Case 3. It should be noted, however, that the preceding
analysis of including purchase cost does not account for opportunity cost of capital,
which is a substantial aspect to consider, since, on a dollar-for-dollar basis, bus capital
costs are up-front costs (or must be financed, which involves added interest costs) and
9 Table 3.2 cost differential (hybrid diesel-to-CNG) inflation-adjusted to 2015 using CPI from BLS (2016).

67
thus more onerous to the operator relative to operating costs that are recurrent costs
and paid throughout the vehicle's service life. Furthermore, refuelling infrastructure
costs are significantly greater for CNG technology than for diesel-hybrids, which
essentially uses the existing diesel infrastructure. The challenge in accounting for
infrastructure costs for CNG is that, apart from timing of disbursements and longer
service life of infrastructure than buses, costs also have to be allocated between all
those buses that will use the infrastructure. Finally, from Figure 3.1 it can be seen that
diesel-to-CNG ratio fell substantially from 2014 onwards, to less than 1 (that is, diesel is
less expensive than CNG on an energy equivalent basis), which will tend to magnify the
advantage of diesel-hybrid over CNG. Given the complexity of opposing forces from
different cost parameters, and to properly address all these issues, a more
sophisticated analytic framework would be required, such as in Lowell et al. (2007) that
uses life-cycle cost modeling approach to compare various fuel and propulsion
technologies for buses. For example, Lowell et al. (2007) accounts for inter-temporal
cost schedule variations for different types of technologies, with different capital
expenditures for bus and infrastructure investments, different re-build needs throughout
the service life of vehicles, and different operating and maintenance expenses for a total
value stream of future costs, all of which are then discounted to present values.
3.3 Discussion and policy implications
3.3.1 Summary of key findings
As discussed, CNG has been used worldwide in road transport, and particularly in
urban bus transit, in an attempt to mitigate urban air pollution problems. Despite interest
in CNG in terms of mitigating air pollution, adoption has been very limited, which raises
important questions regarding the challenges and suitability of using CNG, especially
from the perspective of bus fleet operators. Since investigating and understanding the
challenges is an important research need, this chapter critically discussed the
experience of five fleet operators in the US, Mexico and Chile. Taken together, the
cases allowed a comparison of transit bus performance with CNG relative to diesel (and
diesel-hybrid), in terms of key parameters including fuel economy and emissions, capital

68
and operating costs, and reliability; the effect of operating and test conditions on these
performance parameters; and the evolution in performance over time, in response to
factors such as more stringent emission standards and technological development. With
respect to these issues, and based on the five cases, what key conclusions and policy
implications can be derived?
Overall, the cases confirm that despite other potential benefits for CNG -- namely
energy security and lower greenhouse gas emissions -- urban air quality was the
primary rationale for adopting or considering CNG, especially since bus fleet operators
have had to increasingly meet more stringent vehicle emissions standards; particularly
for NOx and PM as was the case in US.
With respect to bus and fuelling infrastructure choice, the experience of NYCT and
WMATA showed a diversified approach was used, with the bulk of these fleets
continuing to rely on the conventional diesel fuel systems, with exhaust control and
cleaner (low sulphur) diesel; this was due to space constraints in dense urban settings
that led to high costs of CNG infrastructure and the challenges associated with adhering
to safety regulations. At SunLine no modifications were necessary in their outdoor bus
storage facility, showing that CNG refuelling infrastructure investments are climate and
space dependent. Also, the cases showed that CNG buses required simpler and less
expensive control measures to achieve more stringent emission standards than diesel.
Yet, despite less expensive emissions control, CNG bus purchase costs were higher
relative to comparable diesel buses, but much lower than diesel-hybrids.
In terms of fuel economy, despite other important technical factors, in practice
operating conditions made a significant difference to relative performance between
diesel and CNG buses. The CNG buses in the cases reviewed had a significantly (25%)
lower fuel economy on an energy basis relative to their diesel counterparts in city
operation. More importantly, both the US cases and MCMA showed that higher average
speeds significantly improved performance for both diesel and CNG buses, but much
more for CNG buses. In the case of the diesel-hybrid, its fuel economy advantage was

69
higher on more severe operating cycles, since regenerative braking and energy storage
are most beneficial under these conditions. In WMATA's case, the CNG penalty relative
to diesel disappeared when exhaust control measures like DPF and EGR were used to
reduce PM and NOx emissions on diesel buses. From an analytic standpoint, the cases
demonstrate the critical importance of making comparative evaluations under operating
conditions that are similar and as close as possible to real-life conditions, in terms of
vehicle vintage, weight, speed, engine power, and emissions control, among other
factors.
As for emissions performance, CNG buses confirmed their significant potential for
reducing PM and NOx relative to comparable diesel buses. The cases showed that
technology and maintenance were key to emissions performance, and that operating
conditions also profoundly affected emissions for all bus technologies, with emissions of
critical pollutants such as CO, CO2 and NOx being significantly higher on cycles with
low average speeds, high frequency of stops, and high percentage of idling. In the case
of PM, however, while emissions were the highest on the most severe cycle in terms of
these parameters, PM showed a mixed trend with respect to speed. Further, the MCMA
case showed that sulphur content made little difference to PM emissions in diesel
buses, at the tested levels. Also, the US and Mexican cases showed that retrofitting
older diesel buses with engines with advanced emission controls can cost-effectively
achieve significant emission reductions of key pollutants, such as PM, with a
performance that is comparable to CNG and newer diesel buses.
In terms of reliability, at NYCT EFS-related reliability was considerably lower for the
CNG vehicle, despite the diesel fleet being a few years older at the time of the
evaluation. Relative to NYCT, vehicular reliability at WMATA was significantly worse for
both fuel systems, but EFS-related reliability was significantly better for WMATA relative
to NYCT, especially for CNG. Given differences in operating conditions between the two
cities, this suggests that higher operating speeds perhaps help EFS, but not necessarily
total vehicle reliability. However, note that the vehicular reliability of the SunLine CNG
fleet was more than double that for its NYCT and WMATA counterparts. Even though

70
the EFS-related MBRC figures for all CNG buses at WMATA were much higher than for
their diesel counterpart, the EFS-related maintenance cost in $/km was interestingly the
same for all these cases, implying more costly though less frequent repairs for the CNG
fleets. A comparison of reliability and operating cost performance across the US
operators showed that, in the case of EFS maintenance cost, WMATA’s reliability was
much better than NYCT’s, as mentioned, for both CNG and diesel, and correspondingly,
WMATA’s EFS costs in $/km were also much lower. However, WMATA’s total vehicular
maintenance costs in $/km were also much lower than NYCT’s, despite WMATA’s
overall MBRCs performance being worse than NYCT’s. At the same time, even though
WMATA’s EFS and vehicle maintenance cost was much lower than NYCT’s, WMATA’s
EFS share of vehicle maintenance cost was the same as for NYCT. The examination of
the cost breakdowns showed that effective cost management, as well as the
considerably larger role for preventive maintenance inspection might explain the
significantly lower maintenance costs, even for the vehicle as a whole, despite much
more frequent road calls at WMATA relative to NYCT. At SunLine, maintenance costs,
which were considerably lower than even WMATA’s, despite its being a much older
CNG fleet, reinforce the argument for cost control through effective management,
preventive maintenance, and training.
Total operating costs at WMATA, in $/km, were higher for CNG despite lower
maintenance costs since fuel costs were higher, on account of the lower fuel economy
for CNG relative to diesel. In the case of SunLine, CNG total operating cost was also
much lower even than for WMATA and NYCT, not only because of low maintenance
costs, but also because of significantly lower fuel cost, both due to a high fuel economy
and a very low unit fuel price for CNG. In the case of the diesel-hybrid buses at NYCT,
the total operating cost was considerably (23%) lower than for CNG, due to a lower
maintenance cost, but mainly because of a considerably lower fuel cost, on account of a
significantly higher fuel economy relative to CNG. Meanwhile, fuel costs were
significantly lower for both fuel systems at WMATA relative to NYCT, because of the
much higher fuel economy plus the significantly lower fuel price at WMATA. In the case
of MCMA, the fuel cost in $/km is slightly lower for CNG, despite a significantly poorer

71
fuel economy relative to diesel, because of a much lower CNG price relative to diesel in
Mexico City. Overall, it appears that in the cases analyzed variation in the total
operating cost across fuel systems is due primarily to variation in fuel cost, since
maintenance cost varies considerably less; in turn, the variation in fuel costs is due to
variations in fuel economy (due to operating conditions) and fuel unit price.
The key lesson from the sensitivity analysis is that while CNG fuel economy was
generally lower than diesel, CNG fuel prices were low enough, relative to diesel, to
make CNG financially viable relative to traditional diesel buses (i.e., operating costs of
diesel buses were higher than CNG's, even considering a statistically relevant range of
fuel price estimates). Meanwhile, even with updated fuel prices, and the cost
advantages of diesel-hybrids over CNG diminishing, operating costs for diesel-hybrids
were still consistently lower than CNG's, regardless of the fuel price scenario
considered; this suggests that low maintenance costs for diesel-hybrids and the severe
operating conditions of New City favor this type of bus fuel system over CNG. From an
operational and operating cost perspective, this shows that diesel-hybrids can be
superior options to CNG, especially considering that depot modifications and refuelling
infrastructure investments are minimal for diesel-hybrids. To make matters worse for
CNG's relative advantage, note that since 2015, diesel prices have reduced quite
substantially, whereas CNG prices have not, and as a result diesel and CNG fuels are
now being sold at near parity, on an energy equivalent basis. Thus, this suggests that
the advantages of CNG bus fleets in this analysis will diminish if these fuel price
differences persist into the future; whereas the advantages of diesel-hybrids will be
enhanced. A caveat regarding diesel-hybrids is the higher bus purchase cost relative to
CNG buses, which in turn, are also more expensive than traditional diesel buses.
3.3.2 Conclusion and policy implications
From a financial perspective, the complexity of evaluating various alternative fuel
systems for buses, considering the above issues, is that these fuel and bus systems
have different cost composition (capital and operating costs). A life-cycle cost modeling
approach would be more appropriate to compare various fuel and bus systems, since it

72
integrates for each fuel and bus type, the different capital costs for bus and
infrastructure investments, different re-build needs throughout the service life of
vehicles, and different operating and maintenance expenses over the entire service life
of buses and their supporting infrastructures. By using this framework, it would be
possible to better address the question of an optimal diesel-to-CNG price ratio that
would justify investment in CNG over diesel (or diesel-hybrid) systems.
The broader question is to incorporate a social perspective into these sets of issues, so
that decision-makers are aware of the overall incremental costs associated with the
particular fuel choice, and can weigh them against the environmental benefits of each
fuel and bus option. Consider that, given the results discussed here, CNG’s
environmental outcomes can be attained at competitive incremental costs in
comparison to diesel and diesel-hybrids, making this fuel an important option in
controlling emissions in bus fleets without need for additional exhaust control measures
or improved fuel quality. At the same time, the challenge for CNG is that “cleaner” diesel
and more advanced diesel engine technologies are making headway in order to comply
with stricter emission standards set by environmental authorities, particularly by using
low sulphur diesel in combination with exhaust emissions control measures. Further,
since diesel technologies have lower vehicle purchase and infrastructure costs, the
cost-effectiveness advantages of CNG may diminish into the future. In this regard,
consider the renewal of Delhi’s public bus transit fleet that started in 2006-2007, with the
purchase of 3200 low-floor CNG buses, at a total cost of 16.3 billion Indian Rupees
(DTC, 2015), or approximately $357 million US dollars using the average exchange rate
over the period (Reserve Bank of India, 2016). Given the incremental price of a CNG
bus over diesel-equivalents, which can be safely estimated at around 20%, this
represents a non-trivial added cost of fleet renewal of approximately $71 million. This
raises the questions of how cost-effective air quality measures in Delhi have been: do
the PM and NOX emissions reduction outcomes justify the incremental price tag? Are
there more effective ways of achieving the same emissions outcomes, such as by using
ULSD? How many fewer buses are being put into service, and with what effects, given

73
these incremental costs? These questions will be addressed in Chapter 6 when
evaluating the cost-effectiveness of CNG in Delhi.
Considering the above, a critical lesson for policymaking is the need to understand the
linkages between various policy goals, such as improving air quality, and the financial
and operational challenges related to setting up each fuel option, how different
operational and contextual parameters will affect stakeholder behavior, and so forth. For
example, if the policy goal is to eliminate market distortions by incorporating key
environmental effects of each technological option, policy-making must be based on
understanding of the critical incentives that will motivate stakeholder choices.
Particularly from the fleet operator’s perspective, this means balancing broader public
concerns, such as emissions, with operator considerations of financial feasibility and
operational performance. This is especially important where, there are fleet operators
that are private companies, for whom cost minimization is a top motivating factor in
deciding technological options.

74
Chapter 4: Operational and financial performance of Delhi's CNG-fueled public bus transit fleet: A critical evaluation
Chapter overview
As shown in Chapter 1, Indian cities, and particularly Delhi, have been characterized by
poor air quality since the 1990s, which has led to a wide range of policies implemented
nationally in India and in Delhi. Among these policies in Delhi was the Supreme Court of
India ruling in 1998 that mandated that all public and for-hire motor vehicles (buses,
taxis and auto rickshaws) in the city to be powered by CNG. Because of this ruling, all of
the city’s buses, both publicly owned and operated by the Delhi Transport Corporation
(DTC), had to be converted to run on CNG by 2001, and, as briefly shown in Chapter 1,
there were various resource, logistical, and institutional challenges to accomplish this
CNG implementation. However, in light of this mandate, and as was discussed in
Chapter 2, the literature on the implementation of CNG in Delhi’s public vehicles has
focused almost exclusively on its emissions outcomes, with little if any attention devoted
to its operational or financial aspects. In the case of DTC, analyzing the operational and
financial performance of its bus fleets on CNG is important because it is this
performance that critically determines the bus operator’s policy responses. Building on
this important research need and the many important issues raised in Chapter 3 related
to CNG implementation and evaluation, I conduct a critical evaluation the operational
and financial performance of DTC's CNG-fueled bus fleet in this chapter, in order to
assess how the conversion from diesel to CNG has affected fleet operations and
finances. This chapter, together with the life-cycle cost assessment of CNG buses in
Chapter 5, will help assess the cost-effectiveness of Delhi’s CNG policy in Chapter 6.
4.1 Introduction Indian cities have been characterized by poor air quality since the 1990s. In Delhi, for
example, suspended particulate matter levels have exceeded World Health
Organization (WHO) guideline limits almost daily since the 1990s. Levels of PM10

75
(particulates below 10 microns diameter), which are strongly linked with respiratory and
cardio-vascular illnesses and deaths, also exceed the WHO limits (CPCB, 2015). A
global survey of urban air pollution (WHO, 2014a) showed that Delhi had the highest
annual average levels of fine particulates (PM2.5), which pose the most serious health
risk. In response to this problem, a wide range of policies has been implemented since
the early 1990s to address air emissions from urban transport. Delhi being the national
capital, and given its serious air quality problems, many of these policies were first
implemented there and in the other major metropolitan centres, and then in the rest of
the country in a phased manner. These policies have included increasingly stringent
vehicle emission and fuel quality standards, vehicle inspection and maintenance (I&M)
to control in-use emissions, and the phasing out of old commercial vehicles (CSE,
2002b; BIS, 2002; TERI, 2002; Kojima, Brandon and Shah, 2000). A Supreme Court of
India ruling in 1998 mandated that all public and for-hire motor vehicles (buses, taxis
and auto rickshaws) in Delhi be powered by compressed natural gas (CNG) (Supreme
Court of India, 1998).
As a consequence of this ruling10, all of the city’s buses, including those that were
publicly owned and operated by the Delhi Transport Corporation (DTC), had to be
converted to run on CNG over a highly compressed time frame, by March 31, 2001.
Due to resource, logistical, and institutional challenges, discussed later, CNG
implementation on Delhi’s buses began only in 1999-2000. In any event, Delhi today
has the largest bus fleet in India, currently numbering, according to official statistics,
around 60,000 buses (GNCTD, 2012) -- and given that all of the city’s buses run on
CNG -- one of the largest bus fleets running on this, or indeed any alternative fuel,
globally. Further, DTC, the focus of our study, has the second largest publicly owned
and operated urban bus fleet in India, with around 5800 CNG buses currently in
operation (GNCTD, 2012). It serves the National Capital Territory of Delhi, as well as
10 According to the ruling (Supreme Court of India, 1998), no 8-year old buses could ply in Delhi except on CNG (or “other clean fuels”) beyond April 1, 2000, and further, the entire bus fleet in Delhi was required to be “steadily converted” to run on CNG by March 31, 2001.

76
neighbouring cities in surrounding states, and carried 4.5 million passengers daily in
2010-11 (CIRT, 2012).
The literature on the implementation of CNG in Delhi’s public vehicles has focused
almost exclusively on its emissions outcomes (for example, Kathuria, 2005; Jalihal and
Reddy 2006; Chelani and Devotta, 2007; Reynolds and Kandlikar, 2008; Reynolds et
al., 2011; Narain and Krupnick, 2007; Kumar and Foster, 2009), with little if any
attention devoted to its operational or financial aspects. Sen et al. (2007) discuss this
gap in research, pointing to the lack of sufficient focus on the part of decision-makers on
the creation of financially viable and self-supporting urban transport systems. Further,
we argue, while the emissions outcomes of CNG implementation are important from a
societal perspective, and are an important focus for policy evaluation, it is also important
and useful to critically evaluate this, and indeed, any such policy from the perspective of
vehicle users and operators, because it is the policy responses of these actors that
crucially determine the extent to which implementation, and the associated emissions
reductions, actually occur and are successful.
More particularly, analyzing the operational and financial performance of bus fleets on
CNG or any other alternative fuel is important because it is this performance that
critically determines the bus operator’s policy responses. Such an analysis is also useful
from a policy perspective, given the need to provide quality, convenient and affordable
bus services within the constraints of limited budgets on which public transit operators
typically rely, to prevent the migration of ridership to private motor vehicles, with all of
their negative impacts. In this regard, note that, while buses and other public transit
modes still account for a significant share of passenger trips (43% in Delhi), their mode
share has been declining significantly, due to the growing role of personal motor
vehicles (WSA, 2008a).
In view of the foregoing, we critically evaluate the operational and financial performance
of DTC's CNG-fueled bus fleet, in order to assess how the conversion from diesel to
CNG has affected fleet operations and finances. We also critically discuss the

77
implementation experience in terms of the associated infrastructure, logistical and
institutional challenges. The 10-plus years of experience accumulated by DTC, a major
public transit operator, of such a large-scale conversion of its bus fleet to CNG, provides
a valuable opportunity for this retrospective analysis. Apart from addressing an
important research need (such a post-implementation assessment has not been
reported on so far), our analysis will hopefully be useful to decision makers and urban
bus transit operators in contexts similar to India’s, by drawing lessons for the long-term
viability of large-scale conversions of bus fleets to CNG, for comparison with other CNG
bus transit fleets, and for informing techno-economic and environmental analyses of
CNG bus transit operations. In particular, our study, coupled with others that have
focused on its emissions outcomes, should help assess the cost-effectiveness of Delhi’s
CNG policy.
4.1.1 CNG implementation on DTC’s bus fleet
Despite the 1998 Supreme Court mandate to convert the entire bus fleet in Delhi to run
on CNG by March 31, 2001, only around 150 CNG buses had been put into service at
DTC by then. Implementation gained momentum only in 2001-02, and was completed
only by 2003-04 (Figure 4.1a). There were serious logistical and technological
challenges related to the large-scale fuel-system conversion that DTC (and even more
so, Delhi’s private bus operators) faced, particularly with retrofitting diesel engines to
run on CNG. Therefore, they mostly opted for factory-built CNG buses, which were
supplied by two of the largest Indian bus manufacturers, Tata Motors and Ashok
Leyland. More generally, there was a "sequencing problem", namely that of
implementation depending on the availability of financial resources for conversion as
well as reliable refueling infrastructure and vehicle technology (Bell et al., 2004). The
bus manufacturers and infrastructure providers wanted assurances of demand for the
technology, without which they were reluctant to invest in production. In order to break
this supply-demand vicious-cycle, DTC, the bus manufacturers and Indraprastha Gas
Limited (IGL), who provided the dedicated refueling infrastructure in DTC’s depots,
created a task force to coordinate their respective roles. Despite the challenges, CNG

78
implementation was accomplished on Delhi’s bus fleet over a short period, from 2001 to
2004 (Bell et al., 2004; Patankar & Patwardhan, 2006).
Table 4.1 highlights the key vehicle and engine attributes of the diesel and CNG bus
technologies used at DTC during our analysis period. The first generation of CNG
buses, which we refer to as the Standard CNG model, were introduced from 2000 to
2004, when they replaced a fleet of similar configuration diesel buses (Table 4.1), with
most of these CNG buses being inducted in the 24-month period from 2001-02 to 2002-
03. From the transit user's perspective, the quality of the buses changed little due to this
introduction, apart from tailpipe emissions due to the substitution of diesel fuel with
natural gas. From 2007-08, DTC began a fleet modernization process by launching two
procurement cycles for Low Floor (LF) CNG buses. The introduction of LF CNG buses,
which commenced towards the end of 2007, was part of a process that sought to
replace the fleet of ageing standard CNG buses, 10% of which were over DTC’s target
service age11 in 2006-07 (CIRT, 2007), while also offering higher quality bus service
generally, and in particular, improved and more convenient accessibility for the aged
and infirm, as well as young children. Key bus attribute changes included a 400mm floor
height for LF versus 800mm for standard buses, automatic transmission, full air
suspension, air conditioning (AC) option for higher fares, and a target service life of 12
years (or 750,000 kilometers). From 2007 to 2011, 3,700 new LF buses were put into
operation at DTC, of which 67% were non-air conditioned buses (CNG LF) and 33%
were air-conditioned (CNG LF/AC) (Table 4.1). In 2010-11, of the 4,300 operational
buses, nearly 46% were standard CNG buses, 53% were LF buses, and less than 1%
of the buses were diesel powered, which were in the process of being decommissioned.
11 The target service life of standard CNG bus set by DTC was 8 years or 500,000 kilometres (CIRT, 2012).

79
Table 4.1: CNG bus technologies at DTC
Diesel
Standard CNG
Standard CNG LF
CNG LF/AC
Model Year 1997/98 2001/02 2007/08 2007/08 Fuel Type Diesel CNG CNG CNG
Engine model max HP
Hino, Leyland 370, Tata 692 95-110
IVECO 8060.05; TATA LPO 1510
CGS/55 120-150
Cummins LB BGe230/30
230
Cummins LB 250
Compression ratio 17:1 - 17.9:1 10.5:1 (Est.) 10.5:1 10.5:1 No. of cylinders 6 6 6 6 Engine displacement 5.9L 5.9L 5.9L 5.9L
Emissions control / Standards 1996 norms (pre BS-I)
BS-I / BS-II catalytic converter
BSIII Compliant; Engelhard Oxidation Catalyst
Fuel Capacity 160-165 L 90-96 kg 108 kg 108 kg Gross Vehicle Weight (tonnes) 15.2 15.3 16.2 16.2 Length (metres) ~10.1 ~10.7 12 12 Width (metres) 2.4 2.4 2.6 2.6 Passenger capacity ~65 68 70 70 Inflation adjusted bus cost (USDx103) 47.4 59.6 126 149
Percentage of fleet on road (2010-11) 1% 46% 43% 10%
Source: Delhi Transport Corporation
The standard CNG buses, introduced in 2000, had a spark-ignited engine with a power
rating 31% higher than its standard diesel counterpart, and CNG storage in 8-12 gas
tank cylinders located under the passenger floor. Their purchase cost was 26% higher
than that of the diesel buses they replaced. The LF CNG buses included an integral
body chassis, rather than being built on a truck chassis as was the case for the
standard CNG and diesel buses, a larger floor area, rear mounted engines with nearly
double the power rating, and roof-mounted CNG storage tanks. Also, these buses
conformed to the Bharat Stage III and IV emission standards, which are comparable to
EURO-III and IV norms. The LF CNG buses cost USD 126,000-149,000, more than
twice the average price of USD 60,000 for a new standard CNG bus, based on recent
procurements by other Indian transit operators (Government of India, 2009a, 2009b,
2009c, 2011, and 2012).

80
Operation, storage and maintenance of DTC’s bus fleet are conducted from 49 depots
across Delhi. The majority of these depots have dedicated CNG refueling infrastructure
on site, which includes diesel-powered compressors, CNG buffer storage tanks, and
usually two fast-fill dispensers per depot. Natural gas feedstock costs, staffing,
operation, and maintenance of DTC's CNG refueling infrastructure is provided by IGL,
which sells CNG to DTC at a negotiated price. Each depot serves only one type of bus
technology (i.e., standard CNG, or LF CNG buses). DTC staff maintain the standard
CNG buses at the depots, while overhauling and reconditioning is done at two central
workshops.
When the LF CNG buses were procured, starting in 2007-08, DTC contracted with the
bus manufacturers, requiring them to be responsible for maintaining these buses. This
outsourcing was a clear departure from the traditional practice of "in-house"
maintenance, as was the case when CNG was first implemented in 2000, and allowed
for technological risk to be transferred to the bus manufacturers while allowing DTC to
reduce staffing needs substantially and focus staffing resources on transit operations.
Under the agreement with DTC, the bus manufacturers employ their staff for routine and
preventive maintenance of the LF CNG buses on site at the depots, and bear the
associated costs of labour and parts. They carry out overhauls and more specialized
maintenance at outside locations.
4.2 Analytic framework, methodology and data In this paper, we present our analysis of DTC's bus fleet performance over the period
1989-90 to 2010-11 -- that is, from roughly ten years prior to CNG implementation until
10 years after -- in order to assess how fleet operational and financial performance was
affected by the replacement of diesel with CNG, and changes to bus technology. Our
analysis was based on those factors and performance measures most affected by fuel
system change; namely, bus transit service provision and utilization (in terms of fleet
size and age, carrying capacity-kilometres, and passenger-kilometres); fuel economy (in
energy equivalent terms, for diesel versus the CNG operation, and for standard CNG

81
versus LF CNG versus LF-AC CNG buses); capital and operational expenditures
(related to fuel, maintenance and labour); and reliability (in terms of breakdowns, for the
fleet, and for standard CNG versus LF CNG buses).
The data for our analysis was based on annual statistics gathered at DTC by the
authors during a field trip from 02/2010 to 04/2010, by compiling monthly reports
published internally for DTC management, as well as on yearly reports published by the
Central Institute of Road Transport (CIRT, 1992-1995; CIRT, 1997-2012). Unless stated
otherwise, all annual time series data were for the relevant financial year (so, a statistic
for period 2001-02 refers to data from April 1, 2001 to March 31, 2002). Further, the
data we used and our calculations focused only on DTC’s bus operations, excluding
those related to buses they hired (shown as DTC Hired in the CIRT reports).
When calculating operational and financial performance measures on a per-kilometre
basis, we used effective or revenue earning kilometres, henceforth referred to as
kilometres. Fuel economy figures were as reported by CIRT and DTC (see below), and
were based on gross kilometres. CNG fuel consumption was converted to litres diesel
equivalent, based on the mass based energy content of the two fuels, and the density of
diesel in Delhi (SIAM – Society of Indian Automobile Manufacturers, 2013). All financial
parameters reported in Indian Rupees (INR) were, unless otherwise stated, inflation
adjusted based on the Consumer Price Index for Industrial Workers (CPI-IW) published
by the Labour Bureau of the Government of India (Government of India, 2013), with
2010-11 as the base year (the average annual inflation rate during our 20-year analysis
period ending 2010-11 was 7.63%). Finally, values expressed in US dollars (USD) were
derived from the inflation adjusted INR values, using the average exchange rate for
2010-11 (Reserve Bank of India, 2013).
While the annual DTC and CIRT data were useful for analyzing financial and
operational performance, they were mostly aggregated for the entire fleet. Higher
frequency data, available on a monthly basis, were accessed from DTC and used for
analyzing fleet fuel economy and reliability, and to compare different bus technologies

82
that were operational contemporaneously. The reports accessed at DTC provided
statistics on aggregate fleet performance, as well as statistics disaggregated at the
depot level for key operational and financial parameters such as staffing, routes, fleet
size, kilometers operated, key expenditure items, and material consumption (fuel, tyres,
oil). Information was also gathered from DTC managers at selected bus depots, relating
to systems characteristics, maintenance, refueling infrastructure and vehicle technology,
fuel economy (FE) and reliability. The sites at which data was collected were chosen to
ensure representativeness of the geographical regions served by DTC’s urban transit
routes, and accounted for the fact that DTC operated two types of CNG bus
technologies in 2010, for which bus attributes varied significantly.12 Finally, interviews
were conducted with DTC management, to elicit their perspectives based on their
experience with CNG implementation.
4.3 Results and discussion
4.3.1 Operational performance
i) Service provision and utilization
Figure 4.1a shows the buses added and scrapped, and the resulting fleet size and age,
while Figure 4.1b shows the changes in carrying capacity-kilometers13 and passenger-
kilometers over our 20-year analysis period. From 1989-90 to 1999-00, when DTC’s
buses were exclusively diesel powered, there was no significant capital investment in
fleet renewal, and the average age of DTC's fleet steadily increased to almost 8 years,
DTC's benchmark for maximum service life for standard buses. From 1999-00 to 2002-
03, as highlighted in Figure 4.1a, DTC’s fleet went through a transition period, in which
12 The DTC sites visited for data collection were the Strategic Business Unit, DTC’s management office for the LF bus fleet, in Hauz Khas; DTC’s Central Workshop I on Banda Bahadur Marg, where planning for the standard buses, and re-conditioning, re-treading and bus body repairs, were conducted; the Kalkaji Depot and Hari Nagar Depot II (operating the standard buses), and the Sukhdev Vihar Depot, Hari Nagar Depot I and Rohini Depot I (operating the LF buses). 13 Capacity-kilometres are calculated by multiplying the total seating and standee capacity of all buses by the kilometres operated (CIRT, 2009).

83
fleet capacity was affected by, among other factors, the Supreme Court’s scrappage
and CNG mandates. The scrappage mandate requiring the retirement of buses older
than eight years preceded the mandate that all buses be converted to CNG by one year
(see Footnote 10).
As a result of these mandates, DTC’s bus fleet size, which was already in decline, was
reduced precipitously, by about one-third, from 3,000 buses to 2,000 buses, during the
transition period (Figure 4.1a). CNG implementation accelerated from 2001-02, as
noted, and as new CNG standard buses were inducted into the fleet, the fleet size
returned to pre-transition period levels, the fleet composition changed from mostly
diesel to mostly CNG, and the average fleet age decreased significantly. DTC's CNG
bus technology was predominantly homogeneous, with the fleet being comprised only of
standard CNG buses, and vehicle scrappage and fleet renewal being low, during 2001-
2009, therefore allowing the use of operational statistics aggregated at the fleet level
over this time to analyze the performance of standard CNG buses over their service life.
CNG LF bus introduction gained momentum in 2009, and fleet-wide performance
statistics start to be increasingly influenced by this technology from this time onward. In
2010-11, DTC's fleet comprised around 6,200 CNG buses, but only around 4,300 were
in use due to about 1800 standard CNG buses being over their target service life of 8
years (or 500,000 kilometers) and deemed unfit for operation (CIRT, 2012).14
14 While diesel buses were being used in inter-state operations, these buses accounted for less than 1% of the operational fleet in 2010-11, and so have limited impact on fleet-wide statistics.

84
(a) Fleet size and age
(b) Carrying Capacity-kilometres & Passenger-kilometres
Figure 4.1: Service provision and utilization
Carrying capacity-kilometres, as well as passenger-kilometres were both already in
decline since 1989-90 (Figure 4.1b), but with the sharp reduction in the bus fleet due to
the scrappage and CNG mandates, there was an equally sharp (40%) reduction in
these measures in the beginning of the transition period. Further, the average load
factor15 was extremely high, reaching almost 100% for two consecutive years. With the
induction of standard CNG buses from 2000-01, carrying capacity-kilometres increased
steadily until 2005-06, but interestingly, passenger-kilometres did not at the same rate.
Beyond 2005-06, and until 2009, when the CNG LF buses were introduced, both
capacity-kilometres and passenger-kilometres again dropped precipitously, as the
standard CNG buses that were past their target service life were taken out of service,
but also possibly because of the significant increase in bus breakdowns during this
period, as we discuss in a subsequent section. These measures began to revive again,
after the introduction of the new CNG LF buses. Overall, what is striking is the decline in
passenger-kilometres over the 20-year analysis period, and that this measure remains
flat, even while the fleet size was being augmented significantly with new CNG
15 The load factor is the ratio of passenger-kilometres to carrying capacity-kilometres, expressed as a percentage (CIRT, 2009).
0
1
2
3
4
5
6
7
8
9
0
1,000
2,000
3,000
4,000
5,000
6,000
7,000
1989
-90
1991
-92
1993
-94
1995
-96
1997
-98
1999
-00
2001
-02
2003
-04
2005
-06
2007
-08
2009
-10
Aver
age
fleet
age
(yea
rs)
Num
ber o
f bus
es
Fleet size Buses addedBuses scrapped Avegage fleet age
0
20
40
60
80
100
120
0
5,000
10,000
15,000
20,000
25,000
1989
-90
1991
-92
1993
-94
1995
-96
1997
-98
1999
-00
2001
-02
2003
-04
2005
-06
2007
-08
2009
-10
Perc
enta
ge
Milli
on k
ilom
etre
s
Carrying capacity-kilometresPassenger-kilometresLoad factor %

85
buses.16,17 This trend likely reflects (and is reflected in) the steady decline in public
transit shares reported in WSA (2008a), which is likely due to a range of factors, but
also possibly the growing role of the Delhi metro.
ii) Fleet fuel economy
The average fuel economy of standard CNG buses was 45% lower than that of DTC's
diesel-only fleet, in km/L diesel equivalent terms (Figure 4.2a). This significant reduction
in fuel economy in equivalent energy terms is likely due to several factors. First of all,
while the Otto cycle, on which the spark-ignited (SI) CNG engines operate, has a higher
thermal efficiency than the diesel cycle at the same compression ratio, diesel engines
use much higher compression ratios in practice, because they compress only air, and
are thus not susceptible to auto-ignition (as in the case of SI engines), and are therefore
able to achieve higher thermal efficiencies than SI engines. CNG is a much better SI
engine fuel than gasoline, because of its very high octane rating, and therefore SI CNG
engines can use a compression ratio higher than that of gasoline engines, but still,
much lower than that of diesels (in the case of DTC’s buses, as can be seen from Table
4.1, 10.5 for the SI CNG engines, relative to the 17.1-17.9 for the diesels which they
replaced). Additionally, SI engines are characterized by poor part-load efficiencies
because of throttling losses. In the case of the DTC CNG buses, it is also possible that
sub-optimal engine technology, as well as the additional weight of the CNG fuel tanks
contributed to the significantly lower fuel economy. Yet another important factor is likely
the low speed, stop-go characteristics of DTC bus operations; note in this regard that
congestion is a major and growing challenge in Delhi, where the average peak-hour
speed -- for all modes -- was 16 km/h, according to WSA (2008a). Chassis
dynamometer and road tests have shown that the fuel economy of CNG buses with
16 One factor contributing to the low passenger-kilometres from 2000 onward is that the average annual distance covered by DTC’s CNG buses was approximately 74,000 kilometres (CIRT 2012), as opposed to 82,338 kilometres on its diesel buses during the 1990s, according to CIRT data. Also, note that the corresponding figure in other Indian metro cities is 85,000 kilometres (as against only 56,000 kilometres in US cities -- Lowell et al. 2007). 17 Note that, while the average load factor for DTC was 71% from 2000-01 to 2010-11, it was 64% for Bangalore’s and Mumbai’s public bus fleets, and 81% for Chennai’s (CIRT, 1992-1995; CIRT, 1997-2012).

86
similar specifications to diesel buses are typically 4-25% lower depending on the vehicle
operating cycle (Lowell et al. 2007; Wayne et al. 2008; Clark et al. 2009), with the gap
being greater at slower average speeds.18
(a) Yearly Fuel Economy for Standard diesel and CNG buses (b) Monthly Fuel Economy, Standard versus LF CNG buses
Figure 4.2: Fleet fuel economy
While the fuel economy of DTC’s fleet reduced significantly as a result of the switch to
CNG on their standard buses, it deteriorated even further with the introduction of LF
buses in 2007, a process that gained momentum in 2009, as noted. The key differences
in the LF CNG buses relative to the standard CNG buses included a one tonne higher
vehicle weight, and a 70% higher engine power rating (Table 4.1). Based on data
collected at DTC, the average fuel economy was 17% and 35% lower for the LF (non
AC) and LF-AC CNG buses respectively, than for the standard CNG buses during the
same evaluation period in 2009-10. In the case of the AC buses, there was greater
seasonal variation due to the air conditioning system.
18 The US experience has shown that, because SI CNG engines are far more sensitive to operating conditions than their diesel counterparts, higher average speeds significantly improve performance for both diesel and CNG buses, but much more for CNG buses. Further, the fuel economy of state-of-the-art SI CNG engines actually approach that of diesels, under favourable operating conditions, and particularly when stringent emission standards call for more advanced exhaust treatment on diesels, with negative implications for their fuel economy -- see for example Melendez et al. (2005) in this regard.
- 0.5 1.0 1.5 2.0 2.5 3.0 3.5 4.0 4.5
1989
-90
1991
-92
1993
-94
1995
-96
1997
-98
1999
-00
2001
-02
2003
-04
2005
-06
2007
-08
2009
-10
Fuel
Eco
nom
y (k
m/d
iese
l litr
e eq
uiva
lent
)
0
CNG (km/diesel equivalent litre)
Diesel (km/l)
1.0
1.2
1.4
1.6
1.8
2.0
2.2
2.4
Jan-
09
Feb-
09
Mar
-09
Apr-0
9
May
-09
Jun-
09
Jul-0
9
Aug-
09
Sep-
09
Oct
-09
Nov
-09
Dec
-09
Jan-
10
FE (k
m/d
iese
l litr
e eq
uiva
lent
) Standard CNG buses (19 depot sample)
LF CNG (3 depot sample)
LF-AC CNG(1 depot sample)

87
iii) Reliability
One measure of service reliability is the rate of breakdowns.19 In order to evaluate the
reliability of alternative fuel systems on buses, it would be useful to focus on
breakdowns that are related to the fuel system, engine, air intake, cooling, and exhaust.
However, the CIRT breakdown statistics (CIRT, 2001-2012) are disaggregated only in
terms of mechanical, electrical and tyre related breakdowns, with mechanical
breakdowns comprising those related to transmission, engine and brakes. So, for the
evaluation of reliability (in terms of breakdowns) of CNG buses relative to their diesel
predecessors over our analysis period (Figure 4.3a), we used CIRT statistics, excluding
tyre related breakdowns. Since vehicle retirement influenced bus availability, and likely
distorted the statistics during the transition from diesel to CNG, the period from 1999-00
to 2001-02 was excluded from this analysis.
(1)rate = [(no. of breakdowns) / Kms] x 10,000 (2)rate as per (1) but for all types of breakdowns (tyres included).
(a) Yearly fleet breakdown rate (b) Monthly breakdown rate, Standard versus LF CNG buses
Figure 4.3: Reliability
19 A breakdown is defined as stoppage of a bus (while in operation) due to mechanical defects or other failures rendering the bus unfit to operate without attention to it, irrespective of the time involved (CIRT, 2009).
-
0.5
1.0
1.5
2.0
2.5
3.0
199
0-91
199
2-93
199
4-95
199
6-97
199
8-99
200
0-01
200
2-03
200
4-05
200
6-07
200
8-09
201
0-11
Brea
kdow
n ra
te(1
)
Total breakdowns (excluding tyres)
Mechanical
Electrical
NYCT reliability target rate
0 -
0.5
1.0
1.5
2.0
2.5
3.0
3.5
Dec
-07
Feb-
08
Apr-0
8
Jun-
08
Aug-
08
Oct
-08
Dec
-08
Feb-
09
Apr-0
9
Jun-
09
Aug-
09
Oct
-09
Dec
-09
Brea
kdow
n ra
te(2
)
LF CNGStandard CNGNYCT reliability target rate
0

88
Interestingly, the diesel fleet showed an improving trend in breakdown rates (Figure
4.3a), despite the increasing age profile of the fleet (Figure 4.1a), during 1990-91 to
1998-99. On the other hand, the breakdown rate worsened significantly for the CNG
fleet, as the fleet aged, with the average from 2002-03 to 2010-11 being 125% higher
than for the diesel fleet. Since effective kilometres per bus on road is a stronger
determinant of wear and tear, and therefore breakdowns (and maintenance costs), we
have plotted this measure for reference in Figure 4.3a; note that the significantly higher
breakdown rates for the CNG buses occurred despite lower effective kilometres per bus
for CNG relative to diesel buses, and a significant decline in this parameter from 2005-
06. Also worth noting is the significant increase in electrical breakdowns, likely due to
the spark plugs and related electrical systems on the SI CNG engines, a problem that
has also been observed elsewhere (Chandler, 2006). New York City Transit (NYCT),
which operates a fleet of over 4,000 buses, including a large number of CNG buses,
has set performance criteria, which among other things require that buses should be
operated at least 6,400 kilometers between roadcalls on average (Barnitt and Chandler,
2006). This benchmark, which is equivalent to 1.56 breakdowns per 10,000 km (for all
breakdowns)20, was exceeded beyond around 2010, when many of the standard CNG
buses were past their 8-year target service life, and the LF CNG buses were being
rapidly inducted into DTC’s fleet (see below).
In Figure 4.3b, we compare the breakdown rates of the standard and LF CNG buses
during the time period December 2007 to December 2009, based on monthly
breakdown statistics accessed from DTC, which did not discriminate between types of
breakdowns, and so include all breakdowns. The breakdown rate for the LF buses,
which on average was 2.4 breakdowns per 10,000 km, was 41% worse than for the
standard CNG buses (and consistently worse than NYCT's benchmark of 1.56
breakdown-per-10,000 km throughout), despite the very low (1.5 years) average age of
the former buses, and roughly 67% of the standard CNG buses being older than 8 years
during this period. This poor performance on the part of the LF buses, which possibly is 20 NYCT's CNG buses had an average breakdown rate, for all types of failures, of just 1.1 breakdowns per 10,000 km (Barnitt, 2008).

89
due to the fact that they were being implemented for the very first time in India when
they were introduced at DTC, has raised public concern and negative publicity, as
evidenced by media reports (for example, The Times of India, 2013).21 Our discussions
at DTC revealed that the bus manufacturers had likely underestimated, and were
overwhelmed by the maintenance costs of the LF CNG buses. As for the drop in
breakdown rates for 2010-11 (the last data point in Figure 4.3a), note that the data for
2011-12 (not shown in the figure) in fact goes back up to the 2009-10 level. While
Figures 4.3a and 4.3b, taken together, show higher breakdown rates for the LF CNG
relative to the standard CNG buses, it might perhaps be best to wait until around 2016-
17 in order to properly evaluate LF buses in this regard, over their full service life.
4.3.2 Financial performance
i) Capital expenditures
DTC's capital expenditures during our analysis period from 1989-90 to 2010-11 were
mostly affected by the purchase of roughly 3,000 standard CNG buses in 2000-2004,
and then by the purchase of 3700 LF CNG buses starting in 2007-08. There was limited
impact on DTC finances due to other capital expenditures, such as those tied to the
refueling infrastructure or changes to depots and maintenance areas for CNG operation.
The refueling infrastructure was put in by IGL, the gas supplier, as discussed earlier,
and so DTC did not incur any directly related capital expenditures. However, since DTC
pays IGL, which is a publicly traded company, for the fuel that is provided on site, the
CNG price likely factors in IGL's recovery of their capital investment, and so, DTC does
pay indirectly for the refueling infrastructure. While we did not have access to
information on expenditures on depot modifications related to the CNG refueling
infrastructure, we evaluated them indirectly based on the changes to asset values of
building infrastructure at DTC during the transition from diesel to CNG. Despite the
value of building, plant and machinery having increased by 43% from 2001 to 2004 21 Our research at DTC, based on a sample of 300 LF CNG buses, showed that, from February 2009 to January 2010, mechanical, tyre and electrical problems accounted for 45, 27 and 17% of the breakdowns, respectively.

90
(based on CIRT data), these assets accounted for only 12%, whereas DTC's bus fleet
did so for as much as 85%, of DTC's total fixed assets in 2004. This situation is partly
due to the fact that Delhi’s climate allows for open storage of CNG buses and semi-
open maintenance areas, which require only minimal investment in depot infrastructure.
In other contexts, especially in colder climates, most depot upgrades related to CNG
buses are due to installation of ventilation systems, re-wiring of electrical systems, and
gas detection systems to mitigate the risks of gas leakages, explosions and fires (Barnitt
& Chandler, 2006; Chandler et al., 2006).
In terms of bus capital expenditures, purchase costs (Table 4.1) were based on
information collected at DTC, as previously noted. Standard diesel bus costs were
based on the last procurement of this bus type at DTC in 1998-99, while the costs for
standard CNG buses are the average price from 2000-2003, when DTC’s fleet was
being converted to this fuel. The cost premium for the standard CNG bus relative to its
diesel predecessor was 26%, mostly related to the fuel system and engine, apart from
which both bus types had similar vehicle attributes (Table 4.1). While DTC has not
procured standard buses in recent years, their attributes have changed little, apart from
vehicle emission standards, partial use of air suspension, and possibly GPS units. The
average current cost of a standard diesel bus in India is USD 60,000, and the cost
premium of a standard CNG bus is 20%, based on data for Indian transit operators that
procured both standard diesel and CNG buses (Government of India, 2009a, 2009b,
2009c, 2011, and 2012). The CNG bus premium has therefore not changed significantly
since the early 2000s.
DTC’s costs for the non-AC LF CNG buses increased 27%, from INR 4.1 million (USD
123,000) to INR 5.2 million (USD 126,000) per bus, between the first and second
procurements in 2007 and 2009; note that inflation was only 8.7% (based on the
consumer price index referred to earlier) over the same period. Meanwhile, costs for the
LF AC CNG buses actually decreased 9% over the same period to INR 6.2 million (USD
149,000), probably owing to the increased scale of DTC's purchase of 775 buses in the
second procurement, relative to the first one, in which only 25 LF AC CNG buses were

91
purchased. Assessing the marginal cost of CNG LF buses relative to their diesel
counterparts at DTC is a challenge because no new diesel buses have been purchased
since adopting CNG. Data from Municipal Corporation Ludhiana (2013), which procured
similar specification LF non-AC diesel buses at the cost of INR 4.8 million (USD
105,000) per bus from the same manufacturer that supplied most buses at DTC, shows
that the cost premium of a non-AC LF CNG bus at DTC is about 20%; note, however,
that, apart from basic engine and model specifications in the Ludhiana case, not much
is known about other vehicle attributes, which also could affect costs. Data for Indian
transit operators that purchased both CNG and diesel buses (Government of India,
2011) shows that the average cost premium for CNG buses was 8-25%, with lower
premiums for the more expensive semi-LF or LF CNG buses, and higher premiums for
the less expensive standard CNG buses, relative to their diesel counterparts, thus
corroborating the comparison between DTC and Ludhiana. These findings in the Indian
context are similar to the cost premiums of 8-20% for CNG buses observed in the USA
and Europe (Posada, 2009).
ii) Operating expenditures
The area graph in Figure 4.4a shows the key operating expenditures from 1989-90 to
2010-11. Counting from the bottom of the figure, the first two wedges, put together,
represent the total labour costs; the second and third wedges represent the workshop
and maintenance labour plus the expenditure on automobile spare parts, and the third
and fourth wedges the total expenditures on all materials, except fuel, which are shown
in the top wedge. Taken as a whole, the expenditures in Figure 4.4a represent the total
operating expenditures, less taxes, interest, depreciation and other miscellaneous
expenses. In Figure 4.4b, we show the fuel costs, and the expenditures on workshop
and maintenance labour plus all materials except fuel, per effective (or revenue
generating) kilometre (note that the CIRT data does not indicate the expenditures
exclusively related to bus maintenance, except for the workshop and maintenance
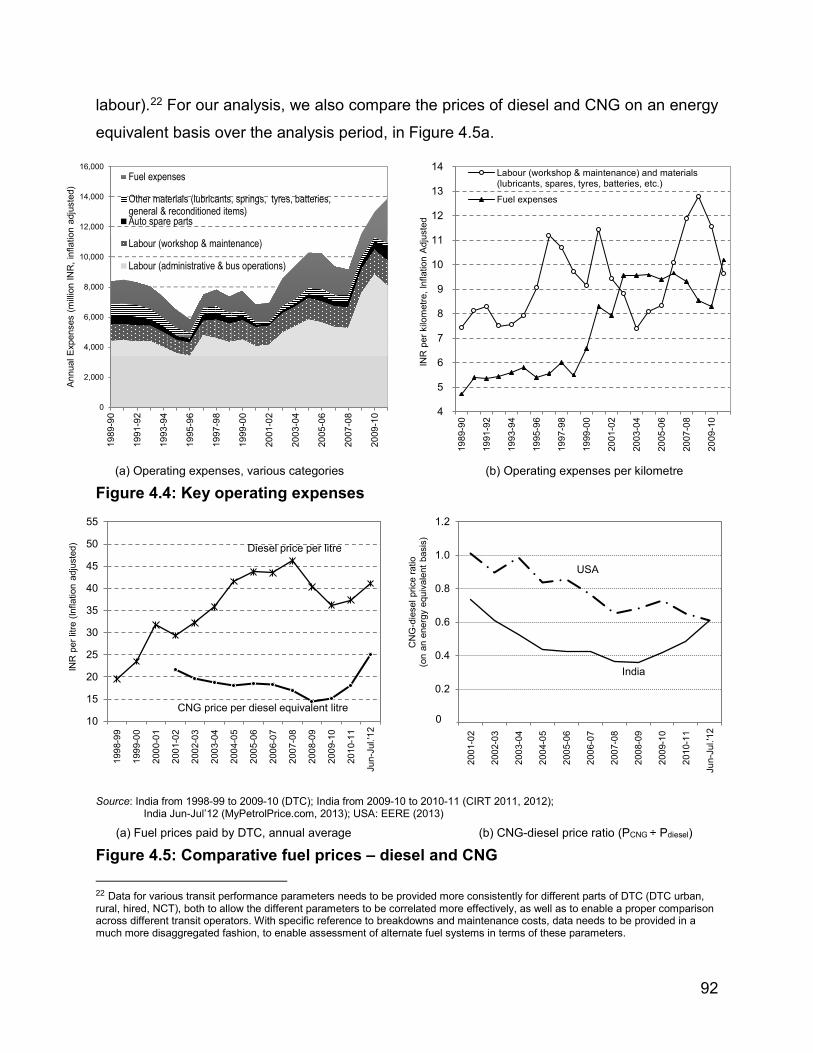
92
labour).22 For our analysis, we also compare the prices of diesel and CNG on an energy
equivalent basis over the analysis period, in Figure 4.5a.
(a) Operating expenses, various categories
(b) Operating expenses per kilometre
Figure 4.4: Key operating expenses
Source: India from 1998-99 to 2009-10 (DTC); India from 2009-10 to 2010-11 (CIRT 2011, 2012);
India Jun-Jul’12 (MyPetrolPrice.com, 2013); USA: EERE (2013)
(a) Fuel prices paid by DTC, annual average (b) CNG-diesel price ratio (PCNG ÷ Pdiesel)
Figure 4.5: Comparative fuel prices – diesel and CNG 22 Data for various transit performance parameters needs to be provided more consistently for different parts of DTC (DTC urban, rural, hired, NCT), both to allow the different parameters to be correlated more effectively, as well as to enable a proper comparison across different transit operators. With specific reference to breakdowns and maintenance costs, data needs to be provided in a much more disaggregated fashion, to enable assessment of alternate fuel systems in terms of these parameters.
0
2,000
4,000
6,000
8,000
10,000
12,000
14,000
16,000
1989
-90
1991
-92
1993
-94
1995
-96
1997
-98
1999
-00
2001
-02
2003
-04
2005
-06
2007
-08
2009
-10
Annu
al E
xpen
ses
(milli
on IN
R, i
nfla
tion
adju
sted
)
Fuel expenses
Other materials (lubricants, springs, tyres, batteries,general & reconditioned items)Auto spare parts
Labour (workshop & maintenance)
Labour (administrative & bus operations)
4
5
6
7
8
9
10
11
12
13
14
1989
-90
1991
-92
1993
-94
1995
-96
1997
-98
1999
-00
2001
-02
2003
-04
2005
-06
2007
-08
2009
-10
INR
per
kilo
met
re, I
nfla
tion
Adju
sted
Labour (workshop & maintenance) and materials(lubricants, spares, tyres, batteries, etc.)
Fuel expenses
10
15
20
25
30
35
40
45
50
55
199
8-99
199
9-00
200
0-01
200
1-02
200
2-03
200
3-04
200
4-05
200
5-06
200
6-07
200
7-08
200
8-09
200
9-10
201
0-11
Jun-
Jul.'
12
INR
per
litre
(Inf
latio
n ad
just
ed) Diesel price per litre
CNG price per diesel equivalent litre0.0
0.2
0.4
0.6
0.8
1.0
1.2
200
1-02
200
2-03
200
3-04
200
4-05
200
5-06
200
6-07
200
7-08
200
8-09
200
9-10
201
0-11
Jun-
Jul.'
12
CN
G-d
iese
l pric
e ra
tio(o
n an
ene
rgy
equi
vale
nt b
asis
)
USA
India
0

93
The first point to note is that interest payments (not shown in Figure 4.4a) alone
amounted to around 50% of total operating expenditures. This high debt burden is
mostly due to the cost associated with the purchase of standard CNG buses from 2000-
01 to 2003-04, and the LF CNG buses starting in 2007-08. The CIRT data shows that
these purchases were financed mainly through government loans, at annual interest
rates of 10.5-14.5%, and with maturities around 13 years. Given the large CNG bus
procurements (which involved significant cost premiums relative to their diesel
counterparts), the high interest rates, and short maturity periods, DTC's liabilities have
grown exponentially since CNG was introduced. The second key point is that labour
expenses, of which those related to administration and bus operations form the lion’s
share -- and have been increasing continuously, and particularly rapidly since around
2007-08 -- account for the bulk of operating expenditures less taxes, interest,
depreciation and other miscellaneous expenses. An important factor in this regard is
labour productivity. In 2010-11, the average DTC depot, with 830 personnel, serviced
110-130 buses, for an average of 7.5 personnel-per-bus, as against an average of 6.2
personnel-per-bus in the other large public bus transit operations in Bangalore,
Chennai, and Mumbai, and 2.5 personnel-per-bus in the USA (CIRT, 2012; Lowell et al.,
2007; Clark et al., 2009).
Thirdly, note that total fuel expenses, being a function of fleet fuel economy, fuel price
and total fleet activity, are largely driven by the variations in the last factor over the
analysis period. On the other hand, fuel costs per kilometre, which are a function of fleet
fuel economy and fuel price, appear to have been driven largely by the increase in
diesel price for the all-diesel fleet until CNG introduction in 2000-01 (Figure 4.4a), given
that fleet fuel economy varied only slightly, from 3.72 to 3.8 km/L between 1989-90 and
2000-01 (Figure 4.3a). Note that, even though capacity-kilometres and passenger-
kilometres were dropping significantly, load factors were as high as 87% on average,
during this period.

94
Fuel costs per kilometre started to increase rapidly with CNG introduction; indeed, they
were 70% higher for the CNG fleet from 2003-04 to 2010-11, that is, after the transition
to CNG had been completed, than for the all-diesel fleet from 1989-90 to 1998-99. This
was despite the high load factors and the increase in diesel prices up to the transition
period, on the one hand, and the significant reduction -- by as much as a third – in CNG
prices, from the time of introduction of this fuel, in 2000-01, until around 2008-09 (Figure
4.5b), besides a much lower (69%) average load factor for the CNG buses than for the
all-diesel fleet (Figure 4.1b). A key contributory factor was of course the much poorer
fuel economy of CNG buses relative to diesel buses -- a situation that was exacerbated
by the increase in CNG price from around 2009, just as the LF CNG buses, with even
poorer fuel economy than the standard CNG buses, were being introduced.
A note on CNG prices: in the US context, natural gas feedstock, as represented by the
average city-gate price (EIA, 2013), represented only about a quarter of the final retail
price of CNG sold at refueling stations (EERE, 2013). Other major costs include those
related to capital infrastructure for refueling stations, energy for compression, fuel
retailers’ margins, and taxes. All these factors are assumed to be priced into the CNG
price paid by DTC to IGL. The average energy equivalent price of CNG hovered just
under 50% of the diesel price from 2001 to 2011 (Figure 4.5a). Figure 4.5b compares
the CNG price relative to that of diesel in the US and Indian contexts. It appears that,
although the CNG-to-diesel price ratio has been higher in the USA than in India, this
ratio has converged to similar levels towards the end of 2011.
The expenditures on workshop and maintenance labour plus all materials except fuel,
per effective kilometre, show large variations over our analysis period (Figure 4.4b).
Interestingly, the graph for this measure appears to be a near mirror image of the graph
for total fleet activity (in terms of capacity-kilometres and passenger-kilometres) in
Figure 4.1b. This is because workshop and maintenance labour and material expenses
– and particularly workshop and maintenance labour, which forms the bulk of these
expenses -- are fairly constant regardless of the fleet activity (or even the fuel system),
as evidenced by Figure 4.4a. Even so, the average maintenance expenditure per

95
kilometre for the CNG fleet, from 2003-04 to 2010-11, was roughly 16% higher than for
the all-diesel fleet, from 1989-90 to 1998-99. This is despite the fact that the average
age of the latter fleet was 6.1 years (with a minimum of 5.6 years), and was almost 8
years before conversion to CNG (Figure 4.1a), whereas the average fleet age
decreased to less than 2 years post-conversion, and gradually increased over the years
until the procurement of the LF CNG buses.23 Note also the significantly higher
breakdown rates for the CNG buses, despite the effective kilometres per bus on road
being lower on average for these buses, and having declined significantly from 2005-06,
which we discussed earlier (Figure 4.3a). A final trend worth noting in Figure 4.4b is the
decline in the per-kilometre expenditures on workshop and maintenance labour plus all
materials except fuel from their peak in 2008-09. This was likely possible, despite the
higher breakdown rates for the LF CNG buses, mostly due to the fixed nature of the LF
bus maintenance costs under the service contracts, thus highlighting an effective cost
management strategy used by DTC to transfer risk on the new bus technology.
Figure 4.6: Maintenance costs, key categories, per kilometre
At the same time, though, fleet age likely contributed to maintenance costs. The period
from 2002 to 2009 may be used to understand the evolution of these costs for standard
23 After the fleet had been fully converted to CNG, in 2003-04, standard CNG buses made up over 90% of the operational fleet, with only a marginal presence of standard diesel buses that operated on inter-state routes.
0
2
4
6
8
10
12
14
16
0
0.5
1
1.5
2
2.5
3
3.5
2002 2003 2004 2005 2006 2007 2008 2009 2010 2011
YR1 YR2 YR3 YR4 YR5 YR6 YR7 YR8 YR9 YR10
INR
per
km
(inf
latio
n ad
just
ed)
INR
per
km
(inf
latio
n ad
just
ed)
Year and Average Standard CNG fleet age
Lubricants Bus spare partsBatteries and other items Labour

96
CNG buses, as they aged over their 8-year service life. Analysis of the different
components of these costs (Figure 4.6) shows that spare parts expenditures, which
were initially low, rose to match or even exceed the labour costs in the last four years of
this period.24
Figure 4.7: Operating costs per passenger kilometre and operating ratio
As we discussed earlier, passenger-kilometres have declined over the 20-year analysis
period. Whatever the cause of this trend, the fact remains that it is happening even as
CNG was introduced, and new standard, LF and LF-AC CNG buses were inducted into
DTC’s fleet from 2000-01 onward, involving significant capital expenditures (and cost
premiums over their diesel counterparts), in the process considerably increasing DTC’s
debt burden. At the same time, operating costs have increased considerably (Figure
4.4a), even without considering taxes, interest, depreciation and other miscellaneous
expenses, and even as passenger-kilometres have remained stagnant (Figure 4.1b).
24 Over 1,843 standard CNG buses were older that the targeted service life of 8 years in 2011 (CIRT 2012), and most likely contributed to the high maintenance costs per kilometre (Figure 4.4), as well as the higher breakdown rates in Figure 4.3a.
0
50
100
150
200
250
300
0.0
0.2
0.4
0.6
0.8
1.0
1.2
1.4
1.6
1.8
1989
-90
1991
-92
1993
-94
1995
-96
1997
-98
1999
-00
2001
-02
2003
-04
2005
-06
2007
-08
2009
-10
perc
enta
ge
INR
per
pas
seng
er-k
m (I
nfla
tion
adju
sted
)
Total operating costs (less taxes, interest, depreciation, and miscelaneous others), per pass-km
Operating ratio = (labour+material expenses) / (traffic revenue)
0

97
This effectively means that operating costs per passenger-kilometre have been
increasing since CNG introduction; indeed, as shown in Figure 4.7, they have grown
steadily over the 20-year analysis period. The net result of this, in turn, is that the
operating ratio, which is the proportion of total traffic revenue accounted for by operating
expenditures, and is thus an important measure of the operational efficiency of the
transit service, has also been increasing steadily over the analysis period, and
exceeded 250% during 2007-09 (again, it must be stressed that taxes, interest,
depreciation and other miscellaneous expenses are excluded from Figure 4.7).
4.4 Conclusions and implications As we argued in our introduction, the 10-plus years of experience accumulated as a
result of the large scale conversion of DTC’s bus fleet to CNG provides a valuable
opportunity for a post-implementation evaluation of the operational and financial
performance of this fuel system, thereby fulfilling an important research need. At the
same time, this experience enables lessons to be drawn for the viability of similar large-
scale conversions of urban bus fleets to CNG, and for informing techno-economic and
environmental analyses of CNG bus transit operations, in India and other rapidly
motorizing low and middle income countries. So, what lessons may be drawn from the
DTC experience?
The fact that the major technical, logistical and institutional challenges associated with
this implementation were overcome, and CNG was implemented on buses (and other
public motor vehicles) in Delhi over the space of 3-4 years, despite these challenges, is
undoubtedly an achievement, which demonstrates the importance of co-ordination
between various actors, including vehicle manufacturers, fuel suppliers, bus and other
public motor vehicle operators, and different levels of government.
At the same time, it is important to recognize that the implementation of the scrappage
and CNG mandates, which were driven primarily by environmental concerns related to
Delhi’s air quality, caused serious reduction in the capacity to deliver transit services at
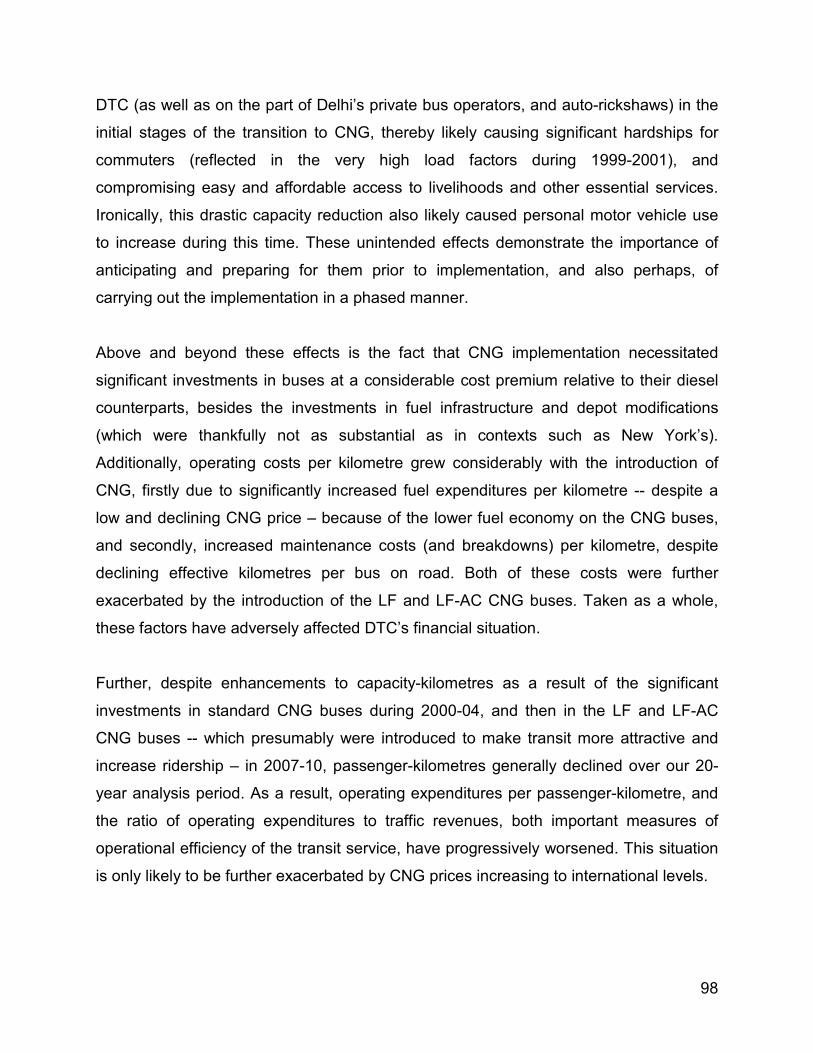
98
DTC (as well as on the part of Delhi’s private bus operators, and auto-rickshaws) in the
initial stages of the transition to CNG, thereby likely causing significant hardships for
commuters (reflected in the very high load factors during 1999-2001), and
compromising easy and affordable access to livelihoods and other essential services.
Ironically, this drastic capacity reduction also likely caused personal motor vehicle use
to increase during this time. These unintended effects demonstrate the importance of
anticipating and preparing for them prior to implementation, and also perhaps, of
carrying out the implementation in a phased manner.
Above and beyond these effects is the fact that CNG implementation necessitated
significant investments in buses at a considerable cost premium relative to their diesel
counterparts, besides the investments in fuel infrastructure and depot modifications
(which were thankfully not as substantial as in contexts such as New York’s).
Additionally, operating costs per kilometre grew considerably with the introduction of
CNG, firstly due to significantly increased fuel expenditures per kilometre -- despite a
low and declining CNG price – because of the lower fuel economy on the CNG buses,
and secondly, increased maintenance costs (and breakdowns) per kilometre, despite
declining effective kilometres per bus on road. Both of these costs were further
exacerbated by the introduction of the LF and LF-AC CNG buses. Taken as a whole,
these factors have adversely affected DTC’s financial situation.
Further, despite enhancements to capacity-kilometres as a result of the significant
investments in standard CNG buses during 2000-04, and then in the LF and LF-AC
CNG buses -- which presumably were introduced to make transit more attractive and
increase ridership – in 2007-10, passenger-kilometres generally declined over our 20-
year analysis period. As a result, operating expenditures per passenger-kilometre, and
the ratio of operating expenditures to traffic revenues, both important measures of
operational efficiency of the transit service, have progressively worsened. This situation
is only likely to be further exacerbated by CNG prices increasing to international levels.

99
The question that our analysis raises is, apart from its emissions outcomes, how has the
significant investment in CNG contributed to, or taken away from, the objective of
providing convenient, affordable and viable public transit service in Delhi, which is
crucially important first and foremost to cater for the accessibility and mobility needs of
the masses, and also to minimize the need for personal motor vehicle activity and its
associated impacts, including air pollutant emissions. This question gains particular
importance because of the decline in passenger-kilometres at DTC, and the equally
significant reduction in public transit modal shares in Delhi among other metropolitan
cities in India, over the past couple of decades.
It may be argued that the debt burden, and the overall financial situation due to the
increased capital and operating costs per passenger-kilometre due to CNG
implementation has in fact detracted from this objective, as well as the ability to
enhance public transit capacity and provide widespread coverage region-wide. It is
worth investigating whether, if the same investment had been made in emission-
controlled diesel buses, a larger capacity to deliver bus transit services might have
resulted, thereby better achieving equity, and conceivably, even environmental
objectives, by helping avoid a larger number of personal motor vehicle trips region-wide.
An additional problem in this regard is of course that the investments are being made
without any accompanying TDM measures.
All of the foregoing points have important implications for policy-making and
implementation, as well as for policy analysis. They demonstrate the need to analyse
and formulate environmental policies such as the implementation of CNG on Delhi’s
buses broadly, in terms of a wide range of impacts for different groups in society, rather
than narrowly in terms of only environmental (in this case emissions) outcomes, and to
explicitly consider and address conflicts and trade-offs between environmental, and
other (transit operation, socio-economic and equity) objectives.

100
Chapter 5: CNG and diesel urban buses in India: A life-cycle cost comparison
Chapter overview
In Chapter 5, I estimate the life-cycle costs (LCCs) of diesel and natural gas-fueled
public transit bus fleets in India. For this chapter, I draw from data and results in
Chapter 4, coupled with on-road bus performance of other key large public bus transit
operators in India in order to closely reflect fuel and bus technologies, operating
conditions, and costs that are most prevalent in urban India, and build a LCC model for
this context. A LCC approach is justified given the complexity of analyzing different fuel
systems for buses that have many parameters, such as investment and operating cost
requirements, which vary in kind, extent, and temporally over the service life of each
fuel and bus technology; and since a LCC framework allows for the evaluation of all
these costs using an integrated and comparable metric, the present value of total LCCs.
Overall, the analysis of LCCs for CNG and diesel buses in India should provide lessons
for assessing the long-term impacts of bus and fuel choices on the viability of CNG use
in public bus transit fleets. Further, LCC results from this chapter will be used in Chapter
6 to evaluate the cost-effectiveness of the emissions reductions enabled by CNG public
transit buses in Delhi.
5.1 Introduction
The buses in the Indian capital, Delhi, including those operated by the publicly owned
Delhi Transport Corporation (DTC), were converted to compressed natural gas (CNG)
from 2000 to 2004 (Bell et al., 2004; Patankar & Patwardhan, 2006), pursuant to a
Supreme Court of India (1998) ruling, and as part of a suite of technological and
regulatory policies to address the poor air quality in this and other Indian cities (CSE,
2002b; TERI, 2002). CNG has also been implemented on buses in other Indian cities
(CIRT, 2013).

101
The implementation of CNG on buses in Delhi and other Indian cities was motivated by
the potential environmental and health benefits that CNG offers, by way of reduced
emissions of critical air pollutants relative to the conventional diesel fuel that it replaces.
CNG, when used in optimized engines, results in significantly reduced emissions of fine
particulates, which are strongly correlated with health outcomes including respiratory
and cardio-vascular illnesses and deaths, and of other air pollutants such as carbon
monoxide, sulphur dioxide, and non-methane hydrocarbons (Kathuria, 2005; Narain &
Krupnick, 2007). These benefits are likely to be enhanced in contexts like India, in which
vehicle emission and fuel quality standards have been -- at least until recently -- less
stringent than those elsewhere (Posada, 2009). As importantly, from the perspective of
climate change, CNG has the potential to reduce net carbon dioxide equivalent
emissions, relative to diesel in urban buses (Reynolds & Kandlikar, 2008).
5.1.1 CNG implementation on DTC’s bus fleet
Delhi, with around 20,000 buses, has one of India’s largest bus fleets; also, DTC has
the second largest publicly operated urban bus fleet in the country, with around 4,700
CNG buses (CIRT, 2017). The first CNG buses in DTC’s fleet, referred to in this paper
as the CNG Standard model (CNG-Std. -- Table 5.1), replaced diesel buses of the same
configuration from around 2000 to 2004. Starting in 2007-08, DTC introduced low-floor
CNG buses (hereafter CNG-LF), to replace the CNG-Std. buses, 10% of which were
over DTC’s target service age of eight years in 2006-07 (CIRT, 2008). The CNG-LF
buses, with a 400mm floor height (as opposed to 800mm for the standard buses), were
introduced to offer improved accessibility. They also had full air suspension, automatic
transmission, and a service life of 12 years (or 750,000 kilometers). Between 2007 and
2011, 3,700 CNG-LF buses were put into operation, of which 33% were air-conditioned
(hereafter CNG-LF/AC), on which higher fares were charged. Of DTC’s 4,300
operational buses in 2010-11, around 46% were standard CNG, 53% were CNG-LF
(CIRT, 2012), and less than 1% were standard diesel buses.

102
The CNG-Std. buses had an engine power rating 31% higher than that of their diesel
counterparts, and CNG stored in 8-12 cylinders below the floor; they cost 26% more
than their diesel counterparts. The CNG-LF buses featured an integral body chassis,
and rear-mounted engines with nearly double the power rating, and roof-mounted CNG
storage. Also, these buses conformed to the Bharat Stage III and IV emission
standards, which are based on the EURO-III and IV norms. The purchase cost of the
CNG-LF and CNG-LF/AC buses is around USD 126,000 and 149,000 respectively,
more than twice the USD 60,000 paid for a new CNG-Std. bus, as data from recent bus
procurements in India show (Government of India, 2009a, 2009b, 2009c, 2011, 2012).
DTC’s bus fleet is operated from over 40 depots, most of which have on-site CNG
refueling infrastructure. This refueling infrastructure is operated by Indraprastha Gas
Limited (IGL), which sells the CNG fuel to DTC at a negotiated price. Each depot
typically serves only one type of bus (i.e., CNG-Std. or CNG-LF), and re-conditioning
and overhauling are done at two central workshops.
From 2007-08, when the CNG-LF buses were introduced, DTC moved away from "in-
house" maintenance, and entered into a contract with the bus manufacturers to make
them responsible for bus maintenance. The bus manufacturers conduct routine and
preventive maintenance of the buses at the depots, and overhauls and other specialized
maintenance at outside locations; they also bear the costs of labor and parts. This
arrangement enables DTC to transfer technological risk to the manufacturers, and to
reduce staffing levels and focus them on transit operations.
5.1.2 Rationale and objectives
Decision-making regarding CNG implementation on urban buses for mitigating urban air
pollution needs to consider its environmental and health benefits, as well as its life-cycle
(capital, operating and maintenance) costs, over the service life of the buses, relative to
their conventional diesel counterparts. There is a considerable literature on the
emissions effects of the implementation of CNG, among other measures, in the

103
transport sector in Delhi, and in India more generally. Some studies worth mentioning
are Kathuria (2005); Chelani and Devotta (2007); Narain and Krupnick (2007); Reynolds
and Kandlikar (2008); and Reynolds, Grieshop, and Kandlikar (2011) in relation to the
emissions effects of CNG implementation, and Jalihal and Reddy (2006); Kumar and
Foster (2009); Goel and Guttikunda (2015); Aggarwal and Jain (2016); and Jain,
Aggarwal, Sharma, and Kumar (2016), on the effects of a wider range of policy
measures. However, very little if any attention has been paid to studying the operational
or financial aspects of CNG implementation; indeed, there is a major gap in
systematically understanding the costs of implementing CNG in the Indian context. The
air pollution mitigation effects of CNG are of course important for society at large,
especially since air quality improvement was the objective of the policy; however, the
perspective of vehicle users and operators is also important. It would be useful to
assess how bus fleets on CNG perform operationally and financially, because it is this
performance that drives the bus operator’s responses, which in turn affect the extent to
which CNG implementation, and the resulting emissions reductions, are successful.
Such an analysis is particularly useful from the perspective of private bus operators, but
it is so for publicly-owned transit operators as well, given the challenge they face in
providing quality and affordable bus services within budgetary constraints.
Further, it is useful to evaluate operational and financial performance on a life-cycle
basis, because each fuel-bus technology system incurs a range of costs that vary in
kind and extent, and temporally, over its service life. Varying patterns of purchase,
operation, maintenance, servicing and replacement costs related to the fuel systems,
buses, engines, and related supporting (including, importantly, fuelling) infrastructure
need to be accounted for. A life-cycle cost (LCC) approach, based on the present value
of bus fleet life-cycle costs, would integrate and compare these varying capital and
operating cost streams for different fuel-bus technology systems on an uniform basis.
This is particularly useful when evaluating CNG bus systems since such systems must
be shown to be cost-effective in mitigating emissions, relative to diesel options with
exhaust treatment, which do not require major changes to the refueling infrastructure.

104
The operational and financial performance of DTC's bus fleet was critically evaluated
from 2001-02, shortly after CNG implementation began, until 2010-11, and compared
with the performance of the fleet when it was diesel powered, from 1989-90 until when
CNG was implemented, in Krelling and Badami (2016). That study evaluated how the
operational and financial performance of the fleet was affected, as it was converted from
diesel to CNG-Std., and then to CNG-LF and CNG-LF/AC buses. In this paper, we
evaluate the LCCs incorporating the elements discussed in the previous paragraph
related to these CNG bus configurations in Delhi, and compare them with those
associated with their diesel counterparts in the Indian context. We base these
evaluations on actual on-road bus performance data for DTC and other Indian public
bus transit agencies, in order to closely reflect fuel and bus technologies, operating
conditions, and costs that are prevalent in urban India. In order to see what might
happen if fuel prices were largely market driven, we also assess the LCCs of low-floor
air-conditioned CNG and diesel buses in India, but with US fuel prices. We then present
sensitivity analyses of LCCs relative to fuel economy and fuel price variations, for the
Standard and LF/AC configurations, to show how these key factors affect the viability of
CNG bus systems relative to their diesel counterparts. Lastly, we analyze how the
choice of a discount rate affects these assessments. No such evaluation has been
conducted on CNG urban bus transit fleets in India or similar contexts, to our
knowledge.25
Our in-depth evaluation of the LCCs of CNG urban buses, as outlined above, is
intended to be an input into decision-making regarding the implementation of CNG
buses for mitigating urban air pollution, in concert with an assessment of the
environmental and health benefits of CNG in this application. We do not address the
assessment of the environmental and health benefits of CNG implementation in this
paper, because this assessment will involve, among other things, a comprehensive and
detailed modeling of emissions of health-critical air pollutants and greenhouse gases for
the various CNG bus configurations we consider, over their service life, relative to their 25 A study by TERI (2002) analyzed the “well to wheels” cost of producing and distributing CNG relative to diesel containing 50ppm sulphur, but did not address the life-cycle costs of CNG buses.

105
diesel counterparts, under real-life operating conditions, and would require a full length
paper on its own. Our in-depth evaluation of the LCCs of CNG buses in this paper will
hopefully fill an important policy research need, and help inform techno-economic and
environmental analyses of CNG urban bus transit operations in India and similar
contexts.
5.2 Analytic framework, methods, and data
5.2.1 Bus and fuel systems evaluated
We conduct our LCC analysis of CNG bus systems in the Indian context, using
operational and financial performance data related to the CNG-Std., CNG-LF and CNG-
LF/AC buses operated by DTC, over the period from 2001-02, very shortly after CNG
buses began to be introduced in Delhi (and the country), to 2010-11 (Table 5.1). DTC’s
experience with CNG buses over more than ten years since around 2000 makes it a
good representative case of large-scale CNG urban bus operations for our analysis in
India. While BEST, the public bus operator in Mumbai has also operated CNG buses for
nearly as long as DTC, a substantial proportion of its buses continue to be diesel-
powered (CIRT, 2017). Most importantly from the perspective of this research, detailed,
disaggregated and long-term data on the various parameters necessary for the LCC
analysis are not readily available for the CNG bus fleet in Mumbai. Besides, the
operating conditions (and therefore bus fleet performance) in Delhi and Mumbai are
likely to be fairly similar -- as borne out by the fleet fuel economy of CNG buses being
similar in these two cities (CIRT, 2012).
As for comparing the LCCs of the CNG-Std., CNG-LF and CNG-LF/AC buses with their
diesel counterparts in the Indian context, we use operational and financial performance
data related to the diesel bus fleets in Bangalore, Chennai and Mumbai, since DTC and
other bus operators in Delhi have not operated diesel buses since 2003. Note that these

106
cities have large, well-established public bus transit systems26, as in Delhi. Besides, the
operating conditions in these cities, in terms of, for example, average driving speeds
and bus load factors, are very similar to those faced by DTC in Delhi (CIRT, 2012;
WSA, 2008a, 2008b).27 So, the CNG and diesel bus technologies being analyzed and
compared in terms of their LCCs reflect those operated by the largest public transit
fleets in the major metropolitan areas of India; and our analysis is based on actual --
and contemporaneous -- on-road CNG and diesel bus performance in these areas.
Table 5.1 summarizes the key characteristics of the CNG and diesel bus technologies
evaluated in our LCC analysis.
Table 5.1: Summary of key bus systems evaluated in India
CNG Std.
CNG LF
CNG LF/AC
Diesel Std.
Diesel LF
Diesel LF/AC
Model Year (MY) 2001/02 2007/08 2007/08 Various Various 2005+ Fuel Type CNG CNG CNG Diesel Diesel Diesel Manufacturer / Model Tata, AL Tata LE RE
LPO 1623 Tata Tata, AL Tata, AL Tata, AL
Engine (max HP) 120-150 230 250 125-165 180 225-290 Compression ratio 10.5:1 10.5:1 10.5:1 ~17:1 17.2:1 17.3:1 No. of cylinders 6 6 6 6 6 6 Engine displacement 5.9L 5.9L 5.9L 5.9L 5.9L 5.9-7L
Emissions control/Standards Catalytic converter BS-III BS-III BS-III BS-III BS-III
Fuel Capacity 90-96 kg 108 kg 108 kg 165 L 150 L 150-310 L Gross Vehicle Weight 15.3 16.2 16.2 ~15 16.2 16.0 Length (meters) ~10.7 12 12 ~10 12 12 Passenger capacity 68 70 70 66 70 70
Source: CNG bus data from DTC, Delhi; diesel buses reflect the technologies used at BEST (Mumbai), BMTC (Bangalore) and MTC-CNI (Chennai); data for these operators are based on bus specification guidelines established by the Ministry of Urban Development of the Government of India for the purchase of buses using public funding (MoUD 2012; 2013).
26 The public bus transit counterparts of DTC in Bangalore, Chennai and Mumbai are the Bangalore Metropolitan Transport Corporation (BMTC); Metropolitan Transport Corporation Limited, Chennai (MTC-CNI); and Brihan Mumbai Electric Supply & Transport Undertaking (BEST). Their fleets comprised 3000 or more buses over the period from 2001-02 to 2010-11 (CIRT, 2003-2012). 27 The average speeds were very similar -- 16 km/h, 16 km/h, 19 km/h, and 18 km/h respectively -- in Delhi, Mumbai, Chennai and Bangalore (WSA, 2008a, p. 28); and all these cities have a “plain” terrain (WSA, 2008b, pp. 100, 103, 106, 112). The average age of the bus fleet was 5 years, 7 years, 6 years, and 4 years respectively in these cities, over our evaluation period from 2001-02 to 2010-11 (CIRT, 2003 to 2012). The load factors in these cities were 71%, 63%, 81%, and 64% respectively. Thus, the average fleet age and load factor in Delhi were close to the average of the fleet ages (5.7 years) and the average of the load factors (69%) in the other three cities.

107
5.2.2 Analytic framework
While our research draws on Schubert and Fable (2005), Lowell, Chernicoff, & Lian
(2007), Laver et al. (2007), Clark et al. (2009), and Johnson (2010), among other
studies, the model we used to calculate LCCs (Equation (1) below) was based on
Lowell et al. (2007) and Clark et al. (2009), given their comprehensive consideration of
various parameters. However, it is worth reiterating, as noted earlier, that our
evaluations use actual on-road bus performance data for DTC and other Indian public
bus transit agencies, and closely reflect Indian fuel and bus technologies, operating
conditions, and costs. Each parameter in Equation (1) is explained in Table 5.2.
LCCi(y, wi, d, ei, k, r) = w0,id + w1,iyk + w5e0,id + � (w2,i,t +w3,i+w4)y+w5e1,id
(1+r)t
T
t=1 (1)
i) Operational and financial parameters, and data sources
Table 5.3 summarizes the key operational and financial parameters -- including the
infrastructure costs (w0), Bus service life (T), Bus purchase cost (w1), Fuel costs (w3),
and labor costs (w4) -- that were used in the LCC model, as well as the data sources
and the periods over which the data were drawn. Following this table is a discussion of
the key parameters, as well as the specific methods used in their estimation. An in-
depth description of all assumptions used in the LCC estimation is presented in the
Appendix B; this description includes the specific values used for various parameters
(e.g., training costs, with hours used, e0 and e1, and hourly wages, w5).

108
Table 5.2: LCC model parameters in Equation (1) Parameter Description LCCi Present value of the total capital and operational costs during infrastructure/fleet setup
period and the expected service life of the bus fleet, T, in US dollars ($) i Refers to different types of bus fleets operating on diesel and CNG fuel systems
shown in Table 5.1 y Annual fleet vehicle-kilometres (y) = [number of buses in fleet] × k (kilometres per bus) wi Unit costs related to each i, detailed below.
w0 Depot infrastructure costs, measured in $-per-depot; total depot cost = w0 x the number of depots, d, required to service the fleet.
w1 Bus purchase cost, measured in $-per-bus purchased; total bus purchase cost = [w1] x [the number of buses purchased].
w2 Maintenance cost, measured in $-per-kilometre; total fleet maintenance cost = [w2] x [annual fleet vehicle-kilometres (y)].
w3 Fuel cost, measured in $-per-kilometre:
w3,i =Pi
FEi
FEi – bus fuel economy, in kilometres-per-litre (or litre diesel energy equivalent for CNG); Pi – fuel price in $-per-litre Total fleet fuel cost = [w3] x [annual fleet vehicle-kilometres (y)] CNG fuel consumption was converted to litres of diesel on an energy equivalent basis, based on Faiz et al. (1996) and CPCB (2010).
w4 Operator labour costs, measured in $-per-kilometre for various bus fleet types. Operator labour represents all labour, other than those involved in maintenance of buses (e.g., workshop and maintenance personnel), and includes drivers, conductors, traffic supervisors, administrative personnel and others (see personnel costs in CIRT 2012 for details). Total fleet operator labour costs = [w4] x [annual fleet vehicle-kilometres (y)].
w5 Average training costs, measured in $-per-hour-per-employee; broken down by staff function (administration, maintenance or operator), but salary is assumed to be common across bus types. Total fleet training costs = [w5] x [the number of employee-hours required for training]; see e, below.
d The number of depots required to service the bus fleet, which is important in determining depot infrastructure and staffing requirements to effectively service the fleet; this parameter is calculated by dividing the number of buses in the fleet by the average bus capacity of each depot (integer, rounded up)
ei Total fleet employee training hours, broken down by specific employee function (this is treated as a vector, accounting for various specific employee functions); it is calculated by multiplying the total training hours (for each function) by the staffing numbers (for each function), for individual depots operating any given bus fleet type i.
e0 Total initial training hours vector, per employee category; also see ei
e1 Total annual ongoing training hours vector, per employee category; also see ei t Refers to a specific year of operation within i’s expected service life, T T Expected service life of a bus fleet type i, in years. k Annual kilometres-per-bus; this measure reflects the average revenue earning
kilometres operated by each bus in the fleet r Discount rate; annual percentage.

109
Table 5.3: Operating and financial assumptions used in LCC model
CNG Std.
CNG LF
CNG LF/AC
Diesel Std.
Diesel LF
Diesel LF/AC
Parameters: Fuel type CNG CNG CNG Diesel Diesel Diesel Depot cost (w0), USDx106 2.2 2.2 2.2 1.7 1.7 1.7
Service life, years 25 25 25 25 25 25 Annual operation & maint., % of w0 5.5% 5.5% 5.5% 5.5% 5.5% 5.5%
Bus service life (T), years 10 12 12 10 12 12 Bus purchase cost (w1), $/bus 59,623 125,744 149,347 48,536 104,661 139,882
Residual value, % of w1 13.4% 13.4% 13.4% 14.9% 14.9% 14.9% Avg. maintenance costs, $/km(1) 0.157 0.185 0.198 0.136 0.156 0.163
Maint. evaluation period 2002-11 AMC (3) AMC (3) 2002-11 <<< Estimated (4) >>> Maint. source data CIRT DTC DTC CIRT Fuel costs (w3), $/km 0.186 0.237 0.296 0.222 0.318 0.397
Fuel Economy (FE), km/L (2) 2.12 1.66 1.33 3.81 2.67 2.14 FE evaluation period 2002-11 2009-10 2009-10 2002-11 Est. (5) 2006-11(5) FE source data CIRT DTC DTC CIRT
CIRT
Fuel price (P), $/L 0.480 0.480 0.480 0.860 0.860 0.860 Fuel price evaluation period 2011-15 2011-15 2011-15 2011-15 2011-15 2011-15 Fuel price source data << MyPetrolPrice.com (2016) >>
Operator labour costs (w4), $/km 0.442 0.442 0.442 0.442 0.442 0.442
Source: CIRT (2012) & DTC: CNG, DTC (Delhi); India diesel: average performance of BEST (Mumbai), MTC-CNI (Chennai), BMTC (Bangalore) (1) Average maintenance expenses reflect the average costs throughout T, for each bus technology and includes costs with workshop and maintenance labour, plus materials (lubricants, spares, tyres, batteries, etc.); actual cost profile used in LCC model is shown and discussed below (see Figure 5.1). (2) Fuel Economy for CNG calculated on a litre diesel energy equivalent basis. (3) AMC: Annual Maintenance Contract between bus manufacturers and DTC, for maintenance costs for systems overhaul as well as workshop labour and consumables throughout the 12-year service life of buses. (4) Maintenance cost data not available for LF and LF/AC diesel buses; estimation methods discussed in the Appendix B. (5) Fuel economy for LF diesel buses: estimation methods discussed in the Appendix B. Fuel economy for LF/AC diesel buses: data is a representative value based on Volvo buses at BMTC, MTC-CNI, and BEST.
We used various data sources for the in-use fleet operational and financial performance
parameters of the LCC model to evaluate CNG and diesel buses in India. The CNG bus
performance data was based on statistics gathered by the first author at DTC and on
annual reports produced by the Central Institute of Road Transport (CIRT, 2002–2012).
For diesel bus performance in the Indian cities of Mumbai, Chennai and Bangalore, data
was also drawn from the Central Institute of Road Transport annual reports (CIRT,
2002–2012) for BEST, MTC-CNI, and BMTC, respectively, during the same period as
for DTC.
The LCCs in Equation (1) represent the total costs of the bus fleet over the service life,
T, of each bus system (i). In order to compare the various bus systems on an uniform
basis, and because of the variable size of the fleets representing these systems in our
study, we calculated the LCCs for 100 buses for all of the bus systems, keeping in mind
that this is the approximate number of buses serviced in each depot at DTC;
incidentally, 100-bus depots are typical of US transit operations (Lowell et al., 2007).
This assumption also means that the number of depots (d) in our LCC calculations was

110
1. Further, the LCCs were estimated for a 12-year service life, for both diesel and CNG
bus systems. Since the Standard buses had a service life of 10 years (Table 5.2), the
capital cost of these buses was converted into an annualized figure (after accounting for
the discount rate), and then pro-rated over a 12-year period. Operational costs were
calculated based on costs per kilometre (w2, w3, and w4) and on annual fleet vehicle-
kilometers (y), which in turn were based on the average annual kilometers operated per
bus (k). (k) was assumed to be 70,000 kilometers, based on the average distances
operated by buses in the Indian cities (CIRT, 2012). Finally, note that we present the
LCC results for all the bus systems, as shown in Equation (2) below, in US dollars-per-
kilometre28.
Average Life Cycle Costs for each bus system = LCCiy∙T
(2)
Depot costs Depot infrastructure needs for CNG bus fleets include those
related to the refueling infrastructure and changes to vehicle storage and maintenance
facilities. Data collected at DTC showed that, in the Indian context, a bus depot with the
capacity for servicing 100 CNG buses cost approximately USD 2 million; more recently
built depots cost DTC an average of USD 2.2 million. These costs include those related
to building infrastructure (storage areas, administration, workshop, etc.) required for bus
operation, but exclude costs related to the CNG refueling infrastructure, which the
majority of DTC’s depots have on site.
The refuelling infrastructure, which includes CNG compressors, buffer storage tanks,
and fast-fill dispensers, was put in and is operated by Indraprastha Gas Limited (IGL),
the local natural gas utility, which sells CNG to DTC at a negotiated price, as noted
earlier. This price factors in the capital costs of the refuelling infrastructure, as well as
the natural gas feedstock costs, and the costs of operating and maintaining the CNG
refuelling infrastructure, incurred by IGL.
28 We use US Dollars (USD), rather than Indian Rupees (INR), for reporting costs in order to facilitate comparison of our findings to other contexts.

111
Therefore, in order to avoid double counting of costs, we did not add the fuel refuelling
infrastructure costs to w0, the depot infrastructure costs in our model, but rather
accounted for this factor, and the other costs associated with the refuelling infrastructure
discussed above, by using the fuel prices faced by DTC. Comparable depot costs in
India for exclusively diesel-based bus operators range from USD 1.3 to 2.1 million in
2009 (Government of India, 2009a, 2009b). So, the depot infrastructure cost in the
model (w0) was set to USD 2.2 million for CNG and USD 1.7 million for diesel. Depot
infrastructure was assumed to have a 25-year service life in all cases, based on the
literature. Since the LCC estimates were made over an uniform 12-year period for all
the bus systems, as already discussed, the up-front depot cost was converted into an
annualized figure (after accounting for the discount rate), and then pro-rated over a 12-
year period.
Bus purchase costs and residual value Data for Indian transit operators
that purchased both CNG and diesel buses (Government of India, 2009a, 2009b,
2009c, 2011, 2012) shows that, considering all bus purchases on the whole, the
average cost premium for CNG buses was 7-25%, with higher premiums for the less
expensive standard CNG buses, and lower premiums for the more costly low-floor CNG
buses; incidentally, these figures are similar to the 8-20% premiums for CNG buses in
Europe and the USA (Lowell et al., 2007; Clark et. al., 2009; Posada, 2009). For our
LCC calculations, CNG-Std., CNG-LF and CNG-LF/AC bus costs (Table 5.3) were
based on data collected on recent purchases at DTC, and inflation-adjusted. In order to
ensure the best possible comparative purchase costs for their diesel counterparts, we
used data for other large urban bus operators in India for the Std. buses, and for the
Municipal Corporation Ludhiana (2013) for the LF and LF/AC buses, because their
diesel buses are of the same type and model as the CNG buses at DTC.
At the end of the fleet's useful service life, bus costs, w1, are subtracted by a residual
value (see Appendix B for details), based on the fact that buses typically operate
beyond, and thus have (market) value at the end of, their service life, T. For example,
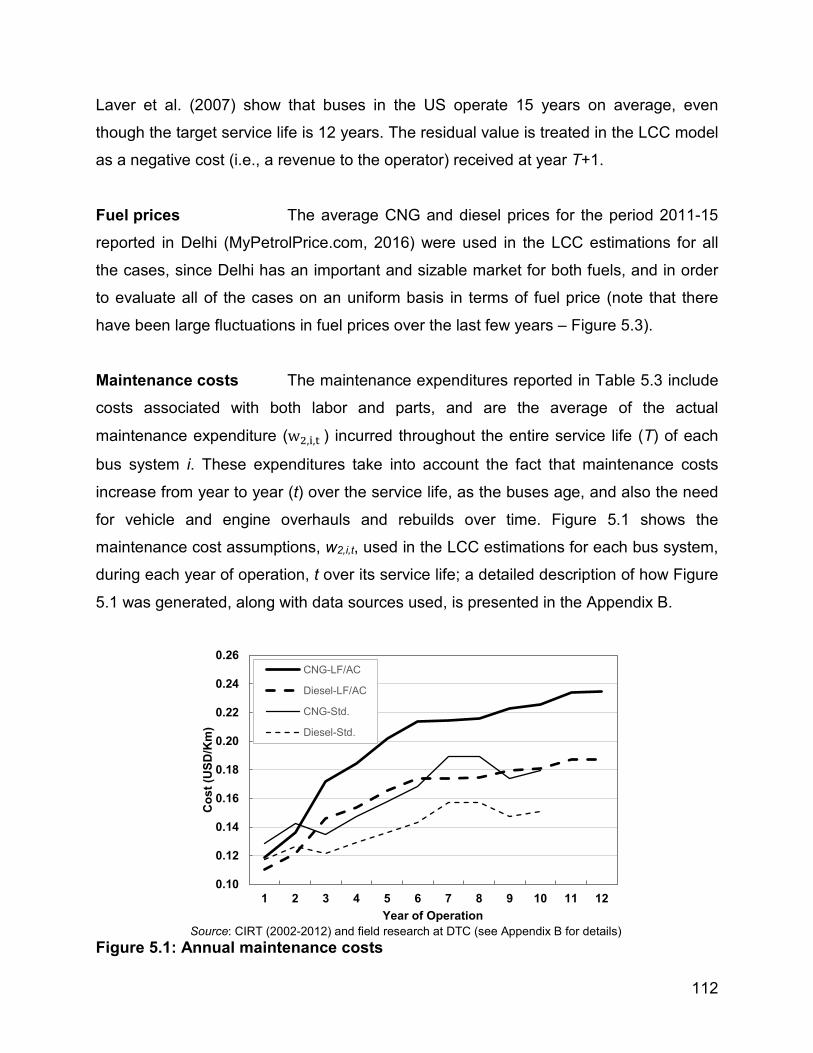
112
Laver et al. (2007) show that buses in the US operate 15 years on average, even
though the target service life is 12 years. The residual value is treated in the LCC model
as a negative cost (i.e., a revenue to the operator) received at year T+1.
Fuel prices The average CNG and diesel prices for the period 2011-15
reported in Delhi (MyPetrolPrice.com, 2016) were used in the LCC estimations for all
the cases, since Delhi has an important and sizable market for both fuels, and in order
to evaluate all of the cases on an uniform basis in terms of fuel price (note that there
have been large fluctuations in fuel prices over the last few years – Figure 5.3).
Maintenance costs The maintenance expenditures reported in Table 5.3 include
costs associated with both labor and parts, and are the average of the actual
maintenance expenditure (w2,i,t ) incurred throughout the entire service life (T) of each
bus system i. These expenditures take into account the fact that maintenance costs
increase from year to year (t) over the service life, as the buses age, and also the need
for vehicle and engine overhauls and rebuilds over time. Figure 5.1 shows the
maintenance cost assumptions, w2,i,t, used in the LCC estimations for each bus system,
during each year of operation, t over its service life; a detailed description of how Figure
5.1 was generated, along with data sources used, is presented in the Appendix B.
Source: CIRT (2002-2012) and field research at DTC (see Appendix B for details)
Figure 5.1: Annual maintenance costs
0.10
0.12
0.14
0.16
0.18
0.20
0.22
0.24
0.26
1 2 3 4 5 6 7 8 9 10 11 12
Cos
t (U
SD/K
m)
Year of Operation
CNG-LF/AC
Diesel-LF/AC
CNG-Std.
Diesel-Std.

113
Financial parameters and the discount rate Financial data originally
reported in Indian Rupees (INR) were, unless noted, adjusted for inflation based on the
Consumer Price Index for Industrial Workers (CPI-IW) drawn from Government of India
(2016), with 2010-11 as the base year. These inflation-adjusted values were converted
to US dollars (USD), using the average exchange rate published by the Reserve Bank
of India (2016) for the same base year. The cost projections over the service life T were
not adjusted for inflation, since inflation impacts all financial measures uniformly and
would also have to be included in the discount rate. Thus, the discount rate used is a
real discount rate (that is, nominal rate minus inflation expectations). A discount rate of
12% was used, based on Zhuang et al. (2007), which contains a theoretical discussion
of social discount rates, but also a review of actual rates used and recommended by
multilateral agencies globally; this rate is on par with that recommended by the Asian
Development Bank for India, according to this reference. We also show the LCCs at 6%
and 0% discount rates, for the various cases.
ii) Sensitivity analysis
Further to our LCC calculations, we conducted simulations to assess the sensitivity of
the LCC results to hypothetical changes in fuel economy and fuel price, both of which
are important parameters that influence fuel costs, which are a major operating expense
for transit agencies. While bus purchase costs are significant and sometimes of the
same magnitude as life-cycle fuel costs, bus purchase costs have not changed
significantly over the years for CNG relative to diesel buses (Government of India,
2009a, 2009b, 2009c, 2011, 2012). On the other hand, fuel prices have varied
considerably over time (Krelling & Badami, 2016; MyPetrolPrice.com, 2016). Also, fuel
economy varies depending on bus type and operating conditions, as discussed below.
For these reasons, two sets of simulations were conducted, to estimate the effect of,
first of all, varying ratios of CNG bus fuel economy relative to diesel bus fuel economy
(ρ = FECNG bus/FEDiesel bus), and secondly, varying ratios of CNG price relative to diesel
price on an energy equivalent basis (ϕ = PCNG/PDiesel), on the LCC for CNG relative to

114
diesel buses (D = LCCDiesel/LCCCNG); thus, when D > 1, CNG would be a better
alternative for the transit agency, from a LCC perspective. Each of these two sets of
simulations was carried out for Standard buses and LF/AC buses.
ρ, the ratio of CNG-to-diesel bus fuel economy, is smaller than 1 in most cases. In the
case of DTC, the average fuel economy (in km/L diesel energy equivalent) of standard
CNG buses was 45% lower than that of their diesel-only fleet29; in other words, ρ = 0.55.
Further, ρ is about 0.62 for low-floor buses in India, based on the data for low-floor CNG
buses at DTC and for comparable low-floor diesel buses in other Indian cities. However,
empirical evidence on CNG and diesel buses operating under similar conditions in the
USA shows ρ ranging from 0.56 to 0.92 (see Chandler, Eberts, & Melendez, 2006;
Barnitt, 2008; and Clark et al., 2009). Further, in one of the cases considered in the
USA (Melendez et al., 2005), CNG bus fuel economy was superior to that of diesel
buses (ρ>1). In view of the foregoing, we conducted the fuel economy related
simulations using a wide range of possibilities, with ρ ranging from 0.2 to 1.2.
With regard to the fuel price related simulations, note that in India, the price of CNG
relative to that of diesel on an energy equivalent basis ranged from a maximum of 0.61
to a minimum of 0.40, between 2001-02 and 2008-09, after which it re-bounded to 0.60
in June-July 2012; in the USA, where fuel prices are more market-driven, this ratio
ranged from a maximum of 1.00 in 2001-02 to a minimum of 0.60 during 2011-2014
(Figure 5.3; MyPetrolPrice.com, 2016; EERE, 2016). More recently in India, the average
CNG-to-diesel fuel price ratio was 0.56 during 2011-2015 (MyPetrolPrice.com, 2016). In
view of the foregoing, we conducted the fuel price related simulations with ϕ ranging
from 0.2 to 1.2, as for the fuel economy simulations. Finally, we investigate how our
sensitivity analysis is affected by the choice of discount rate.
29 At DTC, the average standard diesel-only fleet fuel economy was approximately 3.77 km/L; the standard CNG bus fuel economy was approximately 2.09 km/litre diesel energy equivalent.

115
5.3 Results and discussion
Figure 5.2 and Table 5.4 show the total LCCs calculated with a break-down in terms of
various cost categories, in $/km, for the CNG-Std., CNG-LF and CNG-LF/AC buses and
their diesel counterparts in the Indian context; and for CNG-LF/AC and its diesel
counterpart, but with CNG and diesel prices as in the USA, in order to assess how the
LCC for CNG relative to diesel might be affected if fuel prices were largely market-
driven. Note that, in addition to these estimates at 12% discount rate, we also indicate
the total LCCs at 6 and 0% discount rates, as well as the total LCCs on a $/bus basis at
12, 6 and 0% discount rates, for each of these cases. Further, Table 5.5 compares CNG
relative to diesel fuel systems, in terms of various key cost categories, and total LCCs,
for all of these cases.
Table 5.4: Comparison of bus life-cycle costs ($/km) India .
India with US fuel prices* .
CNG Std.
CNG LF
CNG LF/AC
Diesel Std.
Diesel LF
Diesel LF/AC
CNG LF/AC
Diesel LF/AC
Depot infrastructure (including operation and maintenance costs)
0.028 0.028 0.028 0.022 0.022 0.022 0.028 0.022 5.3% 4.4% 3.9% 4.4% 3.6% 3.1% 3.7% 3.1%
Bus purchase 0.076 0.145 0.172 0.061 0.120 0.161 0.172 0.161 14.3% 22.7% 24.3% 12.3% 19.6% 23.0% 22.9% 22.5%
Bus maintenance cost (labour and parts) 0.079 0.088 0.095 0.069 0.076 0.079 0.095 0.079 15.0% 13.7% 13.4% 13.8% 12.4% 11.4% 12.7% 11.1%
Fuel cost 0.117 0.149 0.186 0.116 0.167 0.208 0.227 0.223 22.1% 23.3% 26.2% 23.4% 27.1% 29.7% 30.2% 31.3%
Labour (bus operators & administrative) & training (all personnel) costs
0.229 0.229 0.229 0.229 0.229 0.229 0.229 0.229 43.3% 35.9% 32.2% 46.0% 37.3% 32.7% 30.5% 32.0%
Total life-cycle costs (LCC) for discount rate at 12% 0.528 0.639 0.710 0.497 0.613 0.699 0.751 0.714 Total life-cycle costs (LCC) for discount rate at 6% 0.678 0.801 0.887 0.643 0.776 0.876 0.942 0.897 Total life-cycle costs (LCC) for discount rate at 0% 0.923 1.067 1.176 0.881 1.044 1.167 1.255 1.197 Total LCC (1,000$/bus) – discount rate at 12% 444 536 597 418 515 587 631 600 Total LCC (1,000$/bus) – discount rate at 6% 569 672 745 540 652 736 791 754 Total LCC (1,000$/bus) – discount rate at 0% 775 896 988 740 877 980 1,054 1,005
Note: *India with US fuel prices: Fuel prices assumed to be as in the US, with all else as in the Indian context. Percentage figures show proportion of each cost component as a percentage share of total LCCs for each bus configuration, at 12% discount rate.
5.3.1 LCCs for CNG-Std. versus CNG-LF versus CNG-LF/AC in the Indian
context
The total LCC of the CNG-LF/AC buses is 11% and 34% higher than that of the CNG-
LF and CNG-Std. buses, on a per-kilometre basis (and per-bus basis), at a discount

116
rate of 12% (Table 5.4). Although labor and training costs are the most important
component of overall LCC for all the CNG bus configurations, they are assumed to not
vary across these configurations; hence, the above LCC differentials are driven, in
decreasing order of importance, by the higher per-kilometre bus purchase, fuel and
maintenance cost, for the CNG-LF/AC relative to the CNG-LF and CNG-Std. buses.
Fuel costs per-kilometre for the CNG-LF/AC buses are 25% and 59% higher, and
maintenance costs 8% and 20% higher relative to those for the CNG-LF and CNG-Std.
buses (Table 5.4); the higher fuel costs reflect the significantly lower fuel economy of
the low-floor buses (Table 5.3). The most important components of overall LCC, after
labor and training, are fuel, bus purchase, maintenance and depot infrastructure costs,
for all three CNG bus configurations, except that maintenance costs marginally exceed
bus purchase costs for the CNG-Std. buses. The fuel and bus purchase costs account
for a progressively higher share of total LCC, when moving from CNG-Std. to CNG-LF
to CNG-LF/AC buses, again reflecting the significantly higher purchase costs and
poorer fuel economy of the low-floor buses. Correspondingly, bus maintenance and
labor costs account for a smaller share of total LCCs for the LF and LF/AC buses
relative to the CNG-Std. buses, even though, in absolute terms, the bus maintenance
costs are higher, and the labor and training costs are the same, for the CNG low-floor
buses relative to the CNG-Std. buses.
Table 5.5: Differential life-cycle costs, by bus type and cost category
India . India with US
fuel prices . Percentage difference of LCC of: CNG Std. CNG LF CNG LF/AC CNG LF/AC
vs. vs. vs. vs. over LCC of: Diesel Std. Diesel LF Diesel LF/AC Diesel LF/AC
Depot infrastructure (including operation and maintenance costs) 27.4% 27.4% 27.4% 27.4% Bus purchase 23.2% 20.6% 7.1% 7.1% Bus maintenance cost (labour and parts) 15.0% 15.6% 19.7% 19.7% Fuel cost 0.1% -10.6% -10.6% 1.4% Labour (bus operators & administrative) & training (all personnel) costs 0.1% 0.1% 0.1% 0.1%
Total life-cycle costs (LCC) for discount rate at 12% 6.2% 4.1% 1.6% 5.1% Total life-cycle costs (LCC) for discount rate at 6% 5.5% 3.1% 1.2% 5.0% Total life-cycle costs (LCC) for discount rate at 0% 4.7% 2.2% 0.8% 4.9%
Note: Figures here rounded based on Table 5.4 data, which reflects more precision than the three decimal digits displayed. See note in Table 5.4 and text for explanations of the India with US fuel prices case.
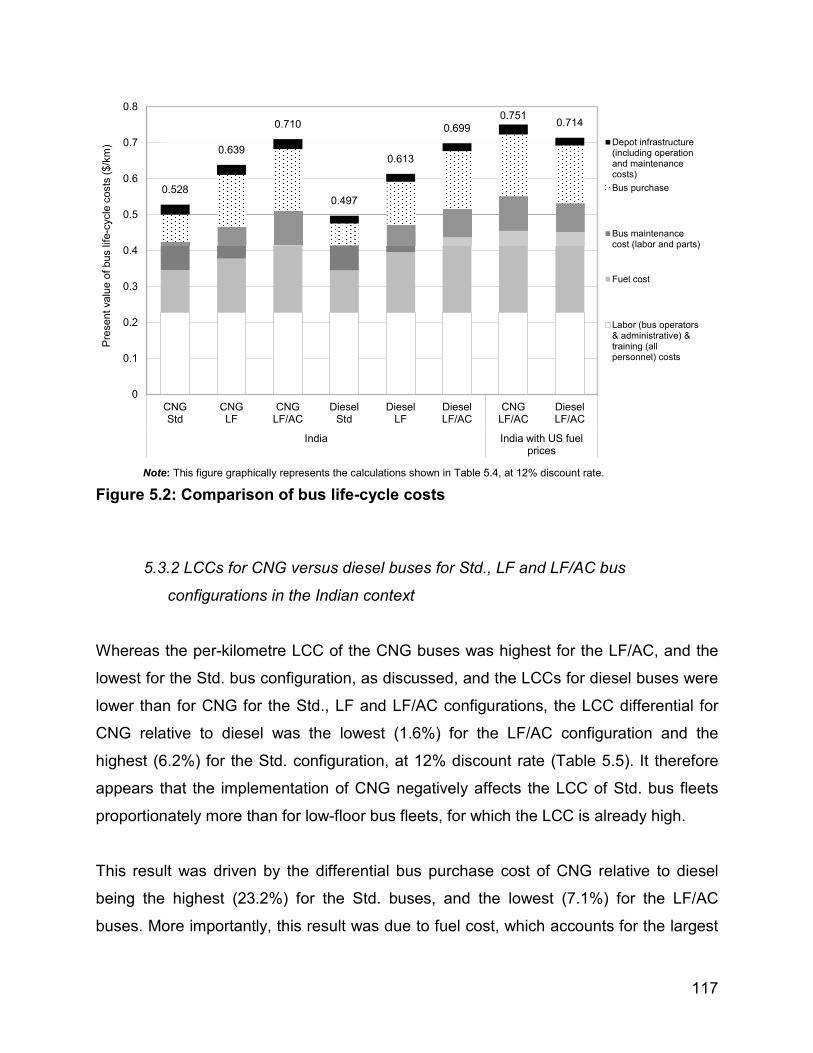
117
Note: This figure graphically represents the calculations shown in Table 5.4, at 12% discount rate.
Figure 5.2: Comparison of bus life-cycle costs
5.3.2 LCCs for CNG versus diesel buses for Std., LF and LF/AC bus
configurations in the Indian context
Whereas the per-kilometre LCC of the CNG buses was highest for the LF/AC, and the
lowest for the Std. bus configuration, as discussed, and the LCCs for diesel buses were
lower than for CNG for the Std., LF and LF/AC configurations, the LCC differential for
CNG relative to diesel was the lowest (1.6%) for the LF/AC configuration and the
highest (6.2%) for the Std. configuration, at 12% discount rate (Table 5.5). It therefore
appears that the implementation of CNG negatively affects the LCC of Std. bus fleets
proportionately more than for low-floor bus fleets, for which the LCC is already high.
This result was driven by the differential bus purchase cost of CNG relative to diesel
being the highest (23.2%) for the Std. buses, and the lowest (7.1%) for the LF/AC
buses. More importantly, this result was due to fuel cost, which accounts for the largest
0.528
0.639
0.710
0.497
0.613
0.6990.751 0.714
0
0.1
0.2
0.3
0.4
0.5
0.6
0.7
0.8
CNGStd
CNGLF
CNGLF/AC
DieselStd
DieselLF
DieselLF/AC
CNGLF/AC
DieselLF/AC
India India with US fuelprices
Pres
ent v
alue
of b
us li
fe-c
ycle
cos
ts ($
/km
) Depot infrastructure(including operationand maintenancecosts)Bus purchase
Bus maintenancecost (labor and parts)
Fuel cost
Labor (bus operators& administrative) &training (allpersonnel) costs

118
share of total LCC after labor and training, being 10.6% lower for CNG relative to diesel
for the LF and LF/AC configurations, and only 0.1% higher relative to diesel for the Std.
buses (Table 5.5). This effect, which is surprising, given that the fuel economy of CNG
buses is significantly lower than for diesel for all three configurations on an energy
equivalent basis, is mainly due to the energy equivalent CNG fuel price being only 56%
of the price of diesel, on average, over the most recent five-year period (2011-2015)
considered in our analysis30, and the fuel economy for CNG being 44% lower on the
Std. buses relative to diesel, while it was 38% lower on the low-floor buses (Table 5.3).
A key factor driving the total LCC differential for CNG relative to diesel being the lowest
(1.6%) for the LF/AC configuration and the highest (6.2%) for the Std. configuration, is
the fact that the differential bus purchase and fuel costs of the CNG buses relative to
diesel more than compensated for the differential maintenance costs for CNG relative to
diesel being the highest for the LF/AC buses, and the lowest for the Std. buses. Also,
note that maintenance costs account for a lower share of total LCC than do fuel cost
and even bus purchase cost, for the low-floor buses. Finally, note that the labor and
training costs (which account for the largest share of overall LCCs across the board)
were assumed to be the same for CNG and diesel, and so did not affect the LCC
differential for CNG relative to diesel for the three bus configurations. And while the
depot infrastructure cost was considerably higher (27.4%) for CNG relative to diesel
(Table 5.5), this cost category accounts only for a small share of the overall LCC (Table
5.4), and so did not substantially affect the LCC differential for CNG relative to diesel for
the three bus configurations.
5.3.3 LCCs of CNG and diesel LF/AC buses in India, with US fuel prices
Interestingly in this case, the total LCC for CNG LF/AC is as much as 5.1% higher than
for diesel, just due to using US fuel prices, as opposed to only 1.6% higher, with Indian 30 Actually, the CNG-to-diesel price ratio was lower, so the per-kilometre fuel costs would have been even more favourable for CNG relative to diesel than in the present case, in the previous five years (MyPetrolPrice.com, 2016); this shows how sensitive the LCC results are to fuel price (and fuel economy) variations, which is the reason for our sensitivity analysis related to these factors (reported in Section 5.3.4).

119
fuel prices (Tables 5.4 and 5.5, and Figure 5.2). This is because, while the fuel costs,
and their share of total LCC, go up because of the fuel prices being generally higher in
the USA than in India during 2011-15, which is the period over which the fuel prices
were used in the LCC estimations for all the cases we evaluated, the fuel costs increase
more for CNG relative to diesel, because of the higher CNG-to-diesel fuel price ratio in
the USA relative to India (Figure 5.3). Note that similar increases in total LCCs occur for
CNG relative to diesel for the Standard and low-floor bus configurations, when US
instead of Indian fuel prices are used.
Lastly, a note on the effect of using different discount rates -- as progressively lower
discount rates (6% and 0%) are used, instead of 12%, the recurring costs (related to
fuel, maintenance, and labor) and their shares in total LCC, progressively increase
relative to the front-end fixed costs (depot and bus purchase), and so does the total
LCC, for all of the cases (Table 5.4). Further, as the up-front costs, in terms of which
CNG has a disadvantage relative to diesel, become less predominant relative to the
recurring costs (which are only marginally higher for CNG, with the higher maintenance
costs for CNG being compensated for by its lower fuel costs, relative to diesel), the
differential total LCCs of the CNG bus configurations relative to their diesel counterparts
reduce, or, in other words, CNG becomes less uncompetitive relative to diesel in all
cases (Table 5.5). So, for example, whereas the total LCC for LF/AC buses is 1.6%
higher for CNG relative to diesel at 12% discount rate, it is 1.2% and 0.8% higher
respectively, at 6% and 0% discount rate. However, even at 0% discount rate, the total
LCC for the CNG bus configurations are higher than for their diesel counterparts.

120
Figure 5.3: CNG and diesel fuel prices and ratios, India and USA, 2002-2015
5.3.4 Sensitivity analysis
The previous section shows how various factors affect LCC in the different cases that
we considered. In particular, note that, while fuel costs account for a significant share of
total LCC across fuel systems and bus technologies, the component factors, namely,
fuel economy and fuel price, are subject to large variations, owing to operating
conditions, and market forces and government policy respectively. These variations
strongly affect fuel costs, and total LCC. Figure 5.3 shows the variations over time in the
CNG and diesel prices, and the CNG-to-diesel fuel price ratios in India, as opposed to
the USA, where fuel prices are more market-driven. Indeed, fuel costs were a key
contributor to the differential in total LCC for CNG relative to diesel being lower for the
LF and LF/AC than for the Std. buses.
It is for these reasons that we conducted a sensitivity analysis to investigate how the
fuel economy and fuel price of CNG relative to diesel would affect the LCC for these two
2002 2003 2004 2005 2006 2007 2008 2009 2010 2011 2012 2013 2014 2015India Diesel 0.74 0.78 0.91 1.03 1.05 0.95 0.97 0.83 0.88 0.88 0.85 0.89 0.92 0.75India CNG 0.45 0.43 0.42 0.46 0.44 0.43 0.39 0.37 0.41 0.50 0.51 0.53 0.43 0.42USA Diesel 0.43 0.47 0.53 0.66 0.79 0.79 1.07 0.68 0.79 0.98 1.00 0.98 0.95 0.70USA CNG 0.42 0.44 0.49 0.55 0.63 0.59 0.62 0.52 0.56 0.59 0.59 0.59 0.58 0.58India Ratio 0.61 0.56 0.46 0.44 0.42 0.45 0.40 0.45 0.46 0.57 0.60 0.60 0.47 0.57USA Ratio 1.00 0.93 0.93 0.84 0.79 0.75 0.59 0.76 0.71 0.60 0.59 0.60 0.61 0.83
0
0.2
0.4
0.6
0.8
1
1.2
CN
G-d
iese
l pric
e ra
tio =
(C
NG
pric
e)* ÷
(Die
sel p
rice)
*
* Fuel prices in the data table and for the graphs are on an energy equivalent basis, and inflation adjusted. Diesel prices shown are USD/L diesel. CNG prices are USD/L diesel energy equivalent.Source: India: MyPetrolPrice.com (2016); USA: EERE (2016).
USA
India
Fuel
Pric
es*

121
fuel systems. The results of these sensitivity analyses are depicted in Figures 5.4a and
5.4b, which show the ratio of the present value of LCC for diesel relative to CNG (at
12% discount rate in both cases) plotted against the ratio of fuel economy for CNG
relative to diesel (in Figure 5.4a), and against the ratio of the energy equivalent fuel
price of CNG relative to diesel (in Figure 5.4b), for both Std. and LF/AC buses in India.
(a) Impact of CNG-to-diesel fuel economy ratio
(b) Impact of CNG-to-diesel fuel price ratio
Figure 5.4: Sensitivity of LCC to fuel economy and fuel price in India
In both Figures 5.4a and 5.4b, the horizontal dashed line represents a diesel-to-CNG
LCC ratio of 1, meaning that CNG is more competitive relative to diesel above, and less
so below, the line, in terms of LCC. Further, in Figure 5.4a, we show two vertical lines,
representing the CNG-to-diesel fuel economy ratio of 0.56 and 0.62 for the Std. and
LF/AC buses respectively (as in Table 5.3), for reference. Similarly, in Figure 5.4b, the
three vertical lines represent a CNG-to-diesel fuel price ratio of 0.40, 0.56 and 0.61,
being respectively the lowest level of this ratio (which occurred in Delhi in 2008), the
average over the most recent five year period (2011-15), which we have used in our
analysis throughout, and the highest level of this ratio (recorded in Delhi in 2002).
As is evident from Figures 5.4a and 5.4b, the current values of CNG-to-diesel fuel
economy and fuel price ratios are much closer to what these ratios need to be for CNG
0.56 0.62 0.6
0.7
0.8
0.9
1.0
1.1
0.2 0.4 0.6 0.8 1.0 1.2
LCC
Rat
io =
(Die
sel
LCC
PV)
÷(C
NG
LC
C P
V)
Fuel Economy Ratio (CNG FE ÷ Diesel FE)
(1) (2)
Break-even FE Ratio:LF/AC: 0.66Standard:0.76
stan
dard
LF/A
C
LF/AC buses
Standard buses
0.40 0.56 0.61
0.7
0.8
0.9
1.0
1.1
1.2
0.2 0.4 0.6 0.8 1.0 1.2
LCC
Rat
io =
(Die
sel L
CC
PV)
÷(C
NG
LC
C P
V)
Fuel Price Ratio = CNG price ÷ Diesel price
Break-even fuel price ratio:LF/AC: 0.52Standard: 0.41
Standardbuses
LF/AC buses
(1) (2) (3)

122
to become competitive with diesel, for LF/AC buses than for Std. buses. Secondly, note
that the fuel economy has to be much higher for CNG -- and the energy equivalent fuel
price much lower for CNG -- relative to diesel, for CNG to be competitive with diesel in
terms of LCC on Std. as opposed to on LF/AC buses. At the same time, however, the
diesel-to-CNG LCC ratio increases somewhat more steeply as the CNG-to-diesel fuel
economy ratio increases, and decreases somewhat more steeply as the CNG-to-diesel
fuel price ratio increases for LF/AC than for Std. buses. In other words, the
competitiveness of CNG relative to diesel is more sensitive to the CNG-to-diesel fuel
economy and fuel price ratios on LF/AC than on Std. buses. These results reflect our
earlier points that a) the share of fuel costs in total LCC is higher for the LF buses than
on the Std. buses (and the highest for the LF/AC buses); and b) because the total LCC
is already higher for the LF buses relative to Std. buses, the implementation of CNG
affects total LCC less on the LF buses than it does on Std. buses.
Finally, Figures 5.5a and 5.5b show the sensitivity of these results to the discount rate;
specifically, how the results depicted in Figures 5.4a and 5.4b are affected when using a
0% as opposed to a 12% discount rate. These figures show that the break-even fuel
economy ratio was reduced, and the break-even fuel price ratio was increased, for both
the Std. and LF/AC bus configurations, as a result of a 0% discount rate being chosen
instead of a 12% discount rate. This means that CNG can be competitive with diesel in
terms of LCC at a lower fuel economy, and at a higher fuel price, relative to diesel, the
lower the discount rate that is selected. Also note that the break-even fuel economy and
fuel price ratios are affected more for the Std. bus relative to the LF/AC bus, and that,
correspondingly, the difference in these break-even ratios for these two bus
configurations narrows, when a 0% rather than a 12% discount rate, is chosen. As
discussed in the previous section, these effects are because of the much higher up-front
capital costs of the LF/AC buses, which are not affected by the discount rate;
meanwhile, the recurring costs, which are proportionally more predominant, as a share
of the total LCCs, in the case of the Std. buses (relative to the LF/AC buses), become
even more so when the discount rate is 0% as opposed to 12%.

123
(a) Impact of CNG-to-diesel fuel economy ratio
(b) Impact of CNG-to-diesel fuel price ratio
Figure 5.5: Sensitivity of LCC to fuel economy and fuel price – effect of discount rate
5.4 Conclusions, limitations, and implications
First of all, it is important to reiterate that this paper, which analyses the life-cycle
(capital, operating and maintenance) costs of various CNG urban bus configurations,
over their service life, relative to their diesel counterparts in India, and key factors that
influence these costs, is intended to be an input into decision-making regarding the
implementation of CNG buses for mitigating urban air pollution, in concert with an
assessment, which this paper does not address, of the environmental and health
benefits of CNG. As noted in our Introduction, the assessment of the environmental and
health benefits of CNG will require a comprehensive and detailed modeling of emissions
of health-critical air pollutants and greenhouse gases, related to the various CNG bus
configurations, over their service life, relative to their diesel counterparts. This modeling
exercise will need to consider the emission control characteristics of the various bus
configurations and fuel quality standards, and real-life operating conditions and other
factors. Further, a monetary valuation of the benefits associated with the emissions
effects in terms of key health-critical air pollutants and greenhouse gases will be
needed, for weighing against the life-cycle costs arrived at in this paper, to conduct an
0.6
0.7
0.8
0.9
1.0
1.1
1.2
0.2 0.4 0.6 0.8 1.0 1.2
LCC
Rat
io =
(Die
sel
LCC
PV)
÷(C
NG
LC
C P
V)
Fuel Economy Ratio (CNG FE ÷ Diesel FE)
Changes in break-even fuel economy ratio, when Discountrate is changed from 12% to 0%LF/AC: From 0.66 to 0.64Std.: From 0.76 to 0.68
LF/AC buses
Std. buses
Discount rate = 12%Discount rate = 0%
0.6
0.7
0.8
0.9
1.0
1.1
1.2
0.2 0.4 0.6 0.8 1.0 1.2
LCC
Rat
io =
(Die
sel L
CC
PV)
÷(C
NG
LC
C P
V)
Fuel Price Ratio = CNG price ÷ Diesel price
Changes in break-even fuel price ratio, when Discount rateis changed from 12% to 0%LF/AC: From 0.52 to 0.54Std.: From 0.41 to 0.46 Std.
buses
LF/ACbuses
Discount rate = 12%Discount rate = 0%

124
analysis to inform decision-making within a cost-benefit framework (alternatively, this
analysis may be conducted within a cost-effectiveness, or a multi-criteria decision-
making, framework).
Our study shows that the significantly higher life-cycle cost (LCC) of the CNG-LF/AC
relative to that of the CNG-LF and in particular the CNG-Std. buses is driven by higher
bus purchase, followed by fuel and maintenance costs for the LF/AC relative to the LF
and Std. buses. The bus purchase and fuel costs account for a progressively higher
share of total LCC, when moving from CNG-Std. to CNG-LF to CNG-LF/AC buses, with
the fuel costs reflecting the significantly poorer fuel economy of the low-floor buses.
The LCCs for diesel are lower than for CNG for all three bus configurations, but
implementation of CNG negatively affects the LCC of Std. bus fleets proportionately
more than for the low-floor bus fleets, for which the LCC is already high. At the same
time, whereas replacing diesel with CNG on air-conditioned low-floor buses would
increase LCC by only around 1.6%, the LCC of CNG-LF/AC buses is 16% higher than
for diesel low-floor and as much as 43% higher than for standard diesel buses; and that
of even (non air-conditioned) CNG-LF buses is around 4% higher than for their diesel
counterparts, and 29% higher than for standard diesel buses. Finally, the LCC of diesel
LF/AC buses is 14% higher than for diesel low-floor buses, and as much as 41% higher
than for standard diesel buses.
While decision-making regarding CNG implementation for mitigating urban air pollution
will need to consider its life-cycle costs as well as its environmental and health benefits,
as already noted, the significantly higher LCCs for the low-floor and low-floor air-
conditioned buses, even for diesel, raises the questions of whether these buses are
justified by increased patronage, especially by those who would otherwise use personal
motor vehicles, and how they affect transit supply, and affordable transit service.
Our sensitivity analysis shows the significant effect of CNG and diesel fuel price (and
fuel economy), on the LCCs of CNG relative to diesel. Both diesel and CNG prices, and

125
the CNG-to-diesel price ratio, are lower in India relative to the USA, where these prices
are more market-driven. The LCCs for CNG would be much higher relative to diesel for
all the bus configurations in our study, if the CNG-to-diesel fuel price ratio were higher,
as in the USA. The wide variations in CNG and diesel prices, and their critical
importance for life-cycle costs and the competitiveness of CNG, demonstrate the need
for careful fuel pricing policies when CNG is implemented in public bus transit.
126
Chapter 6: Cost-effectiveness of CNG implementation in the public bus transit fleet in Delhi
Chapter overview
In Chapter 6, I draw from the results and insights from the previous analytical chapters,
and address the broader overarching question of this dissertation, regarding the
desirability of CNG implementation in urban bus fleets in Delhi, and India. Specifically,
(i) I investigate if CNG implementation was a cost-effective choice when it was
mandated by the Supreme Court, and (ii) if CNG still makes sense today, given the
vehicle and emissions technologies currently available. To address these two questions,
I use cost-effectiveness (CE) analysis and scenario analysis. Data for this research was
drawn from the life-cycle costs in Chapter 5, while emissions data that is applicable to
Indian operating conditions, and specific to each vehicle and fuel technology, was
drawn from various published and expert sources. The CE analysis was done by
calculating the ratio of cost differences for CNG compared to Diesel over the emissions
difference (for Diesel vs. CNG), for Standard and LF bus types. This analysis was also
conducted for CNG LF versus Diesel Standard buses, which some cities may consider,
and for Diesel Standard buses conforming to the most recent emissions norms.
Emissions were estimated for key air pollutants affecting human health (PM and NOX)
and for climate change inducing greenhouse gases (CO2, CH4, BC).
6.1 Introduction
In the 30-year period, from 1986 to 2016, Delhi's motor vehicle fleet grew 11x, while its
road infrastructure kilometres grew only about 2x, and today the city has a fleet of more
than 9 million vehicles, including motorcycles (GNCTD, 2017). As discussed in previous
chapters, this rapid motorization has produced a range of negative impacts, amongst
which a special cause for concern is poor air quality and related risks to human health.
Given this challenge, various policy actions have been taken over the years by the
Indian and Delhi governments to mitigate transport emissions. Delhi being the national

127
capital, and given its serious air quality problems, many of these policies were first
implemented there, as discussed in Chapter 4, including the Supreme Court of India
ruling in 1998 that mandated the use of compressed natural gas (CNG) in its public
vehicle fleet.
Estimates of the impact in Delhi of CNG policy and retirement of diesel buses on
emissions in the early 2000s, suggest that these effects were mixed, for example, with
CO and SO2 experiencing a significant decline, but PM10 levels only marginally
decreasing, while NOX levels actually increased after conversion (Kathuria, 2005; Jalihal
& Reddy, 2006; Reynolds & Kandlikar, 2008; Kumar & Foster, 2009). Moreover, after
2005, PM10 ambient concentrations in Delhi increased steadily and steeply (CPCB,
2012). A recent activity-based emissions inventory for Delhi shows transport sector
contributions of 17% for PM2.5, 13% for PM10, 2% for SO2, 53% for NOX, 18% for CO,
and 51% for VOC; with the bulk of transport PM2.5 emissions (i.e., >50%) originating
from heavy-duty and light-duty trucks (Guttikunda & Goel, 2013). From a public health
perspective, PM2.5, NOX, SO2 and O3 emissions are critical since high level of exposure
to these pollutants are associated with elevated risk of human respiratory and
cardiovascular morbidity and mortality. PM2.5 ambient levels are significantly higher in
Delhi than local ambient air quality standards stipulate (Kumar et al., 2017), exposure to
which is estimated to contribute to 7,350-16,200 premature deaths every year in the city
(Guttikunda & Goel, 2013). From a broader perspective, it should be recognized that a
fuel mandate such as CNG, while motivated by the desire to improve local air quality,
might also allow other environmental goals to be achieved, such as reductions in
climate change impacts. In this regard, the combustion of fossil fuels releases criteria air
pollutants, greenhouse gases, and aerosols, and some pollutants like PM have both
health as well as climate effects (Reynolds & Kandlikar, 2008). Therefore, there is great
importance in also evaluating the effectiveness of lowering climate-forcing emissions
resulting from policies such as CNG in Delhi, in addition to air pollutants affecting
human health.

128
From a transport perspective, the challenge with evaluating the effectiveness of a policy
like CNG, as pointed out by Kathuria (2005), is that a wide range of factors, apart from
vehicle and fuel technology, influences air pollution. For example, factors can include
vehicle mix on roads, operating conditions, fuel quality on other vehicles, and traffic
congestion, all of which change over time. Also important in evaluating emissions
effectiveness is the rapidly growing motorization activity that Delhi continues to
experience, which is outpacing growth in road infrastructure capacity, as noted above,
and the fact that commuters have been shifting trips away from public transit and
towards personal motor vehicles. So, notwithstanding improved fuel quality and CNG
use, the fact is that any potential contribution to improved air quality in Delhi from these
and other measures may be likely being offset by the rapid increase in motor vehicle
activity (Narain & Krupnick, 2007). From this perspective, since emissions outcomes are
dependent on not only characteristics of CNG technology but also a host of other
factors, the evaluation of fuel policy effectiveness should, as far as possible, account for
these factors that also affect emissions outcomes.
Specifically considering the evaluation of CNG policy outcomes in Delhi, as far as public
bus transit is concerned, there are some interesting issues and evidence worth
highlighting. For instance, Reynolds and Kandlikar (2008) argue that the use of CNG in
buses in Delhi resulted in a 20% reduction in carbon dioxide (CO2) equivalent emissions
relative to diesel on the same buses, if aerosols such as black carbon (BC), organic
carbon (OC), and sulphur dioxide (SO2) are included in the emissions analysis. This
means that there are potentially positive contributions from CNG implementation on
Delhi’s buses, not only in terms of mitigating air pollution and health impacts, but also in
terms of mitigating GHG emissions and climate change impacts, since PM contributes
to both effects.
While studies that have evaluated CNG in bus systems using CE analysis are limited, a
few references are worth mentioning (Rabl, 2002; Cohen et al., 2003). Furthermore,
there is a limited number of academic studies that have considered both emissions
outcomes and costs of fuel policies in countries such as India. For the particular case of

129
the implementation of CNG as an alternative fuel on the public bus fleet in Delhi, as
discussed in Chapter 4, studies have mainly focused on quantifying emissions
performance, which are of course important, but have not considered financial and
operational dimensions. So, there is an important contribution to knowledge that can be
made by evaluating the outcomes of Delhi's CNG policy using a CE framework that
integrates the LCCs of CNG implementation with the existing emissions performance
research. Indeed, this was the reason for the research on operational and financial
performance in Chapter 4, and for the quantification of life-cycle costs in Chapter 5.
Objective To further contribute to this important policy-analytic
objective, I evaluate the CE of the implementation of CNG on past and current CNG bus
technologies relative to diesel, by comparing the related life-cycle costs against their
respective emissions outcomes. Overall, this study addresses two major questions.
Firstly, it investigates the CE of CNG implementation in the public bus fleet in Delhi, by
evaluating the costs and emissions performance of buses that were used in the
conversion to CNG in the early 2000s in that city. Secondly, for Delhi, but also more
broadly the entire Indian context, this study analyzes the merit of CNG implementation
in a public bus fleet today considering that CNG and diesel buses must comply with
stricter Indian emissions standards. Therefore, for this research I specifically analyze
the CE of Standard, Low-floor and Low-floor AC CNG buses, relative to diesel. Costs
are evaluated based on the life-cycle calculations for these bus types in Chapter 5,
while emissions effectiveness is evaluated in terms of critical pollutants affecting human
health (PM and NOX emissions), and also climate change impacts in terms of CO2
equivalent emissions (the rationale for having focused on these pollutants will be
discussed in Section 6.2.2, below).

130
6.2 Analytic framework, methods and data
6.2.1 Bus and fuel technologies evaluated
In terms of the buses and fuel technologies that were evaluated in the CE analysis31,
while the focus is on comparing CNG to diesel buses, the challenge is that over time,
diesel buses have had a lowered emissions profile, given more stringent vehicle and
emissions standards, the improvement in diesel quality (e.g., with use of lower sulphur
diesel), and the possibility of use of engine and exhaust aftertreatment devices, as
discussed in Chapter 3. These issues were accounted for in the analysis by considering
CNG buses, but also cleaner diesel buses, relative to the diesel buses that were
replaced by CNG. Furthermore, for current bus and fuel technologies, I focus on like-to-
like buses for comparison; for example, CNG-LF buses were compared to Diesel-LF
buses, which comply with the most recent emissions standards in India. The different
types of diesel buses to which various CNG and cleaner diesel buses are being
compared to (i.e., diesel buses that are the basis of comparison), will be termed,
hereafter, as “baseline” diesel buses.
The cost data for the CE analysis was based on DTC for the Standard CNG (CNG-
Std.), Low-floor CNG (CNG-LF) and Low-floor AC CNG (CNG-LF/AC) buses, as in
Chapter 532. For comparable diesel buses in India, I use operational and cost
performance data related to the diesel bus fleets in Bangalore, Chennai and Mumbai, as
justified in Chapter 5. Thus, the CNG and diesel bus technologies analyzed reflect those
operated by the largest public transit fleets in the major metropolitan areas of India; and
the analysis is based on actual on-road CNG and diesel bus performance in these
areas. Please see Table 5.1 (p.106) for a summary of the key vehicle and engine
characteristics of buses analyzed in this chapter. 31 Note that a detailed discussion of the CE analytic framework is presented in Section 6.2.2, below. 32 While DTC is not the only operator in Delhi, as noted in Chapter 4, it operates roughly 50-60% of Delhi's public urban bus transit fleet. The DMRC (Delhi Metro Rail Corp.) and a cluster scheme of privately owned operators run the remainder of Delhi's public bus fleet, for which their technological choices largely mirror the technologies and standards currently in use at DTC. For this reason, operational data and technological choices which are the basis of the evaluation for Delhi in this chapter are based on DTC, and analysis is done on a per-bus basis.

131
In addition to fuel and bus technology, emissions are also highly influenced by fuel
quality and standards, particularly for diesel vehicles. Over the years, India has adopted
an increasingly stringent phased vehicle and fuel emissions control program starting
with the Bharat Stage I (BS-I), equivalent to EURO-I (see Table C1, Appendix C). When
DTC adopted CNG, Delhi's National Capital Region was transitioning from BS-I to BS-II
emission standards, though most of India was only bound by the BS-I standard. Several
cities in India33, including many large metropolitan areas, started to comply with the BS-
IV emission standard in 2010, while the rest of the country finished the transition to the
BS-IV standard only in 2017, equivalent to the EURO-IV standard. BS-IV diesel34 has a
lower sulphur content than its predecessor BS-III35 (SIAM, 2013). Table C1 (Appendix
C) details heavy-duty diesel and CNG engine emissions standards in India and the
European Union for comparative purposes.
So, for the CE analysis, I grouped the buses according to the emission standards
pertinent to the period when buses were in operation. In the case of DTC, CNG-Std.
buses replaced Diesel-Std. in the early 2000s, when vehicles complied with Bharat
Stage I or II emission standards (BS-I; BS-II). So, CNG-Std. and Diesel-Std. buses are
evaluated in terms of BS-I or II compliant vehicles, and used in the CE analysis in order
to address the first research objective of evaluating the effectiveness of the CNG policy
as carried out in early 2000s. Also, I considered the next generation of diesel buses,
which would have complied in the early 2000s with the next phase of emission standard
in India, BS-III (see Table C1, Appendix C).
Finally, towards 2007-08, DTC started replacing the ageing fleet of CNG-Std. buses
with low-floor CNG buses. Of these low-floor buses, approximately 80% were non-air-
33 Delhi (NCR), Mumbai, Kolkata, Chennai, Bengaluru, Hyderabad, Ahmedabad, Pune, Surat, Kanpur, Lucknow, Sholapur, Jamshedpur, Agra, Puducherry, Mathura, Vapi, Jamnagar, Ankaleshwar, Hissar and Bharatpur (Guttikunda & Mohan 2014). 34 Maximum sulphur content of 50 ppm; minimum cetane number of 51; fuel density of 820 to 845 kg/m3 (SIAM, 2013). 35 Maximum sulphur content of 350 ppm; minimum cetane number of 51; fuel density of 820 to 845 kg/m3 (SIAM, 2013).

132
conditioned and 20% were air-conditioned (Chapter 4). Given the period that the low-
floor buses were purchased at DTC, the buses complied with BS-III or BS-IV standards.
So, BS-III and IV compliant CNG-LF and CNG-LF/AC buses -- as well as their diesel
counterparts -- were assessed to address the second research question, that is, to
verify if there are any significant changes in CE with adoption of more stringent fuel and
vehicle standards in India and evaluate the merits of continuing to pursue a natural gas
policy today.
6.2.2 Cost-effectiveness analysis
As pointed out by Boardman et al. (2001), a key reason for using CE analysis is when
difficulty is involved in monetizing policy impacts (e.g., health impacts). For this reason,
CE analysis has been widely used in the evaluation of emissions effectiveness of
alternative fuel policies in transport (Kok et al., 2011; Browne & Ryan, 2011) and in
evaluating health impacts of vehicle emissions (Cohen et al., 2003). This was the
motivation in choosing the CE analysis framework for evaluating CNG implementation in
Delhi's public buses in this study.
To analyze CNG implementation in Delhi’s public bus fleet, I calculate the incremental
CE ratio of CNG over diesel buses. I base the CE analysis on a dollars-per-avoided
emissions basis, as described in Boardman et al. (2001), Kok et al. (2011), and Browne
and Ryan (2011). In calculating the CE ratio, as shown in equation (1) below, the
numerator of the CE ratio reflects the incremental life-cycle costs (LCCs) of CNG over
diesel, based on life-cycle costs of CNG and diesel buses from Chapter 5. The
denominator of the CE ratio reflects the incremental emissions reductions for CNG
relative to diesel, based on the emissions differences of diesel buses over CNG buses
in India. Emissions impacts were measured separately, in terms of health critical
pollutants PM and NOX, and in terms of global warming potential, CO2 equivalent
emissions (CO2(e)), as justified below.

133
The CE ratio to evaluate different types of CNG buses, CECNG, is defined as:
𝐶𝐶𝐶𝐶𝐶𝐶𝐶𝐶𝐶𝐶 = 𝐿𝐿𝐶𝐶𝐶𝐶𝐶𝐶𝐶𝐶𝐶𝐶−𝐿𝐿𝐶𝐶𝐶𝐶𝐷𝐷𝐷𝐷𝐷𝐷𝐷𝐷𝐷𝐷𝐷𝐷𝐸𝐸𝐸𝐸𝐸𝐸𝐸𝐸𝐸𝐸𝐸𝐸𝐸𝐸𝐶𝐶𝐸𝐸𝐷𝐷𝐷𝐷𝐷𝐷𝐷𝐷𝐷𝐷𝐷𝐷−𝐸𝐸𝐸𝐸𝐸𝐸𝐸𝐸𝐸𝐸𝐸𝐸𝐸𝐸𝐶𝐶𝐸𝐸𝐶𝐶𝐶𝐶𝐶𝐶
(1)
where LCCCNG or Diesel is the present value of life-cycle costs (in $-per-bus) of a particular
type of CNG or diesel bus -- Standard or Low-floor. EMISSIONSCNG or Diesel, refers to the
total amount of emissions (in grams or kilograms) of a particular type of pollutant (PM,
NOX, or CO2(e)) over the entire service life of a particular bus type (CNG or diesel; Std.
or LF). Therefore, the CE ratio reflects the incremental cost of a CNG bus over diesel
per gram of avoided emissions, considering the vehicle's entire service life (i.e., $ per
gram, per bus). The smaller the CE ratio is, the more emissions reductions can be
accomplished at a lower incremental cost, for a particular option; while a negative CE
ratio indicates that CNG costs more and also increases emissions in relation to the
diesel buses it is being compared to (positive numerator and negative denominator).
Table 6.1 discusses the various possibilities and likelihood of various potential CE ratio
outcomes.
Table 6.1: Potential CE ratio outcomes Outcome of CE ratio CE ratio breakdown Likelihood of case Positive IF:
𝐿𝐿𝐶𝐶𝐶𝐶𝐶𝐶𝐶𝐶𝐶𝐶 > 𝐿𝐿𝐶𝐶𝐶𝐶𝐷𝐷𝐷𝐷𝐷𝐷𝐷𝐷𝐷𝐷𝐷𝐷 AND: 𝐶𝐶𝐸𝐸𝐸𝐸𝐸𝐸𝐸𝐸𝐸𝐸𝐸𝐸𝐸𝐸𝐸𝐸𝐷𝐷𝐷𝐷𝐷𝐷𝐷𝐷𝐷𝐷𝐷𝐷 > 𝐶𝐶𝐸𝐸𝐸𝐸𝐸𝐸𝐸𝐸𝐸𝐸𝐸𝐸𝐸𝐸𝐸𝐸𝐶𝐶𝐶𝐶𝐶𝐶
Expected, since LCC for CNG buses are greater than diesel buses (Chapter 5), and CNG is expected to show emissions reductions of critical pollutants, which is the reason for its implementation.
IF: 𝐿𝐿𝐶𝐶𝐶𝐶𝐶𝐶𝐶𝐶𝐶𝐶 < 𝐿𝐿𝐶𝐶𝐶𝐶𝐷𝐷𝐷𝐷𝐷𝐷𝐷𝐷𝐷𝐷𝐷𝐷
AND: 𝐶𝐶𝐸𝐸𝐸𝐸𝐸𝐸𝐸𝐸𝐸𝐸𝐸𝐸𝐸𝐸𝐸𝐸𝐷𝐷𝐷𝐷𝐷𝐷𝐷𝐷𝐷𝐷𝐷𝐷 < 𝐶𝐶𝐸𝐸𝐸𝐸𝐸𝐸𝐸𝐸𝐸𝐸𝐸𝐸𝐸𝐸𝐸𝐸𝐶𝐶𝐶𝐶𝐶𝐶
Unlikely, since information from previous chapters shows no cases where CNG LCC is less than diesel LCC. Though, as shown in Chapter 3, and will be shown below, there are particular pollutants that are emitted more by CNG buses than diesel buses.
Negative IF: 𝐿𝐿𝐶𝐶𝐶𝐶𝐶𝐶𝐶𝐶𝐶𝐶 > 𝐿𝐿𝐶𝐶𝐶𝐶𝐷𝐷𝐷𝐷𝐷𝐷𝐷𝐷𝐷𝐷𝐷𝐷
AND: 𝐶𝐶𝐸𝐸𝐸𝐸𝐸𝐸𝐸𝐸𝐸𝐸𝐸𝐸𝐸𝐸𝐸𝐸𝐷𝐷𝐷𝐷𝐷𝐷𝐷𝐷𝐷𝐷𝐷𝐷 < 𝐶𝐶𝐸𝐸𝐸𝐸𝐸𝐸𝐸𝐸𝐸𝐸𝐸𝐸𝐸𝐸𝐸𝐸𝐶𝐶𝐶𝐶𝐶𝐶
Possible, since it is expected that the numerator is positive, as per above; nonetheless, there are particular pollutants that are emitted more by CNG buses than diesel buses (negative denominator), as discussed.
IF: 𝐿𝐿𝐶𝐶𝐶𝐶𝐶𝐶𝐶𝐶𝐶𝐶 < 𝐿𝐿𝐶𝐶𝐶𝐶𝐷𝐷𝐷𝐷𝐷𝐷𝐷𝐷𝐷𝐷𝐷𝐷
AND: 𝐶𝐶𝐸𝐸𝐸𝐸𝐸𝐸𝐸𝐸𝐸𝐸𝐸𝐸𝐸𝐸𝐸𝐸𝐷𝐷𝐷𝐷𝐷𝐷𝐷𝐷𝐷𝐷𝐷𝐷 > 𝐶𝐶𝐸𝐸𝐸𝐸𝐸𝐸𝐸𝐸𝐸𝐸𝐸𝐸𝐸𝐸𝐸𝐸𝐶𝐶𝐶𝐶𝐶𝐶
Unlikely, since information from previous chapters shows no cases where CNG LCC is less than diesel LCC.

134
In addition to the CE analysis, I also used scenario analysis to evaluate the broader
impact of the CNG implementation in Delhi’s public bus fleet. In the scenario approach, I
considered emissions reductions due to CNG, given the potential impact of higher life-
cycle costs on public bus transit supply. It may be expected that, in this case, supply
constraints in the number of public buses using CNG affect the overall effectiveness of
the emissions reductions, since travel demand may have to be satisfied by other types
of transport modes and vehicles other than CNG buses, including conventional diesel
buses -- if these are permitted to operate -- and other lower capacity vehicles.
In the sub-sections bellow I detail, discuss, and justify various aspects of these analytic
methods.
Life-cycle costs To estimate CNG incremental costs over diesel in the
CE numerator (Equation 1), I used bus life-cycle costs over a uniform 12-year period
(70,000 km per year) based on the LCC model results in Chapter 5. However, LCCs
presented in Table 6.2 are exclusively in US dollars ($) per bus using a 12% discount
rate, and includes a minor adaptation, in that, diesel and CNG low-floor bus LCCs in
Table 6.2 are calculated using the LCC cost results for LF and LF/AC CNG and diesel
buses from Table 5.4 (Chapter 5), and assuming a fleet that is 80% LF buses and 20%
LF/AC buses; this fleet profile assumption approximately reflects DTC's current
structure of low-floor buses as discussed.

135
Table 6.2: Present value of bus LCCs, $-per-bus, 12-yr service life, 12% disc.rate Vehicle Id.
no. Fuel type Bus type Emission Standard Capital(a) Operating(b) Total LCC 1 Diesel Std. BS-I/II 70,008 347,696 417,704 2 Diesel Std. BS-III/IV 73,194(c) 358,453(d) 431,647 3 Diesel LF(e) BS-III/IV 126,352 403,256 529,608 4 CNG Std. BS-I/II 87,037 356,735 443,771 5 CNG LF(e) BS-III/IV 149,960 398,454 548,414
Source: LCC model in Chapter 5 (see Table 5.4); converted from $/km to $/bus using 70,000 annual vehicle kilometres for 12 years of service life.
a Capital Costs = Depot infrastructure + Bus purchase. b Operating Costs = Bus maintenance (labour and parts) + Fuel + Labour (bus operators & administrative) and training. c Capital costs estimated from LCC model for Diesel Std. (BS-I/II), but with bus purchase being 6.18% higher; this
percentage is 2x the added purchase cost (to be conservative) of an EURO III/IV bus over an EURO II/III bus, as reported in Miller et al. (2017).
d Operating costs estimated from LCC model for Diesel Std. (BS-I/II), but with diesel price being 11% higher to account for the added refining cost of diesel with lower Sulphur content; this estimate was taken from TERI (2002).
e LCCs for LF is the average LCCs of a fleet consisting of 80% non-AC LF buses (i.e., LF bus in Table 5.4 terminology) and 20% LF/AC buses from Table 5.4.
Choice of air pollutants The CE analysis centers on two critical aspects of
vehicle exhaust emissions: first, on human health effects, and secondly, on climate
change effects. I focus on PM and NOX for their implications for health risks, while
leaving out SO2 and O3, since O3 is a secondary pollutant and SO2 from transport is
relatively small (only 2% of total emissions for this pollutant according to Guttikunda and
Goel, 2013) and plus, diesel sulphur has reduced drastically with more stringent
emissions standards. At the same time, I also consider CO2, CH4 and BC emissions, as
these are GHGs with global warming potential, but also with important health impacts.
In terms of PM emissions, many studies do not use fine (PM2.5) or ultrafine (PM0.1)
fraction size particulate matter, which are generally more relevant in terms of negative
health outcomes. For example, Cohen et al. (2003) do not make any distinction
between PM or PM2.5 emissions, as they argue that the bulk of transport PM emissions
is comprised of PM2.5. This argument is also presented in ARAI (2008). So, in the
absence of substantial data on fine or ultrafine particulate matter emissions in the Indian
context, I use PM data that was available, as a proxy for PM2.5 emissions. For bus
emission factors reported in Table 6.4, the data is in PM2.5 terms, but this is not the case
for lower occupancy vehicle PM emission factors in Table 6.5. In addition to PM and
NOX tailpipe emissions, black carbon (BC) was also evaluated since it is an important
component of PM and exposure to it is associated with probable human carcinogens

136
(Apte et al., 2011); moreover, BC is also an important climate-forcing agent (Bond &
Sun, 2005; Ramanathan & Carmichael, 2008).
Table 6.3: Choice of greenhouse gas equivalent emission pollutants Air Pollutant Diesel Buses CNG Buses CH4 Methane emissions from diesel buses
are very low1, and are not relevant for the CE analysis from a GHG perspective1,2,3.
Methane emissions from CNG buses are significant4. In addition, since leaked methane from CNG bus systems is an important contributor to total CO2(e) emissions3, methane leakage was incorporated into total methane emissions from CNG buses, as presented in Table 6.4 (below).
BC and OC
In the Indian context, approximately 76% of PM emissions are estimated to be BC, with the remainder being OC7.
Approximately 29% of PM is estimated to be BC in the Indian context; the remainder is OC7.
For the purpose of estimating CO2(e) only BC for diesel buses was considered, since OC from diesel buses represents, in absolute terms, less than 1% of total CO2(e) emissions for buses; while BC and OC represent less than 0.1% for CNG buses8.
N2O Emissions from diesel buses are, at best, not relevant to the CE analysis since the difference in emissions between CNG and diesel buses are very small5 and N2O emissions from conventional diesel and emissions controlled diesel buses are small enough to be ignored, even after adjustment to GWP2. So, N2O was not considered in the analysis for either fuel system.
CO2 Was included in the analysis given its significant contribution to total CO2(e) emissions6. SO2 SO2 is a climate cooling pollutant (Myhre et al., 2013, p.684). For the purpose of the CE analysis, it was not
considered, since CNG buses do not emit this pollutant8 and the contribution of SO2 to total CO2(e) emissions from diesel buses is very small, as it represents only about 1% of total CO2(e) emissions for these buses8.
1 The calculated average CH4 emissions for diesel buses is 1.66 g/mi compared to an average of 11.23 for CNG buses (Hesterberg et al. 2008; Table 1, p.6438).
2 For example, Cohen et al. (2003) justify not using in impact analysis the emissions of CH4 from diesel buses and N2O from CNG and diesel buses; they state that "none of the selected studies reported CH4 or N2O emissions for either CD [Conventional Diesel] or ECD [Emissions Controlled Diesel] vehicles, although values reported by Ahlvik and Brandberg (2) indicate that they are small enough to ignore, even after adjustment for GWP." (SI, p.30).
3 Exhaust methane from diesel buses (1.1 x10³ tons of CO2(e)) represents less than 0.1% of total CO2(e) emissions, thus will not impact CE analysis if included or not; leaked methane from CNG buses represents about 11% of total CO2(e) emissions and therefore was included in the CE analysis (Reynolds & Kandlikar 2008: SI, Table S5, p.S8).
4 Sources: Cohen et al. (2003), Reynolds & Kandlikar (2008), and Hesterberg et al. (2008). 5 "Nitrous oxide (N2O), another potent greenhouse gas, is not included here because net mass emissions of this species are not appreciably
different for diesel vs CNG engines" (Reynolds & Kandlikar 2008: Section 2.1, p.5861). 6 Sources: Cohen et al. (2003), and Reynolds & Kandlikar (2008). 7 The BC ratio is 76% for diesel buses; For CNG buses, though BC ratio is not stated in text, or SI, can be estimated to be 29% (Reynolds &
Kandlikar 2008: p.5861-5863). 8 Source: Reynolds & Kandlikar (2008): SI, Table S5, p.S8.
In terms of GHG emissions, the key climate forcing agents CO2, CH4, N2O, SO2 and
aerosols, such as black carbon (BC) and organic carbon (OC) are generally considered
and normalized to evaluate the climate change contribution of these different
greenhouse gases using the Global Warming Potential (GWP) in the common metric of
CO2-equivalent (CO2(e)) emissions (Myhre et al., 2013). For my CE analysis on mobile
emissions from buses, I only evaluate CH4, CO2, and BC, based on the importance of
these emissions in terms of GWP. The rationale for these choices, are summarized in
Table 6.3, above, and also explained in Appendix C. The computations of CO2(e) in
terms of GWP of these emissions are described in the next section.
Emissions factor estimates Ideally, emissions factors (EFs) would be
based on measurements conducted on actual in-use public transit buses and under

137
operating conditions representative of Delhi and other Indian cities. While there is a vast
amount of literature on emission factors, based on in-use buses for different types of
diesel and CNG bus technologies internationally (e.g., WVU, 2005; Nylund et al., 2007;
Hesterberg et al., 2008; Wayne et al., 2008), there are few if any reliable measurements
of emissions of in-use public transit buses under operating conditions in Delhi, or India
for that matter. Emission factors used in the CE model, were based on the limited
literature related to vehicle exhaust emission factor measurements in India, conducted
on chassis dynamometers (Bose & Sundar, 2005; ARAI, 2008; ARAI, 2009; CPCB,
2010). Note in this regard that emission measurements in traffic are less reproducible
than those conducted on chassis dynamometer, as argued in Hesterberg et al. (2008).
The EFs that were used in the CE analysis, and the sources for these factors are
provided in Tables 6.4 and 6.5, with details on data sources and EF calculations
provided in the footnotes. Table 6.4 shows the EFs for each bus type in terms of PM,
NOX and CH4, CO2, BC, and the CO2(e) that was calculated based on CH4, CO2 and BC
emissions using methods explained in Appendix C. Methane (CH4) emissions in Table
6.4 incorporate leakage, since this is a significant factor contributing to emissions, as
described in Appendix C. Also, specific details on CO2 emissions estimates based on
fuel economy data, BC emission factor estimates based on PM emissions, and CO2(e)
are all described in Appendix C.
For the scenario analysis, which also considered effects on emission effectiveness
given mode shifts, Table 6.5 provides emission factors for cars, M2Ws (motorized two-
wheeled vehicles) and M3Ws (motorized three-wheeled vehicles). EF calculations in
this table are for the most prevalent and relevant fuels for each vehicle type; this
approach in estimating EFs was also adopted in a study of traffic–generated emissions
in Delhi (Sindhwani & Goyal, 2014).

138
Table 6.4: Emission factors for buses, g/km. Vehicle Id. no. Fuel Bus
Emission Standard
PM(a) (g/km)
NOx(a) (g/km)
CH4(b) (g/km)
CO2(c) (g/km)
FE(c) (km/l)
BC(d) (g/km)
CO2(e)(e) (g/km)
1 Diesel Std. BS-I/II 7.00 45.30 1.20 708 3.81 3.221 2666 2 Diesel Std. BS-III/IV 2.47 18.12 0.27 860 3.08 1.229 1602 3 Diesel LF BS-III/IV 2.67 f 21.38 f 0.27 f 1035 2.56 1.229 f 1777 4 CNG Std. BS-I/II 0.49 54.36 6.11 907 2.12 0.122 1150 5 CNG LF BS-III/IV 0.18 25.66 3.16 1205 1.60 0.046 1321
a Source: Goel & Guttikunda (2015), which in turn bases EFs on CPCB (2010) as primary source data, but also incorporating the effects of “emission standards applicable for newer fleet by year, corrections applicable for engine deterioration based on fleet age-mix, and changing idling conditions on the roads” (p.83). EFs for BS-I/II buses were taken from Supplementary Material and BS-III/IV buses from Table 5 in Goel & Guttikunda (2015; p.83).
b Source: CNG buses: EFs reflect average of EF results found in Bose & Sundar (2005), ARAI (2008, 2009), and Reynolds & Kandlikar (2008); Diesel buses: EFs reflect average EF results found in Bose & Sundar (2005), and ARAI (2008, 2009).
c Source: all FE data taken from Chapters 4 and 5 (with CNG on energy equivalent basis), but Diesel-Std. BS-III/IV which was taken from Goel & Guttikunda (2015). CO2 EFs calculated from FE data as explained in Appendix C (Table C2).
d BC EFs calculated from PM using methods provided in Appendix C. e CO2(e) calculated from CH4, CO2 and BC using methods provided in Appendix C. f A correction factor, as reported in IVEM (2008), Clark et al. (2002), and EEA (2013), was used to estimate PM, NOX and BC
emission factors for this bus category, based on differences in bus weight of LFs to Std. Diesel buses. For CH4, no difference was observed between different classes of diesel buses (Clark et al. 2002), so the same emission factor was used for Diesel-Std. (BS-III/IV) and Diesel-LF (BS-III/IV).
Table 6.5: Emission factors for cars, M2Ws, and M3Ws, g/km. Vehicle Id. no. Vehicle Fuel PMb NOxb CH4c CO2d BCe CO2(e)f
6 Car Gasoline 0.050 0.243 0.17 223.6 0.160 324 7 M2Wa Gasoline 0.058 0.172 0.18 26.6 0.013 39 8 M3W CNG 0.041 3.633 1.84 62 0.008 118
a M2Ws, emission factors reflect weighted average of 2-stroke (2S) and 4-stroke (4S) engines, assuming M2W fleet proportion numbers are 72:28 for 2S and 4S, respectively (Sindhwani & Goyal 2014).
b Source: Goel & Guttikunda (2015). c Source: Sindhwani & Goyal (2014); methane includes leakage based on Reynolds & Kandlikar (2008). d Source: Car + M2W: Ramachandra & Shwetmala (2009); M3W: Reynolds & Kandlikar (2008). e Source: Car + M3W: Reynolds & Kandlikar (2008); M2W: Sindhwani & Goyal (2014). f CO2(e) calculated from CH4, CO2 and BC using methods provided in Appendix C. Vehicle usage and total emissions To calculate total bus emissions
over its service life for each air pollutant and vehicle type (Std. or LF; CNG or diesel),
emission factors (g/km) were taken from Tables 6.4 and 6.5 and multiplied by estimated
vehicle usage in vehicle kilometres (VKMS)36, over a 12-year cycle. DTC data shows
that VKMS in the 5-year period (2006-07 to 2010-11) averaged 67,041 kilometres-per-
year, per-bus, but with a slight increasing trend in recent years (CIRT, 2016; CIRT,
2017); so, the emissions calculations were based on a constant usage of 70,000
kilometres per-year, per-bus (as in Chapter 5).
36 For buses, vehicle-kilometres (VKMS) refer to the average effective kilometres operated by a vehicle within a fleet of vehicles. Effective kilometres are revenue earning kilometres (CIRT 2009, p.25).

139
Figure 6.1: Comparison of passengers carried and load factor at DTC
6.2.3 Scenario analysis
For the scenario analysis, because of the higher LCCs for CNG compared to Diesel,
and because of operator’s budgetary constraint, I investigate what happens to bus
capacity, and how this then impacts ridership, and in turn affects emissions. So, modal
choice and bus capacity changes were incorporated in the emissions modeling, and
particularly how some trips will likely move from buses to other transport modes, all of
which will have important environmental implications.
There is in fact evidence of this impact of higher costs on the supply of buses in Delhi;
since DTC converted to CNG in the early 2000s, its carrying capacity-kilometres
(CAPKM) on a per-population basis was actually 37% lower in the 10-year period from
2000-01 to 2010-11 than the prior 10-year period of diesel only operations, from 1990-
91 to 1999-00 (CIRT, 2012; GNCTD, 2017). Of course the introduction of Delhi’s metro
system is also a factor, but it only accounts for a very small mode share overall during
this period (Tiwari, 2017). Even with recent upgrades to Delhi's public transit bus fleet,
with the introduction of low-floor buses and considering fleets operated by other
operators32(p.130), CAPKM on a per-capita basis is most likely declining, due to ageing
and retirement of the old fleet of standard CNG buses, and lack of recent procurements
(The Times of India, 2016; Hindustan Times, 2017). The consequence of reductions in
bus capacity is that bus loading may increase and may also have the unintended
0%10%20%30%40%50%60%70%80%90%
100%
1993
-94
1994
-95
1995
-96
1996
-97
1997
-98
1998
-99
1999
-00
2000
-01
2001
-02
2002
-03
2003
-04
2004
-05
2005
-06
2006
-07
2007
-08
2008
-09
2009
-10
2010
-11
2011
-12
2012
-13
2013
-14
02004006008001,0001,2001,4001,6001,800
Load
fact
or %
Pass
enge
rs c
arrie
d (m
illion
s)
Passengers carried (5-yr moving average) Load factor (5-yr moving average)Source: CIRT (1991--2016).
A
B

140
outcome of causing passenger trips to be conducted by other modes of transport, rather
than by bus, thus affecting the overall effectiveness of CNG implementation. Actually,
this is what Figure 6.1 shows, when we compare the number of passengers carried to
the load factor at DTC from 2006-07 onwards; during this period, the load factor at DTC
has been steadily increasing (see box highlight A in Figure 6.1) whereas the number of
passengers carried has been relatively flat (see box highlight B in Figure 6.1).
To hypothetically keep bus loading and quality of service constant in the event that the
supply of CNG buses is constrained by higher costs, it would be reasonable to assume
that part of existing bus trips would have to be provided via baseline diesel buses,
assuming these could continue to operate. Since this is not in the case in Delhi, as only
CNG buses can operate as per policy, lower bus supply will push trips to other modes of
transportation, including cars, motorized two-wheeled vehicles (M2Ws), and
intermediate public transit. The evidence points to this, with Goel and Guttikunda (2015)
showing a steep decrease in public transit mode shares in Delhi from 1994 to 2007,
even when metro is included; in the meantime, the modal shares of private vehicles
were up considerably. From the point of view of trip demand (measured in passenger-
kilometres), we can assume it to be constant with respect to changes in bus technology;
so, a bus supply constraint may cause part of trip demand to migrate to other modes of
transport.
Given these considerations, the analysis of the effectiveness of CNG implementation
was conducted using three different independent scenarios. Scenario 1 assumed there
is no budget constraint on the operator's part. In this first scenario, all diesel buses are
converted to CNG. Meanwhile, to evaluate the (hypothetical) cleaner diesel buses
alternative, this scenario also assumed a full conversion to diesel buses that would
comply with more stringent emissions standards (i.e., a fleet consisting of mix of BS-III
and IV). Scenario 1 is meant to serve as a benchmark to evaluate the full benefits of
using CNG, against which the effectiveness of emissions reductions, as a result of
budget constraints, can be compared. Scenarios 2 and 3 assume that the higher costs
of CNG will reduce the number of buses using this fuel vis-à-vis the baseline (diesel),

141
and that, therefore, existing bus trip demand will either be met by keeping some existing
baseline diesel buses in operation (see further Scenario 2 discussion below), or via non-
bus options (see further Scenario 3 discussion below).
The budget restriction is assumed to affect CNG bus fleet capacity, as follows:
CNG Fleet Capacity (CAPKM)i = LCCbaseLCCi
(2)
where i represents the CNG buses (Standard or LF) being compared to baseline diesel
buses (Standard or LF). In Scenarios 2 and 3, CNG fleet capacity will be smaller than
baseline, since diesel LCCs are smaller than CNG LCCs. Using LCCs from Table 6.2 in
Equation 2, Std. CNG fleet capacity will be 0.941 of a Std. diesel bus fleet (i.e., there is
a loss of 5.87% in bus supply capacity compared to a Std. diesel bus fleet), and LF
CNG bus fleet capacity will be 0.966 of LF diesel buses (i.e., a 3.43% loss in supply
capacity).
In Scenario 2, the smaller number of CNG buses put into operation, creates a gap in
supply of bus transit services that is covered via use of baseline diesel buses that are
not entirely retired, thus keeping the overall supply capacity of bus services constant
from pre- to post-CNG conversion. However, note that Scenario 2 is purely hypothetical
in the case of Delhi, since the Supreme Court of India ruling concerning CNG
implementation did not allow diesel buses to operate within the city. Nevertheless, this
second scenario may be valid for other contexts where CNG implementation is sought
and restrictions do not apply. So, for the broader Indian context, a mix of Scenarios 2
and 3 are more likely relevant.
In Delhi’s case, specifically, since diesel buses cannot operate in the city, Scenario 3 is
the most relevant for the purpose of analyzing CNG implementation in the city’s public
bus fleet. The gap in bus supply resulting from higher CNG costs will change the
composition of trip demand. Scenario 3 assumes that, because of the smaller number of
buses, part of the existing bus users remain in the current system with an increase in

142
bus loading, and that, part of existing bus users will migrate to lower occupancy motor
vehicles for their transport needs due to the decrease in bus service quality (smaller bus
supply and higher loading). In the analysis of Scenario 3, lower occupancy motor
vehicles include intermediate public transit (taxies, jeeps, and auto-rickshaws), private
cars, and motorized two-wheeled vehicles (M2Ws).
Estimation of the migration of bus trips to other modes, due to smaller bus supply was
based on the socio-demographic profile of bus users in Delhi. A recent study showed
that 34% of users cannot afford M2Ws (Suman, Bolia, & Tiwari, 2017), so, it was
assumed that this is the percentage of existing bus users that will either continue to use
the new CNG buses (via increase in loading) or migrate to non-motorized transport.
Meanwhile, since 66% of bus users have the means of buying and using M2Ws or cars
(Suman, Bolia, & Tiwari, 2017), this is the percentage of bus users assumed to change
trips from buses to lower occupancy motor vehicles; this group was allocated to cars
(including taxies and jeeps), M2Ws, and M3Ws, using average modal split data for Delhi
as shown in the literature (Sahai, Bishop & Singh, 2009; Tiwari, 2017).
Table 6.6 shows how bus ridership migration to private modes of transport for Scenario
3 was calculated. Considering the 5.87% loss in bus supply capacity for the CNG-Std.
bus fleet (Equation 2), and that 3.88% passenger-kilometres (i.e., 66% of 5.87%) will
migrate to lower occupancy motor vehicles, this means that of the 3.2 million annual bus
passenger-kilometres37 provided by the average public transit bus in Delhi there will be
an annual reduction of approximately 124,000 passenger-kilometres in bus ridership,
per bus. For the LF CNG buses, since supply capacity decreases by 3.43% (Equation
2), it will result in a 2.26% loss in bus ridership, with a reduction of approximately 72,000
passenger-kilometres (PKMS) in ridership per bus, per year. Given these reductions in
bus ridership, for which transport needs will be met via lower occupancy motor vehicles,
PKMS in Scenario 3 will be divided according to the mentioned modal split (Table 6.6).
VKMS were estimated from these PKMS needs and average vehicle occupancy ratios
37 3.2 million is the average PKMS per bus on road in DTC’s fleet over a 5-year period, from 2006-07 to 2010-11 (CIRT, 2008-2012).

143
by dividing PKMS of each mode by the average vehicle occupancy for each mode: 2.75
for cars (including taxies), 1.3 for M2Ws and 2 for M3Ws, respectively (Reddy &
Balachandra, 2012). So, in Scenario 3, fleet emissions will include those from a smaller
number of CNG buses, plus those from public transit ridership having switched to lower
occupancy motor vehicles, as shown in Table 6.6. Table 6.6: Impact of bus ridership migration to private modes of transport (Scenario 3)
[0] [1] [2] [3] [4]
Motorized modal shares
in Delhi1
Motorized modal shares in Delhi (assuming bus
ridership changes)2
Average vehicle occupancy
(passengers per vehicle)3
Change in
PKMS (per-bus/yr)
Change in VKMS
= [3] / [2] (per-bus/yr)
Impact of change in Std. CNG bus ridership: -3.88% in bus ridership = -123,765 PKMS/bus/year5 with the following changes in modal shares: Cars4 19.7% 20.4% 2.75 +49,533 +18,004 M2Ws 26.2% 27.1% 1.3 +65,854 +50,657 M3Ws 3.3% 3.4% 2 +8,377 +4,189 Buses 45.1% 43.4% 50 -123,765 -2,475 Metro/Train 5.7% 5.7% Total 100% 100% Impact of change in LF CNG bus ridership: -2.26% in bus ridership = -72,249 PKMS/bus/year6 with the following changes in modal shares: Cars4 19.7% 20.1% 2.75 28,916 10,510 M2Ws 26.2% 26.7% 1.3 38,443 29,572 M3Ws 3.3% 3.4% 2 4,890 2,445 Buses 45.1% 44.1% 50 -72,249 -1,445 Metro/Train 5.7% 5.7% Total 100% 100% 1 Source: Sahai, Bishop & Singh (2009), Reddy & Balachandra (2012), Tiwari (2017). 2 Source: These estimates take into account the net loss in bus ridership, as noted in text, and redistribution of these passenger kilometres to other private modes of motorized transport (assuming modal shares in column [0]). 3 Source: for Cars 2Ws and 3Ws from Reddy & Balachandra (2012); for buses, based on average bus load% and bus capacity at DTC, over a 5-yr period, from 2006-07 to 2010-11 (CIRT, 2008-2012). 4 Car also includes Jeeps, and Taxies. 5 Bus PKMS ridership decrease estimate = 3.87682% (x) 3,192,430 PKMS per bus, per year; the PKMS per bus on road was based on DTC’s PKMS 5-year fleet average divided by DTC’s 5-year average buses on road from 2006-07 to 2010-11 (CIRT, 2008-2012). 6 Bus PKMS ridership decrease estimate = 2.26314% (x) 3,192,430 PKMS per bus, per year; the PKMS per bus on road was based on DTC’s PKMS 5-year fleet average divided by DTC’s 5-year average buses on road from 2006-07 to 2010-11 (CIRT, 2008-2012).
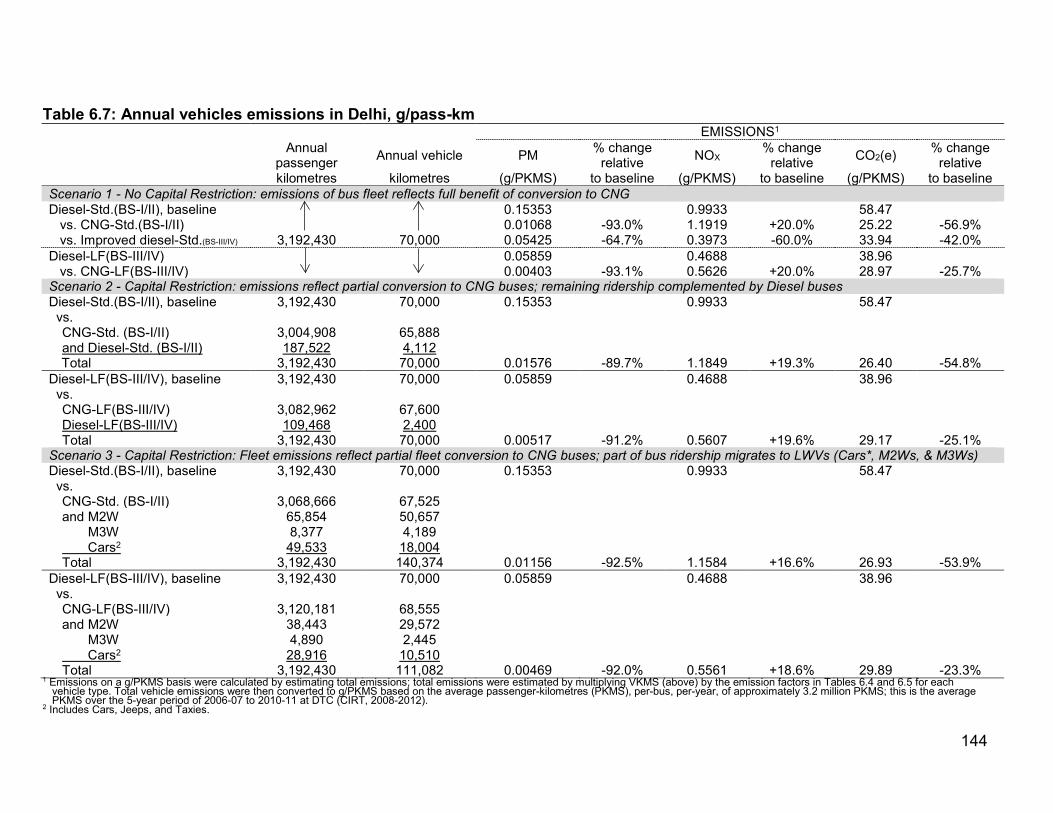
144
Table 6.7: Annual vehicles emissions in Delhi, g/pass-km
EMISSIONS1
Annual passenger Annual vehicle PM % change
relative NOX % change relative CO2(e) % change
relative kilometres kilometres (g/PKMS) to baseline (g/PKMS) to baseline (g/PKMS) to baseline
Scenario 1 - No Capital Restriction: emissions of bus fleet reflects full benefit of conversion to CNG Diesel-Std.(BS-I/II), baseline 0.15353
0.9933
58.47
vs. CNG-Std.(BS-I/II) 0.01068 -93.0% 1.1919 +20.0% 25.22 -56.9% vs. Improved diesel-Std.(BS-III/IV) 3,192,430 70,000 0.05425 -64.7% 0.3973 -60.0% 33.94 -42.0% Diesel-LF(BS-III/IV) 0.05859
0.4688
38.96
vs. CNG-LF(BS-III/IV) 0.00403 -93.1% 0.5626 +20.0% 28.97 -25.7% Scenario 2 - Capital Restriction: emissions reflect partial conversion to CNG buses; remaining ridership complemented by Diesel buses Diesel-Std.(BS-I/II), baseline 3,192,430 70,000 0.15353 0.9933 58.47 vs.
CNG-Std. (BS-I/II) 3,004,908 65,888 and Diesel-Std. (BS-I/II) 187,522 4,112 Total 3,192,430 70,000 0.01576 -89.7% 1.1849 +19.3% 26.40 -54.8%
Diesel-LF(BS-III/IV), baseline 3,192,430 70,000 0.05859 0.4688 38.96 vs. CNG-LF(BS-III/IV) 3,082,962 67,600 Diesel-LF(BS-III/IV) 109,468 2,400 Total 3,192,430 70,000 0.00517 -91.2% 0.5607 +19.6% 29.17 -25.1%
Scenario 3 - Capital Restriction: Fleet emissions reflect partial fleet conversion to CNG buses; part of bus ridership migrates to LWVs (Cars*, M2Ws, & M3Ws) Diesel-Std.(BS-I/II), baseline 3,192,430 70,000 0.15353 0.9933 58.47 vs.
CNG-Std. (BS-I/II) 3,068,666 67,525 and M2W 65,854 50,657 M3W 8,377 4,189 Cars2 49,533 18,004 Total 3,192,430 140,374 0.01156 -92.5% 1.1584 +16.6% 26.93 -53.9% Diesel-LF(BS-III/IV), baseline 3,192,430 70,000 0.05859 0.4688 38.96 vs.
CNG-LF(BS-III/IV) 3,120,181 68,555 and M2W 38,443 29,572 M3W 4,890 2,445 Cars2 28,916 10,510 Total 3,192,430 111,082 0.00469 -92.0% 0.5561 +18.6% 29.89 -23.3% 1 Emissions on a g/PKMS basis were calculated by estimating total emissions; total emissions were estimated by multiplying VKMS (above) by the emission factors in Tables 6.4 and 6.5 for each
vehicle type. Total vehicle emissions were then converted to g/PKMS based on the average passenger-kilometres (PKMS), per-bus, per-year, of approximately 3.2 million PKMS; this is the average PKMS over the 5-year period of 2006-07 to 2010-11 at DTC (CIRT, 2008-2012).
2 Includes Cars, Jeeps, and Taxies.

145
6.3 Results and analysis
I present in Table 6.7 (above) total emissions from buses and vehicles, for the three
scenarios, and in Table 6.8 and Figure 6.2 (below) the calculated CE ratios for Std. and
LF buses. In Table 6.8, each CE ratio is expressed in life-cycle cost (US dollars) to
achieve service-life emissions reduction for PM, NOX and CO2(e), respectively. For each
pollutant, CE ratios are compared for CNG-Std.(BS-I/II) versus Diesel-Std.(BS-I/II),
CNG-LF(BS-III/IV) vs. Diesel-LF(BS-III/IV), and Diesel-Std.(BS-III/IV) vs. Diesel-
Std.(BS-I/II); they are also compared for CNG-LF(BS-III/IV) vs. Diesel-Std.(BS-III/IV),
since some Indian cities might contemplate this substitution. Calculations in Table 6.8
and Figure 6.2 assume there is full conversion of the bus fleet to CNG, and thus, these
results are compatible with Scenario 1.
6.3.1 Analysis of emissions results for the three scenarios
Scenario 1 From Table 6.7, Scenario 1, we see that the change in bus
emissions due to CNG implementation are -93% for PM, -57% for CO2(e), and +20% for
NOX, relative to Diesel-Std.(BS-I/II) bus emissions, respectively. For CNG-LF (vs.
Diesel-LF), results show PM emissions reduction is still quite significant at 93%, while
NOX emissions are up 20%. In terms of CO2(e), while CNG-LFs lowered emissions by
26%, compared to Diesel-LFs, this reduction is only half the emissions reductions
benefit seen with CNG-Std. (vs. Diesel-Std.). Actually, CO2(e) emissions from CNG-LF
buses are higher compared to emissions from CNG-Std. buses (Table 6.4) since there
is a significant impact of the more powerful engines and low-floor bus technology,
including the use of AC systems, on fuel economy performance, and thus CO2
emissions performance. These CO2(e) results are despite BC emissions from CNG-Std.
buses being nearly 3x higher than for CNG-LFs, and CH4 emissions being 2x higher
(Table 6.4). Lastly, emissions reductions for Diesel-Std.(BS-III/IV) (vs. Diesel.BS-I/II)
are also substantial, including for NOX. However, if we compare emissions of CNG-
Std.(BS-I/II) to Diesel-Std.(BS-III/IV), which is not shown in Table 6.7, PM would be

146
down by 80%, NOX +200%, and CO2(e) -26% for the CNG buses, so CNG
implementation is better than using cleaner diesel (BS-III/IV) considering PM emissions
reduction goal (Table 6.7).
Scenarios 2 and 3 From Table 6.7, we see in Scenarios 2 and 3
that PM, NOX and CO2(e) emissions reductions percentages from CNG implementation,
relative to the Diesel (BS-I/II) baseline buses, are similar to the results in Scenario 1.
That is, substantial reductions for PM emissions for all CNG technologies, increase in
NOX emissions, and moderate reductions in CO2(e) emissions (all relative to CNG
buses corresponding baseline diesel counterparts). Moreover, these results show that
the emissions reductions benefits due to a full substitution of diesel by CNG buses in
Scenario 1 weakened relative to baseline diesel buses, but only very marginally, as
higher costs limited the number of CNG buses in operation in Scenarios 2 and 3.
Particularly, PM emissions reductions weakened more in Scenario 2, as opposed to
Scenario 3, due to the use of a small number of diesel buses that remained in operation
in Scenario 2, and the much higher PM emissions profile of these diesel buses.
Meanwhile, in terms of CO2(e), it was Scenario 3 where emissions reductions weakened
slightly more, relative to Scenario 1, than Scenario 2 (vs. Scenario 1), due to the poorer
CO2(e) emissions performance of lower occupancy vehicles, on a PKMS basis.
However, when comparing emissions results of CNG buses in Scenarios 2 and 3 to
CNG emissions in Scenario 1 in Table 6.7, some interesting results also emerge. For
instance, PM emissions for a mixed fleet of (mostly) CNG-Std., but also some Diesel-
Std. buses, in Scenario 2 is 48% higher than PM emissions from only CNG-Std. buses
in Scenario 1. For a mixed fleet of (mostly) CNG-LF, but also some Diesel-LF buses, in
Scenario 2 (vs. only CNG-LF buses in Scenario 1), PM emissions are 28% higher.
Meanwhile, PM emissions for a mixed fleet of CNG buses in Scenario 3, that includes
lower occupancy vehicles, are closer to Scenario 1 results, being +8% for CNG-Std.
buses and +16% for CNG-LFs, versus only CNG-Std. and CNG-LF buses in Scenario 1,
respectively. Since PM emissions from CNG implementation in Scenario 2 are higher
than emissions from CNG in Scenario 3, from a PM emissions perspective, removing as

147
many diesel buses is likely better, even if lower occupancy vehicles make up for a
potential shortfall in CNG bus supply.
These same types of comparisons from the previous paragraph show for NOX
emissions that across the three CNG implementation scenarios, results are very close
to each other. That is, there are only marginal comparable CNG-to-CNG emissions
differences between the three scenarios, which vary at the most by 3%. So, from a NOX
perspective, due to these small CNG emissions differences between the three
scenarios, there is likely no significant impact in using a residual number of diesel buses
versus using lower private occupancy vehicles to make up for the shortfall in CNG bus
transit supply after implementation.
For CO2(e), a CNG-to-CNG comparison across the three scenarios shows emissions
generally close to each other. There is a marginal increase of about 4.7% in CO2(e)
emissions for a mixed fleet of (mostly) CNG-Std., but also some Diesel-Std. buses, in
Scenario 2 (vs. only CNG-Std. buses in Scenario 1), and 1% increase for mixed fleet of
(mostly) CNG-LF, but also some Diesel-LF buses, in Scenario 2 (vs. only CNG-LF
buses in Scenario 1). In Scenario 3, CO2(e) emissions went up 7% for a mixed CNG-
Std. fleet (vs. only CNG-Std. buses in Scenario 1) and by 3% for a mixed CNG-LF fleet
(vs. only CNG-LFs in Scenario 1). This increase in Scenario 3 is due to a small
proportion of passengers migrating to lower occupancy vehicles to fill the gap in bus
supply with an overall increase in vehicle-kilometres needed to transport the same
amount of passengers and for the same commuting distances (Table 6.7). So, for
CO2(e), the above comparisons show that emissions differences across the 3 scenarios
are only marginal, with CO2(e) emissions from CNG buses being lower in Scenario 2
than in Scenario 3. So, from a CO2(e) emissions perspective, it is likely better to keep
diesel buses in operations, rather than allowing for a shortfall in CNG bus supply being
met by lower occupancy vehicles.
A last note on the scenario analysis is that I assumed total LCCs as the basis for the
budgetary constraint, which in turn limited bus supply. An alternate approach, not

148
considered in this chapter, is that the adoption of CNG may be limited strictly by capital
costs rather than total costs. Capital costs, being up-front costs, have to be financed
either through the operator's cash reserves (usually very limited), or through
government financing and private financing. If this were the case, we would see greater
decrease in bus supply, since operating costs for diesel buses are only marginally
different to CNG, while diesel capital costs are much lower than comparable CNG
buses (Table 6.2). Thus, the impact of this change on supply of CNG buses would be
greater, and the deterioration in emissions performance seen in Scenarios 2 and 3
(Table 6.7) will likely be worse.
6.3.2 CE ratio analysis
Cost-effectiveness ratio calculations, based on Equation 1 (Section 6.2.2), are
presented in detail in Table 6.8, which also includes a breakdown of CE ratio
calculations, given incremental LCCs and service-life emissions differences. A summary
of the CE ratios from Table 6.8 is also presented in Figure 6.2.
Interestingly, whereas Table 6.7, Scenario 1, showed lower PM and CO2(e) emissions
for CNG buses, than for Diesel buses, CE ratio results show that CNG buses may not
be the optimal choice (Table 6.8). In terms of PM emissions effectiveness, Diesel-
Std.(BS-III/IV) (relative to Diesel-Std. BS-I/II) has the largest emissions reductions at the
lowest incremental cost, and therefore, the lowest CE ratio, at 3.7 $/kg, lower than for
CNG-Std. buses (relative to Diesel-Std. BS-I/II), at 4.8 $/kg. So, it appears that, from a
CE perspective, Diesel-Std.BS-III/IV would likely have been a better choice for tackling
PM emissions reductions at a lower cost, rather than having implemented CNG-Std.
buses. The breakdown data in Table 6.8, shows that while bus service-life emissions
reductions of PM for CNG-Std. (vs. Diesel Std.) of 5,473 kg is greater than the
emissions reductions for Diesel-Std.BS-III/IV (vs. Diesel-Std.BS-I/II), of 3,803 kg, the
incremental LCCs for CNG-Std. (vs. Diesel-Std.) are 2x the incremental LCCs for
Diesel-Std.BS-III/IV (vs. Diesel-Std.BS-I/II), and so the lower CE ratio in the latter case.

149
Table 6.8: Cost-effectiveness ratio calculation breakdown, Scenario 1 (1) Incremental life-cycle costs: $/bus
CNG-Std.BS-I/II (-) Diesel-Std. BS-I/II 26,067 CNG-LF BS-III/IV (-) Diesel-LF BS-III/IV 23,608
CNG-LF BS-III/IV (-) Diesel-Std. BS-III/IIV 121,569 Diesel-Std. BS-III/IV (-) Diesel-Std. BS-I/II 13,942
(2) Bus service-life emissions differences: PM NOX CO2(e) CH4 CO2 BC
(kg) (kg) (tonnes) (kg) (tonnes) (kg)
Diesel-Std. BS-I/II (-) CNG-Std.BS-I/II 5,473 -7,610 1,274 -4,119 -166 2,603 Diesel-LF BS-III/IV (-) CNG-LF BS-III/IV 2,090 -3,595 383 -2,425 -143 994 Diesel-Std. BS-III/IIV (-) CNG-LF BS-III/IV 1,924 -6,335 191 -2,425 -290 917 Diesel-Std. BS-I/II (-) Diesel-Std. BS-III/IV 3,803 22,832 940 780 -128 1,750
(3) CE RATIO = [ (1) ÷ (2) ] PM NOX CO2(e) CH4 CO2 BC
($/kg) ($/kg) ($/tonne) ($/kg) ($/tonne) ($/kg)
CNG-Std. (BS-I/II) vs. Diesel-Std. (BS-I/II) 4.8 -3.4 20 -6.3 -157 10.0 CNG-LF (BS-III/IV) vs. Diesel-LF (BS-III/IV) 11.3 -6.6 62 -9.7 -165 23.8 CNG-LF (BS-III/IV) vs. Diesel-Std. (BS-III/IIV) 63.2 -19.2 638 -50.1 -420 132.5 Diesel-Std.(BS-III/IV) vs. Diesel-Std.(BS-I/II) 3.7 0.6 15 17.9 -109 8.0
In terms of the low-floor buses, despite lower PM emissions from CNG-LFs relative to
Diesel-LFs, as show in Table 6.7, the CE ratio of 11.3 $/kg in Table 6.8 for this pollutant
is more than double compared to the CE ratios for CNG-Std. (vs. Diesel-Std.) and for
Diesel-Std.BS-III/IV (vs. Diesel-Std.BS-I/II) previously discussed. The reason for this
substantially higher CE ratio for PM emissions for CNG-LFs (vs. Diesel-LFs) can be
seen in Table 6.8. Despite a lower incremental LCC of CNG-LFs (vs. Diesel-LFs),
compared to LCC difference for CNG-Std. (vs. Diesel-Std.), the service-life emissions
reductions of 2,090 kg for the CNG-LF buses (vs. Diesel-LFs) are not as substantial as
the reductions reported for CNG-Std.(BS-I/II) (vs. Diesel-Std.BS-I/II) of 5,473 kg; and
so, the CE ratio is considerably higher. Also, when CNG-LF (BS-III/IV) is compared to
Diesel-Std. (BS-III/IIV), the PM emissions CE ratio of 63.2 $/kg is higher than all the
other bus comparisons already discussed; this is mostly due to the high incremental
LCC of CNG-LFs over Diesel-Std. buses, as show in in Table 6.8.
This last bus comparison, of CNG-LF (BS-III/IV) vs. Diesel-Std. (BS-III/IV), is important
as it shows that implementation of low-floor CNG buses as a substitute for conventional
standard diesel buses, which, as noted earlier, some Indian cities might contemplate,
comes at substantially higher costs but no significant marginal reductions in emissions.
Thus, the use of low-floor buses in the Indian context needs to be carefully considered,
since its total life-cycle costs are significantly higher than for standard buses, and since

150
this vehicle technology is increasingly being used across the country (MoUD, 2012).
This raises a dilemma for policymakers and planners, since the choice of low-floor
buses is based on the assumption that increasing incomes and behavioral changes of
transit users are leading them to private modes of transportation, and an increased
quality of bus service is needed to counter this effect. However, these benefits
(environmental and quality of the bus service) come at significantly higher costs of
purchase and operation, all of which reduce the environmental CE of low-floor buses,
when compared to less costly standard buses. Furthermore, these higher LCCs most
likely limit the capacity of operators to expand their fleets, thus potentially adversely
affecting the capacity of bus service provision, which results in possibly higher loading,
lower frequency of service, and thus, uncertain outcomes in terms of quality of service
desired, and likely lower ridership, particularly among choice bus transit riders.
The NOX CE ratio reported in Figure 6.2a are negative for all CNG-to-diesel
comparisons. The reason is that, while the numerator in equation 1 is positive, as
expected, since CNG bus LCCs are higher than the diesel buses they are being
compared to (Table 6.8), emissions are also higher for all CNG bus types relative to
diesel buses (and thus a negative denominator in equation 1). So, as far as NOX
emissions is concerned, CNG is not a desirable choice. Nonetheless, the NOX CE ratio
for Diesel-Std.(BS-III/IV) relative to older generation diesel buses (BS-I/II) is positive
and close to zero, showing that the cleaner diesel buses are a better choice for reducing
NOX emissions, that is, the incremental costs of the improved diesel system are low and
show good emissions reductions results for this pollutant (Table 6.8).

151
(a) CE ratio for PM and NOX
(b) CE ratio for CO2(e) and sub-components
* CE ratio = (Incremental LCCs) ÷ (Bus service-life emissions differences)
Figure 6.2: Cost-effectiveness ratio, $-per-emissions reduction, Scenario 1
For the analysis of CO2(e) cost-effectiveness ratios in Figure 6.2b, it is interesting to first
look at the breakdown of each individual pollutant influencing its value, that is CH4, CO2
and BC. For CH4, all CNG buses have negative CE ratios, since, as already noted,
emissions of this pollutant are generally expected to be higher, and CNG is mostly
methane and especially when considering the fuel leakage problem. For CO2, also, all
the CE ratios are negative, since all alternative buses, including Diesel-Std.BS-III/IV,
emit more than baseline diesel buses (Table 6.8); in this case, the "least worst" choice,
is Diesel-Std. (BS-III/IV) as a substitute for Diesel-Std. (BS-I/II). For CNG buses, CO2
emissions are higher due to the fuel economy performance of CNG buses used in Delhi
being much poorer than comparable diesel buses (Table 6.4). As discussed in Chapters
3 and 4, CNG's fuel economy penalty relative to the diesel buses they replaced
amounted to 45%, both on Std. and LF buses, on an energy equivalent basis rather
than the expected fuel economy loss of 20-25% usually reported in the literature. Lastly,
for BC, since all CNG buses have substantially lower emissions than the baseline diesel
buses (Table 6.4), and since BC emissions are related to PM emissions, the differences
in the CE ratios for BC in Figure 6.2b closely follow the differences seen in Figure 6.2a
for PM, as discussed above.
5
-3
11
-7
63
-19
41
-30
-20
-10
0
10
20
30
40
50
60
70
($/kg) ($/kg)
PM NOx
Cos
t-effe
ctiv
enes
s ra
tio*
20
-6
-157
1062
-10
-165
24
638
-50
-420
133
15 18
-109
8
-500
-300
-100
100
300
500
700
($/tonne) ($/kg) ($/tonne) ($/kg)
CO2(e) CH4 CO2 BC
Cos
t-effe
ctiv
enes
s ra
tio*
CNG-Std. (BS-I/II) vs. Diesel-Std. (BS-I/II)
CNG-LF (BS-III/IV) vs. Diesel-LF (BS-III/IV)
CNG-LF (BS-III/IV) vs. Diesel-Std. (BS-III/IV)
Diesel-Std.(BS-III/IV) vs. Diesel-Std.(BS-I/II)

152
In view of the foregoing, in terms of CO2(e), Diesel-Std. BS-III/IV (vs. Diesel-Std. BS-I/II)
is the best choice, given the CE ratio of 15 $/tonne, which is lower than CE ratio of 20
$/tonne for CNG-Std. (vs. Diesel-Std.), and significantly lower than the ratio for CNG-LF
(vs. Diesel-LF) of 62 $/tonne, and for CNG-LF (vs. Diesel-Std. BS-III/IV) of 638 $/tonne.
The CO2(e) CE ratio for Diesel-Std. BS-III/IV (vs. Diesel-Std. BS-I/II) is lower than the
ratio for CNG-Std. (vs. Diesel-Std. BS-I/II), since the incremental LCC for Diesel-Std.
BS-III/IV (vs. Diesel-Std. BS-I/II) is much smaller than for CNG-Std. (vs. Diesel-Std. BS-
I/II), respectively (Table 6.8); and despite bus service-life emissions reduction of 940
tonnes of CO2(e) for Diesel-Std. BS-III/IV (vs. Diesel-Std. BS-I/II), being smaller than the
emissions reduction for CNG-Std (vs. Diesel-Std. BS-I/II) of 1,274 tonnes (Table 6.8).
Meanwhile, from Table 6.8, it can be seen that the CE ratio for CO2(e) for both CNG-LF
comparisons are much greater than for Diesel-Std. BS-III/IV (vs. Diesel-Std. BS-I/II) or
for CNG-Std. (vs. Diesel-Std.), since emissions reductions benefits are not as high, and
particularly for the CNG-LF (vs. Diesel-Std. BS-III/IV) comparison, the incremental LCC
is also much greater than the other comparisons in question, respectively.
Changes to the discount rate In Chapter 5, I considered how changes
in the discount rate affected the LCC results, so here I include a brief discussion of how
a change to this parameter will affect the CE ratio results. Overall, even if the discount
rate is progressively lowered to zero, Diesel-Std. BS-III/IV buses (vs. Diesel-Std. BS-I/II)
continue to have a lower CE ratio for PM, NOX and CO2(e), than for all the other CNG
bus comparisons, respectively. However, the incremental LCC for Diesel-Std. BS-III/IV
(vs. Diesel-Std. BS-I/II), as reported in Table 6.8, almost doubles when the discount rate
is zero, whereas the increase in LCC differences for the CNG buses comparisons (vs.
their diesel counterparts) is not as significant at lower discount rates. So, as the
discount rate decreases, the CE ratio advantage for Diesel-Std. BS-III/IV (vs. Diesel-
Std. BS-I/II) for all the mentioned pollutants diminishes compared to the ratios of the
other CNG bus comparisons (relative to the diesel counterparts), respectively.

153
6.4 Conclusions and implications
In this chapter, I assessed the cost-effectiveness of CNG implementation in Delhi’s
public bus fleet by comparing emissions of health-critical pollutants and GHGs against
the life-cycle costs of buses. This analytic framework is an important tool for evaluating
policy and planning decisions, and to my knowledge, this quantification and analysis
has not been systematically done for the specific context of Delhi -- or even India --
concerning CNG buses, and therefore, fulfils an important research need.
6.4.1 Summary of key results
Scenario emissions In Scenario 1, I showed that a full substitution of
diesel by CNG buses brings substantial PM emissions reductions, for both the early
2000 CNG buses (relative to comparable diesel buses at the time), as well in terms of
newer LF-CNG buses (relative to modern LF-Diesel buses). Lower CO2(e) emissions
are also possible for all CNG bus types; but, NOX emissions were higher for all CNG
buses. However, this scenario is not consistent with the reality in Delhi.
Since LCCs are higher for CNG than diesel, which likely constrained bus capacity as
discussed, I analyzed Scenario 2 (where some Diesel buses would continue to operate
to account for reduced supply of CNG buses) and Scenario 3 (where the operator
retires all diesel buses and bus transit capacity effectively is reduced on CNG, which
was the case in Delhi). In terms of emissions differences between CNG and
corresponding diesel buses in Scenarios 2 and 3, compared to the differences between
CNG and diesel in Scenario 1, I showed that emissions for CNG in Scenarios 2 and 3
were only marginally worse than in Scenario 1 for all air pollutants analyzed. However,
when I compared emissions changes exclusively between CNG buses across the three
scenarios, that is, in CNG-to-CNG comparisons, other interesting results also emerged.
Particularly, PM emissions from CNG in Scenario 2 were higher than PM emissions
from CNG in Scenario 3, for both Standard and low-floor buses. Meanwhile, in the

154
CNG-to-CNG comparisons for CO2(e), it showed that CO2(e) emissions from CNG
buses in Scenario 2 were lower than CO2(e) emissions from CNG buses in Scenario 3.
These results have important implications, which will be discussed below.
CE ratios Whereas the analysis of total emission results (above)
favored CNG buses (and particularly Standard buses) over improved diesel buses that
complied with stricter emissions standards, the opposite was true in the analysis of CE
ratio across all the air pollutants considered. Particularly, in terms of PM emissions
effectiveness, Diesel-Std.(BS-III/IV) had the lowest CE ratio relative to all the other CNG
bus comparisons, due to lower incremental LCCs. Also, the highest CE ratios for all air
pollutants analyzed was for the comparison of CNG-LF (BS-III/IV) to Diesel-Std. (BS-
III/IV).
6.4.2 Implications
In light of the above results, it is interesting to re-visit the two central questions I initially
raised. That is, (i) what were the merits of CNG policy, from a public bus transit
perspective based on CNG technology of the early 2000s, and (ii) what is the merit in
continuing to pursue this policy in Delhi, or for other cities of India, given current
technologies and alternatives?
For the first question, the analysis showed that the CNG implementation policy
produced benefits, since CNG-Std. buses offered the most potential in bringing down
emissions of health-critical PM and CO2(e) pollutants in the early 2000s. This emissions
advantage was in relation to comparable diesel buses at the time, and even relative to
cleaner diesel buses that would comply in the early 2000s with the subsequent phases
of Indian fuel emissions standards (BS-III emission standard was only adopted in Delhi
from 2005 and BS-IV from 2010). However, CNG’s higher capital and operating costs
adversely impacted the CE of emissions reductions in comparison to comparable
cleaner diesel buses (BS-III/IV), and the cost of emissions reductions was higher with
CNG-Std. than it would have been with these cleaner diesel buses. So, in the early

155
2000s, the bus fuel and technological choice that would have resulted in the largest
emissions reduction of air pollutants affecting human health and climate change
inducing GHGs, at the lowest incremental cost, would likely have been to upgrade to a
new fleet of diesel buses running on lower sulphur fuel and using improved exhaust
aftertreatment systems. This approach would also likely have produced other
advantages, such as lower overall implementation costs, a potentially larger bus fleet,
and other positive externalities (such as cleaner diesel that would be used nation-wide).
This is not to say that the CNG implementation decision taken in Delhi was ineffective or
unjustifiable, since this discussion has to be put into a broader context. In the late 1990s
and early 2000s, the air quality in Delhi was in a critically poor state, the institutional
realities of upgrading oil refining to meet higher diesel standards perhaps were a major
constraint, and the possibility of diesel adulteration was a point of concern for many
stakeholders, which could negate any benefits of cleaner diesel technology. Thus, all of
these contextual factors may actually justify the higher costs paid for achieving
emissions benefits produced by CNG, when these -- and other -- risk factors and
institutional realities are accounted for.
Furthermore, the scenario analyses showed that the emissions reductions benefits,
from a full substitution of diesel buses by CNG, marginally weakened when higher costs
limited the number of CNG buses put into operation. While a full substitution of diesel by
CNG buses is still the best option for minimizing PM and CO2(e) emissions, the
alternate scenarios also produced emissions reductions, which were marginally worse
than a full substitution. Also very important is that analysis of Scenarios 2 and 3 showed
an important trade-off between urban air pollutant and greenhouse gas emissions
reductions. For PM emissions reduction in Delhi, Scenario 3 showed for both standard
and low-floor CNG buses, that restricting the use of diesel buses -- despite lower public
bus transit supply and the use of lower occupancy vehicles -- was more beneficial than
keeping a residual number of diesel buses running, since PM emissions from CNG
buses in Scenario 2 were higher than in Scenario 3. However, the opposite was true in
terms of CO2(e) emissions reductions, that is, when public bus transit supply is

156
constrained, keeping a residual number of diesel buses on the road minimizes CO2(e)
emissions (as shown by Scenario 2 results) than allowing transit ridership to migrate
towards lower occupancy vehicles (as shown by Scenario 3 results). So, from the point
of view of local health critical pollution (i.e., PM), but not in the case of CO2(e)
emissions, the restriction of only allowing CNG buses on the road, as was required by
the Supreme Court of India CNG directive, was an effective choice, rather than allowing
diesel buses to continue to operate in the city, and despite increase in traffic of lower
occupancy motor vehicles. Of course, the Supreme Court directive was not motivated,
at the time, by GHG or climate change concerns, but by the air pollution problem.
In terms of the second question, the analysis showed that, under the BS-IV fuel
emissions standard in India, low-floor CNG buses continue to offer substantial
emissions reductions in terms of PM and CO2(e) when compared to low-floor diesel
buses. However, CNG-LFs cost-effectiveness ratios, relative to Diesel-LFs, are much
higher than the ratios for CNG-Std. relative to Diesel-Std. since the emissions gap
between the CNG and diesel buses narrowed, which shows the increased incremental
cost of CNG implementation today (and the well known fact that, the higher the level of
pollution control, the higher the marginal cost of pollution abatement). The difference is
even more significant when CNG-LF buses are compared to Diesel-Std. buses of
similar emissions and fuel technology (BS-III/IV). The problem is that the low-floor
buses implemented in Delhi towards 2007/08 had much higher LCCs than the prior
generation of standard CNG buses. These substantial cost differences between modern
low-floor and standard buses still exist today for both CNG and diesel buses.
Looking at the future of CNG in Delhi, the challenge is that the city has an immense
stake in this fuel, which is to say that changing the fuel system back to diesel would
come at higher costs than in other Indian cities that already operate diesel bus fleets. In
the case of Delhi and its surroundings, all these facts justify considering more carefully
the use of CNG-Std. buses and low-sulphur diesel buses with advanced exhaust
aftertreatment systems, given their lower costs, relative to CNG-LFs. The
implementation of CNG-Std. buses would have lower impact on funding than the more

157
costly low-floor variants, allowing for a more significant expansion of the public bus
transit fleet, thus enabling greater environmental benefits due to CNG use, while also
being less climate damaging. For other cities that have fleets currently running on diesel
fuel, the analysis shows that the higher costs of CNG do not justify the environmental
benefits compared to cleaner diesel bus technologies, unless, as stated above, other
contextual factors may justify its use.

158
Chapter 7: Conclusion and policy implications
7.1 Introduction
In this last chapter, I present an overview of the key findings from my dissertation
research and discuss the implications of these findings from a broader policy
perspective, especially given the significance of my research for CNG public bus transit
policy-making in India and for similar contexts. Finally, I outline important issues that
were raised throughout the dissertation and how these issues can be further
investigated and analyzed, helping guide possible future research on fuel and
transportation policy.
As I showed in the first chapters, the critical problem motivating my research is the
substantial contribution of the transport sector to air pollution. Remarkably, and despite
various interventions, the contribution of road transport to air pollution continues to grow
in fast expanding economies like India and China. As result, exposure to air pollution in
India and China have led to a substantial rise in mortality and morbidity of growing
urban populations. As I have shown, heavy-duty diesel vehicles, disproportionately
contribute to this problem, and therefore merit particular policy attention to address
urban air pollution.
In terms of road transport, there have been various approaches to address the urban air
pollution problem, including widespread implementation of stricter fuel and emissions
standards, and the use of alternative fuel and propulsion technologies in buses.
Worldwide, diesel-fueled buses continue to be the predominant choice in public transit
systems, given their superior performance in terms of reliability and fuel-efficiency.
Today, diesel buses comply with stricter emissions standards and emit considerably
less health critical pollutants compared to buses used 10 to 15 years ago. For example,
United States (US) and European Union (EU) standards in 2016 limit emissions of NOX
and PM2.5 to less than a tenth of the levels allowed 15 years earlier (Posada et al.,
2016). However, to achieve such results, buses must use lower sulphur diesel, exhaust

159
gas recirculation systems, and exhaust aftertreatment systems38. The use of alternative
fuel and propulsion technologies is varied, with countries like the US, already having
substantial experience and sizable number of bus operators using CNG and diesel-
hybrid buses, and with increasing interest in other alternatives, such as battery electric,
fuel-cell, and hydrogen buses.
The challenge for a country like India is that, only in 2017 were EURO-IV equivalent
standards implemented countrywide, and so, emission standards still lag those seen in
the US or the EU. In such contexts, the use of CNG buses can still substantially reduce
emissions of harmful pollutants like PM, relative to existing diesel buses, without need in
CNG buses for more advanced fuel, engine and aftertreatment technologies.
Given the above, the overall objective of my PhD research was to assess the
operational and financial performance consequences of, and the cost-effectiveness of
emissions reductions due to, replacing diesel bus fleets with CNG in Delhi, India. The
broader goal of this work is to support decision- and policy-making related to the use of
alternative transport fuel systems in low- and middle-income countries, like India, and
help inform whether this alternative transport fuel system can cost-effectively mitigate
urban air quality problems. For this reason, in my first analytical chapter (Chapter 3) I
conducted a comprehensive critical review of CNG in urban bus transit fleets based on
the experiences of fleet operators in the US and Latin America. Drawing on the key
lessons from this review for CNG evaluation and the important issues raised, I turned
my attention to India, by analyzing in Chapter 4 the operational and financial
performance CNG buses in Delhi. Both these research projects, in turn, helped provide
the basis for modelling the LCCs of CNG buses in the Indian context (Chapter 5).
Lastly, based on these LCCs and coupled with my estimation of the emissions
outcomes of CNG implementation in Delhi, I evaluated of the cost-effectiveness of
reducing key pollutants in this city (Chapter 6). Below I present key results, followed by
38 Such as Diesel Oxidation Catalysts (DOC), Diesel Particulate Filters (DPF) and Selective Catalytic Reduction (SCR) catalysts.

160
a brief policy relevant discussion, in terms of my dissertation research done in Chapter’s
3 to 6.
7.2 Key research findings
Chapter 3 The objective of Chapter 3 was to investigate key
lessons from the experiences of five urban bus transit fleet operators in the US, Mexico
and Chile with CNG and to explore the relevance of those lessons for addressing urban
air quality concerns. It is important to stress that these experiences are relevant to the
Indian context in 2000 and beyond, given the bus technologies that were evaluated and
emission norms present in India since 2000. To this end, the chapter comprised of a
critical review of the performance of CNG based on these experiences to see how fuel
implementation can be more effectively evaluated with respect to a bus operator's
financial, emissions, and operational goals, and what is required for this implementation
to be successful. Key lessons drawn from the analysis of the five cases were:
1) Despite other important benefits for CNG, such as improving energy security and
lowering GHG emissions, the primary rationale for fleet operators in considering natural
gas implementation were the desire curb air pollution and to comply with more stringent
emission standards.
2) CNG buses required simpler and less expensive control measures to achieve
more stringent emissions standards than diesel, but at higher purchase costs.
3) Fuel economy (FE) of CNG buses was generally 25% lower, on an energy
equivalent basis, relative to diesel in city operations. Interestingly, bus operations in
higher average speeds improved performance for both diesel and CNG buses, but
much more for CNG. Also important was the fact that CNG's FE penalty disappeared
when exhaust control measures like DPF and EGR were used to reduce PM and NOX
emissions on diesel buses.

161
4) CNG buses have significant potential for reducing PM and NOX emissions,
relative to diesel, but that exhaust control technology choice, maintenance practices,
and operating conditions on CNG were key in achieving favorable results. For diesel
buses, PM emissions were not strongly correlated with diesel sulphur content.
Retrofitting older buses with advanced emission controls engines can cost-effectively
achieve significant emission reductions of key pollutants, such as PM, with a
performance that is comparable to CNG and newer diesel buses.
5) Most of the variations in total operating cost across fuel systems was primarily
due to changes in fuel cost, since maintenance cost varied considerably less; in turn,
the variation in fuel costs was due to differences in fuel economy -- where CNG
performs poorly -- and fuel unit price (which depended greatly on context; even between
cities within the US). Furthermore, analysis showed that, from a financial perspective, a
life-cycle cost modeling approach to account for the total cost of ownership of buses
would be more appropriate to compare various fuel and bus systems, given the
differences in operational performance and considering the different composition of
capital and operating costs over time.
The critical problem raised in this chapter is the need to incorporate operational and
financial issues that are important to vehicle operators in the broader set of transport
and environmental policy goals in policy evaluation. It is important and useful to critically
evaluate CNG policy from the perspective of vehicle users and operators, because it is
the policy responses of these actors that crucially determine the extent to which
implementation, and the associated emissions reductions, actually occur and are
successful. More particularly, analyzing the operational and financial performance of
bus fleets on CNG or any other alternative fuel is important because it is this
performance that critically determines the bus operator’s policy responses. Chapter 3
showed that for CNG, environmental benefits can be attained at competitive incremental
costs in comparison to diesel and diesel-hybrids, making this fuel an important option in
controlling emissions in bus fleets without the need for additional exhaust control
measures or improved fuel quality, which is very important in contexts such as India. At

162
the same time, the challenge for CNG is that “cleaner” diesel and more advanced diesel
engine technologies are making headway in order to comply with stricter emission
standards set by environmental authorities, particularly by using low sulphur diesel in
combination with exhaust emissions control measures.
Chapter 4 The objective of Chapter 4 was to critically evaluate
the operational and financial performance of DTC's CNG-fueled bus fleet in order to
assess how the conversion from diesel to CNG in Delhi had affected fleet operations
and financial performance, and thus addressing the important research need of
conducting a post-implementation assessment of CNG. From the analysis of DTC's
experience, key lessons were drawn related to the long-term viability of large-scale
conversions of bus fleets to CNG, for comparison with other CNG bus transit fleets, and
for informing techno-economic and environmental analyses of CNG bus transit
operations, as follows:
1) Given various technical, logistical and institutional challenges, the
implementation of CNG at DTC showed the importance of co-ordination between
various actors, including vehicle manufacturers, fuel suppliers, bus and other public
motor vehicle operators, and different levels of government.
2) The initial drastic capacity reduction in bus services at DTC, due to bus
scrappage and CNG mandates, demonstrated the importance of more careful planning
and of carrying out the implementation in a phased manner.
3) CNG required significant investments in buses at considerable added costs
relative to diesel buses, in addition to the investments in depot modifications and fuel
infrastructure. Also, operating costs, per kilometre, grew considerably with the use of
CNG, firstly due to significantly increased fuel expenses per kilometre -- despite low and
declining CNG price -- because of the lower fuel economy of CNG buses; and secondly,
due to increased maintenance costs (and breakdowns) per kilometre, despite declining
effective kilometres per bus on road. Moreover, both these costs were further

163
exacerbated by the introduction of CNG low-floor buses. As a whole, these factors
severely affected DTC's financial situation for the worse.
The key question raised from this research is how has the significant investment in CNG
contributed to, or took away from, the objective of providing convenient, affordable and
viable public transit service in Delhi, which is crucially important first and foremost to
cater for the accessibility and mobility needs of the masses, and also to minimize the
need for personal motor vehicle activity and its associated impacts, including air
pollutant emissions. It may be argued that the debt burden, and the adversely affected
financial situation of DTC, due to the increased capital and operating costs after CNG
implementation, likely detracted from this objective, as well as the ability to enhance
public transit capacity and provide widespread coverage region-wide.
Chapter 5 The objective of Chapter 5 was to evaluate the life-
cycle costs (LCCs) of CNG bus configurations in Delhi, and compare them with those
associated with their diesel counterparts in the Indian context. The evaluations were
based on actual (on-road) bus performance data for DTC and other public bus transit
agencies, in order to closely reflect fuel and bus technologies, operating conditions, and
costs that are prevalent in urban India. I also analyzed the sensitivity of life-cycle costs
relative to fuel economy and fuel price variations to show how these key factors affect
the viability of CNG bus systems relative to their diesel counterparts. Key lessons
drawn from these analyses were:
1) The LCCs for CNG are higher than for diesel, but CNG negatively affects the
LCC of Standard buses proportionately more than for the low-floor buses, for which the
LCC is already high. The LCC is significantly higher for the low-floor air-conditioned,
relative to that of the low-floor, and in particular the Standard, CNG buses.
2) The significantly higher LCC of the CNG-LF/AC relative to CNG-LF and in
particular the CNG-Std. buses is driven by higher bus purchase, followed by fuel and
maintenance costs.

164
3) The sensitivity analysis showed the significant effect of the fuel price (and fuel
economy) of CNG relative to diesel, on the competitiveness of CNG relative to diesel.
The CNG-to-diesel price ratio, a key factor in this regard, has varied widely, owing to
market forces and government policy in India. Both diesel and CNG prices, and the
CNG-to-diesel price ratio, are lower in India relative to the US, where these prices
appear to be more market-driven.
Overall, the analysis showed the critical importance of the fuel price and fuel economy
of CNG, for the competitiveness of CNG relative to diesel buses. This, along with the
wide variation in CNG and diesel prices, demonstrates the need for careful fuel pricing
policies when CNG is implemented in bus transit. But also, the need for CNG price to
properly reflect the costs of production and delivery. A key question for policy that this
research raises is whether the significantly higher LCCs for low-floor and low-floor air-
conditioned buses, even for diesel, are justified by increased patronage, especially by
those who might otherwise use personal motor vehicles. As well, what are the
opportunity costs of the low-floor and AC buses, in terms of transit supply under budget
constraints, and providing affordable transit service to commuters?
Chapter 6 The objective of Chapter 6 was to evaluate the cost-
effectiveness (CE) of CNG implementation on past and current bus technologies
relative to diesel, by comparing the related LCCs versus their respective emissions
outcomes. Overall, I addressed two major questions. Firstly, I investigated the CE of
CNG implementation in the public bus fleet in Delhi, by evaluating the incremental costs
and emissions performance of buses that were used in the conversion to CNG in the
early 2000s in that city. Secondly, for Delhi, but also more broadly the Indian context, I
analyzed CNG implementation in a public bus fleet today considering that CNG and
diesel buses must comply with stricter Indian emissions standards. Costs were based
on LCCs from Chapter 5, while emissions were evaluated in terms of PM, NOX, and
CO2(e). Key lessons drawn from the analyses were:

165
1) A fully implemented fleet of CNG-Std. buses in the early 2000s would minimize
emissions of PM and CO2(e) pollutants relative to existing diesel buses and even in
relation to cleaner diesel technologies available at the time. However, the choice that
resulted in the largest emissions reduction, at the lowest cost, in tackling these
emissions challenges would likely have been to upgrade to a new fleet of diesel buses
running on lower sulphur fuel and using improved exhaust aftertreatment systems,
given the higher incremental LCCs of CNG-Std. buses. Modern low-floor CNG buses
also offer considerable reductions benefits of PM and CO2(e) emissions relative to
comparable low-floor diesel buses; however, CNG-LF’s costs of lowering these
emissions relative to low-floor diesel buses is much higher than for CNG-Std. relative to
comparable Diesel-Std. buses, and substantially more so if CNG-LF buses are
compared to Diesel-Std. buses of similar emissions and fuel technology, thus
immensely increasing its cost-effectiveness ratio relative to all other options.
2) The results of the scenario analysis showed that, in Scenario 1, with a full
substitution of diesel buses by CNG, which would only happen if there is no budget
constraint, there would be substantial PM reductions, lower CO2(e) emissions, but
higher NOX emissions, for all CNG bus types. However, this scenario is not consistent
with the reality in Delhi. Since LCCs are higher for CNG than diesel, which likely
constrained bus capacity, I analyzed Scenario 2 (where some diesel buses would
continue to operate to account for reduced supply of CNG buses) and Scenario 3
(where the operator retires all diesel buses and bus transit capacity effectively is
reduced on CNG, which was the case in Delhi). The analysis of these two scenarios
shows an important trade-off between urban air pollutant and greenhouse gas
emissions. Whereas PM emissions were lower in Scenario 3, CO2(e) emissions were
lower in Scenario 2, for CNG vs. Diesel, on both Std. and LF buses.
So, in relation to the policy decision that required CNG implementation in Delhi, I
showed that CNG was not necessarily the most effective choice in the early 2000s, as
cleaner diesel buses would have a lower CE ratio, and thus resulted in the largest
emissions reductions, at a lower incremental cost, in addressing both health-critical (PM

166
and NOX) and climate change (CO2(e)) challenges. However, if we consider that CNG
implementation was a given, following the Supreme Court of India decision, then, the
decision of restricting buses to use only CNG was an optimal choice from the point-of-
view of health-critical air pollution (PM emissions), and despite the extent to which a
lower supply of CNG buses may have increased traffic of lower occupancy motor
vehicles. From the point-of-view of climate change objectives, I showed that keeping a
residual number of diesel buses would have likely been a better choice, but then again,
the primary motivation of the policy instituted in early 2000s was to address the air
pollution challenge (specifically, PM emissions) and not climate change. Furthermore,
as I argued in Chapter 6, this policy decision should also be analyzed from a broader
context of air quality that was critically poor at the time in Delhi, the institutional
challenges of upgrading oil refining capacity, and concerns around the enforcement of
actually using cleaner diesel in buses. The CNG policy decision, when taken with these
contextual factors into consideration, may actually justify the higher costs that were
incurred for achieving emissions benefits.
7.3 Policy implications of research
In the early 2000s, after CNG started being implemented in Delhi, PM emissions
decreased due to significant reductions coming from the public bus transit system
(Guttikunda, 2012). However, these emissions benefits were accompanied by major
disruptions to bus supply during the 2-year transition period from diesel to CNG.
Further, the disruptions had serious adverse consequences to bus transit users at the
time (Bell et al., 2004), least of which were frustrated commuters due to the lack of
buses and extremely high load factors, and related disruption of economic activity due
to this lack of public transit availability, all of which was not quantified in my research.
As discussed, the problem was that when the natural gas policy came into effect, there
were various resource, logistical and institutional challenges encountered by DTC in
establishing a CNG infrastructure for its bus fleet operations and in the initial transition
to CNG that prevented the technology from expanding. In this sense, a sensible policy
approach at the time in Delhi would have been a gradual implementation of CNG, with

167
diesel buses still operating during the transition to the new fuel system, as stated in the
conclusion of Chapter 4.
Even after CNG bus numbers in Delhi increased, the emissions benefits of CNG were
diluted, as shown in Chapter 6, since bus service provision capacity, on a per-
population basis, never reached the levels seen before CNG. The problem, as I showed
in Chapter 4, was that the added costs of CNG negatively affected DTC's financial
situation over time, and this continues to reflect in the operator's extremely high debt
service load and low fare recovery rates even today39. In fact, I analyzed in Chapter 5
the incremental life-cycle costs of CNG over diesel, for which the key contributor to
these differences was higher fuel expenditures for CNG; and fuel expenditures were
higher, despite a low CNG fuel price, mostly due to the significantly poorer fuel
economy of CNG buses in Delhi, which was almost double the worst expected
performance result seen in the literature for like-to-like buses, as shown in Chapter 3.
Furthermore, in capital expenditures terms, the added costs of CNG for a standard bus-
based fleet is 24% higher, while for LF/AC buses is +10%, relative to their
corresponding diesel buses.
So, given the above considerations, a crucial question that my research raises is, apart
from its emissions outcomes, how has the significant investment in CNG contributed to,
or taken away from, the objective of providing convenient, affordable and viable public
transit service in Delhi, which is, as argued earlier, crucially important. This question
gains particular importance because of the decline in passenger-kilometres at DTC, and
the equally significant reduction in public transit modal shares in Delhi among other
metropolitan cities in India, over the past couple of decades.
It may be argued that the debt burden, and the overall financial situation due to the
increased capital and operating costs per passenger-kilometre due to CNG
39 The problem is persistent, as shown by the latest financial report for DTC -- for the 2014-15 period -- where interest payments corresponded to 73% of all expenses (less depreciation), and operating expenses equaled to 121% of all traffic receipts (CIRT, 2017).

168
implementation has in fact detracted from this objective, as well as the ability to
enhance public transit capacity and provide widespread coverage region-wide. After all,
if the same investment had been made in regular diesel buses, a larger capacity to
deliver bus transit services might have resulted at lower cost, thereby better achieving
equity, and as I showed in Chapter 6, better environmental results, by helping avoid a
larger number of personal motor vehicle trips. An additional problem in this regard is of
course that the investments are being made without any accompanying transit demand
management measures.
All of the foregoing points have important implications for policy-making and
implementation, as well as for policy analysis. They demonstrate the need to analyse
and formulate environmental policies such as the implementation of CNG on Delhi’s
buses broadly, in terms of a wide range of impacts for different groups in society, rather
than narrowly in terms of only environmental (in this case emissions) outcomes, and to
explicitly consider and address conflicts and trade-offs between environmental, and
other (transit operation, socio-economic and equity) objectives.
7.3.1 Other issues
Parameter estimation Another important issue that was raised
relates to the choices for performance data collection methods and the high degree of
variability of operational measures that resulted from different choices in performance
evaluation methodology. In Chapter 3, the case of WMATA showed significantly
different fuel economy performance results between chassis dynamometer tests and
on-road data for an identical sample of buses, being much more favorable towards CNG
buses in the dynamometer tests than in the on-road results. The chassis dynamometer
tests were conducted using driving test cycle specifically designed to mimic road
conditions of WMATA's fleet, but showed a fuel economy penalty for CNG buses, vis-à-
vis diesel, being nine times smaller as recorded by on-road data collected during a 12-
month evaluation cycle. The differences in this example are striking, and have
significant implications for analysis, given that fuel economy data typically feeds into

169
multiple dimensions of various analytic frameworks, such as in assessing vehicle range
(fuel autonomy) requirements given operating efficiency goals, in estimating fuel
expenditures in terms of financial feasibility, or even in terms of evaluating
environmental outcomes, such as with CO2 emissions estimation.
I do not want to argue on the merits of chassis dynamometer tests versus on-road tests.
But, in WMATA's example in Chapter 3, the longer-term on-road statistics provided a
more robust sample of performance estimates for use in the analytic framework (as did
on-road data from DTC's CNG buses), and also illustrated how limited sampling (be it
via chassis dynamometer or other methods) adds much uncertainty to the analytic and
decision-making process. The implication of this for policymaking is that feasibility
studies should ideally account for uncertainty in the use of parameter assumptions,
whenever data limitation is present, such as by use of simulation or stochastic methods,
by considering expected variations of these input parameters.
For this dissertation, I collected data in the Indian context based on long-term and
actual on-road conditions, in order to increase the validity of analysis findings. Even so,
I incorporated uncertainty in parameter estimation into the analytic framework via the
use of a sensitivity analysis in Chapter 5 and the scenario analysis in Chapter 6. With
this framework, key stakeholders and decision-makers can evaluate choices by
incorporating this uncertainty into the planning process, to set goals and objectives,
realistically budget resource needs and financial requirements, and set expectations for
operators, users, or other stakeholders.
Reliability measures In Chapter 4, I explained how DTC outsourced
maintenance of newly procured low-floor buses to vehicle manufacturers, for the entire
duration of the expected vehicle service life of 12 years. Interestingly, reliability
performance of the newly purchased low-floor buses was not significantly different from
the ageing fleet of standard CNG buses that still operated at DTC when data was
gathered; actually, low-floor bus reliability was much worse during a certain period. This
fact raises the issue of why new CNG-LF buses were apparently less reliable than much

170
older CNG-Std. buses. While the new low-floor CNG technology could have been
influenced by short-term teething problems, it also cannot be dismissed that the choice
of performance metric to hold outsourced firms accountable to contractual maintenance
quality standards may have influenced the overall reliability performance of CNG
technology. In DTC’s case, rather than holding low-floor bus maintenance providers
accountable to a reliability measure, such as number of breakdowns-per-kilometre,
vehicle manufactures were only accountable to meet a bus availability target40. So, it
should be quite obvious that, if key performance measures related to both reliability and
availability are not integrated into pricing mechanism of maintenance contracts (e.g., in
the form of penalties in payment transfers to providers for not meeting breakdown
targets), there can be an incentive for maintenance providers in having buses starting
its trips, even though buses may be at high risk of not completing the journey due to
mechanical or other technology related problems, since it would increase the availability
percentage. Whether or not this was a motivating factor on the part of maintenance
providers driving the poor reliability performance statistics of new low-floor CNG buses
at DTC, the fact remains that there is intense public attention on the issue (negative at
best), as cited in previous chapters. This also shows the critical importance of carefully
selecting performance measures.
From this problem, I raise a few key policy lessons. First, that outsourcing fleet
maintenance was a very interesting (and valid) strategy, as it -- theoretically -- allowed
the transit operator to transfer the technological performance risk of a new fuel system
to the vehicle manufacturer. The problem is that, to effectively transfer this risk, the
transit operator must be capable of integrating the other important aspects that
influence operational efficiency of its fleet. For example, in Chapter 3, I showed that
NYCT has set internal performance metrics for in-house maintained buses in terms of
not only availability, but also reliability and recovery time of buses submitted to
maintenance. Perhaps, all these operational performance goals should be taken into
account in the contractual obligations of maintenance service providers in DTC’s case, 40 Availability at DTC, is measured by dividing the completed distance of trips by scheduled distance of trips (Chapter 5).

171
to fully allow for a more effective transfer (and thus management) of technological
operational risks, and thus aim for more reliable fleet operations.
7.4 Scope for future research
7.4.1 Trade-off between costs and public transit capacity and its impacts
Since the early 2000s when CNG was implemented in Delhi, there has been a
significant change in mode shares in the city, with substantial increase in the size and
share of low occupancy motor vehicle usage, as I stated in Chapter 6. I showed,
through that research, to what extent bus supply constraints and modal shifts reduced
the effectiveness of environmental objectives. To do this, I quantified the effects of
hypothetical modal shifts on the cost-effectiveness of CNG measures using a scenario
analysis. The latest data shows that from 2001 to 2011 the urban part of Delhi
experienced an increase of 3.5 million people (+27%) with growing urban density rates
(GNCTD, 2017), an environment that favors the feasibility of any public transit system;
during this same period, however, public bus transit fleet numbers have remained
constant, at best. Meanwhile, I have to recognize the difficulty and uncertainty in
attributing causality of the modal changes specifically to reductions in bus capacity;
which in turn, I assumed were caused by the operator’s capital constraints. Certainly
bus supply restrictions are a contributing factor to these modal changes, however, in
this respect, I believe there is much room for research in India and countries that face
similar challenges.
So, given the above context, I believe that more research is needed in quantifying
precisely how (and to what extent) higher bus life-cycle costs may negatively affect the
capacity of service provision of transit operators. In addition, a related question is the
need to investigate how possible bus supply capacity reductions may impact commuter
mode choices and transit demand. Relative to these two questions, there are many
aspects that would have to be explored in terms of the decisions that are made
regarding bus fleet numbers in Indian cities. For instance, I would include the need of a
172
deep understanding of the bus operator’s rationale and priorities, financial and
operational constraints, and how all of this is factored into fleet number and deployment
decisions; the political economy of how fleet funding and decision-making is taken
across various layers governmental jurisdictions; the socio-economic context and other
institutional factors that may affect decision-making; and, the motivations and influences
of various stakeholders in this process. For both these research questions, the case of
Delhi, and perhaps even of other large Indian cities that have exhibited similar trends of
a public bus transit system that has not kept pace with population growth, will be a
fertile ground to consider in an integrated manner policy-relevant, contextually-grounded
research on these complex issues. This proposed line of research would certainly
enhance cost-effectiveness analysis framework not only for evaluating alternative
transport fuel outcomes, as I did in this dissertation, but also in evaluating other public
transit and urban transport objectives, considering an integrated transit perspective.
7.4.2 CNG feasibility
For context, consider that Delhi, Mumbai, Kolkata, Chennai and Bangalore in total
benefited from 41% of buses funded by the Indian national program called Jawaharlal
Nehru National Urban Renewal Mission, JNNURM (MoUD, 2012), but that these cities,
combined, represented only about 16% of India's urban population. This may suggest
that larger bus operators, in larger metropolitan cities of India, have access to more
financial resources, and are thus able to count on technological options, such as CNG,
that would otherwise not be available to smaller operators in smaller Indian cities that
face greater budget constraints. In fact, CNG had its use expanded beyond Delhi to
other large cities as well; from 2010-11 to 2014-15, 1210 additional CNG buses (+32%)
were used in other urban areas like Mumbai, Pune, and Ahmedabad (CIRT, 2012;
CIRT, 2017). Also, there is a considerable domestic installed capacity with logistical
support for expanding natural gas use in bus transport in other cities (Government of
India, 2014).

173
So, it is reasonable to expect that a gradual expansion of CNG to greater scale across
the country may not encounter the same challenges faced in Delhi. However, these
larger cities have established formal public transport systems and thus are more likely
to receive funding for bus purchases for fleet renewal or fleet augmentation, whereas
these formal public transport systems are not typically present in smaller Indian cities
that normally rely on informal para-transit systems (Tiwari, 2011). Given this context, it
is very unlikely that smaller Indian cities may leapfrog from higher polluting diesel buses
to more costly technologies such as CNG. Furthermore, in terms of infrastructure and
logistical capabilities, other cities in India that do not have local CNG installed logistical
and feedstock supply networks, as in Delhi. These facts seriously raise the question of
whether or not such systems, as CNG, should even be considered in these contexts.
An additional issue related to the preceding challenge is the influence on alternative
transport fuel feasibility and viability for buses, vis-à-vis diesel systems, given variations
in scale in the size of a bus fleet. In other words, is there an ideal (or minimum) bus fleet
size that optimizes the financial efficiency of a CNG-based bus fleet, given technological
infrastructure and operations requirements of this fuel system? Furthermore, how would
CNG system feasibility be impacted, in India, if adopted across a range of city sizes?
My dissertation findings were based mostly on performance data from “megacities” of
India, that is, cities with populations greater than 8 million people, where travel
distances are longer and there is a substantial critical mass in terms of public transport
demand (Tiwari, 2011), as highlighted above, and thus the need for large fleets.
However, such may not be the case in smaller cities, where a smaller critical mass
exists in terms of public transit demand, and if CNG cannot be scaled down cost-
efficiently to a smaller fleet size, this may complicate the financial and operational
feasibility of CNG bus systems. Investigating these issues with in-depth research will
allow for a more comprehensive analytic framework; that is capable of handling varying
degrees of public transit realities, and that therefore is more effective in evaluating the
viability of bus alternative transport fuel systems across these varying contexts.

174
7.4.3 Fuel supply constraints
I indicated in the dissertation that there were various substantial barriers to
implementing CNG in Delhi. A specific problem was the logistical constraint, that is, in
terms of natural gas supply network needs (from upstream to distribution to bus depots),
especially since this set-up was not in place at first. If this is the case in other contexts,
this raises the question of how CNG fuel prices may be affected.
Determining the makeup of fuel prices can be quite complex, as prices are influenced
by a variety of factors, such as natural gas upstream and downstream costs, retail
costs, market conditions, in addition to which there are public policy influences through
taxes and subsidies. For example, in the US, where prices tend to be more market
driven, from 2010 to 2013 natural gas feedstock costs, as represented by the average
city-gate price (EIA, 2013) represented only about a quarter of the final retail price of
CNG (EERE, 2016). Other key cost components of fuels include capital infrastructure
for the refuelling stations, energy used in gas compression (which tends to be
significant), and fuel retailers’ margins, among others. So, natural gas feedstock prices
can represent only a small proportion of overall CNG prices, and thus, there might be
large variations in CNG costs from city to city, depending on the challenges and costs of
establishing a CNG distribution network available to the bus transit operator in India.
In Delhi, there is a well-established natural gas distribution network provided by the
local utility company, which is a business that is not dependent exclusively on gas
demand from the bus system. According to Delhi's natural gas distributor, piped natural
gas sales for domestic, commercial and industrial usage, amounted to 1.3 billion
standard cubic meters in 2012-13, representing 25% of all natural gas sales, with the
remainder 75% of natural gas being sold in the form of CNG for use as vehicle fuel
(IGL, 2017). So, given the complexity of determining a viable CNG bus fleet operation,
which in turn is dependent on infrastructure requirements and fuel availability, and a
competitive fuel price vis-à-vis diesel, more in-depth review of these issues is
warranted, in case adoption is required at varying level of city sizes, in terms of varying

175
levels of public transit demand, and given possible natural gas feedstock supply
constraints.
7.4.4 Natural gas supply scalability
Lastly, I would like to raise the importance of the scalability issue relating to CNG use in
road transport, that is, of the consequences of expanding natural gas use in
transportation in India, in terms of fuel supply availability, resource use challenges, and
effects on the price of natural gas and CNG. To put this discussion into perspective,
consider that road transport in India uses 10% of total primary energy supplied, which is
much smaller than the share of road transport to total primary energy supply observed
among higher-income OECD countries (21%) or even the shares observed globally
(15%) (IEA, 2018). Assuming road transport in India increases proportionally to
resemble the shares of this sector in the rest of the world, this means that energy
consumed in road transport will grow at a much faster pace than energy consumed in
other sectors of the economy; a trend that the country has witnessed over the past
decades, and that will likely continue into the foreseeable future. Furthermore, the share
of natural gas in India, compared to other energy sources, represents only 6% of total
energy sources (Figure 7.1a); of this 6%, road transport consumes only a small fraction
(5%) (Figure 7.1b); in 2016, natural gas consumption in road transport amounted to
2.15 million tonnes of oil equivalent (Mtoe) in India, while oil consumption was 79.6
Mtoe (IEA, 2018).
So, consider the case in which natural gas energy consumption in road transport
doubled in India. Using data from IEA (2018) in Figure 7.1b, this case would require an
increase in domestic natural gas supply to road transport to 4.15 Mtoe, increasing
overall natural gas use by an extra 5%, assuming natural gas use in all other sectors
remain the same. A four-fold increase in natural gas consumption in road transport
energy to 8.6 Mtoe in India, would require natural gas supply to increase by an extra
14%. The bottom-line from this simple exercise is that any of these scenarios --
however unlikely -- do not represent unreasonable logistical supply challenges for a

176
country like India, considering current installed natural gas upstream capacity, and
assuming a gradual increase in this capacity with more investment and resources; also
consider that India’s share of global natural gas consumption is only 1.5% (IEA, 2018),
and thus, would not be a major global disruptor to demand for this energy feedstock,
assuming most of the increase in natural gas consumption is supplied from imports.
(a) Total primary energy supply, India, by fuel type
(b) Natural Gas Use, India, by sector
*Mtoe = million tonnes of oil equivalent Source: IEA (2018)
Figure 7.1: Natural gas supply and demand, India, 2016
Though India may have the capacity to scale up CNG adoption, given the above
discussion, it is also interesting to consider if this increase in natural gas use will lead to
changes in fuel costs or even in fuel availability; in my research I showed that changes
in these factors have direct consequences for the bus operator's financial and
operational viability.
The life-cycle cost analysis and the cost-effectiveness study conducted in Chapters 5
and 6, assumed supply and prices for natural gas and CNG as exist currently, that is,
considering road transportation sector natural gas demand that is currently 2 to 3% of
overall road transport energy demand in India today (IEA, 2018). While the sensitivity
analysis in Chapter 5 did consider variations in price of CNG relative to diesel, these
scenarios were not based on an in-depth analysis of a possible expansion of CNG use
in transport sector, and the impacts that this change could have of fuel prices.
Coal & peat44%
Oil25% Biofuel
22%
Natural Gas6%
Hydro, Nuclear &
Others3%862 Mtoe*
Energy production (Electricity, CHP plants,
others)32%
Non-energy uses43%
Industry16%
Road Transport
5%
Other4%
47 Mtoe*

177
Furthermore, the dissertation also did not analyze the possible consequences of
increasing CNG adoption rates within the road transport sector, and related
requirements from upstream to downstream supply chain needs, in terms of feedstock
exploration and production (or import), logistics of doing this, feedstock processing
(purification), transportation, storage to consumption hubs, as well as local distribution
of natural gas by utility companies, and setting up of CNG refuelling infrastructure. This
is quite a complex supply system, for which scaling-up would require massive
investments, time, and resources. These issues are worth investigating.
178
References
Aggarwal, P., & Jain, S. (2016). Energy demand and CO2 emissions from urban on-
road transport in Delhi: current and future projections under various policy
measures. Journal of Cleaner Production, 128, 48-61.
AGN – Asociación Empresas Gas Natural (2016). ¿Gas natural en el Transantiago
[Spanish]? Retrieved from http://www.agnchile.cl
Apte, J., Kirchstetter, T., Reich, A., Deshpande, S., Kaushik, G., Chel, A., Marshall, J., &
Nazaroff, W. (2011). Concentrations of fine, ultrafine, and black carbon particles
in auto rickshaws in New Delhi, India. Atmospheric Environment, 45, 4470-
4480. doi:10.1016/j.atmosenv.2011.05.028
ARAI (2008). Emission factor development for Indian vehicles. In: Ambient Air Quality
Monitoring and Emission Source Apportionment Studies. Central Pollution
Control Board, Ministry of Environment & Forests, Govt. of India.
ARAI (2009). Source profiling for vehicular emissions. In: Ambient Air Quality Monitoring
and Emission Source Apportionment Studies. New Delhi, India: Central
Pollution Control Board, Ministry of Environment & Forests, Govt. of India.
ARAI (2011). Indian Emissions Regulations. Retrieved from:
https://www.araiindia.com/pdf/Indian_Emission_Regulation_Booklet.pdf
ARCADIS Geraghty & Miller, Inc, United States, & Transit Development Corporation.
(1998). Guidebook for evaluating, selecting, and implementing fuel choices for
transit bus operations. Report No. 38. Washington, D.C.: Transportation
Research Board/National Academy Press.
Barnitt, R. (2008). In-Use Performance Comparison of Hybrid Electric, CNG, and Diesel
Buses at New York City Transit. SAE Technical Paper 2008-01-1556.
Warrendale, PA: Society of Automotive Engineers. doi:10.4271/2008-01-1556.

179
Barnitt, R., & Chandler, K. (2006). New York City Transit (NYCT) hybrid (125 Order) and
CNG transit buses final evaluation results. NREL/TP, 540-40125. Golden, Colo:
National Renewable Energy Laboratory. doi: 10.2172/894985.
Bell, R.G., Mathur, K., Narain, U., & Simpson, D. (2004). Clearing the air: How Delhi
broke the logjam on air quality reforms. Environment, 46(3), 22-39.
BIS – Bureau of Indian Standards (2002). Motor Gasolines – Specification, IS
2796:2000. Third revision, with amendments. New Delhi: Bureau of Indian
Standards.
BLS – Bureau of Labor Statistics (2016). Consumer Price Index-All Urban Consumers:
U.S. All items, 1982-84=100 [online database]. United States Department of
Labor: Bureau of Labor Statistics. Retrieved from: http://www.bls.gov/cpi
Boardman, A., Greenberg, D., Vining, A., & Weimer, D. (2001). Cost-benefit analysis:
concepts and practice (2nd ed.). New Jersey: Prentice Hall.
Bond, T., & Sun, H. (2005). Can reducing black carbon emissions counteract global
warming? Environmental Science and Technology, 39, 5921-5926.
Bond, T., et al. (2004). A technology-based global inventory of black and organic carbon
emissions from combustion. Journal of Geophysical Research, 109, D14203.
Bose, K., & Sundar, S. (2005). Emissions Test Results from Diesel Buses, with and
without Oxidation-Catalyst and Regenerating Particle-Trap, and CNG Buses
with Three-Way Catalyst in India. SAE Technical Paper No. 2005-01-0477.
Society of Automotive Engineers: Warrendale, PA.
Browne, D., & Ryan, L. (2011). Comparative analysis of evaluation techniques for
transport policies. Environmental Impact Assessment Review, 31, 226-233. doi:
10.1016/j.eiar.2010.11.001

180
CAA – Clean Air Asia (2012). Accessing Asia: Air Pollution and Greenhouse Gas
Emissions Indicators for Road Transport and Electricity. Pasig City, Philippines.
Retrieved from: http://www.cleanairasia.org
Chandler, K. & Eudy, L. (2007). SunLine Transit Agency, Hydrogen-Powered Transit
Buses: Preliminary Evaluation Results. NREL/TP, 540-41001. Golden, Colo:
National Renewable Energy Laboratory. doi: 10.2172/899297.
Chandler, K. (2006). Ten years of compressed natural gas (CNG) operations at SunLine
Transit Agency, April 2003-December 2004. NREL/SR, 540-39180. Golden,
Colo: National Renewable Energy Laboratory. doi: 10.2172/876662.
Chandler, K., Eberts, E., & Melendez, M. (2006). Washington Metropolitan Area Transit
Authority compressed natural gas transit bus evaluation. NREL/TP, 540-37626.
Golden, Colo: National Renewable Energy Laboratory. doi: 10.2172/881923.
Chelani, A., & Devotta, S. (2007). Air Quality Assessment in Delhi: Before and After
CNG as Fuel. Environmental Monitoring and Assessment, 125(1), 257-263. doi:
10.1007/s10661-006-9517-x
China: Building the dream (2014, April 19). In Special Report: China. The Economist.
Retrieved from: http://www.economist.com/
CIRT – Central Institute of Road Transport (1990–2017). State Transport Undertakings -
Profile and Performance. Annual reports for each preceding financial year from
1989-90 to 2016-17. Pune, India: Central Institute of Road Transport.
CIRT – Central Institute of Road Transport (2009). Compendium of transport terms – 7th
Revised Edition. Pune, India: Central Institute of Road Transport.
Clark, N., Kern, J., Atkinson, C., & Nine, R. (2002). Factors Affecting Heavy-Duty Diesel
Vehicle Emissions, Journal of the Air & Waste Management Association, 52(1),
84-94. doi: 10.1080/10473289.2002.10470755.

181
Clark, N., Zhen, F., Wayne, W., Schiavone, J., Chambers, C., Goloub, A., & Chandler,
K. (2009). TCRP Report 132: Assessment of Hybrid-Electric Transit Bus
Technology. Washington, D.C..: Transportation Research Board of the National
Academies.
Cohen, J T, Hammitt, J K, & Levy, J I. (2003). Fuels for Urban Transit Buses: A Cost-
Effectiveness Analysis. Environmental Science & Technology, 37(8), 1477-
1484.
CPCB – Central Pollution Control Board (2010). Status of the vehicular pollution control
programme in India. PROBES/136/2010. New Delhi, India: Central Pollution
Control Board, Ministry of Environment & Forests, Government of India.
CPCB – Central Pollution Control Board (2012). National Ambient Air Quality Status &
Trends in India: 2010. NAAQMS/35/2011-2012. New Delhi, India: Central
Pollution Control Board, Ministry of Environment & Forests, Government of
India.
CPCB – Central Pollution Control Board (2015). Ambient air quality data. New Delhi:
Central Pollution Control Board. Accessible at http://cpcb.nic.in/
CSE – Centre for Science and Environment (2001). “Special Report” on CNG in Delhi.
New Delhi, India: Down to Earth, 9(23), April 30. p.32.
CSE – Centre for Science and Environment (2002a). A report on the independent
inspection of fuel quality at fuel dispensing stations, oil depots and tank lorries.
February 5, 2002. New Delhi: Centre for Science and Environment.
CSE – Centre for Science and Environment (2002b). State of India’s Environment – The
Citizens’ Fifth Report, Part I: National Overview. New Delhi: Centre for Science
and Environment.

182
Davis, S., Diegel, S., & Boundy, R. (2015). Transportation Energy Data Book: Edition
34. ORNL-6991. Washington, D.C.: Vehicle Technologies Office, Office of
Energy Efficiency and Renewable Energy, U.S. Department of Energy.
Retrieved from: http:// cta.ornl.gov/data
Davis, S., Williams, S., & Boundy, R. (2017). Transportation Energy Data Book: Edition
36. ORNL/TM-2017/513. Washington, D.C.: Vehicle Technologies Office, Office
of Energy Efficiency and Renewable Energy, U.S. Department of Energy.
Retrieved from: http:// cta.ornl.gov/data
Deuman Ingenieros (2003). Preparación del estudio para la evaluación ambiental y
económica de buses de tecnología limpia (in Spanish). Final Report, January
2003. Santiago, Chile: Secretaría Interministerial de Planificación de
Transporte. Retrieved from: http://www.sectra.cl
DieselNet.com (2018). EU: Heavy-Duty Truck and Bus Engines. Retrieved from:
https://www.dieselnet.com/standards/eu/hd.php.
DTC – Delhi Transport Corporation (2015). DTC Website. Government of National
Capital Territory of Delhi. Retrieved from: http://delhi.gov.in/
EEA (2013). EMEP/EEA air pollutant emission inventory guidebook 2013: Technical
guidance to prepare national emission inventories. Technical report No
12/2013. European Environment Agency. Retrieved from:
https://www.eea.europa.eu/
EERE – Energy Efficiency and Renewable Energy, U.S. Dept. of Energy (2013). Clean
Cities Alternative Fuel Price Report [various issues ranging from May 2000 to
April 2013]. Golden, Colo.: U.S. Dept. of Energy, Energy Efficiency and
Renewable Energy, Clean Cities. Retrieved from: http://www.eere.energy.gov/

183
EERE – Energy Efficiency and Renewable Energy, U.S. Dept. of Energy (2016). Clean
Cities Alternative Fuel Price Report [various issues ranging from May 2000 to
April 2016]. Golden, Colo.: U.S. Dept. of Energy, Energy Efficiency and
Renewable Energy, Clean Cities. Retrieved from: http://www.eere.energy.gov/
EIA – U.S. Energy Information Administration (2013). Natural Gas Prices: Citygate
Price, U.S., Monthly: 2000-2013 data [Data set]. Retrieved from
http://www.eia.gov
EIA – U.S. Energy Information Administration (2016). Country Analysis Brief: India
(June 14, 2016 update). Washington, DC: U.S. Energy Information
Administration, U.S. Department of Energy. Retrieved from http://www.eia.gov/
EIA – U.S. Energy Information Administration (2018). Monthly Energy Review, February
2018 [Database: Table 10.3]. Washington D.C.: Energy Information
Administration, U.S. Department of Energy. Retrieved from
https://www.eia.gov/totalenergy/data/monthly/#renewable
EPA – U.S. Environmental Protection Agency (2011). Emission Standards Reference
Guide. Heavy-Duty Highway Compression-Ignition Engines and Urban Buses –
Exhaust Emission Standards. United States Environmental Protection Agency.
Retrieved from: http://epa.gov/
EPA – U.S. Environmental Protection Agency (2012). Report to Congress on Black
Carbon. U.S. EPA: EPA-450/R-12-001 March 2012. Retrieved from:
http://epa.gov/
ESMAP (2011). Transit Bus Operational and Maintenance Practices to Maximize Fuel
Economy. Report No.63116 – GLB. Washington, DC.: The World Bank, Energy
Sector Management Assistance Program.
Eudy, L. (2002). Natural gas in transit fleets: a review of the transit experience.
NREL/TP-540-31479. Golden, CO: National Renewable Energy Laboratory. doi:
10.2172/15000215.

184
Faiz, A., C. S. Weaver, M. P. Walsh (1996). Air Pollution from Motor Vehicles –
Standards and Technologies for Controlling Emissions. Washington D.C.: The
World Bank, November 1996.
FHWA – U.S. Federal Highway Administration (2017). Highway Statistics 2016
[database: Table MV-1]. U.S. Department of Transportation, Federal Highway
Administration. Retrieved from: www.fhwa.dot.gov
Gandhi, K.K. (2011, May). Cleaner Liquid fuels: Way forward. Panel discussion on road
map for continual improvement presented at the workshop on “Cleaner liquid
fuels and improved vehicular technologies, May 31, 2011.” New Delhi, India:
The Energy and Resources Institute.
Gargava, P., Chow, J., Watson, J., & Lowenthal, D. (2014). Speciated PM10 Emission
Inventory for Delhi, India. Aerosol and Air Quality Research, 14, 1515–1526.
doi: 10.4209/aaqr.2013.02.0047
GNCTD - Govt. of National Capital Territory of Delhi (2012). Statistical Abstract of Delhi
2012. New Delhi, India: Directorate of Economics and Statistics, Govt. of
National Capital Territory of Delhi. Retrieved from: http://delhi.gov.in/
GNCTD - Govt. of National Capital Territory of Delhi (2017). Statistical Abstract of Delhi
2016. New Delhi, India: Directorate of Economics and Statistics, Govt. of
National Capital Territory of Delhi. Retrieved from: http://delhi.gov.in/
Goel, R., & Guttikunda, S. (2015). Evolution of on-road vehicle exhaust emissions in
Delhi. Atmospheric Environment, 105, 78-90. doi:
https://doi.org/10.1016/j.atmosenv.2015.01.045
Goldemberg, J., United Nations Development Programme, United Nations, & World
Energy Council. (2000). World energy assessment: Energy and the challenge of
sustainability. New York, N.Y: United Nations Development Programme.

185
Golub, A., Zhen, F., Clark., N., Wayne, S., Schiavone, J., Chambers, C., Chandler., K.
(2011). Creation of Life-Cycle Cost Tool for Transit Buses to Evaluate Hybrid
Electric Bus Technologies in Real-World Operation. Transportation Research
Record: Journal of the Transportation Research Board, 2218, 19-26.
Government of India (2009a). Minutes of the 68th Meeting of Central Sanctioning and
Monitoring Committee (CSMC) for sanctioning projects under UIG of
JNNURM.K-14012/2(68)/2006-NURM. New Delhi, India: Ministry of Urban
Development, Government of India. Retrieved from: http://jnnurm.nic.in/
Government of India (2009b). Minutes of the 69th Meeting of Central Sanctioning and
Monitoring Committee (CSMC) for sanctioning projects under UIG of
JNNURM.K-14012/2(69)/2006-NURM. New Delhi, India: Ministry of Urban
Development, Government of India. Retrieved from: http://jnnurm.nic.in/
Government of India (2009c). Minutes of the 70th Meeting of Central Sanctioning and
Monitoring Committee (CSMC) of 26.2.2009, for sanctioning projects under UIG
of JNNURM.K-14011/48/2006-UT (Pt.). New Delhi, India: Ministry of Urban
Development, Government of India. Retrieved from: http://jnnurm.nic.in/
Government of India (2011). Minutes of the 95th Meeting of Central Sanctioning and
Monitoring Committee (CSMC) for sanctioning projects under UIG of JNNURM.
K-14012/2(95)/2006-NURM. New Delhi, India: Ministry of Urban Development,
Government of India. Retrieved from: http://jnnurm.nic.in/
Government of India (2012). Minutes of the 104th Meeting of Central Sanctioning and
Monitoring Committee (CSMC) for sanctioning projects. K-14011/3/2012-UT-I.
New Delhi, India: Ministry of Urban Development, Government of India.
Retrieved from: http://jnnurm.nic.in/
Government of India (2014). Report of Expert Committee on Auto Fuel Vision and
Policy 2025. New Delhi, India: Ministry of Petroleum and Natural Gas,
Government of India. Retrieved from: http://petroleum.nic.in/

186
Government of India (2016). Monthly All-India Consumer Price Index Numbers for
Industrial Workers. New Delhi, India: Labour Bureau, Government of India.
Retrieved from: http://labourbureau.nic.in
Graftieaux, P., Vergara, W., & Johnson, T. (2003). Global environment facility support
for sustainable transport: Early lessons from World Bank-assisted projects in
Mexico City, Mexico; Santiago, Chile; and Lima, Peru. Transportation research
record, (1846), 9-13.
Guttikunda, S. (2012). Air Pollution in Delhi. Economic and Political Weekly, 47(26), 24-
27.
Guttikunda, S., & Goel, R. (2013). Health impacts of particulate pollution in a megacity:
Delhi, India. Environmental Development, 6, 8-20. doi:
10.1016/j.envdev.2012.12.002
Guttikunda, S., & Mohan, D. (2014). Re-fueling road transport for better air quality in
India. Energy Policy, 68, 556-561.
Hao, H., Liu, Z., Zhao, F., & Li, W. (2016). Natural gas as vehicle fuel in China: A
review. Renewable & Sustainable Energy Reviews, 62, 521-533. doi:
10.1016/j.rser.2016.05.015.
Heath, Michelle, D. Golosinski, C. Raggett, D. Quinn (1996). Alternative Transport Fuels
in Canada: Prospects and Policies. Study no.70. Calgary: Canadian Energy
Research Institute, November 1996.
Hesterberg, T., Lapin, C., & Bunn, W. (2008). A Comparison of Emissions from Vehicles
Fueled with Diesel or Compressed Natural Gas. Environmental Science &
Technology,42(17), 6437-6445.

187
Hindustan Times (2017, July). Delhi’s DTC buses could become history by 2025 as
99% of fleet retires in 5 yrs. Retrieved from:
https://www.hindustantimes.com/delhi-news/ageing-buses-could-turn-dtc-
history-by-2025-in-delhi-99-fleet-retires-in-5-yrs/story-
M7KEqUEPWWx3yaFsfEakqM.html
IEA – International Energy Agency (2002). Bus systems for the future: achieving
sustainable transport worldwide. Paris, France.
IEA – International Energy Agency (2013). Production costs of alternative transportation
fuels: Influence of crude oil price and technology maturity. Paris, France:
OECD/IEA.
IEA – International Energy Agency (2018). World Energy Balances. Paris, France:
OECD/IEA.
IGL – Indraprastha Gas Limited (2017). 18th Annual Report, 2016-17. New Delhi, India:
Indraprastha Gas Limited. Retrieved from:
http://www.iglonline.net/english/Default.aspx
IVEM (2008). IVEM Base Emission Rate Correction Factor Data, Appendix B:
Correction Factor Data (.xls). Retrived from: http://www.issrc.org/ive
Jain, S., Aggarwal, P., Sharma, P., & Kumar, P. (2016). Vehicular exhaust emissions
under current and alternative future policy measures for megacity Delhi, India.
Journal of Transport & Health, 3, 404-412.
Jalihal, S.A., & Reddy, T.S. (2006). Assessment of the impact of improvement
measures on air quality: Case study of Delhi. Journal of transportation
engineering, 132(6), 482-488. doi:10.1061/(ASCE)0733-947X(2006)132:6(482).
Johnson, C. (2010). Business Case for Compressed Natural Gas in Municipal Fleets.
Technical Report NREL/TP-7A2-47919 June 2010. Golden, CO: National
Renewable Energy Laboratory.

188
Karman, D. (2006). Life-Cycle Analysis of GHG Emissions for CNG and Diesel Buses in
Beijing. 2006 IEEE EIC Climate Change Technology Conference, EICCCC
2006, 2007, 2006 IEEE EIC Climate Change Technology Conference, EICCCC
2006.
Kathuria, V. (2005). Vehicular Pollution Control in Delhi: Impact of Compressed Natural
Gas. Economic and Political Weekly, 40(18), 1907-1915.
Khan, M., & Yasmin, T. (2014). Development of natural gas as a vehicular fuel in
Pakistan: Issues and prospects. Journal of Natural Gas Science and
Engineering, 17, 99-109. doi: 10.1016/j.jngse.2014.01.006.
Khan, M., Yasmin, T., & Shakoor, A. (2015). International experience with compressed
natural gas (CNG) as environmental friendly fuel. Energy Systems, 6, 507-531.
doi: 10.1007/s12667-015-0152-x
Kojima, M., Brandon, C. & Shah, J. (2000). Improving Urban Air Quality in South Asia
by Reducing Emissions from Two-stroke Engine Vehicles. Washington, D.C.:
The World Bank.
Kok, R., Annema, J., & van Wee, B. (2011). Cost-effectiveness of greenhouse gas
mitigation in transport: A review of methodological approaches and their impact.
Energy Policy, 39, 7776-7793. doi:10.1016/j.enpol.2011.09.023
Krelling, C., & Badami, M.G. (2016). Operational and financial performance of Delhi's
CNG-fueled public bus transit fleet: A critical evaluation. Transport Policy, 47,
178-188.
Krelling, C., & Badami, M.G. (2019). CNG and diesel urban buses in India: A life-cycle
cost comparison. International Journal of Sustainable Transportation. doi:
10.1080/15568318.2019.1594468
Kumar, N., & Foster, A.D. (2009). Air quality interventions and spatial dynamics of air
pollution in Delhi and its surroundings. International Journal of Environment and
Waste Management, 4(1), 85-111.

189
Kumar, P., Gulia, S., Harrison, R., & Khare, M. (2017). The influence of odd–even car
trial on fine and coarse particles in Delhi. Environmental Pollution, 225, 20-30.
Laver, R., Schneck, D., Skorupski, D., Brady, S., Cham, L., & Rankin, J. (2007). Useful
Life of Transit Buses and Vans. Report No. FTA VA-26-7229-07.1. Washington.
D.C.: Federal Transit Administration, U.S. Department of Transportation.
Lipman, T., & Delucchi, M. (2002). Emissions of Nitrous Oxide and Methane from
Conventional and Alternative Fuel Motor Vehicles. Climatic Change, 53, 477–
516.
Lowell, D., & Kamakaté, F. (2012). Urban off-cycle NOx emissions from Euro IV/V
trucks and buses: Problems and solutions for Europe and developing countries.
White Paper Number 18, March 2012. Washington D.C.: The International
Council on Clean Transportation (ICCT). Retrieved from:
http://www.theicct.org/sites/default/files/publications/ICCT_WP18_urban_Nox_e
missions.pdf
Lowell, D., Chernicoff, W., & Lian, F. (2007). Fuel Cell Bus Life Cycle Cost Model: Base
Case & Future Scenario Analysis. Research and Innovation Technology
Administration Final Report No. DOT-T-07-01. Washington, D.C.: U.S.
Department of Transportation.
Melendez, M., Taylor, J., Wayne, W. S., Smith, D., & Zuboy, J. (2005). Emission Testing
of Washington Metropolitan Area Transit Authority (WMATA) Natural Gas and
Diesel Transit Buses. NREL/TP-540-36355. Golden, CO: National Renewable
Energy Laboratory. doi: 10.2172/861488.
Miller, J., Minjares, R., Dallmann, T., & Jin, L. (2017). Financing the transition to soot-
free urban bus fleets in 20 megacities. Washington D.C.: The International
Council on Clean Transportation (ICCT). Retrieved from:
https://www.theicct.org/sites/default/files/publications/Soot-Free-Bus-
Financing_ICCT-Report_11102017_vF.pdf

190
MJB – M.J. Bradley & Associates (2007). Comparison of Energy Use & CO2 Emissions
From Different Transportation Modes. Washington D.C.: American Bus
Association. Retrieved from: http://www.buses.org/
MoRTH – Ministry of Road Transport & Highways (2018). Road Transport Year Book:
2015-16. New Delhi, India: Government of India, Ministry of Road Transport &
Highways, Transport Research Wing. Retrieved from: http://morth.nic.in
MoUD - Ministry of Urban Development (2012). Transforming City Bus Transport in
India through Financial Assistance for Bus Procurement under JnNURM. New
Delhi, India: Ministry of Urban Development, Government of India.
MoUD - Ministry of Urban Development (2013). Recommendatory Urban Bus
Specifications – II. New Delhi, India: Ministry of Urban Development,
Government of India.
MTT – Ministério de Transportes y Telecomunicaciones. (2008). Diagnóstico, análisis y
recomendaciones sobre el desarrollo del transporte público en Santiago
[Spanish]. Santiago, Chile. Retrieved from: http://www.mtt.cl
Municipal Corporation Ludhiana (2013). Request for proposal (RFP) from bus operators
for part financing & procurement, operation & maintenance of city buses on
specified routes under city bus services project in Ludhiana under JnNURM.
Ludhiana, India: Municipal Corporation Ludhiana.
Myhre, G., D. Shindell, F.-M. Bréon, W. Collins, J. Fuglestvedt, J. Huang, D. Koch, J.-F.
Lamarque, D. Lee, B. Mendoza, T. Nakajima, A. Robock, G. Stephens, T.
Takemura & H. Zhang (2013). Anthropogenic and Natural Radiative Forcing. In:
Climate Change 2013: The Physical Science Basis. Contribution of Working
Group I to the Fifth Assessment Report of the Intergovernmental Panel on
Climate Change [Stocker, T.F., D. Qin, G.-K. Plattner, M. Tignor, S.K. Allen, J.
Boschung, A. Nauels, Y. Xia, V. Bex and P.M. Midgley (eds.)]. Cambridge
University Press, Cambridge, United Kingdom and New York, NY, USA.
Retrieved from: http://www.ipcc.ch/report/ar5/

191
MyPetrolPrice.com (2013). “Diesel Prices in Delhi” & “CNG Prices in Delhi” [website
dataset]. Retrieved from: http://www.mypetrolprice.com/
MyPetrolPrice.com (2016). “Diesel Prices in Delhi” & “CNG Prices in Delhi” [website
dataset]. Retrieved from: http://www.mypetrolprice.com/
Narain, U. & Krupnick, A. (2007). The Impact of Delhi’s CNG Program on Air Quality.
RFF DP 07-06. Washington D.C.: Resources for the Future. Retrieved from:
http://www.rff.org
Narain, U., & Bell, R. (2005). Who changed Delhi's air? The Roles of the Court and the
Executive in Environmental Policmaking. RFF DP 05-48. Washington D.C.:
Resources for the Future. Retrieved from: http://www.rff.org
NGV Journal (2010). Chile looks forward to a natural gas massive transport.
01/Jul/2010. Retrieved from: http://www.ngvjournal.com/
NGV Journal (2011a). Mexico city plans to expand the metropolitan CNG bus fleet.
04/Feb/2011. Retrieved from: http://www.ngvjournal.com/
NGV Journal (2011b). Mexico's first natural gas powered vehicles started operating.
04/Jan/2011. Retrieved from: http://www.ngvjournal.com/
NREL – National Renewable Energy Laboratory, U.S. (2002). General evaluation plan:
fleet test & evaluation projects. NREL/BR-540-32392. Golden, CO.
NTD – National Transit Database (2017). NTD 2017 Database: Revenue Vehicle
Inventory [Data set]. U.S. Department of Transportation, Federal Transit
Administration. Retrieved from: https://www.transit.dot.gov/ntd
NYCT – New York City Transit (2011). Website data. Retrieved from
http://www.mta.info/

192
Nylund, N-O, Erkkilä, K, Clark, N., & Rideout, G. (2007). Evaluation of duty cycles for
heavy-duty urban vehicles – Final report of IEA AMF Annex XXIX. VTT
Research Notes 2396. VTT Processes Engines and Vehicles, Finland.
Retrieved from: http://www.vtt.fi/inf/pdf/tiedotteet/2007/T2396.pdf
OECD – Organization for Economic Co-operation and Development. (2005). OECD
environmental performance reviews. Chile. Paris, France.
OECD/IEA – Organization for Economic Co-operation and Development & International
Energy Agency (2015). Energy Balances of non-OECD Countries 1970-2012
[online database]. Paris, France.
OTA – U.S. Congress, Office of Technology Assessment (1994). Saving Energy in U.S.
Transportation. OTA--ETII--589. Washington, DC: U.S. Government Printing
Office, July 1994. Retrieved from: http://ota.fas.org/reports/9432.pdf
Patankar, M. & Patwardhan, A. (2006). The switch to CNG in two urban areas in India,
in Nieuwenhuis, Vergragt & Wells (eds.). The business of sustainable mobility –
From vision to reality. Ch.13, pp. 171-186. Sheffield, U.K.: Greenleaf Publishing
Ltd.
Pope III, C., Brook, R., Burnett, R., & Dockery, D. (2011). How is cardiovascular disease
mortality risk affected by duration and intensity of fine particulate matter
exposure? An integration of the epidemiologic evidence. Air Quality,
Atmosphere and Health 4, 5–14.
Posada, F. (2009). CNG Bus Emissions Roadmap: from Euro III to Euro VI. Washington
D.C.: The International Council on Clean Transportation (ICCT). Retrieved from:
http://www.theicct.org/sites/default/files/publications/CNGbuses_dec09.pdf
Posada, F., Chambliss, S., & Blumberg, K. (2016). Costs of emission reduction
technologies for heavy-duty diesel vehicles. ICCT White Paper, February 2016.
Washington, D.C.: International Council on Clean Transportation. Retrieved
from www.theicct.org.

193
Qiu, Z., Li, X., Hao, Y., Deng, S., & Gao, H.O. (2016). Emission inventory estimation of
an intercity bus terminal. Environmental Monitoring and Assessment, 188(6).
doi: 10.1007/s10661-016-5370-8.
Rabl, A. (2002). Environmental benefits of natural gas for buses. Transportation
Research Part D, 7, 2002: 391-405. doi: 10.1016/S1361-9209(02)00007-X
Ramachandra, T.V., & Shwetmala (2009). Emissions from India’s transport sector:
Statewise synthesis. Atmospheric Environment, 43(34), 5510-5517.
Ramanathan, V., & Carmichael, G. (2008). Global and regional climate changes due to
black carbon. Nature Geoscience, 1, 221- 227.
Reddy, B., & Balachandra, P. (2012). Urban mobility: A comparative analysis of
megacities of India. Transport Policy, 21, 152-164.
Rehman, M. (2019, January). The curious case of Pakistan's natural gas crisis. Herald.
Retrieved from: https://herald.dawn.com
Reserve Bank of India (2013). Handbook of Statistics on the Indian Economy, Table
147. Mumbai: Reserve Bank of India. Retrieved from:
http://www.rbi.org.in/home.aspx
Reserve Bank of India (2016). Handbook of Statistics on the Indian Economy, Table
147. Mumbai: Reserve Bank of India. Retrieved from:
http://www.rbi.org.in/home.aspx
Reynolds, C., & Kandlikar, M. (2008). Climate Impacts of Air Quality Policy: Switching to
a Natural Gas-Fueled Public Transportation System in New Delhi.
Environmental Science & Technology, 42(16), 5860-5865.
Reynolds, C., Grieshop, A., & Kandlikar, M. (2011). Climate and health relevant
emissions from in-use Indian three-wheelers fueled by natural gas and gasoline.
Environmental Science & Technology, 45(6), 2406–2412.

194
RTP - Red de Transporte de Pasajeros del Distrito Federal (2010). RTP Presentó Sus
Nuevas Unidades Eco Bus Ciudad de Vanguardia. Boletin 16/11/2010. Mexico,
D.F.: RTP. Retrieved from: http://www.rtp.df.gob.mx/
Sahai, S., Bishop, S., & Singh, J. (2009). Bus System Reform in Delhi. DIMTS.
Retrieved from: http://www.dimts.in/download/Bus_System_Reform_in_Delhi-
DIMTS_Delhi_India.pdf
Sanghi, S., Kale, S., & Mohan, D. (2001). Air quality impact assessment by changeover
to CNG buses in Delhi. Delhi: Transportation Research and Injury Prevention
Programme, IIT-Delhi. Retrieved from: http://tripp.iitd.ernet.in/
Schubert, R., & Fable, S. (2005). Comparative Costs of 2010 Heavy-Duty Diesel and
Natural Gas Technologies: Final Report. TIAX Case No.D0286/D0288 to the
California Natural Gas Vehicle Partnership. Cupertino, C.A.: TIAX LLC.
SECTRA – Secretaría Interministerial de Planificación de Transporte (n.d.). Plan de
Transporte Urbano para el Gran Santiago 2000-2010 (in Spanish). Santiago,
Chile. Retrieved from: http://www.sectra.cl
Sen, A.K., Tiwari, G., & Upadhyay, V. (2007). Should Bus Commuting be Subsidized for
Providing Quality Transport Services? Sadhna, 32(4), 329-346. Retrieved from:
http://tripp.iitd.ernet.in/
Service, R. (2014). Stepping on the gas. Science, 346(6209), 538-541.
SIAM – Society of Indian Automotive Manufacturers (2013). Website. Fuel Specification:
Diesel. Retrieved from: http://www.siamindia.com/
Sindhwani, R., & Goyal, P. (2014). Assessment of traffic–generated gaseous and
particulate matter emissions and trends over Delhi (2000–2010). Atmospheric
Pollution Research, 5, 438-446. doi: 10.5094/APR.2014.051.

195
SMA – Secretaría del Medio Ambiente (2006a). Pruebas en campo de autobuses de
tecnologías alternativas en la Ciudad de México (in Spanish). Final Report.
Mexico, D.F.: Secretaría de Medio Ambiente, Gobierno del Distrito Federal.
SMA – Secretaría del Medio Ambiente (2006b). Inventario de emisiones de
contaminantes criterio de la Zona Metropolitana del Valle de México, 2006 (in
Spanish). Mexico City, Mexico: Secretaría de Medio Ambiente, Gobierno del
Distrito Federal.
Suman, H., Bolia, N., & Tiwari, G. (2017). Comparing public bus transport service
attributes in Delhi and Mumbai: Policy implications for improving bus services in
Delhi. Transport Policy, 56, 63-74.
SunLine – SunLine Transit Agency (2011). Website data. Retrieved from:
http://www.sunline.org/
Supreme Court of India (1998). Judgment in the matter of M.C. Mehta vs. Union of India
& Ors. – Writ Petition No. 939 of 1996. New Delhi, India: Supreme Court of
India. July 28.
TERI – Tata Energy Research Institute (2002). Pricing and Infrastructure Costing for
Supply and Distribution of CNG and ULSD to the Transport Sector in Mumbai,
India. New Delhi, India: The Energy and Resources Institute – TERI.
TERI & ICCT (2011). Background paper: Workshop on cleaner liquid fuels and
improved vehicular technologies, 31 May 2011. New Delhi, India: The Energy
and Resources Institute.
The Times of India (2013, July). Breakdowns mar low-floors' track record. Online article.
Retrieved from: http://timesofindia.indiatimes.com/city/delhi/Breakdowns-mar-
low-floors-track-record/articleshow/20868560.cms?referral=PM
The Times of India (2016, October). DTC to be soon left with 3,775 buses. Retrieved
from: https://timesofindia.indiatimes.com/city/delhi/DTC-to-be-soon-left-with-
3775-buses/articleshow/54786658.cms

196
Tiwari, G. (2011). Key Mobility Challenges in Indian Cities. OECD/ITF: Discussion
Paper No. 2011-18. Leipzig, Germany: 2011 International Transport Forum.
Retrieved from: https://www.itf-oecd.org
Tiwari, G. (2017). Mode distribution data obtained from personal communication with
Geetam Tiwari, Prof. of the Department of Civil Engineering, TRIPP-IITD.
UNICA – União da Indústria de Cana-de-Açúcar (2014). UNICADATA: Consumo de
combustíveis: Etanol hidratado combustível (+) Etanol anidro combustível
(Portuguese) [Dataset]. Retrieved from: http://www.unicadata.com.br/
Universidad de Chile (2007). Desarrollo de pruebas de campo para la evaluación
comparada de tecnologías de buses para Santiago (in Spanish). Final Report,
July 2007. Santiago, Chile: Ministerio de Transportes y Telecomunicaciones.
Retrieved from: http://www.mtt.cl
Universidad de Chile, Pontificia Universidad Católica de Chile, & Deuman Ingenieros.
(2003). Plan de cambio tecnológico para el sistema de transporte público de
Santiago Chile (in Spanish). Final Report, January 2003. Santiago, Chile:
Secretaría Interministerial de Planificación de Transporte. Retrieved from:
http://www.sectra.cl
Vergara, W. & Haeussling, S. (2007). Transport and climate: lessons from the
partnership between Mexico City and the World Bank. Sustainable
Development working paper no. 29. Report No: 40909. Washington, D.C.: The
World Bank.
Wagner, V., & Rutherford, D. (2013). Survey of best practices in emission control of in-
use heavy-duty diesel vehicles. Washington, D.C.: The International Council on
Clean Transportation (ICCT). Retrieved from:
http://www.theicct.org/sites/default/files/publications/ICCT_HDV_in-
use_20130802.pdf

197
Wang, M., Wu, M. & Huo, H. (2007). Life-cycle energy and greenhouse gas emission
impacts of different corn ethanol plant types. Environmental Research Letters 2
(2007) 024001: 13pp. doi: 10.1088/1748-9326/2/2/024001
Wang, R., Wu, Y., Ke, W., Zhang, S., Zhou, B., & Hao, J. (2015a). Can propulsion and
fuel diversity for the bus fleet achieve the win-win strategy of energy
conservation and environmental protection? Applied Energy, 147, 92-103.
Wang, H., Fang, H., Yu, X., & Wang, K. (2015b). Development of natural gas vehicles in
China: An assessment of enabling factors and barriers. Energy Policy, 85, 80-
93.
Wang, C., Ye, Z., Yu, Y., & Gong, W. (2018). Estimation of bus emission models for
different fuel types of buses under real conditions. Science of the Total
Environment, 640-641, 965-972. doi: 10.1016/j.scitotenv.2018.05.289.
Wayne, W.S., Clark, N., Khan, A., Gautam, M., Thompson, G., & Lyons, D. (2008).
Regulated and Non-Regulated Emissions and Fuel Economy from Conventional
Diesel, Hybrid- Electric Diesel, and Natural Gas Transit Buses. Journal of the
Transportation Research Forum, 47(3), 105-125. Retrieved from:
https://trforum.org/
Weaver, C., & Almanza, M. (2006). Measurement of air pollutant emissions from public
transport buses in the Insurgentes corridor of Mexico City. Final Report, January
2006. Contract No. GDF-SMA-GEF-SC-020-04. Secretaría del Medio Ambiente,
Government of Mexico City.
WHO – World Health Organization (2013). Review of evidence on health aspects of air
pollution: REVIHAAP Project. Copenhagen, Denmark: WHO Regional Office for
Europe, World Health Organization. Retrieved from:
http://www.euro.who.int/en/health-topics/environment-and-health/air-
quality/publications/2013/review-of-evidence-on-health-aspects-of-air-pollution-
revihaap-project-final-technical-report

198
WHO – World Health Organization (2014a). WHO's Ambient Air Pollution database:
Update 2014. In: Ambient (outdoor) air pollution in cities database 2014
(website). Geneva, Switzerland: Public Health, Social and Environmental
Determinants of Health Department, World Health Organization. Retrieved from:
http://www.who.int
WHO – World Health Organization (2014b). Ambient (outdoor) air quality and health.
Fact sheet No. 313. Retrieved from:
http://www.who.int/mediacentre/factsheets/fs313/en/
WMATA – Washington Metropolitan Area Transit Authority (2010). 2010 Metrobus Fleet
Management Plan: Final Report, July 22, 2010. Retrieved from:
https://www.wmata.com/
World Bank (2002a). Introduction of climate friendly measures in transport. Project
Appraisal Document. Report No: 24871-ME. Washington, D.C.: The World Bank
Retrieved from: http://databank.worldbank.org/
World Bank (2002b). Improving air quality in metropolitan Mexico City: an economic
valuation. Policy Research working paper series no. WPS 2785. Washington,
D.C.: The World Bank Retrieved from: http://databank.worldbank.org/
World Bank (2003). Sustainable transport and air quality for Santigo (GEF). Project
Appraisal Document. Report no. 26848-CL. Washington, D.C.: The World Bank
Retrieved from: http://databank.worldbank.org/
World Bank (2015). Table 3.1: Rural environment and land use, In World Development
Indicators (14-Apr-2015 update). Washington D.C.: The World Bank. Retrieved
from: http://databank.worldbank.org/
WSA – Wilbur Smith Associates (2008a). Study on Traffic and Transportation Policies
and Strategies in Urban Areas in India: Final Report. Bangalore, India: Wilbur
Smith Associates. Retrieved from: http://www.moud.in/

199
WSA – Wilbur Smith Associates (2008b). Annexure 3.1 of Transport Study on Traffic
and Transportation Policies and Strategies in Urban Areas in India - Final
Report. Bangalore, India: Wilbur Smith Associates. Retrieved from:
http://www.moud.in/
WVU – West Virginia University. (2004). Development of the Mexico City Schedule for
Characterization of Emissions and Performance from Transit Buses. Mexico
City Secretariat of Environment (SMA), Contract No. GDF-SMA-GEF-SC-027-
04.
WVU – West Virginia University. (2005). Chassis dynamometer emissions
characterization of buses in Mexico City. Final Report, March 2005. West
Virginia University Center for Alternative Fuels, Engines and Emissions.
Morgantown, West Virginia. Mexico City Secretariat of Environment (SMA),
Contract No. GDF-SMA-GEF-SC-027-04.
Yang, M., Kraft-Oliver, T., Yan, G., & Min, W. (1997). Compressed Natural Gas
Vehicles: Motoring Towards a Cleaner Beijing. Applied Energy, 56(3/4), 395-
405. doi: 10.1016/S0306-2619(97)00019-6
Zhuang, J., Liang, Z., Lin, T., & De Guzman, F. (2007). Theory and Practice in the
Choice of Social Discount Rate for Cost -benefit Analysis: A Survey. ERD
Working Paper No. 94. Manila: Asian Development Bank. Retrieved from:
http://www.adb.org

200
Appendix A: List of sites visited in Delhi for data collection
Table A1 lists DTC sites visited in 2010 for data collection; the sites at which data was
collected were chosen to ensure representativeness of the geographical regions served
by DTC’s urban transit routes, and accounted for the fact that DTC operated two types
of CNG bus technologies in 2010, for which bus attributes varied significantly.
Table A1: Sites visited for data collection at DTC in Delhi, India Site Name Location DTC Region Activities 1. Strategic Business Unit Hauz Khas South DTC’s management office for the
LF bus fleet 2. Central Workshop I Banda Bahdur Marg North planning for the standard buses,
and re-conditioning, re-treading and bus body repairs
3. Sukhdev Vihar Bus Depot Sukhdev Vihar South Bus depot (operating the LF) 4. Hari Nagar Depot I Hari Nagar West Bus depot (operating the LF) 5. Hari Nagar Depot II Hari Nagar West Bus depot (operating the
Standard) 6. Rohini Depot I Rohini North Bus depot (operating the LF) 7. Kalka Ji Bus Depot Sanjay Colony South Bus depot (operating the
Standard)
Source: Google Earth, 2015 Figure: Delhi Map with location of DTC sites visited in 2010.

201
In 2010-11, operation, storage and maintenance of DTC’s bus fleet were conducted
from 49 depots across Delhi; based on fleet average statistics for this period, a typical
DTC depot facility has an area of about 20,000 m2 with an average capacity of servicing
about 110-130 buses (CIRT, 2012). The majority of these depots have dedicated CNG
refueling infrastructure on site, which includes diesel-powered compressors, CNG buffer
storage tanks, and usually two fast-fill dispensers per depot (Figure A1).
7
Source: Map (Google Earth) and pictures (author).
Figure A1: DTC bus depot layout, Sukhdev Vihar depot, 2010-11

202
Appendix B: Supplementary material for Chapter 5 Table B1: Description of parameter assumptions used in the LCC model Model Notation
Parameter Description
T Vehicle service Life
Vehicle service life was assumed to be 12 years for LF buses, and 10 years for standard buses, reflecting the average lifespan of these buses in the Indian context (CIRT, 2012).
k Annual kilometres per bus
From 2001-02 to 2010-11, the average annual distance operated for CNG buses at DTC was approximately 74,000 kilometers, as opposed to 86,000 kilometers for buses in Mumbai, Chennai and Bangalore (CIRT, 2012). The average annual kilometers, weighted by fleet size, for the above three cities plus Delhi, was approximately 80,000 kilometers in 2010-11, but has been declining for the past 5 years for DTC, BEST and BMTC. Since the average annual kilometers per bus is just under 70,000 kilometers in Delhi and Mumbai, which is likely due to the higher traffic congestion in these cities than in Chennai and Bangalore, as shown by average speeds in WSA (2008a), the LCC model assumed an annual average of 70,000 kilometers operated per bus (k), to account for this possible trend.
Fleet size In order to compare the various bus systems on an uniform basis, and because of the variable size of the fleets representing these systems in our study, we calculated the LCCs for 100 buses for all of the bus systems in the Indian context, because this is the approximate number of buses serviced in each depot at DTC in 2010-11; 100-bus depots are also typical of US transit operations (Lowell et al., 2007).
d No. of depots Because the LCCs were calculated for 100 buses, which is the approximate number of buses per depot at DTC, the number of depots, which is important for determining depot infrastructure and staffing requirements and costs, is 1 in our model.
y Annual vehicle-kilometres
Calculated by multiplying the number of buses (in the case of our model, 100) by the annual operated kilometers for each bus (k); this measure is assumed to be constant for all years of operation and common to all of the bus systems that were evaluated.
e Total Training Hours per depot
Vector e was estimated by multiplying training hours by staffing numbers for each staff function. Staffing numbers, per depot were assumed to be 540 operators, 110 mechanics, and 51 administrators, for a total staff ratio per bus of approximately 6, based on staffing number breakdowns observed at DTC in 2010-11. For training hours, no specific data was available within the Indian context, so training hours reported in Lowell et al. (2007) were used for CNG and diesel buses; that is, a vector of initial training hours of [3,25,2] for [bus operators, mechanics, administrators], respectively, for CNG, and [2,20,0] for diesel buses. Yearly ongoing refresher training requirements of [1,7,1] hours for CNG buses, and [0,5,0] for diesel buses, for [operators, mechanics, administrators], respectively, were assumed, also based on Lowell et al. (2007).Vector e was estimated by multiplying training hours by staffing numbers for each staff function. Staffing numbers, per depot were assumed to be 540 operators, 110 mechanics, and 51 administrators, for a total staff ratio per bus of approximately 6, based on staffing number breakdowns observed at DTC in 2010-11 (in the US, these numbers were assumed to be 300 operators, 20 mechanics and 30 administrators per depot based on Lowell et al., 2007). For training hours, no specific data was available within the Indian context, so training hours reported in Lowell et al. (2007) were used for CNG and diesel buses; that is, a vector of initial training hours of [3,25,2] for [bus operators, mechanics, administrators], respectively, for CNG, and [2,20,0] for diesel buses. Yearly ongoing refresher training requirements of [1,7,1] hours for CNG buses, and [0,5,0] for diesel buses, for [operators, mechanics, administrators], respectively, were assumed, also based on Lowell et al. (2007).

203
Model Notation
Parameter Description
FE
Fuel economy The fuel economy performance of standard CNG buses at DTC from 2001-02 to 2010-11 was around 45 percent lower than that of DTC's diesel-only fleet, on an energy-equivalent basis, in the 10 years prior to the switch to CNG, and also relative to that of standard diesel buses operated by BEST, BMTC and MTC-CNI during 2001-02 to 2010-11. Our LCC model assumed 3.81 km/L as the fuel economy for standard diesel buses based on this 10-year average performance from CIRT reports for BEST, BMTC and MTC-CNI, and 2.12 km/L as the energy equivalent fuel economy of standard CNG buses, based on the data for DTC during the same 10-year period (CIRT, 2002-2012). Fuel economy for LF/AC CNG buses was assumed to be 1.33 km per liter diesel energy equivalent, based on data collected on a sample of 25 of these buses operating out of the same depot at DTC for the 12-month period from Jan 2009 to Jan.2010. Meanwhile, the fuel economy of diesel LF/AC buses was assumed to 2.14 km/L, based on the average fuel economy performance of "Volvo" type buses used in BEST, BMTC and MTC-CNI, and reported in CIRT reports. The fuel economy for diesel low-floor buses had to be estimated since there was no disaggregated data for this type of bus. Estimation was done using a linear interpolation of LF performance in CNG buses (i.e., between LF and LF/AC CNG buses), and adjusted for diesel performance given LF/AC diesel buses as observed in India. The following formula was used:
FEdiesel LF =FECNG LF
FECNG LF/AC∙ FEdiesel LF/AC
The ratios of our estimated fuel economy for low-floor diesel buses to that for the Standard and LF/AC diesel buses are very close to these ratios based on data in the ESMAP (2011) report for Hyderabad and Mysore.
r Discount rate The discount rate was based on Zhuang, Liang, Lin, & De Guzman (2007) for the Indian context, as discussed in the paper.
P Fuel price The LCC model assumed a CNG price of $0.480/liter diesel energy equivalent and diesel price of $0.860/liter, based on the five-year average of CNG and diesel prices reported in Delhi, from 2011 to 2015 (MyPetrolPrice.com, 2016). Delhi was selected for this purpose, because the city has an important and sizable market for both fuels, aside from natural gas demand from DTC. Since fuel prices have fluctuated much over the years, on an inflation-adjusted basis, we used the most recent five-year averages for the CNG and diesel fuel prices for the Indian context, and also for the USA, based on EERE (2016).
w0 Depot infrastructure, operation and maintenance costs
Based on the available data in the Indian context, depot infrastructure cost in the model was set to 2.2 million USD for CNG buses and 1.7 million USD for diesel buses. The depot service life was set to 25 years, based on Lowell et al. (2007) and Clark et al. (2009). Note that the CNG depot infrastructure includes only equipment and building costs related to the operation and maintenance of buses, but excludes the refueling infrastructure, which, as discussed in the paper, was indirectly accounted for via the fuel price. The costs related to operation and maintenance of depot infrastructure (including those pertaining to depot up-keep due to physical depreciation, as well as costs related to utilities, and other depot infrastructure operational costs) are also important to consider. However, since no data was available in relation to the annual depot operating and maintenance costs in the Indian context, we assumed these costs to be 5.5% of total capital expenditures, based on Lowell et al. (2007) and Clark et al. (2009).
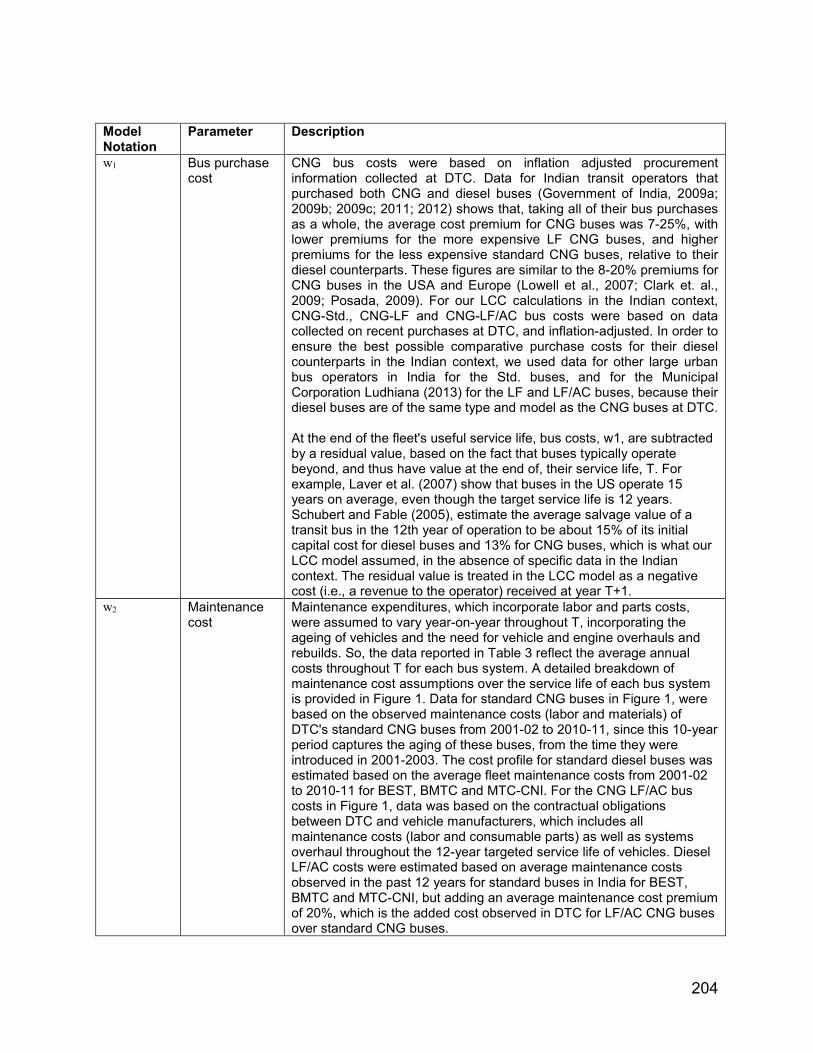
204
Model Notation
Parameter Description
w1
Bus purchase cost
CNG bus costs were based on inflation adjusted procurement information collected at DTC. Data for Indian transit operators that purchased both CNG and diesel buses (Government of India, 2009a; 2009b; 2009c; 2011; 2012) shows that, taking all of their bus purchases as a whole, the average cost premium for CNG buses was 7-25%, with lower premiums for the more expensive LF CNG buses, and higher premiums for the less expensive standard CNG buses, relative to their diesel counterparts. These figures are similar to the 8-20% premiums for CNG buses in the USA and Europe (Lowell et al., 2007; Clark et. al., 2009; Posada, 2009). For our LCC calculations in the Indian context, CNG-Std., CNG-LF and CNG-LF/AC bus costs were based on data collected on recent purchases at DTC, and inflation-adjusted. In order to ensure the best possible comparative purchase costs for their diesel counterparts in the Indian context, we used data for other large urban bus operators in India for the Std. buses, and for the Municipal Corporation Ludhiana (2013) for the LF and LF/AC buses, because their diesel buses are of the same type and model as the CNG buses at DTC. At the end of the fleet's useful service life, bus costs, w1, are subtracted by a residual value, based on the fact that buses typically operate beyond, and thus have value at the end of, their service life, T. For example, Laver et al. (2007) show that buses in the US operate 15 years on average, even though the target service life is 12 years. Schubert and Fable (2005), estimate the average salvage value of a transit bus in the 12th year of operation to be about 15% of its initial capital cost for diesel buses and 13% for CNG buses, which is what our LCC model assumed, in the absence of specific data in the Indian context. The residual value is treated in the LCC model as a negative cost (i.e., a revenue to the operator) received at year T+1.
w2 Maintenance cost
Maintenance expenditures, which incorporate labor and parts costs, were assumed to vary year-on-year throughout T, incorporating the ageing of vehicles and the need for vehicle and engine overhauls and rebuilds. So, the data reported in Table 3 reflect the average annual costs throughout T for each bus system. A detailed breakdown of maintenance cost assumptions over the service life of each bus system is provided in Figure 1. Data for standard CNG buses in Figure 1, were based on the observed maintenance costs (labor and materials) of DTC's standard CNG buses from 2001-02 to 2010-11, since this 10-year period captures the aging of these buses, from the time they were introduced in 2001-2003. The cost profile for standard diesel buses was estimated based on the average fleet maintenance costs from 2001-02 to 2010-11 for BEST, BMTC and MTC-CNI. For the CNG LF/AC bus costs in Figure 1, data was based on the contractual obligations between DTC and vehicle manufacturers, which includes all maintenance costs (labor and consumable parts) as well as systems overhaul throughout the 12-year targeted service life of vehicles. Diesel LF/AC costs were estimated based on average maintenance costs observed in the past 12 years for standard buses in India for BEST, BMTC and MTC-CNI, but adding an average maintenance cost premium of 20%, which is the added cost observed in DTC for LF/AC CNG buses over standard CNG buses.

205
Model Notation
Parameter Description
w3 Fuel cost Fuel expenditures were assumed to be constant throughout the forecast period T and calculated as a function of fuel price (P) and fuel economy (FE).
w4 Labour cost Operator labor costs, measured in $-per-kilometer for various bus fleet types. Operator labor represents all labor, other than those involved in maintenance of buses (e.g., workshop and maintenance personnel), and includes drivers, conductors, traffic supervisors, administrative personnel and others (see personnel costs in CIRT 2012 for details). Total operator labor costs = [w4] x [annual vehicle-kilometers (y)]. Note that we have assumed operator labor costs to be constant throughout T, and the same for all bus systems within each country.
w5 Training cost Training costs were calculated based on the hours of training for each bus system, as described in relation to training hours (e) above, and average salaries estimated on an hourly basis from CIRT data for DTC, BEST, BMTC and MTC-CNI in 2010-11, for staff involved in bus operations, maintenance, and administration (CIRT, 2012). On this basis, the average hourly salaries we used for operators, mechanics and administrators respectively in our calculations were USD 2.84, 4.92 and 6.94.

206
Appendix C: Supplementary material for Chapter 6
C.1: Methane (CH4): tailpipe and fugitive emissions
Many studies do not provide methane emissions estimates, with the exception of
Hesterberg et al. (2008); though, even within this study, the number of data points was
particularly small. In Nylund et al. (2007), it is argued that methane emissions can also
be accurately estimated from hydrocarbon emissions, since HC emissions from CNG
buses are predominantly methane (Nylund et al., 2007; p.61). This same approach was
used in this study, when direct methane emissions were not available, that is, for
emission factors that were taken from Bose and Sundar (2005) and ARAI (2008, 2009).
Furthermore, since methane leakage is a significant contributor to total methane
emissions, this study used, for the different classes of CNG buses, a multiplication
factor of 1.3062 to account for leaked methane (Reynolds & Kandlikar, 2008: Table 1,
p.5861). Therefore, methane emission factors reported in Table 6.4 incorporate
methane leakage in the estimates.
C.2: Black Carbon (BC)
BC is a product of incomplete combustion of fossil fuels, and is a strong light-absorbing
component of particulate matter (EPA, 2012). In the US, mobile sources were
responsible for 52% of BC emissions, but 93% of these came from diesel vehicles or
engines (EPA, 2012), which is critically relevant within the Indian context, where --
nationally -- the proportion of diesel to gasoline use is 5:1 (TERI & ICCT, 2011). In
estimating emissions from mobile sources, Bond et al. (2004) calculate the fraction of
BC in PM to be approximately 66±16%, with no significant variation in this ratio between
normal vehicles (i.e., well-maintained) or super-emitting ones. They estimate BC
emissions to be a function of PM10, on a g-per-kg of fuel basis, and the proportion of BC
in PM10, emphasizing that no differentiation between light-duty and heavy-duty vehicles
is necessary, as emission factors per mass of fuel (not per distance) are very similar
among the various vehicle classes. Note that in the absence of PM10 emissions, they

207
take total particulate matter, as they are similar, with Cohen et al. (2003), also making
no distinction between PM or PM2.5 (ultra-fine particulate matter) emissions, as they
argue that the bulk of PM emissions is comprised of PM2.5. In the absence of specific
ultra-fine particulate matter or even PM10 data, we also took PM data that was available.
Contextually, the challenge in measuring BC is presented by the effect of super-emitting
vehicles (i.e., "smokers"; Faiz et al., 1996) on PM emissions, as, even though the ratio
of BC in PM will not change, total PM emission outcomes will (Bond et al., 2004).
Taking into account this factor, Reynolds and Kandlikar (2008) estimate the proportion
of BC in PM, within the context of Delhi, to be 76% for diesel buses and 29% for CNG
buses, based on the assumption that 40% of all buses in Delhi were super-emitting
vehicles, and based on Bond et al. (2004) methodology, that estimate BC from a PM1
(i.e., fine particulate matter with diameter smaller than one micrometer), in which they
assume that approximately 86% of diesel PM10 is composed of emissions with
diameters smaller than one micrometer; so, actually 65.4% of PM10 is BC for diesel
emissions. Also, recent studies for Delhi, based on chassis dynamometer mass
emission tests on vehicles and using a composite vehicle fleet profile that accounts for
vehicles of different vintages and categories, the fraction of BC in PM10 for diesel buses
was estimated to be around 27±2%, while for CNG buses it was 20±1% (ARAI, 2009;
Gargava et al., 2014). The difference in estimates between Reynolds and Kandlikar
(2008) and the last set of references in Delhi may be accounted by, in part, the source
and vintage of PM emission factor data, for which Gargava et al. (2014) use data based
on recent chassis dynamometer test and for a more up-to-date bus technology, but do
not account for vehicles that could have a super-emitting profile, as done in Reynolds
and Kandlikar (2008); furthermore, the sample of vehicles used in Gargava et al. (2014)
was small for meaningful statistical significance. In view of all of the foregoing, in
estimating BC emissions the average of the two estimates (Reynolds & Kandlikar, 2008;
Gargava et al., 2014) was used for the purpose of this investigation, using the average
proportion of BC in PM of 46% for diesel buses and 25% for CNG buses.

208
C.3: Carbon Dioxide (CO2)
CO2 emissions were estimated from fuel economy data for Delhi and India, which
reflects up-to-date performance of standard and newer fleet of low-floor buses currently
in operation in Delhi and other major Indian cities, as well as the performance of early
2000 diesel and CNG buses (Chapter 4). This will allow for more accurate
representation of engine and vehicle types in India, since fuel economy is an accurate
estimator for CO2 emissions based on the fraction of carbon content in the fuel, and
assuming that all fuel oxidizes (Lipman & Delucchi, 2002; MJB, 2007). Table C2 details
data and sources for CO2 emission factor estimation, which is based on the following
equation, noting that CO2 emissions for CNG were calculated based on energy
equivalence to diesel, given fuel characteristics in India:
CO2 � gkm� =
CO2−to−Carbon Ratio (CO2 g
molC gmol
)×Carbon percentage in Fuel (Wt.%)
Fuel Economy (kmL )×Fuel Liquid Density � Lkg�×1000 (g/kg)
C.4: CO2 equivalent (GWP for BC, CH4, CO2)
As per IPCC methodology, the combined effect of GHG emissions from buses is
expressed in terms of CO2 equivalent emissions, based on the global warming potential
(GWP) of BC, CH4 and CO2 using the concept of radiative forcing (RF) as means of
comparing the strength of various mechanisms that are causing climate change over a
100 year life-cycle, that is GWP100 (Myhre et al., 2013: Table 8.7, p.714). I should also
point out the uncertainties in estimating RF from different polluting gases. Well-mixed
greenhouse gases, including CO2 and CH4, have very robust evidence and high
confidence level in their estimates, while aerosols, such as BC, less so (Myhre et al.,
2013: Section 8.5.1). The challenge in estimating the effect of BC on global warming is
that, given its physical properties, it is not well mixed in the atmosphere and with
different and uncertain indirect and snow/albedo effects, resulting in estimates for
GWP100 ranging from 330 to 2240 CO2(e), if this metric has to be used (EPA, 2012:
Section 2.7.3.1, p.61). The extent and nature of these uncertainties is beyond the scope
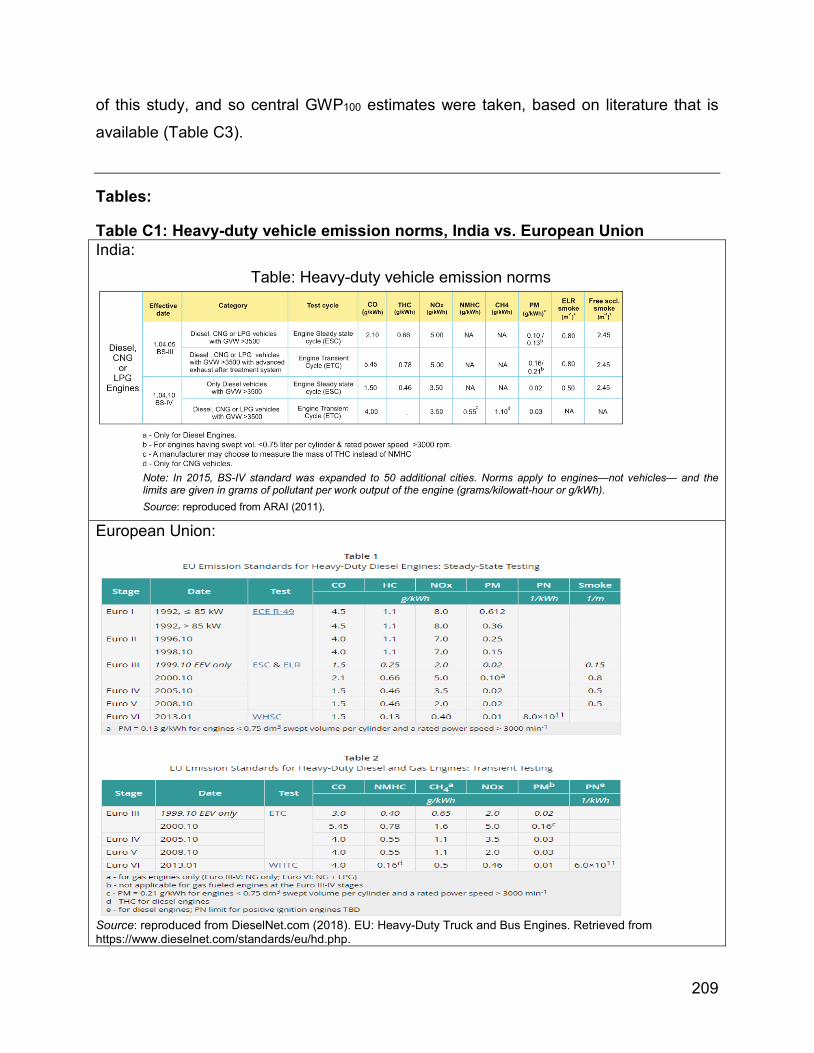
209
of this study, and so central GWP100 estimates were taken, based on literature that is
available (Table C3).
Tables:
Table C1: Heavy-duty vehicle emission norms, India vs. European Union India:
Table: Heavy-duty vehicle emission norms
Note: In 2015, BS-IV standard was expanded to 50 additional cities. Norms apply to engines—not vehicles— and the limits are given in grams of pollutant per work output of the engine (grams/kilowatt-hour or g/kWh).
Source: reproduced from ARAI (2011).
European Union:
Source: reproduced from DieselNet.com (2018). EU: Heavy-Duty Truck and Bus Engines. Retrieved from https://www.dieselnet.com/standards/eu/hd.php.

210
Table C2: CO2 emission factor estimation for CE analysis, g/km
Id. Bus type/fuel Emissions cert. FE1 FE2
Mult. Factor3
Carbon in fuel mass4
CO2 emission factors
Unit of measure km/L kg/km factor % wt. g/km 1 Std. Diesel (MY00+) BS-I/II 3.814 0.219 3.664 88.30 708 2 LF Diesel (D50)5 BS-III/IV 2.686 0.311 3.664 86.60 986 3 Std. CNG (MY00+) BS-I/II 2.124 0.334 3.664 74.04 907 4 LF CNG5 BS-III/IV 1.598 0.444 3.664 74.04 1205 1 CNG Fuel Economy (FE) converted to diesel litre equivalent based on energy content of 50 MJ/kg for CNG and 42.5 MJ/kg for diesel (Faiz et al., 1996) and liquid density of diesel of 0.835 kg/l (SIAM, 2013). Bus FE data from LCC model assumptions (Chapter 5). 2 FE in kg/km converted from FE in km/l; for this, it was assumed a liquid density of 0.835 kg/l for diesel (SIAM 2013), and 0.422 kg/l for CNG (Faiz et al., 1996). 3 Multiplication factor for fuel mass that is carbon, assuming all fuel oxidizes; ratio calculated using the molar mass of CO2 (44 g/mol) divided by molar mass of Carbon (12 g/mol). 4 Carbon percentages, with respect to weight, for D350 and D50 from Bose & Sundar (2005); for CNG buses estimate assumes 92.6% of natural gas is methane (% of molar fraction), based on WVU (2005), and very close to reported methane fraction in natural gas in Delhi (Reynolds & Kandlikar 2008). 5 FE reflects weighted average of AC (20%) and non-AC (80%) buses in fleet. 6 DTC doesn’t operate modern standard CNG buses, only LF. FE estimated from CO2 emissions in ARAI (2009) for OEM CNG buses, MY05+.
Table C3: CO2(e) emission factor estimation Compound GWP100 Source CO2 1 Myhre et al. (2013): Table 8.A.1 (p.731) CH4 28 (34)1 Myhre et al. (2013): Table 8.7(p.714) BC 455 (± 57%)
7402
(-61% to +72%)3
Reynolds & Kandlikar (2008) Myhre et al. (2013)
1 Figure in parenthesis refers to GWP with climate-carbon feedbacks, which is here only for reference. 2 We take the average range value for CO2(e). GWP100 for BC is 740 for transport in Asia, as used in the latest IPCC report supporting the average GWP value of 659 (Myhre et al. 2013: Table 8.SM.16); For reference, Bond and Sun (2005) reported GWP100 of 680. 3 Table 8.SM.7 (Myhre et al. 2013), for uncertainty in RF by BC.