A correlation network approach to metabolic data analysis for tomato fruits
13
A correlation network approach to metabolic data analysis for tomato fruits Remco Ursem Yury Tikunov Arnaud Bovy Ralph van Berloo Fred van Eeuwijk Received: 16 May 2007 / Accepted: 12 February 2008 Ó The Author(s) 2008 Abstract Network analysis of correlations between abundances of metabolites across tomato genotypes can help in unraveling the biological basis of organoleptic variation in tomato. We illustrate how to construct and interpret simple correlations net- works using metabolic data collected on a diverse set of tomato genotypes. Various types of correlations are calculated and displayed in the form of networks. Interpretations on the basis of network analyses are compared to interpretations following principal com- ponents analysis. Keywords Correlation network Metabolomics Network analysis Principal component analysis Tomato Introduction The Center for BioSystems Genomics (CBSG) is a joint venture in the field of plant genomics of breeding companies, biotech companies, research institutes and universities in the Netherlands. At the web site (http:// www.cbsg.nl) it is stated that ‘The consortium aims at developing knowledge for the improvement of food and non-food crops with reduced environmental impact and enhanced consumer quality.’ An important part of CBSG concentrates on tomato quality with the objective of developing a better understanding of the biological factors involved in tomato taste, with special attention for the underlying genetics. The ultimate goal of the CBSG tomato quality program is the develop- ment of a marker assisted improvement strategy for quality traits. The empirical basis of the current research on tomato quality is formed by various types of observations on a diverse set of tomato consisting of 94 genotypes, mostly cultivars and hybrids. Within the phenotypic data, a prominent place is given to a set of metabolites. Before trying to identify the genetic basis of the variation in metabolite levels by marker-trait association analyses, we decided to investigate the patterns of variation and covariation (correlation) in the metabolites by network visualization. Network construction and representation techniques provide an interesting complement to more classical multivariate methods as described in their application to meta- bolites in Graffelman and van Eeuwijk (2005) and van Berloo et al. (submitted). We expect that metabolite R. Ursem Y. Tikunov A. Bovy R. van Berloo F. van Eeuwijk Centre for BioSystems Genomics, P.O. Box 98, 6700 AB Wageningen, The Netherlands R. Ursem (&) R. van Berloo Laboratory of Plant Breeding, Wageningen University, P.O. Box 386, 6700 AJ Wageningen, The Netherlands e-mail: [email protected] Y. Tikunov A. Bovy Plant Research International, 6700 AA Wageningen, The Netherlands F. van Eeuwijk Biometris, P.O. Box 100, 6700 AC Wageningen, The Netherlands 123 Euphytica DOI 10.1007/s10681-008-9672-y
-
Upload
independent -
Category
Documents
-
view
0 -
download
0
Transcript of A correlation network approach to metabolic data analysis for tomato fruits
A correlation network approach to metabolic data analysisfor tomato fruits
Remco Ursem Æ Yury Tikunov Æ Arnaud Bovy ÆRalph van Berloo Æ Fred van Eeuwijk
Received: 16 May 2007 / Accepted: 12 February 2008
� The Author(s) 2008
Abstract Network analysis of correlations between
abundances of metabolites across tomato genotypes
can help in unraveling the biological basis of
organoleptic variation in tomato. We illustrate how
to construct and interpret simple correlations net-
works using metabolic data collected on a diverse set
of tomato genotypes. Various types of correlations
are calculated and displayed in the form of networks.
Interpretations on the basis of network analyses are
compared to interpretations following principal com-
ponents analysis.
Keywords Correlation network � Metabolomics �Network analysis � Principal component analysis �Tomato
Introduction
The Center for BioSystems Genomics (CBSG) is a
joint venture in the field of plant genomics of breeding
companies, biotech companies, research institutes and
universities in the Netherlands. At the web site (http://
www.cbsg.nl) it is stated that ‘The consortium aims at
developing knowledge for the improvement of food
and non-food crops with reduced environmental
impact and enhanced consumer quality.’ An important
part of CBSG concentrates on tomato quality with the
objective of developing a better understanding of the
biological factors involved in tomato taste, with special
attention for the underlying genetics. The ultimate goal
of the CBSG tomato quality program is the develop-
ment of a marker assisted improvement strategy for
quality traits. The empirical basis of the current
research on tomato quality is formed by various types
of observations on a diverse set of tomato consisting of
94 genotypes, mostly cultivars and hybrids. Within the
phenotypic data, a prominent place is given to a set of
metabolites. Before trying to identify the genetic basis
of the variation in metabolite levels by marker-trait
association analyses, we decided to investigate the
patterns of variation and covariation (correlation) in
the metabolites by network visualization. Network
construction and representation techniques provide an
interesting complement to more classical multivariate
methods as described in their application to meta-
bolites in Graffelman and van Eeuwijk (2005) and
van Berloo et al. (submitted). We expect that metabolite
R. Ursem � Y. Tikunov � A. Bovy � R. van Berloo �F. van Eeuwijk
Centre for BioSystems Genomics, P.O. Box 98,
6700 AB Wageningen, The Netherlands
R. Ursem (&) � R. van Berloo
Laboratory of Plant Breeding, Wageningen University,
P.O. Box 386, 6700 AJ Wageningen, The Netherlands
e-mail: [email protected]
Y. Tikunov � A. Bovy
Plant Research International, 6700 AA Wageningen,
The Netherlands
F. van Eeuwijk
Biometris, P.O. Box 100, 6700 AC Wageningen,
The Netherlands
123
Euphytica
DOI 10.1007/s10681-008-9672-y
patterns as identified by network techniques can
eventually be better related to molecular marker
variation than the variation in individual metabolites.
Metabolite correlations are believed to provide a
‘fingerprint’ of the underlying biophysical system
(Steuer et al. 2003b; Steuer et al. 2003a; Weckwerth
et al. 2004; Morgenthal et al. 2006). Elucidating the
origin of metabolite correlations will give us insight
into biochemical processes and their regulation
(Camacho 2005; Steuer 2006).
To illustrate the application of network methodol-
ogy to metabolite data collected within the CBSG
tomato quality program, a selection out of a larger set
of scored metabolites was made, consisting of several
volatile organic compounds (secondary metabolites
that evaporate at normal temperatures), and some
primary metabolites—sugars and organic acids. All
substances were known or expected to play a role in
tomato taste sensation (Baldwin et al. 2000; Tandon
et al. 2003; Baldwin et al. 2004; Krumbein et al.
2004; Ruiz et al. 2005).
Material and methods
Tomato cultivars
The collection of tomato cultivars used within the
CBSG tomato quality project was selected to be a
diverse set with respect to tomato quality traits, plant
characteristics and genotypic background. All culti-
vars were greenhouse cultivars provided by the five
international breeding companies involved in the
project, and almost all were F1 hybrids. In this study
we used data of 94 cultivars for which there was a
complete dataset consisting of AFLP marker scores,
metabolic profiles, organoleptic trait evaluations, plant
and fruit morphology measurements and consumer
appreciation assessments. The cultivars were classi-
fied by eye into three different types of tomato,
labelled as round, beef and cherry. The three groups
made up roughly 50, 25, and 25% of the total
collection, respectively. A priori, there was no reason
to believe that metabolite patterns should differ
between tomato types. The cultivars were evaluated
in three greenhouse experiments over a 2-year-
period. Each experiment consisted of a randomized
complete block design with three replicates. Individ-
ual plots consisted of three plants.
Metabolic profiling
For a given experiment, metabolic profiling of cultivars
was based on pooled fruit samples, where the pooling
arose from combining fruits from the three replicates of
the experiment. Samples for round and beef tomatoes
contained 12 red ripe fruits, while samples for cherry
tomatoes contained 18 fruits. Individual tomatoes from
individual replicates could not be identified anymore
once the pooled samples were constructed. Metabolic
assessments thus pertained to the pooled samples, one
pooled sample for each cultivar in an experiment.
Volatile compounds of red ripe fruit material were
relatively quantified and identified using Gas Chroma-
tography/Mass Spectrometry (GC/MS) (for details, see
Tikunov et al. 2005). Sugars and organic acids were
profiled using GC/MS as described in Roessner-Tunali
et al. (2003). The volatiles were measured once in the
first experiment, twice in the second experiment, and
once in the third experiment. The two metabolic
assessments in the second experiment concerned a
duplicate metabolic sample preparation (technical
replicate) and not a biological duplication, i.e., the
same pooled fruit samples were used for both metabolic
assessments. The sugars and organic acids were
measured once in all three experiments.
Estimation of genotypic means, heritability
and genetic correlation
All metabolites were log10 transformed before further
analysis to improve normality. Linear mixed models
were used to estimate genotypic means. We used
these models to estimate mean trait values per
genotype, taking into account other factors that might
influence individual measurements like environment
and measuring day. Genotypic metabolite means
were estimated with the following mixed model for
metabolite abundance:
yijk ¼ lþ dk þ gi þ ðgeÞij þ eijk
where dk (k = 1...41) stands for measurement day; a
compound effect of experiment, replication and mea-
surement day, with measurement day nested within
replication, and replication nested within experiment.
The effect gi (i = 1...94) represents the main genotype
effect, while (ge)ij is the effect for the interaction of
genotype i and experiment j (j = 1...3). The terms dk and
gi were fixed terms, and (ge)ij and the error term, eijk,
Euphytica
123
were random. We realize that our linear mixed model
may look somewhat unconventional in the sense that
we include a random genotype by experiment interaction
on top of two fixed main effects. First, the reason to incl-
ude a fixed day effect was that we found that for almost
all traits there was reason to correct the genotypic means
for the effects of experiment, replicate and measurement
day. However, the relative sizes of those effects diffe-
red very strongly between traits. Fitting the three
experiments or the two replicates within the second
experiment as random terms did not make sense due to
the low number of levels. The only term representing
‘environmental’ variation that would classify for possi-
bly being random was day within replicate within
experiment. However, as we found that these day effects
looked sometimes very far from normal, we preferred to
take the day effects fixed. Furthermore, we felt uneasy to
recover genotype information from the day totals, which
was another reason to take these effects fixed. As we
were interested in the genotypic means as such we
decided to choose the main effects of genotypes fixed.
For the generation of genotypic means, we saw the
genotype by experiment effects as nuisance parameters
and thus we took this interaction random. Random
genotype by replicate within experiment effects were
absent or so small as to be ignorable.
To estimate broad-sense heritability, h2, or better,
repeatability, of each metabolite, we adapted the
above given linear mixed model by changing the
status of the genotypic main effects from fixed to
random. The heritability was then calculated by
introducing the corresponding estimated variance
components in the following equation, which will
provide a rough estimator for the heritability.
h2 ¼r2
g
r2g þ
r2ge
neþ r2
enenr
:
Here r2g; r2
ge and r2e are the variance between
genotypes, the variance for genotype by experiment
interaction, and the residual variance. Further, ne = 3,
is the number of experiments, and nr is the number of
replications within experiments, for which we took 1.2
for the volatiles, the harmonic mean of the number of
replications across the three experiments, 1, 2, and 1,
respectively. For sugars and acids only one replication
was taken per experiment, so then nr = 1.
Genetic correlations between metabolites can be
estimated in various ways. An elegant, but elaborate
method is to fit multi-trait mixed models like in
Malosetti et al. (2008). For exploration purposes, a
quick, although less accurate method for calculating
genetic correlations can be used:
rg ¼rp
hxhy
(Burdon 1977; Falconer et al. 1996), where rg is the
genetic correlation, rp the phenotypic correlation, and hx
and hy the square root heritabilities of the concerned
metabolites. This method follows directly from the text
book formulation of the phenotypic correlation between
two traits x and y as rp ¼ hxhyrg þ exeyre (Falconer
et al. 1996), with ex ¼ffiffiffiffiffiffiffiffiffiffiffiffiffi
1� h2x
p
; ey ¼ffiffiffiffiffiffiffiffiffiffiffiffiffi
1� h2y
q
and re
as the correlation between the traits due to common
micro-environmental influences. When we assume that
re = 0 because of our experimental and randomization
procedures, we arrive at the above expression for
estimation of genetic correlations. This estimation
approach can produce estimates exceeding one.
Genetic correlations exceeding one were set at one.
To study metabolite relations while correcting for
differences due to tomato type, we also estimated
tomato-type corrected correlations between metabo-
lites. These type-corrected correlations were estimated
by regression of the genotypic means on tomato type
(cherry/non-cherry) followed by calculation of corre-
lations between the residual metabolite abundances.
Besides the above mentioned correlations, we also
calculated partial correlations, correlations between
metabolites conditional on all other metabolites, i.e.
correlations between pairs of metabolites that remain
after removal of covariation due to joint dependence on
third metabolites. Partial correlations were calculated
from the inverse of the correlation matrix as follows. Let
aij be the ij-th element of the inverse of the correlation
matrix, then the partial correlation, rpartialij , between the
metabolites i and j is calculated as rpartialij ¼ �aij
ffiffiffiffiffiffiffi
aiiajjp . With
these partial correlations we try to determine to what
extend metabolite correlations are direct (not depend-
ing on other metabolites in the network).
Distributions of traits
As a first data exploration and to compare relative
abundance of the different metabolites in our collec-
tion of tomatoes, boxplots were constructed for all
metabolites. With these boxplots we can compare
Euphytica
123
quartiles and ranges, and get an idea about trait
distributions in the tomato collection as a whole.
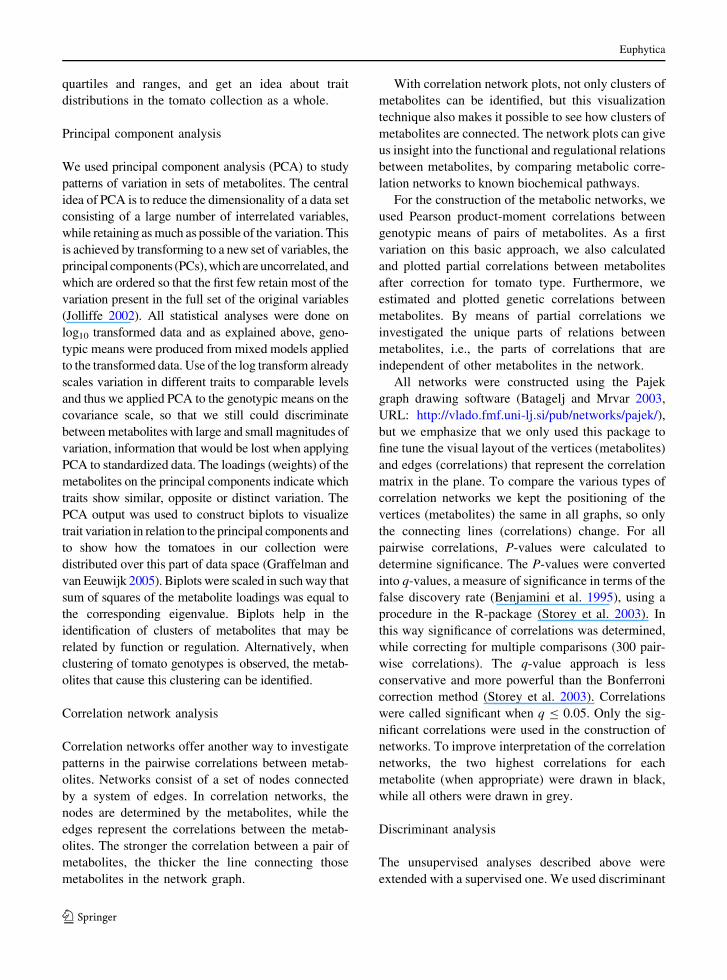
Principal component analysis
We used principal component analysis (PCA) to study
patterns of variation in sets of metabolites. The central
idea of PCA is to reduce the dimensionality of a data set
consisting of a large number of interrelated variables,
while retaining as much as possible of the variation. This
is achieved by transforming to a new set of variables, the
principal components (PCs), which are uncorrelated, and
which are ordered so that the first few retain most of the
variation present in the full set of the original variables
(Jolliffe 2002). All statistical analyses were done on
log10 transformed data and as explained above, geno-
typic means were produced from mixed models applied
to the transformed data. Use of the log transform already
scales variation in different traits to comparable levels
and thus we applied PCA to the genotypic means on the
covariance scale, so that we still could discriminate
between metabolites with large and small magnitudes of
variation, information that would be lost when applying
PCA to standardized data. The loadings (weights) of the
metabolites on the principal components indicate which
traits show similar, opposite or distinct variation. The
PCA output was used to construct biplots to visualize
trait variation in relation to the principal components and
to show how the tomatoes in our collection were
distributed over this part of data space (Graffelman and
van Eeuwijk 2005). Biplots were scaled in such way that
sum of squares of the metabolite loadings was equal to
the corresponding eigenvalue. Biplots help in the
identification of clusters of metabolites that may be
related by function or regulation. Alternatively, when
clustering of tomato genotypes is observed, the metab-
olites that cause this clustering can be identified.
Correlation network analysis
Correlation networks offer another way to investigate
patterns in the pairwise correlations between metab-
olites. Networks consist of a set of nodes connected
by a system of edges. In correlation networks, the
nodes are determined by the metabolites, while the
edges represent the correlations between the metab-
olites. The stronger the correlation between a pair of
metabolites, the thicker the line connecting those
metabolites in the network graph.
With correlation network plots, not only clusters of
metabolites can be identified, but this visualization
technique also makes it possible to see how clusters of
metabolites are connected. The network plots can give
us insight into the functional and regulational relations
between metabolites, by comparing metabolic corre-
lation networks to known biochemical pathways.
For the construction of the metabolic networks, we
used Pearson product-moment correlations between
genotypic means of pairs of metabolites. As a first
variation on this basic approach, we also calculated
and plotted partial correlations between metabolites
after correction for tomato type. Furthermore, we
estimated and plotted genetic correlations between
metabolites. By means of partial correlations we
investigated the unique parts of relations between
metabolites, i.e., the parts of correlations that are
independent of other metabolites in the network.
All networks were constructed using the Pajek
graph drawing software (Batagelj and Mrvar 2003,
URL: http://vlado.fmf.uni-lj.si/pub/networks/pajek/),
but we emphasize that we only used this package to
fine tune the visual layout of the vertices (metabolites)
and edges (correlations) that represent the correlation
matrix in the plane. To compare the various types of
correlation networks we kept the positioning of the
vertices (metabolites) the same in all graphs, so only
the connecting lines (correlations) change. For all
pairwise correlations, P-values were calculated to
determine significance. The P-values were converted
into q-values, a measure of significance in terms of the
false discovery rate (Benjamini et al. 1995), using a
procedure in the R-package (Storey et al. 2003). In
this way significance of correlations was determined,
while correcting for multiple comparisons (300 pair-
wise correlations). The q-value approach is less
conservative and more powerful than the Bonferroni
correction method (Storey et al. 2003). Correlations
were called significant when q B 0.05. Only the sig-
nificant correlations were used in the construction of
networks. To improve interpretation of the correlation
networks, the two highest correlations for each
metabolite (when appropriate) were drawn in black,
while all others were drawn in grey.
Discriminant analysis
The unsupervised analyses described above were
extended with a supervised one. We used discriminant
Euphytica
123
analysis (Dillon et al. 1984) to investigate metabolic
variation within and between the different types of
tomato (beef, round and cherry). Data on all 25
metabolites in all 94 genotypes was used. Discriminant
analysis finds linear combinations of metabolites that
maximize the ratio of the between group variance to the
averaged within group variance, thereby producing
functions of the metabolites that can be used to
discriminate between the tomato groups. Estimating
the correlation between metabolic abundances and
discriminant function scores provides an indication of
which metabolites discriminate between tomato types.
Results
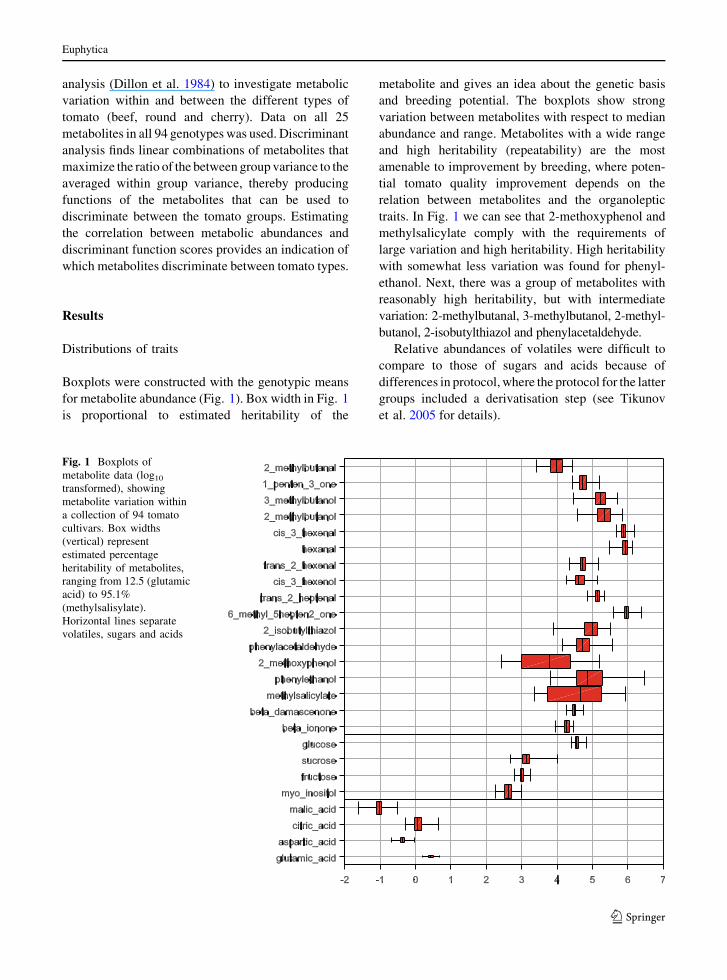
Distributions of traits
Boxplots were constructed with the genotypic means
for metabolite abundance (Fig. 1). Box width in Fig. 1
is proportional to estimated heritability of the
metabolite and gives an idea about the genetic basis
and breeding potential. The boxplots show strong
variation between metabolites with respect to median
abundance and range. Metabolites with a wide range
and high heritability (repeatability) are the most
amenable to improvement by breeding, where poten-
tial tomato quality improvement depends on the
relation between metabolites and the organoleptic
traits. In Fig. 1 we can see that 2-methoxyphenol and
methylsalicylate comply with the requirements of
large variation and high heritability. High heritability
with somewhat less variation was found for phenyl-
ethanol. Next, there was a group of metabolites with
reasonably high heritability, but with intermediate
variation: 2-methylbutanal, 3-methylbutanol, 2-methyl-
butanol, 2-isobutylthiazol and phenylacetaldehyde.
Relative abundances of volatiles were difficult to
compare to those of sugars and acids because of
differences in protocol, where the protocol for the latter
groups included a derivatisation step (see Tikunov
et al. 2005 for details).
Fig. 1 Boxplots of
metabolite data (log10
transformed), showing
metabolite variation within
a collection of 94 tomato
cultivars. Box widths
(vertical) represent
estimated percentage
heritability of metabolites,
ranging from 12.5 (glutamic
acid) to 95.1%
(methylsalisylate).
Horizontal lines separate
volatiles, sugars and acids
Euphytica
123
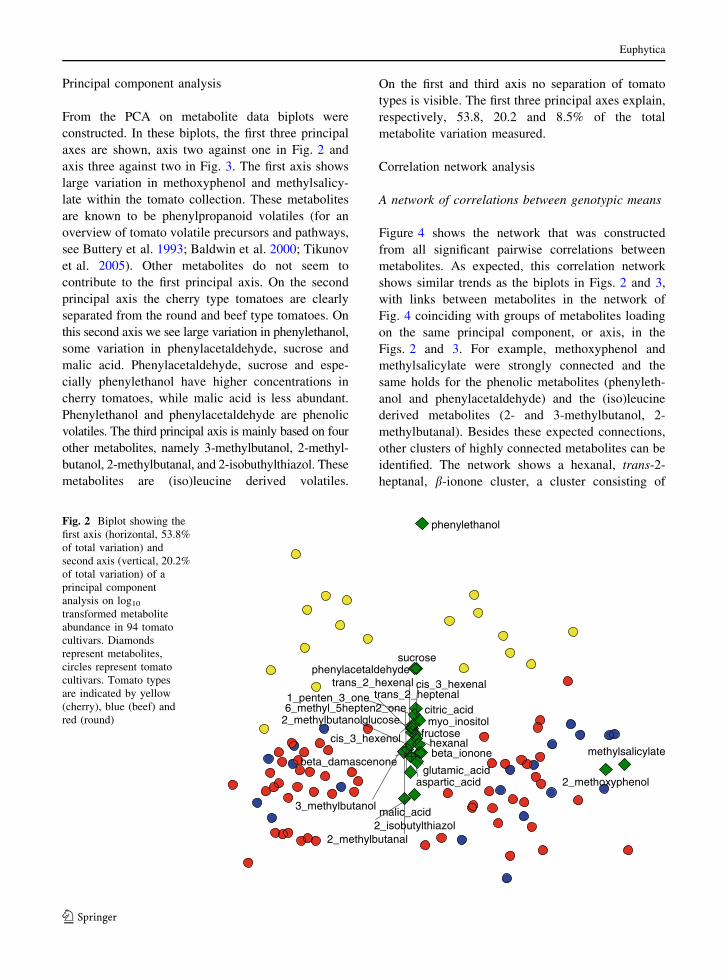
Principal component analysis
From the PCA on metabolite data biplots were
constructed. In these biplots, the first three principal
axes are shown, axis two against one in Fig. 2 and
axis three against two in Fig. 3. The first axis shows
large variation in methoxyphenol and methylsalicy-
late within the tomato collection. These metabolites
are known to be phenylpropanoid volatiles (for an
overview of tomato volatile precursors and pathways,
see Buttery et al. 1993; Baldwin et al. 2000; Tikunov
et al. 2005). Other metabolites do not seem to
contribute to the first principal axis. On the second
principal axis the cherry type tomatoes are clearly
separated from the round and beef type tomatoes. On
this second axis we see large variation in phenylethanol,
some variation in phenylacetaldehyde, sucrose and
malic acid. Phenylacetaldehyde, sucrose and espe-
cially phenylethanol have higher concentrations in
cherry tomatoes, while malic acid is less abundant.
Phenylethanol and phenylacetaldehyde are phenolic
volatiles. The third principal axis is mainly based on four
other metabolites, namely 3-methylbutanol, 2-methyl-
butanol, 2-methylbutanal, and 2-isobuthylthiazol. These
metabolites are (iso)leucine derived volatiles.
On the first and third axis no separation of tomato
types is visible. The first three principal axes explain,
respectively, 53.8, 20.2 and 8.5% of the total
metabolite variation measured.
Correlation network analysis
A network of correlations between genotypic means
Figure 4 shows the network that was constructed
from all significant pairwise correlations between
metabolites. As expected, this correlation network
shows similar trends as the biplots in Figs. 2 and 3,
with links between metabolites in the network of
Fig. 4 coinciding with groups of metabolites loading
on the same principal component, or axis, in the
Figs. 2 and 3. For example, methoxyphenol and
methylsalicylate were strongly connected and the
same holds for the phenolic metabolites (phenyleth-
anol and phenylacetaldehyde) and the (iso)leucine
derived metabolites (2- and 3-methylbutanol, 2-
methylbutanal). Besides these expected connections,
other clusters of highly connected metabolites can be
identified. The network shows a hexanal, trans-2-
heptanal, b-ionone cluster, a cluster consisting of
2_methylbutanal
1_penten_3_one
3_methylbutanol
2_methylbutanol
cis_3_hexenal
hexanal
trans_2_hexenal
cis_3_hexenol
trans_2_heptenal6_methyl_5hepten2_one
2_isobutylthiazol
phenylacetaldehyde
2_methoxyphenol
phenylethanol
methylsalicylatebeta_damascenone
beta_ionone
glucose
sucrose
fructosemyo_inositol
malic_acid
citric_acid
aspartic_acidglutamic_acid
Fig. 2 Biplot showing the
first axis (horizontal, 53.8%
of total variation) and
second axis (vertical, 20.2%
of total variation) of a
principal component
analysis on log10
transformed metabolite
abundance in 94 tomato
cultivars. Diamonds
represent metabolites,
circles represent tomato
cultivars. Tomato types
are indicated by yellow
(cherry), blue (beef) and
red (round)
Euphytica
123
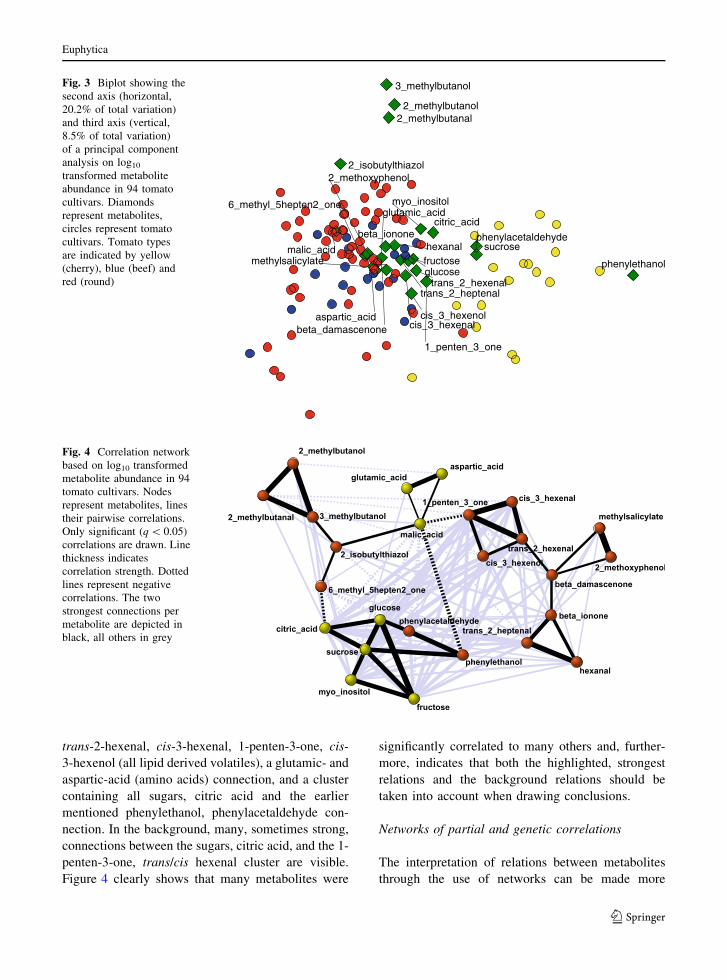
trans-2-hexenal, cis-3-hexenal, 1-penten-3-one, cis-
3-hexenol (all lipid derived volatiles), a glutamic- and
aspartic-acid (amino acids) connection, and a cluster
containing all sugars, citric acid and the earlier
mentioned phenylethanol, phenylacetaldehyde con-
nection. In the background, many, sometimes strong,
connections between the sugars, citric acid, and the 1-
penten-3-one, trans/cis hexenal cluster are visible.
Figure 4 clearly shows that many metabolites were
significantly correlated to many others and, further-
more, indicates that both the highlighted, strongest
relations and the background relations should be
taken into account when drawing conclusions.
Networks of partial and genetic correlations
The interpretation of relations between metabolites
through the use of networks can be made more
2_methylbutanal
1_penten_3_one
3_methylbutanol
2_methylbutanol
cis_3_hexenal
hexanal
trans_2_hexenal
cis_3_hexenol
trans_2_heptenal
6_methyl_5hepten2_one
2_isobutylthiazol
phenylacetaldehyde
2_methoxyphenol
phenylethanolmethylsalicylate
beta_damascenone
beta_ionone
glucose
sucrosefructose
myo_inositol
malic_acid
citric_acid
aspartic_acid
glutamic_acid
Fig. 3 Biplot showing the
second axis (horizontal,
20.2% of total variation)
and third axis (vertical,
8.5% of total variation)
of a principal component
analysis on log10
transformed metabolite
abundance in 94 tomato
cultivars. Diamonds
represent metabolites,
circles represent tomato
cultivars. Tomato types
are indicated by yellow
(cherry), blue (beef) and
red (round)
Fig. 4 Correlation network
based on log10 transformed
metabolite abundance in 94
tomato cultivars. Nodes
represent metabolites, lines
their pairwise correlations.
Only significant (q \ 0.05)
correlations are drawn. Line
thickness indicates
correlation strength. Dotted
lines represent negative
correlations. The two
strongest connections per
metabolite are depicted in
black, all others in grey
Euphytica
123
meaningful by working not only with standard
correlations between metabolites, but also with partial
correlations between metabolites after correction
for particular genetic or environmental disturbing
factors. Further variations are possible when consid-
ering genetic correlations instead of phenotypic
correlations, and when looking at correlations within
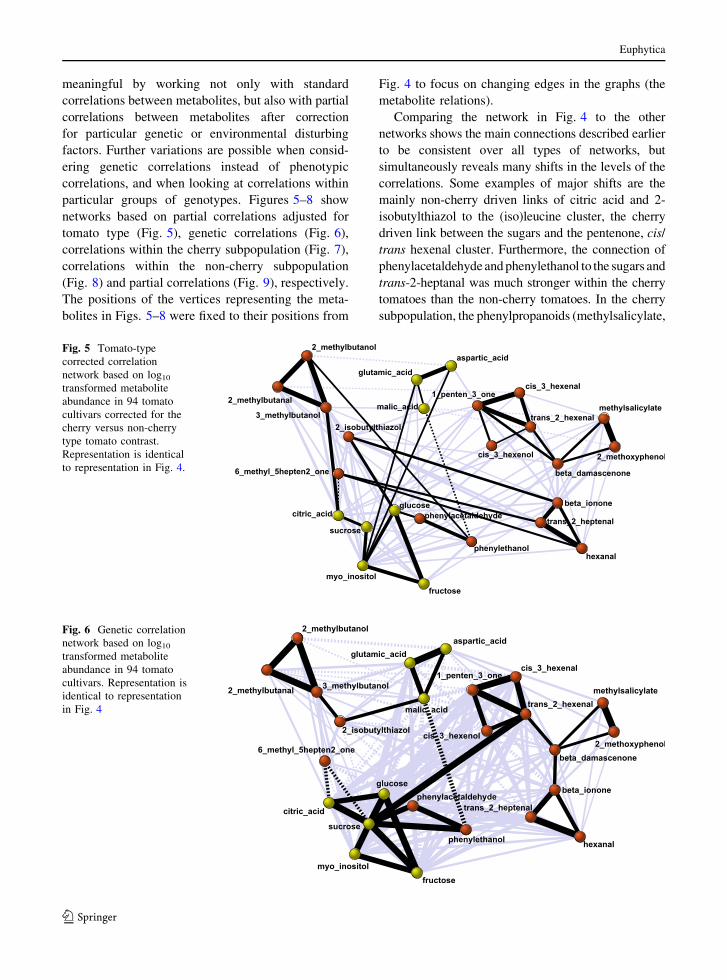
particular groups of genotypes. Figures 5–8 show
networks based on partial correlations adjusted for
tomato type (Fig. 5), genetic correlations (Fig. 6),
correlations within the cherry subpopulation (Fig. 7),
correlations within the non-cherry subpopulation
(Fig. 8) and partial correlations (Fig. 9), respectively.
The positions of the vertices representing the meta-
bolites in Figs. 5–8 were fixed to their positions from
Fig. 4 to focus on changing edges in the graphs (the
metabolite relations).
Comparing the network in Fig. 4 to the other
networks shows the main connections described earlier
to be consistent over all types of networks, but
simultaneously reveals many shifts in the levels of the
correlations. Some examples of major shifts are the
mainly non-cherry driven links of citric acid and 2-
isobutylthiazol to the (iso)leucine cluster, the cherry
driven link between the sugars and the pentenone, cis/
trans hexenal cluster. Furthermore, the connection of
phenylacetaldehyde and phenylethanol to the sugars and
trans-2-heptanal was much stronger within the cherry
tomatoes than the non-cherry tomatoes. In the cherry
subpopulation, the phenylpropanoids (methylsalicylate,
Fig. 5 Tomato-type
corrected correlation
network based on log10
transformed metabolite
abundance in 94 tomato
cultivars corrected for the
cherry versus non-cherry
type tomato contrast.
Representation is identical
to representation in Fig. 4.
Fig. 6 Genetic correlation
network based on log10
transformed metabolite
abundance in 94 tomato
cultivars. Representation is
identical to representation
in Fig. 4
Euphytica
123
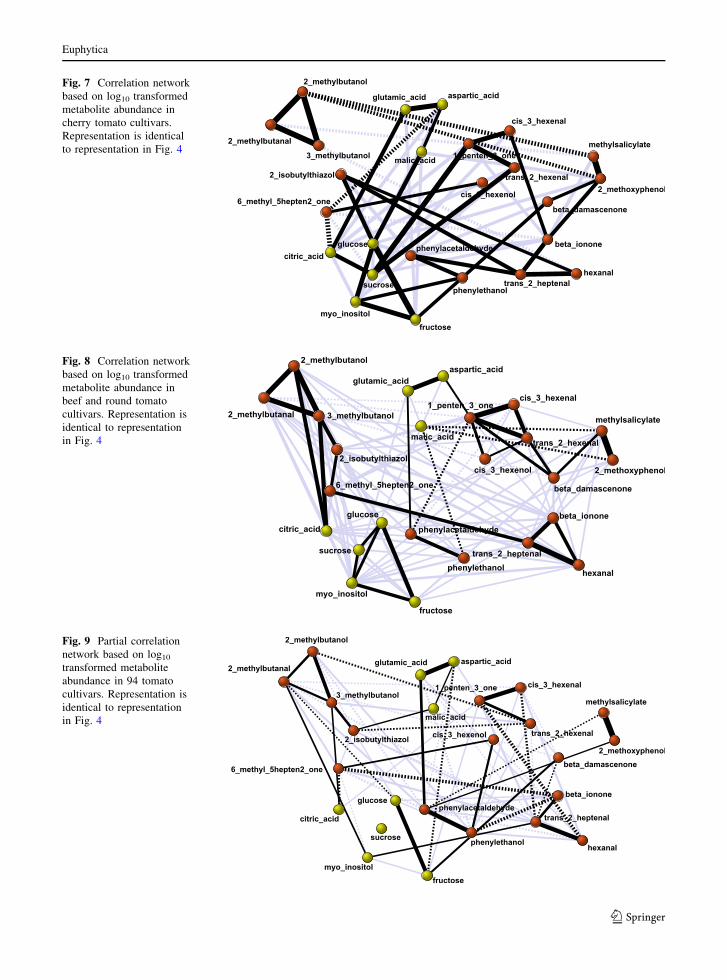
Fig. 7 Correlation network
based on log10 transformed
metabolite abundance in
cherry tomato cultivars.
Representation is identical
to representation in Fig. 4
Fig. 8 Correlation network
based on log10 transformed
metabolite abundance in
beef and round tomato
cultivars. Representation is
identical to representation
in Fig. 4
Fig. 9 Partial correlation
network based on log10
transformed metabolite
abundance in 94 tomato
cultivars. Representation is
identical to representation
in Fig. 4
Euphytica
123
2-methoxyphenol) had a high negative correlation with
2-methylbutanol, while in the non-cherry subpopulation
the phenylpropanoids were negatively correlated to
malic acid.
Figure 5 shows the tomato-type corrected correla-
tion network, correlations between the residuals of the
metabolite genotypic means after regression on the
cherry–non-cherry contrast. Major differences between
networks for corrected (Fig. 5) and uncorrected
(Fig. 4) metabolites are the weaker connected sugars/
phenolic volatiles cluster and the lower correlations
of this cluster with the hexanal/pentenone cluster and
trans-2-heptenal. Furthermore, malic acid loses part of
its negative correlations with the sugars/phenolic
volatiles cluster and 2-isobutylthiazol gains a strong
positive correlation to glucose in the tomato type
corrected network of Fig. 5. This makes sense since
most sugars, citric acid and the phenolic volatiles
had a higher relative abundance and malic acid and
2-isobutylthiazol had lower relative abundance in
cherry compared to beef and round tomatoes.
In the network based on estimated genetic corre-
lations (Fig. 6), the central role for sucrose is even
stronger than in the networks based on phenotypic
correlations (Fig. 4) and partial phenotypic correla-
tions (Fig. 5). Sucrose is the highest correlated
metabolite for citric acid, all measured sugars, the
phenolic volatiles and trans-2-hexanal in the genetic
network of Fig. 6 (Some qualification is necessary
here in that sucrose and the amino acids had a
relatively low estimated heritability, which may lead
to an over-emphasis on the genetic correlations
involving these metabolites due to the method we
used to estimate genetic correlations).
The network based on partial correlations in Fig. 9
shows that many of the main metabolite relations, the
strong correlations that turn up in all networks, seem to
be direct relations, i.e., relations that are largely
independent of the variation in the other metabolites.
Major exception to this finding is the sugar cluster,
where all correlations but the glucose–fructose and a
small fructose-myo-inositol correlation are lost. Fur-
thermore some other metabolite relations turn out to be
indirect, depending on a third metabolite that connects
the two. One example is the trans-2-hexenal relation
with cis-3-hexenal via 1-penten-3-one, and the hexanal
relation with b-ionone via trans-2-heptenal. In addi-
tion new relations can be found, like the positive direct
relation between hexanal and cis-3-hexenal that goes
together with a negative direct relation between
hexanal and 1-penten-3-one, a metabolite that shows
a strong direct relation with cis-3-hexenal.
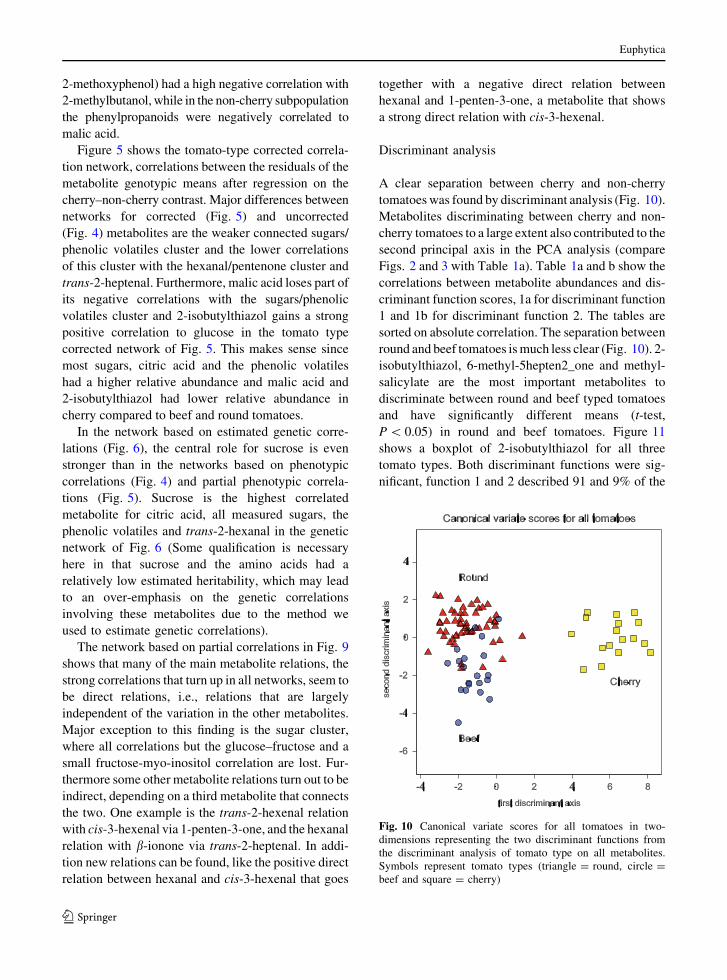
Discriminant analysis
A clear separation between cherry and non-cherry
tomatoes was found by discriminant analysis (Fig. 10).
Metabolites discriminating between cherry and non-
cherry tomatoes to a large extent also contributed to the
second principal axis in the PCA analysis (compare
Figs. 2 and 3 with Table 1a). Table 1a and b show the
correlations between metabolite abundances and dis-
criminant function scores, 1a for discriminant function
1 and 1b for discriminant function 2. The tables are
sorted on absolute correlation. The separation between
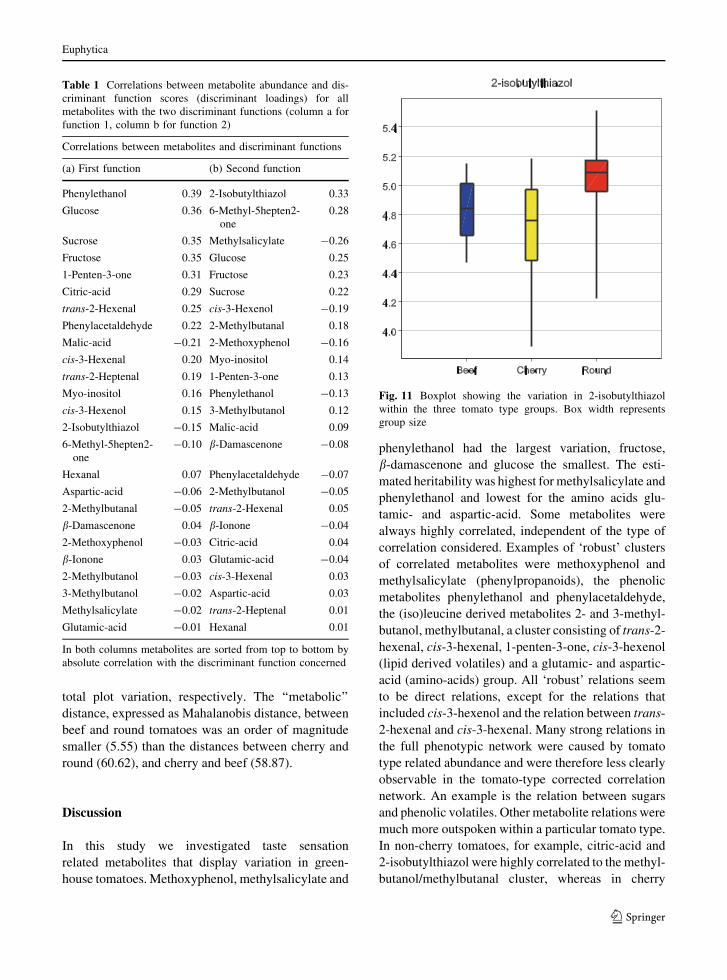
round and beef tomatoes is much less clear (Fig. 10). 2-
isobutylthiazol, 6-methyl-5hepten2_one and methyl-
salicylate are the most important metabolites to
discriminate between round and beef typed tomatoes
and have significantly different means (t-test,
P \ 0.05) in round and beef tomatoes. Figure 11
shows a boxplot of 2-isobutylthiazol for all three
tomato types. Both discriminant functions were sig-
nificant, function 1 and 2 described 91 and 9% of the
Fig. 10 Canonical variate scores for all tomatoes in two-
dimensions representing the two discriminant functions from
the discriminant analysis of tomato type on all metabolites.
Symbols represent tomato types (triangle = round, circle =
beef and square = cherry)
Euphytica
123
total plot variation, respectively. The ‘‘metabolic’’
distance, expressed as Mahalanobis distance, between
beef and round tomatoes was an order of magnitude
smaller (5.55) than the distances between cherry and
round (60.62), and cherry and beef (58.87).
Discussion
In this study we investigated taste sensation
related metabolites that display variation in green-
house tomatoes. Methoxyphenol, methylsalicylate and
phenylethanol had the largest variation, fructose,
b-damascenone and glucose the smallest. The esti-
mated heritability was highest for methylsalicylate and
phenylethanol and lowest for the amino acids glu-
tamic- and aspartic-acid. Some metabolites were
always highly correlated, independent of the type of
correlation considered. Examples of ‘robust’ clusters
of correlated metabolites were methoxyphenol and
methylsalicylate (phenylpropanoids), the phenolic
metabolites phenylethanol and phenylacetaldehyde,
the (iso)leucine derived metabolites 2- and 3-methyl-
butanol, methylbutanal, a cluster consisting of trans-2-
hexenal, cis-3-hexenal, 1-penten-3-one, cis-3-hexenol
(lipid derived volatiles) and a glutamic- and aspartic-
acid (amino-acids) group. All ‘robust’ relations seem
to be direct relations, except for the relations that
included cis-3-hexenol and the relation between trans-
2-hexenal and cis-3-hexenal. Many strong relations in
the full phenotypic network were caused by tomato
type related abundance and were therefore less clearly
observable in the tomato-type corrected correlation
network. An example is the relation between sugars
and phenolic volatiles. Other metabolite relations were
much more outspoken within a particular tomato type.
In non-cherry tomatoes, for example, citric-acid and
2-isobutylthiazol were highly correlated to the methyl-
butanol/methylbutanal cluster, whereas in cherry
Table 1 Correlations between metabolite abundance and dis-
criminant function scores (discriminant loadings) for all
metabolites with the two discriminant functions (column a for
function 1, column b for function 2)
Correlations between metabolites and discriminant functions
(a) First function (b) Second function
Phenylethanol 0.39 2-Isobutylthiazol 0.33
Glucose 0.36 6-Methyl-5hepten2-
one
0.28
Sucrose 0.35 Methylsalicylate -0.26
Fructose 0.35 Glucose 0.25
1-Penten-3-one 0.31 Fructose 0.23
Citric-acid 0.29 Sucrose 0.22
trans-2-Hexenal 0.25 cis-3-Hexenol -0.19
Phenylacetaldehyde 0.22 2-Methylbutanal 0.18
Malic-acid -0.21 2-Methoxyphenol -0.16
cis-3-Hexenal 0.20 Myo-inositol 0.14
trans-2-Heptenal 0.19 1-Penten-3-one 0.13
Myo-inositol 0.16 Phenylethanol -0.13
cis-3-Hexenol 0.15 3-Methylbutanol 0.12
2-Isobutylthiazol -0.15 Malic-acid 0.09
6-Methyl-5hepten2-
one
-0.10 b-Damascenone -0.08
Hexanal 0.07 Phenylacetaldehyde -0.07
Aspartic-acid -0.06 2-Methylbutanol -0.05
2-Methylbutanal -0.05 trans-2-Hexenal 0.05
b-Damascenone 0.04 b-Ionone -0.04
2-Methoxyphenol -0.03 Citric-acid 0.04
b-Ionone 0.03 Glutamic-acid -0.04
2-Methylbutanol -0.03 cis-3-Hexenal 0.03
3-Methylbutanol -0.02 Aspartic-acid 0.03
Methylsalicylate -0.02 trans-2-Heptenal 0.01
Glutamic-acid -0.01 Hexanal 0.01
In both columns metabolites are sorted from top to bottom by
absolute correlation with the discriminant function concerned
Fig. 11 Boxplot showing the variation in 2-isobutylthiazol
within the three tomato type groups. Box width represents
group size
Euphytica
123
tomatoes the methylbutanol/methylbutanal cluster was
highly negatively correlated to the phenylpropanoid
volatiles methylsalicylate and 2-methoxyphenol. The
correlations within the sugar cluster were highly
interdependent, only the glucose–fructose and a small
fructose-myo-inositol relation were present in the
partial correlation network.
In this paper, we used network plots to simulta-
neously visualize all significant correlations between
metabolites. In contrast to PCA, network plots do not
focus on representation of maximum variation in data
matrices, which sometimes negatively affects repre-
sentation of pairwise relations between variables.
Especially, relations between metabolites whose
variation is spread out over several principal axes
can be easily overlooked in PCA biplots, even when
metabolite abundance is normalized. We demon-
strated that a fruitful way to explore patterns in
metabolite variation is by a combination of PCA
(without column standardization) and network plots.
Correlation networks are very useful to study changes
in metabolite relations when comparing different
experimental conditions or different parts of the
overall metabolic variation. By fixing the positions of
the metabolite nodes, changes in correlation structure
can be easily identified. Dissecting metabolite vari-
ation and correlations into identifiable genetic and
environmental parts will help to understand relations
of these metabolites to processes on other biological
levels. Presently, we are investigating methods to link
patterns in organoleptic variation to patterns in
metabolic variation and molecular marker variation.
Acknowledgements This work was funded by the research
program of the Center for BioSystems Genomics (project
TQ3), which is a Centre of Excellence under the auspices of
the Netherlands Genomics Initiative.
Open Access This article is distributed under the terms of the
Creative Commons Attribution Noncommercial License which
permits any noncommercial use, distribution, and reproduction
in any medium, provided the original author(s) and source are
credited.
References
Baldwin EA, Goodner K, Plotto A, Pritchett K, Einstein M
(2004) Effect of volatiles and their concentration on per-
ception of tomato descriptors. J Food Sci 69:S310-S318
Baldwin EA, Scott JW, Shewmaker CK, Schuch W (2000)
Flavor trivia and tomato aroma: biochemistry and possible
mechanisms for control of important aroma components.
Hortscience 35:1013–1022
Batagelj V, Mrvar A (2003) Pajek–analysis and visualization
of large networks. In: Junger M, Mutzel P (eds) Graph
drawing software. Springer, Berlin, p 77
Benjamini Y, Hochberg Y (1995) Controlling the false discovery
rate—a practical and powerful approach to multiple testing.
J Royal Stat Soc Ser B-Methodol 57:289–300
Burdon RD (1977) Genetic correlation as a concept for
studying genotype-environment interaction in forest tree
breeding. Silvae Genet 26:168–175
Buttery RG, Ling LC (1993) Volatile components of tomato
fruit and plant-parts—relationship and biogenesis. Acs
Symp Ser 525:23–34
Camacho DM (2005) The origin of correlations in metabolo-
mics data. Metabolomics 1:53–63
Dillon WR, Goldstein M (1984) Multivariate analysis: methods
and applications. Wiley, New York
Falconer DS, Mackay TFC (1996) Introduction to quantitative
genetics. Longman, Harlow
Graffelman J, van Eeuwijk F (2005) Calibration of multivariate
scatter plots for exploratory analysis of relations within
and between sets of variables in genomic research. Biom J
47:863–879
Jolliffe IT (2002) Principal component analysis. Springer-
Verlag, New York
Krumbein A, Peters P, Bruckner B (2004) Flavour compounds
and a quantitative descriptive analysis of tomatoes (Lyc-opersicon esculentum Mill.) of different cultivars in short-
term storage. Postharvest Biol Technol 32:15–28
Malosetti M, Ribaut JM, Vargas M, Crossa J, van Eeuwijk FA
(2008) A multi-trait multi-environment QTL mixed model
with an application to drought and nitrogen stress trials in
maize (Zea mays L.). Euphytica (this issue)
Morgenthal K, Weckwerth W, Steuer R (2006) Metabolomic
networks in plants: transitions from pattern recognition to
biological interpretation. Biosystems 83:108–117
Roessner-Tunali U, Hegemann B, Lytovchenko A, Carrari F,
Bruedigam C, Granot D, Fernie AR (2003) Metabolic
profiling of transgenic tomato plants overexpressing
hexokinase reveals that the influence of hexose phos-
phorylation diminishes during fruit development. Plant
Physiol 133:84–99
Ruiz JJ, Alonso A, Garcia-Martinez S, Valero M, Blasco P,
Ruiz-Bevia F (2005) Quantitative analysis of flavour
volatiles detects differences among closely related tradi-
tional cultivars of tomato. J Sci Food Agric 85:54–60
Steuer R (2006) On the analysis and interpretation of correla-
tions in metabolomic data. Brief Bioinform 7:151–158
Steuer R, Kurths J, Fiehn O, Weckwerth W (2003a) Inter-
preting correlations in metabolomic networks. Biochem
Soc Trans 31:1476–1478
Steuer R, Kurths J, Fiehn O, Weckwerth W (2003b) Observing
and interpreting correlations in metabolomic networks.
Bioinformatics 19:1019–1026
Storey JD, Tibshirani R (2003) Statistical significance for ge-
nomewide studies. Proc Natl Acad Sci USA 100:9440–
9445
Tandon KS, Baldwin EA, Scott JW, Shewfelt RL (2003) Linking
sensory descriptors to volatile and nonvolatile components
of fresh tomato flavor. J Food Sci 68:2366–2371
Euphytica
123

Tikunov Y, Lommen A, de Vos CHR, Verhoeven HA, Bino
RJ, Hall RD, Bovy AG (2005) A novel approach for
nontargeted data analysis for metabolomics. Large-scale
profiling of tomato fruit volatiles. Plant Physiol
139:1125–1137
van Berloo R, Gort G, Zhu A, Ursem R, Bovy A, van Eeuwijk F
(submitted) Association mapping for fruit quality traits in a
set of cultivated tomato hybrids
Weckwerth W, Loureiro ME, Wenzel K, Fiehn O (2004)
Differential metabolic networks unravel the effects of
silent plant phenotypes. Proc Natl Acad Sci USA
101:7809–7814
Euphytica
123