Role and significance of fruits in boosting immunity against ...
Upload
khangminh22Category
view
1download
0
Études des anti-oxydants-antimicrobiens
provenant de fruits et légumes
Thèse
Cuong Ho
Doctorat en sciences et technologie des aliments
Philosophiae Doctor (Ph. D.)
Québec, Canada
© Cuong Ho, 2017
Études des anti-oxydants-antimicrobiens provenant de fruits et légumes
Thèse
Cuong Ho
Sous la direction de :
Joseph Arul, directeur de recherche
Paul Angers, codirecteur de recherche
iv
Résumé
Plusieurs études ont rapporté l’activité antimicrobienne et anti-oxydante d'extraits de sous-
produits végétaux. Le recours à l’utilisation de ces extraits dans les produits alimentaires
pourrait constituer une stratégie innovante et prometteuse. Les résidus de fruits et légumes
peuvent être une source potentielle de composés bioactifs. L’enjeu de cette étude était
d’initier des recherches qui pourront aboutir au développement d’agents anti-oxydants-
antimicrobiens à partir des sous-produits végétaux destinés à la conservation des aliments,
comme une alternative aux produits chimiques synthétiques. L'étude initiale a été
d'identifier des extraits de fruits et légumes qui possèdent à la fois de grandes propriétés
antimicrobiennes et anti-oxydantes. Enfin, des moyens simples pour augmenter l'activité
antimicrobienne de ces extraits ont été étudiés.
Environ 160 extraits aqueux de sous-produits de fruits et légumes ont été criblés pour
évaluer leur potentiel antimicrobien et anti-oxydant. L’activité antimicrobienne a été
déterminée par l’inhibition de la croissance d’Escherichi coli et de Bacillus subtilis.
L’activité anti-oxydante a été mise évidence par le test au DPPH (2,2-diphenyl -1-
picrylhydrazyl). L'étude a conduit à l'identification des extraits présentant à la fois un
potentiel antimicrobien et des propriétés anti-oxydantes. Les propriétés bioactives des
extraits sont influencées par le pH de l'extrait, le type de tissu (fruits, feuilles et racines) et
le type physiologique des fruits (climactérique). Les résultats ont montré l’existence d’une
relation entre les propriétés anti-oxydantes et antimicrobiennes des extraits de plantes. De
ce fait, l'indice anti-oxydant-antimicrobien développé pourrait être utile dans le choix des
sources végétales bioactives. Les extraits de plantes aux propriétés antimicrobiennes et anti-
oxydantes présentent un potentiel comme agent de conservation sécuritaire, bénéfique pour
la santé et économique.
La considération de la vitesse de piégeage des radicaux (facteur du temps) pour définir
l'efficacité réelle (capacité) du système anti-oxydant a été considérée comme la meilleure
manière d’exprimer avec plus de fiabilité le pouvoir anti-oxydant réel. La nouvelle
expression, le pouvoir antiradicalaire - ARP, produite à partir du test DPPH, peut être plus
utile pour identifier l'activité anti-oxydante des échantillons biologiques. Certains
échantillons présentaient une valeur ARP élevée tels que les extraits de rambutan, feuille de

v
canneberge, feuille de bleuet, feuille de vigne (sauvage), feuille de framboise, feuille de
bétel, avocat, grenade et cherimoya. Les extraits de feuilles possèdent, en général, une
valeur d’ARP supérieure à celle des fruits tandis que, les extraits de racines présentent les
plus faibles ARP. De plus, cette étude montre également que le nombre moyen d’oxydation
du carbone de mélanges complexes tels que des extraits de plantes peut prédire leur pouvoir
anti-oxydant, en dépit de la disparité entre les tissus de feuilles et de fruits.
Le spectre d'activité anti-radicalaire d'extraits sélectionnés a été exploré. L'activité anti-
oxydante a été évaluée par différentes méthodes incluant, capacité anti-oxydante
équivalente de Trolox (TEAC), essai de radicaux libres (DPPH), test du pouvoir réducteur
d’ion ferrique (FRAP), mesure du potentiel d'oxydoréduction, réduction du peroxyde
d'hydrogène, du radical hydroxyle, d’anion superoxyde, d’oxyde nitrique et de l’activité de
chélation du fer. Les teneurs totales en composés phénoliques (TPC) et en flavonoïdes
(TFC) des extraits ont également été déterminées. Les extraits de feuille de bétel, fruit de
bleuet, feuille de cassis, feuille de canneberge ont montré une bonne activité de piégeage
des radicaux (essai TEAC); ceux de pomme, oseille, vigne rouge et racine de pissenlit
étaient efficaces contre SOA; ceux de feuilles de canneberge, feuille de bleuet, cassis et
romarin contre le radical hydroxyle; ceux de bette à carde, panais, brocoli et orange contre
H2O2; et ceux de pomme de terre, banane, oseille, feuille d'argousier contre l'oxyde
nitrique. Les extraits de feuille et fruit de bleuet, grenade, cassis et feuille de bétel ont
montré un bon pouvoir réducteur d’ion ferrique. Les extraits possédant la capacité élevée de
chélation du fer étaient: feuille d’argousier, radis, panais, feuille de bétel et mangoustan.
L'extrait de feuille de bétel présentait des activités élevées, y compris de fixation du fer et
de piégeage de divers radicaux, à l'exception de l'oxyde nitrique, où l'activité était
néanmoins modérée. Les essais de TEAC, de DPPH et de FRAP fournissent
essentiellement la même réponse concernant l'activité anti-oxydante des extraits de plantes,
ce qui suggère que l'un de ces essais serait suffisant pour évaluer leur capacité anti-
radicalaire. Cette étude suggère également que l'activité anti-oxydante d'une substance,
déterminée par un ou plusieurs essais, ne donne pas une image complète de son efficacité
contre les diverses espèces de radicaux oxygénés; et elle montre que la détermination du
spectre de l'activité anti-radicalaire serait nécessaire.

vi
L’activité antimicrobienne des extraits de plantes sélectionnés a été évaluée en détail par
turbidimétrie en milieu liquide et par diffusion en milieu solide (gel). L’activité
antimicrobienne a été exprimée dans la première méthode par l’inhibition de la croissance
(GI), par la concentration minimale inhibitrice (MIC) et par une nouvelle expression,
dénommée index antimicrobien (AMI). Dans la seconde méthode, l’activité a été exprimée
en zone d’inhibition. L'AMI prend en compte les trois phases de croissance des bactéries.
Bien que les méthodes turbidimétriques soient fiables dans l’évaluation de l’activité
antimicrobienne des substances, la nouvelle expression (AMI) semble être plus
significative car, elle comprend l’information sur l’interaction entre la substance et le
micro-organisme et sa vitesse de croissance en présence de cette substance. De plus, l'AMI
démarque l’activité des échantillons, même ceux qui sont très actifs. Le spectre d’activité
antimicrobienne des extraits de plantes sélectionnés a été également étudié. Seulement
quelques extraits ont montré un spectre d’activité antimicrobienne assez large. En effet,
seul l’extrait de feuille de bétel a un large spectre d’activité contre les bactéries, les levures
et les champignons, suivis des extraits de grenade et de fruits d’argousier qui semblent être
efficaces contre les bactéries et les levures. L’extrait de cassis est effectivement une
substance antibactérienne.
Finalement, différentes stratégies pour améliorer l’activité antimicrobienne d'extraits anti-
oxydants-antimicrobiens sélectionnés ont été explorées. Trois approches, incluant
l’extraction par solvants sélectifs, le mélange binaire des extraits et l'addition de composés
végétaux, ont été étudiées. L’activité anti-oxydante-antimicrobienne et le profil
phytochimique ont été analysés. Le résultat montre que l’eau chaude peut être utilisée
comme solvant pour l’extraction d’agents anti-oxydants-antimicrobiens d’origine végétale,
bien qu’un solvant polaire extrait en préférence les substances phénoliques et modestement
les substances non polaires comme les terpénoïdes. Toutefois, compte tenu du rendement et
de l’activité des extraits, l’eau semble être appropriée, et elle peut être considérée comme
un solvant efficace pour les fruits qui sont riches en substances phénoliques. Néanmoins,
d'autres solvants sélectifs doivent être considérés pour l’extraction des substances actives
non-polaires issues de matière première végétale comme les feuilles. Certaines
augmentations de l’activité antimicrobienne sont possibles par le mélange de deux extraits
de plantes ou par l’addition de composés végétaux. On a aussi observé que la composition

vii
des mélanges peut être importante, car les interactions synergiques ou antagonistes se
retrouvent dans certaines proportions. Le mélange des extraits de grenade et cassis d’une
part et le mélange des extraits de thé vert et pomme de cajou d’autre part ont montré une
amélioration d’activité. L’ajout de glyoxal de méthyle et mono-caprine a également produit
une augmentation de l’activité des extraits de plantes. L'addition de glyoxal de méthyle à 25
% (p/p) a amélioré l’activité des extraits de grenade et de cassis.
Dans l'ensemble, ce travail a exploré le potentiel des extraits des sous-produits de fruits et
de légumes comme agent anti-oxydant-antimicrobien. Les extraits de plantes montrant des
potentiels anti-oxydants et antimicrobiens regroupent: olive, canneberge, noni, feuille de
bétel, cassis, grenade, citronnelle, épinard, raisin vert (vin), cassis (résidu), aubergine,
ramboutan, prune indienne, feuille de canneberge, feuille de romarin, feuille de vigne
(sauvage), thé vert, mangoustan et feuille de framboise. Cependant, de cette liste, seuls
quelques extraits (feuille de bétel, grenade, résidus de cassis) présentent un large spectre
d’activité anti-oxydante et antimicrobienne. En outre, cette étude a introduit de nouvelles
expressions pour l’activité anti-oxydante (ARP) et antimicrobienne (AMI) des mélanges
complexes tels que les extraits de plantes. Ces expressions peuvent être utiles pour le
criblage de matériels d’origine végétale dans la recherche de ces activités. Un autre
enseignement de cette étude est que l'amélioration de l'activité antimicrobienne des extraits
de plantes ne peut pas être possible simplement par le mélange d'extraits, en raison des
interactions potentielles entre les composants des extraits. La connaissance de la
composition phytochimique est essentielle pour comprendre de telles interactions, dans la
sélection des mélanges et pour déterminer les approches possibles pour améliorer l'activité
antimicrobienne. Les sous-produits de végétaux peuvent être une source potentielle
d'antioxydant-antimicrobiens pour une application dans la conservation des aliments,
comme alternative aux agents synthétiques, mais beaucoup de travaux sont encore
nécessaires pour atteindre ce but, ce qui nécessiterait une approche systémique.
viii
Abstract
There is a growing interest in the development of strategies to use agricultural and
industrial residues as a source of high value-added, including bioactive products. The
residues of fruits and vegetables may be a potential source of bioactive compounds. The
major objective of this work is to conduct studies to pave the way for the development of
antioxidant-antimicrobials from plant by-products for use in food preservation, as
alternative to synthetic chemicals. The starting point was the identification of extracts of
fruit and vegetable extracts exhibiting high antimicrobial and antioxidant properties. The
selected extracts were then characterized for their spectrum of antioxidant and
antimicrobial activities. Finally, simple ways of enhancing the antimicrobial activity of the
selected extracts were examined.
Aqueous extracts of about 160 fruit and vegetable by-products were evaluated for their
potential as antimicrobial and antioxidant agents. The growth inhibiting activity of all the
160 extracts were tested against Escherichia coli, and Bacillus Subtilis; and the antioxidant
activity was determined by DPPH radical scavenging assay. The pH of the extract, type of
tissue (fruit, leaf and root) and physiological type of fruits (climacteric) had impact on the
bioactive properties. There was some relationship between antioxidant and antimicrobial
properties of the plant extracts. The proposed antioxidant-antimicrobial index may be
useful in the selection of plant sources of bio-actives.
Consideration of rate of radical quenching (time factor) to define actual efficacy (capacity)
of antioxidant system was found to be a better and reliable way of expressing the real
antioxidant power. The new expression, antiradical power - ARP, generated from DPPH
assay may be more useful in identifying the antioxidant activity of biological samples.
Some samples exhibited high ARP value such as rambutan, cranberry leaf, blueberry leaf,
grape leaf (wild), raspberry leaf, betel leaf, avocado, pomegranate and custard apple. Leaf
extracts possess, in general, higher ARP than fruits, and root extracts possess low ARP. In
addition, this study also suggests that average carbon oxidation number of complex
mixtures such as plant extracts may portend their antioxidant power, in spite of the
disparity between leaf and fruit materials.

ix
In chapter 4, plant extracts selected from the original 160 were investigated for their
spectrum of anti-radical activity. The antioxidant activity was evaluated by Trolox
equivalent antioxidant capacity (TEAC), DPPH free radical assay (DPPH), ferric reducing
power assay (FRAP), redox potential measurement, hydrogen peroxide, hydroxyl radical,
superoxide anion, nitric oxide and iron chelating activities. Their total phenolic content
(TPC) and total flavonoid content (TFC) were also determined. Betel leaf, blueberry fruit
and black currant and cranberry leaf showed high radical scavenging activity (TEAC
assay); apple, sorrel, red grape and dandelion root were effective against SOA; cranberry
leaf, blueberry leaf, black currant and Rosemary against hydroxyl radical; rainbow chard,
parsnip, broccoli and orange against H2O2; and potato, banana, sorrel, sea buckthorn leaf
against nitric oxide. Blueberry leaf and fruit, pomegranate, black currant and betel leaf
showed high ferric ion reducing power. The extracts showing high iron binding capacity
were: sea buckthorn leaf, radish, parsnip, betel leaf and mangosteen. Betel leaf extract
exhibited high activities, including iron binding and scavenging of various radicals except
nitric oxide, where the activity was moderate. TEAC, DPPH and FRAP assays provide
essentially the same response with respect to the antioxidant activity of plant extracts,
suggesting that any one of them would be adequate to evaluate their anti-radical capacity.
This study also suggests that antioxidant activity of a substance, determined by one or
more related assays, does not give the complete picture of its effectiveness against various
species of oxygen radicals; and emphasizes that determination of the spectrum of the anti-
radical activity would be necessary.
In chapter 5, the antimicrobial activity of selected plant extracts was evaluated in detail by
turbidimetric methods in liquid medium, and by well-diffusion method in gel medium. The
antimicrobial activity was expressed in the former by growth inhibition, minimum
inhibitory concentration - MIC and by a new expression, the antimicrobial index – AMI;
and in the latter, expressed by zone of inhibition. AMI takes into account all the three
growth phases of the bacteria. Although the turbidimetric methods were in good agreement
in the assessment of the activity of the substances, the new expression, AMI, appears to be
more meaningful since it carries the information regarding interaction between the
substance and the microorganism and the growth rate in the presence of that substance. In
addition, AMI demarcates the activity of samples, even those found to be highly active.

x
Furthermore, the spectrum of antimicrobial activity of selected plant extracts was also
examined. Only a few extracts showed some broad spectrum in their activities. In effect,
only betel leaf extract showed a broad spectrum of antimicrobial activity against bacteria,
yeasts and fungi; whereas pomegranate and sea buckthorn fruit extracts appear to be
effective against both bacteria and yeasts. Black currant extract is effectively an
antibacterial substance.
In chapter 6, various ways of enhancing the antimicrobial activity of selected antioxidant-
antimicrobial extracts were explored. Three approaches, including selective solvent
extraction, binary blending of extracts and addition of plant compounds were investigated.
Antioxidant, antimicrobial activity and the profile of phytochemical classes were analyzed.
The results showed that hot water could be used for solvent extraction of antioxidant-
antimicrobials from plant materials, albeit a polar solvent that extracts phenolic substances
preferably and only modestly non-polar substances such as terpenoids. However,
considering the yield of the extracts and the activity, water appeared to be an effective
solvent solvent for fruit sources that are rich in phenolic substances. Other selective
solvents must be considered for extraction of active non-polar substances for plant sources
such as leaves. Some enhancement in antimicrobial activity was possible by either mixing
plant extracts or by the addition of plant compounds. It was also observed that the
composition of blends or mixtures might be important, since synergistic or antagonistic
interactions occurred at certain proportions. Pomegranate and black currant extract blends
and green tea and cashew apple extract blends showed enhancement in activity. The
addition of methyl glyoxal and mono-caprin also showed enhancement in the activity of
plant extracts. Methyl glyoxal at 25 % (w/w) addition improved the activity of pomegranate
and black currant extracts.
Overall, this work explored the potential of extracts of fruit and vegetable by-products as
anti-oxidant-antimicrobials. Some plant extracts having potential as antioxidant-
antimicrobial agents. They include: olive, cranberry, noni, betel leaf, black currant,
pomegranate, lemon grass, spinach, green grape (wine), black currant (residue), egg plant,
rambutan, Indian plum, cranberry leaf, rosemary leaf, grape leaf (wild), green tea,
mangosteen and raspberry leaf. However, the list is reduced to a few (betel leaf,

xi
pomegranate, black currant residue), should broad antioxidant and antimicrobial activities
are taken into account.
In addition, this study introduces new expressions for antioxidant (ARP) and antimicrobial
(AMI) activities of complex mixtures such as plant extracts, and they can be useful in the
screening of plant materials for these activities. The knowledge of the phytochemical
composition is essential to understand such interactions, in the selection of mixtures and to
determine possible approaches to enhance the antimicrobial activity. Plant by-product can
be a potential source of antioxidant-antimicrobial for use in food preservation, as
alternative to synthetic agents, but much work is needed to realize this goal, and that would
require a systemic approach.
xii
Table des matières
Résumé .................................................................................................................................. iv
Abstract .............................................................................................................................. viii
Table des matières .............................................................................................................. xii
Liste des tableaux ............................................................................................................. xvii
Liste des figures ................................................................................................................. xix
Liste des abréviations et des sigles .................................................................................. xxii
GENERAL INTRODUCTION ........................................................................................... 1
Chapter 1 REVUE DE LITERATURE .............................................................................. 5
1.1 Plant by-products: eco-friendly source of novel bioactive compounds ................. 6 1.1.1 Why plant by-products? ......................................................................................... 7 1.1.2 Source, provider and type of by-products .............................................................. 8
1.1.3 Methods of extraction of bioactive compounds from plant ................................... 9 1.1.4 Trend and challenges in using plant by-products ................................................. 11
1.2 Plant secondary metabolites .................................................................................... 13 1.2.1 Primary and secondary metabolites ..................................................................... 13 1.2.2 Plant secondary metabolism ................................................................................. 14
1.2.3 Biosynthesis of secondary metabolites ................................................................ 16 1.2.3.1 Terpenes......................................................................................................... 18 1.2.3.2 Phenolic compounds ...................................................................................... 19
1.2.3.3 Nitrogen-containing compounds ................................................................... 23
1.2.3.4 Polyketides..................................................................................................... 23
1.3 Antioxidants .............................................................................................................. 25 1.3.1 Concepts ............................................................................................................... 25
1.3.2 Why to examine antioxidants from plants? .......................................................... 26 1.3.3 Production of free radical in biology ................................................................... 28
1.3.4 Natural sources of antioxidant compounds .......................................................... 29 1.3.5 Modulation of free radical by antioxidants .......................................................... 30
1.3.5.1 Mechanisms of antioxidant action ................................................................. 31 1.3.5.2 Defense system mechanism in vivo against oxidative damage ..................... 31 1.3.5.3 Plant antioxidant systems .............................................................................. 33
1.3.6 The structure–activity relationships of antioxidant .............................................. 35 1.3.7 Methods of in vitro antioxidant activity determination .................................... 37
1.3.7.1 In vitro antioxidant capacity assays ............................................................... 37 1.3.7.2 Mode of action of in vitro antioxidant activity assays ................................... 38
1.3.8 Trends and challenges in application of antioxidants from plant sources. .......... 46
1.4 Plants as a source of antimicrobials ........................................................................ 49 1.4.1 Why antimicrobials from plant sources? .............................................................. 49
1.4.2 Major groups of phytochemicals with antimicrobial properties .......................... 50 1.4.3 Modes of action of antimicrobials ........................................................................ 53 1.4.4 Bacterial resistance to antimicrobials and mechanisms ....................................... 56

xiii
1.4.5 In vitro methods to evaluate plant extracts for antimicrobial activity.................. 57
1.4.5.1 Diffusion method ........................................................................................... 58
1.4.5.2 Dilution method ............................................................................................. 58 1.4.5.3 Broth dilution ................................................................................................. 58 1.4.5.4 Agar dilution .................................................................................................. 59 1.4.5.5 Time kill assay ............................................................................................... 59
1.4.6 Research trends and challenges of antimicrobials from plant products ............... 59
1.4.7 Recent literature on bioactivities of some specific fruits and vegetables - A
random walk .................................................................................................................. 61
1.5 Hypotheses ................................................................................................................. 66 1.6 Objectives .................................................................................................................. 67
1.6.1 General Objective ................................................................................................. 67
1.6.2 Specific Objectives ............................................................................................... 67
Chapter 2 NATURAL ANTIOXIDANT-ANTIMICROBIALS: SCREENING OF
FRUITS, VEGETABLES AND THEIR BY-PRODUCTS ............................................. 68
2.1 Abstract ...................................................................................................................... 69 2.2 Introduction ............................................................................................................... 70 2.3 Materials and Methods ............................................................................................. 72
2.3.1 Plant materials ...................................................................................................... 72 2.3.2 Chemicals and reagents ........................................................................................ 72 2.3.3 Preparation of extracts .......................................................................................... 72
2.3.4 Bacterial strains and inoculum preparation .......................................................... 72 2.3.5 Antimicrobial activity assay ................................................................................. 73
2.3.6 Antioxidant assay - DPPH radical-scavenging capacity ...................................... 73 2.3.7 Statistical analyses ............................................................................................... 74
2.4 Results ........................................................................................................................ 75 2.4.1 Antimicrobial activity .......................................................................................... 75
2.4.2 Antioxidant activity of fruit and vegetable extracts (DPPH assay) ..................... 84 2.4.3 Correlation between the antimicrobial and antioxidant activity of plant extracts 84
2.5 Discussion .................................................................................................................. 86 2.5.1 Antioxidant and antibacterial activities of plant by-products .............................. 86 2.5.2 E. coli and B. subtilis sensitivity. ......................................................................... 86
2.5.3 Effect of pH of extracts on AM and AO properties ............................................. 88 2.5.4 Effect of physiological type of fruit: climacteric vs. non-climacteric.................. 89 2.5.5 Effect of plant tissue type ..................................................................................... 90 2.5.6 Antioxidant activity of Brassica and Allium extracts .......................................... 90 2.5.7 Correlation between antioxidant and antimicrobial activities .............................. 92
2.5.8 Antioxidant-antimicrobials index (AO-AM Index) ............................................. 93
2.6 Conclusions ................................................................................................................ 95
Chapter 3 ANTI-RADICAL POWER (ARP) OF PLANT EXTRACTS: A NEW
MEASURE OF ANTIOXIDANT PROPERTY FROM DPPH ASSAY ....................... 96
3.1 Abstract ...................................................................................................................... 97 3.2 Introduction ............................................................................................................... 98 3.3 Materials and methods ........................................................................................... 100
3.3.1 Plant materials .................................................................................................... 100

xiv
3.3.2 Chemicals and reagents ...................................................................................... 100
3.3.3 Plant extract preparation .................................................................................... 100
3.3.4 DPPH free radical scavenging assay .................................................................. 100 3.3.5 Elemental and metal analyses ............................................................................ 101 3.3.6 Reaction kinetics and calculation of reaction rate constants .............................. 102 3.3.7 Anti-Radical Power (ARP): The overall antioxidant activity ............................ 104 3.3.8 Average carbon oxidation number ..................................................................... 105
3.3.9 Data analysis ...................................................................................................... 105
3.4 Results and discussion ............................................................................................ 106 3.4.1 Estimation of antioxidant activity by DPPH• assay ........................................... 106
3.4.1.1 Antioxidant capacity .................................................................................... 107 3.4.1.2 Rate of radical scavenging ........................................................................... 108
3.4.2 Relation between scavenging rate and capacity of antioxidant activity ............ 113
3.4.3 Anti-Radical Power ............................................................................................ 116 3.4.4 Average carbon oxidation number (ACON) ...................................................... 119
3.5 Conclusions .............................................................................................................. 124
Chapter 4 ANTI-RADICAL ACTIVITY SPECTRUM OF SECLETED FRUIT AND
VEGETABLE EXTRACTS AGAINST SEVERAL REACTIVE OXYGEN SPECIES
............................................................................................................................................ 125
4.1 Abstract .................................................................................................................... 126
4.2 Introduction ............................................................................................................. 127 4.3 Materials and methods ........................................................................................... 129
4.3.1 Plant materials .................................................................................................... 129
4.3.2 Chemicals and reagents ...................................................................................... 130 4.3.3 Plant extract preparation .................................................................................... 130
4.3.4 Total phenolic content ........................................................................................ 130 4.3.5 Total flavonoid assay ......................................................................................... 131
4.3.6 Antioxidant Assays ............................................................................................ 131 4.3.6.1 TEAC (Trolox equivalent antioxidant capacity) ......................................... 131 4.3.6.2 DPPH free radical scavenging assay ........................................................... 132
4.3.6.3 Reducing power property ............................................................................ 132 4.3.6.4 Hydrogen peroxide scavenging activity ...................................................... 133
4.3.6.5 Hydroxyl radical scavenging activity .......................................................... 133 4.3.6.6 Superoxide anion scavenging capacity ........................................................ 133 4.3.6.7 Nitric oxide scavenging activity .................................................................. 134 4.3.6.8 Metal chelating assay (Spectrometric assay) ............................................... 134
4.3.7 Data analysis ...................................................................................................... 134
4.4. Results and Discussion ........................................................................................... 136 4.4.1 Total phenolic and flavonoid contents ............................................................... 136
4.4.2 Antioxidant activity ............................................................................................ 138 4.4.2.1 Test Radicals (ABTS tand DPPH)............................................................... 138 4.4.2.2 Relation between anti-radical activities (TEAC, DPPH) and total phenolic
content (TPC) and total flavonoid content (TFC) ................................................... 141 4.4.2.3 Reducing power property (FRAP) ............................................................... 143 4.4.2.4 Hydroxyl radical scavenging activity .......................................................... 146 4.4.2.5 Hydrogen peroxide scavenging activity ...................................................... 147

xv
4.4.2.6 Superoxide anion scavenging activity ......................................................... 147
4.4.2.6 Nitric oxide scavenging activity .................................................................. 147
4.4.2.7 Metal chelating activity ............................................................................... 148 4.4.3 Inter-relationships between anti-radical activities ............................................. 150 4.4.4 Anti-radical activity spectrum ............................................................................ 153
4.5 Conclusions .............................................................................................................. 155
Chapter 5 CHARACTERIZATION OF ANTIMICROBIAL ACTIVITY OF
SELECTED PLANT EXTRACTS: ANTIMICROBIAL ACTIVITY INDEX AND
SPECTRUM OF ACTIVITY .......................................................................................... 156
5.1 Abstract .................................................................................................................... 157 5.2 Introduction ............................................................................................................. 158
5.3 Materials and methods ........................................................................................... 161 5.3.1 Plant materials .................................................................................................... 161
5.3.2 Extraction and stock solution preparation .......................................................... 162
5.3.4 Bacterial strains and inoculum preparation ........................................................ 162 5.3.5 Antimicrobial activity assays ............................................................................. 162
5.3.5.1 Zone inhibition agar gel diffusion assay...................................................... 162 5.3.5.2 Micro-titer broth dilution (growth inhibition or inhibition capacity) and time
kill curve assay ........................................................................................................ 163 5.3.5.3 Broth micro-dilution (MIC) assay ............................................................... 163 5.3.5.4 Agar dilution (yeasts) .................................................................................. 164
5.3.5.5 Anti-fungal assay (agar dilution) ................................................................. 164 5.3.6 Empirical expression for antimicrobial activity ................................................. 164
5.3.7 Data analysis ...................................................................................................... 167
5.4 Results and discussion ............................................................................................ 168 5.4.1 Antimicrobial activity of plant extracts .............................................................. 168
5.4.1.1 Antimicrobial Index (AMI) ......................................................................... 168
5.4.1.2 Growth inhibition or antimicrobial capacity ............................................... 173 5.4.1.3 Minimum inhibitory concentration (MIC) .................................................. 173 5.4.1.4 Zone inhibition (ZI) ..................................................................................... 173
5.4.1.5 Comparison of methods in the characterization plant extracts .................... 174 5.4.2 Spectrum of Antimicrobial activity .................................................................... 182
5.4.2.1 Antimicrobial activity of plant extracts against bacteria ............................. 182 5.4.2.2 Antimicrobial activity of plant extract against yeasts ................................. 183 5.4.2.3 Antimicrobial activity of plant extract against fungi ................................... 184
5.5 Conclusions .............................................................................................................. 186
Chapter 6 ENHANCEMENT OF THE ANTIMICROBIAL ACTIVITY OF
SELECTED PLANT EXTRACTS BY FRACTIONATION AND MIXING ............. 187
6.1 Abstract .................................................................................................................... 188
6.2 Introduction ............................................................................................................. 189 6.3 Materials and methods ........................................................................................... 190
6.3.1 Plant materials .................................................................................................... 190 6.3.3 Plant extracts and stock solution preparation ..................................................... 190 6.3.4 Bacterial strains and inoculum preparation ........................................................ 191 6.3.5 Antimicrobial activity assays ............................................................................. 191

xvi
6.3.5.1 Growth Inhibition using micro-titer broth dilution assay (GI) .................... 191
6.3.5.2 MIC - Broth microdilution assay ................................................................. 192
6.3.6 Antioxidant assay - DPPH radical-scavenging capacity .................................... 192 6.3.7 Phyto-chemical analysis ..................................................................................... 193
6.3.7.1 Total phenolics ............................................................................................ 193 6.3.7.2 Total flavonoid assay ................................................................................... 193 6.3.7.3 Estimation of total tannin content ................................................................ 194
6.3.7.4 Determination of proanthocyanidin content ................................................ 194 6.3.7.5 Determination of alkaloid content ............................................................... 194 6.3.7.6 Terpenoids ................................................................................................... 195
6.3.8 Enhancement of antimicrobial activity of plant extracts .................................... 196 6.3.8.1 Selective solvent extraction ......................................................................... 196
6.3.8.2 Binary blends of selected extracts ............................................................... 197
6.3.8.3 Addition of plant compounds ...................................................................... 197 6.3.9 Statistical analysis .............................................................................................. 197
6.4 Results and discussion ............................................................................................ 198 6.4.1 Solvent fractionation of extracts ........................................................................ 198
6.4.1.1 Extract yields ............................................................................................... 198
6.4.1.2 Composition of solvent fractions and their antioxidant-antimicrobial
activities ................................................................................................................... 199 6.4.2 Binary blends of selected extracts ...................................................................... 203
6.4.3 Addition of plant compounds ............................................................................. 206
6.5 Conclusions .............................................................................................................. 212
GENERAL CONCLUSIONS AND PERSPECTIVES ................................................. 213
BIBLIOGRAPHIE ........................................................................................................... 218
ANNEXES ......................................................................................................................... 233
Annexe 1. Yields of extracts from plant materials (Chapter 1) ................................ 234
Annexe 2. Numerical data for figures in Chapter 6 ................................................... 238

xvii
Liste des tableaux
Table 1.1 Solvents used for active component extraction .................................................... 10
Table 1.2 Natural plant sources of some antioxidants .......................................................... 29
Table 1.3 Natural sources of polyphenol .............................................................................. 30
Table 1.4 In vitro antioxidant capacity assays ...................................................................... 38
Table 1.5 Major classes of antimicrobial compounds from plants ....................................... 52
Table 1.6 Phyto-chemical composition and bioactivities of fruit and vegetable
extracts .................................................................................................................................. 63
Table 2.1 Antimicrobial and Antioxidant activity of Climacteric fruits .............................. 78
Table 2.2 Antimicrobial and Antioxidant activity of Non-climacteric fruits ....................... 79
Table 2.3 Antimicrobial and Antioxidant activity of leaf extracts ....................................... 81
Table 2.4 Antimicrobial and antioxidant activity of root peel extracts ................................ 83
Table 3.1 Antioxidant activity of fruits and vegetables by products extracts ................... 109
Table 3.2 Elemental composition, average carbon oxidation number value of fruits
and vegetables by-products extracts ................................................................................... 120
Table 3.3 Comparison of ACON, Capacity, rate and ARP values of plant by product
(fruit and leaf) extracts (1.0 mg/mL) .................................................................................. 120
Table 4.1 Total phenolic and flavonoid contents of aqueous extracts of 36 selected
plant materials: Total phenolic content was expressed as gallic acid (GAE) and
ascorbic acid equivalent (AAE) and total flavonoid content was expressed as rutin
equivalent (RE). (±) SD ...................................................................................................... 137
Table 4.2 Free radical scavenging activity and reducing property of the aqueous
extracts obtained from selected plant materials. (±) denotes standard deviation ............... 140
Table 4.3 Free radical scavenging activity and reducing property of the aqueous
extracts obtained from selected plant materials. (±) denotes standard deviation: Ferric
reducing power assay (FRAP) and Nitric Oxide Radical Scavenging (NO) ...................... 144
Table 4.4 Ferrous ion chelating activity of aqueous extract obtained from selected
plant material. This activity was expressed as Na2EDTA equivalent and (±) means the
standard deviation ............................................................................................................... 149
Table 5.1 Antimicrobial growth kinetic parameters against E.coli for plant extracts at
the concentration of 10 mg/mL .......................................................................................... 170
Table 5.2 Comparison of antimicrobial activity (AMI) against E.coli of plant extracts
(10 mg/mL) determined by agar gel diffusion assay (Zone of inhibition, ZI), Micro-
titer broth dilution (antimicrobial capacity), Broth microdilution assay (MIC) ................. 176
Table 5.3 Growth inhibition of bacteria by plant extracts at 10.0 mg/mL (Growth
inhibition ± SD) .................................................................................................................. 182
xviii
Table 5.4 Zone of inhibition (mm) of bacterial growth by well-diffusion assay at 5.0
mg/mL ................................................................................................................................ 183
Table 5.5 Inhibitory activity of selected plant extracts on the growth inhibition of
yeasts at 10.0 mg/mL .......................................................................................................... 184
Table 5.6 Inhibitory activity of selected plant extracts on the growth inhibition of
fungi (%) at 10.0 mg/mL .................................................................................................... 184
Table 6.1 Solubility parameter of the solvent systems ....................................................... 196
Table 6.2 The MIC against E.coli of 12 selected plant extracts and 10 plant products ..... 206
Table 6.3 The GI (%) against E.coli of mixture of 12 plant extracts with added plant
products at total concentration of 5.0 mg/mL .................................................................... 208
Table 6.4 The GI (%) against E. coli of mixtures of plant extracts and 5 plant
compounds at the proportion of plant extract 97.5%, (v/v). ............................................... 209

xix
Liste des figures
Figure 1.1 Overview of plant primary and secondary metabolism ...................................... 15
Figure 1.2 Biosynthetic relationships of major groups of secondary metabolites ............... 17
Figure 1.3 Biosynthetic of terpenes: Mevalonic acid pathway ............................................ 18
Figure 1.4 Biosynthetic phenolic compounds: Shikimate + Malonate pathway .................. 19
Figure 1.5 Balance between antioxidant (AO) and reactive oxygen species (ROS) in
plants ..................................................................................................................................... 34
Figure 1.6 ROS and antioxidant defense mechanisms ......................................................... 34
Figure 1.7 (a) catechol moiety of the B-ring, (b) 2,3-double bond in conjugation with
a 4-oxofunction of a carbonyl group in the C-ring and (c) presence of hydroxyl
groups at the 3 and 5 positions ............................................................................................. 35
Figure 1.8 Intra-molecular hydrogen bonding of ortho substituted phenols ........................ 36
Figure 1.9 Radical trapping mechanism of phenolic antioxidants ....................................... 36
Figure 1.10 Radical trapping mechanism of carotenoids ..................................................... 36
Figure 1.11 Reduction of ABTS+ radical by Trolox (H-donor)........................................... 39
Figure 1.12 Protonation of DPPH (violet) to most stable DPPH-H form (light yellow
color) ..................................................................................................................................... 40
Figure 1.13 Mechanism of Ferric Reduction ........................................................................ 40
Figure 1.14 Reduction of Titanium compound by H2O2 ...................................................... 41
Figure 1.15 Superoxide anion radical generation by PMS-NADH system .......................... 42
Figure 1.16 Formation of azo dye ........................................................................................ 43
Figure 1.17 Mechanism of metal chelation by ferrozine ...................................................... 45
Figure 1.18 Mechanisms of action of antimicrobial agents. PABA, paraminobenzoic
acid; DHFA, dihydrofolic acid; THFA, tetrahydrofolic acid ............................................... 54
Figure 1.19 Mechanisms of bacterial resistance to antimicrobials ....................................... 57
Figure 2.1 A comparison of sensitivity of E.coli and B.subtilis against 164 plant
extracts .................................................................................................................................. 75
Figure 2.2 Effect of physiological type of fruits on the growth inhibition of B.subtilis ..... 77
Figure 2.3 Effect of physiological type of fruits on the growth inhibition of E.coli ........... 77
Figure 2.4 Effect of the plant tissue type on the growth inhibition of E. coli ...................... 77
Figure 2.5 Effect of the plant tissue type on the growth inhibition of B. subtilis ................ 77
Figure 2.6 Effect of ripening process of fruit on DPPH radical scavenging capacity .......... 85
Figure 2.7 Effect of plan part origin of sample on DPPH radical scavenging capacity ....... 85

xx
Figure 2.8 Correlation between, the pH, growth inhibitory activity (GI) against E.coli
and B.subtilis and DPPH radical scavenging capacity of the extracts. ................................ 85
Figure 3.1 Time course of DPPH• scavenging by selected extracts ................................... 107
Figure 3.2 Relation between rate of radical scavenging and capacity of the radical
scavenging capacity of plant extracts ................................................................................. 115
Figure 3.3 Relation between ARP and radical scavenging capacity of plant extracts ....... 118
Figure 3.4 Correlations between pH, rate, capacity and ARP ............................................ 119
Figure 3.5 Relationship between ACON and capacity of selected plant extracts .............. 121
Figure 3.6 Relationship between ACON and rate of selected plant extracts ..................... 121
Figure 3.7 Relationship between ARP and ACON of selected plant extracts .................... 121
Figure 4.1 Correlation between Trolox equivalent antioxidant capacity and DPPH
free radical scavenging activity .......................................................................................... 141
Figure 4.2 Correlation between Trolox equivalent antioxidant capacity (TEAC),
DPPH and total phenolic content (TPC)............................................................................. 142
Figure 4.3 Relationship between redox (potentiometric) and FRAP analysis ................... 145
Figure 4.4 Relationship between TEAC and FRAP values of plant extracts ..................... 146
Figure 4.5 Correlation between Total polyphenol content (TPC), Total flavonoid
content (TFC), DPPH, TEAC, Hydroxyl radical (HR), Superoxide anion (SOA),
Hydrogen peroxide (HP) and Nitric oxide (NO) ................................................................ 151
Figure 4.6 Multi correlation between Total polyphenol content (TPC), Total
flavonoid content (TFC), DPPH, TEAC, Hydroxyl radical (HR), Superoxide anion
(SOA), Hydrogen peroxide (HP) and Nitric oxide (NO) ................................................... 152
Figure 5.1 Growth curve of E. coli in Nutrient broth at 37oC temperature during 24 h
period .................................................................................................................................. 168
Figure 5.2 Linear representation of growth curves of E. coli according to equation (9).
A: Control; B: Nutrient broth containing pomegranate extract at 10 mg/mL
concentration ...................................................................................................................... 169
Figure 5.3 Relationship between interaction constants log Ka and log K of plant
extracts ................................................................................................................................ 171
Figure 5.4 Antimicrobial activity of plant extracts: correlation loading of
antimicrobial evaluation methods by PCA ......................................................................... 179
Figure 5.5 Antimicrobial activity of plant extracts: scatter plot of antimicrobial
activity of plant extracts by PCA. The number corresponds to the product as listed in
Table 5.1 and 5.2. ............................................................................................................... 179
Figure 5.6 Multi-correlation between different methods for assay of antimicrobial
activity ................................................................................................................................ 181
Figure 6.1 Yield of solvent extracts of pomegranate, black currant residue and betel
leaf ...................................................................................................................................... 198

xxi
Figure 6.2 Composition of solvent fractions of pomegranate and their antimicrobial
activity against E. coli and anti-radical activity by DPPH assay........................................ 201
Figure 6.3 Composition of solvent fractions of black currant residue and their
antimicrobial activity against E. coli and anti-radical capacity by DPPH assay ................ 201
Figure 6.4 Composition of solvent fractions of betel leaf and their antimicrobial
activity against E. coli and anti-radical activity by DPPH assay........................................ 202
Figure 6.5 Antibacterial activity of blends of plant extracts in varying proportions.......... 203
Figure 6.6 Antibacterial activity of blends of plant extracts in varying proportions
against B.subtilis at total concentration of 5.0 mg/mL ...................................................... 205
Figure 6.7 Antibacterial activity (MIC) against E.coli at varying compositions of
plant extract – plant compound mixtures ........................................................................... 210
xxii
Liste des abréviations et des sigles
AAE: Ascorbic Acid Equivalent
ABTS: 2,2-azinobis 3-ethylbenzothiazoline-6-sulphonic acid
ACAC: acetone: acetonitrile (solvent)
ACON: Average Carbon Oxidation Number
ACS: acridone synthase
AM: antimicrobial
AMI: Antimicrobial Index
ANOVA: Analysis of Variance
AOA: Antioxidant Activity
APX: ascorbate peroxidase
ARP: anti-radical power
ASH: ascorbic acid
ATCC: American Type Culture Collection
ATP: adenosine triphosphate
BHA: butylated hydroxyanisole
BHT: butylated hydroxytoluene
BPS: benzophenone synthase
BS: Bacillus subtilis
CAT: catalase
CE: catechol equivalent
CFU: colony-forming unit
CHS chalcone synthase
CLSI: Clinical and Laboratory Standards Institute
CTAS: coumaroyl triacetic acid synthase
DHAR: dehydroascorbate reductase
DHFA: dihydrofolic acid
DMAPP: dimethylallyl pyrophosphate
DNA: deoxyribonucleic acid
DPPH: 2,2-diphenyl-1-picrylhydrazyl
DR: Dragendorff’s Reagent
EC: Escherichia coli
EC50: effective concentration of a drug that gives half-maximal response
EO: Essential oils
ET: electron transfer
EUCAST: European Committee on Antimicrobial Susceptibility Testing
FCR: Folin Ciocalteu reagent
FRAP: Ferric ion Reducing Power
FW: Fresh weight
GAE: Gallic Acid Equivalent
GI: Growth Inhibitory Activity
GOPX: guaicol peroxidase
GPX: glutathione peroxidase
GR: glutathione reductase
GSH: glutathione
GSH: glutathione peroxidase

xxiii
GSSG: glutathione disulfide
GST: glutathione-S- transferase
H2O: water
HAT: hydrogen atom transfer
HEEA: hexane: ethyl acetate (solvent)
HEX: Hexane (solvent)
HFA: tetrahydrofolic acid
HH2O hot water
HIV: human immunodeficiency virus
HMG-CoA: 3-hydroxy-3-methyl-glutaryl-coenzyme A reductase
HPLC: High Performance Liquid Chromatography
HSD: honest significant difference
iNOS: inducible nitric oxide synthase
IOU: inhibits oxygen uptake
IPP: isopentenyl diphosphate
LDL: Low-density lipoprotein
MBC: minimum bactericidal concentration
MDHAR: monodehydroascorbate reductase
MDR: multidrug-resistance
MEET: methanol: ethanol (solvent)
MEH2O: methanol 80 (v): water 20 (v) (solvent)
MEP: 2-Methyl-D-erythritol-4-phosphat pathway
MHB: Mueller-Hinton Broth
MIC: Minimum inhibitory concentration
MPO myeloperoxidase
Na2EDTA: sodium ethylene diamine tetra acetate
NADH: nicotinamide adenine dinucleotide
NADPH: Nicotinamide adenine dinucleotide phosphate
NAO: natural antioxidant
NBT: nitroblue tetrazolium
NBT: nitro-blue tetrazolium
NCCLS: National Committee for Clinical Laboratory Standards
ND: not detected
NO: nitric oxide
OD: optical density
OH: hydroxyl
ONOO−: peroxynitrite
ORAC: oxygen radical absorbance capacity
PA: proanthocyanidin
PABA: paraminobenzoic acid
PAL: phenylalanine ammonia lyase
PBS: phosphate buffered saline
PCA: Principal Component Analysis
PG: propyl gallate
PKS: Polyketide synthases
PMS: phenazine methosulfate
RE: rutin equivalent

xxiv
RNS: reactive nitrogen species
ROS: Reactive Oxygen Species
SD: standard deviation
SOA: superoxide anion
SOD: superoxide dismutase
STS: stilbene synthase
TBHQ: tert-butyl hydroquinone
TBHQ: tertiary-butyl-hydroquinone
TEAC: Trolox equivalent antioxidant capacity
TFC: total flavonoid contents
TPC: total phenolic content
TRAP: total radical trapping antioxidant parameter
UV: Ultraviolet
ZI: Zone of Inhibition
xxv
Dévouement
Je tiens à exprimer mes plus profonds regrets au décès du Professeur Khaled Belkacemi. Il
a été une des victimes de l’attentat du 29 janvier 2017 au Centre culturel islamique de
Québec, une semaine après avoir siégé au comité de jury de la soutenance de cette thèse.
Nous nous souviendrons toujours de Dr. Belkacemi comme d’un grand professeur très
passionné, cultivé, dévoué, compétent et aimé de ses collègues et de ses étudiants.

xxvi
Remerciements
Je tiens tout d’abord à remercier mon directeur de recherche professeur Joseph Arul qui
m’a accueilli au sein de son laboratoire et m’a offert un projet si intéressant ainsi qu’un
inestimable appui scientifique et moral. La première leçon que tu m’as donnée est
inoubliable, "Attitude et Aptitude font Altitude". Cela m’a guidé tout au long de mes
études. Merci Joseph pour ta confiance en moi, tes encouragements, et tes conseils à toutes
les rencontres, merci aussi pour ton aide financière. Je voudrais remercie aussi professeur
Paul Angers, mon co-directeur de recherche, de m’avoir accepté de travailler dans son
laboratoire et utiliser ses équipements, merci pour sa gentillesse et ses encouragements. Je
remercie également professeur Khaled Belkacemi, du département des sols et de génie
agroalimentaire, d’avoir fait la pré-lecture de cette thèse. Je tiens à merci aussi professeur Jean-
Christophe Vuillemard, Dr. Wilhelmina Kalt (cherceure, Agricuture et agroalimentaire Canada,
Kentville, Nouvelle-Écosse) d’avoir accepté d’être membre de commité de jury. Vos
commentaires ont vraiment contribué à la qualité de cette thèse. Un remerciement particulier
est également adressé au PCBF-ACDI de m'avoir accordé une bourse d'études de 5 ans.
J'aimerais également remercier Ronan Corcuff, pour son support technique dont j’ai pu
bénéficier tout au long de mes études. Merci pour sa grande disponibilité et
particulièrement pour sa rigueur au labo qui ont contribué aussi à la qualité de tous mes
résultats. Un gros merci aussi à Diane Gagnon, Pascal Dubé, Anne-Françoise Allain,
Catherine Viel, Marie Michèlle Gagnon, Benoit Fernandez, pour leur supporte technique,
leur gentillesse, leurs conseils.
J’ai eu la chance de travailler dans une excellente équipe. Merci pour mes collègues Arturo,
Fayaz, Navina, Likun, Maria, Mialy, Tom Richard, Marine Dubois, et mention spéciale
pour Mayank Pathak, Deepak Kumar Jha et Denis Dallie pour leurs participations dans mes
travaux de thèse et pour leurs connaissances et encouragements. Un merci particulier à
Thang et Vinh pour leur amitié.
Un remerciement spécial à mes parents, ma sœur Huyen, ma femme Khuong et mes enfants
Han et Phong, pour leurs soutiens lors des moments difficiles et leur amour, leur
compréhension de même que pour n'avoir jamais cessé de croire en moi.

1
GENERAL INTRODUCTION

2
Agricultural industry produces billions of tons of residues in non-edible portions derived
from the cultivation and processing of a particular crop. Waste and by-products cause
pollution, management and economic problems worldwide (Santana-Méridas et al., 2012).
These residues of fruits and vegetables may be an abundant source of bioactive
compounds. There is a growing realization and interest in the development of different
strategies to use agricultural and industrial residues as a source of high value-added
products (Santana-Méridas et al., 2012). Vegetables and some fruits yield between 25%
and 75% of non-edible by-products as wastes (e.g., apple, 30 %; pineapple, 45 %; and
citrus fruits, 70 %) (Van Dyk et al., 2013), after processing of fruits and vegetables in the
food processing industry; and they contain a large amount of bioactive compounds such as
polyphenols. The most abundant by-products of minimally processed fresh fruit and
vegetable products are fruit peels and seeds which have been reported to contain high
amounts of phenolic compounds with antioxidant and antimicrobial properties
(Balasundram et al., 2006). The antimicrobial activities of a variety of naturally occurring
phenolic compounds from different plant sources have been studied in detail (Cueva et al.,
2010b; Daglia, 2012b; Quideau et al., 2011). Phenolic compounds play an important role in
the protection of crops against pathogenic agents by damaging microbial cell membrane
and causing lysis of the cells. Phenolic compounds from spices such as gingerone,
zingerone, and capsaicin have been found to inhibit the germination of bacterial spores
(Burt, 2004). Polyphenols from green tea have also been explored for their broad spectrum
activity against pathogens (Taylor et al., 2005). In addition, flavonoids, when used in
conjunction, have been reported to enhance the antibacterial, antiviral, and anticancer
activities of compounds such as naringenin, acycloguanosine, and tamoxifen (Ayala-
Zavala et al., 2010).
Antioxidants play a significant role in protecting the body from damage caused by free
radical- induced oxidative stress (Ozsoy et al., 2008). Natural anti-oxidants, like
polyphenols, found in medicinal and edible plants, are very effective in preventing
oxidative damages (Silva et al., 2005). It is desirable to establish and standardize
antioxidant assay methods that can measure the real antioxidant power directly for all
classes of anti-oxidants, irrespective of their origin, either plant extracts or biological
fluids. Free radicals play a very important role in the oxidative damage of biological

3
systems (McCord, 2000; Scalbert et al., 2005). Plant extracts are complex mixture of
compounds, where phytochemicals may function in synergism or antagonism with each
other, and they may exhibit ‘Broad spectrum antioxidant activity’ against various radicals
of importance in biology.
Plants have been a focus of attention for a longtime as source of antimicrobial compounds
and it has been reported that two-thirds of the world’s plant species have medicinal value
(Craig, 1999; Krishnaiah et al., 2011). In recent years, there has been an increasing interest
in antimicrobial properties of medicinal plants, and enormous attention is being paid in the
discovery of new antimicrobial from natural sources. (Brown et al., 2014; Khanam et al.,
2015), as multi-drug resistances of microbes are becoming a concern that can have
considerable impact on public health with potential treatment failures (Balouiri et al.,
2016). However, the research on antimicrobial compounds from plant sources has yet to see
a systematic approach with respect to screening for possible candidates active against
microbial pathogens, yeasts and fungi (Aqil and Ahmad, 2003). Furthermore, the screening
processes, as of now, do not necessarily take into account of the morphological (Gram-
positive or negative) or growth requirement (aerobe or anaerobe) characteristics of the
bacteria. It is expected that testing of selected plant extracts against wide variety of test
microorganisms will be helpful in developing plant extract formulations exhibiting broad
spectrum antimicrobial activity as well as new antimicrobial substances.
Several bioassays are used to determine the activity of antimicrobial substances, such as the
well-known and commonly used disk diffusion or well diffusion and broth or agar dilution
(Balouiri et al., 2016). These methods can be qualitative and quantitative in nature. A
qualitative test such as the Kirby-Bauer disk diffusion method helps screening candidate
antimicrobial compounds, whereas quantitative methods (such as MIC, growth inhibition)s,
also known as end point methods, help quantify the potency of the compound. Absorbance
readings can help monitor lag phase, growth rate, and maximum population in real time and
ascertain the effectiveness of an antimicrobial agent. Although, only the maximum growth
is typically noted to determine the effect of environmental conditions from these assays,
other parameters such as the lag time and growth rate reflecting bacterial growth through its
life cycle can help to understand bacteria-environment interactions and build bacterial

4
growth prediction models for use in food and fermentation microbiology. Mathematical
modeling can be important to incorporate a few parameters, or very useful to help advance
the understanding a wide variety of intrinsic and extrinsic factors governing microbial
growth.
Many studies have shown that naturally derived compounds and natural products may have
applications in controlling pathogens in foods (Lucera et al., 2012; Negi, 2012). However,
the use of natural antimicrobials is limited due to the fact that they are of low potency, and
it requires high concentrations, which can affect the organoleptic properties of foods
(Davidson et al., 2013; Lucera et al., 2012). However, enhancing the antimicrobial activity
of plant extracts to increase their potency could enable their use as antimicrobial agents in
foods at low levels without affecting the sensory properties of foods. Three approachs for
enhancement used in this study were extraction using selective solvents (Miyasaki et al.,
2013), binary blending of extracts and addition of plant products that may potentiate the
activity of the extracts (Worthington and Melander, 2013).
The objective of this work was to conduct studies to evaluate the potential of extracts
obtained from various fruit and vegetable by-products and to develop antioxidant-
antimicrobials for use as food preservation agents, as alternatives to synthetic agents. The
thesis is organized in six chapters starting with a review on plant by-products, plant
secondary metabolites, and antioxidants and antimicrobials from plant sources (chapter 1).
The identification of promising antioxidant-antimicrobial extracts from fruits and vegetable
by-products, generated during harvesting or processing is described in chapter 2. The
chapter 3 introduces a new measure to characterize the antioxidant property of plant
extracts from DPPH assay, the anti-radical power (ARP). The spectrum of anti-radical
activity of selected fruit and vegetable extracts is reported in chapter 4. The chapter 5
depicts the characterization of antimicrobial activity of selected plant extracts by a new
measure, the antimicrobial activity index (AMI) and the evaluation of the spectrum of their
antimicrobial activity. Finally, chapter 6 describes the work that explored ways to enhance
the antimicrobial activity of selected antioxidant-antimicrobial extracts.

5
Chapter 1 REVUE DE LITERATURE
Cette partie de revue bibliographique porte sur des sous-produits de plantes, les méthodes
d’extraction des composés bioactifs, les métabolites secondaires, les antioxydants et les
antimicrobiens. Ce chapitre se termine par la présentation de la problématique, de
l’hypothèse de recherche, du but et des objectifs spécifiques de cette étude.

6
1.1 Plant by-products: eco-friendly source of novel bioactive compounds
Avant propos
The following is a description of some of the terminologies often used in both business and
scientific literature to describe product sources. They include: by-products, co-products,
secondary products, intermediate products and sub-products We will use the definitions of
the Waste Framework Directive (EuropeanUnion, 2006) as follows:
Waste: A material that the holder discards, and indended or is required to discard.
Production residue: A material that is not deliberately produced in a production process
that may or may not be a waste.
By-product: A production residue that can be used directly without any additional
processing, other than normal industrial practice.
There are two main categories of agricultural residues: crop residues (generated in the
farm) and agro-industrial residues (generated during post-harvest process).
Crop residues (primary biomass residues) are non-edible plant parts that are left in the field
or orchard after the main crop part has been harvested. These residues, which mainly
include straw, stove, stubble, stalks, sticks, leaves, haulms, roots, branches, twigs, brushes,
trimmings and pruning, are produced from sources including seeds, fruits, nuts, vegetables
and energy crops.
Agro-industrial residues (secondary biomass residues) are those materials from the
processing of the crop into a main resource product, including residues from wood and food
processing industries in the form of husks, hulls, peels, dust, straws, bagasse, sawdust,
corncobs, pomace, etc. In addition, the remaining residues after the use of processed
materials may be considered as a tertiary biomass (UNIDO, 2007).

7
1.1.1 Why plant by-products?
The generation of food waste occurs all through the food life cycle; from agriculture,
industrial food processing and manufacturing, retail and up to household consumption. In
developed countries, 42% of food waste is produced by households, while 39% losses
occur in the food processing industry, 14% in food service sector, and the remaining 5% at
the retail and distribution level (Mirabella et al., 2014).
Agricultural industry produces billions of tons of residues in non-edible portions derived
from cultivation and processing of a particular crop. Waste and by-products can cause
pollution, management and economic problems worldwide (Santana-Méridas et al., 2012).
These residues of fruits and vegetables may be an abundant source of bioactive compounds.
This is the reason for the development of different strategies to use agricultural and
industrial residues as a source of high value-added products (Santana-Méridas et al., 2012).
Because the consumers are more and more discouraged by the presence synthetic additives
in foods they consume, food industry is increasingly paying attention to obtain functional
ingredients from natural sources. This is particularly true for phenolic compounds, which in
contrast to certain ingredients such as carotenoids and vitamins, are not chemically
synthesized and need to be extracted from plant materials. The exploitation of by-products
of fruit and vegetable processing as a source of functional compounds and their application
in food is a promising field which requires interdisciplinary research of food technologists,
food chemists, nutritionists and toxicologists (A. Schieber, 2001).
Amongst the fruits, vegetables and herbals, agricultural and industrial residues are also
sources of natural antioxidants (Moure et al., 2001). Special attention is being paid to their
extraction from inexpensive or residual sources from agricultural industries. By-products,
remaining after processing of fruits and vegetables in the food processing industry, still
contain a considerable quantity of phenolic compounds (Cowan, 1999). Some studies have
already been done on by-products, which could be potential sources of antioxidants.
Recycling of the by-products has been supported by the fact that polyphenols have been
located specifically in the peels (Moure et al., 2001). One of the richest sources of

8
polyphenols are grape berry skins, which during wine and juice making remain as residue
are usually converted into compost (Lapornik et al., 2005). The olive mill wastes are also a
major potential source of phenolic compounds. The phenolic content of the olive mill waste
water is reported to fluctuate between 1.0 % and 1.8 % (Visioli and Galli, 2001), depending
on varietal factors and processing effects. Besides olive mill waste water, olive leaves are
another by-product of the olive industry that has been explored as a source of phenolics
(Lee and Lee, 2009). Besides having a strong antioxidant activity, polyphenols often also
exhibit antimicrobial activity (Agourram et al., 2013).
1.1.2 Source, provider and type of by-products
The food processing industry would be the ideal source of such wastes. Residue from juice
production, waste from canning factory, harvest, minor crops and other agricultural and
processed food by-products would be ideal candidates (Peschel et al., 2006).
The number of studies devoted to exploit residual sources for bioactive compounds has
increased considerably, which is driven not only to add value to the by-products, but also to
improve recycling of the wastes for sustainable development of the agro- and food industry.
Such studies have contributed to the knowledge base regarding specific locations of active
compounds and their modifications during processing. Although numerous studies have
been carried out on this subject, only a few by-product derived antioxidants have been
developed successfully from the vast quantities of plant residues produced by the food
processing industry. Various examples of such successes include the work done in Europe,
primarily on grape seed and olive waste extracts (Alonso et al., 2002; Amro et al., 2002).
Potential crop candidates with a high annual production and already confirmed high
antioxidant potential include apple (DuPont et al., 2002), tomato (Lavelli et al., 2000), and
artichoke (Jimenez-Escrig et al., 2003).
The peels of several other fruits also contain higher amounts of phenolic compounds than
the edible fleshy parts. Apple peels contain up 3.3 % in comparison to apple pomace, which
yields 11.8 % of phenolic compounds (Schieber et al., 2003). The peels and seeds of
tomatoes have also been reported to be richer sources of phenolic compounds in
comparison to their fleshy pulp (George et al., 2004). Louli et al (2004) investigated the

9
effect of various process parameters such as solvent type and feed pre-treatment (crushing,
removal of stems) on the efficiency of the extraction of phenolic antioxidants from grape
residue; whereas Negro et al (2003) investigated the content of total polyphenols and
antioxidant activity of grape residue extracts (Louli et al., 2004; Negro et al., 2003).
The citrus industry produces large quantities of peel and seed residues, which may account
for up to 50% of the total fruit weight (Bocco et al., 1998). Citrus industry by-products, if
utilized optimally, could be a major source of terpenes and phenolic compounds,
particularly flavonoids, as the peels are known to contain higher amounts of total phenolics
compared to the edible portions (Balasundram et al., 2006). Likewise, by-products obtained
after the processing of artichoke, cauliflower, carrot, celery and onion have also been
reported (Larrosa et al., 2002).
Although the antioxidant potential of less small volume crops such as strawberry
(Kahkonen et al., 2001), pear (Imeh and Khokhar, 2002), red beet root (Kujala et al., 2001),
or broccoli (Kurilich et al., 2002) is known, little information is available in the literature
with regards to practical means of obtaining bio-active substances from by-products as
well as their utilization in foods. This might be caused by three limiting factors often
overlooked in scientific studies: the effectiveness of recovery and extraction, the
marketability of resulting extracts and the practical suitability for the food, cosmetic or
pharmaceutical products.
1.1.3 Methods of extraction of bioactive compounds from plant
Extraction of bioactive compound from plant is the separation of active portions of plant
tissues using selective solvents. During extraction, solvents diffuse into the solid plant
material and solubilize compounds with similar polarity. The products so obtained from
plants are relatively complex mixtures of metabolites such as alkaloids, glycosides,
terpenoids, flavonoids and lignans (Joana Gil-Chávez et al., 2013).
The commonly used methods of extraction of plant are the conventional liquid–liquid or
solid–liquid extraction and the advanced include pressurized-liquid extraction, subcritical
and supercritical extractions, and microwave- and ultrasound-assisted extractions. In

10
addition, these extraction techniques have been improved with preparative treatment steps
(enzyme-and instant controlled pressure drop-assisted extractions), which help to release
the compounds from the matrix. These technologies could provide in the next few years an
innovative approach to increase the production of specific compounds, particularly
flavonoids, for use as nutraceuticals as ingredients in the design of functional foods (Joana
Gil-Chávez et al., 2013).
Table 1.1 Solvents used for active component extraction
Water Ethanol Methanol Ether Acetone Chloroform
Anthocyanins Tannins Anthocyanins Alkaloids Phenol Terpenoids
Starches Polyphenols Terpenoids Terpenoids Flavonols Flavonoids
Tannins Polyacetylenes Saponins Coumarins
Saponins Flavonol Tannins Fatty acids
Terpenoids Terpenoids Xanthoxyllines
Polypeptides Sterols Totarol
Lectins Alkaloids Quassinoids
Lactones
Flavones
Phenones
Polyphenols
(Cowan, 1999)
Table 1.1 summarizes the use of different solvents for extraction of various bioactive
compounds. Solvent is selected for its capacity for the species being separated into it, i.e.,
the solubility of the targeted compounds in that solvent. The solvent should also be
selective, extracting primarily one or more of the related class of compounds from the solid
matrix. Thus, polar solvents are more appropriate for polar components, and non-polar
solvents for non-polar components. Some times, a solvent mixture may be used to obtain
properties that cannot be achieved with a single solvent. For laboratory preparations, hot
water, hexane, ethyl acetate, chloroform, dichloromethane, ether, acetone and alcohols
(ethanol and methanol) are frequently used solvent mixtures offering a range of polarity.
Hot water is a universal solvent, and it is used frequently to extract phyto-compounds.
Acetone dissolves many hydrophilic and lipophilic components, and is volatile and
miscible with water, and has a low toxicity for use in the bioassay of extracts. Acetone is
used for extraction phenolic compounds from plant extracts. Alcohols are effective in the

11
degradation of cell walls, and seed coats that have non-polar character, and facilitate the
release of substances from the cells. The frequently used alcohols are ethanol and methanol.
Ethanol can permeate through the cellular membrane and facilitates the extraction of intra-
cellular components from plant materials. Higher recoveries of bioactive flavonoids can be
achieved with aqueous ethanol (70%, v/v) due to the higher polarity of the mixture than
pure ethanol (Khoddami et al., 2013). While methanol is more polar than ethanol, it is
often a suitable solvent for extraction of components of higher polarity such as
polyphenols. Since most of the antimicrobial compounds isolated from plant sources
possess relatively more non-polar character (aromatic or unsaturated organic compounds),
they are initially extracted using either ethanol or methanol and purified subsequently.
Although tannins can be modestly extracted by aqueous medium, they are efficiently
extracted by less polar solvents. Ether is commonly used selectively for the extraction of
coumarins and non-polar lipids. Terpenoids are generally extracted with more non-polar
solvents such as dichloromethane and ethyl acetate, when the former is more selective
towards terpenoids. Terpenoid lactones have been obtained by successive extractions of
dried barks with hexane, followed by solvent mixture (chloroform-methanol) with higher
bioactivity concentrating in chloroform-methanol fraction (Cowan, 1999).
1.1.4 Trend and challenges in using plant by-products
Recently, polyphenolic content was also examined in some plant by-products, which are
available in large quantities and at low cost, but are currently used only as animal feed or
fertilizer. Their use as food additives could help industries to solve the environmental
problems related to the disposal of these materials, and provide new sources of natural
antioxidants.
The future of food processing in a sustainable way should warrant not only minimize
wastes from processing, but also would require value-addition to the waste streams. An
integrated system should also incorporate nutrional, health-functional and food safety
characteristics of the foods and by-products. The food processes need optimization to
minimize the amounts of waste generation, and focus on complete utilization of by-
products resulting from large-scale processing at affordable costs. There is a need for
specific analytical methods for the characterization and quantification of organic

12
micronutrients and other functional compounds. The bioactivity, bioavailability and of
phytochemicals need to be carefully assessed by in vitro and in vivo studies. In addition,
there is also a need to eliminate natural and anthropogenic toxins such as solanin, patulin,
ochratoxin, dioxins and polycyclic aromatic hydrocarbons need by efficient quality control
systems.
The ‘activity’ of many phytochemicals has only been tested in in vitro models, and this may
bear no relationship to the situation in vivo. Undoubtedly, functional foods represent an
important, innovative and rapidly growing part of the overall food market. However, their
design, i.e. their complex matrix and their composition of bioactive principles, requires
careful assessment of potential risks which might arise from isolated compounds recovered
from by-products. Furthermore, investigations on stability and interactions of
phytochemicals with other food ingredients during processing and storage need to be
initiated. Since functional foods are on the boundary between foods and drugs, their
regulation still proves to be difficult. In any case, consumer protection must take priority
over economic interests, and health claims need to be substantiated by standardized,
scientifically sound and reliable studies (A. Schieber, 2001).

13
1.2 Plant secondary metabolites
1.2.1 Primary and secondary metabolites
Given that plants are sessile and cannot flee in inimical situations, they must have ways to
adapt themselves to both favourable and unfavourable changes in their environment. In
order to defend themselves, plants have evolved many strategies for survival, including the
capability to produce over 200,000 highly varied and diverse assortment of specialized low
molecular weight organic compounds that are collectively termed as secondary metabolites,
secondary products, or natural products. The synthesis and storage of secondary
metabolites can be regarded as a strategy of plants for defense and communication (Dixon,
2001; Wink, 2013). Even though secondary metabolites do not play a direct role in growth
and development of plants, they play a role in plant protection and signalling, and they
exhibit a wide range of medicinal, pharmacological properties in humans that make them
valuable. Numerous epidemiological studies indicate that an increase in the consumption of
fruits and vegetables is associated with a decrease in the incidence of cancer, cardiovascular
disease, osteoporosis and diabetes (Kris-Etherton et al., 2002; Temple and Kaiser Gladwin,
2003). Interestingly, some of the secondary metabolites such as flavonoids, polyacetylenes,
stilbenes, glucosinolates and others exhibit both antimicrobial and health-promoting
properties.
Phenolic and polyphenolic compounds, characterized by an aromatic or phenolic ring
structure, include flavonoids, phenolic acids, and lignans. Phenolic compounds are feeding
deterrents for many insects and other animals; high concentrations of phenolic compounds
are often associated with increased resistance to fungal plant pathogens (Nicholson and
Hammerschmidt, 1992). Some phenolic compounds determine the color and smell of
plants, attracting pollinators. Phenolic compounds also play a role in cold acclimation and
protection against UV radiation. In plant cells, most phenolic compounds are coupled to
sugars, thereby reducing the concentration of free phenolic compounds, and likely reducing
their endogenous toxicity.
Plant secondary metabolites are not mere randomly produced compounds, but ones that
have been shaped and optimized during evolution. It is not surprising that many of them are
14
used as pharmaceuticals, spices, fragrances, pesticides, poisons, hallucinogens, stimulants,
or colors. Many of the compounds also are used as medicinal, pharmaceutical and industrial
chemical precursors, pesticides, flavorings, perfumery ingredients, plant hormones, and
drugs of abuse. Some still play exotic roles in some cultures as arrow poisons, pesticides,
and hallucinogens (Seigler, 1998).
1.2.2 Plant secondary metabolism
Plants synthesize a vast range of organic compounds that are traditionally classified as
primary and secondary metabolites, although the precise boundaries between the two
groups can, in some instances, be somewhat blurred (Figure 1.1). Primary metabolites are
compounds that have essential roles associated with photosynthesis, respiration, growth and
development. They include phytosterols, acyl lipids, nucleotides, amino acids and organic
acids. Other phytochemicals, the secondary metabolites, many of which accumulate in
surprisingly high concentrations in some species, and they can be species or strain specific,
with genetic and environmental factors playing influence in their production (Sato, 2003;
Seigler, 1998).
Phytochemical investigations have revealed a high structural diversity of plant secondary
metabolites, comprising more than alkaloids, non-protein amino acids, cyanogenic
glucosides and glucosinolates, terpenoids, polyphenols, polyacetylenes and fatty acids,
polyketides, and carbohydrates (Harborne, 1993; Kretzschmann, 1981). The synthesis and
storage of secondary metabolites can be regarded as a strategy of plants for defense and
communication. Plants being devoid of motility and immune system, have elaborated
alternative defense strategies, involving the huge variety of secondary metabolites as tools
to overcome stress constraints, adapt to the changing environment and survive. The large
complexity of chemical types and and their interactions underly various protective
functions they perform: structure stabilizing compounds, produced by polymerization and
condensation of phenols and quinones or by electrostatic interactions of polyamines with
negatively charged loci in cell components; photo-protective compounds, related to
absorbance of visible light and UV radiation characterized by the presence of conjugated

15
(Seigler, 1998)
Figure 1.1 Overview of plant primary and secondary metabolism
double bonds; antioxidant and antiradical compounds, governed by the availability of –OH,
–NH2 , and –SH groupings, as well as aromatic nuclei and unsaturated aliphatic chains; and
signal transducing molecules (Edreva et al., 2008).
High concentrations of secondary metabolites might result in more resistant plant but such
continuous production is thought to be costly in terms of resource and energy usage causing
a burden on the plant that reduces its growth and reproduction (Siemens et al., 2002).
Therefore, plant defense metabolites can be divided into constitutive substances, also called
prohibitins or phytoanticipins and induced metabolites formed in response to an infection

16
involving de novo enzyme synthesis, known as phytoalexins (Grayer, 1994).
Phytoanticipins involve high energy and carbon consumption and exhibit fitness cost under
natural conditions (Mauricio, 1998), but recognized as the first line of chemical defense
that potential pathogens have to overcome. In contrast, phytoalexin production may take
two or three days, since the enzyme system needs to be synthesized first (Grayer and
Harborne, 1994). There are various other modes of defense include the construction of
polymeric barriers to pathogen penetration and the synthesis of enzymes that degrade
pathogen cell wall (Hammond-Kosack). In addition, plants employ specific recognition and
signaling systems enabling the rapid detection of pathogen invasion and initiation of
vigorous defensive responses (Schaller and Ryan, 1996). Some plants are primed upon
infection and develop defense responses, secondary compounds and proteins, quickly to
ward off subsequent microbial attacks (Putnam, 1983).
1.2.3 Biosynthesis of secondary metabolites
Secondary metabolites are synthesized from intermediate metabolites of primary
metabolism and mainly derived from major metabolic pathways of glycolysis, Krebs cycle
and Calvin cycle result in production of major primary metabolites such as acetyl-CoA,
shikimic acid and mevalonic acid, from which secondary metabolites are ultimately
synthesized. The majority of these compounds belong to one of a number of families, each
of which have particular structural characteristics arising from the way in which they are
built-up in nature, i.e., from their biosynthesis. These secondary metabolites include the
following (Hartmann, 2007; Mazid et al., 2011): a) Terpenoids derived from acetate-
mevalonate; b) Aromatic amino acids, aromatic glucosinolates and polyphenols derived
from shikimic acid; c) Alkaloids, aliphatic glucosinolates and peptide antibiotics derived
from amino acids; and d) Polyketides and fatty acids derived from acetate and malonate.
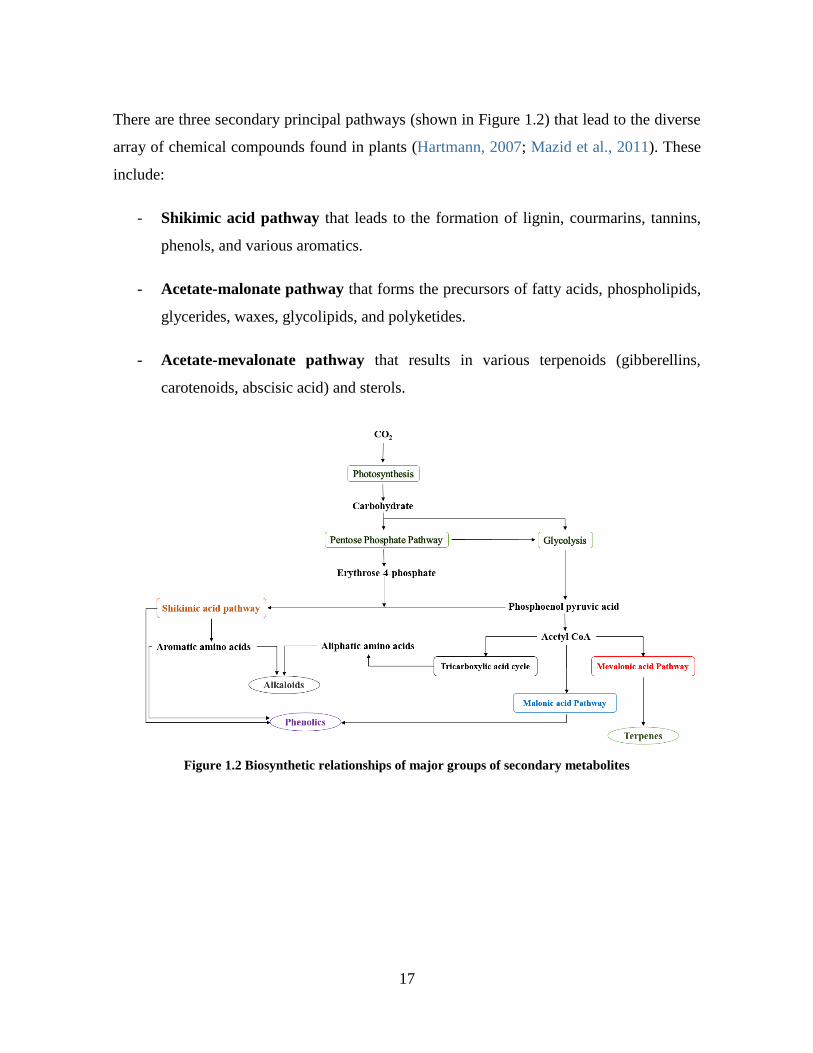
17
There are three secondary principal pathways (shown in Figure 1.2) that lead to the diverse
array of chemical compounds found in plants (Hartmann, 2007; Mazid et al., 2011). These
include:
- Shikimic acid pathway that leads to the formation of lignin, courmarins, tannins,
phenols, and various aromatics.
- Acetate-malonate pathway that forms the precursors of fatty acids, phospholipids,
glycerides, waxes, glycolipids, and polyketides.
- Acetate-mevalonate pathway that results in various terpenoids (gibberellins,
carotenoids, abscisic acid) and sterols.
Figure 1.2 Biosynthetic relationships of major groups of secondary metabolites
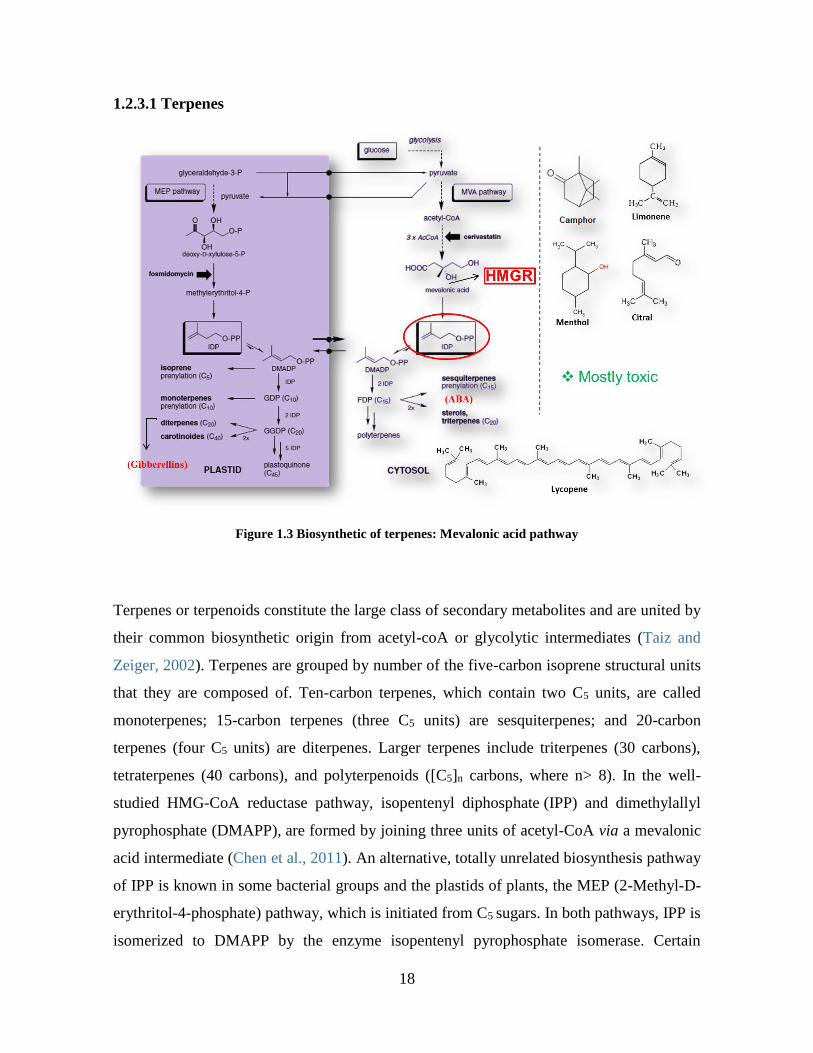
18
1.2.3.1 Terpenes
Figure 1.3 Biosynthetic of terpenes: Mevalonic acid pathway
Terpenes or terpenoids constitute the large class of secondary metabolites and are united by
their common biosynthetic origin from acetyl-coA or glycolytic intermediates (Taiz and
Zeiger, 2002). Terpenes are grouped by number of the five-carbon isoprene structural units
that they are composed of. Ten-carbon terpenes, which contain two C5 units, are called
monoterpenes; 15-carbon terpenes (three C5 units) are sesquiterpenes; and 20-carbon
terpenes (four C5 units) are diterpenes. Larger terpenes include triterpenes (30 carbons),
tetraterpenes (40 carbons), and polyterpenoids ([C5]n carbons, where n> 8). In the well-
studied HMG-CoA reductase pathway, isopentenyl diphosphate (IPP) and dimethylallyl
pyrophosphate (DMAPP), are formed by joining three units of acetyl-CoA via a mevalonic
acid intermediate (Chen et al., 2011). An alternative, totally unrelated biosynthesis pathway
of IPP is known in some bacterial groups and the plastids of plants, the MEP (2-Methyl-D-
erythritol-4-phosphate) pathway, which is initiated from C5 sugars. In both pathways, IPP is
isomerized to DMAPP by the enzyme isopentenyl pyrophosphate isomerase. Certain

19
terpenes have well characterized function in plant metabolism, and therefore, are
considered primary metabolites. For example, gibberellins and cytokinins are phyto-
hormones, and carotenoids play a role in the protection of the photosynthetic apparatus,
besides their ecological role as pigments. Other terpenes that are produced by plants as
secondary metabolites are presumed to be involved in defense as toxins and feeding
deterrents to a large number of plant feeding insects and mammals such as anti-herbivore
compounds limonoids and insecticidal monoterpenes pyrethroids.
1.2.3.2 Phenolic compounds
(Flamini et al., 2013)
Figure 1.4 Biosynthetic phenolic compounds: Shikimate + Malonate pathway

20
Plant phenolics are a chemically heterogeneous group of nearly 10,000 individual
compounds. Phenolic compounds are a diverse group of phytochemicals classified into
phenolic acids, flavonoids, proanthocyanidins (non-hydrolysable tannins) and hydrolysable
tannins, chalcones, coumarins, lignans, lignins, phenols, phenylpropanoids, quinines,
stilbenoids, and xanthones (Dai and Mumper, 2010). Many serve as defense compounds
against herbivores and pathogens. Others function in mechanical support, in attracting
pollinators and fruit dispersers, in absorbing harmful ultraviolet radiation, or in reducing the
growth of nearby competing plants (Imperato, 2006). Two basic biosynthetic pathways are
involved: the shikimic acid pathway and the malonic acid pathway. The shikimic acid
pathway participates in the biosynthesis of most plant phenolics whereas malonic acid
pathway is of less significance in higher plants. The shikimic acid pathway converts simple
carbohydrate precursors derived from glycolysis and the pentose phosphate pathway to the
aromatic amino acids (Herrmann and Weaver, 1999). The most abundant classes of
secondary phenolic compounds in plants are derived from phenylalanine via the elimination
of an ammonia molecule to form cinnamic acid. This reaction is catalyzed by phenylalanine
ammonia lyase (PAL), which is at a branch point between primary and secondary
metabolism, so it is the regulatory step in the formation of many phenolic compounds. The
activity of PAL is increased by environmental factors, such as low nutrient levels, light and
fungal infection (K Hahlbrock and Scheel, 1989).
Phenolic acids come from phenyl propanoid pathway are further sub-classed as hydroxyl
cinnamic acids, hydroxyl benzoic acids, hydroxyl phenylacetic acids, and hydroxyl
phenylpropanoic acids, and they are all synthesized from cinnamate precursor. Two classes
of phenolic acids can be distinguished as derivatives of cinnamic acid and derivatives of
benzoic acid (Manach et al., 2004). The hydroxy cinnamates include 4-coumaric acid,
caffeic acid, ferulic acid, sinapic acid, 3,4,5- Trihydroxy cinnamic acid, 2-hydroxy
coumaric acid and 2,5-Dihdroxy cinnamic acid. Ferulic acid is the most abundant phenolic
acid found in cereal grains. The corresponding hydroxyl benzoates include 4-hydroxy
benzoic acid, procatechuic acid, vanillic acid, syringic acid, gallic acid, salicylic acid and
gentisic acid. Tea is an important source of gallic acid. Ellagic acid is built from oxidative
coupling of two molecules of gallic acid. Chlorogenic acids are esters of hydroxyl cinnamic

21
acids, and coffee bean is rich containing about 30 chlorogenic acids (Gordon and Wareham,
2010; Henning et al., 2004).
Coumarins are classed by their benzopyran-2-on nucleus, and they originate from
cinnamate intermediate. Some well-known coumarins from vegetables include coumarin
(cinnamic acid), umbelliferone (4-coumaric acid) and scopoletin (ferulic acid) (Yang et al.,
2015). They exhibit a wide range of anti-microbial activity against both fungi and bacteria
(Brooker et al., 2008). It is believed that these cyclic compounds play pesticidal defense
role for plants (Seigler, 1998). Furano-coumarins are coumarins with furan ring either
linear or angular configuration. The most well studied furanocoumarins are psoralens for
their phyto-toxicity. They are abundant in members of the family Apiaceae including
celery, parsnip and parsley. These compounds turn toxic when exposed to UV-A light,
some become activated to a high energy electronic state, which can insert themselves into
the double helix of DNA and bind to the pyramidine bases, and thus, blocking transcription
and repair, and eventually leading to cell death (Rice, 1984).
Lignans are essentially phenyl propanoid dimers linked by C-C between the units. The
monomeric precursors (monolignols, e.g., coniferyl or 4-coumaryl alcohol) are the same for
lignin and lignin formation. Flaxseed is the richest source of lignans (resinols), but they are
also found in Brassica vegetables. Lignins are defense polymeric barriers to pathogen
penetration by a highly branched polymer of phenyl propanoid compounds. Lignification
blocks the growth of pathogens and are a frequent response to infection or wounding
(Vanholme et al., 2010).
Tannins are also plant phenolic polymers with molecular masses between 600 and 3000,
and are divided into two major groups: condensed tannins (or proanthocyanidins, PAs),
which are of flavonoid origin; and berries and plums are good sources of PAs. The
hydrolysable tannins, which are esters of gallic acid with a sugar moiety, mainly -D-
glucose, are grouped into gallotannins and ellagitannins. Grape seed and persimmon seeds
are rich sources of hydrolysable tannins. Berries such as strawberry, raspberry and
blackberry, and pomegranate are good sources of ellagitannins, and mango for gallotannins.

22
They are general toxins that significantly reduce the growth and survival of many
herbivores and also act as feeding repellents to a great diversity of animals.
Flavonoids. They make up the largest classes of phenolic compounds with flavane ring
system, having a basic carbon skeleton of 15 carbons arranged in two aromatic rings
connected by a three-carbon bridge. They are synthesized on a separate pathway from
cinnamoyl CoA esters with addition of three units of malonyl CoA (Figure 1.4). Flavonoids
are classified into different groups: the flavonones (e.g., hesperetin and naringenin in citrus
fruits); flavones (e.g., apigenin in celery and parsley; luteolin in pepper and red grape,
mainly as glycosides); flavonols (quercetin, kaempferol, myricetin and iso-hamnetin in
berries, pears, onion, kale and leek); favon-3-ols or catechins (tea, berries, peaches, red
grape and bannanas); procyanidins or flavan-3,4-diols; anthocyanidins such as cyanidin,
delphinidin, malvidin pelargonidin and others in berries, red grape, cherry and other
pigmented produce; and proanthocyanidins. Isoflavonoids are derived from a flavonone
intermediate, naringenin, ubiquitously present in plants and play a critical role in plant
developmental and defense response. Isoflavones such as genistein, daidzein and glycitein
occur mainly in leguminous plants such as soy (Manach et al., 2004)
Different types of flavonoids perform very different functions in plants, including
pigmentation and defense. Flavones and flavonols function to protect cells from UV-B
radiation because they accumulate in epidermal layers of leaves and stems and absorb light
strongly in the UV-B region (Lake et al., 2009). Moreover, it seems that synthesis of these
flavonoids is an effective strategy against reactive oxygen species (Posmyk et al., 2009).
Stilbenes (resveratrol and viniferins) are present in grape as constitutive compounds of the
woody organs (roots, canes, stems) and as induced substances (in leaves and fruit) acting as
phytoalexins in the mechanisms of grape resistance against certain pathogens (Bavaresco et
al., 1999).
23
1.2.3.3 Nitrogen-containing compounds
Nitrogenous secondary metabolites include well-known anti-herbivore defenses such as
alkaloids and cyanogenic glycosides, which are of considerable interest because of their
potential toxicity to humans and their medicinal properties. Most are biosynthesized from
common amino acids (Taiz and Zeiger, 2002). Alkaloids are toxic to some degree and
appear to serve primarily in defense against microbial infection and herbivore attack. They
are usually synthesized from one of the few common amino acids, in particular, aspartic
acid, lysine, tyrosine and tryptophan. Within plants, pyrrolizidine alkaloids occur naturally
as nontoxic N-oxides. In herbivore digestive tracts, however, they are quickly reduced to
uncharged, hydrophobic tertiary alkaloids, which can easily migrate through cell
membranes and they can be toxic.
Cyanogenic glycosides and glucosinolates also constitute a group of N-containing
protective compounds that are not inherently toxic but are readily broken down to give off
volatile poisons such as HCN and H2S when the plant is crushed; and their presence deters
feeding by insects and other herbivores such as snails and slugs. Found principally in the
Brassicaceae and related plant families, glucosinolates give off the compounds responsible
for the smell and taste of vegetables such as cabbage, broccoli, and radishes. The release of
these mustard-smelling volatiles from glucosinolates is catalyzed by a hydrolytic enzyme,
thioglucosidase or myrosinase, which cleaves glucose from its bond with the sulfur atom.
The resulting aglycone, the nonsugar portion of the molecule, rearranges with loss of the
sulfate to give pungent and chemically reactive products, including isothiocyanates,
thiocyanates and nitriles, depending on the conditions of hydrolysis. These products
function in defense as herbivore toxins and feeding repellents.
1.2.3.4 Polyketides
Polyketides are one of the most pharmacologically relevant families of natural products
found in microorganisms and plants. Extremely diverse in terms of structure and function,
polyketides of clinical importance include antibiotics, antitumor agents and cholesterol-
lowering agents; and they are biosynthesized from acyl CoA precursors. Polyketide
synthases (PKS) are responsible for the biosynthesis of polyketides and use a common
24
chemical strategy: chain elongation by a decarboxylase condensation reaction, followed by
cyclization to generate the final polyketide product. They are classified according to their
architectural configurations as type I, II and III (Staunton and Weissman, 2001). Several
type III PKSs, also known as chalcone synthase-PKSs, have been found in plants. They are
home-dimeric or condensing enzymes that essentially act iteratively. They utilize a variety
of different starter substrates substrates ranging from aliphatic-CoA to aromatic-CoA
substrates, from small (acetyl-CoA) to bulky (p-coumaroyl-CoA) substrates or from polar
(malonyl-CoA) to nonpolar (isovaleroyl-CoA) substrates, giving the plants an extraordinary
synthetic and functional diversity (Flores-Sanchez and Verpoorte, 2009).

25
1.3 Antioxidants
1.3.1 Concepts
Oxidation: In the past, oxidation was considered simply as a reaction, where an oxygen
molecule is added to a molecule or a hydrogen atom is taken away from a molecule. In the
larger sense, oxidation is a reaction that turns the oxidation number of a molecule more
positive or less negative. Therefore, the molecule that loses the electrons (received by an
oxidant) is the reductant. Redox reaction implies a transfer an electron of a reductant to an
oxidant. Oxidation is the loss of electrons or an increase in the oxidation state of a
molecule, atom, or ion.
Reactive oxygen species (ROS): The O2 molecule is a di-radical, as it has two impaired
electrons that have the same spin quantum number. This spin restriction makes O2 to accept
its electrons one at a time, leading to the generation of the so-called ROS, which can
damage the cells. ROS are also produced continuously as by-products of various metabolic
pathways.
Antioxidant is any substance that, when present at low concentrations compared to those
of an oxidisable substrate, significantly delays or prevents its oxidation (Halliwell et al.,
1995). Antioxidant may act by decreasing oxygen concentration, intercepting singlet
oxygen, preventing first-chain initiation by scavenging initial radicals such as hydroxyl
radicals, binding metal ion catalysts, decomposing primary products to non-radical
compounds, and chain breaking to prevent continued hydrogen abstraction from the
substrates. The extent to which oxidation of lipids occurs also depends on the chemical
structure of the fatty acids involved as well as other factors related to the storage of foods
and reaction conditions (Shahidi, 1997).
Food manufacturers have used food grade antioxidants to prevent quality deterioration of
products and to maintain their nutritional value (Shahidi and Zhong, 2007). Antioxidants
have also been of interest to biochemists and health professionals, because they may help
the body protect itself against damage caused by ROS and consequently, against the
incidence of degenerative diseases (Shahidi and Zhong, 2007).

26
Pro-oxidants are chemicals that induce oxidative stress, either by generating reactive
oxygen species or by inhibiting antioxidant systems (Puglia and Powell, 1984). For
example, as well as many of so-called antioxidants, also flavonoids can act, under certain
circumstances, as pro-oxidants and, hence, promote the oxidation of other compounds
(Halliwell, 2009). Human diets contain not only antioxidants but also many pro-oxidants:
hydrogen peroxide; lipid peroxides; redox–cycling toxins; heme and heme compounds; iron
and copper ions; ascorbate (that generates hydroxyl radicals by Fenton reaction); aldehyde
from lipid peroxides decomposition; and nitrite (nitrite at low pH in the stomach produces
reactive oxides of nitrogen).
1.3.2 Why to examine antioxidants from plants?
Fresh fruits and vegetables are normally consumed raw or minimally processed and are
considered to be an important part of a healthy diet as they provide needed nutrients, fiber
and antioxidants. Many plants and plant by-products have been studied as sources of
potentially safe natural antioxidants for the food industry; various bioactive compounds
have been isolated, many of them being polyphenols (Kennedy and Wightman, 2011;
Nicholson and Hammerschmidt, 1992)
Plants expose themselves to ROS, and so, they are rich in antioxidant defenses and repair
systems against oxidative damage to help them deal with O2 toxicity. Plants supply a range
of antioxidants to humans some known to be important in vivo such as ascorbate, α-
tocopherol, tocotrienols, flavonoids and carotenoids. Diets rich in plants are associated with
lower risk of developing many age-related diseases (e.g., some cancers, diabetes,
atherosclerosis, and dementia…) and most people in “advanced” countries would gain
better health if they consume diets containing more fruits and vegetables (Pandey and
Rizvi, 2009).
The growing interest in the substitution of synthetic food antioxidants by natural ones has
fostered research on vegetable sources and the screening of raw materials for identifying
new antioxidants. Oxidation reaction is not an exclusive concern for food industry, and
antioxidants are widely used to prevent deterioration of oxidation susceptible products,
such as cosmetics, pharmaceuticals. In addition, other biological properties such as anti-

27
carcinogenicity, anti-mutagenicity, anti-allergenicity and anti-aging activity have been
reported for natural and synthetic antioxidants.
Recently, special attention is being paid on their extraction from a variety of inexpensive or
residual sources from agricultural industries (Moure et al., 2001), since many studies have
reported that plants contain a wide variety of compounds with beneficial health effects.
Particularly, many herbs and spices used to aromatize foods have been screened as sources
of natural antioxidants and antimicrobial compounds. (Ramirez et al., 2007).
The importance of the antioxidants contained in foods is well appreciated for both
preserving the foods themselves and supplying essential antioxidants in vivo. With
increasing experimental, clinical and epidemiological data that show the beneficial effects
of antioxidants against oxidative stress-induced degenerative and age-related diseases,
cancer and aging, the importance and role of antioxidants have received renewed attention
(Yanishlieva et al., 2001).
Humans are protected from oxidative stress by various anti-oxidants that have different
functions; some are enzymes and proteins and others are small molecule antioxidants.
Foods are important as an essential source of such antioxidants, components and trace
elements. In addition, numerous synthetic antioxidants have been developed and some of
them have been used in practice, for example, as food additives, supplements and drugs.
The phenolic compounds such as vitamin E and flavonoids are typical antioxidants.
As endogenous antioxidants synthesised by aerobes (e.g. SOD, catalase, GSH) do not
completely prevent damage by reactive species in vivo (Halliwell, 1999); efficient repair
systems are needed to reduce the damage and humans must also obtain antioxidants from
the diet. There is currently a considerable amount of interest in dietary antioxidants as
bioactive components of food. The physiological role of some of these, such as vitamin E
and vitamin C, is well established. The interest in flavonoids has increased in recent years,
because of their ubiquitous presence as antioxidants in food (Yanishlieva et al., 2001).

28
1.3.3 Production of free radical in biology
The generation of ROS begins with rapid uptake of oxygen, activation of NADPH oxidase,
and the production of the superoxide anion radical (O2˙−) (Nimse and Pal, 2015)
(1)
The O2˙− is then rapidly converted to H2O2 by SOD:
(2)
These ROS can act by either of the two oxygen dependent mechanisms resulting in the
destruction of microorganism or other foreign matter. The reactive species can also be
generated by the myeloperoxidase–halide–H2O2 system. The enzyme myeloperoxidase
(MPO) is present in the neutrophil cytoplasmic granules. In the presence of chloride ion,
which is ubiquitous, H2O2 is converted to hypochlorous acid (HOCl), a potent oxidant and
antimicrobial agent (Babior, 1999).
(3)
ROS are also generated from O2˙−and H2O2 via ‘respiratory burst’ by Fenton (4) and/or
Haber–Weiss (5) reactions
H2O2 + Fe2+ → ˙OH + OH− + Fe3+ (4)
O2˙− + H2O2 → ˙OH + OH− + O2 (5)
The enzyme nitric oxide synthase produces reactive nitrogen species (RNS), such as nitric
oxide (NO˙) from arginine
L-Arg + O2 + NADPH → NO˙ + citrulline (6)
An inducible nitric oxide synthase (iNOS) is capable of continuously producing large
amount of NO˙, which act as a O2˙−quencher. The NO˙ and O2˙
− react together to produce
peroxynitrite (ONOO−), a very strong oxidant, hence, each can modulate the effects of the
other. Although neither NO˙ nor O2˙− is a strong oxidant, peroxynitrite is a potent and
versatile oxidant that can attack a wide range of biological targets (Zhu et al., 1992).
NO˙ + O2˙− → ONOO− (7)
Peroxynitrite reacts with the aromatic amino acid residues in the enzyme resulting in the
nitration of the aromatic amino acids. Such a change in the amino acid residue can result in

29
enzyme inactivation. However, nitric oxide is an important cytotoxic effector molecule in
the defense against tumor cells, various protozoa, fungi, helminths, and mycobacteria
(Nathan and Hibbs, 1991). The other sources of free radical reactions are cyclooxygenation,
lipooxygenation, lipid peroxidation, metabolism of xenobiotics, and ultraviolet radiations
(Shahidi and Zhong, 2010).
1.3.4 Natural sources of antioxidant compounds
Numerous plants have been studied as sources of potentially safe natural antioxidants for
the food industry; various compounds have been isolated, many of them being polyphenols
(Ferrazzano et al., 2011; Quideau et al., 2011). Many of the antioxidants occur as dietary
constituents, these include tocopherols, vitamin C, carotenoids, and phenolic compounds
(Table 1.2).
Table 1.2 Natural plant sources of some antioxidants
Compounds Example of source
Vitamin E (Tocolpherols
and Tocotrienols)
Oilseeds, palm oil, nuts, eggs, dairy products, whole grains,
vegetables, cereals, margarine, etc.
Vitamin C (Ascorbic acid) Fruits and vegetable, berries, citrus fruits, sprouts, green peppers,
potatoes, etc.
Carotenoids Dark leafy vegetables, carrots, sweet potatoes, yams, tomatoes,
cantaloupes, apricots, citrus fruits, kale, turnip greens, palm oil, etc.
Flavonoids/Isoflavones Fruits and vegetables, oilseeds, berries, eggplant, peppers, citrus
fruits, cruciferous vegetables, yams, tomatoes, onions, etc.
Phenolic acids/Derivatives
of Catechins
Oilseeds and certain oils, cereals, grains, etc.
Green tea, berries, certain oilseeds, etc.
(Shahidi, 1997)

30
Table 1.3 Natural sources of polyphenol
Poly phenols Source (serving size) mg/kg fresh wt (or mg/L) mg/serving
Hydroxybenzoic acids Blackberry (100 g) 80–270 8–27 Protocatechuic acid Raspberry (100 g) 60–100 6–10 Gallic acid Black currant (100 g) 40–130 4–13 p-Hydroxybenzoic acid Strawberry (200 g) 20–90 4–18
Hydroxycinnamic acids Blueberry (100 g) 2000–2200 200–220 Caffeic acid Kiwi (100 g) 600–1000 60–100 Chlorogenic acid Cherry (200 g) 180–1150 36–230 Coumaric acid Plum (200 g) 140–1150 28–230 Ferulic acid Aubergine (200 g) 600–660 120–132 Sinapic acid Apple (200 g) 50–600 10–120
Pear (200 g) 15–600 3–120 Chicory (200 g) 200–500 40–100 Artichoke (100 g) 450 45
Potato (200 g) 100–190 20–38 Corn flour (75 g) 310 23
Flour: wheat, rice, oat (75 g) 70–90 5–7 Cider (200 mL) 10–500 2–100 Coffee (200 mL) 350–1750 70–350
Anthocyanins Aubergine (200 g) 7500 1500 Cyanidin Blackberry (100 g) 1000–4000 100–400 Pelargonidin Black currant (100 g) 1300–4000 130–400 Peonidin Blueberry (100 g) 250–5000 25–500 Delphinidin Black grape (200 g) 300–7500 60–1500 Malvidin Cherry (200 g) 350–4500 70–900
Rhubarb (100 g) 2000 200 Strawberry (200 g) 150–750 30–150
Red wine (100 mL) 200–350 20–35 Plum (200 g) 20–250 4–50 Red cabbage (200 g) 250 50
Flavonols Yellow onion (100 g) 350–1200 35–120 Quercetin Curly kale (200 g) 300–600 60–120 Kaempferol Leek (200 g) 30–225 6–45 Myricetin Cherry tomato (200 g) 15–200 3–40
Broccoli (200 g) 40–100 8–20 Blueberry (100 g) 30–160 3–16 Black currant (100 g) 30–70 3–7 Apricot (200 g) 25–50 5–10 Apple (200 g) 20–40 4–8 Beans, green or white (200
g) 10–50 2–10
Black grape (200 g) 15–40 3–8 Tomato (200 g) 2–15 0.4–3.0 Black tea infusion (200 mL) 30–45 6–9 Green tea infusion (200 mL) 20–35 4–7 Red wine (100 mL) 2–30 0.2–3
Flavones Parsley (5 g) 240–1850 1.2–9.2 Apigenin Celery (200 g) 20–140 4–28 Luteolin Capsicum pepper (100 g) 5–10 0.5–1
Flavanones Orange juice (200 mL) 215–685 40–140 Hesperetin Grapefruit juice (200 mL) 100–650 20–130 Naringenin Lemon juice (200 mL) 50–300 10–60 Eriodictyol
Isoflavones Soy flour (75 g) 800–1800 60–135 Daidzein Soybeans, boiled (200 g) 200–900 40–180 Genistein Miso (100 g) 250–900 25–90 Glycitein Tofu (100 g) 80–700 8–70
Tempeh (100 g) 430–530 43–53 Soy milk (200 mL) 30–175 6–35
Monomeric flavanols Chocolate (50 g) 460–610 23–30 Catechin Beans (200 g) 350–550 70–110 Epicatechin Apricot (200 g) 100–250 20–50
Cherry (200 g) 50–220 10–44 Grape (200 g) 30–175 6–35 Peach (200 g) 50–140 10–28 Blackberry (100 g) 130 13
Apple (200 g) 20–120 4–24 Green tea (200 mL) 100–800 20–160 Black tea (200 mL) 60–500 12–100 Red wine (100 mL) 80–300 8–30
(Manach et al., 2004)
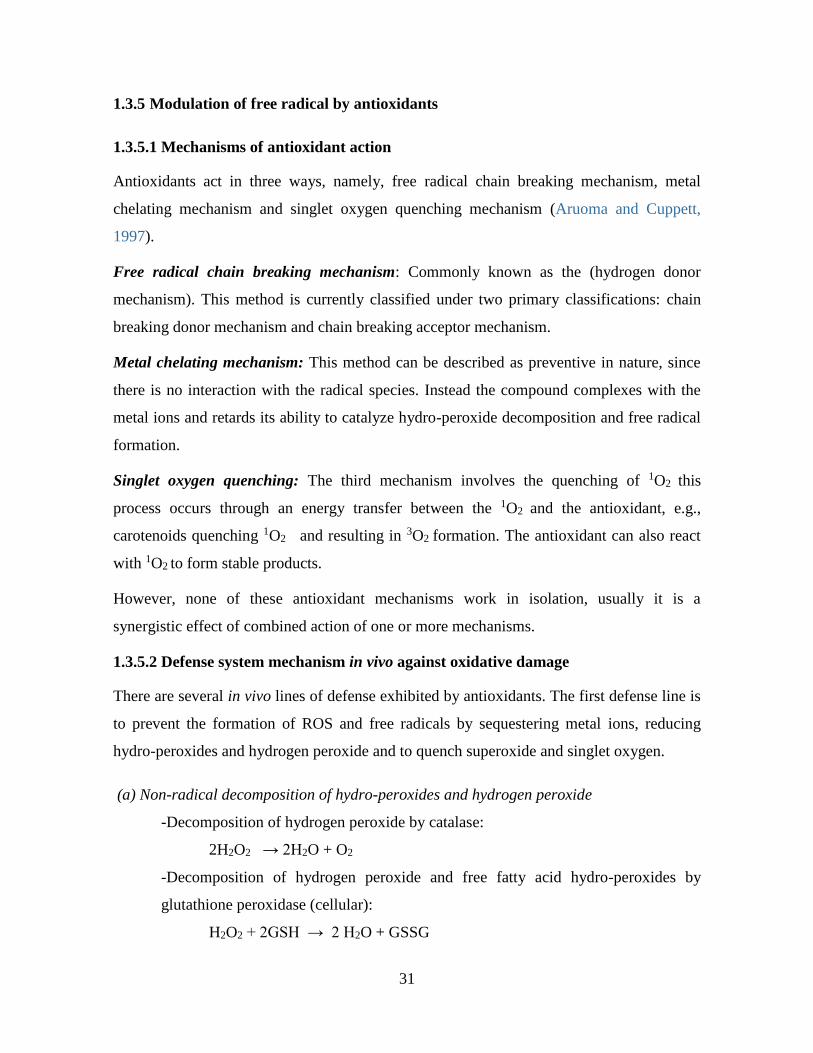
31
1.3.5 Modulation of free radical by antioxidants
1.3.5.1 Mechanisms of antioxidant action
Antioxidants act in three ways, namely, free radical chain breaking mechanism, metal
chelating mechanism and singlet oxygen quenching mechanism (Aruoma and Cuppett,
1997).
Free radical chain breaking mechanism: Commonly known as the (hydrogen donor
mechanism). This method is currently classified under two primary classifications: chain
breaking donor mechanism and chain breaking acceptor mechanism.
Metal chelating mechanism: This method can be described as preventive in nature, since
there is no interaction with the radical species. Instead the compound complexes with the
metal ions and retards its ability to catalyze hydro-peroxide decomposition and free radical
formation.
Singlet oxygen quenching: The third mechanism involves the quenching of 1O2 this
process occurs through an energy transfer between the 1O2 and the antioxidant, e.g.,
carotenoids quenching 1O2 and resulting in 3O2 formation. The antioxidant can also react
with 1O2 to form stable products.
However, none of these antioxidant mechanisms work in isolation, usually it is a
synergistic effect of combined action of one or more mechanisms.
1.3.5.2 Defense system mechanism in vivo against oxidative damage
There are several in vivo lines of defense exhibited by antioxidants. The first defense line is
to prevent the formation of ROS and free radicals by sequestering metal ions, reducing
hydro-peroxides and hydrogen peroxide and to quench superoxide and singlet oxygen.
(a) Non-radical decomposition of hydro-peroxides and hydrogen peroxide
-Decomposition of hydrogen peroxide by catalase:
2H2O2 → 2H2O + O2
-Decomposition of hydrogen peroxide and free fatty acid hydro-peroxides by
glutathione peroxidase (cellular):
H2O2 + 2GSH → 2 H2O + GSSG

32
LOOH + 2GSH → LOH + H2O+GSSG
-Decomposition of hydrogen peroxide and phospholipid hydro-peroxides by
glutathione peroxidase (plasma):
PLOOH + 2GSH → PLOH + H2O + GSSG
-Decomposition of phospholipid hydro-peroxides by glutathione peroxidase:
-Decomposition of hydrogen peroxide and lipid hydro-peroxides by peroxidase:
LOOH + AH2 → LOH + H2O + A
H2O2 + AH2 → 2H2O + A
-Decomposition of lipid hydro-peroxides by glutathione-S-transferase:
(b) Sequestration of metal by chelation:
- Transferrin, lactoferrin: sequestration of iron
- Haptoglobin: sequestration of haemoglobin
- Haemopexin: stabilisation of haem
- Ceruloplasmin, albumin: sequestration of copper
(c) Quenching of active oxygen species:
- Superoxide dismutase (SOD): disproportionation of superoxide
2O2•-+ 2H+ → H2O2 + O2
- Carotenoids, vitamin E: quenching of singlet oxygen
The second line defense is the radical-scavenging antioxidants. Vitamin E and vitamin C
are major lipophilic and hydrophilic radical-scavenging antioxidants. Phenolic compounds
may also work as important radical-scavenging antioxidants. They scavenge radicals and
inhibit chain initiation or break chain propagation. They include the hydrophilic agents
such as vitamin C, uric acid, bilirubin and albumin; and lipophilic agents such as vitamin E,
ubiquinol, carotenoids and flavonoids.
The third-line of defense is the repair and de novo enzymes responsible for defenses such as
repair of the damages and reconstitution of membranes: lipases, proteases, DNA repair
enzymes, and transferases (Gill and Tuteja, 2010).

33
1.3.5.3 Plant antioxidant systems
Plant systems have developed extensive protective mechanisms to combat harmful effects
of free radicals, including a variety of small molecules and enzymes. The equilibrium
between production and scavenging of ROS may be perturbed by various biotic and abiotic
stress factors such as salinity, UV radiation, drought, heavy metals, temperature extremes,
nutrient deficiency, air pollution, herbicides and pathogen attacks. These disturbances lead
to sudden increase in intracellular levels of ROS, which can cause significant damage to
cell structures (Figure 1.5). Through a variety of reactions, O2●- leads to the formation of
H2O2, OH● and other ROS. The ROS are highly reactive and toxic at high levels and causes
damage to proteins, lipids, carbohydrates, DNA which ultimately results in cell death. ROS
affect many cellular functions by damaging nucleic acids, oxidizing proteins, and causing
lipid peroxidation. Stress-induced ROS accumulation is counteracted by enzymatic
antioxidant systems that include a variety of scavengers, such as superoxide dismutase
(SOD), ascorbate peroxidase (APX), catalase (CAT), glutathione reductase (GR),
monodehydroascorbate reductase (MDHAR), dehydroascorbate reductase (DHAR),
glutathione peroxidase (GPX), guaicol peroxidase (GOPX) and glutathione-S- transferase
(GST) and non-enzymatic low molecular metabolites, such as ascorbic acid (ASH),
glutathione (GSH), α-tocopherol, carotenoids and flavonoids (Gill and Tuteja, 2010).
Exposure of plants to unfavorable environmental conditions such as temperature extremes,
heavy metals, drought, water availability, air pollutants, nutrient deficiency, or salt stress
can increase the production of ROS. Figure 1.6 summarizes the antioxidant defense systems
of plant cellular antioxidant machinery to protect themselves against abiotic stresses. The
components of antioxidant defense system are enzymatic and non-enzymatic antioxidants.
Enzymatic antioxidants include SOD, CAT, APX, MDHAR, DHAR and GR and non-
enzymatic antioxidants are GSH, ASH (both water soluble), carotenoids and tocopherols
(lipid soluble) (Yanishlieva et al., 2001).
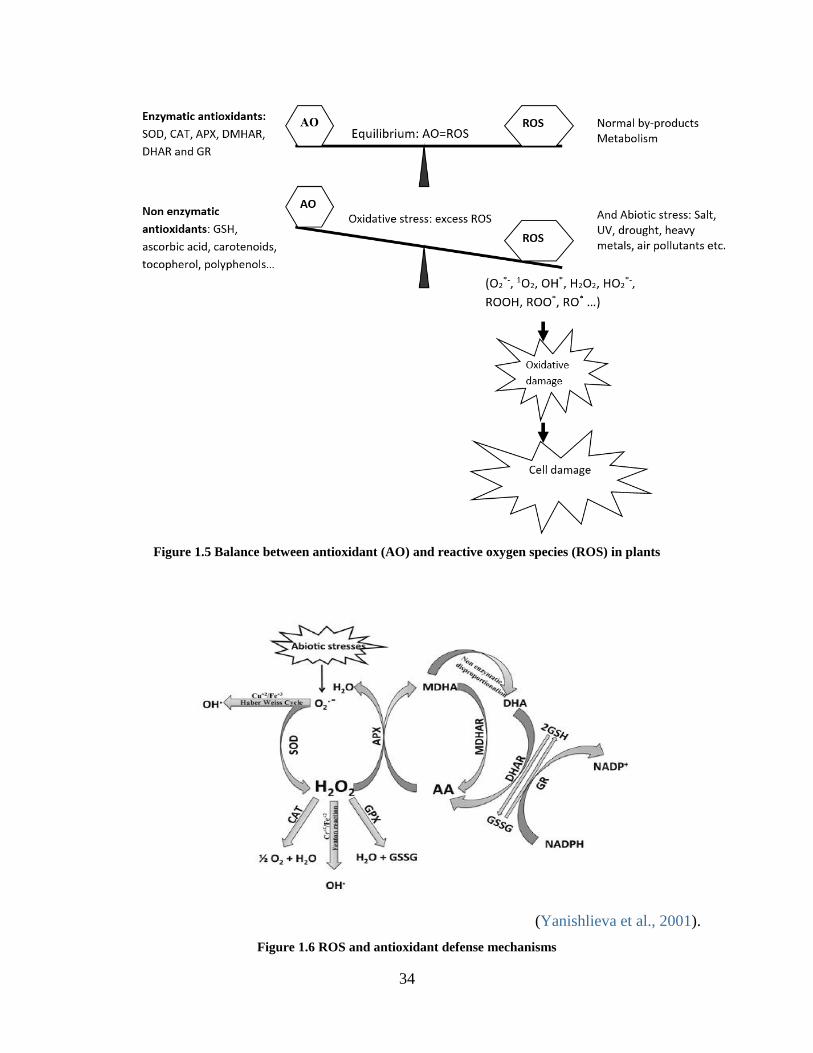
34
Figure 1.5 Balance between antioxidant (AO) and reactive oxygen species (ROS) in plants
(Yanishlieva et al., 2001).
Figure 1.6 ROS and antioxidant defense mechanisms
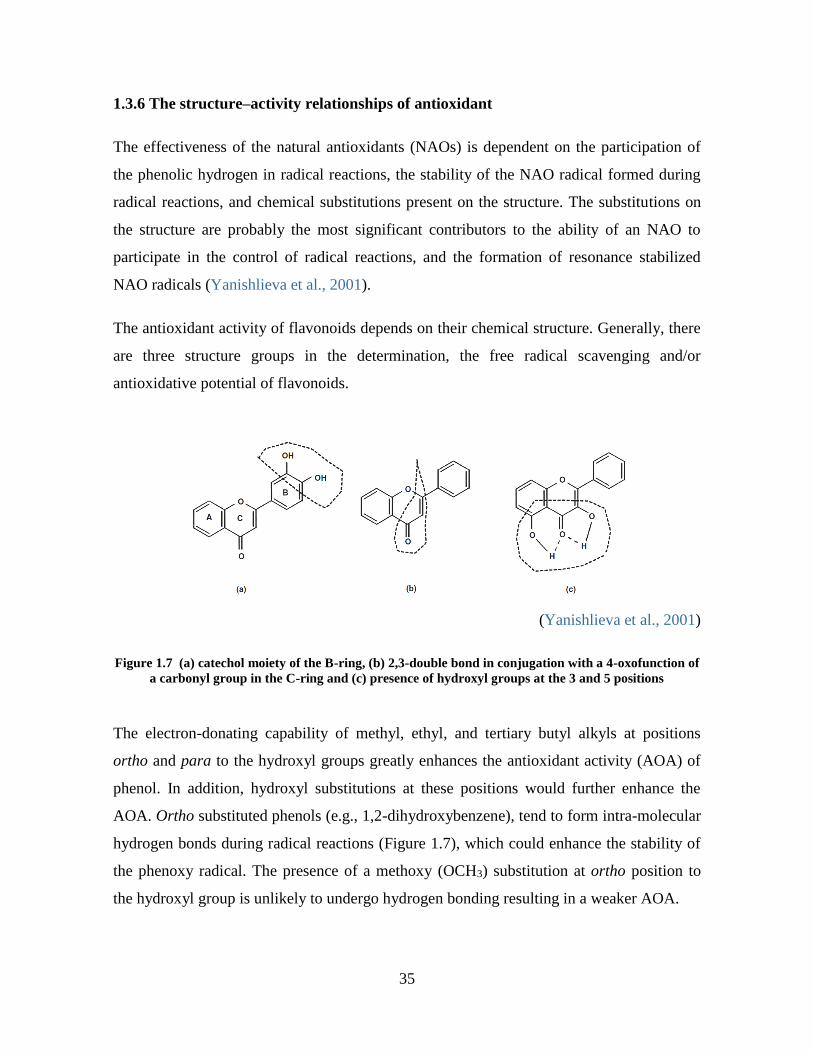
35
1.3.6 The structure–activity relationships of antioxidant
The effectiveness of the natural antioxidants (NAOs) is dependent on the participation of
the phenolic hydrogen in radical reactions, the stability of the NAO radical formed during
radical reactions, and chemical substitutions present on the structure. The substitutions on
the structure are probably the most significant contributors to the ability of an NAO to
participate in the control of radical reactions, and the formation of resonance stabilized
NAO radicals (Yanishlieva et al., 2001).
The antioxidant activity of flavonoids depends on their chemical structure. Generally, there
are three structure groups in the determination, the free radical scavenging and/or
antioxidative potential of flavonoids.
(Yanishlieva et al., 2001)
Figure 1.7 (a) catechol moiety of the B-ring, (b) 2,3-double bond in conjugation with a 4-oxofunction of
a carbonyl group in the C-ring and (c) presence of hydroxyl groups at the 3 and 5 positions
The electron-donating capability of methyl, ethyl, and tertiary butyl alkyls at positions
ortho and para to the hydroxyl groups greatly enhances the antioxidant activity (AOA) of
phenol. In addition, hydroxyl substitutions at these positions would further enhance the
AOA. Ortho substituted phenols (e.g., 1,2-dihydroxybenzene), tend to form intra-molecular
hydrogen bonds during radical reactions (Figure 1.7), which could enhance the stability of
the phenoxy radical. The presence of a methoxy (OCH3) substitution at ortho position to
the hydroxyl group is unlikely to undergo hydrogen bonding resulting in a weaker AOA.

36
Figure 1.8 Intra-molecular hydrogen bonding of ortho substituted phenols
NAO would be expected to participate in radical trapping and singlet oxygen quenching
mechanisms. Radical trapping mechanisms can occur via interactions between radical
species, such as an antioxidant radical and lipid peroxyl radical (Figure 1.9).
Figure 1.9 Radical trapping mechanism of phenolic antioxidants
Alternatively, lipid peroxy radicals can interact with electron dense regions of a molecule.
For example, the conjugated polyene system of carotenoids has been found to interact with
peroxy radicals (Figure 1.10).
Figure 1.10 Radical trapping mechanism of carotenoids

37
1.3.7 Methods of in vitro antioxidant activity determination
1.3.7.1 In vitro antioxidant capacity assays
There are numerous methods for measuring antioxidant activity, involving various redox
reactions. The assays can roughly be classified into two types: assays based on hydrogen
atom transfer (HAT) reactions and assays based on electron transfer (ET) (Table 1.4). The
majority of HAT-based assays apply a competitive reaction scheme and substrates compete
for thermally generated peroxyl radicals through decomposition of azo compounds. These
assays include inhibition of induced low-density lipoprotein autoxidation, oxygen radical
absorbance capacity (ORAC), total radical trapping antioxidant parameter (TRAP), and
crocin bleaching assays. ET-based assays measure the capacity of an antioxidant in the
reduction of an oxidant, which changes color when reduced. ET-based assays include the
Trolox equivalence antioxidant capacity (TEAC), ferric ion reducing antioxidant power
(FRAP), “total antioxidant potential” assay using a Cu (II) complex as an oxidant, and 2,2-
diphenyl-1-picrylhydrazyl (DPPH). In addition, other assays have been designed to
measure the capacity of a sample to scavenge biologically relevant oxidants such as singlet
oxygen, superoxide anion, hydroxyl and peroxynitrite radicals, and they are summarized in
Table 1.4. Based on such analyses, it has been suggested that the total phenols assay by
Folin Ciocalteu reagent (FCR) could be useful for quantification of the reducing capacity of
the antioxidants in the sample, and the ORAC assay to quantify peroxyl radical scavenging
capacity. (Huang et al., 2005).
Each method has its own merits and drawbacks, it has been found that the most common
and reliable methods are the ABTS and DPPH methods; and they have been modified and
improved in recent years (Krishnaiah et al., 2011).
The oxidative damage can be attenuated not only by scavenging radicals, but also by
sequestering metal ions, decomposing hydrogen peroxide and/or hydro-peroxides,
quenching active pro-oxidants. It should be appreciated that the antioxidant can exert its
effect by different mechanisms and it is essential in evaluating antioxidant capacity to
clarify which function is being measured by the method employed (Aruoma, 2003). Thus,
as often pointed out, there is no single method that correctly evaluates the total antioxidant
activity.

38
Table 1.4 In vitro antioxidant capacity assays
Assays involving hydrogen atom
transfer reactions (HAT)
ROO● + AH → ROOH + A●
ROO● + LH → ROOH + L●
ORAC (oxygen radical absorbance capacity)
TRAP (total radical trapping antioxidant
parameter)
Crocin bleaching assay
IOU (inhibits oxygen uptake),
Inhibition of linoleic acid oxidation,
Inhibition of LDL oxidation
Assays by electron-transfer reaction
(ET)
M(n) + e (from AH) → AH●+ + M(n-
1)
TEAC (Trolox equivalent antioxidant capacity)
FRAP (ferric ion reducing antioxidant
parameter)
DPPH (diphenyl-1-picrylhydrazyl)
Copper (II) reduction capacity
Total phenols assay by Folin-Ciocalteu reagent
(Huang et al., 2005)
1.3.7.2 Mode of action of in vitro antioxidant activity assays
Trolox equivalent antioxidant capacity (TEAC)
The TEAC assay is based on the ability of antioxidants to scavenge the ABTS●+ radical
and can measure antioxidant capacities of hydrophilic and lipophilic compounds in the
same sample (Pellegrini et al, 1999). The mechanism of single hydrogen transfer takes
place in two steps:

39
Step 1:
N
S S
O
OOH
N
S
N
S
O
OOH
N
CH3
CH3
ABTS
-e- ↕ +e- K2S2O8 (Potassium persulfate)
N
S S
O
OO
-
N
S
N+
S
O
OO
-
N
CH3
CH3
Step 2: Reduction of ABTS°+ and oxidation of Trolox
O
OH
CH3
CH3CH3
O
OH
CH3
Trolox
+
CH3 O
CH3
CH3
O
OH
CH3
O-
ABTS+ (reduced) Oxidized Trolox
Figure 1.11 Reduction of ABTS+ radical by Trolox (H-donor)
* ABTS (2,2'-azino-bis(3-ethylbenzothiazoline-6-sulphonic acid)),
* Trolox ((6-hydroxy-2,5,7,8-tetramethylchroman-2- carboxylic acid) (Pellegrini et al, 1999)
CH3
NH+
S
O
O
O-
S
N
N
N
S S
O
O
O-
CH3

40
DPPH free radical scavenging assay
The stable pre-formed DPPH radical has been used widely for the determination of primary
antioxidant activity. It is a free radical that can accept H+/e- to become a stable molecule
(Groupy et al. 2003). The antioxidant process of this reaction is thought to be expressed as
(Figure 1.18):
2,2-diphenyl-1-picrylhydrazyl (DPPHo) (Groupy et al. 2003)
Figure 1.12 Protonation of DPPH (violet) to most stable DPPH-H form (light yellow color)
Reducing power property (FRAP)
The ability of biological samples to reduce ferric ions is determined using FRAP method
previously described by Oyaizu (1986), and by redox potential (potentiometric assay). An
antioxidant with ablity to donate a single electron to the ferric-complex would cause the
reduction of this complex into the blue ferrous complex, which absorbs strongly at 700 nm.
The reducing power of antioxidant compounds can be easily predicted from equations (1),
(2) and (3) (Figure 1.19).
K3[Fe(CN)6] + e-(Extract) → K4[Fe(CN)6] (1)
Fe3+ + e- → Fe2+ (2)
Fe2+(aq) + K3Fe(CN)6(aq) → KFe[Fe(CN)6](s) + 2K+ (3)
Deep Blue Colour
Figure 1.13 Mechanism of Ferric Reduction
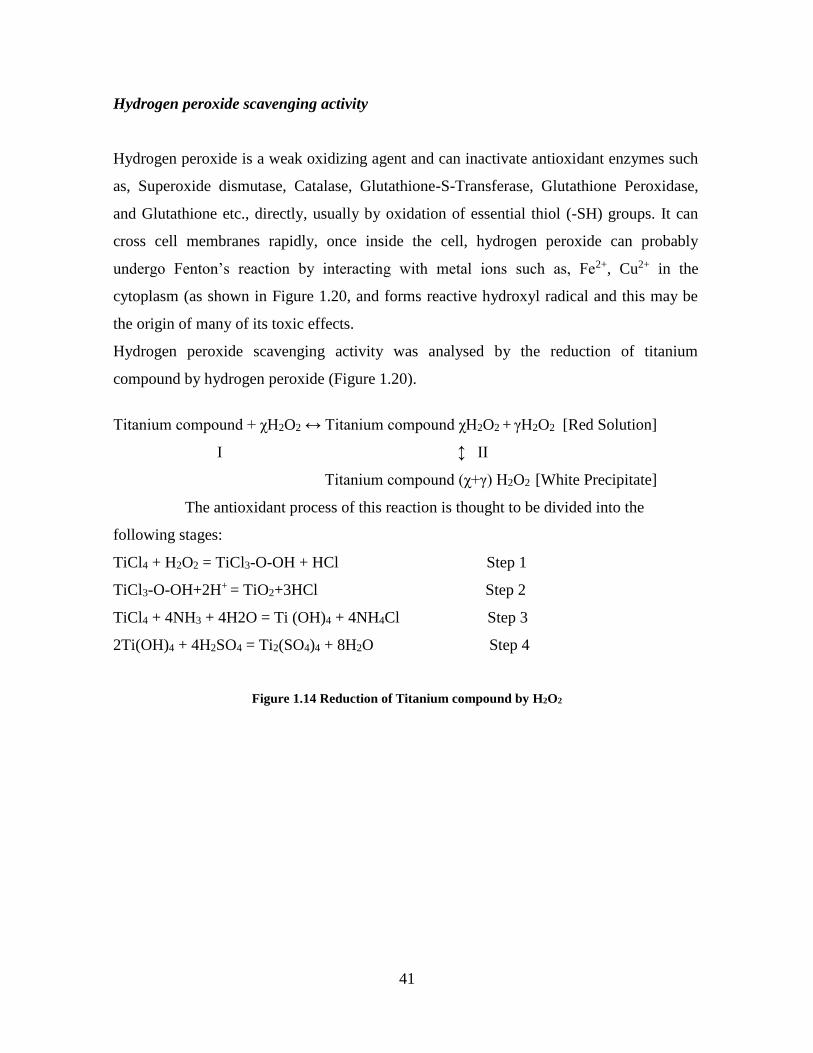
41
Hydrogen peroxide scavenging activity
Hydrogen peroxide is a weak oxidizing agent and can inactivate antioxidant enzymes such
as, Superoxide dismutase, Catalase, Glutathione-S-Transferase, Glutathione Peroxidase,
and Glutathione etc., directly, usually by oxidation of essential thiol (-SH) groups. It can
cross cell membranes rapidly, once inside the cell, hydrogen peroxide can probably
undergo Fenton’s reaction by interacting with metal ions such as, Fe2+, Cu2+ in the
cytoplasm (as shown in Figure 1.20, and forms reactive hydroxyl radical and this may be
the origin of many of its toxic effects.
Hydrogen peroxide scavenging activity was analysed by the reduction of titanium
compound by hydrogen peroxide (Figure 1.20).
Titanium compound + χH2O2 ↔ Titanium compound χH2O2 + γH2O2 [Red Solution]
I ↕ II
Titanium compound (χ+γ) H2O2 [White Precipitate]
The antioxidant process of this reaction is thought to be divided into the
following stages:
TiCl4 + H2O2 = TiCl3-O-OH + HCl Step 1
TiCl3-O-OH+2H+ = TiO2+3HCl Step 2
TiCl4 + 4NH3 + 4H2O = Ti (OH)4 + 4NH4Cl Step 3
2Ti(OH)4 + 4H2SO4 = Ti2(SO4)4 + 8H2O Step 4
Figure 1.14 Reduction of Titanium compound by H2O2

42
Superoxide anion scavenging activity
Superoxide anion is also another harmful reactive oxygen species as it damages cellular
component in biological systems. It can act directly or indirectly by forming H2O2, OH●,
peroxy nitrite, or singlet oxygen (Sharma and Singh, 2012). The ability of the plant extract
to scavenge superoxide radical from reaction mixture is reflected in the decrease of the
absorbance at 560 nm. The mechanism of single electron transfer takes place in two steps
(Figure 1.21):
Tetrazolium Salt Formazan + O2
.-
N
N+
O CH3
CH3
NH
N
CH3
O CH3
NAD(P)H
CH3SO4
_
1-Methoxy PMS 1-Methoxy PMS Reduced form
e-
In the next step O2.- is neutralized by the antioxidant compounds.
Figure 1.15 Superoxide anion radical generation by PMS-NADH system

43
Nitric oxide scavenging activity
Nitric oxide radicals display important roles in various types of inflammatory. It is
potentially toxic with a free radical character, and therefore, it is responsible for many
physiologic and pathologic events such as juveniles’ diabetes, multiple sclerosis, and
ulcerative colitis (Huie and Padmaje, 1993). Additionally, increasing evidence shows that
NO modulates neurotoxin induced cell damage and is involved in neuronal cell death in
Parkinson’s disease and other neurodegenerative disorders including Alzheimer disease
(Zhan et al; 2006, Aliev et al. 2009 ). Griess assay is generally used to assess nitric oxide
inhibition activity of the plant extracts. The antioxidant process of this reaction is thought
to be divided into the following stages as shown in Figure 1.22.
Figure 1.16 Formation of azo dye
44
Metal chelating activity
Bivalent transition metal ions play an important role as catalysts of oxidative processes,
leading to the formation of hydroxyl radicals and hydrogen peroxide decomposition
reaction via Fenton reaction (Aruoma et al., 1997). Therefore, minimizing their
concentration by chelating them would reduce radical oxygen species (ROS) generation
associated with Fenton’s reaction, and thereby, offering protection against oxidative
damage. The assay involves chelation of the metal ion using ferrozine that forms a
complex with ferrous ion. The chelation reaction is thought to be occurring in the
following stages (Figure 1.23). In the presence of other chelating agents, the ferrozine
complex formation is inhibited. Thus measurement of the reduction of colour of the
reaction media, allows the estimation of the chelating activity of the co-existing chelating
agent.

45
N
OOH
OH
O
N
OH
O
OH
O
+
FeCl2
O
OH
Fe2+
O-
OH
O
OH OH
OH
OH
O-
OH
OH
OH
OH
+Fe
2+ Residual Residual
EDTA
+ Fe2+
Ferrozine
Fe2+
N
N
N
N
SO
OO
-
S
O
O
O-
NN
N N
S
O
O
O-
SO
O
O-
Blue Colour Formation
Figure 1.17 Mechanism of metal chelation by ferrozine
NN
N N
S
O
O
OH
SO
O
O-

46
1.3.8 Trends and challenges in application of antioxidants from plant sources.
The application of antioxidants from natural sources in food can have dual benefits of food
preservation and health promotion. In effect, with increasing consumer consciousness with
regard to food additive safety, the replacement of synthetic antioxidants by natural ones can
have the added dimension of health function, in addition to physico-chemical functionality
such as solubility in both oil and aqueous phases such as emulsion systems in foods.
However, naturally occurring antioxidant substances may also need safety evaluation for
use as food additives (Rangan and Barceloux, 2009).
Antioxidants have been used in the food industry to preserve flavor and color and to avoid
vitamin destruction. Antioxidants such as ascorbic acid (vitamin C) and -tocopherol
(vitamin E) are frequently used as antioxidants for food. Because of high manufacturing
costs and lower efficiency of natural antioxidants, the most used are the synthetic
antioxidants. Among the synthetic types, the most frequently used are butylated
hydroxyanisole (BHA), butylated hydroxytoluene (BHT), propyl gallate (PG) and tert-
butyl hydroquinone (TBHQ) (Moure et al., 2001). However, there are some reports
suggesting that BHA and BHT could be toxic, causing concerns among the consumers with
regard to the safety of such synthetic antioxidants, leading to increased attention of the
industry in finding natural and safer alternatives for antioxidants (Wanasundara and
Shahidi, 1998).
Spices and herbs such as oregano, thyme, dittany, marjoram, lavender, and rosemary have
limited applications in spite of their high antioxidant activity, as they impart a characteristic
herbal flavor to the food, and deodorization steps are required (Moure et al., 2001).
Polyphenolic compounds that contribute to the sensory and organoleptic properties of fruits
and vegetables (color, taste, astringency), can affect the functional and nutritional values of
proteins by binding to them, reducing the overall nutritional values of foodstuffs. Besides
the formation of strong complexes with dietary proteins, polyphenols have other
undesirable effects in the digestion of foods such as binding to salivary proteins and
digestive enzymes. Polyphenol polymerization, due to autoxidation, is responsible for color
loss in processed vegetables. Therefore, the potential of tannins to diminish nutrient

47
availability should be considered when using them as biological antioxidants (Moure et al.,
2001).
Although the current understanding of the role of natural antioxidants is derived from in
vitro studies, their biological effects have not been studied rigorously in animal models and
humans. The results obtained from in vitro investigations show many contradictions,
because AOA depends strongly on many factors, including the presence of oxygen and
metals, pH and polarity of the medium, and temperature. Thus there is a need to standardize
AOA assays (Aruoma, 2003). Direct observation of antioxidant reactions in living
systems, generally, is not possible because of the low concentrations of the reactants
involved, and because of the rapid rates of oxidant-antioxidant reactions (Halliwell, 2009).
Despite decades of research, it is currently impossible to state what are the contributions of
fruits and vegetables to the health-promoting effects through antioxidant protection. In
particular, it is unclear whether flavonoids and other plant polyphenols have any direct
antioxidant effect in vivo. One challenge is to measure the low levels of oxidized products
in the presence of a vast excess of unpertubed biomolecules in human tissues and body
fluids (Halliwell, 2009).
Phenolic compounds could be both antioxidants and pro-oxidants in the gastrointestinal
tract. In practice, there may be little difference in the results of these various actions.
However, increased cellular antioxidant protection can be achieved either by supplying
more antioxidants or by a mild degree of pro-oxidant stress, leading to upregulation of
endogenous antioxidant defense systems (Halliwell, 2009).
While phenolic compounds are putative antioxidants, the radicals emenating from their
radical scavenging activity may exhibit pro-oxidant activity as well. In practice, there may
be little difference in the results of these various actions. However, increased cellular
antioxidant protection can be achieved either by supplying more antioxidants or by a mild
degree of pro-oxidant stress, leading to upregulation of endogenous antioxidant defense
systems (Halliwell, 2009).

48
The failure of antioxidant in demonstrated benefits in humans is debatable. First, in some
diseases, reactive oxygen species may not actually be important. Second, intervention trials
often tested antioxidants on subjects who already had extensive pathology, where
preventative actions may be too late. Third, the doses used may be wrong. For cancer and
several neurodegenerative diseases, the evidence supporting a role for oxidative damage in
their progression is compelling (Halliwell, 2009), but the evidence is mixed for
atherosclerosis and several other diseases. Recently it is very interesting to note the
interplay of factors causing neuronal cell death in Alzheimer's and Parkinson's diseases,
including mitochondrial dysfunction, oxidative damage, and defects in the turnover of
abnormal proteins (especially affecting the proteasome system). This line of thinking
ensued the discovery that inhibition of proteasome function can lead to cellular oxidative
stress. For chronic inflammatory diseases, the overall role of reactive oxygen species, both
in their origin and progression is less clear, nonetheless the reactive oxygen species may
help explain why such diseases also increase cancer risk. Ironically, these species can
sometimes be anti-inflammatory, e.g., by modulating lymphocyte function. Hence the use
of antioxidants to treat chronic inflammatory diseases may not be as simple as it originally
sounded (Halliwell, 2009).

49
1.4 Plants as a source of antimicrobials
1.4.1 Why antimicrobials from plant sources?
Microbial and plant products occupy the major part of the antimicrobial compounds
discovered until now (Balouiri et al., 2016). The folk medicines and alternative medicines
which have been prevalent for hundreds of years prove a point that it is possible that nature
might have enough for us to offer so that we might not need to turn to synthetic
antimicrobials at all (Dorai, 2012). In fact, plants synthesize over 100,000 small-molecular
compounds, many of which have antimicrobial activity (Lewis and Ausubel, 2006).
Isolation of phytochemicals with potential antimicrobial activities are being explored as
potential therapeutic agents to fight infections. Naturally occurring phytochemicals,
predominantly secondary metabolites, are the source of the many of drugs in clinical use
today (Taylor, 2013).
After the revolution in the “golden era”, when almost all groups of important antibiotics
(tetracyclines, cephalosporins, aminoglycosides and macrolides) were discovered and the
main problems of chemotherapy were solved in the 1960s. As history repeats itself these
days and these exciting compounds are in danger of losing their efficacy because of
increased incidences of microbial resistance (Brown and Wright, 2016). Currently, its
impact is considerable with treatment failures associated with multidrug-resistant bacteria,
and it has become a global concern to public health (Balouiri et al., 2016). Phytochemicals
have already demonstrated their potential as antibacterials when used alone, and as
synergists/potentiators of less effective antibacterial products. Moreover, studies have
demonstrated that phytochemicals can be used, where bacterial resistance mechanisms
make conventional treatments ineffective and also in the control of biofilm (Simoes et al.,
2009). Phytochemicals can act through different mechanisms than conventional antibiotics,
and therefore, could be of use in the treatment of resistant bacteria (Abreu et al., 2012).
Nowadays, consumers are increasingly aware of diet-related health problems, therefore
demanding natural ingredients which are expected to be safe and health-promoting. They
want organically grown and manufactured foods containing minimal synthetic
preservatives (Odonovan, 2002; Yeung, 2001). Because of greater consumer awareness and
50
concern regarding synthetic chemical additives, foods preserved with natural additives are
becoming popular. This has led researchers and food processors to look for natural food
additives with a broad spectrum of antimicrobial activity (Bhalodia and Shukla, 2011;
Marino, 2001).
Agricultural industry produces billions of tons of residues in non-edible portions derived
from the cultivation and processing of a particular crop. Waste and by-products can cause
disposal problems, pollution, management and economic problems worldwide (Santana-
Méridas et al., 2012). Food grade agro-industrial waste is often utilized as animal feed or as
fertilizer. Fruit and vegetable wastes and by-products can range from pomace (leftovers
after pressing), to vegetable trimmings and dicarded whole fruits and vegetables
(Wijngaard et al., 2009), and their utilization would add profit value to the by-products. It
could also help save energy and money that go into research and development costs for
synthetic food additives (Kabuki, 2000; Mirabella et al., 2014).
1.4.2 Major groups of phytochemicals with antimicrobial properties
Nature antimicrobial compounds are present in abundance in fruits and vegetables, and they
are present in all parts of the plant such as bark, stalks, leaves, fruits, roots, flowers,
pods, seeds, stems, latex and hull (Amarowicz, 2009; Amarowicz et al., 2005; Ramos,
2006; Ramos et al., 2005). The antimicrobial compounds in plant materials are commonly
found in leaves (rosemary, sage, basil, oregano, thyme, and marjoram), flowers or buds
(clove), bulbs (garlic and onion), seeds (caraway, fennel, nutmeg, and parsley), rhizomes
(asafetida), fruits (pepper and cardamom), or other parts of plants (Tiwari et al., 2009).
Plants have an almost limitless ability to synthesize aromatic substances, most of which are
phenols or their oxygen-substituted derivatives (Cowan, 1999; Naidu and Davidson, 2000).
Most are secondary metabolites, of which at least 12,000 have been isolated, a number
estimated to be less than 10 % of the total (Cowan, 1999). In many cases, these substances
serve as plant defense mechanisms against predation by microorganisms, insects, and
herbivores. Some, such as terpenoids impart to plants their odors; while others such as
anthocyanins, betalains, carotenoids and tannins) are responsible for plant pigmentation.
Many compounds are responsible for plant flavour (e.g., the terpenoid capsaicin from chilli
pepper), and some of the same herbs and spices used by humans to season food yield useful

51
medicinal compounds. Useful antimicrobial phytochemicals can be divided into several
categories, described and summarized by Cowan (1999) in Table 1.5.
Secondary metabolites produced by plants constitute a major source of bioactive
substances. The scientific interest in these metabolites has increased today with the search
of new therapeutic agents from plant sources. Major components with antimicrobial activity
found in plants, herbs, and spices are phenolic compounds, terpenes, aliphatic alcohols,
aldehydes, ketones, acids, and isoflavonoids (Davidson et al., 2005). Nonphenolic
constituents such as allyl isothiocyanate and garlic oil are also effective against gram-
negative bacteria and fungi (Tiwari et al., 2009).
Plants, herbs, and spices as well as their derived essential oils, and isolated compounds
from them such as eugenol, carvacrol, thymol are known to inhibit various metabolic
activities of bacteria, yeast, and molds (Deba et al., 2008; Djenane et al., 2012; Ichrak et al.,
2011; Jia et al., 2010; Joshi et al., 2010). Antimicrobial activity of essential oils depends on
the chemical structure of their components and on their concentration. Katayama and Nagai
(1960) recognized eugenol, carvacrol, thymol, and vanillin as active antimicrobial
compounds in essential oils. Oils with high levels of eugenol (allspice, clove bud and leaf,
bay, and cinnamon leaf), cinnamamic aldehyde (cinnamon bark and cassia oil), and citral
(lemon myrtle, Litsea cubeba, and lime) are typically strong antimicrobials. In mustard and
horse radish, precursor glucosinolates are converted by enzyme myrosinase to yield a
variety of isothiocynates including the allyl form, which are strong antimicrobial agents
(Katayama and Nagai, 1960).
Simple phenols and phenolic acids. Some of the simplest bioactive phytochemicals
consist of a single substituted phenolic ring. Cinnamic and caffeic acids are common
representatives of a wide group of phenylpropane-derived compounds. The mechanisms
thought to be responsible for phenolic toxicity to microorganisms include enzyme
inhibition by the oxidized compounds, possibly through reaction with sulfhydryl groups or
through more non-specific interactions with the proteins (Cowan, 1999).

52
Table 1.5 Major classes of antimicrobial compounds from plants
Class Subclass Mechanism
Phenolics
Simple phenols Substrate deprivation, membrane disruption
Phenolic acids Substrate deprivation, membrane disruption
Quinones Bind to adhesins, complex with cell wall, inactivate
enzymes
Flavonoids Bind to adhesins
Flavones Complex with the cell wall, inactivate enzyme, inhibit
HIV reverse transcriptase
Flavonols Complex with the cell wall, inactivate enzyme, inhibit
HIV reverse transcriptase
Tannins Bind to proteins, Bind to adhesions, Enzyme inhibition,
substrate deprivation, complex with cell wall, membrane
disruption, metal ion complexation
Coumarins Interaction with eukaryotic DNA (antiviral activity)
Terpenoids,
essential oils
Membrane disruption
Alkaloids Intercalate into cell wall and/or DNA
Lectins and
polypeptides
Block viral fusion or adsorption, form disulfide bridges
(Cowan, 1999)
Quinones. A quinone is a class of organic compounds that are formally "derived from
aromatic compounds [such as benzene or naphthalene] by conversion of an even number of
–CH= groups into –C(=O)– groups with any necessary rearrangement of double bonds",
resulting in "a fully conjugated cyclic dione structure (IUPAC, 2009). Quinones are
aromatic rings with two ketone or carbonyl groups. They are ubiquitous in nature and are
highly reactive. These compounds, being colored, are responsible for the browning
reaction in cut or injured fruits and vegetables, and are intermediates in the melanin
synthesis pathway. Quinones are known to complex irreversibly with nucleophilic amino
acids in proteins (Stern, 1996), often leading to inactivation of proteins and loss of their
function.
Flavonoids: Flavones, flavonoids, and flavonols. Flavones are a class of flavonoids
containing one carbonyl group (as opposed to the two carbonyls in quinones). The addition
of a 3-hydroxyl group yields a flavonol . Since they are known to be synthesized by plants
in response to microbial infection, it should not be surprising that they have been found to
be effective antimicrobial substances in vitro against a wide array of microorganisms. Their
53
activity is probably due to their ability to complex with extracellular and soluble proteins
and to complex with bacterial cell walls similar to quinones. More lipophilic flavonoids
may also disrupt microbial membranes (Cowan, 1999).
Tannins.“Tannin” is a general descriptive name for a group of polymeric phenolic
substances capable of tanning leather or precipitating gelatin from solution, a property
known as astringency. Many human physiological activities, such as stimulation of
phagocytic cells, host-mediated tumor activity, and a wide range of anti-infective actions,
have been assigned to tannins (SantiestebanLópez, 2007). One of their molecular actions is
to complex with proteins through so-called secondary bonding such as hydrogen bonding
and hydrophobic effects. Thus, their mode of antimicrobial action, may be related to their
ability to inactivate microbial adhesins, enzymes, cell envelope transport proteins, etc. They
can also complex with polysaccharides (Cowan, 1999; SantiestebanLópez, 2007).
1.4.3 Modes of action of antimicrobials
Antimicrobials can fatally affect a microbial cell in various ways by specifically and
selectively killing or damaging cellular structures and their functions. Much of knowledge
regarding the mechanisms of action of antimicrobials is derived from studies on antibiotics.
Various mechanisms have been proposed by which antibiotics act with different
specificities with regards to target sites on or in microbial cells (Kohanski et al., 2010).
Figure 1.17 summarizes the general mechanisms of antibiotics against bacterial cell as well
as the major cellular targets (Neu H. C., 1996). Antibiotic acts by interferring with: (1) cell
wall synthesis, (2) plasma membrane integrity, (3) nucleic acid synthesis, (4) ribosomal
function, and (5) folate synthesis. Cell wall synthesis is inhibited by ß-lactams, such as
penicillins and cephalosporins, which inhibit peptidoglycan polymerization, and by
vancomycin, which combines with cell wall substrates. Polymyxins disrupt the plasma
membrane, causing leakage. The plasma membrane sterols of fungi are attacked by
polyenes (amphotericin) and imidazoles. Quinolones bind to a bacterial complex of DNA
and DNA gyrase, blocking DNA replication. Nitroimidazoles damage DNA. Rifampin
blocks RNA synthesis by binding to DNA directed RNA polymerase. Aminoglycosides,
tetracycline, chloramphenicol, erythromycin, and clindamycin interfere with ribosome

54
function. Sulfonamides and trimethoprim block the synthesis of the folate needed for DNA
replication.
(Neu H. C., 1996).
Figure 1.18 Mechanisms of action of antimicrobial agents. PABA, paraminobenzoic acid; DHFA,
dihydrofolic acid; THFA, tetrahydrofolic acid
Although there are dozens of plant secondary metabolites that show activity in the micro to
sub-micro molar range, at least against Gram-positive species, surprisingly little is known
about their mechanisms of action (Lewis and Ausubel, 2006). Antimicrobials from plant
sources can affect the structure and function of some of the biomolecules. Although plant
antimicrobials can be expected to affect microbial cell organelles such as such as cell
membrane, interference with DNA/RNA function and cell metabolism, and modification of
cell environment, the available information suggests that cell membranes may be the
primary target with disruption of their integrity, since the effectiveness of antimicrobial
activity of these compounds generally increases with their lipophilicity (Daglia, 2012b;
Hendrich, 2006; Kanjee and Houry, 2013; Kohanski et al., 2010). One complication that
arises in establishing antimicrobial mechanisms of plant extracts is that they are a mixture
of compounds, and methodologies commonly used to elucidate the mode of action of a pure
compound are less useful. The addition of phytochemical compounds to a medium can
alter the conditions of the milieu such as pH, depending on their solubility in water
(hydrophilicity), their concentration, and temperature condition of the antimicrobial assay.

55
However, determination of the physico-chemical properties of phytochemicals related to
antimicrobial activity may shed some light on their antimicrobial potential. They may
include: capacity to acidify or alkalinize microbial cells (acid dissociation constant), lipid
solubility (anesthetics), water solubility, surface activity and ability to form complexes with
proteins, metal binding capacity, and redox potential (e.g., oxygen scavenging ability or
ability to generate reactive oxygen groups) (Kanjee and Houry, 2013; Kohanski et al.,
2010). The polycationic nature of some of the antimicrobials can also contribute to
antimicrobial activity by binding to cellular membrane and causing membrane dysfunction
(Sikkema, 1995).
Some examples of mechanisms of action of natural compounds are shown in Table 1.5.
Various mechanisms have been elucidated in detail. For example, tea tree oil, which is
essentially a terpenic hydrocarbon. It is known that hydrocarbons can partition
preferentially into biological membranes and disrupt their vital functions. Tea tree oil has
been shown to be effective against a plethora of micro-organisms (Carson, 2006). The
major antimicrobial constituent of garlic and onion is allicin, along with several other
sulfur-containing compounds (Barone and Tansey, 1977).
The possible mechanism of action for phenolic compounds is not very clear. The effect of
phenolic compounds is generally concentration-dependent. At low concentrations, phenols
affect enzyme activity, particularly those associated with energy production; while at high
concentrations, they cause protein denaturation (Bajpai et al., 2008). The antimicrobial
effect of phenolic compounds may be, in part, due to their ability to alter microbial cell
permeability, thereby accentuating the loss of biomolecules and ions from the interior
(Dorman and Deans, 2000). They could also interfere with membrane function such as
electron transport, nutrient uptake, protein, nucleic acid synthesis, and enzyme activity
(Bajpai et al., 2008), and interact with membrane proteins, perturbing membrane structure
and functionality (Dorman and Deans, 2000).
The antimicrobial activity of isothiocynates derived from broccoli, onion and garlic is
related to the inactivation of extracellular enzymes through oxidative cleavage of disulfide
bonds and the formation of the reactive thiocyanate radical was proposed to mediate the
antimicrobial activity (Delaquis and Mazza, 1995). Carvacrol, (β)-i-carvone, thymol, and

56
trans-cinnamaldehyde are reported to decrease the intracellular ATP (adenosine
triphosphate) content of E. coli O157:H7 cells, while simultaneously increasing
extracellular ATP, indicating that the disruptive action of these compounds occurs on the
plasma membrane (Helander et al., 1998a).
The accumulation of lipophilic compounds in the (cytoplasmic) membrane of
microorganisms has also considerable effect on the structural and functional properties of
the membrane. The numerous observations of toxic effects of terpenes, and phenols can be
explained largely by the interactions of these compounds with the membrane and with
membrane constituents. As a result of accumulation of lipophilic molecules, the membrane
loses its integrity, causing increased permeability to protons and ions. In addition, it has
been observed that proteins embedded in the membrane are also affected (Carson, 2006;
Cox, 2001; Sikkema, 1995).
1.4.4 Bacterial resistance to antimicrobials and mechanisms
Infectious diseases are still one of the most important causes of human mortality. The quest
for novel effective antimicrobial agents from natural products has gained much momentum
particularly in the health care sector, where microbial resistance is increasing at an alarming
rate and offering new challenges (Aumeeruddy-Elalfi et al., 2016). The overuse, underuse
and general misuse of antibiotics are major factors in the emergence and dissemination of
resistance.
Bacteria compete against each other for food resources, by manufacturing lethal
compounds that they direct against each other. Other bacteria, to protect themselves, evolve
defense against that chemical attack. By this way, penicillin-the first antibiotic discovered
in 1928 by Alexander Fleming, and the bacterial resistance to penicillin occurred by 1945,
just 4 years after its mass production (Brown and Wright, 2016).
The major mechanisms of bacterial resistance to antimicrobials are depicted in Figure 1.18
(Abreu et al., 2012) and include: (1) active drug efflux systems from the cell via a
collection of membrane-associated that effectively remove toxic compounds from cells; (2)
mutations resulting in altered cell permeability; (3) enzymatic degradation of antimicrobials

57
by the synthesis of enzymes that either modify or inactivate selectively, targeting and
destroying antimicrobial compounds; and (4) alteration/modification of the target site, e.g.,
through mutation of key binding elements, such as ribosomal RNA.
By understanding the mechanism of resistance to antimicrobial, there seems to be
considerable potential to develop at least three different types of antibacterials from plants:
traditional antibiotics, multidrug-resistance (MDR) inhibitors and compounds that target
bacterial virulence (Lewis and Ausubel, 2006).
(Abreu et al., 2012)
Figure 1.19 Mechanisms of bacterial resistance to antimicrobials
1.4.5 In vitro methods to evaluate plant extracts for antimicrobial activity
A variety of methods are currently in use for evaluation and/or screening for in-vitro
antimicrobial activity of plant extracts. These methods have been traditionally categorized
as qualitative and quantitative assays. They can also be classified as kinetic and end-point
methods, depending upon whether the antimicrobial compound is being evaluated for its
efficiency or potential. The most commonly known methods are the disk or well diffusion
and broth or agar dilution methods. For a more detailed investigation time kill assays,
Minimum inhibitory concentration (MIC), minimum bactericidal concentration (MBC)
estimation are also carried out (Balouiri et al., 2016).

58
1.4.5.1 Diffusion method
Since its inception the Kirby Bauer diffusion method has been extensively used. Clinical
and Laboratory Standards Institute (CLSI) regularly publishes standards of testing for
bacteria, yeasts and fungi (Jorgensen and Ferraro, 2009). In this method, agar plates are
inoculated with a standardized inoculum of chosen test strain. Then depending upon if it’s a
disc diffusion or well diffusion method, either paper discs (4-6mm diameter) saturated with
the extract are placed on the agar surface or wells are bored on the surface which are filled
with the extract (20-100µL). The antimicrobial agent radially diffuses into the agar surface
inhibiting the bacteria, and thereby forming a clear “zone of inhibition”. The zone of
inhibition is measured in mm excluding the well or disc diameter. It is a simple, low cost
and relatively fast method, which can handle a large number of samples easily. However, it
is important to point out the qualitative nature of this method, which limits its application
as a screening method.
1.4.5.2 Dilution method
Dilution methods are appropriate once the antimicrobial compounds have been screened
and their MIC, MBC values need to be estimated. Either agar dilution or broth dilution can
be used to estimate the quantitative effect of the antimicrobial compound on bacteria and
fungi. Similar to diffusion methods, CLSI and EUCAST regularly update the standards and
guidelines for dilution methods as well (NCCLS, 1991; Wiegand et al., 2008).
1.4.5.3 Broth dilution
A micro or macro dilution is the most commonly used antimicrobial susceptibility test
(NCCLS, 1991). The assay involves testing a serially diluted antimicrobial compound (e.g.,
2, 4, 8, 16 µg/mL) in liquid medium dispensed in tubes containing a minimum volume of 2
mL (macro) or with smaller volume using a 96 wells microtiter plate (micro). Thereafter,
each tube or well is inoculated with a standardized inoculum of a microbial test strain,
which had previously been adjusted to 0.5 McFarland scale. After inoculation, the setup
(tube/plate) is incubated as per growth condition of the test strain. The resulting MIC value
is the lowest concentration of the antimicrobial compounds, which completely inhibit
microbial growth. The tubes/wells for this purpose can be observed visually or through a
turbidity meter (Wiegand et al., 2008).

59
1.4.5.4 Agar dilution
The method is similar to broth dilution with the difference being that a known, serially
diluted antimicrobial compound is incorporated into molten agar before being poured in the
petri. Thereafter, the agar surface is inoculated with a standardized and known
concentration of microbial inoculum. The MIC endpoint is the lowest concentration of
antimicrobial agent that completely inhibits growth of the test strain. This technique is
useful for both bacteria and fungi, and especially, when a large number of target organism
need to be tested against (NCCLS, 1991; Wiegand et al., 2008).
1.4.5.5 Time kill assay
Time kill assay is a dynamic antimicrobial assay, and it helps to understand the direct
interaction between the antimicrobial compound and the microorganism in a time
dependent or concentration dependent manner. The CLSI-M26-A document provides easy
to follow assay guidelines for time kill assay (Jorgensen and Ferraro, 2009). The
antimicrobial compound is tested at 0.25xMIC and 1xMIC concentration in a growth
medium against a bacterial suspension of minimum log 5 CFU/mL. The incubation is
carried out for progressively increasing durations (4, 6, 8, 12, 16, 18, 24 hours). The tubes
containing the bacterial suspension and the antimicrobial compound are then plated to
enumerate the bacteria. The resulting bacterial population is compared against a control to
calculate the minimum bactericidal concentration MBC. This methods is reliable and
reproducible and correlates well with other antimicrobial susceptibility assays (Li et al.,
1993).
1.4.6 Research trends and challenges of antimicrobials from plant products
The need for natural antimicrobials is very pertinent with the growing awareness of the
consumers about synthetic additives in foods and with the rise of antibiotic resistance in the
health sector. Understandably, there is increasing number of studies and reports on
antimicrobials from microbial sources (bacteriophages, bacteria, algae and fungi)
(Challinor and Bode, 2015), and plant products (essential oils, phytochemicals and
bioactive compounds from fruit and vegetable by-products) (Guil-Guerrero et al., 2016;
Lewis and Ausubel, 2006; Munuswamy et al., 2013; Taylor, 2013).
60
Essential oils (EO) are complex natural mixtures of biologically active substances can have
therapeutic use in the treatment of a panoply of human diseases (Aumeeruddy-Elalfi et al.,
2016). EO of a large number of plants possess useful biological and therapeutic activities,
and are extensively used in the preparation of pharmacologic drugs (Djenane et al., 2012;
Joshi and Mathela, 2012; Prakash et al., 2010; Taga et al., 2012). Many studies have
showed that antimicrobial activity of essential oils (EO), phytochemicals from plants,
herbs, and spices depends not only on the extraction method but also on geographic zone of
cultivation (Rather et al., 2012; Shi et al., 2010).
Unfortunately, many of the published reports on the application of plant extracts as
antimicrobials have been accomplished in model and laboratory systems, and there are few
studies that have been carried out in real foods (Tiwari et al., 2009). The essential oils of
spices and plant extracts as well as their major components are more effective in
microbiological media than when evaluated in real foods (Davidson et al., 2005). In most
cases, the concentrations of of those natural substances required to inhibit a microorganism
in food systems are significantly higher than those found to be inhibitory in model systems;
and hence, it is necessary to use higher concentrations for their applications in real foods,
but it often compromises the sensory quality of the foods. Consequently, few of the
applications of phenolic antioxidants as antimicrobials have been successful (Maqsood et
al., 2013). This reduction in the effectiveness observed in vivo represents an important
limitation to the use of EO and phenolic antioxidants as antimicrobial agents in foods
(Davidson et al., 2005).
Moreover, the interactions among phenolic compounds and proteins and lipids could
explain also the reduction of the antimicrobial effect of the plant extracts, where the major
constituents are typically phenols. The chemical complexity of plant extracts, often
undocumented toxicity, poor water solubility and the lack of standardization may be
responsible for the apparent lack of industrial interest in phytochemicals. Difficulties in
access and supply, the inherent slowness of working with natural products and the costs of
collection, extraction and isolation are additional limitations (Abreu et al., 2012).
Plant extracts compounds from medicinal herbs and dietary plants possess a range of
bioactivities like - antibacterial, antifungal, antiviral, antimutagenic and anti-inflammatory

61
activities. However, limiting the use of natural antimicrobials is the fact that they are of low
potency and require to be used in high quantity, which can detrimental for the organoleptic
properties of food (Davidson et al., 2013; Lucera et al., 2012). For example, the
concentrations of extracts from Cirsium spp required to control and/or to inhibit
successfully Staphylococcus aureus, Bacillus subtilis and Pseudomonas aeruginosa was
found at 1.56–50.0mg/mL. Concentrations of 1.56–25.0 mg/mL for Gram- positive bacteria
and that for Gram-negative (12.5–50.0 mg/mL) were found to be too high to be used in
foods (Borawska et al., 2010).
Several studies have proposed that natural compounds in combination with antibiotics and
other antimicrobials are a new strategy for developing therapies for infections caused by
bacterial species, and that natural plant products can potentiate their activity (Borawska et
al., 2010; Holloway et al., 2011; Jayaraman et al., 2010; Worthington and Melander, 2013).
The use of combinations of EOs and their isolated components are proposed as new
approaches to increase the efficacy of EOs in foods, taking advantage of their synergistic or
additive effects (Bassole and Juliani, 2012). The use of bacterial resistance modifiers such
as efflux pump inhibitors, derived from natural sources mainly from plants can suppress the
emergence of MDR strains (Stavri et al., 2007). Plants extract have also been studied as
sources of new co-therapeutics and resistance-modifying agents (Abreu et al., 2012).
1.4.7 Recent literature on bioactivities of some specific fruits and vegetables - A
random walk
There is growing interest in exploring bioactivities of edible plant materials and their by-
products, herbs, spices and medicinal plants as seen by increasing number of scientific
reports appearing in the literature recently. While some studies have focused mainly on the
bioactivity of plant extracts, some have determined the phytochemical composition of the
extracts and attempted to relate it to their bioactivity. Again, most of studies on fruit and
vegetable extracts have examined antioxidant and antimicrobial activities, while some have
evaluated a range of activities including anti-cholesterolemic, anti-inflammatory, anti-
cancer, analgesic, anti-aging and antiviral activities. Some selected studies reporting on
phytochemical composition and biological activities of fruit and vegetable extracts are
summarized in Table 1.6. Red onion and green pepper exhibited a range of bioactivities;
62
bluberry fruit, rose mary and cranberry appear to be promising sources of antioxidants,
while mangosteen, sea buckthorn and pomgrenate were shown to be good sources of
antimicrobials. These studies consistently support the idea that fruit and vegetables are
potentially a vast reservoir of antioxidant and antimicrobial compounds. Additionally, the
principle compounds responsible for the AO-AM activity in the plant-based or herbal
extractions also contribute to variety of health benefits (Gao et al., 2013; Johanningsmeier
and Harris, 2011; Slavin and Lloyd, 2012; Wang et al., 2011). Although plant-sourced
compounds show bioactivity, a high concentration of the extracts is required in most cases
(Seydim and Sarikus, 2006; Vegara et al.; Yai). For example, the MIC of plant extracts
required to successfully inhibit bacteria in foods ranged (1.56–25.0 mg/mL for gram
positive), and, (12.5–50.0 mg/mL for Gram negative bacteria) (Borawska et al., 2010).
Furthermore, it is evident that factors such as geographical zone of habitation, time of
collection of plants, maturity of the plants affect the levels of phytochemical constituents,
and therefore, their bioactivity (Rathee et al., 2006). In addition, the solvent used for
extraction appears to have a significant impact, since a particular class of phytochemicals is
extracted depending on the nature of solvents. In view of the aforementioned factors and a
lack of standardized testing and screening method for plant-sourced compounds, a
reasonable comparison of results becomes difficult (Halliwell, 2009).

63
Table 1.6 Phyto-chemical composition and bioactivities of fruit and vegetable extracts
Product Extraction, analytical and assay methods
Phyto-compounds present Potential activity Reference
Anise - Hot water and ethanol extraction - Total phenolic compounds -Reducing power assay, superoxide anion scavenging activity, free radical scavenging activity, scavenging of hydrogen peroxide - Zone inhibition method
Anethole, eugenol pseudoisoeugenol methylchavicol, coumarins, scopoletin, umbelliferon, terpene hydrocarbons, polyenes and polyacetylenes
Antioxidant, antimicrobial
(Faculty, 2003)
Asparagus (by-product)
-Ethanol extraction -HPLC -DPPH
Saponins, flavonoids, and hydroxycinnamates,
-sitosterol
Antioxidant
(Fuentes-alventosa et al., 2009)
Broccoli -Solvent extraction (methylene chloride, methanol) -GC-MS -DPPH, reducing power assay, superoxide anion radical and hydroxyl radical assays
Flavones, ascorbic acid, quecetin, larciresinol, pinoresinol,
secoisolariciresinol, -carotene, -
carotene, -tocopherol,
campestanol, -sitosterol, -sitostanol, glucoiberin, glucorapinin, glucoalyssin
Antioxidant
(Yuan et al., 2010)
Black berry (leaves)
-Solvent extraction (methanol) - HPLC - TEAC, ABTS - MBC
Ellagic acid, quercetin, rutin, ferulic acid, gallic acid, caffeic acid, kaemferol
Anti-inflammatory, antiviral and antimicrobial, antioxidant
(Martini et al., 2009)
Blue berry fruit
- Acetone extraction - Total phenolic content -Oxygen radical scavenging activity, hydroxyl radical scavenging activity, DPPH, H2O2 assay, , pH differential method
Phenolics, anthocyanins, flavanols, hydroxycinnamic acid, ascorbic acid
Antioxidant and antimicrobial (Wang et al., 2010)
Cabbage - Methanol extraction - Free radical scavenging activity-DPPH and ABTS radicals
Flavanols, sterols, glucosinolates Antioxidant
(Bartoszek et al., 2008)
Carrot - Solvent extraction (water and alcohol) - HPLC-DAD -MIC
Alkaloids, naphtho- and anthraquinones, terpenoids, saponins, flavones, flavonols, phenolic acids derivatives, lactones, isocourmarin(6-methoxymellein), polyacetylenes (falcarionl and falcarindiol)
Antimicrobial
(Vegara et al., 2011)
Cherry -Solvent extraction: (acetone/water/acetic acid (70:29:1, v/v/v) -Total phenolic content, HPLC MS/MS, -DPPH radical scavenging activity
Myricetin, quercetin, catechins, flavonols, and proanthocyanidins
Antioxidant
(Bonat et al., 2011)
Coriander - Hydrodistillation extraction - Total phenolic content, GC-MS
- DPPH, reducing power assay, -carotene/ linoleic acid bleaching assay
Linalool, pinene, phellandrene, eucalyptol, linalool, borneol, β-caryophyllene, citronellol, geraniol, thymol, linalyl acetate, geranyl acetate, caryophyllene oxide, elemol and methyl heptenol
Antioxidant
(Neffati et al., 2011)
Cranberry -Water extraction and ethanol extraction -Total soluble phenolic assay, HPLC, -DPPH, -Plate count
Proanthocyanidins, flavanols, quercitin, ellagic acid, rosmarnic acid, resveratrol
Antioxidant, antimicrobial (Vattem et al., 2004)

64
Table 1.6 Phyto-chemical composition and bioactivities of fruit and vegetable extracts (Continued)
Product Extraction, analytical and assay methods Phyto-compounds
present Potential activity
Reference
Fenugreek -Solvents and water extraction -Lipid peroxidation inhibitory activity, DPPH scavenging activity, FRAP - MIC, disc diffusion method
Polyphenols, flavonoids Antioxidant, antimicrobial (Premanath,
2011)
Grape (seeds)
- Hot water (80-90OC) extraction
--carotene, linoleic acid peroxidation assay, FRAP, DPPH - MIC
Stilbenes, catechins, epicatechins, and gallic acid, and the polymeric and oligomeric procyanidins
Antioxidant, antimicrobial (Adamez et al.,
2012)
Green pepper
- Methanol extraction -GC-MS, total polyphenols estimation, - DPPH, ABTS radical scavenging, ß-carotene bleaching assay
Carotenoids, terpenoids, alkaloids, flavonoids, lignans, simple phenols and phenolic acids,3 4 dihydroxyphenyl ethanol glucoside,3 4-dihydroxy 6 (N-ethylamino) benzamide
Antioxidant, anti- inflammatory, anti-cancer, anti-aging, anti-bacterial
(Chatterjee et al., 2007)
Kale -Soxhlet extraction (n-hexane and petroleum ether) - LC-MS/MS, total phenolic content -DPPH -Zone inhibition assay
Ferulic and caffeic acids, glucosinolates, flavonoids, phenolics
Antioxidant, antimicrobial (Ulrichova and
Strnad, 2008)
Kiwi - Water extraction -Total phenolic contents assay, total flavonoid content by calorimetric assay, LC-MS/MS, - DPPH, ABTS, Fe3+ reducing activity, cupric ion (Cu2+) reducing-CUPRAC assay, ferrous ion (Fe2+) chelating activity, superoxide anion radical scavenging activity
α-tocopherol), ascorbate acid, phenolics, carotenoids
Antioxidant
(Bursal and Galain, 2011)
Lettuce - Methanol extraction and water extraction - Total phenolic content, - DPPH, reducing power assay - MIC, cyto-pathic effect assay, cell toxicity assay
Flavonoid, tannins, polyphhenols
Antioxidant, antiviral, antibacterial, analgesic, anti-inflammatory
(Edziri et al., 2011)
Lychee seeds
- Ethanol extraction - Total phenolic content assay, fatty acid profile by gas chromatography DPPH
Flavonoids, citric acid, ascorbic acid, tocopherols, carotenoids
Antioxidant, serum fatty acid profile
(Maria et al., 2011)
Mango - Solvent extraction (methanol) - Total phenolic content - DPPH, FRAP
Anacardic acid, phenolic compounds, carotenoids, ascorbic acid
Antioxidant
(Palafox-carlos et al., 2012)
Mangosteen - Ethanol extraction -Total phenolic and flavonoid content assay - DPPH - MIC, MBC,
Prenylated and oxygenated xanthones, essential oils, tannins, flavonoids
Antioxidant, antimicrobial (Pothitirat and
Traidej, 2009) (Yai, 2010)
Orange (peel and juice)
- Hydro-distillation and methanol extraction -DPPH, reducing power and inhibition of lipid
peroxidation using -carotene–linoleate model system in liposomes, TBARS assay in brain homogenates
Flavanone glycosides, hydroxycinnamic acids,vitamin C, and carotenoids
Antioxidant
(Guimaraes et al., 2010)
Pineapple - Ethyl acetate extraction - Total phenolics, total flavonoids - Lipid peroxidation β-carotene-linoleate lipid model system, DPPH
Flavonoids, isoflavones, flavones, anthocyanins, catechins and other phenolics
Antioxidant
(Hossain and Rahman, 2011)

65
Table 1.6 Phyto-chemical composition and bioactivities of fruit and vegetable extracts (Continued)
Products Extraction, analytical and assay methods
Phyto-compounds present Potential activity
Reference
Pomegranate - Petroleum ether extraction - Total phenolic content assay, HPLC - DPPH, TEAC, - agar-well diffusion method
Polyphenols, ascorbic acid, tannins, flavonoids
Antioxidant, antimicrobial (Ferrara et al.,
2009)
Raspberry - Solvent extraction (acetone, methanol) - Total phenolic content, HPLC, - ORAC, DPPH, pH differential method
Flavonoids, phenolic acids, stilbenes, and procyanidins, cyanidins, anthocyanins, ellagitannins, phenolic acids, conjugates of ellagic acid and quercetin
Anti-inflammation, and anti-proliferation, antioxidant
(Zhang et al., 2010)
Red onion - Methanol extraction -HPLC, MS/MS,
--carotene and linoleic acid coupled reaction method, FRAP, DPPH, hydroxyl ions scavenging
Polyphenols, anthocyanins, flavonoids, quercetin, kaempferol, glycosides, tocopherol, carotenoids, angiotensin, melatonin, alliins (sulphur compounds), enzymes (superoxide dismutase, glutathione peroxidase and catalase)
Antimicrobial, antispasmodic, anticholesterolemic, hypotensive, hypo-glycemic, anti-asthmatic, and anti-cancer activities, antioxidant
(Dini et al., 2008), (Prakash et al., 2007)
Rhubarb - Solvent extraction (chloroform and methanol) - Total phenolic content, total flavonoids content
- DPPH, -carotene-bleaching assay, Free radical scavenging activity, Cupric reducing antioxidant capacity (CUPRAC), reducing power, metal chelating activity
Flavonoids, stilbenes and anthraquinones, carotenoids and vitamins C and E
Antioxidant
(Aydog and Duru, 2007)
Rosemary - Steam-distillation - DPPH - Zone inhibition assay, MIC
Carvacrol, eugenol, thymol, tocopherols, flavonoids, carnosic acid (CA), carnosol (COH) and rosmarinic acid (RA)
Antimicrobial, antioxidant (Seydim and
Sarikus, 2006)
Sea buckthorn -Liquid–liquid extraction (Hexane, ethyl acetate and water) -Total phenolic content, condensed tannin content, HP-TLC -FRAP, DPPH
Ascorbic acid, flavonoids, carotenoids, proanthocyanidins
Antioxidant, Antimicrobial (Michel et al.,
2012b)
Strawberry - Solvent extraction (ethanol) - Total phenolic content assay - Reducing power assay, DPPH
Ascorbic acid, -tocopherol, glutathione, carotenoids and flavonoids, total phenolics, proanthocyanidines
Antioxidant
(Oliveira et al., 2011)
Thai gac -Solvent extraction (hexane, acetone, ethanol and methanol) -Total flavonoid content, HPLC-diode array, DPPH, FRAP
-carotene, vitamin A, lycopene, lutein Antioxidant
(Kubola and Siriamornpun, 2011)
Tomato - Total phenolic content, total flavonoids content, HPLC- lycopene and ascorbic acid,
- FRAP, ORAC, DPPH, -carotene linoleic acid assay (lipid peroxidation)
Phenolics, carotenoids, ascorbic acid,
-tocopherol, tomatine (alkaloid)
Anti oxidant
(Liu et al., 2011)

66
1.5 Hypotheses
A variety of phytochemical compounds can be extracted from fruit and vegetable wastes,
and some of which may exhibit both antioxidant and antimicrobial properties. There are
certain common physico-chemical features that may confer to them both antioxidant and
antimicrobial properties, including lipophilicity-hydrophilicity balance, acidity-alkalinity
balance, redox potential and metal complexing ability. Identification of plant extracts
exhibiting both antioxidant and antimicrobial activityies could lead to the development of
effective antioxidant-antimicrobials for use in the preservation of foods, potentially
replacing synthetic preservatives.

67
1.6 Objectives
1.6.1 General Objective
The objective of this work is to conduct studies to evaluate the potential of extracts
obtained from various fruit and vegetable by-products towards the development of
antioxidant-antimicrobials for use as food preservation agents, as alternative to synthetic
agents.
1.6.2 Specific Objectives
Specifically, the research involves:
(1) The identification of promising antioxidant-antimicrobial extracts from fruits and
vegetable by-products, generated in the field or processing;
(2) Antioxidant characterization of plant extracts for their capacity and efficacy;
(3) Evaluation of selected edible plant extracts for their spectrum of anti-radical activity
of importance in biology;
(4) Comprehensive evaluation of selected edible plant extracts for their antimicrobial
activity; and
(5) Exploration of ways to enhance the antimicrobial activity of selected antioxidant-
antimicrobial extracts, primarily by blending of extracts in various proportions and
by the addition of various phyto-compounds that may be inherently antimicrobial or
not.
A positive result marked by an appreciable inhibitory activity against microbial growth and
viability would qualify an extract for evaluation at the next level, where the extract would
be tested with defined paradigms such as, colony count tests, MIC, MBC and kill kinetics.
The most promising extracts would be evaluated for spectrum spectrum of antimicrobial
action against selected aerobic Gram-positive and Gram-negative bacteria, yeasts and fungi.

68
Chapter 2 NATURAL ANTIOXIDANT-ANTIMICROBIALS: SCREENING OF
FRUITS, VEGETABLES AND THEIR BY-PRODUCTS
Environ 160 extraits aqueux de sous-produits de fruits et légumes ont été criblés pour évaluer leur potentiel
antimicrobien et anti-oxydant. L’activité antimicrobienne a été déterminée par l’inhibition de la croissance
d’Escherichi coli et de Bacillus subtilis. L’activité anti-oxydante a été mise évidence par le test au DPPH (2,2-
diphenyl -1-picrylhydrazyl). L'étude a conduit à l'identification des extraits présentant à la fois un potentiel
antimicrobien et une propriété anti-oxydante. Les propriétés bioactives des extraits sont influencées par le pH
de l'extrait, le type de tissu (fruits, feuilles et racines) et le type physiologique des fruits (climactérique). Les
résultats ont montré l’existence d’une relation entre les propriétés anti-oxydantes et antimicrobiennes des
extraits de plantes. De ce fait, l'indice anti-oxydant-antimicrobien développé pourrait être utile dans le choix
des sources végétales bioactives. Les extraits de plantes aux propriétés antimicrobiennes et anti-oxydantes
présentent un potentiel comme agent de conservation sécuritaire, bénéfique pour la santé et économique. Ce
résultat permet aussi de sélectionner 36 échantillons pour des études suivantes.
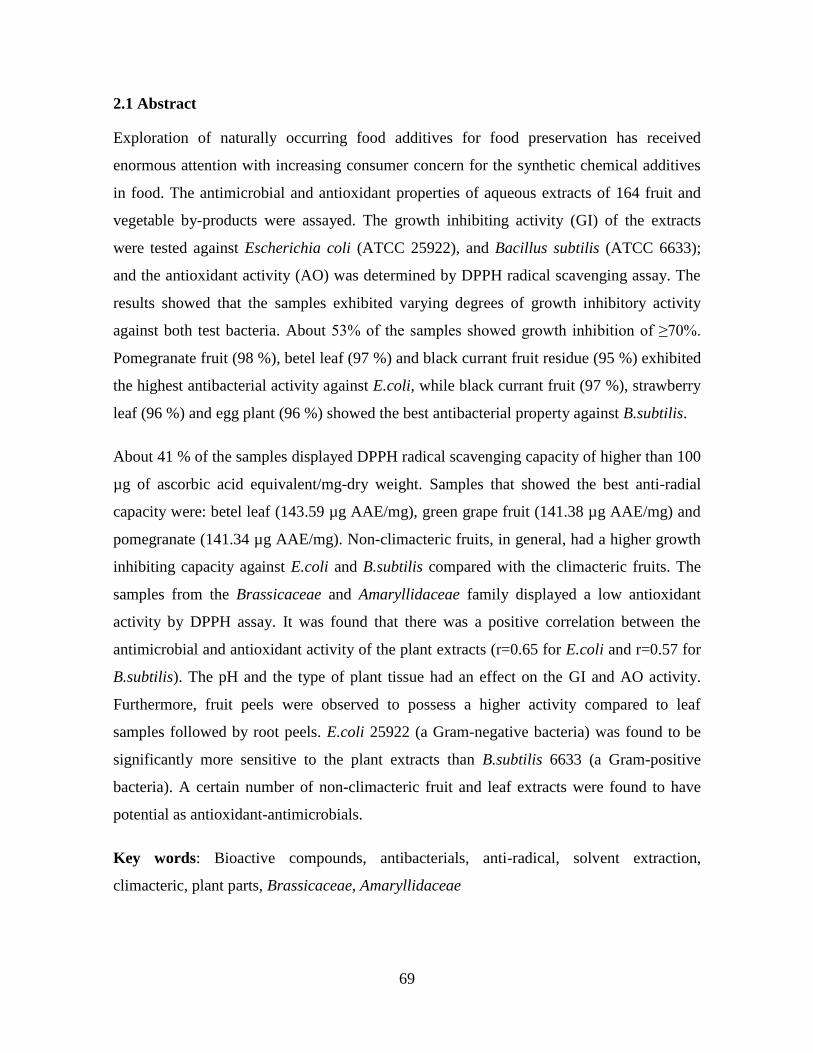
69
2.1 Abstract
Exploration of naturally occurring food additives for food preservation has received
enormous attention with increasing consumer concern for the synthetic chemical additives
in food. The antimicrobial and antioxidant properties of aqueous extracts of 164 fruit and
vegetable by-products were assayed. The growth inhibiting activity (GI) of the extracts
were tested against Escherichia coli (ATCC 25922), and Bacillus subtilis (ATCC 6633);
and the antioxidant activity (AO) was determined by DPPH radical scavenging assay. The
results showed that the samples exhibited varying degrees of growth inhibitory activity
against both test bacteria. About 53% of the samples showed growth inhibition of ≥70%.
Pomegranate fruit (98 %), betel leaf (97 %) and black currant fruit residue (95 %) exhibited
the highest antibacterial activity against E.coli, while black currant fruit (97 %), strawberry
leaf (96 %) and egg plant (96 %) showed the best antibacterial property against B.subtilis.
About 41 % of the samples displayed DPPH radical scavenging capacity of higher than 100
µg of ascorbic acid equivalent/mg-dry weight. Samples that showed the best anti-radial
capacity were: betel leaf (143.59 µg AAE/mg), green grape fruit (141.38 µg AAE/mg) and
pomegranate (141.34 µg AAE/mg). Non-climacteric fruits, in general, had a higher growth
inhibiting capacity against E.coli and B.subtilis compared with the climacteric fruits. The
samples from the Brassicaceae and Amaryllidaceae family displayed a low antioxidant
activity by DPPH assay. It was found that there was a positive correlation between the
antimicrobial and antioxidant activity of the plant extracts (r=0.65 for E.coli and r=0.57 for
B.subtilis). The pH and the type of plant tissue had an effect on the GI and AO activity.
Furthermore, fruit peels were observed to possess a higher activity compared to leaf
samples followed by root peels. E.coli 25922 (a Gram-negative bacteria) was found to be
significantly more sensitive to the plant extracts than B.subtilis 6633 (a Gram-positive
bacteria). A certain number of non-climacteric fruit and leaf extracts were found to have
potential as antioxidant-antimicrobials.
Key words: Bioactive compounds, antibacterials, anti-radical, solvent extraction,
climacteric, plant parts, Brassicaceae, Amaryllidaceae

70
2.2 Introduction
Vegetables and fruits yield between 25 % and 75 % of non-edible by-products as wastes
(for example, in 2010, apple 30%, pineapple 45%, citrus 70%) (Van Dyk et al., 2013), after
processing of fruit and vegetable in the food processing industry; and they contain a large
amount of bioactive compounds. The by-products of fruits and vegetables are made up of
skins, and seeds of different shapes and sizes that normally have no further usage, and are
usually discarded. These raw by-products may be good sources of AO and AM for use in
food applications.
Fruit and vegetable peels are first barrier-rich substances in plants which protect against
attack from the pests such as insects and other plant-feeding animals, and environmental
stresses such as UV radiation, heat, cold, heavy metals, and chemicals. Therefore, the fruit
and vegetable peel residues could be an excellent, inexpensive and readily available
resource for bioactive compounds for use in the food and pharmaceutical industries;
thereby, adding value to the processing wastes and also contributing to the economic
benefit of food processors.
The most abundant by-products of minimally processed fresh fruit and vegetable products
are fruit peels and seeds which have been reported to contain high amounts of phenolic
compounds with antioxidant and antimicrobial properties (Balasundram et al., 2006). The
antimicrobial activities of a variety of naturally occurring phenolic compounds from
different plant sources have been studied in detail (Cueva et al., 2010b; Daglia, 2012b;
Quideau et al., 2011). These compounds play an important role in the protection of crops
against pathogenic agents, damaging the cell membrane of microorganisms, and causing
lysis of the cells. Phenolic compounds from spices such as gingeron, zingerone, and
capsaicin have been found to inhibit the germination of bacterial spores (Burt, 2004).
Polyphenols from green tea have also been explored for broad spectrum activity against
pathogens (Taylor et al., 2005). In addition, flavonoids when used in conjunction have been
reported to enhance the antibacterial, antiviral, and anticancer activities of compounds such
as naringenin, acycloguanosine, and tamoxifen (Ayala-Zavala et al., 2010).
Extensive research also points to the potential of bioactive compounds from plant by-
71
products as a source of antioxidants (Agourram et al., 2013; Moure et al., 2001; Santana-
Méridas et al., 2012; Van Dyk et al., 2013). Of late, the use of synthetic antioxidants has
come under the scanner and their use is being strictly regulated (Lobo et al., 2010). Similar
to the changing perception towards synthetic antioxidants, increasing reports of resistance
of pathogens against synthetic antimicrobials has led to limitations on their use (Davidson
and Branen, 2005). It was found that total phenolic and flavonoid content was higher in
peels in comparison to other parts (Gözlekçi et al., 2011). The radical scavenging activity
was found to correlate well with the total phenolic content and flavonoids, where samples
with the lowest total phenolic content and flavonoids displayed the lowest radical
scavenging activity (Aksoy et al., 2013; Sen et al., 2013).
The objective of this study was to identify plant extracts exhibiting both antimicrobial and
antioxidant properties, and examine possible relationships between them. We performed
exhaustive screening of various edible plant by-products and wastes for potential
antimicrobial and antioxidant properties. Furthermore, the antimicrobial and antioxidant
properties of the extracts were also examined in relation to their sources such as plant tissue
type and the physiological type of fruit (climacteric and non-climacteric).

72
2.3 Materials and Methods
2.3.1 Plant materials
All fruit, vegetable and plant by-products were collected from farms, farmer’s markets and
fruit and vegetable processors in and around Quebec City. All collected samples were
transported the same day and stored at 4°C until further processing. Subsequently within 48
hours, they were lyophilized, ground to powder, vacuum-sealed and stored at -30°C.
2.3.2 Chemicals and reagents
Chemicals, diphenyl-2-picrylhydrazyl, ascorbic acid, gallic acid and Murielle Hilton Broth
were procured from Sigma Aldrich USA. All other reagents were of analytical grade.
2.3.3 Preparation of extracts
About 50 gram of the lyophilized powder of raw sample was extracted with 500 mL of
distilled water at 85-90°C for 60 minutes with constant stirring. The slurry was then
vacuum filtered (Whatman No. 1 filter paper), and the filtrate was concentrated under
vacuum using a rotary evaporator at 65°C to about 100 mL and then lyophilized. The
lyophilized extracts were vacuum-packed and stored at -30oC until further use. For the
antimicrobial and antioxidant assays the samples were dispersed in Mueller-Hinton broth
and methanol, to obtain a stock solution of 100 mg/mL and 1 mg/mL, respectively. All the
stock solutions were purged with argon, stored at 4oC and used within 24 hours.
2.3.4 Bacterial strains and inoculum preparation
The antimicrobial activity of the extracts was determined against Escherichia coli ATCC
25922 (a Gram-negative) and Bacillus subtilis ATCC 6633 (a Gram-positive) bacteria.
Bacterial cultures were revived from stocks kept at -80°C by three successive growth cycles
at 37 °C for 24 h in Mueller Hilton Broth (Sigma Aldrich). The standard inoculums were
prepared following NCCLS guidelines (Jorgensen and Ferraro, 2009) with organisms in
their log growth phase (4h after incubation), and then adjusted to match 0.5 McFarland
standard (corresponds to approximately to 1.5 X 10⁸ CFU/mL). The standardized
suspensions were used within 15 minutes.

73
2.3.5 Antimicrobial activity assay
The antimicrobial activity of plant extracts was determined using a microtitre broth dilution
assay (NCCLS, 1991; Wiegand et al., 2008). Briefly, 190 µl of plant extract in MH broth
(10 mg/mL) was pipetted in the 96-well plate. Subsequently, the wells were inoculated with
the test strain (10µl) to achieve a final concentration of 104 to 105 CFU/mL in each well.
The blank and assay control was the plant extract (190 µl at 10 mg/mL) and 10 µl of MHB
broth without the bacterial strain, respectively; where the latter also served as the sterility
control. Chloramphenicol (1 mg/mL) was used as the positive control, while the inoculated
MHB broth as the negative control. The prepared plates were incubated at 37°C in a micro-
plate reader (Biotek Power XS2), and absorbance readings (OD600nm) were recorded hourly
for 24 hours. All assays were performed in triplicate. The percentage of growth inhibition
was calculated by the difference between the negative control (inoculum without plant
extract) and that contains the sample.
2.3.6 Antioxidant assay - DPPH radical-scavenging capacity
The DPPH radical scavenging was analysed through a standard spectrophotometric method
(Sharma and Bhat, 2009) with modifications. A stock solution of DPPH (6.1x 10⁻⁵ M) was
freshly prepared in methanol and was used immediately. The DPPH stock solution was
diluted with methanol and adjusted to OD of 0.7 (± 0.02) at 515 nm. Subsequently, 190 µL
of the DPPH solution was pipetted into a 96 well micro-plate (Becton Dickinson Falcon
353072), followed by addition of 10 µL of plant extracts (1.0 mg/mL). Thereafter, the plate
was incubated in a (Biotek Power XS2 Logicel Gen 5) spectrophotometer at 25°C for a
period of 1 hour, with absorbance readings (515 nm) recorded every 1 min. Ascorbic acid
(1 mg/mL) was used as a standard and the results were expressed as ascorbic acid
equivalent (µg AAE/mg extract). The assays were carried out in triplicate.
Radical scavenging activity = [(A0 − A1)/A0 ]× 100 (%)
Where A0 was the absorbance of the control sample (without plant extract) and A1 was the
absorbance in the presence of the test sample.

74
2.3.7 Statistical analyses
The results of the growth inhibition assay were expressed as mean of the percentage of
inhibition ± standard deviation (SD) of three replicates. The result of the DPPH radical
scavenging assay was presented as µg AAE/mg extract ± standard deviation (SD) of three
replicates. Antimicrobial and antioxidant activities were analyzed as a function of plant
tissue types (fruit peel, leaf, root peel); physiological type of the fruit (climacteric fruit vs.
non-climacteric fruit); and test strains used (E. coli (Gram -) vs B. subtilis (Gram +)). The
data were subjected to means comparison using Kruscal-Wallis test (Wilcoxon test
followed by Kruscal-Wallis post hoc analysis) using R software at a significance level of
5% (p=0.05).

75
2.4 Results
2.4.1 Antimicrobial activity
The antimicrobial activity of 164 samples (80 fruit peels, 67 leaves, and 17 root peels)
against the two test strains (E.coli and B.subtilis) is presented in Table 2.1. The inhibition
activity (GI) is presented as percentage of growth inhibition. The results showed that all the
samples exhibited antimicrobial activity, with 53 % of the samples showing >70 % GI at
the tested concentration of 10 mg/mL; about 6 % of the samples exhibiting GI of > 90 %.
Among them, a small number of extracts exhibited GI of > 90 %: black currant, betel leaf,
cranberry, egg plant, pomegranate, rambutan, raspberry, grape leaf and sea buckthorn leaf.
Among the materials evaluated, three samples exhibiting the highest antibacterial activity
against E.coli were pomegranate fruit (98 %), betel leaf (97 %) and black currant fruit
residue (95 %); whereas the three best extracts active against B. subtilis were black currant
fruit (97 %), strawberry leaf (96.07%) and egg plant peel (96 %). The extracts in general
displayed antimicrobial activity towards both bacteria. The mean growth inhibition activity
against E.coli was 65 %, and was significantly higher (p<0.05) than the mean of GI against
B.subtilis 6633 (59 %) as seen in Figure 2.1.
Figure 2.1 A comparison of sensitivity of E.coli and B.subtilis against 164 plant extracts
E. coli B. subtilis
20
40
60
80
10
0
Gro
wth
in
hib
itio
n, %

76
The inhibition activity of 80 fruit peel samples comprising of 30 climacteric fruits and 50
non-climacteric fruits is presented in Figure 2.2. The antimicrobial activity of non-
climacteric fruit peels (E.coli, 74 % and B.subtilis, 68 %) was significantly higher (p<0.05)
than those of climacteric fruit peels (E.coli 60.89% and B.subtilis, 54 % (Figures 2.2, 2.3).
The samples were divided according to their tissue types (fruit peels, leaf and root peels),
and their GI was compared. The type of plant tissue (fruit, leaf and root) was also corelated
with the inhibitory activity of the extracts. The fruit peel extracts exhibited a higher
antibacterial activity than leaf extracts (p<0.05), followed by root peel extracts (Figures 2.4
and 2.5).
It was observed that the pH of the extract was a factor influencing the GI of extracts. The
pH of the extract negatively correlated with the growth inhibition of both the test strains, as
seen in Figure 2.7, which shows coefficient of correlation, r of -0.39 for E.coli and r of -
0.37 for B.subtilis.
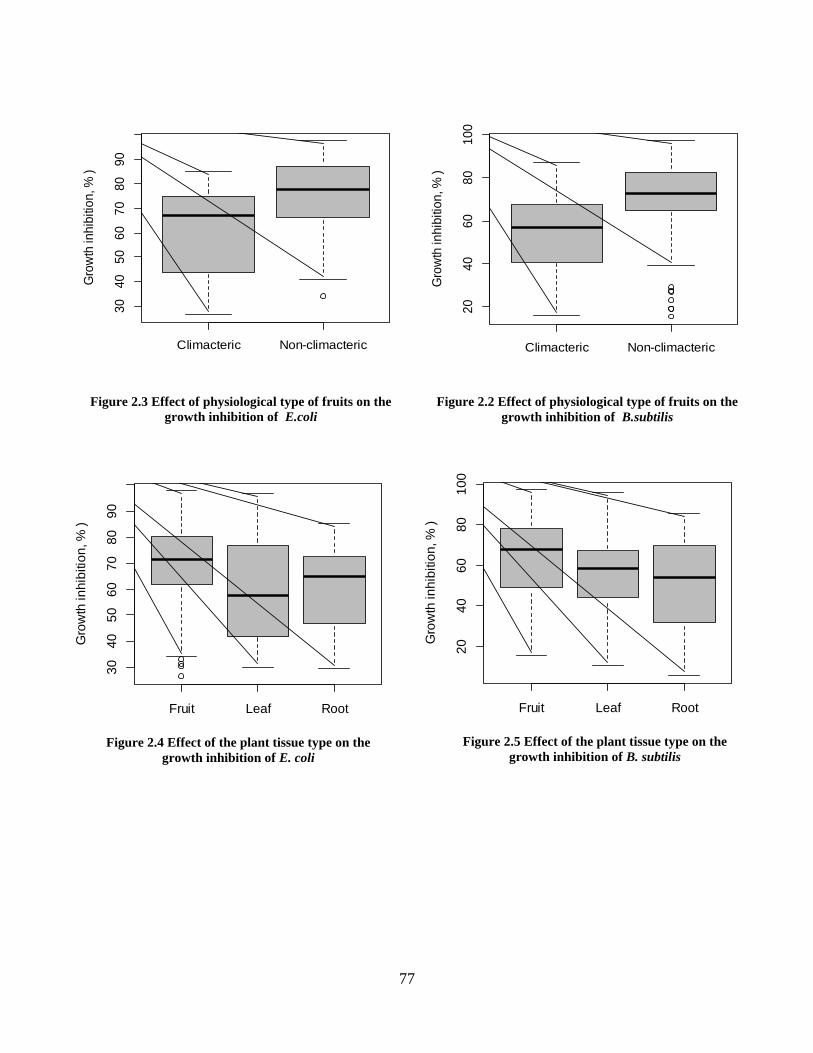
77
Climacteric Non-climacteric
30
40
50
60
70
80
90
Gro
wth
inh
ibiti
on
, % )
Figure 2.3 Effect of physiological type of fruits on the
growth inhibition of E.coli
Climacteric Non-climacteric
20
40
60
80
10
0
Gro
wth
in
hib
itio
n, %
)
Figure 2.2 Effect of physiological type of fruits on the
growth inhibition of B.subtilis
Fruit Leaf Root
30
40
50
60
70
80
90
Gro
wth
in
hib
itio
n, %
)
Figure 2.4 Effect of the plant tissue type on the
growth inhibition of E. coli
Fruit Leaf Root
20
40
60
80
10
0
Gro
wth
in
hib
itio
n, %
)
Figure 2.5 Effect of the plant tissue type on the
growth inhibition of B. subtilis
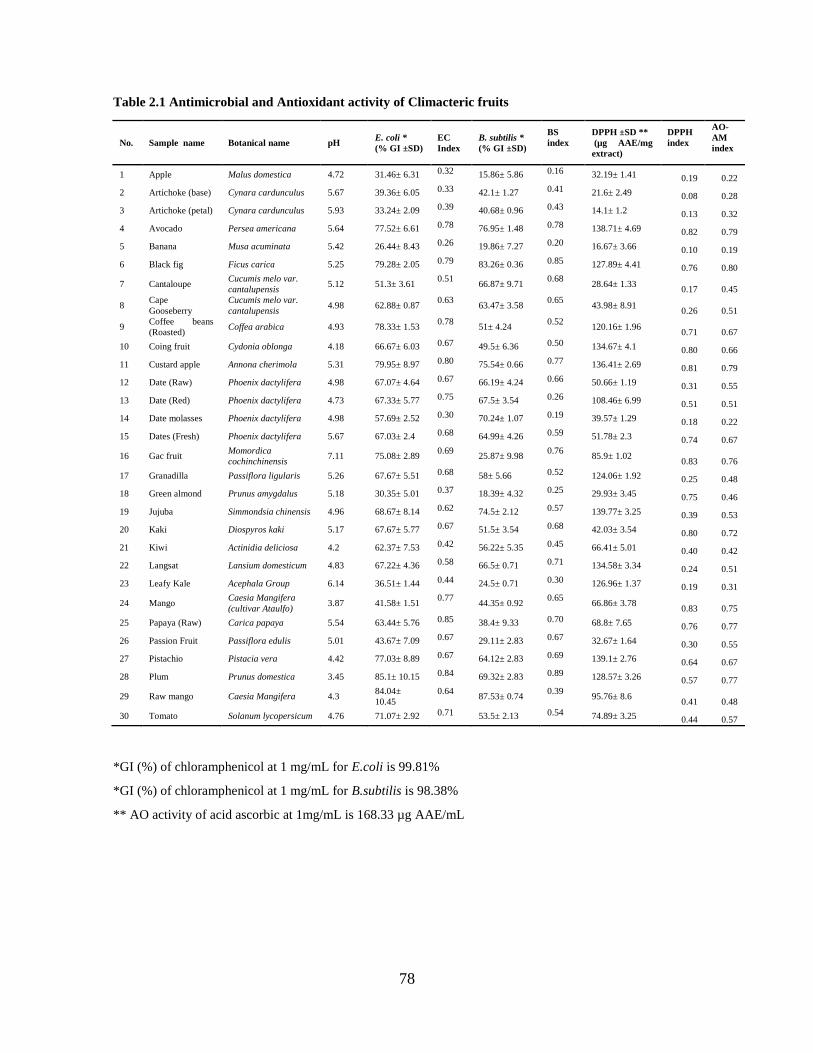
78
Table 2.1 Antimicrobial and Antioxidant activity of Climacteric fruits
No. Sample name Botanical name pH E. coli *
(% GI ±SD)
EC
Index
B. subtilis *
(% GI ±SD)
BS
index
DPPH ±SD **
(µg AAE/mg
extract)
DPPH
index
AO-
AM
index
1 Apple Malus domestica 4.72 31.46± 6.31 0.32 15.86± 5.86 0.16 32.19± 1.41 0.19 0.22
2 Artichoke (base) Cynara cardunculus 5.67 39.36± 6.05 0.33 42.1± 1.27 0.41 21.6± 2.49 0.08 0.28
3 Artichoke (petal) Cynara cardunculus 5.93 33.24± 2.09 0.39 40.68± 0.96 0.43 14.1± 1.2 0.13 0.32
4 Avocado Persea americana 5.64 77.52± 6.61 0.78 76.95± 1.48 0.78 138.71± 4.69 0.82 0.79
5 Banana Musa acuminata 5.42 26.44± 8.43 0.26 19.86± 7.27 0.20 16.67± 3.66 0.10 0.19
6 Black fig Ficus carica 5.25 79.28± 2.05 0.79 83.26± 0.36 0.85 127.89± 4.41 0.76 0.80
7 Cantaloupe Cucumis melo var.
cantalupensis 5.12 51.3± 3.61
0.51 66.87± 9.71
0.68 28.64± 1.33
0.17 0.45
8 Cape
Gooseberry
Cucumis melo var.
cantalupensis 4.98 62.88± 0.87
0.63 63.47± 3.58
0.65 43.98± 8.91
0.26 0.51
9 Coffee beans
(Roasted) Coffea arabica 4.93 78.33± 1.53
0.78 51± 4.24
0.52 120.16± 1.96
0.71 0.67
10 Coing fruit Cydonia oblonga 4.18 66.67± 6.03 0.67 49.5± 6.36 0.50 134.67± 4.1 0.80 0.66
11 Custard apple Annona cherimola 5.31 79.95± 8.97 0.80 75.54± 0.66 0.77 136.41± 2.69 0.81 0.79
12 Date (Raw) Phoenix dactylifera 4.98 67.07± 4.64 0.67 66.19± 4.24 0.66 50.66± 1.19 0.31 0.55
13 Date (Red) Phoenix dactylifera 4.73 67.33± 5.77 0.75 67.5± 3.54 0.26 108.46± 6.99 0.51 0.51
14 Date molasses Phoenix dactylifera 4.98 57.69± 2.52 0.30 70.24± 1.07 0.19 39.57± 1.29 0.18 0.22
15 Dates (Fresh) Phoenix dactylifera 5.67 67.03± 2.4 0.68 64.99± 4.26 0.59 51.78± 2.3 0.74 0.67
16 Gac fruit Momordica
cochinchinensis 7.11 75.08± 2.89
0.69 25.87± 9.98
0.76 85.9± 1.02
0.83 0.76
17 Granadilla Passiflora ligularis 5.26 67.67± 5.51 0.68 58± 5.66 0.52 124.06± 1.92 0.25 0.48
18 Green almond Prunus amygdalus 5.18 30.35± 5.01 0.37 18.39± 4.32 0.25 29.93± 3.45 0.75 0.46
19 Jujuba Simmondsia chinensis 4.96 68.67± 8.14 0.62 74.5± 2.12 0.57 139.77± 3.25 0.39 0.53
20 Kaki Diospyros kaki 5.17 67.67± 5.77 0.67 51.5± 3.54 0.68 42.03± 3.54 0.80 0.72
21 Kiwi Actinidia deliciosa 4.2 62.37± 7.53 0.42 56.22± 5.35 0.45 66.41± 5.01 0.40 0.42
22 Langsat Lansium domesticum 4.83 67.22± 4.36 0.58 66.5± 0.71 0.71 134.58± 3.34 0.24 0.51
23 Leafy Kale Acephala Group 6.14 36.51± 1.44 0.44 24.5± 0.71 0.30 126.96± 1.37 0.19 0.31
24 Mango Caesia Mangifera
(cultivar Ataulfo) 3.87 41.58± 1.51
0.77 44.35± 0.92
0.65 66.86± 3.78
0.83 0.75
25 Papaya (Raw) Carica papaya 5.54 63.44± 5.76 0.85 38.4± 9.33 0.70 68.8± 7.65 0.76 0.77
26 Passion Fruit Passiflora edulis 5.01 43.67± 7.09 0.67 29.11± 2.83 0.67 32.67± 1.64 0.30 0.55
27 Pistachio Pistacia vera 4.42 77.03± 8.89 0.67 64.12± 2.83 0.69 139.1± 2.76 0.64 0.67
28 Plum Prunus domestica 3.45 85.1± 10.15 0.84 69.32± 2.83 0.89 128.57± 3.26 0.57 0.77
29 Raw mango Caesia Mangifera 4.3 84.04±
10.45
0.64 87.53± 0.74
0.39 95.76± 8.6
0.41 0.48
30 Tomato Solanum lycopersicum 4.76 71.07± 2.92 0.71 53.5± 2.13 0.54 74.89± 3.25 0.44 0.57
*GI (%) of chloramphenicol at 1 mg/mL for E.coli is 99.81%
*GI (%) of chloramphenicol at 1 mg/mL for B.subtilis is 98.38%
** AO activity of acid ascorbic at 1mg/mL is 168.33 µg AAE/mL

79
Table 2.2 Antimicrobial and Antioxidant activity of Non-climacteric fruits
No. Sample name Botanical name pH E. coli *
(% GI ±SD)
EC
Index
B. subtilis *
(% GI ±SD)
BS
index
DPPH±SD **
(µg AAE/mg
extract)
DPPH
index
AO-
AM
index
31 Areca nut Areca catechu 5.8 80.35± 4.12 0.81 75.96± 2.3 0.77 138.52± 2.17 0.82 0.80
32 Bangladesh lemon
(Satkara) Citrus Macroptera 4.74 61.32± 5.29
0.61 58.5± 2.12
0.59 30.45± 2.41
0.18 0.46
33 Bitter Gourd Momordica charantia 4.99 79.04± 10.24 0.79 88.16± 3.05 0.90 103.59± 7.26 0.62 0.77
34 Black currant Ribes nigrum 3.27 91.23± 1.69 0.91 97.38± 3.36 0.99 133.12± 1.2 0.79 0.90
35 Black currant
(Fermented residue) Ribes nigrum 3.2 69.32± 5.23
0.69 79.56± 1.41
0.81 127.5± 2.47
0.76 0.75
36 Black currant (residue) Ribes nigrum 3.55 94.73± 3.52 0.95 80.5± 0.71 0.82 135.12± 6.98 0.80 0.86
37 Blueberry Vaccinium corymbosum 3.85 79.45± 8.1 0.80 65.82± 5.92 0.67 137.87± 4.54 0.82 0.76
38 Cactus Opuntia ficus-indica 5.56 63.81± 1.09 0.64 47.7± 3.82 0.48 53.95± 7.55 0.32 0.48
39 Canadian cucumber Cucumis sativus 6.23 78.64± 7.19 0.79 69± 4.25 0.70 11.34± 1.69 0.07 0.52
40 Canadian Yew taxus canadensis 4.78 77.39± 6.5 0.78 79.75± 1.77 0.81 34.24± 2.92 0.20 0.60
41 Carambola Averrhoa carambola 4.13 72.53± 6.08 0.73 67.5± 3.54 0.69 118.4± 2.26 0.70 0.71
42 Carob molasses Ceratonia siliqua 4.56 61.05± 5.29 0.61 73.96± 1.36 0.75 28.43± 1.1 0.17 0.51
43 Cashew apple Anacardium occidentale 5.23 78.86±5.61 0.79 72.65±4.32 0.74 96.34±3.97 0.57 0.70
44 Cherry Prunus avium 4.5 50.05± 7.07 0.50 73.18± 0.25 0.74 42.86± 2.92 0.25 0.50
45 Cranberry Vaccinium macrocarpon 2.69 94.33± 8.08 0.95 95± 2.83 0.97 138.52± 5.51 0.82 0.91
46 Drum Sticks Moringa oleifera 5.02 63.82± 2.87 0.64 27.25± 3.89 0.28 16.55± 7.04 0.10 0.34
47 Egg plant Solanum melongena 5.09 87.4± 2.1 0.88 95.61± 1.3 0.97 125.39± 4.9 0.74 0.86
48 English cucumber Cucumis sativus 6.12 34.03± 3.55 0.34 19.04± 8.44 0.19 12.7± 3.43 0.08 0.20
49 Grape (Black) Vitis vinifera 3.8 66.21± 4.11 0.66 48.41± 4.82 0.49 77.17± 2.32 0.46 0.54
50 Grape Green (wine)
(Residue) Vitis vinifera 3.55 78.33± 6.26
0.78 76± 1.41
0.77 138.07± 4.37
0.82 0.79
51 Grape Red Vitis vinifera 3.92 81.67± 6.17 0.82 72.5± 3.54 0.74 140.5± 2.75 0.83 0.80
52 Grape Red (wine) Vitis vinifera 4.17 70.2± 5.2 0.70 72.5± 0.71 0.74 130.86± 5.07 0.78 0.74
53 Grape (Red) seed
(Fermented residue) Vitis vinifera 4.31 88.33± 2.08
0.88 82.5± 2.12
0.84 132.64± 1.41
0.79 0.84
54 Grape Red (wine)
(Fermented residue) Vitis vinifera 3.49 82.67± 2.08
0.83 75± 1.41
0.76 132.69± 2.84
0.79 0.79
55 Green Chilly Cultivar Capsicum 5.62 82.13± 7.68 0.82 68.15± 4.04 0.69 29.66± 7.79 0.18 0.56
56 Green grape (Table) Vitis vinifera 4.12 78.46± 7.43 0.79 74.43± 5.05 0.76 134.47± 2.19 0.80 0.78
57 Green grape (wine) Vitis vinifera 4.26 87.67± 1.15 0.88 90.5± 0.71 0.92 141.38± 4.45 0.84 0.88
58 Green Italian pepper Capsicum annuum 6.07 73.65± 6.84 0.74 93.77± 5.32 0.95 113.43± 5.06 0.67 0.79
59 Indian Plum Ziziphus mauritiana 4.89 88.33± 1.15 0.88 84.5± 6.36 0.86 136.11± 1.19 0.81 0.85
60 Ivy Gourd Coccinia grandis 5.18 41.03± 5.24 0.41 29.34± 3.76 0.30 14.96± 5.84 0.09 0.27
61 Kumquat Citrus japonica 4.4 76.83± 7.19 0.77 66± 8.49 0.67 90.53± 4.18 0.54 0.66
62 Lemon albido Citrus lemon 4.95 71.3± 2.07 0.71 71.47± 0.76 0.73 117.64± 5.01 0.70 0.71
63 Lemon flavido Citrus lemon 5.02 70.46± 4.01 0.71 74.49± 7.76 0.76 84.68± 1.64 0.50 0.66
64 Lychee Litchi chinensis 4.11 78.96± 3.18 0.79 71.91± 4.11 0.73 130.96± 1.37 0.78 0.77
65 Mangosteen Garcinia mangostana 4.58 80.44± 7.88 0.81 82.78± 3.93 0.84 136.93± 1.84 0.81 0.82
66 Noni Morinda citrifolia 5.82 94.39± 7.8 0.95 92.08± 2.83 0.94 140.86± 2.83 0.84 0.91
67 Olive (Jolpai) Olea europaea 3.51 93.33± 5.13 0.94 80.5± 7.78 0.82 113.02± 6.71 0.67 0.81
68 Olive (dried mill
effluent) Olea europaea 4.12 97.55±8.14
0.98 98.23±3.22
1.00 136.75±4.45
0.81 0.93
69 Orange albido Citrus sinensis 4.56 50.8± 1.93 0.51 23.09± 2.7 0.23 111.55± 3.26 0.66 0.47
70 Orange flavido Citrus sinensis 5.01 42.81± 4.84 0.43 19.21± 1.12 0.20 53.28± 9.78 0.32 0.31
71 Pineapple Ananas comosus 3.89 66.65± 3.39 0.67 66.32± 0.45 0.67 25.29± 0.69 0.15 0.50
72 Pomegranate Punica granatum 3.55 97.81± 2.05 0.98 87.32± 8.03 0.89 141.34± 3.54 0.84 0.90
73 Pomegranate seeds Punica granatum 5.08 91.67± 1.15 0.92 90.5± 0.71 0.92 87.56± 3.01 0.52 0.79
74 Pomelo Citrus maxima 4.98 72.84± 8.87 0.73 27.16± 4.02 0.28 70.28± 6.48 0.42 0.47

80
Table 2.2 Antimicrobial and Antioxidant activity of Non-climacteric fruit (Continued)
No. Sample name Botanical name pH E. coli *
(% GI ±SD)
EC
Index
B. subtilis *
(% GI ±SD)
BS
index
DPPH±SD **
(µg AAE/mg
extract)
DPPH
index
AO-
AM
index
75 Pumpkin Cucurbita pepo 6.44 71.48± 3.06 0.72 64.6± 0.57 0.66 32.41± 8.41 0.19 0.52
76 Rambutan Nephelium lappaceum 3.76 83.94± 4.33 0.84 90.79± 1.12 0.92 136.3± 3.68 0.81 0.86
77 Raspberry Rubus idaeus 3.27 93.83± 6.01 0.94 95.43± 2.02 0.97 133.63± 0.74 0.79 0.90
78 Sea buckthorn Hippophae (cultivar Indian
Summer) 3.11 87.29± 5.8
0.87 71.5± 4.96
0.73 125.69± 2.07
0.75 0.78
79 Spiky Gourd (Kantola) Momordica dioica 5.17 53.66± 3.86 0.54 39.18± 1.17 0.40 21± 7.68 0.12 0.35
80 Strawberry Fragaria × ananassa 3.41 58.37± 7.26 0.58 63.02± 2.83 0.64 135.5± 3.43 0.80 0.68
81 Tamarind Red Tamarindus indica 3.87 72.73± 5.36 0.73 70.5± 0.71 0.72 109.83± 6.78 0.65 0.70
82 Water-melon Citrullus lanatus 4.79 43.04± 10.8 0.43 15.3± 6.65 0.16 39.87± 6.78 0.24 0.27
*GI (%) of chloramphenicol at 1 mg/mL for E.coli is 99.81%
*GI (%) of chloramphenicol at 1 mg/mL for B.subtilis is 98.38%
** AO activity of acid ascorbic at 1mg/mL is 168.33 µg AAE/mL

81
Table 2.3 Antimicrobial and Antioxidant activity of leaf extracts
No. Sample name Botanical name pH E. coli *
(% GI ±SD)
EC
Index
B. subtilis *
(% GI ±SD)
BS
index
DPPH±SD **
(µg AAE/mg
extract)
DPPH
index
AO-
AM
index
83 Alpha-alpha Medicago sativa 6.56 38.07± 2.55 0.38 42.15± 4.2 0.43 14.61± 4.53 0.09 0.30
84 Anise Pimpinella anisum 5.63 41.08± 1.22 0.41 32.47± 2.13 0.33 76.44± 3.34 0.45 0.40
85 Asparagus Asparagus officinalis 5.1 40.78± 4.13 0.39 59.99± 5.64 0.45 22.44± 5.17 0.28 0.37
86 Baby arugula Eruca sativa 5.01 38.47± 1.1 0.41 43.87± 1.6 0.61 47.71± 4.43 0.13 0.38
87 Basil Ocimum basilicum 5.7 76.67± 3.51 0.77 62.02± 1.41 0.63 95.14± 2.93 0.57 0.65
88 Betel Piper betle 5.92 97.02± 2.09 0.97 90.12± 1.41 0.92 143.59± 1.77 0.85 0.91
89 Black currant Ribes nigrum 5.44 43.12± 4.12 0.43 57.48± 3.5 0.58 60.83± 7.02 0.36 0.46
90 Blueberry Vaccinium corymbosum 3.52 77.29± 3.74 0.77 48.87± 1.6 0.50 136.47± 3.88 0.81 0.69
91 Bok Choy Brassica rapa chinensis, 5.92 36.28± 5.15 0.36 50.81± 5.38 0.52 45.26± 2.34 0.27 0.38
92 Broccoli Brassica oleracea group
Italica 5.44 64.73± 6.79
0.73 63.57± 2.02
0.81 39.79± 2.92
0.16 0.57
93 Broccoli
inflorescence
Brassica oleracea group
Italica 6.24 72.43± 7.41
0.65 79.88± 4.24
0.65 27.17± 1.65
0.24 0.51
94 Brussels sprouts Brassica oleracea group
Gemmifera 5.93 71.16± 10.22
0.71 62.59± 3.41
0.64 14.71± 6.1
0.09 0.48
95 Burdock Arctium lappa 5.95 56.98± 5.43 0.57 60.18± 1.36 0.61 132.92± 3.21 0.79 0.66
96 Cabbage Brassica oleracea group
Capitata 5.88 41.51± 6.83
0.42 31.4± 5.09
0.32 17.82± 8.07
0.11 0.28
97 Carrot Daucus carota 6.06 31.83± 3.81 0.32 17.85± 3.04 0.18 40.58± 3.6 0.24 0.25
98 Celery Apium graveolens var. dulce 4.35 41.6± 4.02 0.42 16.55± 4.96 0.17 26.06± 5.32 0.15 0.25
99 Celery rave Apium graveolens 5.02 66.71± 3.85 0.67 62.5± 3.54 0.64 67.37± 2.09 0.40 0.57
100 Celery oriental Chinese 5.92 41.41± 5.28 0.44 10.45± 6.44 0.47 74.96± 4.86 0.75 0.55
101 Chicory lettuce Cichorium intybus 5.93 43.53± 2.14 0.62 46.69± 2.39 0.83 126.06± 5.34 0.41 0.62
102 Coriander
(Fresh) Coriandrum sativum 6.01 61.73± 3.59
0.41 81.66± 2.34
0.11 68.65± 3.56
0.45 0.32
103 Cranberry Vaccinium macrocarpon 4.6 87.87± 6.18 0.88 88.43± 0.6 0.90 131.12± 1.3 0.78 0.85
104 Cress Lepidium sativum 5.85 36.95± 4.86 0.37 15.5± 0.71 0.16 15.19± 3.6 0.09 0.21
105 Curry Murraya koenigii 5.76 38.16± 2.98 0.38 37.5± 2.12 0.38 27.48± 10.3 0.16 0.31
106 Dandelion salad Taraxacum officinale 5.73 68.46± 2.9 0.56 28.73± 1.8 0.49 44.42± 3.52 0.22 0.42
107 Dandelion (wild) Taraxacum officinale 5.51 55.58± 9.42 0.69 48.27± 2.45 0.29 37.79± 1.86 0.26 0.41
108 Dill (Fresh) Anethum graveolens 6.19 40.61± 2.26 0.41 49.58± 0.81 0.50 64.25± 1.89 0.38 0.43
109 Echalot Allium cepa var.
aggregatum 4.59 63.67± 8.5
0.64 64.5± 0.71
0.66 10.41± 3.43
0.06 0.45
110 Endive Cichorium endivia 5.84 45.67± 2.95 0.46 57.7± 3.82 0.59 10.89± 6.49 0.06 0.37
111 Fenugreek Trigonella foenum-graecum 4.59 39.36± 9.72 0.39 41.05± 2.76 0.42 106.33± 1.89 0.63 0.48
112 Frisse Cichorium endivia
var crispum 6.73 59.33± 3.56
0.71 70.34± 1.89
0.66 88.31± 8.69
0.26 0.54
113 Grape (Wild) Vitis vinifera 3.33 92.27± 4.05 0.59 71.39± 5.11 0.71 140.78± 2.17 0.52 0.61
114 Grape (Wild) Vitis vinifera 3.49 92.16± 3.76 0.92 91.34± 1.89 0.73 137.14± 5.32 0.84 0.83
115 Green tea Camellia sinensis 4.48 87.08± 5.25 0.87 76.5± 2.12 0.78 139.55± 3.42 0.83 0.83
116 Hops (pellets) Humulus lupulus 5.73 67.53± 2.53 0.68 57.36± 17.88 0.58 130.66± 1.32 0.78 0.68
117 Horse radish pulp Armoracia rusticana 6.22 77.58± 4.61 0.78 66.55± 4.88 0.68 61.44± 8.02 0.36 0.61
118 Indian Round
Gouard (Tinda) Praecitrullus fistulosus 4.32 74.11± 4.62
0.52 44.39± 0.87
0.45 120.91± 3.26
0.64 0.54
119 Jewish Mallow Corchorus olitorius 5.23 52.25± 5.43 0.58 44.1± 1.56 0.52 107.01± 5.49 0.58 0.56
120 Kangkong Ipomoea aquatica 5.71 57.67± 7.51 0.38 51.5± 0.71 0.52 98.13± 3.39 0.48 0.46
121 Kohlrabi Brassica oleracea group
Gongylodes 5.54 37.55± 9.34
0.39 51.46± 3.47
0.59 80.7± 3.04
0.09 0.36
122 Leek Allium ampeloprasum group 5.31 39.06± 9.9 0.51 57.58± 2.02 0.63 14.96± 1.72 0.61 0.58
123 Leek term Allium ampeloprasum group 5.46 81.04± 3.98 0.81 52± 1.12 0.53 28.02± 2.2 0.17 0.50
124 Lemon Citrus lemon 5.43 51.13± 1.41 0.70 61.5± 0.71 0.67 103.05± 9.67 0.25 0.54
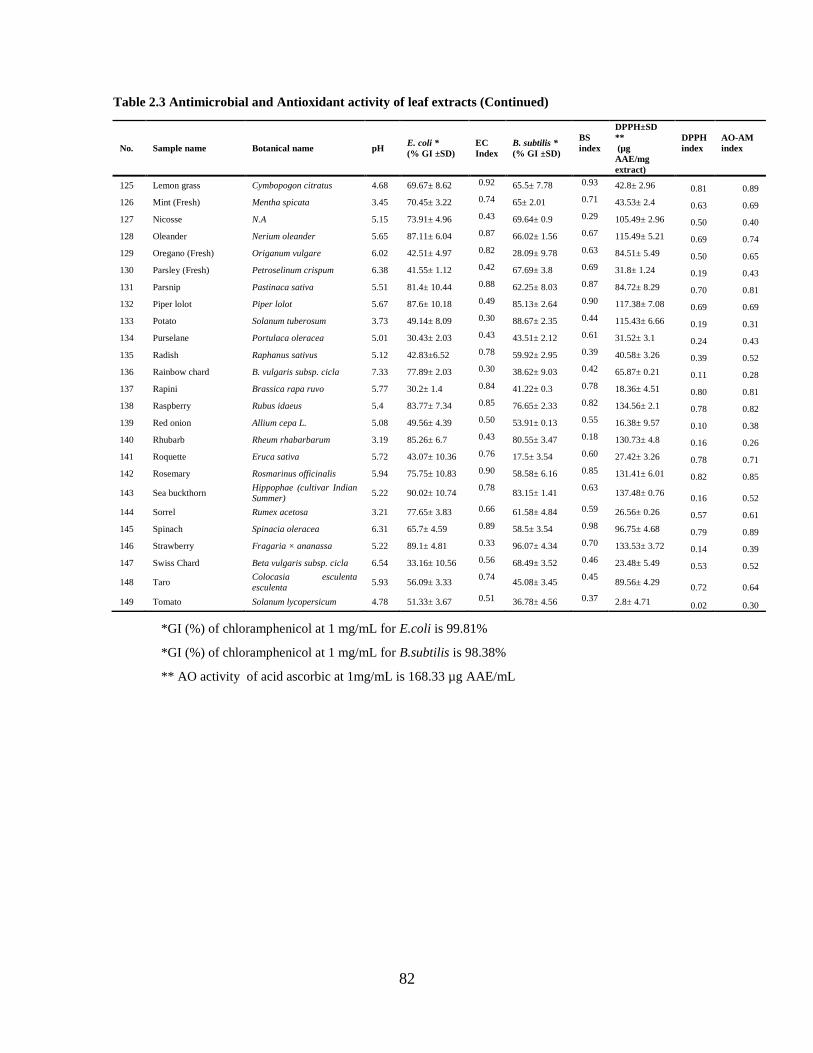
82
Table 2.3 Antimicrobial and Antioxidant activity of leaf extracts (Continued)
No. Sample name Botanical name pH E. coli *
(% GI ±SD)
EC
Index
B. subtilis *
(% GI ±SD)
BS
index
DPPH±SD
**
(µg
AAE/mg
extract)
DPPH
index
AO-AM
index
125 Lemon grass Cymbopogon citratus 4.68 69.67± 8.62 0.92 65.5± 7.78 0.93 42.8± 2.96 0.81 0.89
126 Mint (Fresh) Mentha spicata 3.45 70.45± 3.22 0.74 65± 2.01 0.71 43.53± 2.4 0.63 0.69
127 Nicosse N.A 5.15 73.91± 4.96 0.43 69.64± 0.9 0.29 105.49± 2.96 0.50 0.40
128 Oleander Nerium oleander 5.65 87.11± 6.04 0.87 66.02± 1.56 0.67 115.49± 5.21 0.69 0.74
129 Oregano (Fresh) Origanum vulgare 6.02 42.51± 4.97 0.82 28.09± 9.78 0.63 84.51± 5.49 0.50 0.65
130 Parsley (Fresh) Petroselinum crispum 6.38 41.55± 1.12 0.42 67.69± 3.8 0.69 31.8± 1.24 0.19 0.43
131 Parsnip Pastinaca sativa 5.51 81.4± 10.44 0.88 62.25± 8.03 0.87 84.72± 8.29 0.70 0.81
132 Piper lolot Piper lolot 5.67 87.6± 10.18 0.49 85.13± 2.64 0.90 117.38± 7.08 0.69 0.69
133 Potato Solanum tuberosum 3.73 49.14± 8.09 0.30 88.67± 2.35 0.44 115.43± 6.66 0.19 0.31
134 Purselane Portulaca oleracea 5.01 30.43± 2.03 0.43 43.51± 2.12 0.61 31.52± 3.1 0.24 0.43
135 Radish Raphanus sativus 5.12 42.83±6.52 0.78 59.92± 2.95 0.39 40.58± 3.26 0.39 0.52
136 Rainbow chard B. vulgaris subsp. cicla 7.33 77.89± 2.03 0.30 38.62± 9.03 0.42 65.87± 0.21 0.11 0.28
137 Rapini Brassica rapa ruvo 5.77 30.2± 1.4 0.84 41.22± 0.3 0.78 18.36± 4.51 0.80 0.81
138 Raspberry Rubus idaeus 5.4 83.77± 7.34 0.85 76.65± 2.33 0.82 134.56± 2.1 0.78 0.82
139 Red onion Allium cepa L. 5.08 49.56± 4.39 0.50 53.91± 0.13 0.55 16.38± 9.57 0.10 0.38
140 Rhubarb Rheum rhabarbarum 3.19 85.26± 6.7 0.43 80.55± 3.47 0.18 130.73± 4.8 0.16 0.26
141 Roquette Eruca sativa 5.72 43.07± 10.36 0.76 17.5± 3.54 0.60 27.42± 3.26 0.78 0.71
142 Rosemary Rosmarinus officinalis 5.94 75.75± 10.83 0.90 58.58± 6.16 0.85 131.41± 6.01 0.82 0.85
143 Sea buckthorn Hippophae (cultivar Indian
Summer) 5.22 90.02± 10.74
0.78 83.15± 1.41
0.63 137.48± 0.76
0.16 0.52
144 Sorrel Rumex acetosa 3.21 77.65± 3.83 0.66 61.58± 4.84 0.59 26.56± 0.26 0.57 0.61
145 Spinach Spinacia oleracea 6.31 65.7± 4.59 0.89 58.5± 3.54 0.98 96.75± 4.68 0.79 0.89
146 Strawberry Fragaria × ananassa 5.22 89.1± 4.81 0.33 96.07± 4.34 0.70 133.53± 3.72 0.14 0.39
147 Swiss Chard Beta vulgaris subsp. cicla 6.54 33.16± 10.56 0.56 68.49± 3.52 0.46 23.48± 5.49 0.53 0.52
148 Taro Colocasia esculenta
esculenta 5.93 56.09± 3.33
0.74 45.08± 3.45
0.45 89.56± 4.29
0.72 0.64
149 Tomato Solanum lycopersicum 4.78 51.33± 3.67 0.51 36.78± 4.56 0.37 2.8± 4.71 0.02 0.30
*GI (%) of chloramphenicol at 1 mg/mL for E.coli is 99.81%
*GI (%) of chloramphenicol at 1 mg/mL for B.subtilis is 98.38%
** AO activity of acid ascorbic at 1mg/mL is 168.33 µg AAE/mL
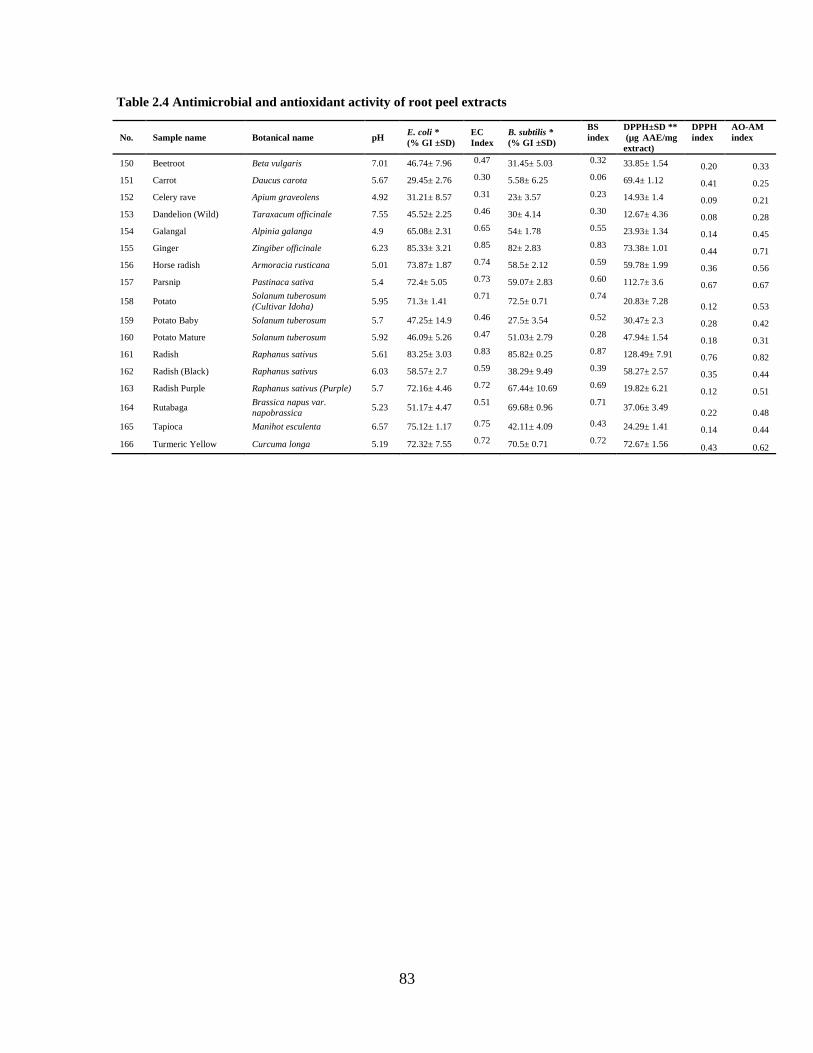
83
Table 2.4 Antimicrobial and antioxidant activity of root peel extracts
No. Sample name Botanical name pH E. coli *
(% GI ±SD)
EC
Index
B. subtilis *
(% GI ±SD)
BS
index
DPPH±SD **
(µg AAE/mg
extract)
DPPH
index
AO-AM
index
150 Beetroot Beta vulgaris 7.01 46.74± 7.96 0.47 31.45± 5.03 0.32 33.85± 1.54 0.20 0.33
151 Carrot Daucus carota 5.67 29.45± 2.76 0.30 5.58± 6.25 0.06 69.4± 1.12 0.41 0.25
152 Celery rave Apium graveolens 4.92 31.21± 8.57 0.31 23± 3.57 0.23 14.93± 1.4 0.09 0.21
153 Dandelion (Wild) Taraxacum officinale 7.55 45.52± 2.25 0.46 30± 4.14 0.30 12.67± 4.36 0.08 0.28
154 Galangal Alpinia galanga 4.9 65.08± 2.31 0.65 54± 1.78 0.55 23.93± 1.34 0.14 0.45
155 Ginger Zingiber officinale 6.23 85.33± 3.21 0.85 82± 2.83 0.83 73.38± 1.01 0.44 0.71
156 Horse radish Armoracia rusticana 5.01 73.87± 1.87 0.74 58.5± 2.12 0.59 59.78± 1.99 0.36 0.56
157 Parsnip Pastinaca sativa 5.4 72.4± 5.05 0.73 59.07± 2.83 0.60 112.7± 3.6 0.67 0.67
158 Potato Solanum tuberosum
(Cultivar Idoha) 5.95 71.3± 1.41
0.71 72.5± 0.71
0.74 20.83± 7.28
0.12 0.53
159 Potato Baby Solanum tuberosum 5.7 47.25± 14.9 0.46 27.5± 3.54 0.52 30.47± 2.3 0.28 0.42
160 Potato Mature Solanum tuberosum 5.92 46.09± 5.26 0.47 51.03± 2.79 0.28 47.94± 1.54 0.18 0.31
161 Radish Raphanus sativus 5.61 83.25± 3.03 0.83 85.82± 0.25 0.87 128.49± 7.91 0.76 0.82
162 Radish (Black) Raphanus sativus 6.03 58.57± 2.7 0.59 38.29± 9.49 0.39 58.27± 2.57 0.35 0.44
163 Radish Purple Raphanus sativus (Purple) 5.7 72.16± 4.46 0.72 67.44± 10.69 0.69 19.82± 6.21 0.12 0.51
164 Rutabaga Brassica napus var.
napobrassica 5.23 51.17± 4.47
0.51 69.68± 0.96
0.71 37.06± 3.49
0.22 0.48
165 Tapioca Manihot esculenta 6.57 75.12± 1.17 0.75 42.11± 4.09 0.43 24.29± 1.41 0.14 0.44
166 Turmeric Yellow Curcuma longa 5.19 72.32± 7.55 0.72 70.5± 0.71 0.72 72.67± 1.56 0.43 0.62
84
2.4.2 Antioxidant activity of fruit and vegetable extracts (DPPH assay)
The results of radical scavenging activity of 164 aqueous plant extracts are given in Table
2.1. A total of 67 samples out of the 164 displayed excellent radical scavenging activity of
the DPPH radical at >100 µg of AAE (ascorbic acid equivalent/mg of dry weight); where
the radical scavenging activity of ascorbic acid was 168.33 µgAAE/mg at the concentration
1mg/mL. The three best samples which exhibited exceptional anti-radial capacity were:
betel leaf (143.59 µg AAE/mg), green grape fruit (141.38 µg AAE/mg) and pomegranate
peel (141.34 µg AAE/mg). The other materials that exhibited strong antioxidant activity
(126-140 µg AAE/mg) were: avocado, custard apple, blueberry, black currant, cranberry,
jujuba, mangosteen, rambutan, raspberry, chicory lettuce, grape leaf, green tea, rosemary,
raspberry leaf and sea buckthorn leaf. Non-climacteric fruit had a significantly higher anti-
radical activity than the climacteric fruit (Figure 2.6)
The plant tissue type showed an effect on the DPPH radical scavenging capacity of the
extracts. Fruit peel extracts exhibited significantly higher DPPH radical scavenging
capacity in comparison to leaf tissue and root peel extracts (p<0.05) (Figure 2.7). The effect
of pH was also assessed, and there was a negative correlation between the pH of the
extracts and their DPPH value (r= -0.42) (Figure 2.8).
Surprisingly, the plants belonging to the family Brassicaceae (mustard family) genus
Brassica (broccoli, cabbage and brussels sprout) and family Amaryllidaceae, genus Allium
(endive, shallot, leek and onion) displayed a low antioxidant activity.
2.4.3 Correlation between the antimicrobial and antioxidant activity of plant extracts
The antimicrobial activity of the aqueous plant extracts could be positively correlated with
the antioxidant activity. As seen in Figure 2.8, the antioxidant activity, assayed by DPPH
radical scavenging capacity exhibited a good correlation with the antimicrobial activity
(growth inhibition) against E.coli (r=0.65) and B.subtilis (r=0.57)
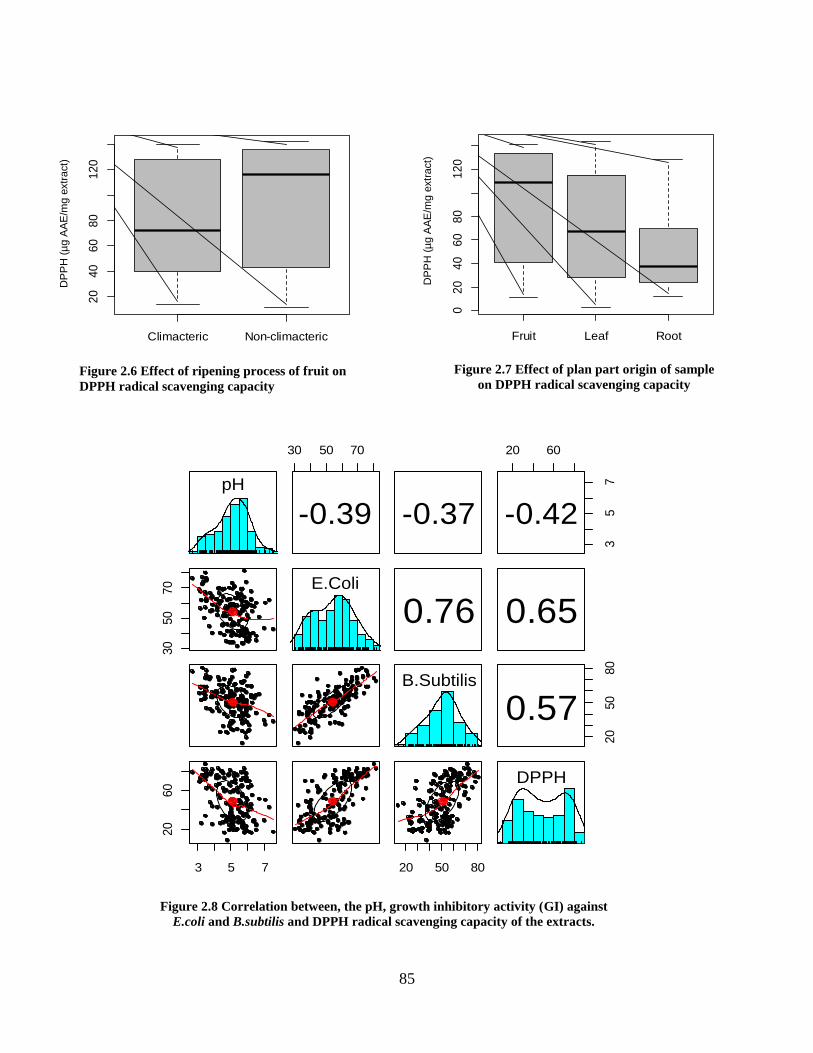
85
pH
30 50 70
-0.39 -0.37
20 60
35
7
-0.42
30
50
70 E.Coli
0.76 0.65
B.Subtilis
20
50
80
0.57
3 5 7
20
60
20 50 80
DPPH
Figure 2.8 Correlation between, the pH, growth inhibitory activity (GI) against
E.coli and B.subtilis and DPPH radical scavenging capacity of the extracts.
Climacteric Non-climacteric
20
40
60
80
12
0
Gro
wth
inh
ibiti
on
, %
)
Figure 2.6 Effect of ripening process of fruit on
DPPH radical scavenging capacity
DP
PH
(µ
g A
AE
/mg
extr
act)
Fruit Leaf Root
02
04
06
08
01
20
Gro
wth
inh
ibiti
on
, %
)
Figure 2.7 Effect of plan part origin of sample
on DPPH radical scavenging capacity
DP
PH
(µ
g A
AE
/mg
extr
act)
86
2.5 Discussion
2.5.1 Antioxidant and antibacterial activities of plant by-products
This study shows that plants can be a good source of antioxidant-antimicrobials; 67
samples out of 164 displayed radical scavenging activity of >100 µg of AAE and, 53% of
the samples showed >70% GI.
The anti-radical activity could relate to the phenolic compounds, carotenoids, ascorbic acid
and tocopherol content (El-Massry et al., 2009; Erden et al., 2013). The data suggests that
aqueous plant extracts are free radical scavengers and act as primary antioxidants that react
with DPPH radical, attributable to their H-donating or electron transferring ability (Huang
et al., 2005).
The results show that plant by-products may also be a potential source of antimicrobials.
Phenolic compounds (phenolic acid, quinones, flavonoid, flavones, flavonols, tannins,
courmarins), terpenoids, alkaloids, lectins, polypeptides and polyacetylenes are the major
classes of antimicrobial compounds from plants (Cowan, 1999). Antimicrobials from plant
sources can fatally affect various aspects of microbial cell function, metabolism and life
cycle by different mechanisms (Kohanski et al., 2010). They include capacity to acidify or
alkalinize cytoplasm, negatively impact cell membranes (anesthetics) and surface enzyme
activity. Furthermore, they can complex with proteins and metals, and also alter the redox
potential of the medium. Polycationic nature of molecules such as chitosan also contributes
to antimicrobial activity (El Ghaouth et al., 1992).
2.5.2 E. coli and B. subtilis sensitivity.
The hot water extracts of plants have a significant growth inhibiting potential against both
the test strains, although E.coli was found to be significantly more sensitive than B. subtilis.
Gram-negative bacteria are generally observed to be more resistant to antimicrobial
compounds due to its cell membrane structure (Cueva et al., 2010a; Perry et al., 2009).
However, other authors have reported that Gram-negative bacteria more susceptible to plant
extracts than Gram-positive bacteria (Gülçın et al., 2003; Pereira et al., 2007a). Consistent
with our observation, in particular, is the report of (Puupponen‐ Pimiä et al., 2001), where

87
phenolic extracts using acetone (70 %) according to the method of (Kähkönen et al., 1999)
from berry fruits including blueberry, raspberry, lingonberry, black currant, cloudberry, sea
buckthorn berry, strawberry, were found to inhibit the growth of Gram-negative, but not
Gram-positive bacteria. They explained that the difference in cell-wall structures between
Gram-negative and Gram-positive bacteria might be the likely basis for the difference in
their sensitivity to phenolic compounds.
The relatively higher sensitivity of the Gram-negative strain to the plant extracts can be
attributed to a variety of reasons. First, the composition of the plant extracts in their active
constituents and their corresponding function may be responsible for the plant extracts
being more active against the Gram-negative strain. The plant extracts that displayed
antimicrobial activity have also high concentrations of different organic acids. The weak
acids in the non-dissociated form, can more easily migrate through the lipid-containing cell
wall and cell membrane of Gram-negative bacteria (Dorman and Deans, 2000), and result
in acidification of the cytoplasm, thereby adversely affecting the microbial metabolism.
Second, hot water solvent that enhances the extract yields, is also efficient in extracting
phenolic acids, flavonoids, anthocyanins, tannins, saponins, terpenoids, polypeptides and
lectins (Cowan, 1999; Xu et al., 2008). These polyphenolic compounds exert antimicrobial
activity in a concentration-dependent manner (Dorman and Deans, 2000; Medina et al.,
2006b; Tajkarimi et al., 2010), where their activity generally depends on compromising the
integrity of cell membrane and/or disruption of the proton motive force (membrane
potential) (Helander et al., 1998b; Heller et al., 1999; Matsuzaki, 1998; Nowakowska,
2007; Rauha, 2000; SantiestebanLópez, 2007; Scalbert, 1991). Phenolic acids can pass
through the lipid membrane and in the process disrupt the cell surface enzyme rendering
them inactive (Cueva et al., 2010a). Hydroxy-cinnamic acids, due to their propanoid side
chain, are less polar than the corresponding hydroxy-benzoic acids, and this property might
facilitate the transport of these molecules across the cell membrane (Campos et al., 2003).
Presence of permeabilizers, amphipathic molecules, and polyphenolic compounds capable
of specifically interacting with the phospholipid membrane, may in combination
compromise the integrity of the outer lipid; thereby, rendering the Gram-negative bacteria
comparatively more sensitive and vulnerable compared to Gram positive bacteria.
However, to validate the result further, the antimicrobial activity needs to be tested against

88
a wider spectrum of bacteria, also, the nature of the compounds in the extract need to be
determined to come to a firm conclusion.
2.5.3 Effect of pH of extracts on AM and AO properties
As expected, the pH of the extract was a factor influencing the GI, which was inversely
related to the pH of the extract against both bacteria (Figure 2.8), as the organic acids
present in the extracts in the non-dissociated form can enhance the antimicrobial activity of
weak acids. This is in accordance with similar studies done on plant derived antimicrobials
(Gutierrez et al., 2008; Hsieh et al., 2001). The inhibitory effect of plant extracts is
generally greater at acidic pH values (Campo and Amiot, 2000). The susceptibility of
bacteria to polyphenolic antimicrobials also appears to increase with lower pH values since
the hydrophobicity of compounds, such as terpenoids, flavonoids increases at low pH,
consequently enabling easier dissolution in lipid rich cell membrane of target bacteria
(Juven et al., 1994). The mode of action of phenolic acids is based on the ability of their
non-dissociated form to pass through the negatively charged outer membrane. Thus, the
membrane acts as a barrier for the conjugated base forms of acids. In their non-dissociated
state (pH below the pKa value of the acid), the acids may alter the membrane permeability
and interfere with enzymatic processes in the cell (Davidson and Branen, 2005). The pKa
of most of the organic acids lies between pH 3 and 5. Since the cytoplasmic pH is generally
higher than that of the growth medium, the weak acid dissociates, releasing the protons and
leading to acidification of the cytoplasm (Cotter and Hill, 2003). Plant phytochemicals can
be found in different chemical forms, which depend on their inherent pH. In the acidic pH,
the antioxidant activity of polyphenols would be significantly higher and would decrease
proportionately with increases in the pH, due to the deprotonation of hydroxyl groups.
Furthermore, resonance and delocalisation of electrons depending on the type of attached
electronegative group also plays a vital role.
As most of the processed foods are in the slightly acidic pH range, the increased AM
activity at acidic pH would be an advantage; although, these results need to be supported
with investigation of the effect of changing pH on the antioxidant and antibacterial activity
of plant extracts.
89
2.5.4 Effect of physiological type of fruit: climacteric vs. non-climacteric
The antioxidant and antimicrobial activity of fruit peel was also analyzed according to the
classification based on their ripening characteristic. Fruits have been classified as
climacteric or non-climacteric, depending on whether or not a fruit exhibits a peak in
ethylene production and respiration during ripening. Environmental factors such as
temperature and sunlight affect plant secondary metabolism. Variation in the climate has
also been seen to affect the accumulation of phytochemical compounds in plants
(Schreiner, 2005). The difference in the distribution of phytochemical compounds is also
seen to vary between the cultivar types and geographical region. In the case of lettuce
cultivars, some are very poor in flavonoids and other phenolic compounds, whereas other
types contain larger amounts of flavonols and anthocyanins (DuPont et al., 2000). This
variation may explain the different antimicrobial activity observed, as the antimicrobial
potential of a plant extract is ultimately linked to their phytochemical composition.
Non-climacteric fruits are generally grown in temperate climates where the average
temperature lies between 0 and 20° C, with the nights being colder (McKnight and Hess,
2000). This diurnal variation in the minimum temperature means that the plants are
subjected to an abiotic stress due to the cold temperature, in comparison to climacteric
fruits growing in the tropical regions; where typically, the minimum temperature is at least
18° C (McKnight and Hess, 2000). The plants growing in cold regions respond to cold
stress by increasing secondary metabolism and in turn phytochemical concentration (Gould,
2004; Oh et al., 2009). For example, it was observed that daily mean temperatures below
16.5°C were beneficial for the β-carotene synthesis in broccoli (Shewfelt and Brückner,
2000), whereas the best temperature was 18°C for carrots (Rosenfeld et al., 1998).
Beneficial temperatures for lycopene formation in tomato were found in the range from
16°C to 21°C (Gross, 1991). The increased concentration of various phytochemicals such
as phenolic acids, flavonoids may explain the comparative higher antimicrobial and
antioxidant activity of non-climacteric fruits. In addition, non-climacteric fruits, generally,
tend to contain higher level of ascorbic acid and tocopherols than the climacteric fruit
(Hernández et al., 2006; Rodriguez-Burruezo et al., 2010). Furthermore, the climacteric
fruits undergo respiratory surge before ripening, subjecting them to oxidative stress, which

90
can possibly deplete the stored antioxidant compounds to some extent. Moreover, with
advances in senescence, their ability to synthesize bioactive compounds may be
significantly compromised. The climacteric behaviour, regardless of the climatic habitat,
appears to be a more plausible factor contributing to the differences in the activity of fruits.
For example, non-climacteric and tropical fruits such as pomegranate or rambutan exhibit
higher activities (Table 2.2) than apple, a climacteric and temperate fruit (Table 2.1).
2.5.5 Effect of plant tissue type
The type of plant tissue (fruit, leaf and root) also had an effect on the inhibitory activity of
the extracts. The presence of polyphenols is ubiquitous in the plant kingdom, but their
presence may greatly vary, because of differences in exposure to light and other
environmental stresses. Consequently, these compounds are usually found at higher
concentrations in leaves and outer parts of plants, compared to the subterranean organs,
where they are present in trace amounts (Herrmann, 1988). Furthermore, plants produce a
diverse array of constitutive and/or induced secondary metabolites (phenylpropanoids,
flavonoids, terpenoids, glucosinolates and alkaloids), varying in concentration and
composition in different plant organs, which can impact antimicrobial and antioxidant
activities or other bioactivities of the extracts derived from them (Cowan, 1999). Berries
and fruits contain a wide range of phenolic acids, which makes them less vulnerable to
bacterial spoilage (Hamad, 2012). Fruit residues were found to possess strongest
antioxidant properties (Deng et al., 2012). Leaves and fruit peels have also been shown to
exhibit significant antioxidant activity (Lombardo et al., 2010; Siddhuraju et al., 2002).
Similar to our finding, leaves, fruit peels, pomace, fruit residue, grape and olive residue,
plant-food processing by-products have been shown to have a higher antimicrobial activity;
and in general, a higher bioactive potential than other parts of the plant such as flowers,
seeds, roots or stems (Riihinen et al., 2008; Romani et al., 2003; Siddhuraju et al., 2002;
Silva et al., 2014; Wijngaard, 2009).
2.5.6 Antioxidant activity of Brassica and Allium extracts
In our screening, extracts from broccoli, cabbage, Brussel sprout, endive, shallot, leek and
onion displayed a low antioxidant (DPPH) assay value. This was in contradiction to the
91
prevailing knowledge about these plants. Allium and Brassica vegetables have long been
recognized for antioxidant activity. The principal bioactive compounds of Allium and
Brassica are commonly referred to as thiosulfinates and glucosinolates (unique to
Brassica). Specific examples include allicin (S-allyl-L-propenethiosulfinate) and methyl
methanethiosulfonate, present in Allium and Brassica, respectively.
An antioxidant is a molecule that inhibits the oxidation of other molecules while being
oxidized itself; meaning that antioxidants are often reducing agents (Sies, 1997). During the
extraction process, the maceration of the cruciferous plant tissue the enzyme myrosinase
cleaves off the glucose moiety in the glucosinolate from a isothiocyanates, thiocyanates and
nitrites depending on the pH of the medium (Burow et al., 2007). For the plants of the
Allium family the enzyme alliinase would act on the S-alkyl-L-cysteine S-oxides to yield
alkyl sulfinates. Further, once subjected to hot-water extraction, the thiosulfinates would
yield simpler thiol derivatives owing to thermal degradation (Oerlemans et al., 2006).
Direct thermal degradation of glucosinolates is also known to produce a variety of thiol
derivatives (Jin et al., 1999). These authors found that increasing the temperature of the
aqueous solutions increased the rate of formation of degradation products. Compounds
identified were dimethyl disulfide, S-methyl methyl-thio-sulfinate, S-methyl methyl-thio-
sulfonate and methyl (methyl-thio) methyl-disulfide. The major volatile compounds
generated by thermal degradation of alliin (S-allyl-L-cysteine sulfoxide) are di-allyl
sulfides (mono-, di-, tri-, and tetra-sulfide) and allyl alcohol, with the types of compounds
formed from alliin depends mainly on temperature of heating, water activity of the medium
and time of heating (Kubec et al., 1997). All of these organosulphur compounds and thiol
derivatives, thus formed have an important effect on the antioxidant properties of the
extracts from Allium and Brassica families. Thiols are organosulphur compounds that
contain a carbon-bonded sulfhydryl group (–C–SH or R–SH). They are one of the few
compounds, which are able to remove O2∙− , H2O2, although the rate constants for these
reactions are low, generally <103M-1*s-1 (Halliwell, 1995). Therefore, only very high thiol
concentrations would have any significant antioxidant effect. Furthermore, the reactive
oxygen species formed from H2O2 such as (HO•) hydroxyl radical, can react with thiols to
produce thiyl radicals (RS•) which can also combine with oxygen to give reactive
oxysulphur radicals such as RSO• and RSO2• (thiyl peroxyl) (Halliwell, 1995; Manoj et al.,

92
2011). These oxysulphur radicals formed can further react with other polyphenols and
antioxidant compounds present in the extract, which will render them unavailable to react
with the DPPH radical, resulting in a reduced radical scavenging activity, thereby
decreasing the absorbance. The lower rate constant of reaction of thiols with ROS and the
formation of oxysulphur radicals may also be a possible reason behind why thiol containing
plant extracts did not exhibit a significant radical scavenging activity.
It is possible that hot water may not be a suitable medium for extraction for these plant
species rich in sulfur compounds that are prone to thermal degradation. On the other hand,
the DPPH assay may not be suitable assay as it is also possible that the antioxidant thiols
may be converted to thiyl radicals in the presence of reactive oxygen species such H2O2,
formed during extraction, can react with antioxidant compounds in the extract, rendering
the latter unavailable for scavenging the DPPH radical.
2.5.7 Correlation between antioxidant and antimicrobial activities
The result showed there was good correlation between the antioxidant and antimicrobial
activity against E.coli (r=0.65) and B.subtilis (r=0.57), suggesting that plant-derived
bioactive compounds have the potential to act both as antimicrobial and antioxidant
compounds. This dual nature of bioactivity can be presumably attributed to oxygen
scavenging ability of certain constituents present in the extracts, a characteristic desirable
for inhibition of aerobic microbial growth as well as antioxidant activity.
Among the phytochemicals, polyphenols are a group of secondary metabolites are
associated with antioxidant activity. The relation between phenolic content and antioxidant
activity has been fairly well documented (Medina et al., 2006a; Nehete et al., 2010). They
also play an important role in plants, providing protection against pathogens and predators
(Bravo, 1998). In addition, several studies have demonstrated antimicrobial activity of
phenols and/or phenolic extracts (Pereira et al., 2007b; Pereira et al., 2006; Proestos et al.,
2005; Rauha et al., 2000). A number of studies have reported that the antioxidants also have
antimicrobial activity (Daglia, 2012a; Djenane et al., 2012; Jia et al., 2010; Katalinić et al.,
2010; Ortega-Ramirez et al., 2014). In particular, the fungi are found to be very sensitive to
antioxidants, presumably, due to depletion of oxygen in the system by antioxidants, which
93
is required for metabolism of aerobic bacteria and fungi. The common phenolic
antioxidants used in food such as BHA (butylated hydroxy anisole), BHT (butylated
hydroxy toluene) and TBHQ (tertiary-butyl-hydroquinone), are also known to exhibit anti-
fungal properties (Passone et al., 2008).
2.5.8 Antioxidant-antimicrobials index (AO-AM Index)
Knowing the plant extracts have both antioxidant and antimicrobial properties to varying
extents, an empirical evaluation was performed in order to identify potent antioxidant-
antimicrobial plant extracts by using the empirical index, giving a higher weight to
antimicrobial activity:
Antioxidant-antimicrobial index = (EC index+BS index+DPPH index)/3
where, EC index is the inhibitory activity (GI) index of extracts against E. coli (the ratio of
the GI of the test samples at 10 mg/mL to that of chloramphenicol at 1 mg/mL (inhibition
of 99.81%); BS index is the inhibitory activity index of extracts against B. subtilis; and
DPPH index is the antioxidant activity of the test samples (the ratio of antiradical activity
of the samples at 1.0 mg/mL to that of ascorbic acid at 1 mg/mL (168.88 µg AAE/mg).
The AO-AM indices are presented in Tables 2.1- 2.4. On this classification, none of the
root or climacteric fruit extracts displayed AO-AM index values of > 0.85. The leaf extracts
possessing high values were: betel, rosemary, lemon grass, cranberry, sea buckthorn and
spinach. The non-climacteric fruit extracts were: black currant, green grape (wine), olive oil
mill effluent, pomegranate, rambutan, raspberry, egg plant and Indian plum.
A small number of extracts from were identified as antioxidant-antimicrobials; and
interestingly, they are mostly non-climacteric fruit sources, while some are leaf materials. It
would seem that these materials are concentrated in few classes of phyto-compounds, in
contrast to climacteric fruit sources that they may contain a variety of phytochemical
classes but at low concentrations. Although the antioxidant activity of the selected extracts
is reasonably comparable to ascorbic acid, their antimicrobial activity is not comparable to
synthetic food preservatives such as benzoate or sorbate, and that their application as
antimicrobial agents would require higher concentrations. Because they inherently possess
94
antioxidant activity, their incorporation at high concentrations would impart to foods added
advantages of health benefits as well as improved protection of foods against oxidation.

95
2.6 Conclusions
The screening of various fruit and vegetable sources including by-products and wastes
permitted the identification of potential antimicrobial extracts exhibiting antioxidant
property. The pH of the extract, type of tissue, and the difference in physiology of fruit also
significantly affect the bioactive properties investigated. The results show that the
antioxidant and antimicrobial properties of the plant extracts are related. The AO-AM index
of the study could be used in the evaluating and selection of bio-actives from plant sources.
This index can be potentially used as the basis of investigating the mode of antimicrobial
action and the physicochemical properties of the molecules responsible for the bioactive
properties. Furthermore, the structure-function relationship of the bioactive compounds
responsible for the antioxidant-antimicrobial activity need to be investigated, which would
help in getting a better understanding of the bioactive properties of plant-derived
compounds. The plant extracts could be a safe, health-beneficial and economical food
preservation agent with antimicrobial and antioxidant properties.

96
Chapter 3 ANTI-RADICAL POWER (ARP) OF PLANT EXTRACTS: A NEW
MEASURE OF ANTIOXIDANT PROPERTY FROM DPPH ASSAY
La capacité antioxydante ne décrit que la valeur quantitative du test antioxydant, tandis que la qualité
d’antioxidante a été toujours inaperçue dans l'étude de réaction d'antioxydant. Dans cette étude, la vitesse
de piégeage des radicaux (facteur du temps) pour définir l'efficacité réelle (capacité) du système anti-
oxydant a été considérée comme la meilleure manière d’exprimer avec plus de fiabilité le pouvoir anti-
oxydant réel. La nouvelle expression, le pouvoir antiradicalaire - ARP, produite à partir du test DPPH, peut
être plus utile pour identifier l'activité anti-oxydante des échantillons biologiques. Certains échantillons
présentaient une valeur ARP élevée tels que les extraits de rambutan, feuille de canneberge, feuille de bleuet,
feuille de vigne (sauvage), feuille de framboise, feuille de bétel, avocat, grenade et cherimoya. Les extraits de
feuilles possèdent, en général, une valeur d’ARP supérieure à celle des fruits tandis que, les extraits de
racines présentent les plus faibles ARP. De plus, cette étude montre également que le nombre moyen
d’oxydation du carbone de mélanges complexes tels que des extraits de plantes peut prédire leur pouvoir
anti-oxydant, en dépit de la disparité entre les tissus de feuilles et de fruits.
97
3.1 Abstract
DPPH radical assay is a reliable method to determine the antioxidant capacity of biological
substrates. The DPPH radical scavenging activity is generally quantified in terms of the
capacity of antioxidants to quench the pre-formed free radicals, and is a typically employed
parameter to express the antioxidant activity and to compare the activity of different
substrates. But antioxidant capacity only describes the quantitative value of antioxidant
assay, while quality of antioxidant efficacy has always been unaccounted for. In this study,
the rate of radical quenching was measured along with capacity in the DPPH assay. The
anti-radical power (ARP) that takes into consideration of both the rate (time factor) and the
actual efficacy (capacity) of antioxidant systems was found to be a better measure of
antioxidant activity. Among all tested extracts, rambutan, cranberry leaf, blueberry leaf,
grape leaf (wild), raspberry leaf, betel leaf, avocado, pomegranate, custard apple, grape
red, grape leaf, grape red (wine), mangosteen, indian plum were found to have ARP value
more than 200 mg-1.min-1. Leaf extracts possess, in general, higher ARP than fruits, and
root extracts possess low ARP. Average carbon oxidation number (ACON) of complex
mixtures such as plant extracts may portend their antioxidant power, in spite of apparent
disparity between leaf and fruit materials.
Keywords: DPPH• radical, capacity, rate, oxidation number

98
3.2 Introduction
Oxidation occurs in many living organisms, and it is an essential process for the production
of energy and fuel the biological processes smoothly. The continuous generation in vivo of
oxygen-centered free radicals as well as other reactive oxygen species (ROS) during
metabolic processes result in cell death and tissue damage. The role of oxygen radicals has
been implicated in several diseases, including cancer, diabetes and cardiovascular diseases,
aging, etc. (Halliwell and Gutteridge, 1999). Human body has multiple enzymatic and non-
enzymatic anti-oxidant systems that protect the cellular molecules against ROS induced
damages. However, severe or continued oxidative stress makes the innate defenses
insufficient for total protection. Hence, in order to balance the ROS in human body certain
amounts of exogenous anti-oxidants are constantly required to maintain adequate levels of
anti-oxidants.
Anti-oxidants play a significant role in protecting the body from damage caused by free
radical- induced oxidative stress (Ozsoy et al., 2008). Natural anti-oxidants, like
polyphenols, found in medicinal and edible plants, are very effective in preventing
oxidative damages (Silva et al., 2005). Such activity is due to the structure of the
polyphenols, which helps to eradicate free radical, and in vitro they have been shown to be
more effective anti-oxidants than tocopherols and ascorbate. Ability of the polyphenol-
derived radicals to stabilize and delocalize the unpaired electron throughout the structure,
and to chelate transition metal ions makes polyphenols ideal antioxidants (Rice-Evans et
al., 1997). Synthetic antioxidants such as butylated hydroxyl anisole (BHA) and butylated
hydroxyl toluene (BHT) are used at regulation limits to protect the quality of food by
retarding oxidation (Taghvaei and Jafari, 2015). However, there are some serious problems
concerning the safety and toxicity of such synthetic antioxidants due to their metabolites
and their possible absorption and accumulation in the body organs and tissues (Chen and
Tappel, 1996).
Antioxidants exert their action through simple or complex mechanisms including
prevention of chain initiation, binding with transition metal ion catalysts, decomposition of
peroxides, prevention of continued hydrogen abstraction, and radical scavenging (Sharma
and Singh, 2012). Till date, many in vitro tests are available from a simple chemical assay
performed in an homogeneous solutions to more complex methods using exogenous

99
sensitive probes to detect oxidation, like oxygen radical absorbance capacity (ORAC),
conjugated autoxidizable triene assay or use of fluorescent probes to detect oxidation
(Grajeda-Iglesias et al., 2016). Although many literature methods do not distinguish
between “antioxidant capacity” and “antioxidant activity” of non-enzymatic antioxidants,
end-point assays measuring the efficiency of antioxidant action (i.e., reactive species
inactivation) are not often differentiated from kinetic-based assays measuring reaction rate.
Antioxidant capacity, i.e., the capacity of antioxidants at a specific concentration to
neutralize radicals present in the reaction mixture, is reported often as their antioxidant
activity (Huang et al., 2005; Kurilich et al., 2002; Niki and Noguchi, 2000; Prior et al.,
2005). More recently however, some reports express the antioxidant activity based on the
kinetics of the redox reaction, and the time required for reduction of 50 % of the radicals
present in the reaction mixture (Philip, 2004; Sharma and Bhat, 2009). The complexities
and physiological applications of antioxidants, either separately or in mixtures, require
rigorous consideration and analysis of all aspects of the chemistry, reaction mechanisms,
and reaction/ radical/target specificity in various test systems, as well as careful and
accurate measure of all reactants and products involved. The DPPH radical assay for
estimating antioxidant activity has been used commonly since the last 20 years and
considered as the most important artificial radical to enlighten the scientific knowledge on
free radicals.
Thus, it is desirable to establish and standardize antioxidant assay methods that can
measure the real antioxidant power directly for all classes of anti-oxidants, irrespective of
their origin, either plant-based extracts or biological fluids. In this context, this study
proposes to determine the antioxidant activity by “Anti-Radical power” that takes into
account both antioxidant capacity, i.e., at at a fixed concentration and time point to
scavenge radicals and the rate at which the radicals are scavenged.

100
3.3 Materials and methods
3.3.1 Plant materials
Hundred and forty plant materials were obtained fresh from fields in and around Quebec
City. The plants materials that were investigated are presented in Table 1. Upon arrival to
the laboratory, samples were washed with water and bleaching agents (NaOCl-300 ppm) to
remove dirt and debris. Subsequently within 48 hours, they were deep frozen, lyophilized,
ground to powder, vacuum-sealed and stored at -30°C until ready for extraction.
3.3.2 Chemicals and reagents
Ascorbic acid and 1,1 diphenyl-2-picrylhydrazine (DPPH) were purchased from sigma-
Aldrich (Canada). All reagents used in this investigation were of analytical grade.
3.3.3 Plant extract preparation
About 50 gram of the lyophilized powder of raw sample was extracted in 500 mL of
distilled water at 85-90°C for 60 minutes with constant stirring. The slurry was then
vacuum filtered (Whatman No. 1 filter paper), and the filtrate was concentrated under
vacuum using a rotary evaporator at 65°C to about 100 mL and then lyophilized. The
lyophilized extracts were vacuum-packed and stored at -30oC until further use. The stock
solution of plant extract at 1.0 mg/mL was prepared in distilled water before the test
performed.
3.3.4 DPPH free radical scavenging assay
Free radical scavenging capacity, the main mechanism by which antioxidants protect foods
against oxydation, was determined by DPPH assay (Faleiro et al., 2005). The DPPH radical
scavenging was analysed through a standard spectrophotometric method (Sharma and Bhat,
2009) with modifications. A stock solution of DPPH (6.1x 10⁻⁵ M) was freshly prepared in
methanol and was used immediately. The DPPH stock solution was diluted with methanol
and adjusted to O.D of 0.7 (± 0.02) at 517 nm. Subsequently, 190 µL of the DPPH solution
was pipetted out into 96 wells microplate (Becton Dickinson Falcon 353072), followed by
addition of 10 µL of the test plant extract (1.0 mg.mL-1). Thereafter, the plate was

101
incubated in a spectrophotometer (Biotek Power XS2) at 25°C for a period of 1 hour, with
absorbance readings (517 nm) recorded every 1 min. The assays were carried out in
triplicate.
Radical scavenging capacity (%) = [(Ao − A1)/Ao ] × 100
where, Ao was the absorbance of the control sample (without plant extract) and A1 was the
absorbance in the presence of the test sample.
The rate of radical scavenging was determined from the slope of the initial linear part of the
quenching curve (Figure 3.1), typically within 10 min of the quenching reaction.
where, rate is given in min-1; y is given in O.D. unit; and t is time of the reaction (min).
3.3.5 Elemental and metal analyses
The element analysis was carried out by Material Characterization Center, Sherbrooke
University, Canada. The equipment SC632 (LECO cooperation) was used to analyze
carbon and sulfur, Truspec for Nitrogen and Hydrogen and micro Truspec for Oxygen.
Briefly, for the determination of carbon, hydrogen, nitrogen and sulfur, the sample falls in
a furnace at 1100°C filled with oxygen for a very fast and complete combustion. The
detection and quantification of the elements (carbon, hydrogen and sulfur) were performed
by infra-red cells, and nitrogen detected by thermal conductivity. Oxygen was analyzed
independently, where the material was pyrolized in an oven at a temperature of 1300°C
equipped with Truspec for detection and quantification by infrared cells.
The metals (Cu, Fe, Mn) were analyzed by Department of Wood Sciences, Laval
University, Quebec, Canada. The samples were dissolved according to Microwave assisted
acid digestion. The sample solutions were then analyzed on an ICP-OES Optima4300DV
(Perkin-Elmer) (Barnes, 1997).
102
3.3.6 Reaction kinetics and calculation of reaction rate constants
A number of competing reactions may take place during ROS/radical processing, either in
series or in parallel in a complex biomaterial as a plant extract. The complete removal of
radicals may be the results of many interacting and complex reactions rather than a single e-
transfer step. An effective first-step kinetic modeling is to study simple e-/H+ transfer
systems rather than real radical scavenging (Huang et al., 2005). Chemical reaction kinetics
can be applied to quantify individual attribute of an ideal antioxidant system in form of the
general rate law (Van Boekel, 2008):
nkPdt
dP (1)
where, k is the rate constant (min-1), t the reaction time (min), and n is the order of the
reaction. In general, P represents a quantitative value for units of e-/H+ donating molecules
in the extracts. The core of kinetic studies on radical scavenging is to quantify an
antioxidant attribute as a function of time. Under specified conditions, using oxidation-
dependent reaction rate constants after the order of that reaction is determined. The order of
reaction is determined based on the goodness of fit of the observations to a pre-selected
reaction order model. Kinetics of antioxidant potential is an unclear phenomenon, and has
been speculated as zero-, first-, or second-order reactions as follows:
P = P0–kt for zero−order reactions (n=0) (2)
P = P0e-kt for first−order reactions (n=1) (3)
1/P = kt + 1/P0 for second−order reactions (n=2) (4)
where, P0 is the initial value of the antioxidant activity at t=0.
Calculation of reaction rate constant:
DPPH• scavenging reaction kinetics was followed as described earlier in methanol medium
(Mishra et al., 2012; Suja et al., 2004). Scavenging reaction between [DPPH•] and the
antioxidant [AH] is represented by Eq. (5-7), assuming secondary reactions may be of
limited occurrence.
[DPPH•] + [AH] ↔ [DPPH-H] + [A•] (5)
[DPPH•] + [e-/H+] ↔ [DPPH2] (6)
[A•] + [A•] ↔ [A-A] (7)

103
The order of reaction of [DPPH•] and [AH] depends on the relative concentration of the
reactants, and hence, it can be expected to follow second order kinetics. Since the
concentration of DPPH• is fixed at 0.1mM and with increasing concentration of antioxidant
such that ([DPPH•]<< [AH]), the reaction may follow a pseudo-first order kinetics as
shown in Eq. (8)
r = k [DPPH•][AH] (8)
where, r is the overall reaction rate.
Since [DPPH•] << [AH]
r = k [DPPH•], (9)
Equation (9) can be also written as:
DPPHkdt
DPPHd (10)
Integrating equation (6):
ln[DPPH•] = ln[DPPH•]o- kobst (11)
Or [DPPH•], = [DPPH•]o. e- kt (12)
Thus, the time required to obtain saturation, will be dependent on concentration and the
type of antioxidant.

104
3.3.7 Anti-Radical Power (ARP): The overall antioxidant activity
Calculation of antioxidant activity
The overall anti-oxidant activity = Antioxidant capacity x Conversion rate (or radical
scavenging rate), where, capacity signifies the maximum steady state equilibrium and
Conversion rate signifies the velocity of the reaction.
The reaction is:
DPPH•+ AH k
DPPH2 + A (13)
where k = reaction rate constant, and AH = Antioxidant
With complete conversion, [DPPH2] = [DPPHo]
AH
A
AHDPPH
ADPPHKeq
2
Velocity of reaction,
S
Sk
eff
where, Seff = Effective concentration of antioxidant in the sample
So = Concentration of the sample
dt
ODdk
)(
and the decrease in OD is the measure of DPPH• scavenging by antioxidant.
So, the overall antioxidant activity or anti-radical power (ARP) is defined as:
S
Sk
AH
AARP
KARP
eff
eq
Placing [AH] = [Seff]
AH
AkARP
where, DPPHA
and thus,
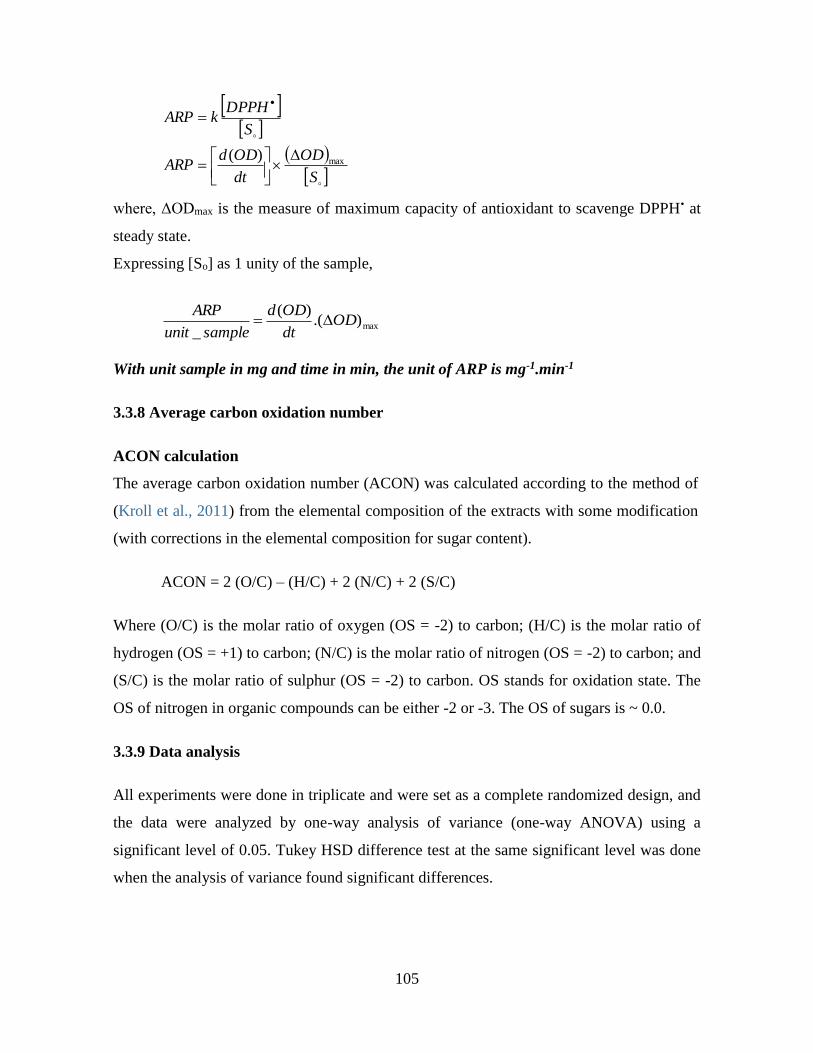
105
S
OD
dt
ODdARP
S
DPPHkARP
max)(
where, ΔODmax is the measure of maximum capacity of antioxidant to scavenge DPPH• at
steady state.
Expressing [So] as 1 unity of the sample,
max).()(
_OD
dt
ODd
sampleunit
ARP
With unit sample in mg and time in min, the unit of ARP is mg-1.min-1
3.3.8 Average carbon oxidation number
ACON calculation
The average carbon oxidation number (ACON) was calculated according to the method of
(Kroll et al., 2011) from the elemental composition of the extracts with some modification
(with corrections in the elemental composition for sugar content).
ACON = 2 (O/C) – (H/C) + 2 (N/C) + 2 (S/C)
Where (O/C) is the molar ratio of oxygen (OS = -2) to carbon; (H/C) is the molar ratio of
hydrogen (OS = +1) to carbon; (N/C) is the molar ratio of nitrogen (OS = -2) to carbon; and
(S/C) is the molar ratio of sulphur (OS = -2) to carbon. OS stands for oxidation state. The
OS of nitrogen in organic compounds can be either -2 or -3. The OS of sugars is ~ 0.0.
3.3.9 Data analysis
All experiments were done in triplicate and were set as a complete randomized design, and
the data were analyzed by one-way analysis of variance (one-way ANOVA) using a
significant level of 0.05. Tukey HSD difference test at the same significant level was done
when the analysis of variance found significant differences.

106
3.4 Results and discussion
Oxidation can be attenuated by antioxidants by different mechanisms, including scavenging
radicals, but also by sequestering metal ions, decomposing hydrogen peroxide and/or
hydro-peroxides, quenching active pro-oxidants, and repairing protein damage (Rahman,
2007). Some are potent radical-scavenging antioxidants, but are poor antioxidants against
lipid peroxidation by lipoxygenase (e.g., -tocopherol) (Niki and Noguchi, 2000).
Carotenoids are weak radical-scavenging antioxidants but can be potent inhibitors of the
oxidation induced by singlet oxygen (Niki and Noguchi, 2000). The activity of the
antioxidants in vivo is determined not only by the reactivity toward radical, but also by
several other factors such as concentration, distribution, localization, fate of antioxidant-
derived radical, interaction with other antioxidants, and metabolism. Plant extracts contain
a mixture of compounds with potential antioxidant activity at varying concentrations. They
may also perform this function by different mechanisms. Although DPPH radical assay
monitors essentially the quenching of the radical, other reactions that take place may
interfere this process. Consequently, the overall antioxidant activity of the extracts is
revealed.
3.4.1 Estimation of antioxidant activity by DPPH• assay
The stable radical, DPPH•, has been used widely for the determination of the free radical
scavenging activities of pure antioxidant compounds such as plant and fruit extracts and
food materials. The assay is based on the reduction of DPPH• in methanol, which causes a
decrease in absorbance at 517 nm as DPPH• is reduced. The absorbance decreases, noted by
color change from purple to yellow, as the radical is scavenged by antioxidants present in
the extract by donation of hydrogen to give the reduced form of DPPH–H (equation (5)). In
this study, decrease in the absorbance at 517 nm due to DPPH reduction was measured in
the presence of the plant extracts until the antioxidants in the extract were depleted under
pseudo-first order assay conditions. The pseudo-first order rate constant, k is linearly
dependent on the concentration of initial radical scavenger (AH).
.

107
3.4.1.1 Antioxidant capacity
The fall in absorbance is an indicator of the capacity of radical scavenging activity of
extract, and is expressed as percentage of decrease in the absorbance at steady state. The
time course of the scavenging of DPPH• radical by a few plant extracts and ascorbic acid is
shown in Figure 3.1 Some extracts exhibited the extent of radical quenching capacity (or
capacity) as ascorbic acid (e.g., betel leaf and grape leaf extracts). While betel leaf extract
neutralized the radical at a faster rate similar to ascorbic acid, grape leaf extract quenched
the radical at a slower rate. Strawberry leaf extract on the other hand, quenched the radical
to a smaller extent than ascorbic acid, and also at somewhat smaller rate than ascorbic acid,
but faster than grape leaf extract. Although, in general, extracts having higher radical
scavenging capacity scavenge the DPPH• at a higher rate, and those with lower capacity
took longer to reduce the amount of DPPH• present in the reaction mixture; it was not as
straight forward, as seen for grape leaf extract (Figure 3.1).
Figure 3.1 Time course of DPPH• scavenging by selected extracts

108
The antioxidant capacity as determined by DPPH assay of 140 plant extracts is shown in
Table 3.1. The antioxidant capacity of all the extracts ranged from 1.2 to 74.76 %. It was
found that there wasn’t significant different between capacity of fruit extracts and that of
leaf extracts (p=0.05). However, when taking account only ten top performances, leaf
extracts (73.42 %) showed higher capacity than climacteric fruit extracts (69.81 %). The
antioxidant capacity of the extracts ultimately depends on the composition of the extracts,
nature and concentration of phytochemical compounds in the extract mixture that exhibit
may possess with varying scavenging capacity, and in this case, the scavenging of DPPH•
radical.
3.4.1.2 Rate of radical scavenging
The reaction of DPPH• with antioxidant is basically a kinetic driven process. Thus in this
study, an attempt was made to assess the nature of kinetic behavior of disappearance of
DPPH• with ascorbic acid (1.0 mg/mL) and various plant extracts. Time course of the
reaction was monitored for individual extracts till steady state under conditions of substrate
depletion, i.e., maximum decrease in DPPH• radical was reached (Figure 3.1). It was clear
that DPPH• scavenging by extracts occurred at different rates. In a similar kinetic scan of
plant extracts, the time to reach the steady state was found to be between 20-30 min
depending upon concentration. However, a time duration of 20-30 min is usually
considered by most authors in fixed reaction time mode for estimation of antioxidant
capacity (Foti, 2015), although our measurements showed that the time to attain steady
state may vary, depending on the nature of antioxidants. The reaction of ascorbic acid with
DPPH• is very fast and attains completion within few minutes (Brand-Williams et al.,
1995), 8 minutes for this study (Figure 3.1). The time required to achieve saturation is
highest for standards like, ascorbic acid, BHT and gallic acid. Plant extracts found to show
a wide range of variability to attain saturation. Regardless of the capacity, antioxidants can
be categorized as slow, medium and fast on the basis of their rate of reaction. The kinetics
of scavenging was found to be concentration-dependent, where scavenging rate increases
with increase in concentration of the extracts (Jha et al., 2014).

109
Table 3.1 Antioxidant activity of fruits and vegetables by products extracts
Sample name Scientific name pH
Rate
(min-1)
Capacity
(%)
ARP
(mg-1.min-1)
Acid ascorbic (1.0 mg/ml) ND 0.531 76.69 321.55
1 Alpha alpha Medicago sativa 6.56 0.060 4.61 13.0
2 Anise Pimpinellaanisum 5.63 0.108 60.68 56.2
3 Areca nut Areca catechu 5.8 0.290 74.03 171.4
4 Artichoke (Base) Cynaracardunculus 5.67 0.084 35.44 32.1
5 Artichoke (Petal) Cynaracardunculus 5.93 0.045 28.40 15.5
6 Asparagus Asparagus officinalis 5.1 0.010 12.14 2.5
7 Avocado Perseaamericana 5.64 0.435 72.57 253.7
8 Bangladesh lemon (Satkara) Citrus Macroptera 4.74 0.042 16.75 11.8
9 Basil Ocimumbasilicum 5.7 0.308 73.06 180.6
10 Betel leaf Piper betle 5.92 0.452 71.60 261.1
11 Bitter Gourd Momordicacharantia 4.99 0.008 11.17 1.9
12 Black currant Ribesnigrum 3.27 0.208 70.15 118.8
13 Black currant Ribesnigrum 5.44 0.234 32.28 85.4
14
Black currant (Fermented
residue) Ribesnigrum
3.2 0.301 70.63 172.2
15 Black currant (residue) Ribesnigrum 3.55 0.183 74.76 109.0
16 Black Fig Ficuscarica 5.25 0.089 38.83 35.8
17 Blueberry fruit Vacciniumcorymbosum 3.85 0.259 69.66 146.8
18 Blueberry leaf Vacciniumcorymbosum 3.52 0.470 72.09 272.9
19 Bokchoy Brassica rapachinensis, 5.92 0.063 34.71 23.7
20 Broccoli Brassica oleracea group Italica 5.44 0.076 54.85 36.8
21 Broccoli inflorescence Brassica oleracea group Italica 6.24 0.094 31.55 33.9
22 Brussels sprouts Brassica oleracea group Gemmifera 5.93 0.121 45.63 53.1
23 Burdock Arctiumlappa 5.95 0.231 73.30 135.7
24 Cabbage Brassica oleracea group Capitata 5.88 0.072 25.24 23.5
25 Cactus Opuntiaficus-indica 5.56 0.098 34.22 36.7
26 Canadian cucumber Cucumissativus 6.23 0.020 6.55 4.5
27 Canadian Yew Taxus canadensis 4.78 0.003 20.39 0.9
28 Cantharanthus Cantharanthus ND 0.298 73.06 174.8
29 Cape Gooseberry Cucumismelo var. cantalupensis 4.98 0.283 36.65 110.2
30 Carambolla Averrhoa carambola 4.13 0.089 55.58 43.9
31 Carrot leaf Daucuscarota 6.06 0.027 24.27 8.9
32 Carrot Daucuscarota 5.67 0.024 19.17 7.0
33 Cashew Anacardiumoccidentale ND 0.135 71.36 77.9
34 Celery Apiumgraveolens var. dulce 4.35 0.030 33.01 11.0
35 Celery rave leaf Apiumgraveolens 5.02 0.023 8.98 5.5
36 Celery rave Apiumgraveolens 4.92 0.006 1.20 0.8
37 Celery oriental Chinese 5.92 0.043 48.79 19.4
38 Cherry Prunusavium 4.5 0.064 25.00 20.9
39 Chicory lettuce Cichoriumintybus 5.93 0.061 67.72 34.0
40 Coing Cydonia oblonga 4.18 0.109 73.30 64.1
41 Coriander (Fresh) Coriandrumsativum 6.01 0.028 36.17 10.8
42 Cranberry leaf Vacciniummacrocarpon 2.69 0.466 73.79 274.5
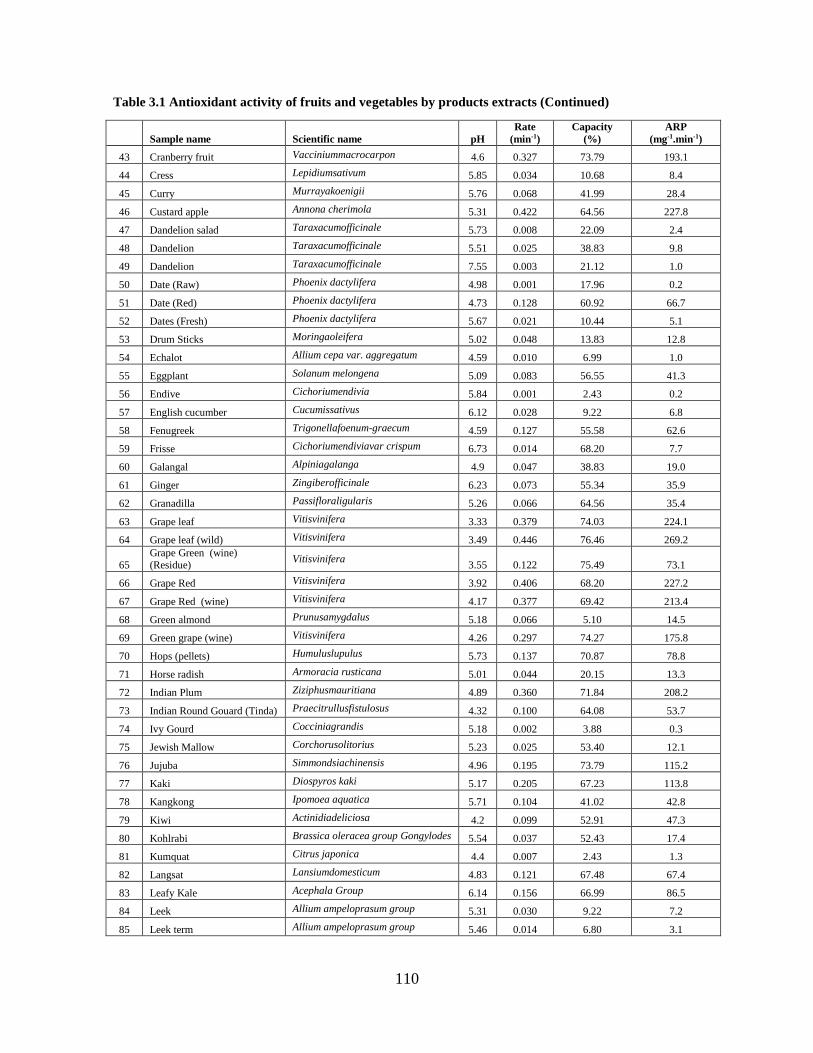
110
Table 3.1 Antioxidant activity of fruits and vegetables by products extracts (Continued)
Sample name Scientific name pH
Rate
(min-1)
Capacity
(%)
ARP
(mg-1.min-1)
43 Cranberry fruit Vacciniummacrocarpon 4.6 0.327 73.79 193.1
44 Cress Lepidiumsativum 5.85 0.034 10.68 8.4
45 Curry Murrayakoenigii 5.76 0.068 41.99 28.4
46 Custard apple Annona cherimola 5.31 0.422 64.56 227.8
47 Dandelion salad Taraxacumofficinale 5.73 0.008 22.09 2.4
48 Dandelion Taraxacumofficinale 5.51 0.025 38.83 9.8
49 Dandelion Taraxacumofficinale 7.55 0.003 21.12 1.0
50 Date (Raw) Phoenix dactylifera 4.98 0.001 17.96 0.2
51 Date (Red) Phoenix dactylifera 4.73 0.128 60.92 66.7
52 Dates (Fresh) Phoenix dactylifera 5.67 0.021 10.44 5.1
53 Drum Sticks Moringaoleifera 5.02 0.048 13.83 12.8
54 Echalot Allium cepa var. aggregatum 4.59 0.010 6.99 1.0
55 Eggplant Solanum melongena 5.09 0.083 56.55 41.3
56 Endive Cichoriumendivia 5.84 0.001 2.43 0.2
57 English cucumber Cucumissativus 6.12 0.028 9.22 6.8
58 Fenugreek Trigonellafoenum-graecum 4.59 0.127 55.58 62.6
59 Frisse Cichoriumendiviavar crispum 6.73 0.014 68.20 7.7
60 Galangal Alpiniagalanga 4.9 0.047 38.83 19.0
61 Ginger Zingiberofficinale 6.23 0.073 55.34 35.9
62 Granadilla Passifloraligularis 5.26 0.066 64.56 35.4
63 Grape leaf Vitisvinifera 3.33 0.379 74.03 224.1
64 Grape leaf (wild) Vitisvinifera 3.49 0.446 76.46 269.2
65 Grape Green (wine) (Residue)
Vitisvinifera 3.55 0.122 75.49 73.1
66 Grape Red Vitisvinifera 3.92 0.406 68.20 227.2
67 Grape Red (wine) Vitisvinifera 4.17 0.377 69.42 213.4
68 Green almond Prunusamygdalus 5.18 0.066 5.10 14.5
69 Green grape (wine) Vitisvinifera 4.26 0.297 74.27 175.8
70 Hops (pellets) Humuluslupulus 5.73 0.137 70.87 78.8
71 Horse radish Armoracia rusticana 5.01 0.044 20.15 13.3
72 Indian Plum Ziziphusmauritiana 4.89 0.360 71.84 208.2
73 Indian Round Gouard (Tinda) Praecitrullusfistulosus 4.32 0.100 64.08 53.7
74 Ivy Gourd Cocciniagrandis 5.18 0.002 3.88 0.3
75 Jewish Mallow Corchorusolitorius 5.23 0.025 53.40 12.1
76 Jujuba Simmondsiachinensis 4.96 0.195 73.79 115.2
77 Kaki Diospyros kaki 5.17 0.205 67.23 113.8
78 Kangkong Ipomoea aquatica 5.71 0.104 41.02 42.8
79 Kiwi Actinidiadeliciosa 4.2 0.099 52.91 47.3
80 Kohlrabi Brassica oleracea group Gongylodes 5.54 0.037 52.43 17.4
81 Kumquat Citrus japonica 4.4 0.007 2.43 1.3
82 Langsat Lansiumdomesticum 4.83 0.121 67.48 67.4
83 Leafy Kale Acephala Group 6.14 0.156 66.99 86.5
84 Leek Allium ampeloprasum group 5.31 0.030 9.22 7.2
85 Leek term Allium ampeloprasum group 5.46 0.014 6.80 3.1
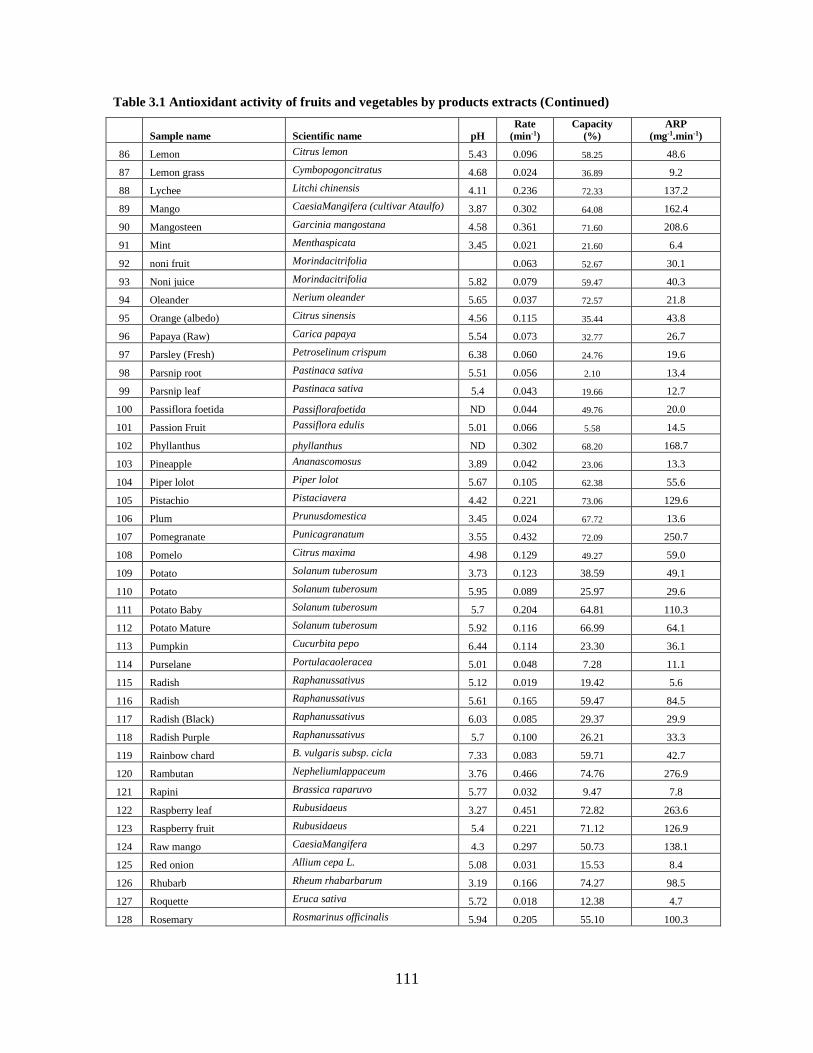
111
Table 3.1 Antioxidant activity of fruits and vegetables by products extracts (Continued)
Sample name Scientific name pH
Rate
(min-1)
Capacity
(%)
ARP
(mg-1.min-1)
86 Lemon Citrus lemon 5.43 0.096 58.25 48.6
87 Lemon grass Cymbopogoncitratus 4.68 0.024 36.89 9.2
88 Lychee Litchi chinensis 4.11 0.236 72.33 137.2
89 Mango CaesiaMangifera (cultivar Ataulfo) 3.87 0.302 64.08 162.4
90 Mangosteen Garcinia mangostana 4.58 0.361 71.60 208.6
91 Mint Menthaspicata 3.45 0.021 21.60 6.4
92 noni fruit Morindacitrifolia
0.063 52.67 30.1
93 Noni juice Morindacitrifolia 5.82 0.079 59.47 40.3
94 Oleander Nerium oleander 5.65 0.037 72.57 21.8
95 Orange (albedo) Citrus sinensis 4.56 0.115 35.44 43.8
96 Papaya (Raw) Carica papaya 5.54 0.073 32.77 26.7
97 Parsley (Fresh) Petroselinum crispum 6.38 0.060 24.76 19.6
98 Parsnip root Pastinaca sativa 5.51 0.056 2.10 13.4
99 Parsnip leaf Pastinaca sativa 5.4 0.043 19.66 12.7
100 Passiflora foetida Passiflorafoetida ND 0.044 49.76 20.0
101 Passion Fruit Passiflora edulis 5.01 0.066 5.58 14.5
102 Phyllanthus phyllanthus ND 0.302 68.20 168.7
103 Pineapple Ananascomosus 3.89 0.042 23.06 13.3
104 Piper lolot Piper lolot 5.67 0.105 62.38 55.6
105 Pistachio Pistaciavera 4.42 0.221 73.06 129.6
106 Plum Prunusdomestica 3.45 0.024 67.72 13.6
107 Pomegranate Punicagranatum 3.55 0.432 72.09 250.7
108 Pomelo Citrus maxima 4.98 0.129 49.27 59.0
109 Potato Solanum tuberosum 3.73 0.123 38.59 49.1
110 Potato Solanum tuberosum 5.95 0.089 25.97 29.6
111 Potato Baby Solanum tuberosum 5.7 0.204 64.81 110.3
112 Potato Mature Solanum tuberosum 5.92 0.116 66.99 64.1
113 Pumpkin Cucurbita pepo 6.44 0.114 23.30 36.1
114 Purselane Portulacaoleracea 5.01 0.048 7.28 11.1
115 Radish Raphanussativus 5.12 0.019 19.42 5.6
116 Radish Raphanussativus 5.61 0.165 59.47 84.5
117 Radish (Black) Raphanussativus 6.03 0.085 29.37 29.9
118 Radish Purple Raphanussativus 5.7 0.100 26.21 33.3
119 Rainbow chard B. vulgaris subsp. cicla 7.33 0.083 59.71 42.7
120 Rambutan Nepheliumlappaceum 3.76 0.466 74.76 276.9
121 Rapini Brassica raparuvo 5.77 0.032 9.47 7.8
122 Raspberry leaf Rubusidaeus 3.27 0.451 72.82 263.6
123 Raspberry fruit Rubusidaeus 5.4 0.221 71.12 126.9
124 Raw mango CaesiaMangifera 4.3 0.297 50.73 138.1
125 Red onion Allium cepa L. 5.08 0.031 15.53 8.4
126 Rhubarb Rheum rhabarbarum 3.19 0.166 74.27 98.5
127 Roquette Eruca sativa 5.72 0.018 12.38 4.7
128 Rosemary Rosmarinus officinalis 5.94 0.205 55.10 100.3

112
Table 3.1 Antioxidant activity of fruits and vegetables by products extracts (Continued)
Sample name Scientific name pH
Rate
(min-1)
Capacity
(%)
ARP
(mg-1.min-1)
129 Sea buckthorn fruit Hippophae (cultivar Indian Summer) 3.11 0.145 52.18 68.6
130 Sea buckthorn leaf Hippophae (cultivar Indian Summer) 5.22 0.334 52.91 159.1
131 Sorrel Rumexacetosa 3.21 0.169 70.63 97.0
132 Spinach Spinaciaoleracea 6.31 0.059 24.76 19.1
133 Strawberry fruit Fragaria × ananassa 3.41 0.133 69.66 75.3
134 Strawberry leaf Fragaria × ananassa 5.22 0.314 48.79 142.6
135 Swiss Chard Beta vulgaris subsp. cicla 6.54 0.049 18.69 14.3
136 Tamarind Red Tamarindusindica 3.87 0.050 31.07 18.1
137 Taro Colocasiaesculentaesculenta 5.93 0.103 50.97 48.1
138 Tomato leaf Solanum lycopersicum 4.76 0.147 36.41 56.8
139 Tomato fruit Solanum lycopersicum 4.78 0.008 3.12 1.4
140 Tumeric (Yellow) Curcuma longa 5.19 0.031 42.72 13.2
On the basis of rate of radical scavenging at a specific concentration (1.0 mg/mL), extracts
can be empirically categorized in groups as follows:
Rate greater than 0.3
Blueberry, cranberry, rambutan, betel, raspberry, grape (wild), avocado, pomegranate,
custard apple, grape red, grape, grape red (wine), mangosteen, indian plum, sea buckthorn,
cranberry, strawberry, basil, mango, phyllanthus, black currant (fermented residue)
Rate between 0.1 and 0.3
Cantharanthus, green grape (wine), raw mango, arecanut, cape gooseberry, blueberry,
lychee, black currant, burdock, pistachio, raspberry, black currant, kaki, rosemary, potato
baby, jujuba, black currant (residue), sorrel, rhubarb, radish, leafy kale, tomato, sea
buckthorn, hops (pellets), cashew, strawberry, pomelo, date (red), fenugreek, potato, grape
green (wine), (residue), langsat, brussels sprouts, potato mature, orange albido, pumpkin,
coing, anis, piper, lolot, kangkong, taro, indian round gouard (tinda), radish purple

113
Rate below 0.1
Kiwi, cactus, lemon, brocoli inflorescence, carambolla, black fig, potato, radish (black),
artichoke (base), eggplant, rainbow chard, noni juice, broccoli, ginger, papaya (raw),
cabbage, curry, green almond, granadilla, passion fruit, cherry, noni fruit, bocchoy, chicory
lettuce, alpha alpha, parsley (fresh), spinash, parsnip, tamarind red, swiss chard, drum
sticks, purselane, galangal, artichoke (petal), horse radish, passiflora foetida, cerlery
oriental, parsnip, bangladesh lemon (satkara), pinapple, oleander, kohlrabi, cress, rapini,
tumeric yellow, red onion, celery, leek, english cucumber, corriander, carrot, jewish
mallow, dandelion (wild), plum, lemon grass, carrot, celery rave, mint, dates , canadian
cucumber, radish, roquette, frisse, leek term, asparagus, echalot, tomato, bitter gourd,
dadelion salad, kumquat, celery rave, dandelion (wild), canadian yew, ivy gouard, endive,
date (raw)
3.4.2 Relation between scavenging rate and capacity of antioxidant activity
An important issue in studying the reactions of antioxidants and radicals is to distinguish
the rate and capacity, that is, quality and quantity. For equivalent capacity, some
antioxidants may be quite reactive and scavenge radicals very rapidly, while other
antioxidants may react with radicals slowly, as shown in Figure 3.1. In our study, the
reaction of the faster antioxidant extract (E1) is completed after about 12 min, the extracts
with intermediate antioxidant (E2) efficacy takes about 30 min to completion, while the
reaction of least antioxidant extract (E3) still continues after 60 min. Hence, if the percent
discoloration is determined at 30 min, the three antioxidants appear to have identical
performance, despite the substantial difference in reactivity. Instead, measurement at 10
min would give the correct rate of reactivity (E1> E2> E3). It should be noted that a
measurement taken at 60 min would yield a completely different rate of antioxidant
performance, merely reflecting the actual rate of the reaction.
In the present study, relation between rate and capacity was found to be hyperbolic (Figure
3.2). The relation between the rate and capacity was linear up to the scavenging rate of
0.15 min-1. Beyond that rate, the capacity reached maximum, i.e., rate had no effect on
capacity. In other words, beyond the rate of 0.15 min-1, the samples exhibiting higher rates

114
of radical scavenging and reaching the maximum capacity could not be differentiated.
Furthermore, some extracts fall into a category of extracts that show an increase in
scavenging capacity in proportion to or linearly with the rate of scavenging (Figure 3.2).
This group includes purselane (number 114), piper lolot (104), black currant (13), Cape
gooseberry (29), raw mango (124), sea buckthorn leaf (130), strawberry leaf (134), grape
red (66), custard apple (46), rambutan (120), raspberry leaf (122) and others. For this group
of extracts, either the capacity or the rate could characterize their antioxidant activity.
Moreover, some samples may not reach the maximum capacity, but may arrive at a
capacity at a faster rate (Figure 3.2). For example, some extracts such as betel leaf extract
reacts with radicals more rapidly than grape leaf extract, while scavenging almost same
amount of radicals. The slow scavenging of radicals by grape leaf extract is likely due to
regeneration of phyto-compound radicals produced by the rapid scavenging of DPPH
radicals; and such reaction occurs with betel leaf or pure ascorbic acid (Figure 3.1).
Evidently, characterizing a sample either by capacity or by rate alone cannot be straight-
forward; they cannot be taken as the sole criterion of antioxidant activity determination.

115
Rate (min-1
)
0.0 0.1 0.2 0.3 0.4 0.5
Cap
acity (
%)
0
20
40
60
80
1
2
3
4
5
6
7
8
910
11
12
13
14
15
16
1718
19
20
21
22
23
24
25
26
27
28
29
30
31
32
33
34
35
36
37
38
39
40
41
4243
44
45
46
47
48
49
50
51
52
53
54
55
56
57
58
59
60
61
62
636465
6667
68
69
70
71
72
73
74
75
76
77
78
7980
81
82 83
8485
86
87
88
89
90
91
92
93
94
95
96
97
98
99
100
101
102
103
104
105
106
107
108
109
110
111112
113
114
115
116
117
118
119
120
121
122123
124
125
126
127
128
129 130
131
132
133
134
135
136
137
138
139
140
pH
2456 3
Figure 3.2 Relation between rate of radical scavenging and capacity of the radical scavenging capacity
of plant extracts
* The number corresponds to the product as listed in Table 3.1.
Antioxidant activity can be more fully expressed by taking both the capacity and rate taken
into consideration. Capacity of an extract towards the radical scavenging is sum total of
amount of radical neutralized by the antioxidant components present in the extract. While,
the rate of radical scavenging depends on the nature of phytochemicals, reaction condition
(i.e., pH, temperature and solvents), and the transient antioxidant-derived radical formation
during scavenging of the active radicals. When an antioxidant scavenges active radicals, the
radical is transformed to a non-radical and stable product, while the antioxidant yields one
antioxidant-derived radical. For example, hydro-quinones and polyphenols may play
important role as antioxidants in vivo; and as they scavenge radicals, semi-quinone radicals

116
are formed, which in turn, may scavenge another radical to produce a quinone, or
disproportionate with another semi-quinone radical to give the parent compound and a
quinone (Flora, 2009). They may also react with oxygen, yielding a quinone and a
hydroperoxyl radical. Therefore, it is not always certain to state that high rate of radical
quenching would have high antioxidant activity or capacity, or vice versa (as seen in Figure
3.2).
Plant extracts can differ quantitatively and qualitatively not only in the composition of
antioxidants but also of natural acids. In consequence, their pH can be different. For most
of the examined extracts the pH was found in between 4 and 5. Between the pH range of 4
and 5 (rate up to 0.15 min-1), capacity was found directly proportional to the rate. But the
extracts, having pH value below 4, showed similar antioxidant capacity with various rates
(plateau region in Figure 3.2). The influence of pH on the antioxidant rate and capacity
was found to be higher at lower pH, which might be due to the nature of phytochemicals at
lower pH and interference of pH on radical stability. De-protonation of hydroxyl groups at
lower pH enhances the antioxidant activity of polyphenols and it decreases monotonously
with increasing pH (Han et al., 2009).
3.4.3 Anti-Radical Power
The DPPH radical assay was developed by (Brand-Williams et al., 1995) and a vast
majority of antioxidant research community have adopted it. Briefly, different antioxidant
concentrations are used in such a way to determine the concentration of antioxidants that
quench the initial DPPH• radical concentration in a specific time interval. The higher the
DPPH• radical quenching by an antioxidant system, the higher would be its antiradical
ability. Most of the time, efficacy of antioxidant system is presented in terms of EC50
(Philip, 2004; Prior et al., 2005; Sharma and Bhat, 2009). However, there are many issues
associated with the EC50 parameter and its interpretation as well. For example, the foremost
is the time interval for the reaction. And EC50 is time-dependent, and the effect of time can
vary from compound to compound. Usually, increasing the reaction time may improve the
evaluation of a given compound (lower EC50), and hence, the test can be customized so that
a poor anti-radical/antioxidant could appear to be an excellent antiradical/antioxidant. It is

117
clear that the interpretation of this test is quite arbitrary, and any comparison between
results is not possible, if the adopted reaction time is different.
Thus the consideration of both rate (time factor) and the capacity of antioxidant system
would be a better and reliable way to define the true efficacy of the antioxidant activity, the
real antioxidant power or antiradical power (ARP). Defined ARP will have a kinetic
parameter (not just a concentration), and as such it will express the antioxidant or
antiradical ability of a compound. Among the tested plant extracts, rambutan, cranberry
leaf, blueberry leaf, grape leaf (wild), raspberry leaf, betel leaf, avocado, pomegranate,
custard apple, grape red, grape leaf, grape red (wine), mangosteen, indian plum, cranberry
fruit, basil, green grape (wine), cantharanthus, black currant (fermented residue), areca nut,
phyllanthus, mango, sea buckthorn leaf, blueberry fruit, strawberry leaf, raw mango,
lychee, burdock, pistachio, raspberry fruit, black currant, jujuba, kaki, potato baby, cape
gooseberry, black currant (residue), rosemary were found to have ARP value of > 200 mg-
1.min-1. The complete ARP values of all tested extracts are presented in Table 3.1.
The ARP value of plant extracts ranged from 0.37 mg-1.min-1 (endive) to 553.88 mg-1.min-1
(rambutan). Statistical analysis showed that the average ARP value of extracts follows the
order: leaf extracts (409.2) ~ non-climacteric fruit extracts (407.6) > climacteric fruit
extracts (283.0) > root crop extracts (86.6 mg-1.min-1) (p<0.05). The average ARP value of
leaf extracts was found to be higher than that of the climacteric fruit extracts.
The relation between ARP of the plant extracts and their antioxidant capacity is shown in
Figure 3.3. The relationship was hyperbolic as was seen for the rate and capacity, if in a
more coherent pattern, indicating that the contribution of the scavenging rate to ARP is
significant. Typically, the scavenging capacity increases with ARP and it reaches maximum
value above the ARP value of 150 mg-1.min-1 (Figure 3.3) and remains steady thereafter.
Thus, ARP can differentiate samples for their antioxidant activity more effectively than the
scavenging capacity. It is evident that extracts even though having high values of capacity,
have lesser value of ARP as their rate of radical quenching is lower, and vice versa. For
example, lychee, pomegranate and orleander have the same antioxidant capacity of 72.33,
72.09 and 72.57 % respectively, but they exhibited the ARP value of 137.2, 250.7 and 21.8
mg-1.min-1 respectively (Table 3.1).

118
Figure 3.3 Relation between ARP and radical scavenging capacity of plant extracts
* The number corresponds to the product as listed in Table 3.1
By the virtue of taking into account of both scavenging capacity and rate, i.e., the extent
and action time, ARP effectively expresses the power of the antioxidant substances. As
shown in Figure 3.4, ARP is nearly co-linear with the scavenging rate (R=0.99), and
correlates well with the scavenging capacity (R=0.72). Most of studies evaluating the
antioxidant activity of natural products determine the scavenging capacity by DPPH assay,
differentiation of most active samples by this expression constrained because of its
limitation, and it is evident that ARP would be marker to estimate the activity of and to
discriminate natural products for their efficacy. Furthermore, pH of the extracts has some
effect on their radical scavenging activity, but it is not significant.

119
Figure 3.4 Correlations between pH, rate, capacity and ARP
3.4.4 Average carbon oxidation number (ACON)
Phytochemicals present in plants are organic in nature and they are crucial because of the
protective roles they play in the life of plants. However, their make up at any specific
condition describes the state of their life. But understanding the organic pool is much
difficult and hindered due to the immense chemical complexity of cellular metabolite
mixtures.
Oxidation number or state indicates the total number of electrons, which have been
removed from an element (a positive oxidation state) or added to an element (a negative
oxidation state) to reach its state (Jensen, 2007). Since the primary element in organic
compounds is carbon, its oxidation number is determined by its bonding to other elements
(H, O, N, S) depending on their electronegativity. Higher and positive oxidation number of
carbon would signify the presence of more electronegative elements O, N and S; and
consequently, presence of more reducing functional groups can be expected. Since plant
extracts are mixtures of many phyto-compounds, and information on their composion and

120
structure of thosition often lacking; it is conceivable to obtain a view of their reducing
activity by knowing the average carbon oxidation number (ACON) from the elemental
composition of the extract.
Elemental analysis was performed on a few selected extract samples for their composition
in C, H, O, N and S, and the ACON was calculated from the mass composition of the
elements of those extracts. The ACON values were corrected for sugar contents and oxalic
acid (rhubarb) for which ACON is zero. The abundance of various elements in the plant
extracts is presented in Table 3.2.
Table 3.2 Elemental composition, average carbon oxidation number value of fruits and vegetables by-
products extracts
Sample Cu
(ppm) Fe
(ppm) Mn
(ppm) C
(%) H
(%) N
(%) S
(%) O
(%) ACON
1.Cranberry leaf 1.9 1822.6 317.26 49.18 5.41 0.202 0.342 42.31 -0.0072
2.Black currant residue 5.3 68.0 15.73 41.42 5.80 0.358 0.100 51.34 0.207*
3.Sea buckthorn leaf 2.4 17.8 134.31 46.41 5.47 1.241 0.095 44.86 -0.092
4.Betel leaf 8.3 42.9 149.05 32.88 4.00 3.133 0.226 39.27 0.508
5.Pomegranate 3.4 24.4 0.30 45.01 5.15 0.280 0.075 48.04 0.364
6.Rhubarb 139.2 46.2 10.64 35.79 4.66 2.345 0.113 51.1 0.15**
7.Blueberry leaf 2.4 17.9 397.11 47.70 5.80 0.254 0.105 44.95 -0.027
8.Grape leaf 11.7 65.9 15.40 41.07 4.92 0.576 0.098 47.84 0.346
9.Cashew 7.3 52.4 7.38 40.75 6.54 0.440 0.056 54.06 0.107*
10.Sea buckthorn fruit 5.5 38.8 9.62 43.70 5.74 0.911 0.136 51.96 0.241*
* Corrected for sugar
**Corrected for oxalic acid
Table 3.3 Comparison of ACON, Capacity, rate and ARP values of plant by product (fruit and leaf)
extracts (1.0 mg/mL)
Sample's name ACON Capacity (%) Rate (min-1) ARP (mg-1.min-1)
Acid ascorbic (1.0 mg/mL) 0.67 76.5 0.531 321.6
Cranberry leaf -0.0072 73.8 0.466 274.5
Black currant residue (F) 0.207 74.8 0.183 109.0
Sea buckthorn leaf -0.092 52.9 0.334 159.1
Betel leaf 0.508 71.6 0.452 261.1
Pomegranate (F) 0.364 72.1 0.432 250.7
Rhubarb 0.15 74.3 0.166 98.5
Blueberry leaf -0.027 72.1 0.47 172.9
Grape leaf 0.346 74.0 0.446 269.2
Cashew (F) 0.107 71.4 0.135 77.9
Sea buckthorn fruit 0.241 52.2 0.145 68.6
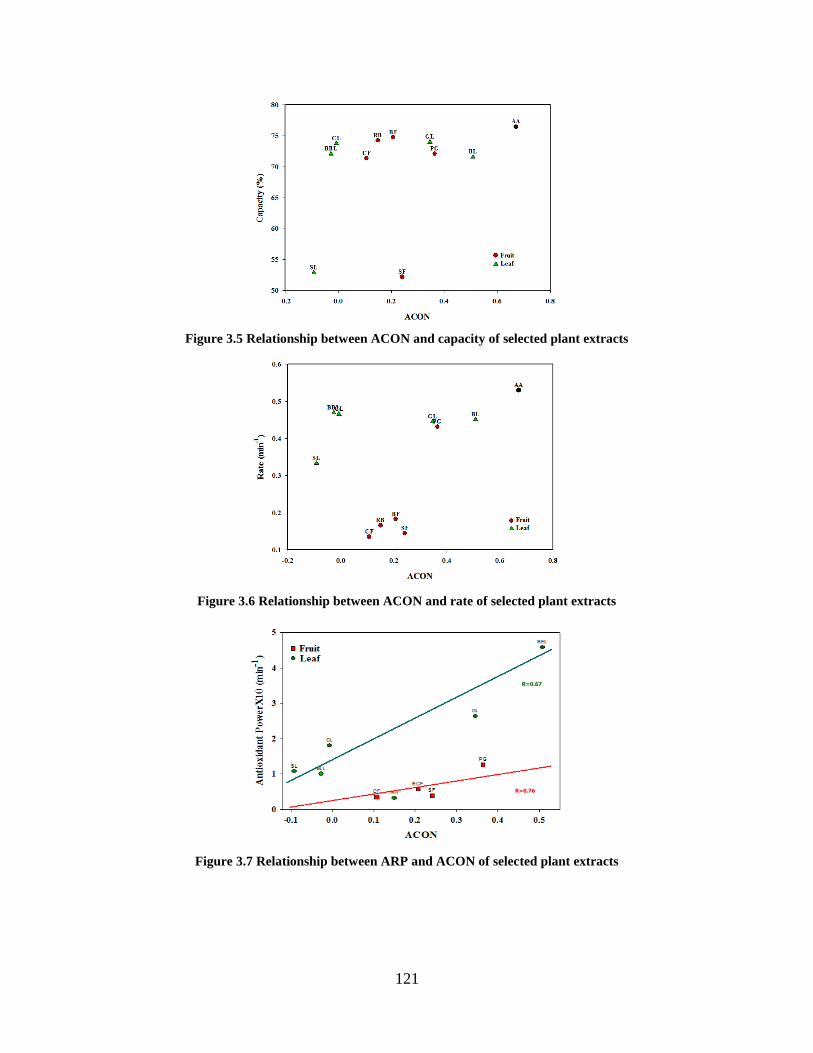
121
Figure 3.5 Relationship between ACON and capacity of selected plant extracts
Figure 3.6 Relationship between ACON and rate of selected plant extracts
Figure 3.7 Relationship between ARP and ACON of selected plant extracts
R=0.76
R=0.67
122
The relationships between ACON and antioxidant capacity, rate of radical quenching and
ARP are shown in Table 3.3 and Figures 3.5, 3.6 and 3.7. One would expect linear or other
relationships between them, if the hypothesis were to be correct. There was no apparent
relationship between ACON and antioxidant capacity (Figure 3.5), and there was no
differentiation between leaf and fruit samples. ACON and radical scavenging rate showed
some linear relationship separately for fruit and leaf sources (Figure 3.6). Yet ACON
related to ARP in a linear fashion separately to leaf (R=0.67) and fruit (R=0.76) sources
(Figure 3.7), suggesting that ARP that contains information on both capacity and rate may
be more meaningful, albeit the sample population is small. It is interesting to note that
rhubarb extract falls in the fruit line, although it is a vegetable.
One striking observation is that ACON-rate and ACON-ARP relationships clearly
distinguish the sources of the extracts, and helps us to visualize the compositional diversity
of metabolites in relation to redox chemistry in sub-cellular compartments of these sources.
Leaf extracts exhibited a higher antioxidant activity than fruit extracts, indicating that the
former group possesses more potentially active compounds and/or in higher concentrations.
In fact, metabolites in different sub-cellular locations of plant have a wide compositional
variation. The separate trend between ACON and ARP of extracts may be an indication of
links between redox status and phytochemical richness of extracts. Compositional
divergences among extracts are also apparent, showing that more reduced metabolites are
found in leaf in comparison to fruits, and hence leaf having higher ARP than fruits. In fact,
leaf contains both specific (NADPH) and non-specific (chlorophyll, phytophytine,
carotenoids, plastaquinone and phenolic compounds) antioxidant components, which can
confer to it a greater potential radical scavenger than fruit, which has mostly non-specific
antiradical components such as low pH, vitamin C, and abundant phenolic compounds to
combat oxidative stress. Presence of polyphenols is ubiquitous in the plant kingdom, but
their presence may greatly vary, because of differences in environmental conditions.
Consequently, the polyphenols are usually found in higher concentrations in leaves and
outer parts of plants, compared to the subterranean organs, where they are present in trace
amounts (Herrmann, 1988).
This study has identified some promising candidate-extracts using ARP metric from 140
samples. They include rambutan, cranberry leaf, blueberry leaf, grape leaf (wild), raspberry
123
leaf, betel leaf, avocado, pomegranate, custard apple, grape red, grape leaf, grape red
(wine), mangosteen, indian plum Although only DPPH radical scavenging activity was the
focus in this study, many reactive oxygen and nitrogen species are encountered in biology.
It is imperative, therefore, to examine antioxidant activity of natural products against an
array of radicals in order to determine their potency as antioxidants. In addition, it may be
useful to identify antioxidant substances possessing high antioxidant capacity but acting at
different rates.

124
3.5 Conclusions
DPPH assay is a widely used for preliminary evaluation of the antioxidant capacity of
natural products, as it is reliable and reproducible. However, the value of the method is
somewhat compromised, when the reaction is not allowed to reach completion (fixed time
measurement) or only either the anti-radical capacity or the scavenging rate is noted. This
work shows that the true antioxidant activity may lie on both the capacity as well as the rate
of radical scavenging. The new expression, ARP, generated from DPPH assay may be more
useful in identifying the antioxidant activity of biological samples. Some samples exhibited
high ARP value such as rambutan, cranberry leaf, blueberry leaf, grape leaf (wild),
raspberry leaf, betel leaf, avocado, pomegranate and custard apple. Leaf extracts possess, in
general, higher ARP than fruits, and root extracts possess low ARP. In addition, this study
also suggests that average carbon oxidation number (ACON) of complex mixtures such as
plant extracts may portend their antioxidant power, in spite of the disparity between leaf
and fruit materials.

125
Chapter 4 ANTI-RADICAL ACTIVITY SPECTRUM OF SECLETED FRUIT AND
VEGETABLE EXTRACTS AGAINST SEVERAL REACTIVE OXYGEN SPECIES
Le spectre d'activité anti-radicalaire des extraits sélectionnés a été exploré. L'activité anti-oxydante a été évaluée par différentes méthodes incluant, la capacité anti-oxydante équivalente de Trolox (TEAC), la détermination des radicaux libres (DPPH), le pouvoir réducteur d’ion ferrique (FRAP), la mesure du potentiel d'oxydoréduction, la réduction du peroxyde d'hydrogène, du radical hydroxyle, de l’anion superoxyde, de l’oxyde nitrique et de l’activité de chélation du fer. La teneur totale en composés phénoliques (TPC) et en flavonoïdes (TFC) des extraits ont également été déterminées. Feuille de bétel, Fruit de bleuet et de cassis, feuille de canneberge ont montré une bonne activité de piégeage des radicaux (essai TEAC); pomme, oseille, vigne rouge et racine de pissenlit étaient efficace contre SOA; feuilles de canneberge, feuille de bleuet, cassis et rosemary contre le radical hydroxyle; rainbow chard, panais, brocoli et orange contre H2O2; et pomme de terre, banane, oseille, feuille d'argousier contre oxyde nitrique. Feuille et fruit de bleuet, grenade, cassis et feuille de bétel ont montré un bon pouvoir réducteur d’ion ferrique. Les extraits possédant la capacité élevée de chélation du fer étaient: feuille d’argousier, radis, panais, feuille de bétel et mangoustan. Extrait de feuille de bétel présentait des activités élevées, y compris de fixation du fer et de piégeage de divers radicaux, à l'exception de l'oxyde nitrique, où l'activité était néanmoins modérée. Les essais de TEAC, de DPPH et de FRAP fournissent essentiellement la même réponse concernant l'activité anti-oxydante des extraits de plantes, ce qui suggère que l'un de ces essais serait suffisant pour évaluer leur capacité anti-radicalaire. Cette étude suggère également que l'activité anti-oxydante d'une substance, déterminée par une ou plusieurs essais, ne donne pas une image complète de son efficacité contre les diverses espèces de radicaux oxygénés; et montre que la détermination du spectre de l'activité anti-radicalaire serait nécessaire.

126
4.1 Abstract
Trolox equivalent antioxidant capacity (TEAC), DPPH radical assay (DPPH) and ferric
reducing power (FRAP) assays are used to assess their antioxidant activity. However, the
activity is rarely evaluated against various reactive oxygen and nitrogen species of
importance in biology. Thus the objective of this study was to examine the antioxidant
properties of selected plant extracts by evaluating their spectrum of anti-radical activity.
Thirty-six aqueous plant extracts from fruit peel and the leaf materials were analysed for
their antioxidant activity by TEAC, DPPH, and FRAP assays, redox potential (reducing
power), quenching capacity against hydrogen peroxide, hydroxyl radical, superoxide anion,
nitric oxide, and iron (pro-oxidant metal ion) chelating activity. Their total phenolic
content (TPC) and total flavonoid contents (TFC) were also determined. It was found that
avocado, betel leaf, blueberry fruit, blueberry leaf, black currant residue, cranberry leaf,
custard apple, grape leaf, sea buckthorn leaf, mangosteen, pomegranate, raspberry and
rosemary exhibited significant antioxidant capacities as determined by the related assays,
TEAC, DPPH and FRAP, among those tested, betel leaf, blueberry fruit and black currant
and cranberry leaf showing high activity (TEAC assay). Apple, sorrel, red grape and
dandelion root were against SOA; cranberry leaf, blueberry leaf, black currant and
rosemary against hydroxyl radical; rainbow chard, parsnip, broccoli and orange against
H2O2; and potato, banana, sorrel, sea buckthorn leaf against nitric oxide. Blueberry leaf and
fruit, pomegranate, black currant and betel leaf showed high ferric ion reducing power. The
extracts showing high iron binding capacity were: sea buckthorn leaf, radish, parsnip, betel
leaf and mangosteen. Betel leaf extract exhibited a broader spectrum of activities,
including iron binding and scavenging of various radicals except nitric oxide, where the
activity was moderate nonetheless. A satisfactory correlation between TEAC & DPPH and
TEAC & FRAP values was found suggesting that any one of them would be adequate to
evaluate their anti-radical capacity. And a strong correlation of TPC with TEAC (R2=
0.954) and DPPH (R2= 0.950) was obtained indicating that the TPC of the extracts were
the main contributors of the antioxidant activity. In addition, TPC and TFC did not
correlate with metal chelating activity, or superoxide anion, hydrogen peroxide, and nitric
oxide, suggesting that a range of phytochemicals must be present to confer a broad
spectrum activity to the extracts, not merely phenolic compounds.

127
4.2 Introduction
Free radicals play a very important role in the oxidative damage of biological systems
(McCord, 2000; Scalbert et al., 2005). Oxidation is an essential process for the production
of energy and run the biological processes smoothly in living organisms. The continuous in
vivo generation of free radicals and other reactive oxygen species (ROS) during metabolic
processes result in cell death and tissue damage. The role of oxygen radicals has been
reported in several diseases, including cancer, diabetes and cardiovascular diseases, ageing,
etc. (Halliwell et al., 1999). The most common free radical derivatives of oxygen include
hydroxyl, superoxide anion, peroxyl radicals, superoxide, singlet oxygen and hydrogen
peroxide; and the reactive nitrogen species include nitric oxide and peroxynitrite anion.
Among them, hydroxyl radicals are highly reactive and can not be eliminated by
endogenous enzymes, SOD (superoxide dismutase) or glutathione cycle; and can damage
all bio-molecules. Singlet oxygen is linked to the oxidation of LDL-cholesterol.
Superoxide anion (SOA), a precursor of other ROS, contributes to lipid and DNA damage.
The scavenging of this radical may also help reduce the formation of hydrogen peroxide
and peroxy radicals (Nimse and Pal, 2015). There are also RNS (Reactive nitrogen species)
that can be harmful to proteins (Patel et al., 1999).
Anti-oxidants have a significant role in protecting the body from damage caused by free
radical induced oxidative stress (Ozsoy et al., 2008). Natural anti-oxidants, such as
polyphenols, found in medicinal and dietary plant products are very effective in preventing
oxidative damages (Silva et al., 2005). Their radical scavenging activity of polyphenols is
due to their structure, which helps to eradicate free radical, and in vitro they have been
shown to be more effective anti-oxidants than tocopherols and ascorbic acid. Ability of the
polyphenol derived radical to stabilize and delocalize the unpaired electron throughout the
structure, and ability to chelate transition metal ions make polyphenols to be used as an
ideal antioxidant (Evans et al., 1997). Human body has multiple enzymatic and non-
enzymatic antioxidant systems that protect the cellular molecules against ROS induced
damages. However, severe or continued oxidative stress makes the innate defense
insufficient for total protection. Hence, in order to balance the ROS in human body certain
amounts of exogenous anti-oxidants are constantly required to maintain an adequate level
of anti-oxidants.

128
Research efforts are also made in screening fruit and vegetable sources for identifying
novel antioxidants. This is particularly true for plant materials that might act as alternative
antioxidant sources (Kalpana et al. 2011). There is a plethora of plants that has been found
to possess strong antioxidant activity (Badami et al. 2003). The natural antioxidant-
compounds are present in all parts of the plant including barks, stalks, leaves, fruits, roots,
flowers, pods, seeds, stems, latex and hull (Ramarathnam et al. 1995; Rajaei et al. 2009;
Gholivand et al. 2010). Antioxidants exert their action through simple or complex
mechanisms including prevention of chain initiation, binding with transition metal ion
catalysts, decomposition of peroxides, prevention of continued hydrogen abstraction, and
radical scavenging (Diplock, 1999). Many studies showed that antioxidant such as
flavonoids and other phenolic compounds present in plant are associated in reducing the
risk of chronic diseases (Singh and Marimuthu, 2005; Cieslik et al. 2006).
The ability of the pure compounds or extracts to trap free radicals is measured in order to
estimate their antioxidant properties. Various methods has been developed to measure the
radical-scavenging capacity of plant derived compounds against free radicals like the 2,2-
diphenyl-1-picrylhydrazyl radical (DPPH•), 2,2-azinobis(3-ethylbenzothiazoline-6-
sulphonic acid) cation radical (ABTS•+); the superoxide anion radical or the hydroxyl
radical (Williams et al., 1995; Pelligrini et al., 1999; Huang et al., 2005 and Siddhuraju et
al., 2007), ferric reducing antioxidant power (FRAP) (Guo et al., 2003; Jiménez-Escrig et
al., 2001). During the reactions, either hydrogen atom is donated from an antioxidant or
electron is transferred.
Plant extracts are complex mixture of compounds, where phytochemicals may function in
synergism or antagonism with each other, and they may exhibit ‘Broad spectrum
antioxidant activity’ against various radicals in biology. The objective of this study was to
investigate the in vitro activity of selected plant extracts against free radicals, hydroxyl and
superoxide anion radicals, hydrogen peroxide, and nitric oxide; reducing activity, and iron
chelating activity. Moreover, the total phenolic compounds and total flavonoid contents of
the extracts was also assessed. Inter-relationships between activities against specific
radicals and their relationship with the titers of total phenolic compounds and total
flavonoids were also examined.

129
4.3 Materials and methods
4.3.1 Plant materials
Thirty-six plant materials vegetable and plant by-products were collected from farms,
farmer’s markets and fruit and vegetable processors in and around Quebec, QC, Canada.
The plants material that were investigated include apple (malus communis), avocado
(Persea americana), banana (Musa acuminate), betel leaf (Piper betle leaf), blueberry fruit
(Vaccinium corymbosum fruit), blueberry leaf (Vaccinium corymbosum leaf), broccoli
(Brassica oleracea), black currant residue (Ribes nigrum residue), black currant fruit (Ribes
nigrum fruit), celery oriental (Apium graveolens), chinese litchi (Litchi chinensis),
cranberry leaf (Vaccinium macrocarpon leaf), custard apple (Annona squamosa. Lin),
dandelion root (Taraxacum officinalis root), dandelion leaf (Taraxacum Officinalis), grape
leaf (Vitis vinifera leaf), green pepper (green Capsicum annuum), hops (Humulus lupulus),
sea buckthorn fruit (Rudbeckia hirta fruit), sea buckthorn leaf (Rudbeckia hirta leaf),
mango peel (mangifera indica peel), mangosteen (Garcinia mangostana), orange peel
(Citrus sinensis), parsnip (Pastinaca sativa), pomegranate (Punica granatum), potato
mature (Solanum tuberosum mature), radish peel (Raphanus sativus peel), rainbow chard
(Beta vulgaris), raspberry leaf (Rubus idaeus leaf), red grape (Vitis vinifera), rhubarb
(Rheum rhabarbarum), rosemary (Rosmarinus officinalis), sorrel (Hibiscus sabdariffa),
kiwi peel (Actinidia chinensis ), canadian yew (Taxus Canadensis) and tomato (Solanum
lycopersicum). Upon arrival to the laboratory, samples were first washed with distilled
water and bleaching agents (Sodium Hypochlorite-300 ppm) to remove dirt and debris.
Thereafter, within 48 hours, the samples were lyophilized, ground to powder, vacuum-
sealed and stored at -30°C until ready for extraction.

130
4.3.2 Chemicals and reagents
Ascorbic acid, aluminum chloride, ammonium hydroxide, 2,2′azino-bis(3-ethyl
benzothiazolin e-6-sulfonic acid) diammonium salt (ABTS), 1,1 diphenyl-2-
picrylhydrazine (DPPH), ferrous sulfate, ferrous chloride, Folin Ciolcalteu’s reagent,
hydrogen peroxide, 1,10-phenanthroline, naphthylethylenediamine dihydrochloride,
nicotinamide adenine dinucleotide (NADH), nitroblue tetrazolium (NBT), phenazine
methosulfate (PMS), rutin, phosphoric acid, potassium persulfate, potassium
hexacyanoferrate (II), potassium hexacyanoferrate (III), sodium carbonate, sodium
ethylene diamine tetra acetate (Na2EDTA) sodium nitrite, sodium nitroprusside, sodium
phosphate monobasic, sodium phosphate dibasic, sulfanilic acid, sulfuric acid, 3-(2-
Pyridyl)-5,6-diphenyl-1,2,4-triazine-4′,4′′-disulfonic acid sodium salt and trichloroacetic
acid were purchased from Sigma-Aldrich (Canada). All the reagents were of analytical
grade.
4.3.3 Plant extract preparation
About 50 gram of the lyophilized powder of raw sample was extracted with 500 mL of
distilled water at 85-90°C for 60 minutes with constant stirring. The slurry was then
vacuum filtered (Whatman No. 1 filter paper), and the filtrate was concentrated under
vacuum using a rotary evaporator at 65°C to about 100 mL and then lyophilized. The
lyophilized extracts were vacuum-packed and stored at -30oC until further use. The stock
solution of plant extract at 1.0 mg/mL was prepared in distilled water before the assay.
4.3.4 Total phenolic content
Total phenolic content of plant extracts was determined by the Folin-Ciocaulteu assay
according to the method described by Singleton et al. (1999) with some modifications.
From the stock solution of plant extract at 1.0 mg/mL, an aliquot of 0.5 mL was mixed
with 0.5 mL of Folin-Ciocalteau reagent. After 3 min, 0.5 mL of saturated sodium
carbonate solution was added, and the solution was diluted to 5 mL with deionized water.
The reaction mixture was kept in the dark for 2 hr and its absorbance was measured at 760
nm against water in UV-Vis spectrophotometer (Biotek, Power XS2, Logiciel Gen 5).

131
Gallic acid and ascorbic acid were used as standards. The results were expressed in terms
of gallic acid equivalent (GAE) and ascorbic acid equivalent (AAE). All experiments were
performed in triplicate.
4.3.5 Total flavonoid assay
Total flavonoid content was determined with aluminium chloride colorimetric assay
(Chang et al., 2002). Plant extract (1.0 mg/mL) was added to 10 mL volumetric flask
containing 4 mL of water. To the above mixture, 0.3 mL of 5% NaNO2 was added. After 5
minutes, 0. 3 mL of 10 % AlCl3 was added. After 6 min, 2.0 mL of 1M NaOH was added,
and the total volume was made up to 10 mL with distilled water. The solution was mixed
and the absorbance was measured against a blank at 510 nm. Rutin was used as a standard,
and the results were expressed as rutin equivalent (RE).
4.3.6 Antioxidant Assays
Antioxidant capacity of each extract from plant was performed using Trolox equivalent
antioxidant capacity (TEAC), DPPH free radical assay, reducing power assay (FRAP),
hydrogen peroxide, hydroxyl radical, superoxide anion and nitric oxide scavenging assays
and metal chelation capacity assay.
4.3.6.1 TEAC (Trolox equivalent antioxidant capacity)
Trolox equivalent antioxidant capacity (TEAC) was carried out according the method
reported by Zulueta et al. (2009) with some modifications. ABTS and potassium persulfate
were dissolved in deionized water to make up to a concentration of 7 mM and 140 mM,
respectively. This reaction mixture was left at ambient temperature for 12 to 16 hours in
the dark to obtain the blue-green coloured radical cation of ABTS+. On the day of analysis,
the ABTS+ solution was diluted with phosphate buffered saline (PBS) (10 mM, pH 7.4) to
obtain an absorbance of 0.700 ± 0.001 at 734 nm. For the spectrophotometric assay 190 µL
of the ABTS+ solution 10 µL of plant extract (1.0 mg/mL) were mixed and the absorbance
was determined at 734 nm during 2 hours with a microplate spectrophotometer (Biotek,
Power XS2, Logiciel Gen 5). Trolox was used as a standard and the results were expressed
as Trolox equivalent. The assay was carried out in triplicate.

132
4.3.6.2 DPPH free radical scavenging assay
The free-radical scavenging activity of plant extract was assessed by the decrease in
absorbance of methanolic solution of DPPH (López-Galilea et al., 2006). A stock solution
of DPPH (6.1 x10⁻⁵ M) was prepared immediately before use. The DPPH solution was
diluted with methanol to obtain an absorbance of 0.7 (± 0.02) at 515 nm. Aliquots of 10 µL
of each plant extract (1.0 mg/mL) and 190 µL of DPPH solution were transferred to a
microplate. A microplate spectrophotometer (Biotek, Power XS2, Logiciel Gen 5) was
used for incubation and reading of microplates (96 wells). Incubation was performed at a
temperature of 25°C for a period of 1 hour. Absorbance was measured at 515 nm at
interval of 1 min. Ascorbic acid was used as a standard and the results were expressed as
ascorbic acid equivalent. The assay was carried out in triplicate.
4.3.6.3 Reducing power property
a) Ferric reducing power assay (FRAP)
The reducing power of the extracts was performed according to the method of Oyaizu
(1986), based on the reduction reaction from Fe (III) to Fe (II) with some modifications.
1.0 mg/mL of plant extract (2.5 mL) was mixed with 2.5 mL of 0.2 M sodium phosphate
buffer (pH 6.6) and 2.5 mL of 1% potassium ferricyanide. The mixture was incubated at
50°C for 20 min. After 2.5 mL of 10% trichloroacetic acid (w/v) was added, and the
mixture was centrifuged at 3000 rpm for 10 min. The upper layer (2.5 mL) was mixed with
2 mL of de-ionised water and 0.5 mL of 0.1% of ferric chloride and the absorbance was
measured spectrophotometrically at 700 nm. Ascorbic acid was used as standard and the
results were expressed as ascorbic acid equivalent. The assay was carried out in triplicate.
b) Potentiometry
The reducing property of the plant extract was assessed according to the method of
Brainina et al. (2007) with some modifications. Chemical interaction of the plant extract
with mediator system K3[Fe(CN6)]/K4[Fe(CN6)] leading to its redox potential shift was
used. Briefly, the redox potential measurements were made with a platinum electrode
connected to a voltmeter (YSI Pro 1020 ORP meter). Calibration was performed against
420 mV redox standard solutions (VWR ORP standard) at room temperature. Solution
containing 0.5 mM of ferricyanide and ferrocyanide were prepared by mixing 1 mM of tri-

133
potassium hexacyanoferrate (III) and 1 mM of potassium hexacyanoferrate (II) trihydrate
solution. Both solutions were freshly prepared by dissolving solids with 10 mM phosphate
buffer (pH 7.0). An electrode (Symphony platinum electrode, Ag/AgCl) was placed in a 50
mL plastic tube containing 28 mL of ferricyanide/ferrocyanide solution (0.5 mM) and 2
mL of plant extract (1.0 mg/mL). Prior to analysis, oxygen was removed from the system
by continuous flushing with argon for a period of 30 min. The potential was read
approximately 10 min after dipping the electrodes into the solution. A stable redox
potential was arbitrarily defined as a change of less than 1mV in a 3-min period. Ascorbic
acid was used as standard and the results were expressed as ascorbic acid equivalent. The
assay was carried out in triplicate.
4.3.6.4 Hydrogen peroxide scavenging activity
Hydrogen peroxide scavenging activity was carried out following procedure previously
described by Patterson et al. (1984). 135 µL of 20% TiCl4 in concentrated HCl was added
to 100 µL of plant extract (1.0 mg/mL), 815 µL of phosphate buffer (0.17 M, pH 7.4), 200
µL of NH4OH (17.0M), and 100 µL of H2O2 to give a precipitate which was dissolved in 3
mL of 1M H2SO4. Absorbance of the solution was measured spectrophotometrically at 410
nm.
4.3.6.5 Hydroxyl radical scavenging activity
The scavenging activity for hydroxyl radical was measured with Fenton reaction
(Sachindra et al., 2007). One mL of 1.865 mM 1.10 phenanthroline was mixed with 1.0 mL
of 1.865 mM FeSO4, 2.0 mL of 0.2 M phosphate buffer (7.4), 1.0 ml of 1.0 mg/mL plant
extract and 1.0 mL of 0.03 % H2O2. The mixture was incubated at 37°C for 1 hr. After
incubation, absorbance of the mixture was measured at 510 nm with a spectrophotometer.
Ascorbic acid (1.0 mg/mL) was used as reference. All the tests were carried out in
triplicate.
4.3.6.6 Superoxide anion scavenging capacity
Superoxide radical scavenging capacity is based on the anion radical which is associated
with PMS-NADH system (Liu et al., 1997). They are generated through PMS-NADH
system by the oxidation of NADH and are assayed by the reduction of nitro-blue
tetrazolium (NBT). 1.0 mL of NBT solution (156 µM NBT in 100 mM phosphate buffer,
pH 7.4), 1 mL of NADH solution (468 µM in 100 mM phosphate buffer, pH 7.4) and 0.1

134
mL of extract (1.0 mg/mL) were mixed and the reaction started by adding 100 µL of
phenazine methosulphate (PMS) solution (60 µM PMS in 100 mM phosphate buffer, pH
7.4). The reaction mixture was incubated at 25°C for 5 min, and the absorbance was
measured at 560 nm. Decrease in the absorbance of the reaction mixture indicates
increased superoxide anion scavenging capacity. Ascorbic acid was used as standard
solution and the results were expressed as acid ascorbic equivalent. All the tests were
performed in triplicate.
4.3.6.7 Nitric oxide scavenging activity
Sodium nitroprusside in aqueous solution at physiological pH spontaneously generates
nitric oxide, which interacts with oxygen to produce nitrite ion which can be determined by
using Griess reaction (Marcocci et al. 1994). 1.0 mL of 10 mM sodium nitroprusside
prepared in phosphate buffer (50 mM, pH 7.4) was mixed with 0.5 mL of the extract (1.0
mg/mL) and the mixture was incubated at 25°C for 150 min. From the incubation mixture,
1.0 mL was taken out and added to 1.0 mL of Griess reagent (1% sulphanilamide, 2%
orthophosphoric acid, and 0.1% napthlethyline diamine hydrochloride). The absorbance of
the chromophore formed was read at 546 nm. A decrease in absorbance indicates the
increase of nitric oxide scavenging capacity. Ascorbic acid (1.0 mg/mL) was used as
standard antioxidant. All the tests were performed in triplicate.
4.3.6.8 Metal chelating assay (Spectrometric assay)
The chelating abilities on ferrous ion by plant extract were estimated by the method as
described by Gülçin (2006) with some modifications. To 0.5 mL of extract (1.0 mg/mL), 1.
6 mL of deionized water and 0.05 mL of FeCl2 (2 mM) were added. Reaction mixture was
left at room temperature for 10 min with continuous stirring. Finally, the reaction was
completed by the addition of 5 mM of ferrozine (0.1 mL). Then, the mixture was shaken
vigorously and left at room temperature for 10 min. Absorbance of the solution was
measured at 562 nm. Na2EDTA (0.1mg/mL) was used as standard and the results were
expressed as Na2EDTA equivalent. The assay was carried out in triplicate.
4.3.7 Data analysis
All experiments were done in triplicate and were set as a complete randomized design, and
the data were analyzed by one-way analysis of variance (one-way ANOVA) using a

135
significant level of 0.05. Tukey HSD difference test at the same significant level was done
when the analysis of variance found significant differences. Principal component analysis
(PCA) was also performed using R with the statistical package Rcmdr.

136
4.4. Results and Discussion
4.4.1 Total phenolic and flavonoid contents
The TPC (total phenolic compounds) and TFC (total flavonoid content) values of the
extracts were ranged from 168.16 to 7.57μg of gallic acid equivalent/mg of dry extract (or
119.72 to 8.20 μg of Ascorbic acid equivalent/mg of dry extract) and 762.33 to 1.67 μg of
rutin equivalent/mg of dry extract, respectively (Table 4.1). Among the extracts, blueberry
leaf was found to contain the highest phenolic and flavonoid contents. The lowest value of
total phenolic and flavonoid contents was found in dandelion root extract. Among thirty-
six plant extracts studied, the extracts those exhibiting high values of both TPC and TFC
were betel leaf, black currant fruit, black currant residue, chinese litchi, cranberry leaf,
custard apple, sea buckthorn fruit and leaf, mangosteen, parsnip, pomegranate, raspberry,
avocado and rosemary.
Generally, extracts that contain high amount of polyphenols also exhibited high antioxidant
activity. Phenolic compounds are the most widespread secondary metabolites in plants.
This class of compounds have received much attention as potential natural antioxidants in
terms of their ability to act as both efficient radical scavengers and metal chelators (Sharma
and Singh, 2012). It has been reported that the antioxidant activity of phenolic compounds
is mainly due to their redox, hydrogen donating and singlet oxygen quenching properties
(Dutra et al., 2008). The TPC of plant extracts was determined using the Folin-Ciocalteu’s
method. The exact mechanism of the reaction is complex, but it is essentially a redox
reaction occurring between antioxidants with phosphotungstic and phosphomolybic acids.
Thus the assay would not be specific to just phenolic compounds, but also to other
substances that could be oxidized by Folin-reagent; numerous reports have dealt with the
poor specificity of this assay (Singleton et al. 1999; Escarpa and Gonzalez, 2001).
Flavonoids, including flavones, flavanols and condensed tannins, are major class of
secondary metabolites, the antioxidant activity of which depends on the presence of free
OH groups, especially 3-OH. Plant flavonoids have antioxidant activity in vitro and also
act as antioxidants in vivo (Geetha et al., 2003; Shimoi et al., 1996).

137
Table 4.1 Total phenolic and flavonoid contents of aqueous extracts of 36 selected plant materials:
Total phenolic content was expressed as gallic acid (GAE) and ascorbic acid equivalent (AAE) and total
flavonoid content was expressed as rutin equivalent (RE). (±) SD
Extract Total Phenolic Content (TPC) Total Flavonoids Content
(TFC)
(1mg of dry extract)
(μg of Gallic acid
equivalent/mg of dry
extract)
(μg of Ascorbic acid
equivalent/mg of dry
extract)
(μg of Trolox equivalent/mg
of dry extract)
Betel leaf 154.03±0.40 109.91±0.28 24.33±2.52
Blueberry fruit 152.64±1.33 108.94±0.92 300.67±7.51
Brocoli 68.27±0.49 50.35±0.34 90±4.58
Black currant residue 156.80±0.42 111.83±0.29 432.67±9.61
Black currant Fruit 163.89±0.64 116.76±0.45 265.33±5.69
Celery oriental 47.39±1.07 35.85±0.75 39.00±3.61
Chinese leechi 136.64±1.83 97.83±1.27 19.67±2.08
Cranberry leaves 158.03±1.34 112.69±0.93 668.33±9.29
Custard apple 159.68±0.45 113.83±0.31 25.33±5.03
Grape leaf, wild 154.77±1.64 110.43±1.14 687.33±13.50
Green pepper 27.28±0.71 21.89±0.49 2.67±1.53
Hops 81.33±0.40 59.43±0.28 35.67±1.53
Sea buckthorn Fruit 137.12±2.07 98.17±1.44 101.33±3.51
Sea bruckthorn leaf 129.36±10.05 92.78±6.98 106.67±3.06
Mango peel 53.63±0.20 40.19±0.14 38.67±1.15
Mangosteen 159.44±3.15 113.67±2.19 41.67±0.58
Parsnip 139.17±0.53 99.59±0.37 251.67±2.08
Pomegranate 158.80±0.37 113.22±0.25 321.67±3.51
Radish peel 73.41±1.36 53.93±0.94 30.33±1.53
Rainbow chard 58.29±2.30 43.43±1.60 68.00±1.00
Raspberry leaf 154.03±0.69 109.91±0.48 270.33±7.64
Red grape 39.92±0.45 30.67±0.31 3.67±1.15
Rhubarb 95.33±1.19 69.15±0.82 7.33±1.15
Sorrel 23.89±4.14 19.54±2.87 31.33±3.06
Kiwi peel 17.81±0.18 15.31±0.13 4.00±1.00
Tomato 33.15±1.57 25.96±1.09 3.67±0.62
Avocado 161.95±2.13 115.41±1.48 83±3.46
Dandelion leaf 52.35±0.95 39.30±0.66 84.33±2.08
Dandelion root 7.57±0.33 8.20±0.23 1.67±0.58
Blueberry leaf 168.16±1.45 119.72±1.00 762.33±18.01
Rosemary 163.09±2.04 116.20±1.42 338.67±10.69
Orange 21.09±0.20 17.59±0.14 5.33±1.53
Canadian yew 17.15±0.32 14.85±0.22 2.33±1.15
Apple 24.32±0.70 19.83±0.48 2.33±0.58
Banana 24.85±0.56 20.20±0.39 3.67±1.15
Potato Mature 34.59±0.33 26.96±0.23 20.00±2.65

138
4.4.2 Antioxidant activity
Plants, rich in secondary metabolites, including phenolic compounds, and flavonoids
mainly, have antioxidant activity due to their chemical structure and redox properties.
Generally, the aqueous extracts exhibited activities against various radicals investigated.
4.4.2.1 Test Radicals (ABTS tand DPPH)
Trolox equivalent antioxidant capacity
The TEAC (ABTS● scavenging activity) value is a quantification of the effective
antioxidant activity of the extracts. The higher TEAC value implies a greater antioxidant
activity. Table 4.2 shows TEAC activity of thirty-six samples. Betel leaf, blueberry fruit
and leaf, black currant residue, cranberry leaf, custard apple, grapes leaf, sea buckthorn
leaf, mangosteen, pomegranate and raspberry were found to possess high TEAC values,
suggesting that these extracts might function as efficient antioxidants. Moderate ABTS●
scavenging activity was recorded for Chinese litchi (216.30 μg of Trolox equivalent/mg of
dry extract), sea buckthorn fruit (191.79), parsnip (172.14) and rhubarb (120.63), while the
lowest activity was shown by green pepper (31.74).
DPPH free radical scavenging assay
The DPPH free radical scavenging capacity of the 36 aqueous plant extracts are shown in
Table 4.2. Orange showed the lowest DPPH free radical scavenging capacity, while betel
leaf, blueberry fruit, black currant residue, pomegranate, grape leaf, custard apple,
raspberry, avocado, blueberry leaf, and rosemary extracts exhibited promising activities,
suggesting that these extracts may contain some compounds which are efficient hydrogen-
donating antioxidants. Other than these extracts with highest activity, black currant fruit,
chinese litchi, cranberry leaf, sea buckthorn fruit and leaf, and parsnip also showed
relatively high DPPH free radical scavenging activities. DPPH free radical scavenging
activity of plant extracts is commonly reported (Parejo et al. 2003; Wong et al. 2005, Luo
et al. 2010, Beyhan et al. 2010, Sharma et al 2012). The DPPH assay is technically simple
and rapid that might explain its widespread use in antioxidant screening (Karadag et al
2009). However, there are some drawbacks, which may limit its application. It was
reported that reaction of DPPH with eugenol was reversible (Huang et al., 2005), which

139
could result in unexpected low reading of antioxidant capacity of sample containing
eugenol, and other compounds bearing a similar structure. This hypothesis may, in part,
explain the low DPPH free radical scavenging activity exhibited by some extracts in this
study. In addition, the low DPPH values registered by of some extracts could be related to
the presence of compounds not reactive towards DPPH.

140
Table 4.2 Free radical scavenging activity and reducing property of the aqueous extracts obtained from
selected plant materials. (±) denotes standard deviation
Extract TEAC assay DPPH assay Superoxide
Radical
Scavenging
Hydroxyl
Radical
Scavenging
Hydrogen
Peroxide
Radical
Scavenging
(1mg of dry
extract)
(μg of Trolox
equivalent/m
g of dry
extract)
(μg of
Ascorbic acid
equivalent/m
g of dry
extract)
(μg of
Ascorbic acid
equivalent/m
g of dry
extract)
(μg of
Ascorbic
Acid
equivalent/m
g of dry
extract)
(μg of
Ascorbic
Acid
equivalent/m
g of dry
extract)
Betel leaf 281.72±0.11 137.14±0.62 259.36±2.59 230.80±26.35 162.43±3.36
Blueberry fruit 280.69±0.11 134.08±2.36 32.40±5.87 98.57±13.91 124.22±4.24
Brocolli 56.18±4.22 39.27±6.15 80.01±1.61 32.29±6.25 382.70±8.94
Black currant
residue 281.39±0.11 135.88±0.83 37.73±3.86 398.91±9.64 155.83±6.97
Black currant
Fruit 271.50±1.73 124.34±9.00 179.29±13.95 27.68±3.35 27.68±2.60
Celery oriental 38.76±6.05 6.83±0.83 15.74±4.00 26.40±5.10 289.10±8.58
Chinese leechi 216.30±2.50 129.39±4.72 108.83±10.13 44.25±14.03 54.50±5.20
Cranberry leaves 279.67±0.22 136.60±1.65 28.98±4.36 446.36±5.11 84.88±3.28
Custard apple 280.24±0.22 130.83±1.43 23.64±2.67 185.50±14.14 166.62±5.44
Grape leaf, wild 253.18±5.65 131.37±3.24 38.37±9.11 29.20±5.43 46.88±4.27
Green pepper 31.74±1.46 7.91±1.90 39.65±14.05 18.69±3.80 60.07±8.44
Hops 99.00±0.48 59.82±3.84 75.31±10.01 14.09±3.78 117.35±20.44
Sea buckthorn
Fruit 191.79±3.05 122.54±7.34 106.91±15.08 39.10±10.80 87.05±1.41
Sea bruckthorn
leaf 229.76±5.42 134.98±2.25 119.72±5.45 44.95±9.87 175.75±5.02
Mango peel 75.01±4.13 61.08±1.43 189.33±11.33 58.98±13.75 128.22±5.30
Mangosteen 280.24±0.22 135.88±0.83 15.31±8.46 190.76±3.28 171.75±1.98
Parsnip 172.14±2.01 106.50±4.29 162.00±2.06 20.09±4.84 463.49±31.00
Pomegranate 280.37±0.38 134.62±0.94 51.40±8.98 55.23±10.00 267.38±21.21
Radish peel 102.13±1.83 34.40±4.72 172.03±4.00 15.20±4.42 11.83±2.47
Rainbow chard 54.26±4.82 50.26±1.95 44.35±7.96 16.60±4.28 760.97±14.37
Raspberry leaf 280.63±0.11 133.35±2.25 24.07±7.39 99.56±22.40 74.88±14.85
Red grape 39.71±3.65 28.99±2.19 251.46±2.79 23.27±8.40 122.13±17.50
Rhubarb 120.63±9.45 98.21±8.38 15.95±3.03 15.10±1.57 28.68±0.89
Sorrel 39.46±4.73 13.67±2.05 270.04±0.64 19.92±4.77 117.20±15.52
Kiwi peel 39.33±3.22 11.15±1.90 198.08±6.32 18.30±1.78 105.87±2.68
Tomato 57.01±6.26 9.35±2.05 209.19±12.86 18.31±2.46 123.55±5.44
Avocado 264.93±15.32 133.35±2.05 116.73±3.03 75.75±13.26 4.60±0.20
Dandelion leaf 61.67±5.53 28.99±2.77 241.64±11.82 16.88±4.00 37.38±3.46
Dandelion root 35.31±1.89 23.95±1.13 257.65±3.70 30.30±2.01 260.05±6.50
Blueberry leaf 281.07±0.22 135.16±0.54 194.88±11.21 368.47±19.51 130.72±16.16
Rosemary 279.80±0.38 130.29±1.08 14.03±4.63 288.25±12.18 115.22±14.50
Orange 37.67±1.73 22.15±2.16 36.88±1.69 22.02±10.95 306.55±14.01
Canadian yew 26.12±2.32 7.01±1.08 103.07±11.05 19.61±1.22 141.38±2.40
Apple 37.86±6.94 14.76±2.72 272.17±2.43 23.06±0.73 109.05±5.26
Banana 41.18±4.39 12.23±1.13 67.62±9.57 22.56±2.69 136.72±0.35
Potato Mature 63.58±0.58 10.97±2.25 229.04±12.86 19.28±6.31 54.55±16.26

141
4.4.2.2 Relation between anti-radical activities (TEAC, DPPH) and total phenolic
content (TPC) and total flavonoid content (TFC)
There was a strong correlation between TPC and DPPH activity (Figure 4.3). The
relationship between total antioxidant capacities obtained from TEAC and DPPH assays
was parabolic (R2 =0.954) (Figure 4.4), suggesting that antioxidant components in the
extract mixtures could scavenge free radicals by donating single electron and hydrogen
atom, and any one of them could be used for total antioxidant assay, barring certain
constraints with DPPH assay as pointed out before.
(TEAC value)0.5
g of Trolox equivalent/mg of dry extract
4 6 8 10 12 14 16 18
DP
PH
valu
e
g o
f A
scorb
ic a
cid
eq
uiv
ale
nt/
mg
of
dry
ext
ract
0
20
40
60
80
100
120
140
160
R2=0.951
Figure 4.1 Correlation between Trolox equivalent antioxidant capacity and DPPH free radical
scavenging activity
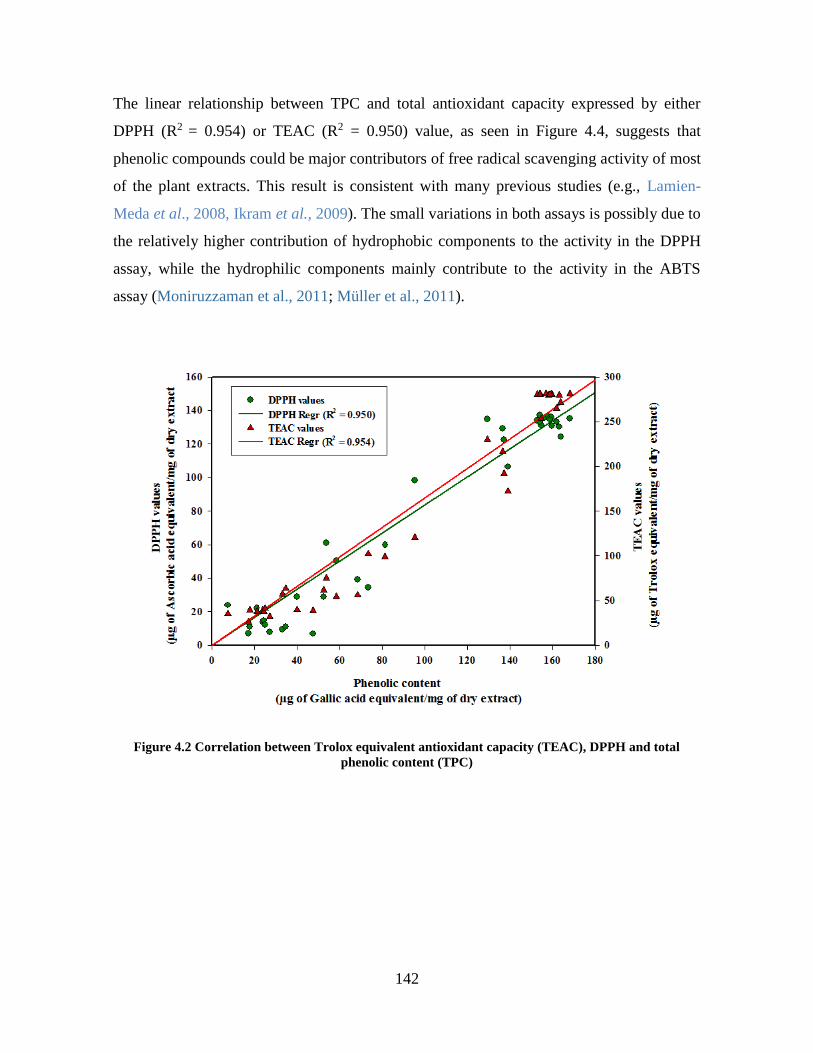
142
The linear relationship between TPC and total antioxidant capacity expressed by either
DPPH (R2 = 0.954) or TEAC (R2 = 0.950) value, as seen in Figure 4.4, suggests that
phenolic compounds could be major contributors of free radical scavenging activity of most
of the plant extracts. This result is consistent with many previous studies (e.g., Lamien-
Meda et al., 2008, Ikram et al., 2009). The small variations in both assays is possibly due to
the relatively higher contribution of hydrophobic components to the activity in the DPPH
assay, while the hydrophilic components mainly contribute to the activity in the ABTS
assay (Moniruzzaman et al., 2011; Müller et al., 2011).
Figure 4.2 Correlation between Trolox equivalent antioxidant capacity (TEAC), DPPH and total
phenolic content (TPC)
143
4.4.2.3 Reducing power property (FRAP)
The ferric ion reducing activities (FRAP) and redox potential (potentiometric assay) values
of the thirty-six plant extracts is shown in Table 4.3 Among the samples, betel leaves,
blueberry fruit, black currant residue, mangosteen, pomegranate and raspberry showed
high FRAP and reducing power values. However, the crude extract of blueberry leaf
displayed, in particular, a considerable reducing power, possibly due to the effect of its
phytochemical components as electron donors and thereby halting radical chain reaction by
converting free radicals to more stable products. Moderate high activity was recorded with
black currant fruit, cranberry leaf, custard apple, sea buckthorn leaf, and avocado; and
dandelion root showed the lowest ferric reducing power.
Naczk et al. (2003) indicated that antioxidant activity of a crude phenolic compound
extract from wild blueberry leaf was comparable to that exhibited by the synthetic
antioxidant butylated hydroxyanisole (BHA). However, Yasoubi et al. (2007) found that
pomegranate peel extract at a 0.050 % level, its antioxidant activity was noticeably higher
than synthetic antioxidants. Betel leaf had been reported to be effective antioxidant, as the
extract of the leaf retarded rancidity of butter cakes and extended their self life (Lean and
Mohamed, 1999).

144
Table 4.3 Free radical scavenging activity and reducing property of the aqueous extracts obtained from
selected plant materials. (±) denotes standard deviation: Ferric reducing power assay (FRAP) and
Nitric Oxide Radical Scavenging (NO)
Extract
(1.0 mg of dry
material)
FRAP
(Spectroscopic Study)
Nitric Oxide Radical
Scavenging
(μg of Ascorbic acid
equivalent/mg of dry extract)
(μg of Ascorbic acid
equivalent/mg of dry extract)
Betel leaf 295.57±6.44 94.21±1.76
Blueberry fruit 329.67±0.87 93.00±2.29
Brocoli 25.14±0.53 68.41±2.02
Black currant residue 315.52±4.16 75.43±0.89
Black currant Fruit 222.51±4.30 44.77±0.60
Celery oriental 18.61±0.45 94.20±6.26
Chinese leechi 95.33±6.35 100.52±4.63
Cranberry leaves 223.15±0.94 112.79±3.48
Custard apple 142.21±1.03 91.39±6.11
Grape leaf, wild 262.36±6.06 106.94±2.21
Green pepper 20.12±0.63 61.36±3.72
Hops 57.79±0.44 108.52±6.38
Sea buckthorn Fruit 94.54±0.57 109.29±0.69
Sea bruckthorn leaf 124.23±2.97 134.04±2.45
Mango peel 49.38±0.71 133.58±2.36
Mangosteen 273.23±8.24 116.66±2.29
Parsnip 82.35±0.28 128.62±3.96
Pomegranate 340.22±0.61 109.08±2.04
Radish peel 30.37±0.15 110.60±1.36
Rainbow chard 19.99±0.07 134.49±0.24
Raspberry leaf 294.23±8.89 131.47±0.51
Red grape 23.76±0.35 128.94±2.53
Rhubarb 71.97±0.64 100.38±1.72
Sorrel 27.98±0.18 97.36±4.32
Kiwi peel 11.45±0.39 134.89±0.83
Tomato 17.15±1.18 132.04±3.57
Avocado 124.98±1.48 92.85±3.95
Dandelion leaf 30.20±1.23 120.64±2.43
Dandelion root 3.29±0.13 65.80±3.56
Blueberry leaf 361.79±12.12 104.59±1.68
Rosemary 216.61±28.61 118.32±3.39
Orange 7.28±1.05 121.09±1.72
Canadian yew 7.33±0.36 109.37±2.27
Apple 11.57±0.07 124.38±5.56
Banana 16.85±1.59 138.20±1.37
Potato Mature 22.61±0.21 143.09±1.89
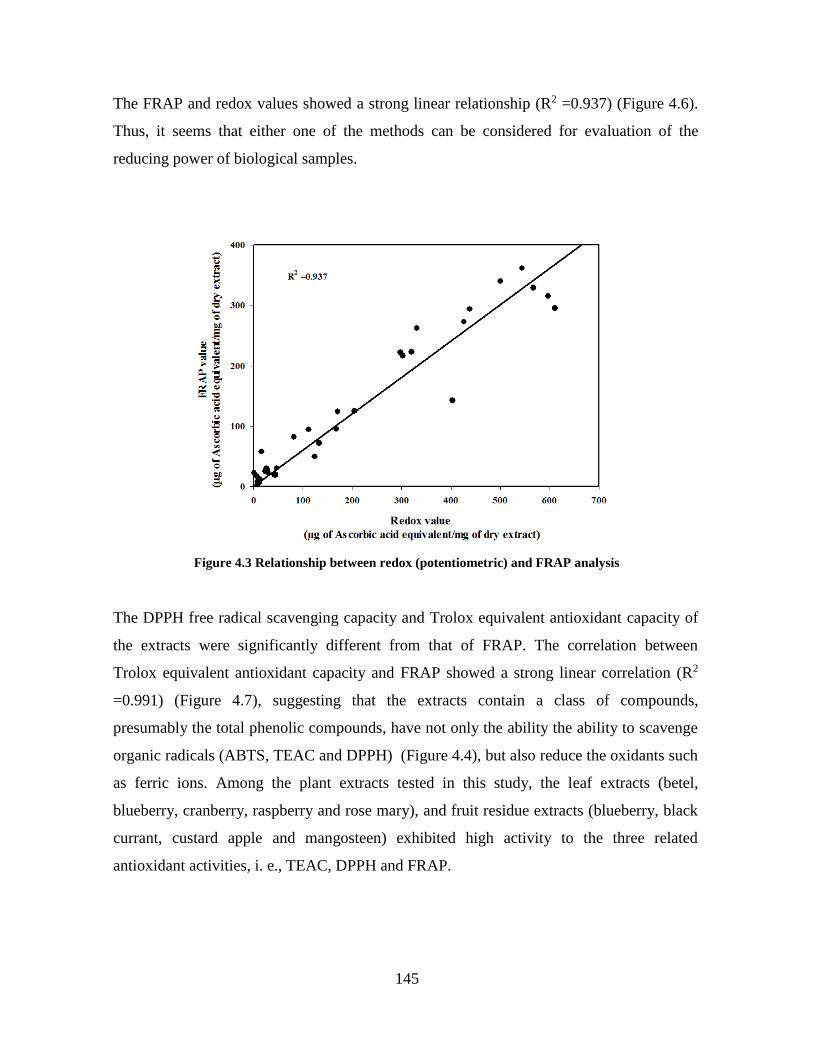
145
The FRAP and redox values showed a strong linear relationship (R2 =0.937) (Figure 4.6).
Thus, it seems that either one of the methods can be considered for evaluation of the
reducing power of biological samples.
Figure 4.3 Relationship between redox (potentiometric) and FRAP analysis
The DPPH free radical scavenging capacity and Trolox equivalent antioxidant capacity of
the extracts were significantly different from that of FRAP. The correlation between
Trolox equivalent antioxidant capacity and FRAP showed a strong linear correlation (R2
=0.991) (Figure 4.7), suggesting that the extracts contain a class of compounds,
presumably the total phenolic compounds, have not only the ability the ability to scavenge
organic radicals (ABTS, TEAC and DPPH) (Figure 4.4), but also reduce the oxidants such
as ferric ions. Among the plant extracts tested in this study, the leaf extracts (betel,
blueberry, cranberry, raspberry and rose mary), and fruit residue extracts (blueberry, black
currant, custard apple and mangosteen) exhibited high activity to the three related
antioxidant activities, i. e., TEAC, DPPH and FRAP.
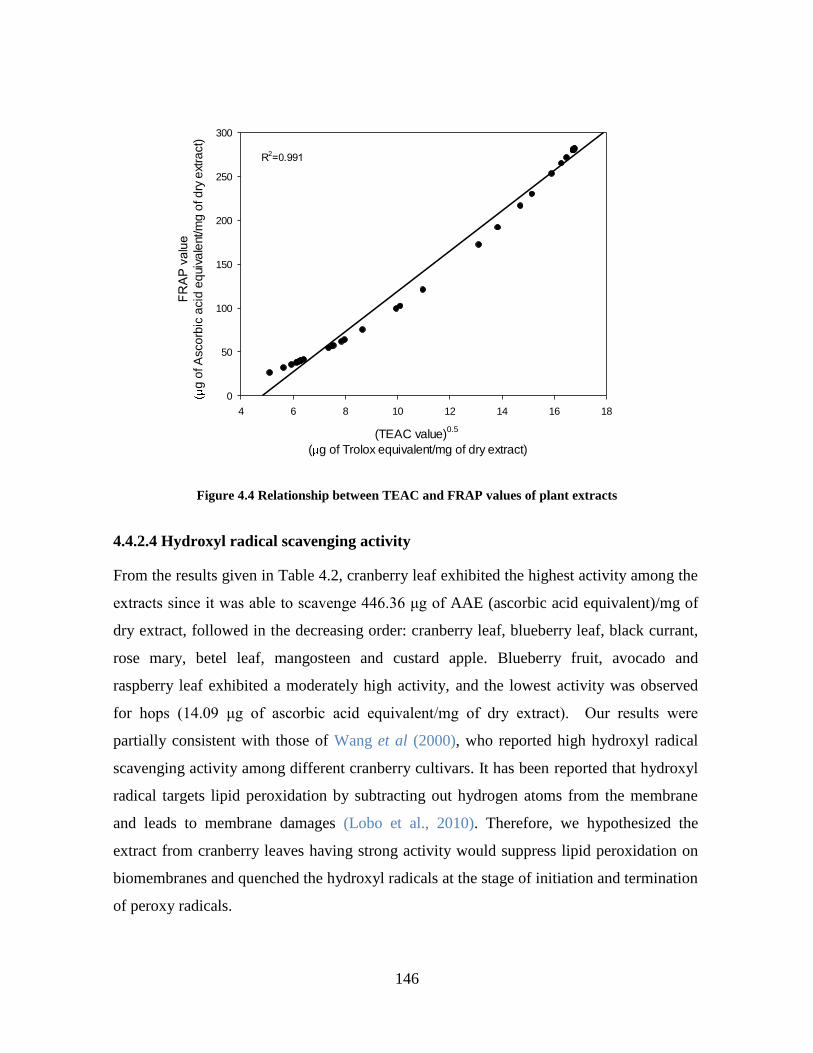
146
(TEAC value)0.5
( g of Trolox equivalent/mg of dry extract)
4 6 8 10 12 14 16 18
FR
AP
va
lue
g o
f A
sco
rbic
acid
eq
uiv
ale
nt/m
g o
f d
ry e
xtra
ct)
0
50
100
150
200
250
300
R2=0.991
Figure 4.4 Relationship between TEAC and FRAP values of plant extracts
4.4.2.4 Hydroxyl radical scavenging activity
From the results given in Table 4.2, cranberry leaf exhibited the highest activity among the
extracts since it was able to scavenge 446.36 μg of AAE (ascorbic acid equivalent)/mg of
dry extract, followed in the decreasing order: cranberry leaf, blueberry leaf, black currant,
rose mary, betel leaf, mangosteen and custard apple. Blueberry fruit, avocado and
raspberry leaf exhibited a moderately high activity, and the lowest activity was observed
for hops (14.09 μg of ascorbic acid equivalent/mg of dry extract). Our results were
partially consistent with those of Wang et al (2000), who reported high hydroxyl radical
scavenging activity among different cranberry cultivars. It has been reported that hydroxyl
radical targets lipid peroxidation by subtracting out hydrogen atoms from the membrane
and leads to membrane damages (Lobo et al., 2010). Therefore, we hypothesized the
extract from cranberry leaves having strong activity would suppress lipid peroxidation on
biomembranes and quenched the hydroxyl radicals at the stage of initiation and termination
of peroxy radicals.

147
4.4.2.5 Hydrogen peroxide scavenging activity
The hydrogen peroxide scavenging activity of most plant extracts was generally low,
except for a few. Among of the 36 studied plant extracts (Table 4.2), only rainbow chard
exhibited relatively high hydrogen paroxide scavenging activity (760.97 μg of ascorbic
acid equivalent/mg of dry extract), followed by parsnip (463.49), broccoli (382.70), orange
(306.55), and celery oriental (289.10). Moderately high activity was observed for
pomrgranate, dandelion root, sea buckthorn leaf, mangosteen, custard apple and betel leaf.
Black currant fruit showed the lowest activity (27.68). Our result was in agreement with
those earlier reported by Hazra et al. (2010), who found negligible hydrogen peroxide
scavenging activity in some fruits (Terminalia chebula, Terminalia belerica and Emblica
officinalis) in comparison to that of the standard (ascorbic acid). In contrast, our results
were opposed to those obtained by Ogunlana and Ogunlana (2008) who reported high
hydrogen peroxide activity in papaya (Psidium guajava) and Wang et al. (2000) who
indicated strong hydrogen peroxide activity for different blackberry cultivars.
4.4.2.6 Superoxide anion scavenging activity
As shown in Table 4.2, it can be put forward that apple (272.17 μg of Ascorbic acid
equivalent/mg of dry extract), sorrel (270.04), betel leaves (259.36), dandelion root
(257.65), dandelion leaf (241.64), red grape (251.46), potato (229.04) and tomato (209.19)
were more potent scavengers of superoxide radical than the other plant extracts. However,
moderately high activities were exhibited by sorrel, kiwi peel, blueberry leaf, mango peel,
black currant fruit, radish peel, parsnip and sea buckthorn. Higher inhibitory effects of the
plant extracts on superoxide anion formation noted herein possibly render them as
promising antioxidants.
4.4.2.6 Nitric oxide scavenging activity
The assay involves generation of nitric oxide using sodium nitroprusside system, which
forms nitrite ion by auto-oxidation. The stable nitrite ion, is assayed spectrophotometrically
(546 nm) measured using Griess reagent system (Marcocci et al. 1994). From the result
given in Table 4.3, it appears that potato, banana, sea buckthorn leaf, mango peel, rainbow
chard, raspberry leaf, tomato, parsnip, apple and orange were potent scavengers of nitric
148
oxide radical. A number of studies reported the potentiality of plant extracts to scavenge
nitric oxide in vitro (Alisi and Onyeze, 2008, Balakrishnan et al. 2009, Ebrahimzadeh et al.
2010, Banerjee et al. 2011). The nitric oxide radical scavenging ability of some flavonoids
was has been reported, and anthocyanidins were found to be the most effective class (Apak
et al., 2016).
4.4.2.7 Metal chelating activity
All the extracts tested were able to chelate ferrous ion to varying extents (Table 4.4). Sea
buckthorn leaf, radish, parsnip, betel leaf, mangosteen, banana showed high iron chelating
activity. While sea buckthorn fruit and rainbow chard, hops, potato mature, tomato,
dandelion leaf and red grape exhibited relativity high activity suggesting that these extracts
contain chelatins and/or or polyacids which were able to chelate ferrous ion, causing the
loss of colour development in the assay.

149
Table 4.4 Ferrous ion chelating activity of aqueous extract obtained from selected plant material. This
activity was expressed as Na2EDTA equivalent and (±) means the standard deviation
Metal chelating activity (spectroscopic study)
(1mg of dry extract) (μg of EDTA equivalent/mg of dry extract)
Betel leaf 71.52±0.21
Blueberry fruit 35.29±1.91
Brocoli 5.79±0.28
Black currant residue 4.40±0.03
Black currant Fruit 0.57±0.11
Celery oriental 0.63±0.28
Chinese leechi 0.25±0.18
Cranberry leaves 39.57±0.18
Custard apple 2.24±1.13
Grape leaf, wild 22.39±0.89
Green pepper 30.91±3.10
Hops 57.11±0.35
Sea buckthorn Fruit 58.40±0.34
Sea bruckthorn leaf 75.77±0.08
Mango peel 3.91±1.14
Mangosteen 70.49±0.16
Parsnip 74.42±0.12
Pomegranate 24.65±0.00
Radish peel 75.69±0.08
Rainbow chard 57.51±0.37
Raspberry leaf 8.28±1.04
Red grape 51.67±0.44
Rhubarb 40±0.62
Sorrel 34.49±0.72
Kiwi peel 26.04±0.20
Tomato 52.96±0.06
Avocado 28.26±0.49
Dandelion leaf 52.36±0.04
Dandelion root 7.25±0.05
Blueberry leaf 13.86±0.07
Rosemary 27.70±0.17
Orange 20.58±0.12
Canadian yew 25.47±0.20
Apple 13.91±0.06
Banana 65.67±0.09
Potato Mature 56.50±0.00
150
4.4.3 Inter-relationships between anti-radical activities
The correlation between various radical scavenging activities of the 36 plant extracts is
shown in Figure 4.12. The total antioxidant activity as determined by test radicals, the
TEAC and DPPH values and the reducing power, determined either by FRAP or the redox
potential are inter-related with high correlation coefficients (r > 0.91, p < 0.05) (Figures
4.3, 4.7 and 4.12). This suggests that same class of compounds in the extracts play
antioxidant role in these assays. Hydroxyl radical scavenging activity of the samples was
also related positively to TEAC, and FRAP values, but at lower correlation coefficient (r)
of 0.64 and 0.67, respectively (Figure 4.12), suggesting that only a sub-class of the
compounds in the samples are active scavengers of hydroxyl radicals.
The TEAC, DPPH and FRAP values of the plant extracts strongly related to their total
phenolic content (TPC) and to a lesser extent with total flavonoid content (TFC). A better
correlation was also observed between hydroxyl radical scavenging activity and TFC than
TPC (Figure 4.12), suggesting that flavonoids may be main components in the extract
contributing to this activity; but again certain flavonoids with potent antioxidant activity
such as quercetin - a flavonol or luteolin - a flavone (Arora et al. 1998) may be present at
higher levels in some extracts than in others. Phenolic compounds are largely hydrophilic
antioxidants, and these secondary metabolites that are most abundant in fruits (Macheix et
al., 1990). Gil et al. (2002) found high correlation (r=0.90) between antioxidant activities
as determined by DPPH or FRAP assay and TPC in nectarines, peaches and plums. Also,
high correlation between TPC and antioxidant activity as determined by FRAP were
reported in fruit juices (Gardner et al., 2000).
The superoxide anion (SOA) radical, H2O2 and NO scavenging activities did not show any
relationship to TEAC, DPPH and FRAP values of the extracts nor to TPC and TFC (Figure
4.12). It suggests that other classes of compounds in the extracts than the phenolic
compounds may be the active compounds playing a role in those scavenging activities.
Principal component analysis (PCA) was performed on the data and is illustrated as a
correlation circle in Figure 4.13, with principal dimensions accounting for 56 % variations
(Dimension 1) and 13 % of variations (Dimension 2), respectively. It confirms the above
conclusions that TEAC, DPPH and FRAP values are very closely and co-linearly related
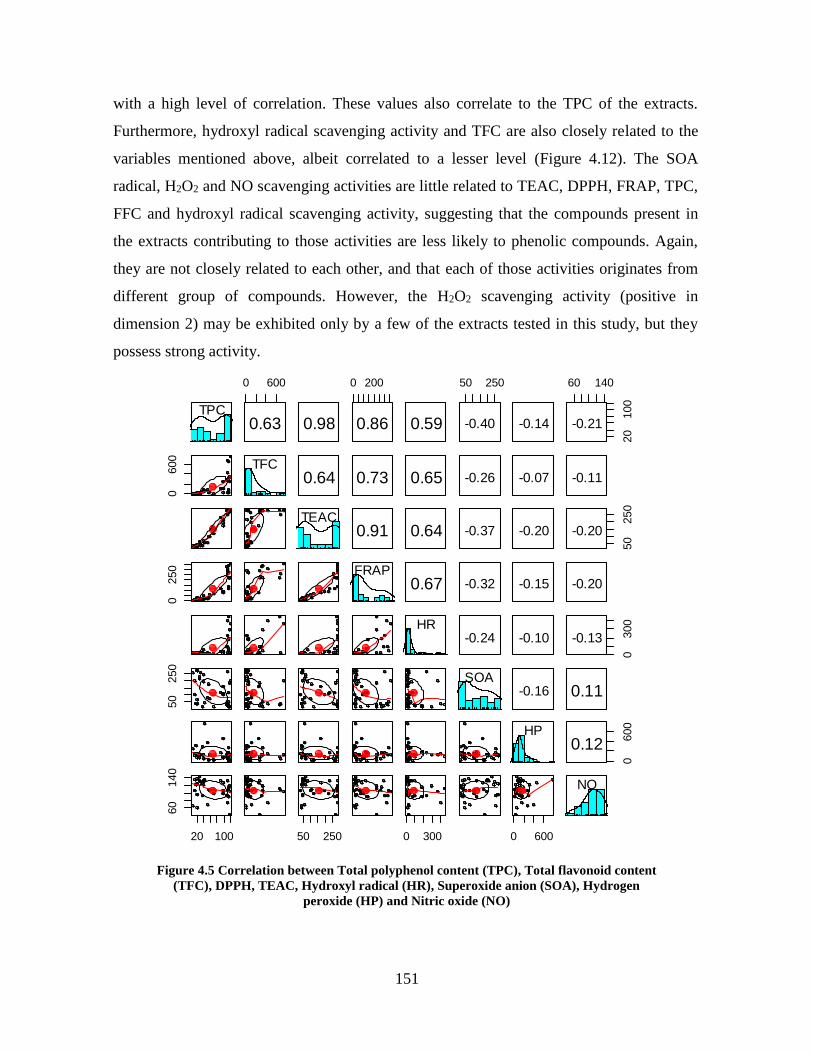
151
with a high level of correlation. These values also correlate to the TPC of the extracts.
Furthermore, hydroxyl radical scavenging activity and TFC are also closely related to the
variables mentioned above, albeit correlated to a lesser level (Figure 4.12). The SOA
radical, H2O2 and NO scavenging activities are little related to TEAC, DPPH, FRAP, TPC,
FFC and hydroxyl radical scavenging activity, suggesting that the compounds present in
the extracts contributing to those activities are less likely to phenolic compounds. Again,
they are not closely related to each other, and that each of those activities originates from
different group of compounds. However, the H2O2 scavenging activity (positive in
dimension 2) may be exhibited only by a few of the extracts tested in this study, but they
possess strong activity.
TPC
0 600
0.63 0.98
0 200
0.86 0.59
50 250
-0.40 -0.14
60 140
20
100
-0.21
0600
TFC0.64 0.73 0.65 -0.26 -0.07 -0.11
TEAC0.91 0.64 -0.37 -0.20
50
250
-0.20
0250 FRAP
0.67 -0.32 -0.15 -0.20
HR-0.24 -0.10
0300
-0.13
50
250
SOA-0.16 0.11
HP
0600
0.12
20 100
60
140
50 250 0 300 0 600
NO
Figure 4.5 Correlation between Total polyphenol content (TPC), Total flavonoid content
(TFC), DPPH, TEAC, Hydroxyl radical (HR), Superoxide anion (SOA), Hydrogen
peroxide (HP) and Nitric oxide (NO)

152
-1.0 -0.5 0.0 0.5 1.0
-1.0
-0.5
0.0
0.5
1.0
Variables factor map (PCA)
Dim 1 (55.95%)
Dim
2 (
12
.95
%)
TPCTFC DPPH
TEACHR
SOA
HP
NO
FRAP
Figure 4.6 Multi correlation between Total polyphenol content (TPC), Total flavonoid content (TFC),
DPPH, TEAC, Hydroxyl radical (HR), Superoxide anion (SOA), Hydrogen peroxide (HP) and Nitric
oxide (NO)
153
4.4.4 Anti-radical activity spectrum
Present investigation confirms that the plant extracts are a rich potential source of natural
antioxidants, and they can be beneficial in preventing the progress of various oxidative
damages. Among the plant extracts, there was none exhibiting high activities against all:
organic radicals, SOA radical, hydroxyl radical and nitric oxide scavenging and iron
binding activities. This is understandable that a specific plant material may not possess an
array of compounds to exhibit all the activities evaluated in this study (Tables 4.2 – 4.4).
However, betel leaf extract exhibited high activities, including iron binding and scavenging
of various radicals except nitric oxide, where the activity was moderate nonetheless. Thus
this search, although not exhaustive, could identify one plant material exhibiting a wide-
spectrum antioxidant activity. Mangosteen that is less active against SOA radical, and, blue
berry leaf that less active against H2O2 scavenging and iron chelating activities could be
considered wide spectrum active materials to a lesser extent. Other moderate spectrum
active extracts were sea buckthorn leaf, pomegranate, rose mary cranberry leaf, custard
apple and black currant fruit.
Many materials that exhibited low TEAC, DPPH or FRAP values exhibited high NO
scavenging or SOA radical scavenging activities, including potato, dandelion leaf, mango,
tomato, kiwi, and rainbow chard. Interestingly, some materials such as rainbow chard,
broccoli, orange, oriental celery, parsnip exhibited very high H2O2 scavenging activity, and
some of them showed this activity.
Overall, some generalisation can be made: all extracts exhibiting high hydroxyl radical
scavenging extracts also exhibited high TEAC, DPPH and FRAP values. Likewise, all
SOA radical scavenging extracts and metal chelating extracts also exhibited high NO
scavenging activity. High H2O2 scavenging activity was exhibited by extracts that did not
exhibit any other activity, including oriental celery and broccoli and some such as rainbow
chard, orange and parsnip that showed good activity against NO. Dandelion root, sorrel and
hops showed high activity only against SOA radical.
This radical specificity could be linked to the presence of phytochemicals, which are
variably present in all plant genera, for example, antioxidant activity in fruits could be due
to abundance of flavonoids and also phenylpropanoid derivatives (Gordon, 1996; Rapta et

154
al., 1995; Yokozawa et al., 1997). Present study explains that screening of plant extracts
using the various radical quenching methods could be effective for the selection of
materials exhibiting either wide spectrum anti-radical activity or a specific radical
scavenging activity. In any event, more detailed studies on the chemical composition of
those extracts, as well as studies with other models, such as lipid peroxidation and in vivo
assays are essential to characterize them as biological antioxidants.

155
4.5 Conclusions
This work evaluated the spectrum of anti-radical activity of 36 plant extracts against
organic (ABTS and DPPH), superoxide anion (SOA), hydroxyl and nitric oxide radicals.
Ferric ion reducing activity and ion binding capacity of the extracts were also examined.
TEAC, DPPH and FRAP assays provide essentially the same response with respect to the
antioxidant activity of plant extracts, suggesting that any one of them would be adequate to
evaluate their anti-radical capacity. Betel leaf, blueberry fruit and black currant and
cranberry leaf showed high radical scavenging activity (TEAC assay); apple, sorrel, red
grape and dandelion root were against SOA; cranberry leaf, blueberry leaf, black currant
and Rosemary against hydroxyl radical; rainbow chard, parsnip, broccoli and orange
against H2O2; and potato, banana, sorrel, sea buckthorn leaf against nitric oxide. Blueberry
leaf and fruit, pomegranate, black currant and betel leaf showed high ferric ion reducing
power. The extracts showing high iron binding capacity were: sea buckthorn leaf, radish,
parsnip, betel leaf and mangosteen. Betel leaf extract exhibited high activities, including
iron binding and scavenging of various radicals except nitric oxide, where the activity was
moderate nonetheless. Thus, this search could identify one plant material exhibiting a
wide-spectrum antioxidant activity. Mangosteen that is less active against SOA radical,
and, blue berry leaf that less active against H2O2 scavenging and iron chelating activities
could be considered wide spectrum active materials to a lesser extent. This study also
shows that antioxidant activity of a substance, determined by one or more related assays,
does not give the complete picture of its effectiveness against various species of oxygen
radicals; and emphasizes that determination of the spectrum of the anti-radical activity
would be necessary.

156
Chapter 5 CHARACTERIZATION OF ANTIMICROBIAL ACTIVITY OF
SELECTED PLANT EXTRACTS: ANTIMICROBIAL ACTIVITY INDEX AND
SPECTRUM OF ACTIVITY
L’activité antimicrobienne des extraits de plantes sélectionnés a été évaluée en détail par turbidimétrie en
milieu liquide et par diffusion en milieu solide (gel). L’activité antimicrobienne a été exprimée dans la
première méthode par l’inhibition de la croissance (GI), par la concentration minimale inhibitrice (MIC) et par
une nouvelle expression, dénommée index antimicrobien (AMI). Dans la seconde méthode, l’activité a été
exprimée en zone d’inhibition. L'AMI prend en compte les trois phases de croissance des bactéries. Bien que
les méthodes turbidimétriques soient fiables dans l’évaluation de l’activité antimicrobienne des substances,
la nouvelle expression (AMI) semble être plus significative car, elle comprend l’information sur l’interaction
entre la substance et le micro-organisme et sa vitesse de croissance en présence de cette substance. De plus,
l'AMI démarque l’activité des échantillons, même ceux qui sont très actifs. Le spectre d’activité
antimicrobienne des extraits de plantes sélectionnés a été également étudié. Seulement quelques extraits ont
montré un spectre d’activité antimicrobienne assez large. En effet, seul l’extrait de feuille de bétel a un large
spectre d’activité contre les bactéries, les levures et les champignons, suivis des extraits de grenade et de
fruits d’argousier qui semblent être efficaces contre les bactéries et les levures. L’extrait de cassis est
effectivement une substance antibactérienne.

157
5.1 Abstract
There is much interest in natural antimicrobials from plant sources to replace synthetic
antimicrobial agents in foods. The antimicrobial activity of compounds or natural
preparations is generally evaluated by turbidimetric methods, zone of inhibition or by plate
count against selected test organisms. The responses from these methods may be
contradictory at times either because of the method itself or constituents of the test
substance such as plant extracts that are complex mixtures. The ability of natural substances
to act against a variety of microorganisms is also an important consideration in the
evaluation of their potential as antimicrobial agents. Thus the objective of this study was to
identify suitable assays for the evaluation of the antimicrobial activity of plant extracts, and
to evaluate the spectrum of activity of selected extracts against bacteria, yeasts and fungi.
Thirty-five aqueous plant extracts were characterized for antimicrobial activity against
Escherichia coli (ATCC 25922) by agar diffusion method and micro-titer broth dilution
method (growth inhibition capacity and MIC). We have developed an expression, the
antimicrobial index (AMI) that takes into account of the antimicrobial action during all the
three phases of bacterial growth from the broth dilution method. Although the turbidimetric
methods were in good agreement in the assessment of the antimicrobial activity of the
substances, the new expression AMI appears to be more meaningful since it carries the
information regarding interaction between the substance and the microorganism. In
addition, AMI demarcates the activity of samples, even those found to be highly active. It
was found that betel leaf, blackcurrant, pomegranate peel, sea buckthorn leaf and wild
grape leaf exhibited significant antimicrobial activity. Only betel leaf extract showed a
broad spectrum of antimicrobial activity against bacteria (Escherichia coli, Bacillus
subtili,s and Listeria monocytogenes); yeasts (Candida tropicalis and Zygo
saccharomyces)s); and molds (Botrytis cineria and Penicillium chrysogenum); whereas
pomegranate and sea buckthorn leaf extracts were effective against both bacteria and
yeasts. Black currant extract is an effective antibacterial substance. These extracts could be
potentially rich sources of natural antimicrobials for food applications.
Key words: agar diffusion, microdilution, turbidimetry, time kill curve, MIC, growth
inhibition, growth rate.

158
5.2 Introduction
Plants have been focus of attention for a longtime as source of antimicrobial compounds
and it has been reported that two-thirds of the world’s plant species have medicinal value
(Craig, 1999; Krishnaiah et al., 2011). In recent years, there has been an increasing interest
in antimicrobial properties of medicinal plants, and enormous attention is being paid in the
discovery of new antimicrobial from natural sources. (Brown et al., 2014; Khanam et al.,
2015), as multi-drug resistance are becoming a concern that can have considerable impact
on public health with treatment failures (Balouiri et al., 2016). However, the research on
plants for antimicrobial compounds has yet to see a systematic approach on screening for
possible candidates active against microbial pathogens, yeasts and fungi (Aqil and Ahmad,
2003). Furthermore, the screening processes, as of now, do not necessarily take into
account of the morphological (Gram-positive or negative) or growth requirement (aerobe or
anaerobe) characteristics of bacteria. It is expected that testing of selected plant extracts
against wide variety of test microorganisms will be helpful in obtaining a broad-spectrum
herbal formulation as well as new antimicrobial substances.
Growth parameters are important identifiers for determining the impact of an antimicrobial
compound on the viability of bacteria. The general growth curve of bacteria is characterized
by four phases: the lag phase, the exponential growth phase, the stationary phase and the
death phase. In the lag phase, there is little growth as the bacteria adapt to the new
environment and synthesize enzymes required for growth. The exponential phase describes
the multiplication of bacterial cells at a rate proportional to the number of cells present
initially, leading to an exponential increase in the number of cells at growth rate that is
characteristic of the bacteria, and dependent on various factors such as pH, temperature,
presence of antimicrobial constituents and others. As the nutrients are depleted in the
medium and inhibitory metabolites accumulate, or other environmental conditions
restricting the number of cells that can be sustained, bacterial growth ceases and the
bacteria moves into the stationary phase. Finally, cellular death and a declining population
occur when the surroundings cannot support the population (Davidson et al., 2005).
Several bioassays are used to determine the activity of antimicrobial substances, such as the
well known and commonly used disk diffusion or well diffusion and broth or agar dilution
(Balouiri et al., 2016). These methods can be qualitative and quantitative in nature. A
159
qualitative test such as the Kirby-Bauer disk diffusion method helps screening candidate
antimicrobial compounds, whereas quantitative methods (such as MIC, growth inhibition),
also known as end point methods, help quantify the potency of the compound.
Turbidimetry based techniques are routinely used to estimate the concentration of pure
cultures and have the advantage of being rapid and non-destructive (Li et al., 1993; Lima et
al., 2012). Tubidity techniques are based on light scattering by suspended particles in a
solution or dispersion, and it can be related to the population of microbial cells and is used
follow bacterial growth through various phases. The absorbance readings are often checked
and confirmed with the plate counts. Although it is based on Beer's Law (absorbance is
proportional to the concentration of the substance being measured). Absorbance readings
can help monitor lag phase, growth rate, and maximum population in real time and
ascertain the effectiveness of an antimicrobial agent. Although, only the maximum growth
is noted to describe the effect of environmental conditions from these measurements, other
criteria such as lag time and growth rate can also be derived from the growth curves that
may reflect bacterial growth through its life cycle under different physico-chemical
conditions, which can help understand the effects of antimicrobials and help build
prediction models for use in food microbiology. Mathematical modelling incorporating
growth kinetics can be useful in advancing the understanding a wide variety of intrinsic and
extrinsic factors governing microbial growth.
The aim of this study was two-fold. The first aim was to develop a primary three-phase
linear kinetic model to determine the impact of selected plant extracts on the growth curve
of E. coli, using absorbance measurement through its growth cycle, and compare it with
other standard methods of antimicrobial assay, including maximum growth inhibition or
inhibition capacity, MIC and diffusion assay. While all these assays would allow a detailed
characterization of the antimicrobial activity of extracts and would help identify the more
promising extracts for antimicrobial activity, there is an opportunity to determine the
kinetic parameters arising from the three-phase model to evaluate antimicrobial effect of
the extracts. Second, some of the promising fruit and vegetable extracts were evaluated for
their spectrum of antimicrobial activity, including against E. coli (Gram-negative) B.
subtilis (Gram-positive), Listeria monocytogenes (pshrotropic and Gram-positive
pathogen), and Geobacillus stearothermopilus (thermo-resistant); yeasts: Candida

160
tropicalis and Zygo saccharomyces; and molds (Botrytis cineria, Penicillium
chrysogenum).

161
5.3 Materials and methods
5.3.1 Plant materials
Thirty-five vegetable and plant by-products were collected from farms, farmer’s markets
and fruit and vegetable processors in and around Quebec, QC, Canada. The selected plant
materials were from a second harvest. In a previous work, they had already been tested for
antimicrobial activity. The plants material that were investigated include Apple peel (Malus
communis), Avocado peel (Persea americana), Banana peel (Musa acuminate), Betel
leaves (Piper betle), Blueberry fruit peel (Vaccinium corymbosum), blueberry leaves
(Vaccinium corymbosum), Broccoli florets(Brassica oleracea), Black currant residue (Ribes
nigrum), Black currant peel (Ribes nigrum), oriental celery (Apium graveolens), Chinese
litchi (Litchi chinensis), Cranberry leaves (Vaccinium macrocarpon), Custard apple
(Annona squamosa), Dandelion root (Taraxacum officinalis), Dandelion leaves
(Taraxacum Officinalis), Grapes leaves (Vitis vinifera), Green pepper (Capsicum annuum),
Hops (Humulus lupulus), Indian summer fruit peel (Rudbeckia hirta fruit), Indian summer
leaves (Rudbeckia hirta leaves), Mango peel (mangifera indica peel), Mangosteenn peel
(Garcinia mangostana), Orange peel(Citrus sinensis), Parsnip peel (Pastinaca sativa),
Pomegranate peel (Punica granatum), Potato peel (Solanum tuberosum), Radish peel
(Raphanus sativus) Rainbow Chard (Beta vulgaris), Raspberry leaves (Rubus idaeus
leaves) red grape, rhubarb (Rheum rhabarbarum), Rosemary (Rosmarinus officinalis),
Sorrel (Hibiscus sabdariffa), Kiwi peel (Actinidia chinensis peel), Canadian yew (Taxus
Canadensis) and Tomato peel (Solanum lycopersicum). Upon arrival to the laboratory,
samples were first washed with distilled water and 300 ppm bleach solution to remove dirt
and debris. Thereafter, within 48 hours, the samples were lyophilized, ground to powder,
vacuum-sealed and stored at -30°C until ready for extraction.
162
5.3.2 Extraction and stock solution preparation
About 50 gram of the lyophilized plant material powder was extracted with 500 mL of
distilled water at 80-90°C for 60 minutes in a water bath with continuous agitation. The
decoction was then vacuum filtered (Whatman No. 1 filter paper) and the filtrate was then
concentrated under vacuum using a rotary evaporator at 65°C until about the 100 mL of
volume was left, thereafter the liquid was lyophilized. The lyophilized samples were then
vacuum-packed and stored at -30oC until further use. For the antimicrobial assays the
samples were dissolved in Mueller-Hinton broth to obtain a stock solution of 80 mg/ml. All
the stock solutions were stored at 4oC and were used within 24 hours.
5.3.4 Bacterial strains and inoculum preparation
The antimicrobial activity of the extracts was determined against E. coli (ATCC 25922).
Bacterial culture was revived from stock at -80°C by three successive growth cycles at 37
°C for 24 h in Muller Hilton Broth (Sigma Aldrich). The standard inoculum was prepared
following NCCLS guidelines (Jorgensen and Ferraro, 2009) with bacteria in log phase
growth (4h after incubation) and then was standardized to match that of a 0.5 McFarland
standard (corresponds to approximately 1.5 x 10⁸ CFU/ml). The adjusted bacterial culture
suspension was used within 15 minutes.
5.3.5 Antimicrobial activity assays
5.3.5.1 Zone inhibition agar gel diffusion assay
Plant extracts were tested according to NCCLS guidelines for antimicrobial susceptibility
tests with modifications (Jorgensen and Ferraro, 2009). The 100 mm MH agar (MHA)
plates were inoculated by confluent swabbing from the standard bacterial suspension. Four
6 mm wells were made in each MHA plate and then 80ul of plant extract at the
concentration of 10 mg/ml was added. Chloramphenicol (1.0 mg/ml) and sterile water were
used as positive and negative controls, respectively. The prepared plates were kept for 30
minutes at room temperature for diffusion and then incubated at 37oC. The zones of
inhibition were measured after 24h.
163
5.3.5.2 Micro-titer broth dilution (growth inhibition or inhibition capacity) and time
kill curve assay
The GI (%) value of plant extracts and the potential to reduce the bacterial population over
time was determined turbidimetrically using a micro-titer broth dilution assay (NCCLS,
1991; Wiegand et al., 2008). Briefly, 190 µl of plant extract in MH broth (10 mg/mL) was
pipetted in a 96-well plate. Subsequently, the wells were inoculated with the test strain
(10µl) to achieve a final concentration of 104- 105 CFU/mL in each well. The blank and
assay control was the plant extract (190 µl at 10 mg/mL) and 10 µl of MH broth without the
test strain, respectively; the latter also served as the sterility control. Chloramphenicol (1.0
mg/mL) was used as the positive control, while the inoculated MH medium as the negative
control. The microplates were incubated at 37°C on a micro-plate reader (Biotek Power
XS2). For time kill assay, hourly absorbance readings (OD600nm) were recorded for a period
of 24 hours, and the growth inhibition or inhibition capacity was expressed as a percentage.
The percentage of growth inhibition was calculated by the difference between the OD
reading of the sample and the negative control (sterile water). All assays were performed in
triplicate.
5.3.5.3 Broth micro-dilution (MIC) assay
Plant extracts were tested as per NCCLS guidelines for micro-dilution susceptibility tests
for aerobic bacteria (NCCLS, 1991) with modifications. The 96 wells micro-titer plates
were prepared with 12 plant extracts in the columns at 80 mg/mL in MH broth. Eight serial
dilutions were made in the rows with the lowest concentration tested being 0.6125 mg/mL.
Thereafter, 10µl of standard inoculum was dispensed in each well to give a final
concentration of 104- 105 CFU/mL. The MIC value after 24 hours of incubation at 37oC,
was the lowest concentration of plant extract at which no growth could be detected by
visual inspection. Chloramphenicol (1.0 mg/mL) was used as a positive control.

164
5.3.5.4 Agar dilution (yeasts)
Antimicrobial activity against yeasts was tested through an agar dilution method (NCCLS,
1991). This method involved incorporating the plant extract into the agar medium at the
concentration of 10 mg/mL. Thereafter, the prepared plates were inoculated with 100 µl of
yeast suspension (103 CFU/ml) onto the agar plate surface. The plates were then incubated
at 30oC and CFU was recorded at 48 hours and 96 hours. The result was expressed in
percentage of inhibition with reference with the control (without the incorporation of plant
extract)
5.3.5.5 Anti-fungal assay (agar dilution)
Anti-fungal activity was evaluated by radial growth method on agar plates amended with
the extracts (El Ghaouth et al., 1992). PDA plates containing 10 mg/ml of plant extracts
were seeded with 5 mm diameter agar plugs taken from the margin of 10-day old Botrytis
cineria cultures (3 day old Penicillium chrysogenum cultures). The test was performed in
triplicate and the plates were incubated in the dark at 24oC. Growth measurements were
determined visually by when the growth on the negative control (sterile water containing no
plant extract) reached the edge of the plate.
5.3.6 Empirical expression for antimicrobial activity
Antimicrobial index (AMI) derivation
The general growth curve of bacteria is characterized by three phases: the lag phase, the
exponential growth phase and the stationary phases, where specific growth rate is zero in
the lag and stationary phases and the logarithm of the bacterial population increases linearly
with time in the exponential phase. The presence of antimicrobial compounds in the
medium can significantly alter the growth kinetics of bacteria. The impact of antibacterial
can manifest by affecting the ability of the bacteria to use its growth medium to prepare for
exponential growth, thereby prolonging the lag phase; and lowering the growth rate during
the log phase as well as the maximum cell count.
The bacterial growth curve without a lag phase can be described by a hyperbolic function
(Michaelis-Menton equation in enzyme kinetic):
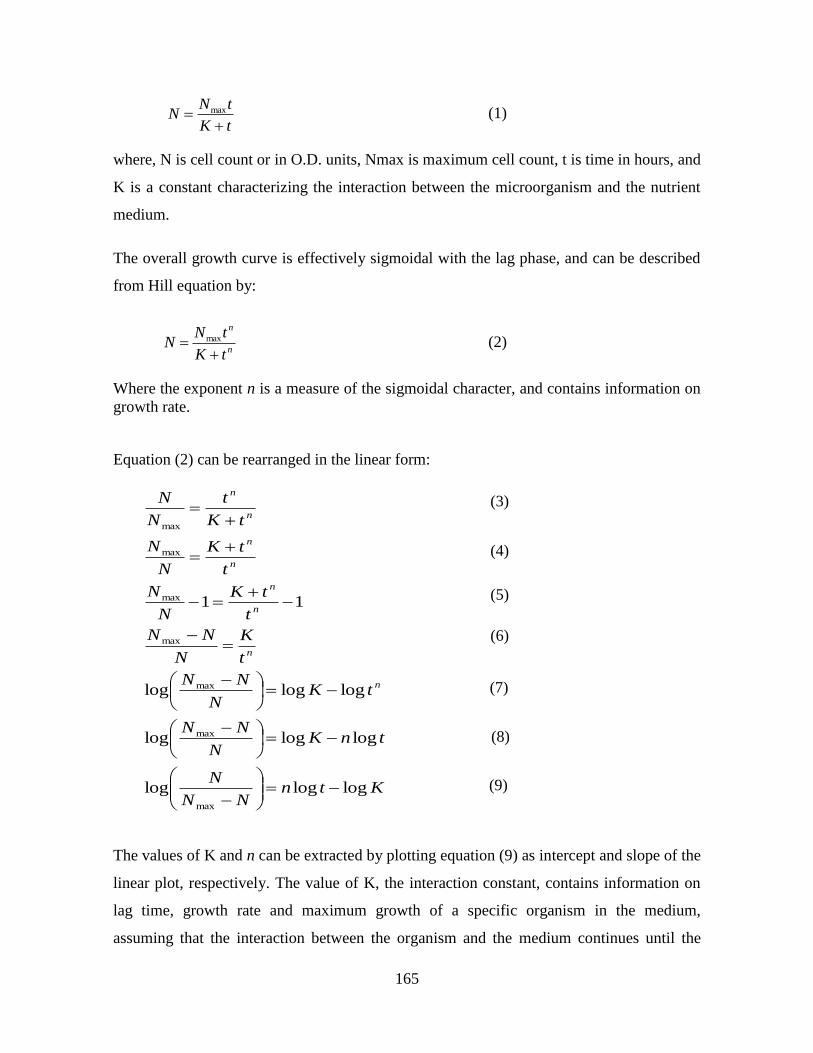
165
tK
tNN
max (1)
where, N is cell count or in O.D. units, Nmax is maximum cell count, t is time in hours, and
K is a constant characterizing the interaction between the microorganism and the nutrient
medium.
The overall growth curve is effectively sigmoidal with the lag phase, and can be described
from Hill equation by:
n
n
tK
tNN
max (2)
Where the exponent n is a measure of the sigmoidal character, and contains information on
growth rate.
Equation (2) can be rearranged in the linear form:
The values of K and n can be extracted by plotting equation (9) as intercept and slope of the
linear plot, respectively. The value of K, the interaction constant, contains information on
lag time, growth rate and maximum growth of a specific organism in the medium,
assuming that the interaction between the organism and the medium continues until the
KtnNN
N
tnKN
NN
tKN
NN
t
K
N
NN
t
tK
N
N
t
tK
N
N
tK
t
N
N
n
n
n
n
n
n
n
n
logloglog
logloglog
logloglog
11
max
max
max
max
max
max
max
(3)
(4)
(5)
(6)
(7)
(8)
(9)
166
nutrients in the medium are depleted. However, it can be expected that these kinetic values
would be modified when the nutrient medium contains antimicrobial substances in the
medium, as the antimicrobial substance in the medium interferes with the normal growth
process of the organism.
Thus, higher K values for the organism in the medium amended with potentially
antimicrobial substances relative to that in the growth medium alone would suggest
inhibitory action of those substances, encompassing all phases of growth. On the other
hand, smaller values of n compared to that in the growth medium would indicate growth
inhibition. Howerver, the K and n for a specific organism and a specific antimicrobial test
substance would depend on the concentration of the test substance in the medium,
temperature, pH, and redox status as the latter two factors might be altered by the presence
of the test substance. In addition, the interaction of the substance with the organism may
involve induction of inhibitory metabolites by the organism.
The values of K and n can be expressed relative to those of the growth medium alone as:
K1 = K/K0 and n1 = n/n0
where K and K0 are interaction constants; and n and n0 are growth rates in the medium
containing antimicrobial substance and in the medium alone, respectively; and K1 and n1
are inhibition constant and growth constant, respectively. When K1 is unity, no inhibition
occurs, and values >1.0 signify inhibitory activity. Likewise, a value of unity for n1
signifies no modification in the growth rate of the organism by the substance, and the
growth rate is reduced when the values of n1 are <1.0.
Combining these two kinetic constants, K1 and n1, we can obtain a measure of the
antimicrobial effect of the substance, the antimicrobial index (AMI):
AMI = K1/n1 (10)

167
5.3.7 Data analysis
All experiments were done in triplicate and were set as a complete randomized design, and
the data were analyzed by one-way analysis of variance (one-way ANOVA) using a
significant level of 0.05. Tukey HSD difference test at the same significant level was done
when the analysis of variance found significant differences. Principal component analysis
(PCA) was also performed using R with the statistical package Rcmdr.
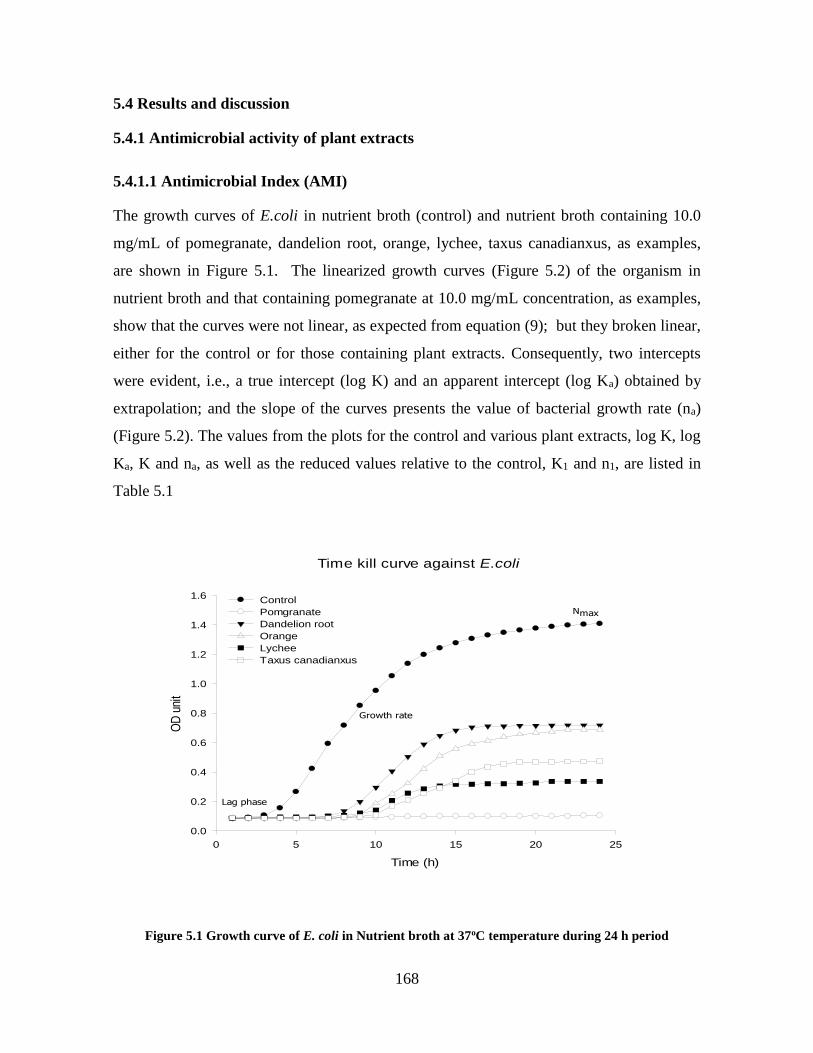
168
5.4 Results and discussion
5.4.1 Antimicrobial activity of plant extracts
5.4.1.1 Antimicrobial Index (AMI)
The growth curves of E.coli in nutrient broth (control) and nutrient broth containing 10.0
mg/mL of pomegranate, dandelion root, orange, lychee, taxus canadianxus, as examples,
are shown in Figure 5.1. The linearized growth curves (Figure 5.2) of the organism in
nutrient broth and that containing pomegranate at 10.0 mg/mL concentration, as examples,
show that the curves were not linear, as expected from equation (9); but they broken linear,
either for the control or for those containing plant extracts. Consequently, two intercepts
were evident, i.e., a true intercept (log K) and an apparent intercept (log Ka) obtained by
extrapolation; and the slope of the curves presents the value of bacterial growth rate (na)
(Figure 5.2). The values from the plots for the control and various plant extracts, log K, log
Ka, K and na, as well as the reduced values relative to the control, K1 and n1, are listed in
Table 5.1
Time kill curve against E.coli
Time (h)
0 5 10 15 20 25
OD
uni
t
0.0
0.2
0.4
0.6
0.8
1.0
1.2
1.4
1.6 Control
Pomgranate
Dandelion root
Orange
Lychee
Taxus canadianxus
Nmax
Growth rate
Lag phase
Figure 5.1 Growth curve of E. coli in Nutrient broth at 37oC temperature during 24 h period
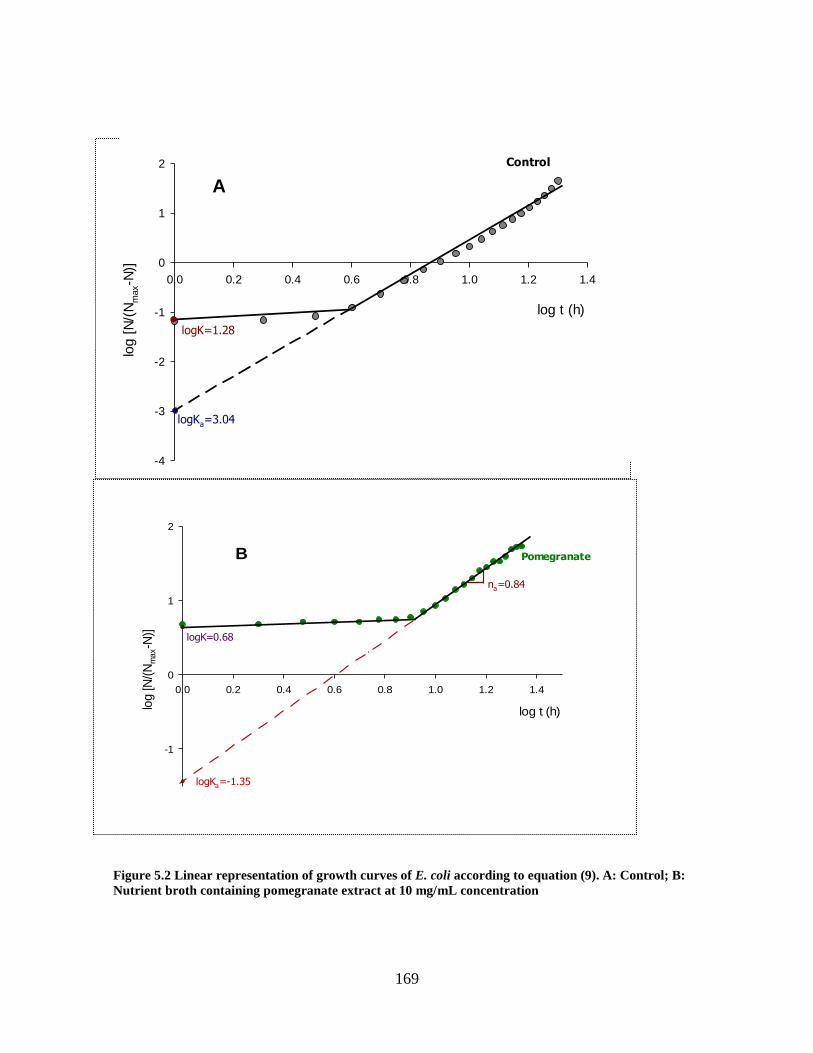
169
Figure 5.2 Linear representation of growth curves of E. coli according to equation (9). A: Control; B:
Nutrient broth containing pomegranate extract at 10 mg/mL concentration
log t (h)
0.0 0.2 0.4 0.6 0.8 1.0 1.2 1.4
log
[N
/(N
ma
x-N
)]
-1
0
1
2
logKa=-1.35
logK=0.68
Pomegranate
na=0.84
B
A
log t (h)
0.0 0.2 0.4 0.6 0.8 1.0 1.2 1.4
-4
-3
-2
-1
0
1
2
log [
N/(
Nm
ax-N
)]
logKa=3.04
logK=1.28
Control

170
Table 5.1 Antimicrobial growth kinetic parameters against E.coli for plant extracts at the concentration
of 10 mg/mL
Extract Log K Log Ka K na K1 na1
1 Control* -1.28 -3.04 5.25 3.43 1.00 1.00
2 Apple fruit peel -1.07 -1.81 8.51 1.40 1.62 0.41
3 Avocado fruit peel -0.46 -1.15 34.67 1.72 6.60 0.50
4 Banana fruit peel -1.05 -1.41 8.91 1.23 1.70 0.36
5 Betel leaf 0.53 0.16 338.84 0.76 64.54 0.22
6 Black currant 0.29 0.2 194.98 0.28 37.14 0.08
7 Black currant residue 0.75 0.42 562.34 0.75 107.11 0.22
8 Blueberry fruit peel -0.42 -1.44 38.02 1.79 7.24 0.52
9 Blueberry leaf -0.46 -1.5 34.67 2.41 6.60 0.70
10 Broccoli leaf -0.66 -1.55 21.88 2.07 4.17 0.60
11 Celery oriental -0.97 -1.72 10.72 1.85 2.04 0.54
12 Cranberry leaf 0.01 -0.49 102.33 1.05 19.49 0.31
13 Custard apple -0.38 -0.83 41.69 0.84 7.94 0.24
14 Dandelion leaf -0.83 -1.98 14.79 2.77 2.82 0.81
15 Dandelion root -0.86 -2.4 13.80 3.07 2.63 0.90
16 Grape leaf, wild 0.54 0.48 346.74 0.78 66.05 0.23
17 Green pepper -0.35 -0.27 44.67 0.71 8.51 0.21
18 Hops (pellets) -0.72 -1.34 19.05 2.40 3.63 0.70
19 Kiwi peel -0.61 -1.6 24.55 2.65 4.68 0.77
20 Lychee -0.46 -1.44 34.67 2.00 6.60 0.58
21 Mango (Ataulfo) -0.92 -1.64 12.02 1.65 2.29 0.48
22 Mangosteen -0.37 -0.82 42.66 0.82 8.13 0.24
23 Orange (albedo) -0.85 -1.88 14.13 2.02 2.69 0.59
24 Parsnip peel -0.53 -1.6 29.51 2.51 5.62 0.73
25 Pomegranate 0.68 -1.35 478.63 0.84 91.17 0.24
26 Potato mature -0.90 -1.61 12.59 2.01 2.40 0.59
27 Radish root peel -0.20 -0.71 63.10 1.15 12.02 0.34
28 Rainbow chard -0.51 -1.22 30.90 2.12 5.89 0.62
29 Raspberry leaf -0.20 -0.65 63.10 1.11 12.02 0.32
30 Red grape Fruit peel 0.11 -0.28 128.82 0.71 24.54 0.21
31 Rhubarb -0.17 -0.65 67.61 0.89 12.88 0.26
32 Sea buckthorn -0.09 -0.39 81.28 0.54 15.48 0.16
33 Sea buckthorn leaf 0.17 -0.57 147.91 1.63 28.17 0.48
34 Sorrel -0.42 -1.22 38.02 1.99 7.24 0.58
35 Taxus canadensis -0.65 -1.69 22.39 1.95 4.26 0.57
36 Tomato peel -0.63 -1.34 23.44 2.09 4.46 0.61

171
In spite of the deviation between the log K and log Ka; interestingly, they are related in a
linear fashion (Figure 5.3), allowing either one of the intercepts for interpretation of the
growth characteristic of bacteria, E. coli, in this instance. The true intercept would be more
appropriate, and thus, log K and na were used as kinetic parameters to characterize the
growth of E. coli.
log K
-1.5 -1.0 -0.5 0.0 0.5 1.0
Log K
a
-3.0
-2.5
-2.0
-1.5
-1.0
-0.5
0.0
0.5
1.0
R2=0.921
Figure 5.3 Relationship between interaction constants log Ka and log K of plant extracts
The inhibition or interaction constant (K1) ranges from 1.0 (control) to 107.1 (black currant
residue), and na1 values from 0.08 (black currant peel) to 1.0 (control) for the selected fruit
and vegetable extracts (Table 5.1). Among the 35 samples, only four samples (black currant
residue, pomegranate, betel leaf and wild grape leaf) were characterized by interaction
constant (K) of > 50.0; another eight samples with values between 10.0 and 50.0 and the
rest with values of < 10.0. This constant clearly demarcates those samples that exhibit high
inhibitory interaction with E. coli, which is also seen by the prolonged lag phase of E. coli

172
in the presence of these extracts. Plant extracts, being a mixture of phytochemicals, where
some of them may be inhibitory to the growth of the bacteria, while some may promote
their growth. Thus the interaction constant could be an indicator of the abundance of highly
inhibitory compounds in the extract, and hence, could be a powerful marker for inhibitory
activity of substances.
High growth rate (n1) values may suggest the possible presence of growth promoting
compounds in the extract mixture. Among the extracts, black currant peel and sea
buckthorn fruit peel were characterized by very low n1 values (< 0.20), reflecting that these
samples contain only small quantity of growth promoting substances. All the samples
possessing high interaction constants had n1 values between 0.20 and 0.25, indicating that
they contain modest quantities of growth promoting substances (Table 5.1).
The overall inhibitory activity, the antimicrobial index (AMI), should reveal the potential of
the extracts per se. The AMI value ranged from 1.0 (control) to 490.0 (black currant
residue) (Table 5.2). High values of AMI (> 290.0) were obtained for black currant peel
and residue, pomegranate and betel leaf, and wild grape leaf extracts, thus demarcating
them from all other samples (Table 5.2). However, they also contain modest levels of
growth promoters, as seen by the n1 values; and there is room to enhance their antimicrobial
activity by removing those substances. Such a purification step has a potential to improve
the activity of sea buckthorn leaf and cranberry leaf extracts (n1 value of 0.48 and 0.31,
respectively).
173
5.4.1.2 Growth inhibition or antimicrobial capacity
Growth inhibition capacity of various extracts was determined from the growth curves, as
depicted in Figure 5.1. This expression takes into account only maximum growth of E. coli
in the nutrient broth relative to the control. The inhibition activity is presented as
percentage of growth inhibition capacity in Table 5.2. The results show that almost all plant
extracts have antimicrobial activity to varying extents. The growth inhibition capacity of
plant extracts ranges from 26.4 % (banana fruit) to 94.39 % (pomegranate). More than 68%
of sample had 70% or more GI value with 17% having 90% of GI capacity. Pomegranate
showed a highest % of GI against E.coli (94.39%) following by black currant residue
(93.83%), grape leaf (92.27%), betel leaf (92.16%), sea buckthorn leaf (90.02%), cranberry
leaf (87.87%), sea buckthorn (87.29%) and rhubarb (85.26%).
5.4.1.3 Minimum inhibitory concentration (MIC)
The lowest value of minimum inhibitory concentration in broth micro-dilution assay was
found at 2.5 mg/mL of betel leaf and 5.0 mg/mL for pomegranate, grape leaf, sea buckthorn
and rhubarb.
5.4.1.4 Zone inhibition (ZI)
The ZI values indicated that black currant residue and pomegranate exhibited the highest
antibacterial against E.coli (28 mm), followed by dandelion leaf (27 mm) and avocado fruit
peel, custard apple, rhubarb (25 mm). About 70% of the samples showed a zone of
inhibition of 15 mm or more; of which 60% showing 20 mm or more. Generally, acidic
leaf or stalk extracts (pH < 4.0) such as dandelion leaf, sorrel, and oriental celery exhibited
high activity by this method, whereas their activities were only modest as determined by
other methods. However, leaf extracts having higher pH (pH> 5.0) that exhibited high or
moderate activities by the other methods such as betel, wild grape, sea buckthorn leaf,
cranberry leaf and raspberry leaf exhibited low ZI. In addition, only ZI method marked
avocado peel extract (pH, 5.64) as active (25 mm).

174
5.4.1.5 Comparison of methods in the characterization plant extracts
The antimicrobial activity of the plant extracts calculated through the different methods
(AMI, antimicrobial capacity, MIC and ZI) is presented in Table 5.2. Although there was a
trend in the identification of samples possessing antimicrobial activity by turbidimetric
methods (capacity, MIC and AMI) and zone inhibition method (ZI), the latter was not
consistent with the former for many samples. As mentioned above, some samples were
classed active only by ZI, while some samples found active by turbidimetric methods were
found poorly active by ZI. There was good agreement between the turbidimetric methods,
although the order of potency for the samples is different as determined by each of these
methods. The relatively high activity of the samples - pomegranate, black currant, sea
buckthorn and rhubarb - and moderate activity of the samples – radish root, mangosteen
and custard apple - was registered by all the four methods; whereas the turbidimetry
methods identified additional samples as highly active, including betel leaf, wild grape leaf,
sea buckthorn leaf, raspberry leaf and cranberry leaf.
High activity was registered by ZI for acidic leaf extracts such as dandelion, oriental celery
and sorrel, while these samples were registered consistently as a poorly active substance by
other methods (Table 5.2). On the contrary, betel, wild grape and other leaf extracts did not
exhibit high zone inhibition, but highly inconsistent with other methods that identified them
as highly active substances. Such striking differences can be inherent in the methods; the
zone inhibition involves diffusion of the active compounds in a solid matrix; whereas the
other methods involve liquid medium, where diffusion may not be a limitation. Acidic leaf
extracts can be expected to contain higher levels of organic acids that can effectively
diffuse out into the gel matrix, thereby contributing to the inhibition of the test
microorganism via pH effects.
The other leaf extracts with higher pH values can be expected to contain less amounts of
easily diffusible organic acids, and their inhibitory activity likely depends on the diffusion
of other active substances they contain. The disparity in the expression of activities between
the solid and liquid media may well be due to the nature of the active substances in those
extracts and their mobility in both the media. Unlike in liquid medium where high mobility

175
of the active compounds can be expected, their diffusion is likely hindered in the solid
medium due to possible interactions with components in the solid network. When the active
substances are soluble in the aqueous medium as it appears be so for fruit extracts such as
pomegranate and black currant that contain high levels of phenolic compounds (Chapter 6),
their migration appears to be little hindered and ZI registers high activity for these samples
(Table 5.2). On the other hand, if the extracts contain active lipophilic substances, as it
would seem to be with betel leaf extract that contain alkaloids and terpenoids, in addition to
phenolic compounds (Chapter 6), the lipophilic compounds can be adsorbed on to the solid
matrix and may not migrate far into the solid medium. Nonetheless, betel leaf other such
leaf extracts show some activity in the zone inhibition method, suggesting that this sample
contains some water-soluble (hydrophilic) active compounds such as phenolic compounds.
Zone inhibition method can provide useful insights into the activity of complex mixtures
such as plant extracts with respect to the nature of active compounds and their interactions,
although it cannot be a stand-alone method. This method should be coupled to a liquid
medium assay in the evaluation of the antimicrobial activity of substances. Of particular
interest is the differentiation of fruit and less acidic leaf extracts, otherwise deemed active
extracts by liquid medium assays, with respect to the nature of active compounds by ZI.
Detailed information on the composition of the extracts would be required, however, to
appreciate the differences underscored by ZI method.
An analysis of variance (ANOVA) was performed on antimicrobial activity data obtained
by those methods in order to get an idea of the most adept and useful expression for
antimicrobial activity that could demarcate the proficiency of the samples. On this count,
AMI demarcates more effectively the samples between the active and poorly active
samples, and also among the extracts that exhibit high activity (Table 5.2). AMI value
could also provide some indication whether the activity of a particular extract could be
improved subject to purification of the extract.
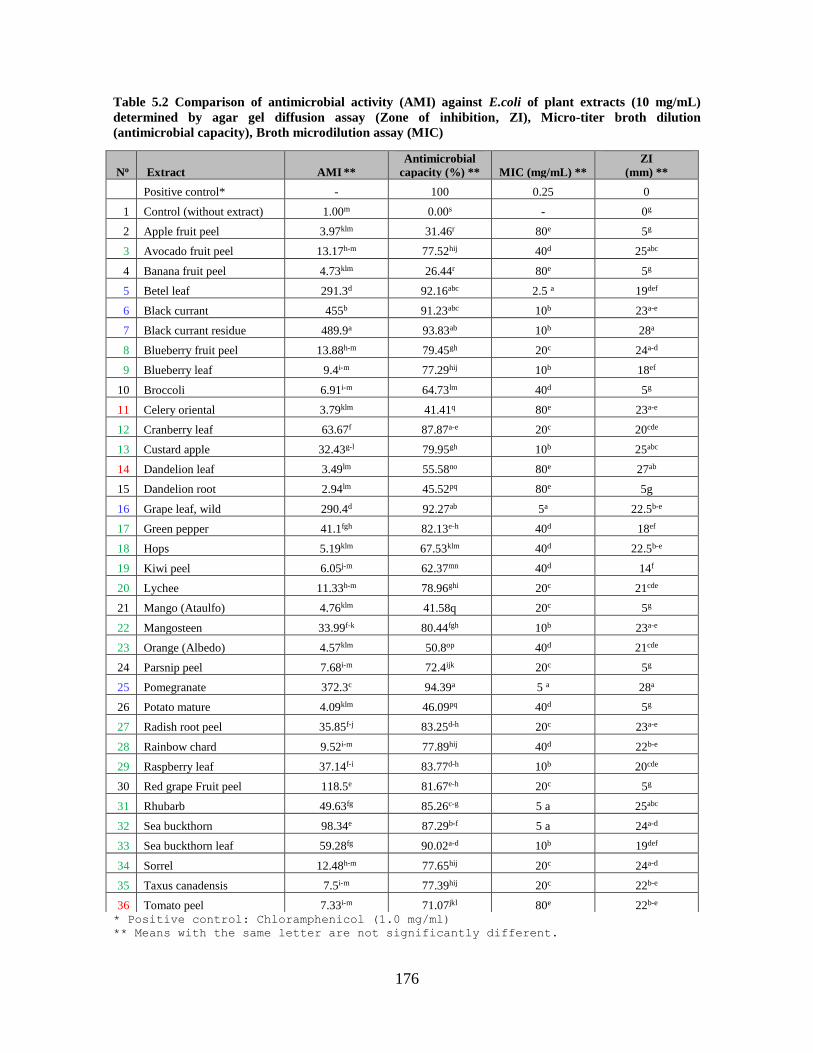
176
Table 5.2 Comparison of antimicrobial activity (AMI) against E.coli of plant extracts (10 mg/mL)
determined by agar gel diffusion assay (Zone of inhibition, ZI), Micro-titer broth dilution
(antimicrobial capacity), Broth microdilution assay (MIC)
* Positive control: Chloramphenicol (1.0 mg/ml)
** Means with the same letter are not significantly different.
No Extract AMI **
Antimicrobial
capacity (%) ** MIC (mg/mL) **
ZI
(mm) **
Positive control* - 100 0.25 0
1 Control (without extract) 1.00m 0.00s - 0g
2 Apple fruit peel 3.97klm 31.46r 80e 5g
3 Avocado fruit peel 13.17h-m 77.52hij 40d 25abc
4 Banana fruit peel 4.73klm 26.44r 80e 5g
5 Betel leaf 291.3d 92.16abc 2.5 a 19def
6 Black currant 455b 91.23abc 10b 23a-e
7 Black currant residue 489.9a 93.83ab 10b 28a
8 Blueberry fruit peel 13.88h-m 79.45gh 20c 24a-d
9 Blueberry leaf 9.4i-m 77.29hij 10b 18ef
10 Broccoli 6.91i-m 64.73lm 40d 5g
11 Celery oriental 3.79klm 41.41q 80e 23a-e
12 Cranberry leaf 63.67f 87.87a-e 20c 20cde
13 Custard apple 32.43g-l 79.95gh 10b 25abc
14 Dandelion leaf 3.49lm 55.58no 80e 27ab
15 Dandelion root 2.94lm 45.52pq 80e 5g
16 Grape leaf, wild 290.4d 92.27ab 5a 22.5b-e
17 Green pepper 41.1fgh 82.13e-h 40d 18ef
18 Hops 5.19klm 67.53klm 40d 22.5b-e
19 Kiwi peel 6.05j-m 62.37mn 40d 14f
20 Lychee 11.33h-m 78.96ghi 20c 21cde
21 Mango (Ataulfo) 4.76klm 41.58q 20c 5g
22 Mangosteen 33.99f-k 80.44fgh 10b 23a-e
23 Orange (Albedo) 4.57klm 50.8op 40d 21cde
24 Parsnip peel 7.68i-m 72.4ijk 20c 5g
25 Pomegranate 372.3c 94.39a 5 a 28a
26 Potato mature 4.09klm 46.09pq 40d 5g
27 Radish root peel 35.85f-j 83.25d-h 20c 23a-e
28 Rainbow chard 9.52i-m 77.89hij 40d 22b-e
29 Raspberry leaf 37.14f-i 83.77d-h 10b 20cde
30 Red grape Fruit peel 118.5e 81.67e-h 20c 5g
31 Rhubarb 49.63fg 85.26c-g 5 a 25abc
32 Sea buckthorn 98.34e 87.29b-f 5 a 24a-d
33 Sea buckthorn leaf 59.28fg 90.02a-d 10b 19def
34 Sorrel 12.48h-m 77.65hij 20c 24a-d
35 Taxus canadensis 7.5i-m 77.39hij 20c 22b-e
36 Tomato peel 7.33i-m 71.07jkl 80e 22b-e

177
The inter-relationship between antimicrobial capacity (Capacity), zone of inhibition (ZI),
MIC and AMI is visualized in principal component analysis (PCA) correlation circle shown
in Figure 5.4. The variables ZI, Capacity and AMI are related, but not closely; and MIC is
inversely (or negatively) related to the other expressions of antimicrobial activity.
However, it appears that the relationship between AMI and MIC is more direct and inverse
than either capacity or ZI, i.e., higher the AMI value, the smaller the MIC value. In
dimension 1 (accounting for 62.3 % of the variations), Capacity shows a very strong
correlation coefficient, but a poor coefficient in dimension 2 (accounting for 18.5 % of the
variations). ZI shows strong correlation coefficients on both dimensions; whereas AMI and
MIC show strong correlation coefficient on dimension 1 and moderate coefficients in
dimensions 2 and 3. This suggests that AMI and MIC are more closely related, albeit
inversely, i.e., higher the interaction of the substance with the microorganism, lower is the
concentration of that substance, required toinhibit the growth of the microorganism.
Although AMI points to the potential of a substance to inhibitory interaction with
microorganism and bacterial growth rate in its presence, and MIC is indicative of dose-
response relationship, they are inter-related, and may provide nearly the same information
regarding the antimicrobial activity of substances. Hence, either one of them may be useful
in practice for screening purposes, but AMI appears to have the capacity to clearly
distinguish even samples showing high activities than MIC. ZI appears to contain
information regarding antimicrobial activity as well as other information, presumably,
diffusivity of the substance, and therefore, constitutes a specific method to obtain additional
characteristic of the substance. The capacity determination remains a non-descript method.
The scatter plot of PCA for the samples is shown in Figure 5.5. Four distinct and
homogenous clusters were apparent. Cluster 1 includes: the control, broccoli, dandelion
root, apple fruit, banana fruit, mango, parsnip, potato and red grape fruit peels. This group
showed very low antimicrobial activity, and none of the methods showed them to be active.
The second cluster includes oriental celery, dandelion leaf and potato, tomato peel. This
group also exhibited low antimicrobial activity, but showed moderate activity by ZI, and
appear to possess additional attribute than group I. not relate to any used methods but with
different manner with group 1.

178
About nineteen of the thirty-six samples clustered in the group 3. This group the center
cluster (Figure 5.5) showed intermediate antimicrobial property, and exhibited moderate
activities by all the methods (ZI, Capacity and AMI) except MIC. The most active and
promising is group 4 that includes betel leaf, black currant, black currant, wild grape leaf
and pomegranate. Interestingly, these samples were identified as the most promising
extracts by AMI alone. It adds credence to the potential of AMI in demarcating highly
active antimicrobial substances or complex mixtures such as the extracts.
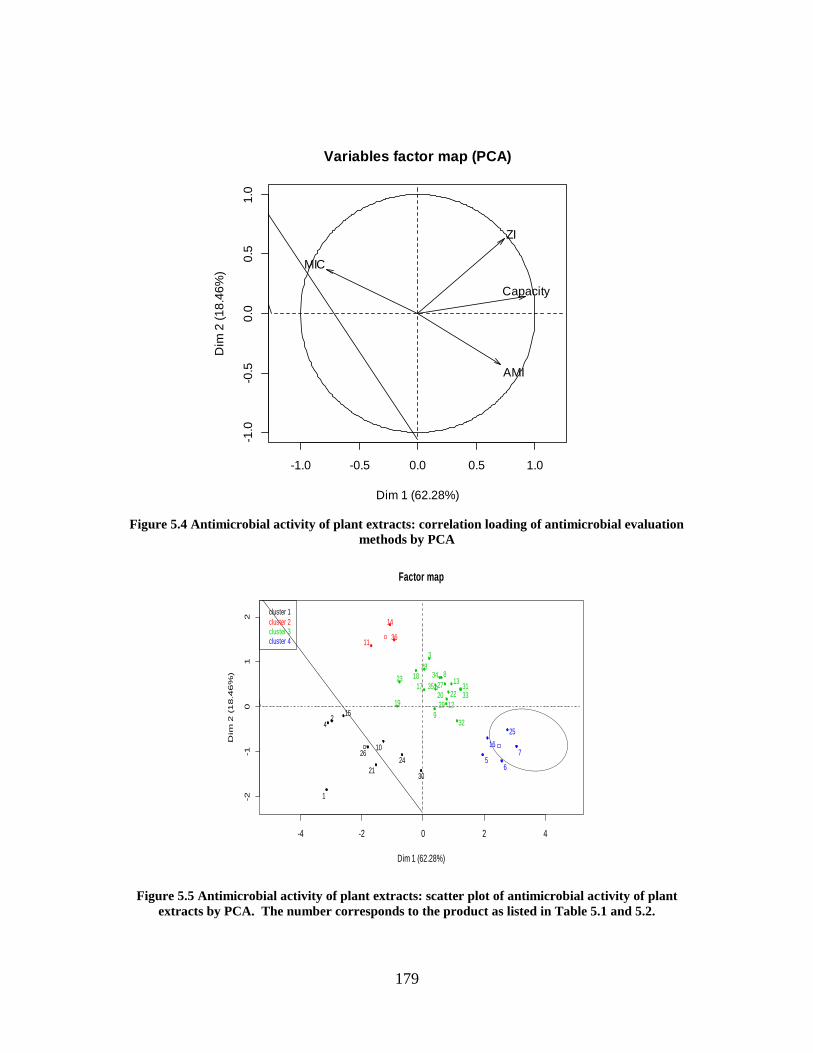
179
Figure 5.4 Antimicrobial activity of plant extracts: correlation loading of antimicrobial evaluation
methods by PCA
Figure 5.5 Antimicrobial activity of plant extracts: scatter plot of antimicrobial activity of plant
extracts by PCA. The number corresponds to the product as listed in Table 5.1 and 5.2.
-1.0 -0.5 0.0 0.5 1.0
-1.0
-0.5
0.0
0.5
1.0
Variables factor map (PCA)
Dim 1 (62.28%)
Dim
2 (
18
.46
%)
Capacity
ZI
MIC
AMI
-4 -2 0 2 4
-2-1
01
2
Factor map
Dim 1 (62.28%)
Dim
2 (
18
.46
%)
1
42
15
26
11
21
10
14
36
19
23
24
18
30
17
28
3
9
2035
34 8
27
29 12
22
13
32
3133
5
16
6
25
7
cluster 1
cluster 2 cluster 3 cluster 4

180
The antimicrobial activity expressed by different methods for the thirty-five samples were
correlated as shown in Figure 5.6. The analysis showed that the inhibition capacity
correlated with MIC the most (correlation coefficient of 0.79), and correlates well with
zone inhibition (0.64), but only moderately with AMI (0.51). The AMI correlates with MIC
only modestly (0.45), and poorly with zone inhibition (0.33). Likewise, zone inhibition and
MIC were related poorly (0.34). Given the interplay of activity and physico-chemical
nature of active compounds in the zone inhibition assay, it may be a useful assay to provide
additional information on the nature of the antimicrobial compound under study, and hence,
the activity expressed by this assay can be useful.
A comparison would be meaningful among the methods where the assay is performed in
liquid medium. Given the high correlation between inhibition capacity and MIC, it would
seem that any one of them could be adequate to identify the promising candidates for
antimicrobial activity. However, AMI relates to both capacity and MIC somewhat
similarly, albeit modestly, and knowing the ability of AMI to demarcate the most promising
candidates from a large pack, it becomes clear that AMI would be a more powerful marker
for characterizing potential antimicrobials. It takes into account of the entire growth cycle,
and provides insight into the potential interactions that occur with the organism as well as
the presence of compounds that could potentially promote growth.

181
Capacity
0.2 0.8
-0.62 0.53
0 200 500
0.51 0.64
0 40 80
040
80
-0.790.2
0.8 na1
-0.53 -0.60 -0.35 0.53
K1
0.92 0.37
040
100
-0.47
0200
500
AMI
0.33 -0.45
ZI
010
25
-0.34
0 40 80
040
80
0 40 100 0 10 25
MIC
Figure 5.6 Multi-correlation between different methods for assay of antimicrobial activity

182
5.4.2 Spectrum of Antimicrobial activity
5.4.2.1 Antimicrobial activity of plant extracts against bacteria
The micro-titer broth dilution assay results are presented in Table 5.3. All the samples
exhibited high or moderate inhibitory activities. Briefly, all extracts displayed the GI (%) of
77-97 % against E.coli, 71-90 % against B.subtilis and 80-100 % against L. monocytogenes.
The plant extracts showing promising activity against the bacteria included black currant
residue, betel leaf, and pomegranate peel. While pomegranate peel (97.8 %), betel leaf
(97%) had the highest antimicrobial activity against E. coli; betel leaf (90.1 %),
pomegranate peel (87.3 %) and cranberry leaf (88.43%) performed well against B. subtilis.
L. monocytogenes was found to be the most sensitive to plant extracts amongst the three
tested bacteria, with pomegranate peel showing 100 % of inhibition.
Table 5.3 Growth inhibition of bacteria by plant extracts at 10.0 mg/mL (Growth inhibition ± SD)
Sample Growth inhibition (%)
E. coli B. subtilis L.monocytogenes
Cranberry leaf 87.87 ± 6.18 88.43 ± 0.60 89.5 ± 0.1
Black currant (residue) 94.73 ± 3.52 80.50 ± 0.71 94.9 ± 0.4 Sea buckthorn leaf 90.02 ± 10.74 83.15 ± 1.41 88.1 ± 0.4 Betel leaf 97.02 ± 2.09 90.12 ± 1.41 98.7 ± 0.2 Pomegranate 97.81 ± 2.05 87.32 ± 8.03 99.99 Rhubarb 85.26 ± 6.70 80.55 ± 3.47 96.1 ±0.6 Blueberry leaf 77.29 ± 3.74 48.87 ± 1.60 92.3 ± 1.0 Grape leaf, wild 92.27 ± 4.05 71.39 ± 5.11 89.5 ± 1.4 Cashew apple 78.86 ± 5.61 72.65 ± 4.32 80.2 ± 0.9 Sea buckthorn (fruit) 87.29 ± 5.8 71.50 ± 4.96 85.6 ± 2.1
The antibacterial activity of plant extracts determined by well-diffusion assay is presented
in Table 5.4. Here, only pomegranate and sea buckthorn fruit were found to be effective,
presumably because of the diffusion limitation of certain active compounds in certain
extracts as discussed before (Section 5.4.1.4). Most of the antimicrobial compounds from
plant sources are either of intermediate polarity or are non-polar, this limits their ability to
diffuse sufficiently in the aqueous agar gel matrix, and hence, often results in a low zone of
inhibition (Balouiri et al., 2016; Khanam et al., 2015).
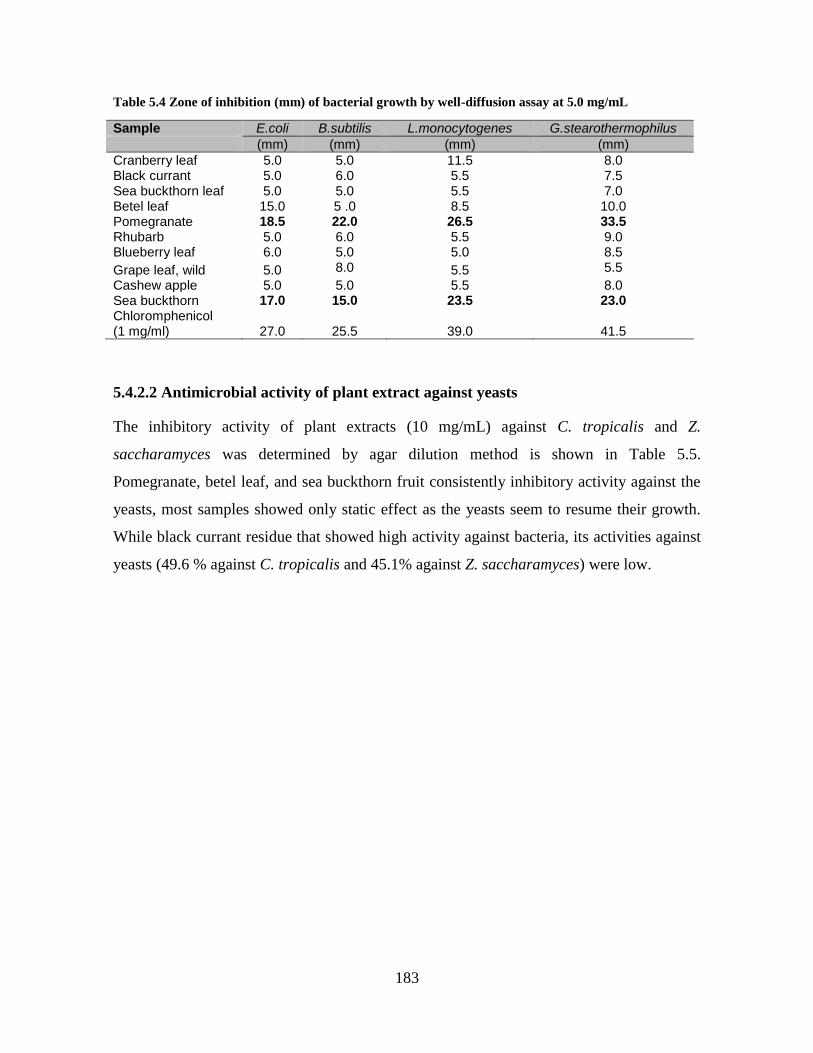
183
Table 5.4 Zone of inhibition (mm) of bacterial growth by well-diffusion assay at 5.0 mg/mL
Sample E.coli B.subtilis L.monocytogenes G.stearothermophilus
(mm) (mm) (mm) (mm)
Cranberry leaf 5.0 5.0 11.5 8.0 Black currant 5.0 6.0 5.5 7.5 Sea buckthorn leaf 5.0 5.0 5.5 7.0 Betel leaf 15.0 5 .0 8.5 10.0 Pomegranate 18.5 22.0 26.5 33.5 Rhubarb 5.0 6.0 5.5 9.0 Blueberry leaf 6.0 5.0 5.0 8.5
Grape leaf, wild 5.0 8.0 5.5 5.5
Cashew apple 5.0 5.0 5.5 8.0 Sea buckthorn 17.0 15.0 23.5 23.0 Chloromphenicol (1 mg/ml) 27.0
25.5 39.0
41.5
5.4.2.2 Antimicrobial activity of plant extract against yeasts
The inhibitory activity of plant extracts (10 mg/mL) against C. tropicalis and Z.
saccharamyces was determined by agar dilution method is shown in Table 5.5.
Pomegranate, betel leaf, and sea buckthorn fruit consistently inhibitory activity against the
yeasts, most samples showed only static effect as the yeasts seem to resume their growth.
While black currant residue that showed high activity against bacteria, its activities against
yeasts (49.6 % against C. tropicalis and 45.1% against Z. saccharamyces) were low.

184
Table 5.5 Inhibitory activity of selected plant extracts on the growth inhibition of yeasts at 10.0 mg/mL
Sample
C.tropicalis (%) Z.saccharamyces (%)
48h 96h 48h 96h
Cranberry leaf 34.8 21.5 11.2 11.1
Black currant 49.6 48.8 45.1 40.6
Sea buckthorn leaf 60.1 41.9 32.8 30.1
Betel leaf 91.4 90.1 99.99 99.99
Pomegranate 99.99 98.3 99.99 88.7
Rhubarb 36.7 23.8 45.6 17.5
Blueberry leaf 59.8 25.6 44.1 34.9
Grape leaf, wild 37.5 25.6 22.7 21.5
Sea buckthorn fruit 87.5 68.7 99.99 99.99
5.4.2.3 Antimicrobial activity of plant extract against fungi
The anti-fungal activity of plant extracts is summarized in Table 5.6. Here, only betel leaf
extract was effective in the inhibiting the growth of fungi (66.67% for B. cinerea and 100%
for P. chrysogenum).
Table 5.6 Inhibitory activity of selected plant extracts on the growth inhibition of fungi (%) at 10.0
mg/mL
Sample Inhibition of radial growth (%)
B. cinerea P. chrysogenum
Cranberry leaf 6.67 0.00
Black currant residue 0.00 8.33
Sea buckthorn leaf 13.33 0.00
Betel leaf 66.67 99.99
Pomegranate 33.33 16.67
Rhubarb 20.00 16.67
Blueberry leaf 13.33 0.00
Grape leaf, wild 6.67 0.00
Sea buckthorn fruit 20.00 0.00
Nystatin (0.5 mg/mL) 99.99 99.99
The minimum inhibitory concentration (MIC) against E.coli was determined for selected
extracts (Table 5.2). For most of the plant extracts the MIC value against E.coli were 10
mg/mL, except for pomegranate (5 mg/mL), sea buckthorn fruit (5 mg/mL) and betel leaf
(2.5 mg/mL) showing a lower value.
Since the result above showed 99.99 % of GI against P. chrysogenum of betel leaf. The
MIC against P. chrysogenum of betel leaf have been also carried out. Its MIC against P.

185
chrysogenum was 2.5 mg/mL, compared to that of the positive control nystatin, which was
0.25 mg/mL. The exceptional activity of betel leaf extract against fungi is attributable to its
contents of alkaloids and terpenoids (Chapter 6). These non-polar compounds could perturb
the external coat of hydrophobins, which are moderately hydrophobic proteins secreted by
fungi creating an interfacial self-assembled amphipathic protein films (Wessels, 1996).
Considering the inhibitory activity against bacteria, yeasts and fungi, only betel leaf extract
appears to possess a broad spectrum of antimicrobial activity; whereas pomegranate and sea
buckthorn leaf extracts appear to be effective against both bacteria and yeasts, and black
currant extract is effectively an antibacterial substance.
The compounds that show activity in most of the samples may belong to the same class of
compounds, and may be present in abundance. As seen in betel leaf extract, the broad
spectrum activity may result from the presence of a variety of compounds with wide range
of polarities. The results confirm the statement of Tiwari et al. (2009) that there are
limitations to the application of natural antimicrobials from plant sources; and the search
must continue.
Although, phytochemicals that produce minimum inhibitory concentrations (MIC) in the
range 100–1000 g/mL in vitro susceptibility tests can be classified as antimicrobials
(Simoes et al., 2009), it is clear from these results that enhancement of the antimicrobial
potency of the extracts seems essential so that their application at lower levels in foods can
be envisaged. It is imperative to have information about the composition of the selected
extracts to determine their potential as broad spectrum antimicrobial.

186
5.5 Conclusions
This study examined the antimicrobial activity of selected plant extracts by turbidimetric
methods, where antimicrobial activity was expressed by Capacity, MIC and AMI; and the
ZI-well-diffusion method, where the activity is expressed by zone of inhibition. Although
the turbidimetric methods were in good agreement in the assessment of the activity of the
substances, the new expression AMI appears to be more meaningful since it carries the
information regarding interaction between the substance and the microorganism. In
addition, AMI demarcates the activity of samples, even those found to be highly active. The
second part of the study examinded the spectrum of antimicrobial activity of selected plant
extracts. Effectively, only betel leaf extract showed a broad spectrum of antimicrobial
activity against bacteria, yeasts and fungi; whereas pomegranate and sea buckthorn leaf
extracts appear to be effective against both bacteria and yeasts, and black currant extract
was effectively an antibacterial substance.

187
Chapter 6 ENHANCEMENT OF THE ANTIMICROBIAL ACTIVITY OF
SELECTED PLANT EXTRACTS BY FRACTIONATION AND MIXING
Différentes stratégies pour améliorer l’activité antimicrobienne d'extraits anti-oxydants-antimicrobiens
sélectionnés ont été explorées. Trois approches, incluant l’extraction par solvants sélectifs, le mélange binaire
des extraits et l'addition de composés végétaux, ont été étudiées. L’activité anti-oxydante-antimicrobienne et
le profil phytochimique ont été analysés. Le résultat montre que l’eau chaude peut être utilisée comme
solvant pour l’extraction d’agents anti-oxydants-antimicrobiens d’origine végétale, bien qu’un solvant polaire
extrait en préférence les substances phénoliques et modestement les substances non polaires comme les
terpénoïdes. Toutefois, compte tenu du rendement et de l’activité des extraits, l’eau semble être appropriée,
et elle peut être considérée comme un solvant efficace pour les fruits qui sont riches en substances
phénoliques. Néanmoins, d'autres solvants sélectifs doivent être considérés pour l’extraction des substances
actives non-polaires issues de matière première végétale comme les feuilles. Certaines augmentations de
l’activité antimicrobienne sont possibles par le mélange de deux extraits de plantes ou par l’addition de
composés végétaux. On a aussi observé que la composition des mélanges peut être importante, car les
interactions synergiques ou antagonistes se retrouvent dans certaines proportions. Le mélange des extraits
de grenade et cassis d’une part et le mélange des extraits de thé vert et pomme de cajou d’autre part ont
montré une amélioration d’activité. L’ajout de glyoxal de méthyle et mono-caprine a également produit une
augmentation de l’activité des extraits de plantes. L'addition de glyoxal de méthyle à 25 % (p/p) a amélioré
l’activité des extraits de grenade et de cassis.

188
6.1 Abstract
Plant materials have been used over centuries as rich sources of antimicrobials. However,
the activity of the extracts from natural sources is rather low in comparison with chemical
antimicrobials, and thus, their application requires higher concentrations that may alter taste
and other properties of food. The aim of this study was to enhance the antimicrobial activity
of selected plant extracts. Three approaches were investigated, including selective solvent
extraction, binary blending of extracts and addition of plant compounds. Micro-titer broth
dilution and DPPH assay were used to measure the antimicrobial and antioxidant activity,
respectively. The profile of phytochemical classes was also analyzed. Based on the yield of
extracts and their activity, hot water could be a suitable solvent for fruit and vegetable
materials that are rich in phenolic substances. Nonetheless, other selective solvents must be
considered for extraction of active non-polar substances for rich plant sources such as
leaves. Some enhancement in antimicrobial activity was possible by mixing plant extracts
or by the addition of certain plant compounds. It was also observed that the composition of
blends or mixtures might be important, since synergistic or antagonistic interactions occur
at certain proportions. Pomegranate and black currant extract blends (both rich in phenolic
substances) and green tea and cashew apple extract blends showed enhancement in activity.
The addition of methyl glyoxal at 25 % (w/w) improved the activity of pomegranate and
black currant extracts. Although some improvement in the antimicrobial activity could be
achieved for some plant extracts, concentration of the extract required for effective control
of microorganisms in foods may not be a very promising by these approaches.
Key words: Phytochemicals, plant extracts, enhancement, antimicrobial, selective
extraction, blends
189
6.2 Introduction
In recent years, there has been a growing interest in the exploration of new antimicrobial
agents from natural sources. Many studies have shown that naturally derived compounds
and natural products may have applications in controlling pathogens in foods (Lucera et al.,
2012; Negi, 2012). However, the use of natural antimicrobials is limited due to the fact that
they are of low potency, and it requires high concentrations, which can affect the
organoleptic properties of foods (Davidson et al., 2013; Lucera et al., 2012). Indeed, the
minimum concentration of plant extract required to successfully control and/or inhibit
(MIC) bacteria was found to be too high to be used in foods, where a concentration of
1.56–25.0 mg/mL for gram positive, and 12.5–50.0 mg/mL for Gram negative bacteria
(Borawska et al., 2010).
In the previous sections, we have shown that plant extracts have antimicrobial activity, and
the extracts of betel leaf and pomegranate exhibited a broad spectrum of activity against
bacteria, yeasts and molds, whereas balck currant residue extract was an effective
antibacterial substance. Other reports have indicated the good antibacterial property of
pomegranate peel extracts (Akhtar et al., 2015; Al-Zoreky, 2009; Ismail et al., 2012), betel
leaf (Nagori et al., 2011), black currant (Ikuta et al., 2012) and green tea (Reygaert, 2014).
Nevertheless, their activity was too low to use at concentrations comparable to chemical
antimicrobials. This is a major constraint in the application of naturally occuring
antibacterials. However, enhancement of antimicrobial activity of plant extracts may be a
possible option towards that goal and should be pursued. Pomegranate, betel leaf, black
currant and green tea extracts and others were selected for enhancement of antimicrobial
activity by blending. It was hypothesized that enhancing the antimicrobial activity of plant
extracts would be possible and would advance the development of antimicrobial agents
antimicrobial agents in foods. Three approachs for enhancement used in this study were
fractionation (Miyasaki et al., 2013), binary blending of extracts and addition of plant
products that may potentiate the activity of the extracts (Worthington and Melander, 2013).
190
6.3 Materials and methods
6.3.1 Plant materials
Pomegranate (Punica granatum), black currant residue (Ribes nigrum), betel leaf (Piper
betle) and green tea (Camellia sinensis) were selected for this study. Samples were
collected from farms, farm markets and fruit and vegetable processors in and around
Quebec City. All collected samples were transported the same day and stored at 4°C until
further processing. Subsequently within 48 hours, they were lyophilized, ground to powder,
vacuum-sealed and stored at -30°C6.3.2 Chemicals and reagents.
Sulfuric acid, chloroform, linalool, sodium nitrite, sodium hydroxide, aluminum chloride,
Folin Ciolcalteau reagent, sodium carbonate, gallic acid, rutin, caffeine, +- catechin, tannic
acid, vanillin, potassium ferricyanide, ferric chloride, potassium iodide, bismuth nitrate
pentahydrate, thiourea, disodium sulphide are bought from Sigma Aldrich (Canada). All
reagents used in this investigation were of analytical grade.
6.3.3 Plant extracts and stock solution preparation
About 50 gram of the lyophilized powder of sample was extracted with 500 mL of distilled
water at 85-90°C for 60 minutes with constant stirring. The slurry was then vacuum filtered
(Whatman No. 1 filter paper), and the filtrate was concentrated under vacuum using a
rotary evaporator at 65°C to about 100 mL and then lyophilized. The lyophilized extracts
were vacuum-packed and stored at -30oC until further use. For the antimicrobial and
antioxidant assays the samples were dispersed in MHB (Mueller Hinton broth) and
methanol, respectively, to obtain a stock solution of 100 mg DW/mL for the antimicrobial
activity and 1.0 mg/mL for the antioxidant assay. All the stock solutions were purged with
argon, stored at 4oC and used within 24 hours.

191
6.3.4 Bacterial strains and inoculum preparation
The antimicrobial activity of the extracts was determined against E.coli ATCC 25922
(Gram-negative) and B. subtilis ATCC 6633 (Gram-positive) bacteria. Bacterial cultures
were revived from stocks at -80°C by three successive growth cycles at 37 °C for 24 h in
Muller Hilton Broth (Sigma Aldrich). The standard inoculums were prepared following
NCCLS guidelines (Jorgensen and Ferraro, 2009) with organisms in log phase growth (4h
after incubation) and then were standardized to match that of a 0.5 McFarland standard
(corresponds to approximately 1.5 x 10⁸ CFU/mL). The adjusted bacterial suspensions were
used within 15 minutes.
6.3.5 Antimicrobial activity assays
6.3.5.1 Growth Inhibition using micro-titer broth dilution assay (GI)
The GI (%) value of plant extracts and the potential to reduce the bacterial population over
time was determined turbidimetrically using a micro-titer broth dilution assay (NCCLS,
1991; Wiegand et al., 2008). Briefly, 190 µl of the plant extract stock made in MHB broth
(10 mg/mL) was pipetted in a 96-well plate. Subsequently, the wells were inoculated with
the test strain (10µl) to achieve a final concentration of 104- 105 CFU/mL in each well. The
blank and assay control were the plant extract (190 µl at 10 mg/mL) and 200 µl of MHB
without the test strain, respectively; where the latter also served as the sterility control.
Chloramphenicol (1.0 mg/mL) was used as the positive control, while the inoculated MHB
medium as the negative control. The prepared plates were incubated at 37°C in a micro-
plate reader (Biotek Power XS2). For the time kill curve assay, hourly absorbance readings
(OD600nm) were recorded for 24 hours and for the time kill curve assay, the OD reading at
the end of 24 hours was recorded for calculating the %GI value. All assays were performed
in triplicate. The percentage of growth inhibition was calculated by the difference between
the final OD600 reading of the sample and the negative control.

192
6.3.5.2 MIC - Broth microdilution assay
Plant extracts were tested as per NCCLS guidelines for microdilution susceptibility tests for
aerobic bacteria (NCCLS, 1991) with modifications. Micro-titer plates (96 wells) were
prepared with 12 plant extracts in the columns at the concentration 80 mg/mL in MH broth.
Eight serial dilutions were made in the rows. Thereafter, 10µl of standard inoculum was
dispensed in each well to give a final concentration of 104- 105 CFU/mL. The MIC value
after 24 hours of incubation at 37o C, was the lowest concentration of plant extract at which
no visible growth could be detected by visual inspection. Chloramphenicol (1.0 mg/mL)
was used as a positive control
6.3.6 Antioxidant assay - DPPH radical-scavenging capacity
Free radical scavenging capacity is the main mechanism by which antioxidants protect food
against oxidation and thus was determined through DPPH radical scavenging assay (Faleiro
et al., 2005). The DPPH radical scavenging was analysed through a standard
spectrophotometric method (Sharma and Bhat, 2009) with modifications. A DPPH stock
solution of 6.1x 10⁻⁵ M was freshly prepared in methanol and adjusted to O.D of 0.7 (±
0.02) at 515 nm. A volume 190 µL of DPPH solution was transferred into each microwell
compartement (96 well micro plate, Becton Dickinson Falcon 353072), followed by
addition of 10 µL of the test plant extract (1.0 mg/mL). Thereafter the plate was incubated
in a (Biotek Power XS2 Logicel Gen 5) spectrophotometer at 25°C for 1 hour, and the
absorbance at 515 nm was recorded each min. Ascorbic acid (1.0 mg/mL) was used as a
standard and the results were expressed as ascorbic acid equivalent (µg AAE/mg extract).
The assays were carried out in triplicate.
Radiacal scavenging capacity = [(A0 − A1)/A0 ]× 100 (%)
where A0 was the absorbance of the control sample (without plant extract) and A1 was the
absorbance in the presence of the test sample.
193
6.3.7 Phyto-chemical analysis
6.3.7.1 Total phenolics
The method described by (Wolfe and Liu, 2003) with little modification by using Folin-
Ciocalteu reagent was used to determine total phenolic content in aqueous extract and
extracts of different solvent mixtures. A volume of 0.5 mL of the extract (1 mg/mL), was
mixed with 0.5 mL of 1N Folin-Ciocalteu reagent and 1mL of Na2CO3 (20% w/v) and the
final volume was made up to 5 mL The resulting mixture was vortexed for 15 sec and
incubated at room temp for 30 min for color development. The absorbance of total phenolic
was measured at 725 nm. Total phenolics content was expressed as mg/g gallic acid
equivalent (Michel et al., 2012a) (concentration 20-100µg/ml) from gallic acid calibration
curve. The experiment was conducted in triplicate and the results were expressed as mean
SD values.
6.3.7.2 Total flavonoid assay
The total flavonoid content was determined by using aluminium chloride colorimetric
method (Zhishen et al., 1999). Briefly, 250 µL of each extract (1.0 mg/mL) was mixed with
1.0 mL of distilled water and subsequently with 75 µL of sodium nitrite solution [5% (w/w)
NaNO2]. After 6 min of incubation, 75 µL of aluminium trichloride solution (10% AlCl3)
was added and then allowed to stand for 6 min, followed by addition of 1.0 mL 4% sodium
hydroxide solution to the mixture. Immediately, water was added to bring the final volume
to 2.5 mL, and then the mixture was thoroughly mixed and allowed to stand for another 15
min at room temperature. Absorbance of the pink color of the mixture was measured at 510
nm versus reagent blank containing water instead of the sample (Basma et al., 2011).
Catechol was used as a standard compound for the quantification of total flavonoid. Results
were expressed as mg of catechol equivalents per gram of dry weight of extracts (µg
CE/mg). Total content of flavonoid compounds in the plant extract was calculated using
this formula:
Total flavonoid content = CE.V/m

194
where, CE is the catechol equivalence (mg/mL) or concentration of catechin solution
established from the calibration curve; V is the volume of extract (mL) and m is the weight
(mg) of the pure plant extract.
6.3.7.3 Estimation of total tannin content
The quantitative tannin content in plant extracts was estimated by the method of Price and
Butler (Paaver et al., 2010; Price and Butler, 1977) with some modifications. Briefly, 0.5
ml aliquots of plant extracts having concentration of 1.0 mg/ml were transferred to vials, 1
ml 1% K3Fe(CN)6 and 1.0 ml 1% FeCl3 were added, and water was added to make 5 ml
volume. After five min, the solutions were measured spectrophotometrically at 760 nm.
The actual tannin concentration was calculated on the basis of the optical absorbance values
obtained for the standard solutions in range 20 - 100 µg/ml.
6.3.7.4 Determination of proanthocyanidin content
The proanthocyanidin content of the solvent fractions were determined by the vanillin- H2SO4
method (Lee et al., 2009; Sun et al., 1998). Briefly, a sample solution 200 μL was added to
500 μL of 1.2% vanillin solution and 500 μL of 20% H2SO4 solution. The reaction was
carried out in the dark at room temperature for 20 min, and then absorbance was measured
absorbance at 500 nm. Proanthocyanidin content was expressed as µg (+)-catechin equivalent
per ml of aquous extracts.
6.3.7.5 Determination of alkaloid content
Alkaloid content was determined by the method of (Sreevidya and Mehrotra, 2003) with
some modifications. The Dragendorff’s reagent (DR) was prepared by mixing a solution of
bismuth (0.8 g bismuth nitrate pentahydrate in 40 mL distilled water), 10 mL glacial acetic
acid, and a solution of potassium iodide (8.0 g potassium iodide in 20 mL distilled water).
The standard bismuth nitrate stock solution was made by dissolving 10 mg Bi(NO3)3·5H2O
in 5 mL of concentrated nitric acid, and diluting it to 100 mL with distilled water. The other
reagents were thiourea, 3% (w/v), and disodium sulfide, 1% (w/v). The stock solutions of
alkaloid was prepared as follows: 10 mg of pure alkaloid (caffeine “purine alkaloids”) was
dissolved in warm distilled water and then made up to 10 mL with warm distilled water.
Similarly, stock solutions of piperine in 95% alcohol were prepared.

195
The plant extract solution was prepared at the concentration 1.0 mg/mL. A 5 mL of the
extract solution was then taken and the pH was maintained at 2–2.5 with dilute HCl. A 2
mL amount of DR was added to it, and the precipitate formed was centrifuged. The
supernatant was checked for complete precipitation by adding 2 drops of DR. After
centrifugation, the centrifugate was completely and meticulously decanted. The residue was
then treated with 2 mL disodium sulfide (Na2S) solution. The brownish black precipitate
formed was then centrifuged. The completion of precipitation was checked qualitatively by
adding 2 drops of disodium sulfide. The residue was dissolved in 2 mL concentrated nitric
acid, with slight warming, as needed. This solution was diluted to 10 mL in a standard flask
with distilled water, an aliquot of 1.0 mL was then pipetted out, and to which 5 mL thiourea
solution was added. The absorbance was measured at 435 nm.
6.3.7.6 Terpenoids
Terpenoid content was determined by the method of (Ghorai et al., 2012). Briefly, 1.5 ml
chloroform was added in 2 ml microcentrifuge tube and then 200 µl plant sample was
added. Thereafter, the sample mixture was thoroughly vortexed and was keep aside 3 min.
Then 100µl concentrated H2SO4 was added to each microcentrifuge tube. Thereafter, the
assay tube was incubated at room temperature for 1.5h-2h in the dark. At the end of
incubation time a reddish brown precipitation was formed in each assay microcentrifuge
tube. Subsequently, all supernatant reaction mixture liquid was carefully decanted without
disturbing the precipitate. 1.5 ml of methanol 95% (v/v) was added and vortexed
thoroughly until all the precipitate completely dissolved in methanol. Then the solution was
read at the absorbance 538 nm. Methanol was used as blank. Total terpenoids concentration
of plant samples was expressed as linalool equivalents using the regression equation of
linalool standard curve.
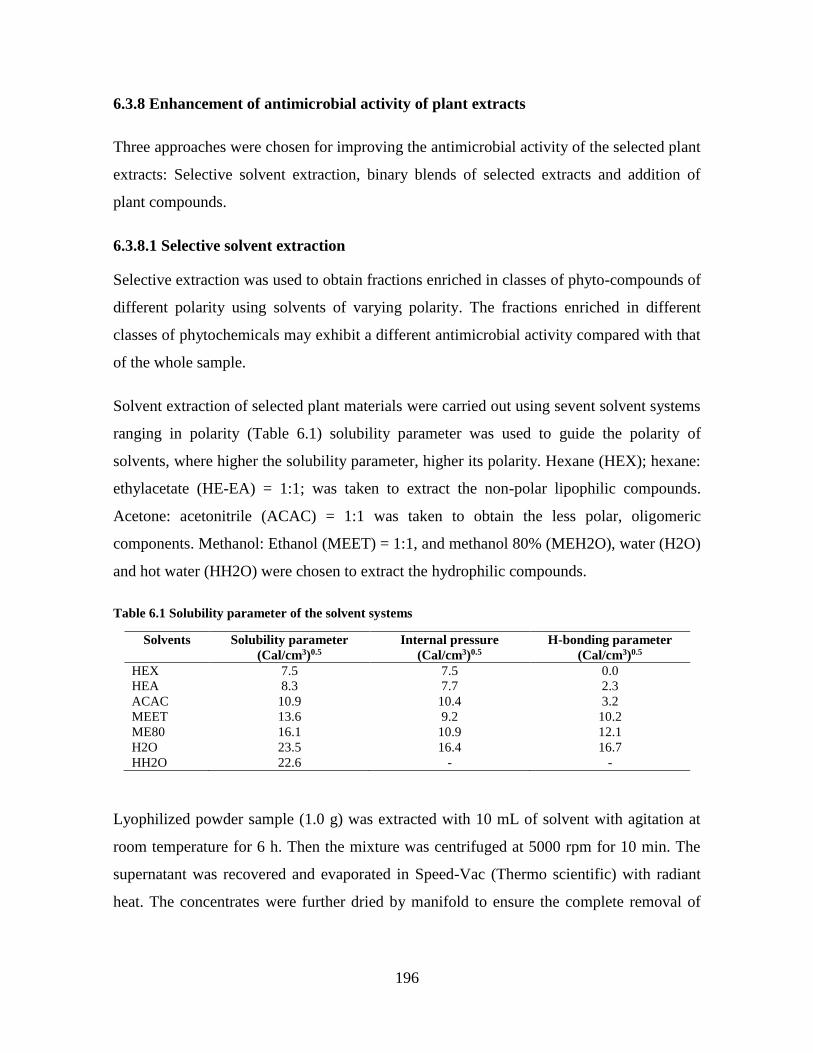
196
6.3.8 Enhancement of antimicrobial activity of plant extracts
Three approaches were chosen for improving the antimicrobial activity of the selected plant
extracts: Selective solvent extraction, binary blends of selected extracts and addition of
plant compounds.
6.3.8.1 Selective solvent extraction
Selective extraction was used to obtain fractions enriched in classes of phyto-compounds of
different polarity using solvents of varying polarity. The fractions enriched in different
classes of phytochemicals may exhibit a different antimicrobial activity compared with that
of the whole sample.
Solvent extraction of selected plant materials were carried out using sevent solvent systems
ranging in polarity (Table 6.1) solubility parameter was used to guide the polarity of
solvents, where higher the solubility parameter, higher its polarity. Hexane (HEX); hexane:
ethylacetate (HE-EA) = 1:1; was taken to extract the non-polar lipophilic compounds.
Acetone: acetonitrile (ACAC) = 1:1 was taken to obtain the less polar, oligomeric
components. Methanol: Ethanol (MEET) = 1:1, and methanol 80% (MEH2O), water (H2O)
and hot water (HH2O) were chosen to extract the hydrophilic compounds.
Table 6.1 Solubility parameter of the solvent systems
Solvents Solubility parameter
(Cal/cm3)0.5
Internal pressure
(Cal/cm3)0.5
H-bonding parameter
(Cal/cm3)0.5
HEX 7.5 7.5 0.0
HEA 8.3 7.7 2.3
ACAC 10.9 10.4 3.2
MEET 13.6 9.2 10.2
ME80 16.1 10.9 12.1
H2O 23.5 16.4 16.7
HH2O 22.6 - -
Lyophilized powder sample (1.0 g) was extracted with 10 mL of solvent with agitation at
room temperature for 6 h. Then the mixture was centrifuged at 5000 rpm for 10 min. The
supernatant was recovered and evaporated in Speed-Vac (Thermo scientific) with radiant
heat. The concentrates were further dried by manifold to ensure the complete removal of
197
solvent from the fractions. The extract in the solid form were used for antimicrobial test
against E.coli by micro-dilution assay at concentrations of 10,000, 5,000 and 2,500 ppm.
The yield of each solvent fraction was recorded, and its composition was analyzed for
various classes of phytocompounds (total phenols, hydrolysable tannins, proanthocyanidins
(condensed tanin), flavonoids, terpenoids and alkaloids), followed by antimicrobial and
antioxidant (DPPH) activity assays.
6.3.8.2 Binary blends of selected extracts
Binary blends of two selected extracts were prepared in different proportions (1.00:0.00,
0.75:0.25, 0.50:0.50, 0.25:0.75 and 0.00:1.00 by volume) and their antimicrobial activity
was evaluated against E. coli and B. subtilis by micro-dilution assay at total concentration
of 10,000, 5,000 and 2,500 ppm.
6.3.8.3 Addition of plant compounds
For this study, 12 selected plant extracts and 15 plant products (Sigma-Aldrich) were
initially assessed for their MIC (minimum inhibitory concentration). Subsequently, the
mixtures were evaluated for antimicrobial activity (12 plant extracts x15 plant products at a
total concentration of 5.0 mg/mL. The antimicrobial assay for plant products was the same
as for plant extracts. Based on the result, selected plant extracts and plant products were
mixed in difference proportions and the mixtures were evaluated for their activity (Growth
inhibition, GI (%); and MIC).
6.3.9 Statistical analysis
All experiments were done in triplicate and were set as a completely randomized design,
and the data were analyzed by one-way analysis of variance (one-way ANOVA) using a
significant level of 0.05. Tukey HSD difference test at the same significant level was done
when the analysis of variance found significant differences. Principal component analysis
(PCA) was also performed using R with the statistical package Rcmdr.

198
6.4 Results and discussion
6.4.1 Solvent fractionation of extracts
6.4.1.1 Extract yields
The yield of the fractions (% dried mass) by different solvent systems is presented in Figure
6.1. In general, the yield of the fractions increased with increase in the polarity of the
solvents for three plant samples. Higher yields of fractions were obtained with
methanol/ethanol, methanol/water and water solvents than in non-polar solvents (hexane,
hexane/ethyl acetate or acetone/acetonitrile). For example, the yield of fractions for
pomegranate (Figure 6.1, Table A6.1, Table A6.2, Table A6.3) were: 7.47, 7,08, 8.81,
35.51, 45.22, 29.81, 52.11 mg/g dry material, for Hex, HE-AE, AC-AC, ME-ET, ME-H2O,
H2O, HH2O repectively.
0
10
20
30
40
50
60
Hex HEA ACAC MEET ME80 H2O HH2O
Solvent fractions
Yie
ld,
%,
w/w
dry
sam
ple
PomegranateBlack currantBetel leaf
Figure 6.1 Yield of solvent extracts of pomegranate, black currant residue and betel leaf
199
The highest mass yields were obtained with hot water for all the three plant samples (52.1%
for pomegranate, 32.5% for black currant residue and 47% for betel leaf). This is so,
because hot water appears to be less selective in the extraction of compounds in the plant
materials, having solvent capacities to varying degrees for compounds of different polarity.
There is a much interest for new environmentally sustainable extraction techniques to
enhance the use of agricultural by-products, and hot water has been used in many studies to
extract bioactive compounds (Ko et al., 2014; Plaza et al., 2013; Vergara-Salinas et al.,
2013). The use of hot water at 85 °C was also found to be a suitable solvent to extract
flavonoid glycosides and amino acids (Bergeron et al., 2005).
6.4.1.2 Composition of solvent fractions and their antioxidant-antimicrobial activities
The phytochemical composition of the different solvent fractions of pomegranate, black
currant and betel leaf, and their corresponding antimicrobial activity against E. coli and
anti-oxidant activity are summarized in Tables 6.2 – 6.4 and Figures 6.2 - 6.4.
The polar solvent fractions were enriched in phenolic compounds (flavonoids,
proanthocyanidins and hydrolysable tannins) whereas non-polar solvents largely extracted
alkaloids and terpenoids, indicating their polar or non-polar nature. However, the non-polar
fractions were not highly enriched in alkaloids or terpenoids, presumably, high recovery of
these compounds may require high volumes of solvent. Nonetheless, hot water was able to
extract small amount of these non-polar compounds, in addition to enrichment in the
phenolic compounds.
The classes of phytochemicals, that were analyzed for, present in pomegranate and betel
leaf fractions, where the phenolic classes were enriched in polar solvents and the non-polar
classes were enriched in non-polar solvents. Although the same was true for black currant,
the non-polar alkaloids and terpenoids were nearly absent in its non-polar solvent fractions.
However, the non-polar fractions of black currant contained higher level of flavonoids
(44.52 and 28.88 mg/kg of dry mass for the fraction Hex and HE-AE, respectively) than
those of pomegranate (2.11 and 2.07 mg/kg dry mass), suggesting that the flavonoids in
black currant are more non-polar in nature than those of pomegranate.

200
The antioxidant and antimicrobial activities of the solvent fractions are shown in Table
A6.4, and in Figures 6.2 – 6.4 along with the phyto-compound composition of the fractions.
Higher concentrations of both polar phenolic compounds as well as the non-polar alkaloids
and terpenoids support antioxidant and antimicrobial activities of fractions of pomegranate
betel leaf and black currant. The poor activities of the non-polar fractions of black currant
can be attributed to the quasi-absence of alkaloids and terpenoids in those fractions. It is
also evident that alkaloids and terpenoids contribute significantly to the antimicrobial
activity of the non-polar fractions, even though they were present in smaller quantities
compared with the phenolic compounds. This suggests that isolation of these substances
may be worthwhile for more powerful antimicrobial agents (Nostro et al., 2000). In
contrast, in the polar solvent fraction, the phenolic compounds were responsible for the
antimicrobial activity, although, these compounds were present at higher concentrations,
indicating that their specific antimicrobial activity is smaller compared with alkaloids and
terpenoids, and consequently, higher concentrations would be required to achieve a similar
antimicrobial activity. Nevertheless, the antimicrobial activities of all fractions were still
comparable to that of hot water fraction, even though these fractions differed in their
composition of phyto-compounds. The results point to no significant enhancement in the
antimicrobial activity by fractionation alone compared with the extract with hot water.

201
0
100
200
300
400
500
600
700
800
900
1000
Hex HEA ACAC MEET ME80 H2O HH2O
Solvent fractions
mg
/kg
d.m
.
0
10
20
30
40
50
60
70
80
90
100
Total polyphenol
Hydrolyzable tannins
Proanthocyanidins
Flavonoids
Antimicrobial activity
Antioxidant activity
Figure 6.2 Composition of solvent fractions of pomegranate and their antimicrobial activity against E.
coli and anti-radical activity by DPPH assay
0
100
200
300
400
500
600
Hex HEA ACAC MEET ME80 H2O HH2O
Solvents fractions
mg
/kg
d.m
.
0
10
20
30
40
50
60
70
80
90Total polyphenol
Hydrolyzable tannins
Proanthocyanidins
Flavonoids
antimicrobial activity
Antioxidant activity
Figure 6.3 Composition of solvent fractions of black currant residue and their antimicrobial activity
against E. coli and anti-radical capacity by DPPH assay

202
0
50
100
150
200
250
300
Hex HEA ACAC MEET ME80 H2O HH2O
Solvent fractions
mg
/kg
d.m
.
0
10
20
30
40
50
60
70
80
90
100
Total polyphenol
alkaloids
Terpenoids
Antimicrobial activity
Antioxidant activity
Figure 6.4 Composition of solvent fractions of betel leaf and their antimicrobial activity against E. coli
and anti-radical activity by DPPH assay
Furthermore, considering the productivity (yield and antimicrobial activity of the fractions),
it became evident that a simple fractionation as an approach to enhance the antimicrobial
activity of plant extracts might be less realistic to obtain antimicrobials for use in foods
with comparable effectiveness of chemical antimicrobials.

203
6.4.2 Binary blends of selected extracts
Two plant extracts were blended at a total concentration of 5.0 mg/mL. The proportions of
the blend is 0.0, 0.25, 0.50, 0.75, 1.0 (by mass). The blends were composed of extracts of
pomegranate, black currant, betel leaf, cashew and green tea. The antimicrobial activity is
shown in table A6.5 and Figure 6.5 (E.coli) and Table A6.6, Figure 6.6 (B.subtilis).
Blend composition - Extract (1), % (w/w)
0.0 25.0 50.0 75.0 100.0
GI,
%
0
20
40
60
80
100
120
Pomegranate (1)-Black currant (2)
Betel leaf (1)-Black currant (2)
Pomegranate (1) -Betel leaf (2)
Green tea (1)-Cashew (2)
Figure 6.5 Antibacterial activity of blends of plant extracts in varying proportions
The blend of pomegranate and betel leaf extracts that contain phenolic compounds or
alkaloids and terpenoids, respectively showed mild incompatibility or little interaction in all
proportions, although the antimicrobial activity was not affected significantly. But the
combination of betel leaf and black currant extracts showed synergy at 50.0 - 75.0 % of
betel leaf extract (100 % of inhibition against E. coli). This is surprising that black currant
extract, like pomegranate extract, is enriched in phenolic compounds should show synergy.
204
It is possible that the bridge class of compounds may be the flavonoids in black currant that
may be more lipophilic, as pointed earlier. Contrary to expectation, the blend of
pomegranate and black currant extracts, both being rich in phenolic compounds, did not
show any synergy, but significant antagonistic interaction at 25.0 % of pomegranate extract
(Figure 6.5). The blend of green tea and cashew apple extracts, that show moderate activity
alone, showed significant synergistic interaction in the antimicrobial activity at 50.0 – 75.0
% of green tea extract (82.39 and 86.34 % of inhibition against E. coli). It suggests that the
phyto-compounds present in these extracts may act in a similar mode against the bacteria.
While green tea is rich in flavon-3-ols (catechins) and hydrolysable tannins, gallo-catechins
and ellagi-catechins (Henning et al., 2004; Reygaert, 2014), cashew apple is known to
contain anacardic acid that is known to possess antimicrobial activity (Muroi et al., 1993).
The pattern of interaction between extracts appears to be similar for B. subtilis, as was
observed with E. coli (Table A6.6 and Figure 6.6), except that a higher synergy was evident
with the blend of green tea and cashew apple extracts (90.02% of inhibition). The similar
pattern of the blends against the bacteria of different morphology indicates that the nature
of interaction whether antagonistic, agonistic or neutral, between the constituents of the
blends may be the primary factor in the activity of the blends. The data on the composition
of phyto-compounds of the extracts are not adequate to understand such interactions, and
more detailed analysis of the extract constituents should be performed.
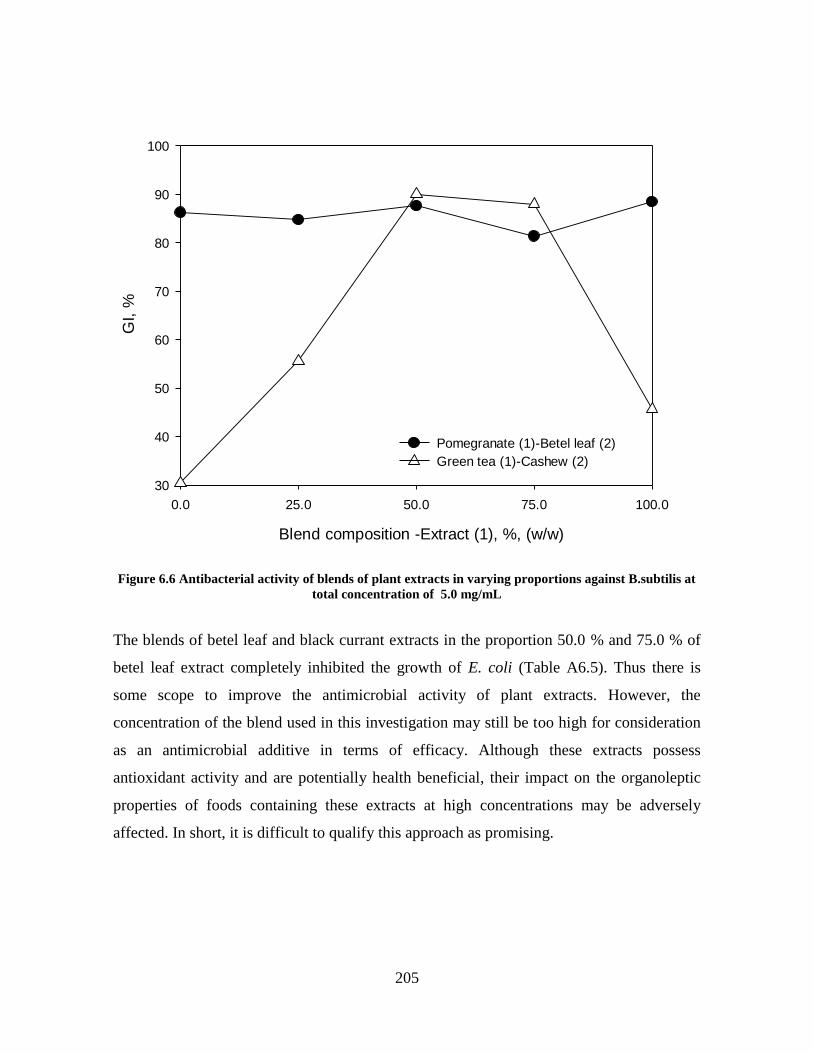
205
Blend composition -Extract (1), %, (w/w)
0.0 25.0 50.0 75.0 100.0
GI, %
30
40
50
60
70
80
90
100
Pomegranate (1)-Betel leaf (2)
Green tea (1)-Cashew (2)
Figure 6.6 Antibacterial activity of blends of plant extracts in varying proportions against B.subtilis at
total concentration of 5.0 mg/mL
The blends of betel leaf and black currant extracts in the proportion 50.0 % and 75.0 % of
betel leaf extract completely inhibited the growth of E. coli (Table A6.5). Thus there is
some scope to improve the antimicrobial activity of plant extracts. However, the
concentration of the blend used in this investigation may still be too high for consideration
as an antimicrobial additive in terms of efficacy. Although these extracts possess
antioxidant activity and are potentially health beneficial, their impact on the organoleptic
properties of foods containing these extracts at high concentrations may be adversely
affected. In short, it is difficult to qualify this approach as promising.
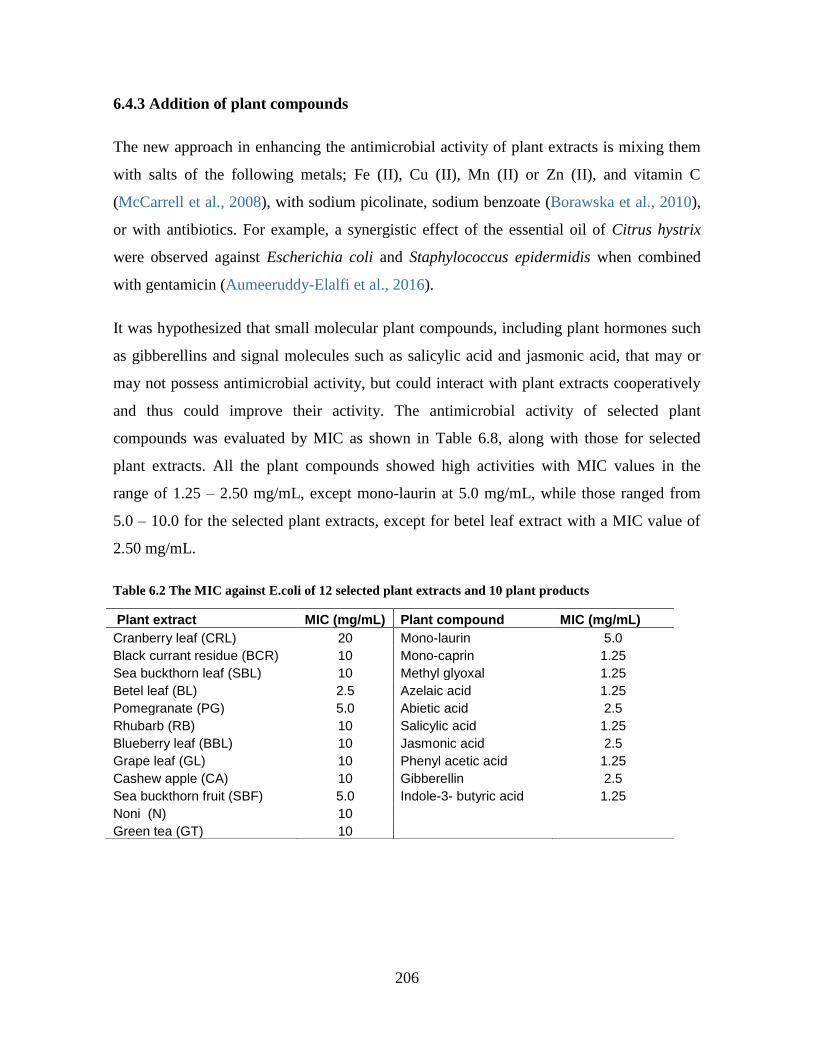
206
6.4.3 Addition of plant compounds
The new approach in enhancing the antimicrobial activity of plant extracts is mixing them
with salts of the following metals; Fe (II), Cu (II), Mn (II) or Zn (II), and vitamin C
(McCarrell et al., 2008), with sodium picolinate, sodium benzoate (Borawska et al., 2010),
or with antibiotics. For example, a synergistic effect of the essential oil of Citrus hystrix
were observed against Escherichia coli and Staphylococcus epidermidis when combined
with gentamicin (Aumeeruddy-Elalfi et al., 2016).
It was hypothesized that small molecular plant compounds, including plant hormones such
as gibberellins and signal molecules such as salicylic acid and jasmonic acid, that may or
may not possess antimicrobial activity, but could interact with plant extracts cooperatively
and thus could improve their activity. The antimicrobial activity of selected plant
compounds was evaluated by MIC as shown in Table 6.8, along with those for selected
plant extracts. All the plant compounds showed high activities with MIC values in the
range of 1.25 – 2.50 mg/mL, except mono-laurin at 5.0 mg/mL, while those ranged from
5.0 – 10.0 for the selected plant extracts, except for betel leaf extract with a MIC value of
2.50 mg/mL.
Table 6.2 The MIC against E.coli of 12 selected plant extracts and 10 plant products
Plant extract MIC (mg/mL) Plant compound MIC (mg/mL)
Cranberry leaf (CRL) 20 Mono-laurin 5.0
Black currant residue (BCR) 10 Mono-caprin 1.25
Sea buckthorn leaf (SBL) 10 Methyl glyoxal 1.25
Betel leaf (BL) 2.5 Azelaic acid 1.25
Pomegranate (PG) 5.0 Abietic acid 2.5
Rhubarb (RB) 10 Salicylic acid 1.25
Blueberry leaf (BBL) 10 Jasmonic acid 2.5
Grape leaf (GL) 10 Phenyl acetic acid 1.25
Cashew apple (CA) 10 Gibberellin 2.5
Sea buckthorn fruit (SBF) 5.0 Indole-3- butyric acid 1.25
Noni (N) 10
Green tea (GT) 10

207
The 10 plant compounds were added to the 12 selected plant extracts at a level of 10 %
(w/w) [9 volumes of plant extract at concentration of 5.0 mg/mL) + 1 volume of plant
compound at 5.0 mg/mL] at total concentration of 5.0 mg/mL, and the antimicrobial
activity was evaluated against E. coli, and the inhibitory activities of the mixtures are
summarized in Table 6.9. Generally, the addition of phyto-compounds to moderate active
extracts such as blueberry leaf, grape leaf and black currant extracts rendered them more
active, except sea buckthorn leaf and green tea that showed enhancement only with methyl
glyoxal among the plant compounds. Abeitic acid, mono-laurin, azelaic acid and jasmonic
acid did not impart any significant improvement in the antimicrobial activity of most of the
extracts (Table 6.9). For the most part, the addition of methyl glyoxal, mono-caprin,
salicylic acid, phenyl acetic acid, gibberellin and indole-3-butryric acid were generally
effective in enhancing the activity of most of the extracts, both high and moderate active
extracts, except sea buckthorn leaf and green tea extracts for which only methyl glyoxal
was effective in effectively enhancing their activity. For example, methyl glyoxal enhanced
antimicrobial activity of black currant residue from 76% to 99.99% of inhibition of E.coli,
of grape leaf and noni fruit from 78% to 99.99% of inhibition. And indole_3_butryric acid
exhibited an enhancement in antimicrobial activity of black currant residue (up to 99.5%),
grape leaf (up to 97.13%), and pomegranate (up to 99.36%) and cashew apple (up to
84.17%). The mixing of methyl glyoxal with black currant extract, or with pomegranate
extract or grape leaf extract exhibited complete inhibition of E. coli. Likewise, the mixing
of mono-caprin with pomegranate extract; salicylic acid with pomegranate extract; and
indole-3-butyric acid with betel leaf resulted in complete inhibition of the bacteria.
The nature of enhancement in the activity by plant compounds cannot be ascertained at this
time due to lack of data; however, it is reasonable to assume that these compounds may not
interact with the constituents of the plant extracts and may play a part in the
permeabilization of bacterial membrane, given their lipophilic character. When there is
interaction with the extract components, such an activity is compromised, as seen for sea
buckthorn leaf and green tea extracts (Table 6.9).

208
Table 6.3 The GI (%) against E.coli of mixture of 12 plant extracts with added plant products at total concentration of 5.0 mg/mL
Plant compound
Mono-laurin
Mono-caprin
Methyl glyoxal
Azelaic acid
Abietic acid
Salicylic acid
Jasmonic acid
Phenyl-acetic acid
Gibberellin
Indole-3-butyric acid
Plant extract Control, GI (%)
(79%)* (98%) (100%) (98%) (82%) (99%) (89%) (100%) (88%) (99%)
Cranberry leaf (73%)* 75.11 83.25 88.54 76.43 78.73 84.59 72.07 84.9 79.65 81.07
Black currant residue (76%) 82.15 99.66 99.99 88.64 80.26 98.13 79.76 87.96 84.56 99.5
Sea buckthorn leaf (74%) 70.2 76.42 97.05 78.06 76.72 78.62 75.48 81.2 78.93 80.01
Betel leaf (95%) 71.05 89.69 99.99 65.71 88.06 95.94 85.98 89.15 81.81 99.99
Pomegranate (87%) 76.87 99.99 99.99 81.52 88.08 99.99 89.1 97.67 77.49 99.63
Rhubarb (72%) 61.75 76.32 78.45 49.49 67.56 80.55 80.23 80.65 78.93 82.11
Blueberry leaf (68%) 69.83 78.5 92.16 78.77 74.34 79.54 80.04 76.51 81.81 86.53
Grape leaf (78%) 83.01 89.91 99.99 85.66 78.23 89.51 80.15 89.92 84.73 97.13
Cashew apple (64%) 66.69 81.12 85.03 57.92 65.23 78.9 78.14 76.3 76.09 84.17
Sea buckthorn fruit (83%) 73.11 84.27 95.55 86.01 75.56 81.17 71.65 77.64 86.32 83.33
Noni fruit (78%) 85.33 89.69 99.99 89.12 80.02 87.46 90.01 89.03 89.64 89.18
Green tea (73%) 53.77 68.09 93.97 57.24 60.11 78.65 75.66 79.31 65.64 79.89
* Value in brackets represent the GI (%) of plant extracts alone or added plant compounds alone at total concentration of 5.0 mg/mL
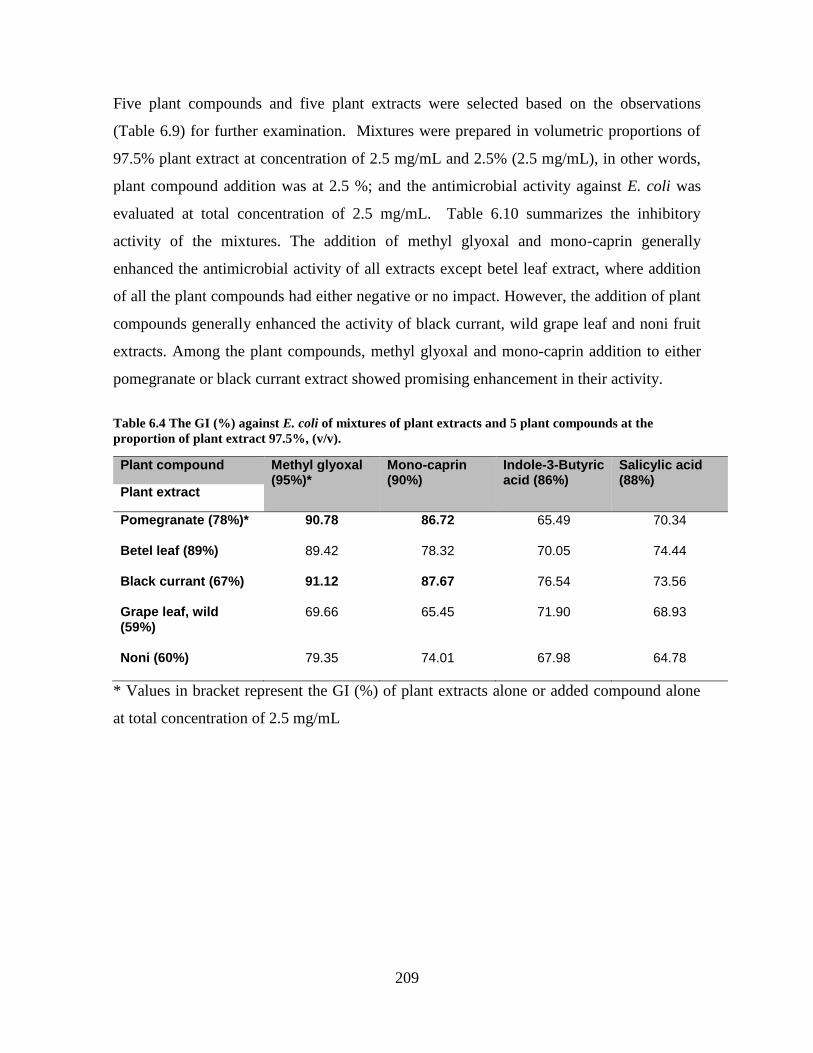
209
Five plant compounds and five plant extracts were selected based on the observations
(Table 6.9) for further examination. Mixtures were prepared in volumetric proportions of
97.5% plant extract at concentration of 2.5 mg/mL and 2.5% (2.5 mg/mL), in other words,
plant compound addition was at 2.5 %; and the antimicrobial activity against E. coli was
evaluated at total concentration of 2.5 mg/mL. Table 6.10 summarizes the inhibitory
activity of the mixtures. The addition of methyl glyoxal and mono-caprin generally
enhanced the antimicrobial activity of all extracts except betel leaf extract, where addition
of all the plant compounds had either negative or no impact. However, the addition of plant
compounds generally enhanced the activity of black currant, wild grape leaf and noni fruit
extracts. Among the plant compounds, methyl glyoxal and mono-caprin addition to either
pomegranate or black currant extract showed promising enhancement in their activity.
Table 6.4 The GI (%) against E. coli of mixtures of plant extracts and 5 plant compounds at the
proportion of plant extract 97.5%, (v/v).
Plant compound Methyl glyoxal (95%)*
Mono-caprin (90%)
Indole-3-Butyric acid (86%)
Salicylic acid (88%)
Plant extract
Pomegranate (78%)*
90.78 86.72 65.49 70.34
Betel leaf (89%)
89.42 78.32 70.05 74.44
Black currant (67%)
91.12 87.67 76.54 73.56
Grape leaf, wild (59%)
69.66 65.45 71.90 68.93
Noni (60%)
79.35 74.01 67.98 64.78
* Values in bracket represent the GI (%) of plant extracts alone or added compound alone
at total concentration of 2.5 mg/mL
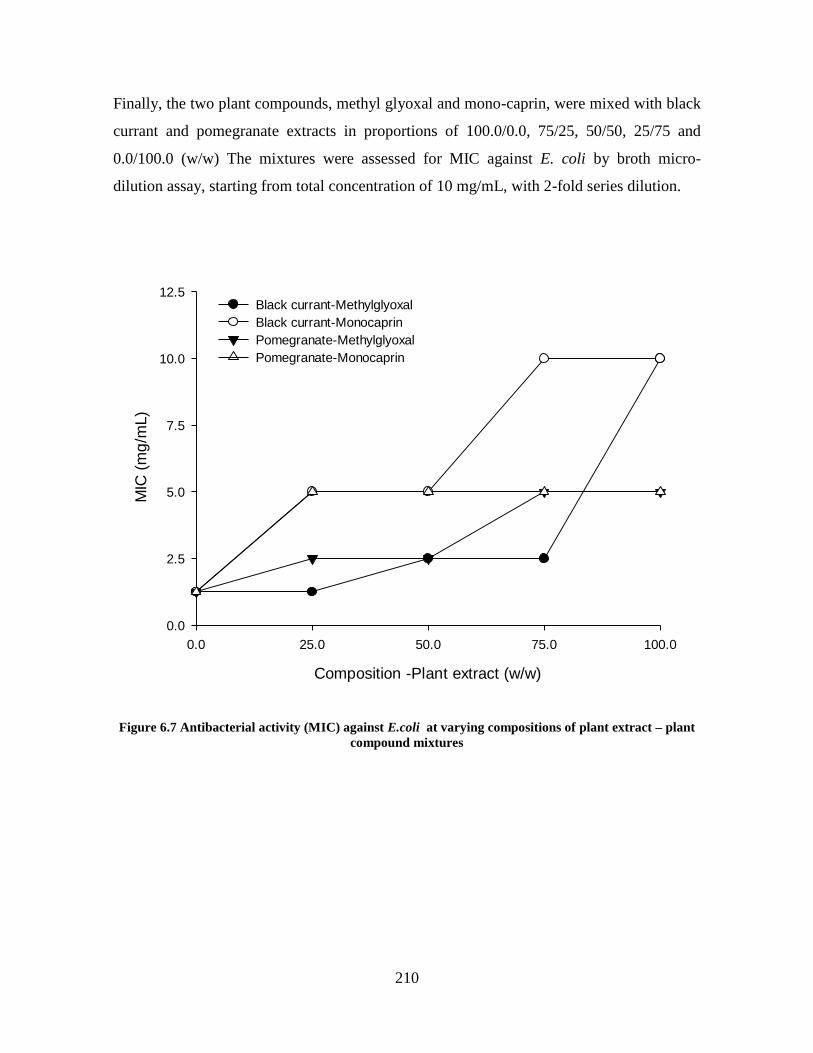
210
Finally, the two plant compounds, methyl glyoxal and mono-caprin, were mixed with black
currant and pomegranate extracts in proportions of 100.0/0.0, 75/25, 50/50, 25/75 and
0.0/100.0 (w/w) The mixtures were assessed for MIC against E. coli by broth micro-
dilution assay, starting from total concentration of 10 mg/mL, with 2-fold series dilution.
Composition -Plant extract (w/w)
0.0 25.0 50.0 75.0 100.0
MIC
(m
g/m
L)
0.0
2.5
5.0
7.5
10.0
12.5Black currant-Methylglyoxal
Black currant-Monocaprin
Pomegranate-Methylglyoxal
Pomegranate-Monocaprin
Figure 6.7 Antibacterial activity (MIC) against E.coli at varying compositions of plant extract – plant
compound mixtures
211
The MIC values of different mixtures are shown in Table A6.7 and Figure 6.7. The addition
of mono-caprin to pomegranate extract did not alter the MIC of pomegranate extract at any
proportion. But methyl glyoxal at 50-75 % level of addition did show a reduction by 50 %
in MIC value of the extract. Besides, addition of such a high level of methyl glyoxal may
not be acceptable. It was quite similar with mono-caprin mixture with black currant.
However, methyl glyoxal mixed with black currant extract at 25 % level reduced the MIC
value against E. coli of black currant alone from 10.0 mg/mL to 2.5 mg/ml, a reduction of
75 %; presumably due to possible synergistic interactions. Yet, betel leaf extract alone
exhibited a MIC value of 2.5 mg/mL. Even though the addition level of 25 % may be
acceptable. In any event, this MIC value is still very high in comparison with synthetic
preservatives, and it would be to characterize them as antimicrobials. It has been suggested
that only those phytochemical products that produce minimum inhibitory concentrations
(MIC) in the range 100–1000 µg/mL in vitro susceptibility tests can be classified as
antimicrobials (Simoes et al., 2009).
212
6.5 Conclusions
This work shows that hot water can be used for solvent extraction of antioxidant-
antimicrobials from plant materials, albeit a polar solvent that extracts mainly phenolic
substances, but also non-polar substances such as terpenoids an alkaloids to some extent.
However, considering the yield of the extracts and the activity, water appears to be
appropriate as an effective solvent for fruit products that are rich in phenolic substances.
Thus, the extraction of multiple substances and the yield of extraction by hot water is still
disarable. Nonetheless, other selective solvents must be considered for extraction of active
non-polar substances for plant sources such as leaves. Some enhancement in antimicrobial
activity was possible by either mixing plant extracts or by the addition of plant compounds.
It was also observed that the composition of blends or mixtures might be important, since
synergistic or antagonistic interactions occur at certain proportions. Pomegranate and black
currant extract blends (both rich in phenolic substances) and green tea and cashew apple
extract blends showed enhancement in activity. The addition of methyl glyoxal and mono-
caprin also showed enhancement in the activity of plant extracts. Methyl glyoxal at 25 %
(w/w) addition improved the activity of pomegranate and black currant extracts. Although
some improvement in the antimicrobial activity could be achieved for the selected extracts,
concentration of the extract required for effective control of microorganisms may not be a
very promising by these approaches.

213
GENERAL CONCLUSIONS AND PERSPECTIVES
214
There is a growing realization and interest in the development of different strategies to use
agricultural and industrial residues as a source of high value-added products. By-products
of fruits and vegetables may be a potential source of bioactive compounds. Identification of
extracts exhibiting both antioxidant and antimicrobial activities could lead to the
development of natural products for possible use in the preservation of foods to replace
synthetic preservatives.
The major goal of this work was to conduct studies to pave the way for the development of
antioxidant-antimicrobials from plant by-products. Specifically, the study involved the
identification of promising antioxidant-antimicrobial extracts from fruits and vegetable by-
products; the characterization of plant extracts for their antioxidant capacity and efficacy;
the evaluation of selected edible plant extracts for their spectrum of anti-radical activity of
importance in biology; the evaluation of selected edible plant extracts for their
antimicrobial activity; and the exploration of ways to enhance the antimicrobial activity of
selected antioxidant-antimicrobial extracts.
The first objective centered on screening of various fruit and vegetable sources. About 160
samples (fruit and vegetable by-products) were evaluated for their potential as source of
antioxidant-antimicrobials for use in food preservation, as alternative to synthetic agents.
The study led to the identification of some potential extracts exhibiting both antimicrobial
and antioxidant properties. The pH of the extract, type of tissue (fruit, leaf and root) and
physiological type of fruits (climacteric) had impact on the bioactive properties. There was
also some relationship between antioxidant and antimicrobial properties of the plant
extracts. The proposed antioxidant-antimicrobial (AO-AM) index may be useful in the
selection of plant sources of such functional bio-actives. The plant extracts could be a safe,
health-beneficial and economical food preservation agent with antimicrobial and
antioxidant properties.
The second objective of this work focused on the antioxidant characterization of plant
extracts for their capacity and efficacy. The true antioxidant activity may lie on both the
capacity as well as the rate of radical scavenging. The new expression, anti-radical power -
ARP, generated from DPPH assay may be more useful in identifying the antioxidant
activity of biological samples. The samples that exhibited high ARP values were: rambutan,
215
cranberry leaf, blueberry leaf, grape leaf (wild), raspberry leaf, betel leaf, avocado,
pomegranate and custard apple. Leaf extracts possess, in general, higher ARP than fruits,
and root extracts possess low ARP. In addition, this study also suggests that average
carbon oxidation number (ACON) of complex mixtures such as plant extracts may portend
their antioxidant power, in spite of the disparity between leaf and fruit materials.
The third part of this study evaluated the spectrum of anti-radical activity of 36 selected
plant extracts against organic radicals (ABTS and DPPH), superoxide anion (SOA),
hydroxyl and nitric oxide radicals. Ferric ion reducing activity and iron binding capacity of
the extracts were also examined. TEAC, DPPH and FRAP assays provided essentially the
same response with respect to the antioxidant activity of plant extracts, suggesting that any
one of them would be adequate to evaluate their anti-radical capacity. Betel leaf, blueberry
fruit and black currant and cranberry leaf showed high radical scavenging activity (TEAC
assay); apple, sorrel, red grape and dandelion root were against SOA; cranberry leaf,
blueberry leaf, black currant and rosemary against hydroxyl radical; rainbow chard,
parsnip, broccoli and orange against H2O2; and potato, banana, sorrel, sea buckthorn leaf
against nitric oxide. Blue berry leaf and fruit, pomegranate, black currant and betel leaf
showed high ferric ion reducing power. The extracts showing high iron binding capacity
were: sea buckthorn leaf, radish, parsnip, betel leaf and mangosteen. Betel leaf extract
exhibited high activities with respect to scavenging of various radicals except nitric oxide,
and iron binding. Thus, this search could identify one plant material exhibiting a wide-
spectrum antioxidant activity. Mangosteen that is less active against SOA radical, and, blue
berry leaf that less active against H2O2 scavenging and iron chelating activities could also
be considered wide spectrum active materials to a lesser extent. This study also suggests
that antioxidant activity of a substance, determined by one or more related assays, does not
give the complete picture of its effectiveness against various species of oxygen radicals;
and emphasizes that determination of the spectrum of the anti-radical activity would be
necessary.
The fourth part of this work evaluated the antimicrobial activity of selected plant extracts in
detail by turbidimetric methods in liquid medium, and by well-diffusion method in gel
medium. The antimicrobial activity was expressed in the former by growth inhibition,
216
minimum inhibitory concentration - MIC and by a new expression, the antimicrobial index
– AMI; and in the latter, expressed by zone of inhibition. AMI takes into account all the
three growth phases of the bacteria. Although the turbidimetric methods were in good
agreement in the assessment of the activity of the substances, the new expression, AMI,
appears to be more meaningful since it carries the information regarding interaction
between the substance and the microorganism and the growth rate in the presence of that
substance. In addition, AMI demarcates the activity of samples, even those found to be
highly active. Furthermore, the spectrum of antimicrobial activity of selected plant extracts
was also examined. Only a few extracts showed some broad spectrum in their activities. In
effect, only betel leaf extract showed a broad spectrum of antimicrobial activity against
bacteria, yeasts and fungi; whereas pomegranate and sea buckthorn fruit extracts appear to
be effective against both bacteria and yeasts. Black currant extract is effectively an
antibacterial substance.
The final objective focused on the exploration of ways to enhance the antimicrobial activity
of selected antioxidant-antimicrobial extracts. The result shows that hot water can be used
for solvent extraction of antioxidant-antimicrobials from plant materials, albeit a polar
solvent that extracts phenolic substances preferably and only modestly non-polar
substances such as terpenoids. However, considering the yield of the extracts and the
activity, water appears to be appropriate, and it can be considered effective for fruit sources
that are rich in phenolic substances. Nonetheless, other selective solvents must be
considered for extraction of active non-polar substances for plant sources such as leaves.
Some enhancement in antimicrobial activity was possible by either mixing plant extracts or
by the addition of plant compounds. It was also observed that the composition of blends or
mixtures might be important, since synergistic or antagonistic interactions occur at certain
proportions. Pomegranate-black currant extract blends and green tea-cashew apple extract
blends showed enhancement in the activity. The addition of methyl glyoxal and mono-
caprin also showed enhancement in the activity of plant extracts. Methyl glyoxal at 25 %
(w/w) addition improved the activity of pomegranate and black currant extracts. Although
some improvement in the antimicrobial activity could be achieved for the selected extracts,
concentration of the extract required for effective control of microorganisms may not be a
very promising by these approaches.

217
Overall, this work explored the potential of extracts of fruit and vegetable by-products as
anti-oxidant-antimicrobials. Some plant extracts having potential as antioxidant-
antimicrobial agents. They include: olive, cranberry, noni, betel leaf, black currant,
pomegranate, lemon grass, spinach, green grape (wine), black currant (residue), egg plant,
rambutan, Indian plum, cranberry leaf, rosemary leaf, grape leaf (wild), green tea,
mangosteen and raspberry leaf. However, the list is reduced to a few (betel leaf,
pomegranate, black currant residue), should broad antioxidant and antimicrobial activities
are taken into account. In addition, this study introduces new expressions for antioxidant
(ARP) and antimicrobial (AMI) activities of complex mixtures such as plant extracts, and
they can be useful in the screening of plant materials for these activities. Another lesson
from this study is that the enhancement of antimicrobial activity of plant extracts may not
be possible merely by simple mixing of extracts, because of potential interactions between
the components of the extracts. The knowledge of the phytochemical composition is
essential to understand such interactions, in the selection of mixtures and to determine
possible approaches to enhance the antimicrobial activity.
Despite the huge number of studies concerning the antioxidant activity of fruits and
vegetables, their role in human health are objects of many studies in the past decades, some
important scientific issues are still rarely addressed. For example, current studies are
mainly focused on revealing the antioxidant potency of crude plant extracts. But, the
specificity of these phytochemicals towards specific radicals such as peroxy, superoxide,
singlet oxygen, hydroxyl radicals, and others is rarely explored. However, plant extract is a
complex system, where phytochemicals may individually function in synergism or
antagonism with each other. This study shows that antioxidant activity of a substance,
determined by one or more related assays, does not give the complete picture of its
effectiveness against various species of oxygen radicals in biology, and therefore,
determination of the spectrum of the anti-radical activity would be necessary.

218
BIBLIOGRAPHIE
A. Schieber, F. C. S. a. R. C. (2001). By-products of plant food processing as a source of functional compounds recent developments. Trends in Food Science & Technology 12, 401-413.
Abreu, A. C., McBain, A. J., and Simoes, M. (2012). Plants as sources of new antimicrobials and resistance-modifying agents. Nat Prod Rep 29, 1007-21.
Adamez, J. D., Samino, E. G., Sanchez, E. V., and Gonzalez-gomez, D. (2012). In vitro estimation of the antibacterial activity and antioxidant capacity of aqueous extracts from grape-seeds ( Vitis vinifera L .). Food Control 24, 136-141.
Agourram, A., Ghirardello, D., Rantsiou, K., Zeppa, G., Belviso, S., Romane, A., Oufdou, K., and Giordano, M. (2013). Phenolic Content, Antioxidant Potential, and Antimicrobial Activities of Fruit and Vegetable By-Product Extracts. International Journal of Food Properties 16, 1092-1104.
Akhtar, S., Ismail, T., Fraternale, D., and Sestili, P. (2015). Pomegranate peel and peel extracts: chemistry and food features. Food Chem 174, 417-25.
Aksoy, L., Kolay, E., Ağılönü, Y., Aslan, Z., and Kargıoğlu, M. (2013). Free radical scavenging activity, total phenolic content, total antioxidant status, and total oxidant status of endemic Thermopsis turcica. Saudi Journal of Biological Sciences 20, 235-239.
Al-Zoreky, N. S. (2009). Antimicrobial activity of pomegranate (Punica granatum L.) fruit peels. Int J Food Microbiol 134, 244-8.
Alonso, Ã. n. M., Guillen, D. A., Barroso, C. G., Puertas, B. n., and GarcÃa, A. (2002). Determination of Antioxidant Activity of Wine Byproducts and Its Correlation with Polyphenolic Content. Journal of Agricultural and Food Chemistry 50, 5832-5836.
Amarowicz, R. (2009). Antioxidant and antibacterial properties of extracts of green tea polyphenols Phenolic Compounds in Foods and Natural Health Products. ACS symposium series 909, 94. Amarowicz, R., Pegg Ronald, B., Dykes Gary, A., Troszynska, A., and Shahidi, F. (2005). Antioxidant and
Antibacterial Properties of Extracts of Green Tea Polyphenols. In "Phenolic Compounds in Foods and Natural Health Products", Vol. 909, pp. 94-106. American Chemical Society.
Amro, B., Aburjai, T., and Al-Khalil, S. (2002). Antioxidative and radical scavenging effects of olive cake extract. Fitoterapia 73, 456-461.
Aqil, F., and Ahmad, I. (2003). Broad-spectrum antibacterial and antifungal properties of certain traditionally used Indian medicinal plants. World Journal of Microbiology and Biotechnology 19, 653-657.
Aruoma, O. I. (2003). Methodological considerations for characterizing potential antioxidant actions of bioactive components in plant foods. Mutation Research/Fundamental and Molecular Mechanisms of Mutagenesis 523-524, 9-20.
Aruoma, O. I., and Cuppett, S. L. (1997). Antioxidant Methodology In vivo and in vitro concepts. AOCS Press Champaign, Illinois, 143-145.
Aruoma, O. I., Spencer, J. P. E., Warren, D., Jenner, P., Butler, J., and Halliwell, B. (1997). Characterization of food antioxidants, illustrated using commercial garlic and ginger preparations. Food Chemistry 60, 149-156.
Aumeeruddy-Elalfi, Z., Gurib-Fakim, A., and Mahomoodally, M. F. (2016). Chemical composition, antimicrobial and antibiotic potentiating activity of essential oils from 10 tropical medicinal plants from Mauritius. Journal of Herbal Medicine 6, 88-95.
Ayala-Zavala, J. F., Rosas-Domínguez, C., Vega-Vega, V., and González-Aguilar, G. A. (2010). Antioxidant Enrichment and Antimicrobial Protection of Fresh-Cut Fruits Using Their Own Byproducts: Looking for Integral Exploitation. Journal of Food Science 75, R175-R181.
Aydog, F., and Duru, M. E. (2007). Food Chemistry Antioxidant activity of stem and root extracts of Rhubarb ( Rheum ribes ): An edible medicinal plant. Food Chemistry 103, 623-630.
Babior, B. M. (1999). NADPH oxidase: An update. BLOOD 93, 1464-1476. Bajpai, V. K., Rahman, A., Dung, N. T., Huh, M. K., and Kang, S. C. (2008). In vitroInhibition of Food Spoilage
and Foodborne Pathogenic Bacteria by Essential Oil and Leaf Extracts ofMagnolia lilifloraDesr. Journal of Food Science 73, M314-M320.
Balasundram, N., Sundram, K., and Samman, S. (2006). Phenolic compounds in plants and agri-industrial by-products: Antioxidant activity, occurrence, and potential uses. Food Chemistry 99, 191-203.
219
Balouiri, M., Sadiki, M., and Ibnsouda, S. K. (2016). Methods for in vitro evaluating antimicrobial activity: A review. Journal of Pharmaceutical Analysis 6, 71-79.
Barnes, K. (1997). Trace metal determinations in fruit, juice, and juice products using an axially viewed plasma. ATOMIC SPECTROSCOPY 18, 84-101.
Barone, F. E., and Tansey, M. R. (1977). Isolation, Purification, Identification, Synthesis, and Kinetics of Activity of the Anticandidal Component of Allium sativum, and a Hypothesis for Its Mode of Action. Mycologia 69, 793-825.
Bartoszek, A., Namies, J., Kusznierewicz, B., and S, A. (2008). Food Chemistry The effect of heating and fermenting on antioxidant properties of white cabbage. Food Chemistry 108, 853-861.
Basma, A. A., Zakaria, Z., Latha, L. Y., and Sasidharan, S. (2011). Antioxidant activity and phytochemical screening of the methanol extracts of Euphorbia hirta L. Asian Pacific Journal of Tropical Medicine 4, 386-390.
Bassole, I. H., and Juliani, H. R. (2012). Essential oils in combination and their antimicrobial properties. Molecules 17, 3989-4006.
Bavaresco, L., Fregoni, C., Cantù, E., and Trevisan, M. (1999). Stilbene compounds: from the grapevine to wine. Drugs under experimental and clinical research 25, 57.
Bergeron, C., Gafner, S., Clausen, E., and Carrier, D. J. (2005). Comparison of the Chemical Composition of Extracts from Scutellaria lateriflora Using Accelerated Solvent Extraction and Supercritical Fluid Extraction versus Standard Hot Water or 70% Ethanol Extraction. Journal of Agricultural and Food Chemistry 53, 3076-3080.
Bhalodia, N. R., and Shukla, V. J. (2011). Antibacterial and antifungal activities from leaf extracts of Cassia fistula l.: An ethnomedicinal plant. Journal of Advanced Pharmaceutical Technology & Research 2, 104-109.
Bocco, A., Cuvelier, M.-E., Richard, H., and Berset, C. (1998). Antioxidant Activity and Phenolic Composition of Citrus Peel and Seed Extracts. Journal of Agricultural and Food Chemistry 46, 2123-2129.
Bonat, G., Pereira-netto, A. B., and Beta, T. (2011). Comparative analysis of total phenolic content , antioxidant activity , and flavonoids profile of fruits from two varieties of Brazilian cherry ( Eugenia uniflora L .) throughout the fruit developmental stages. FRIN 44, 2442-2451.
Borawska, M. H., Czechowska, S. K., Markiewicz, R., Socha, K., Nazaruk, J., Palka, J., and Isidorov, V. A. (2010). Enhancement of antibacterial effects of extracts from Cirsium species using sodium picolinate and estimation of their toxicity. Nat Prod Res 24, 554-61.
Brand-Williams, W., Cuvelier, M. E., and Berset, C. (1995). Use of a free radical method to evaluate antioxidant activity. LWT - Food Science and Technology 28, 25-30.
Bravo, L. (1998). Polyphenols: chemistry, dietary sources, metabolism, and nutritional significance. Nutrition reviews 56, 317-33.
Brooker, N., Windorski, J., and Bluml, E. (2008). Halogenated coumarin derivatives as novel seed protectants. Commun Agric Appl Biol Sci. 2008;73(2):81-9.
Brown, D. G., Lister, T., and May-Dracka, T. L. (2014). New natural products as new leads for antibacterial drug discovery. Bioorg Med Chem Lett 24, 413-8.
Brown, E. D., and Wright, G. D. (2016). Antibacterial drug discovery in the resistance era. Nature 529, 336-43.
Burow, M., Bergner, A., Gershenzon, J., and Wittstock, U. (2007). Glucosinolate hydrolysis in Lepidium sativum––identification of the thiocyanate-forming protein. Plant Molecular Biology 63, 49-61.
Bursal, E., and Galain, A. (2011). Polyphenol contents and in vitro antioxidant activities of lyophilised aqueous extract of kiwifruit ( Actinidia deliciosa ). Food Research International 44, 1482-1489.
Burt, S. (2004). Essential oils: their antibacterial properties and potential applications in foods—a review. International Journal of Food Microbiology 94, 223-253.
Campo, J. D., and Amiot, M.-J. (2000). Antimicrobial effect of rosemary extracts. Journal of Food Protection® 63, 1359-1368.
Campos, F., Couto, J., and Hogg, T. (2003). Influence of phenolic acids on growth and inactivation of Oenococcus oeni and Lactobacillus hilgardii. Journal of Applied Microbiology 94, 167-174.
Carson, C. F. (2006). Melaleuca alternifolia (tea tree) oil: a review of antimicrobial and other medicinal properties. Clinical microbiology reviews 19, 50.

220
Challinor, V. L., and Bode, H. B. (2015). Bioactive natural products from novel microbial sources. Ann N Y Acad Sci 1354, 82-97.
Chatterjee, S., Niaz, Z., Gautam, S., and Adhikari, S. (2007). Food Chemistry Antioxidant activity of some phenolic constituents from green pepper ( Piper nigrum L .) and fresh nutmeg mace ( Myristica fragrans ). Food Chemistry 101, 515-523.
Chen, F., Tholl, D., Bohlmann, J., and Pichersky, E. (2011). The family of terpene synthases in plants: a mid-size family of genes for specialized metabolism that is highly diversified throughout the kingdom. Plant J. 2011 Apr;66(1):212-29. doi: 10.1111/j.1365-313X.2011.04520.x.
Chen, H., and Tappel, A. L. (1996). Protection of multiple antioxidants against heme protein oxidation and lipid peroxidation induced by CBrCl3 in liver, lung, kidney, heart, and spleen. JOURNAL OF AGRICULTURAL AND FOOD CHEMISTRY 44, 854-858.
Cotter, P. D., and Hill, C. (2003). Surviving the acid test: responses of gram-positive bacteria to low pH. Microbiology and Molecular Biology Reviews 67, 429-453.
Cowan, M. M. (1999). Plant products as antimicrobial agents. Clinical microbiology reviews 12, 564-82. Cox, S. D. (2001). The mode of antimicrobial action of the essential oil of Melaleuca alternifolia (tea tree oil).
Journal of applied microbiology 88, 170. Craig, W. J. (1999). Health-promoting properties of common herbs. The American journal of clinical nutrition
70, 491S. Cueva, C., Moreno-Arribas, M., Martín-Álvarez, P. J., Bills, G., Vicente, M. F., Basilio, A., Rivas, C. L., Requena,
T., Rodríguez, J. M., and Bartolomé, B. (2010a). Antimicrobial activity of phenolic acids against commensal, probiotic and pathogenic bacteria. Research in microbiology 161, 372-382.
Cueva, C., Moreno-Arribas, M. V., Martín-Álvarez, P. J., Bills, G., Vicente, M. F., Basilio, A., Rivas, C. L., Requena, T., Rodríguez, J. M., and Bartolomé, B. (2010b). Antimicrobial activity of phenolic acids against commensal, probiotic and pathogenic bacteria. Research in Microbiology 161, 372-382.
Daglia, M. (2012a). Polyphenols as antimicrobial agents. Current Opinion in Biotechnology 23, 174-181. Daglia, M. (2012b). Polyphenols as antimicrobial agents. Curr Opin Biotechnol 23, 174-81. Dai, J., and Mumper, R. (2010). Plant Phenolics: Extraction, Analysis and Their Antioxidant and Anticancer
Properties. MOLECULES 15, 7313-7352. Davidson, P. M., and Branen, A. (2005). Food Antimicrobials.An Introduction. In "Antimicrobials in Food,
Third Edition", pp. 1-10. CRC Press. Davidson, P. M., Critzer, F. J., and Taylor, T. M. (2013). Naturally occurring antimicrobials for minimally
processed foods. Annu Rev Food Sci Technol 4, 163-90. Davidson, P. M., Sofos, J. N., and Branen, A. L. (2005). Antimicrobials in food. Taylor & Francis, Boca Raton. Deba, F., Xuan, T. D., Yasuda, M., and Tawata, S. (2008). Chemical composition and antioxidant, antibacterial
and antifungal activities of the essential oils from Bidens pilosa Linn. var. Radiata. Food Control 19, 346-352.
Delaquis, P., and Mazza, G. (1995). ANTIMICROBIAL PROPERTIES OF ISOTHIOCYANATES IN FOOD PRESERVATION. FOOD TECHNOLOGY 49, 73-&.
Deng, G.-F., Shen, C., Xu, X.-R., Kuang, R.-D., Guo, Y.-J., Zeng, L.-S., Gao, L.-L., Lin, X., Xie, J.-F., and Xia, E.-Q. (2012). Potential of Fruit Wastes as Natural Resources of Bioactive Compounds. International journal of molecular sciences 13, 8308-8323.
Dini, I., Tenore, G. C., and Dini, A. (2008). Food Chemistry Chemical composition , nutritional value and antioxidant properties of Allium caepa L . Var . tropeana ( red onion ) seeds. Food Chemistry 107, 613-621.
Dixon, R. A. (2001). Natural products and plant disease resistance. Nature 411, 843-847. Djenane, D., Aider, M., Yanguela, J., Idir, L., Gomez, D., and Roncales, P. (2012). Antioxidant and antibacterial
effects of Lavandula and Mentha essential oils in minced beef inoculated with E. coli O157:H7 and S. aureus during storage at abuse refrigeration temperature. Meat Sci 92, 667-74.
Dorai, A. A. (2012). Wound care with traditional, complementary and alternative medicine. Indian J Plast Surg 45, 418-24.
Dorman, H. J. D., and Deans, S. G. (2000). Antimicrobial agents from plants: antibacterial activity of plant volatile oils. Journal of Applied Microbiology 88, 308-316.

221
DuPont, M. S., Bennett, R. N., Mellon, F. A., and Williamson, G. (2002). Polyphenols from alcoholic apple cider are absorbed, metabolized and excreted by humans. The Journal of nutrition 132, 172-5.
DuPont, M. S., Mondin, Z., Williamson, G., and Price, K. R. (2000). Effect of Variety, Processing, and Storage on the Flavonoid Glycoside Content and Composition of Lettuce and Endive. Journal of Agricultural and Food Chemistry 48, 3957-3964.
Edreva, A., Velikova, V., , T. T., , S. D., , A. G., , L. A., , A. G., and Gesheva, E. (2008). Stress-protective role of secondary metabolites: Diversity of functions and mechanisms. General applied plant physiology 34, 67-78.
Edziri, H. L., Smach, M. A., Ammar, S., Mahjoub, M. A., Mighri, Z., Aouni, M., and Mastouri, M. (2011). Antioxidant , antibacterial , and antiviral effects of Lactuca sativa extracts. Industrial Crops & Products 34, 1182-1185.
El-Massry, K. F., El-Ghorab, A. H., Shaaban, H. A., and Shibamoto, T. (2009). Chemical compositions and antioxidant/antimicrobial activities of various samples prepared from Schinus terebinthifolius leaves cultivated in Egypt. J Agric Food Chem 57, 5265-70.
El Ghaouth, A., Arul, J., Asselin, A., and Benhamou, N. (1992). Antifungal activity of chitosan on post-harvest pathogens: induction of morphological and cytological alterations in Rhizopus stolonifer. Mycological Research 96, 769-779.
Erden, Y., Kirbag, S., and Yilmaz, O. (2013). Phytochemical Composition and Antioxidant Activity of Some Scorzonera Species. PROCEEDINGS OF THE NATIONAL ACADEMY OF SCIENCES INDIA SECTION B-BIOLOGICAL 83, 271-276.
EuropeanUnion (2006). Directive 2006/12/EC of the European Parliament and of the Council of 5 April 2006 on waste. Official Journal of the European Union L114/9. Available in EUROPA, summaries of EU legislation.
Faculty, M. (2003). Screening of antioxidant and antimicrobial activities of anise ( Pimpinella anisum L .) seed extracts. Food Chemistry 83, 371-382.
Faleiro, L., Miguel, G., Gomes, S., Costa, L., Venancio, F., Teixeira, A., Figueiredo, A. C., Barroso, J. G., and Pedro, L. G. (2005). Antibacterial and Antioxidant Activities of Essential Oils Isolated from Thymbra capitata L. (Cav.) and Origanum vulgare L. Journal of Agricultural and Food Chemistry 53, 8162-8168.
Ferrara, G., Cavoski, I., Pacifico, A., Tedone, L., and Mondelli, D. (2009). Morpho-pomological and chemical characterization of pomegranate (Punica granatum L.) genotypes in Apulia region, Southeastern Italy. Scientia Horticulturae 130, 599-606.
Ferrazzano, G. F., Amato, I., Ingenito, A., Zarrelli, A., Pinto, G., and Pollio, A. (2011). Plant polyphenols and their anti-cariogenic properties: a review. Molecules 16, 1486-507.
Flamini, R., Mattivi, F., De Rosso, M., Arapitsas, P., and Bavaresco, L. (2013). Advanced knowledge of three important classes of grape phenolics: anthocyanins, stilbenes and flavonols. Int J Mol Sci 14, 19651-69.
Flora, S. (2009). Structural, chemical and biological aspects of antioxidants for strategies against metal and metalloid exposure. OXIDATIVE MEDICINE AND CELLULAR LONGEVITY 2, 191-206.
Flores-Sanchez, I. J., and Verpoorte, R. (2009). Plant Polyketide Synthases: A fascinating group of enzymes. Plant Physiology and Biochemistry 47, 167-174.
Foti, M. C. (2015). Use and Abuse of the DPPH(*) Radical. J Agric Food Chem 63, 8765-76. Fuentes-alventosa, J. M., Jaramillo-carmona, S., Rodriguez-gutierrez, G., and Rodriguez-arcos, R. (2009).
Effect of the extraction method on phytochemical composition and antioxidant activity of high dietary fibre powders obtained from asparagus by-products. Food Chemistry 116, 484-490.
Gao, Q. H., Wu, C. S., and Wang, M. (2013). The jujube (Ziziphus jujuba Mill.) fruit: a review of current knowledge of fruit composition and health benefits. J Agric Food Chem 61, 3351-63.
George, B., Kaur, C., Khurdiya, D. S., and Kapoor, H. C. (2004). Antioxidants in tomato (Lycopersium esculentum) as a function of genotype. Food Chemistry 84, 45-51.
Ghorai, N., Chakraborty, S., Gucchait, S., Saha, S. K., and Biswas, S. (2012). Estimation of total Terpenoids concentration in plant tissues using a monoterpene, Linalool as standard reagent.
Gill, S. S., and Tuteja, N. (2010). Reactive oxygen species and antioxidant machinery in abiotic stress tolerance in crop plants. Plant Physiol Biochem 48, 909-30.
222
Gordon, N., and Wareham, D. W. (2010). Antimicrobial activity of the green tea polyphenol (-)-epigallocatechin-3-gallate (EGCG) against clinical isolates of Stentrophomonas maltophilia. Int J Antimicrob Agents 36.
Gould, K. S. (2004). Nature's Swiss army knife: the diverse protective roles of anthocyanins in leaves. BioMed Research International 2004, 314-320.
Gözlekçi, Ş., Saraçoğlu, O., Onursal, E., and Özgen, M. (2011). Total phenolic distribution of juice, peel, and seed extracts of four pomegranate cultivars. Pharmacognosy Magazine 7, 161-164.
Grajeda-Iglesias, C., Salas, E., Barouh, N., Barea, B., Panya, A., and Figueroa-Espinoza, M. C. (2016). Antioxidant activity of protocatechuates evaluated by DPPH, ORAC, and CAT methods. Food Chem 194, 749-57.
Grayer, R. e. J., and Harborne, J. B. (1994). A survey of antifungal compounds from higher plants, 1982–1993. Phytochemistry 37, 19-42.
Grayer, R. J., Harborne, J.B. (1994). A survey of antifungal compounds from higher plants 1982–1993. Phytochemistry 37, 19-42.
Gross, J. (1991). "Pigments in vegetables: chlorophylls and carotenoids," Van Nostrand Reinhold. Guil-Guerrero, J. L., Ramos, L., Moreno, C., Zúñiga-Paredes, J. C., Carlosama-Yepez, M., and Ruales, P. (2016).
Antimicrobial activity of plant-food by-products: A review focusing on the tropics. Livestock Science 189, 32-49.
Guimaraes, R., Barros, L., Barreira, J. C. M., Sousa, M. J., Carvalho, A. M., and Ferreira, I. C. F. R. (2010). Targeting excessive free radicals with peels and juices of citrus fruits: Grapefruit, lemon, lime and orange. Food and Chemical Toxicology 48, 99-106.
Gülçın, İ., Oktay, M., Kıreçcı, E., and Küfrevıoǧlu, Ö. İ. (2003). Screening of antioxidant and antimicrobial activities of anise (Pimpinella anisum L.) seed extracts. Food Chemistry 83, 371-382.
Guo, C., Yang, J., Wei, J., Li, Y., Xu, J., and Jiang, Y. (2003). Antioxidant activities of peel, pulp and seed fractions of common fruits as determined by FRAP assay. Nutrition Research 23, 1719-1726.
Gutierrez, J., Barry-Ryan, C., and Bourke, P. (2008). The antimicrobial efficacy of plant essential oil combinations and interactions with food ingredients. International Journal of Food Microbiology 124, 91-97.
Halliwell, B. (1995). How to characterize an antioxidant: an update. In "Biochem Soc Symp", Vol. 61, pp. 73-101.
Halliwell, B. (1999). Oxygen and nitrogen are pro-carcinogens. Damage to DNA by reactive oxygen, chlorine and nitrogen species: measurement, mechanism and the effects of nutrition. Mutation Research/Genetic Toxicology and Environmental Mutagenesis 443, 37-52.
Halliwell, B. (2009). The wanderings of a free radical. Free Radic Biol Med 46, 531-42. Halliwell, B., Aeschbach, R., Löliger, J., and Aruoma, O. I. (1995). The characterization of antioxidants. Food
and Chemical Toxicology 33, 601-617. Halliwell, B., and Gutteridge, J. M. C. (1999). "Free Radicals in Biology and Medicine." Hamad, S. H. (2012). Factors Affecting the Growth of Microorganisms in Food. In "Progress in Food
Preservation", pp. 405-427. Wiley-Blackwell. Hammond-Kosack, K. E. a. J. D. G. J. Resistance Gene-Dependent Plant Defense Responses The Plant Cell 8,
1773-1791. Han, R.-M., Tian, Y.-X., Liu, Y., Chen, C.-H., Ai, X.-C., Zhang, J.-P., and Skibsted, L. H. (2009). Comparison of
Flavonoids and Isoflavonoids as Antioxidants. Journal of Agricultural and Food Chemistry 57, 3780-3785.
Harborne, J. B. (1993). Introduction to Ecological Biochemistry. Hartmann, T. (2007). From waste products to ecochemicals: Fifty years research of plant secondary
metabolism. Phytochemistry 68, 2831-2846. Helander, I., Alakomi, H. L., Latva-Kala, K., Mattila-Sandholm, T., Pol, I., Smid, E., Gorris, L., and Von Wright,
A. (1998a). Characterization of the action of selected essential oil components on gram-negative bacteria. JOURNAL OF AGRICULTURAL AND FOOD CHEMISTRY 46, 3590-3595.
Helander, I. M., Alakomi, H.-L., Latva-Kala, K., Mattila-Sandholm, T., Pol, I., Smid, E. J., Gorris, L. G. M., and von Wright, A. (1998b). Characterization of the Action of Selected Essential Oil Components on Gram-Negative Bacteria. Journal of Agricultural and Food Chemistry 46, 3590-3595.
223
Heller, W. T., Waring, A. J., Lehrer, R. I., Harroun, T. A., Weiss, T. M., Yang, L., and Huang, H. W. (1999). Membrane Thinning Effect of the β-Sheet Antimicrobial Protegrin†. Biochemistry 39, 139-145.
Hendrich, A. B. (2006). Flavonoid-membrane interactions: possible consequences for biological effects of some polyphenolic compounds. Acta Pharmacol Sin 27, 27-40.
Henning, S. M., Niu, Y., Lee, N. H., Thames, G. D., Minutti, R. R., Wang, H., Go, V. L. W., and Heber, D. (2004). Bioavailability and antioxidant activity of tea flavanols after consumption of green tea, black tea, or a green tea extract supplement. The American journal of clinical nutrition 80, 1558.
Hernández, Y., Lobo, M. G., and González, M. (2006). Determination of vitamin C in tropical fruits: A comparative evaluation of methods. Food Chemistry 96, 654-664.
Herrmann, K. (1988). On the occurrence of flavonol and flavone glycosides in vegetables, Über das Vorkommen von Flavonol-und Flavon-Glykosiden in Gemüse. Zeitschrift für Lebensmittel-Untersuchung und Forschung 186, 1-5.
Herrmann, K. M., and Weaver, L. M. (1999). The Shikimate Pathway. Annu Rev Plant Physiol Plant Mol Biol. 1999 Jun;50:473-503.
Holloway, A. C., Gould, S. W., Fielder, M. D., Naughton, D. P., and Kelly, A. F. (2011). Enhancement of antimicrobial activities of whole and sub-fractionated white tea by addition of copper (II) sulphate and vitamin C against Staphylococcus aureus; a mechanistic approach. BMC Complementary and Alternative Medicine 11, 1-9.
Hossain, M. A., and Rahman, S. M. M. (2011). Total phenolics , flavonoids and antioxidant activity of tropical fruit pineapple. FRIN 44, 672-676.
Hsieh, P.-C., Mau, J.-L., and Huang, S.-H. (2001). Antimicrobial effect of various combinations of plant extracts. Food Microbiology 18, 35-43.
Huang, D., Ou, B., and Prior, R. L. (2005). The Chemistry behind Antioxidant Capacity Assays. Journal of Agricultural and Food Chemistry 53, 1841-1856.
Ichrak, G., Rim, B., Loubna, A. S., Khalid, O., Abderrahmane, R., and Said el, M. (2011). Chemical composition, antibacterial and antioxidant activities of the essential oils from Thymus satureioides and Thymus pallidus. Nat Prod Commun 6, 1507-10.
Ikuta, K., Hashimoto, K., Kaneko, H., Mori, S., Ohashi, K., and Suzutani, T. (2012). Anti-viral and anti-bacterial activities of an extract of blackcurrants (Ribes nigrum L.). Microbiol Immunol 56, 805-9.
Imeh, U., and Khokhar, S. (2002). Distribution of Conjugated and Free Phenols in Fruits:  Antioxidant Activity and Cultivar Variations. Journal of Agricultural and Food Chemistry 50, 6301-6306.
Imperato, F. (2006). Phytochemistry : advances in research, 2006 Research Signpost. Ismail, T., Sestili, P., and Akhtar, S. (2012). Pomegranate peel and fruit extracts: a review of potential anti-
inflammatory and anti-infective effects. J Ethnopharmacol 143, 397-405. IUPAC (2009). quinones. Compendium of Chemical Terminology 2nd ed. (the "Gold Book"). Jayaraman, P., Sakharkar, M. K., Lim, C. S., Tang, T. H., and Sakharkar, K. R. (2010). Activity and interactions
of antibiotic and phytochemical combinations against Pseudomonas aeruginosa in vitro. International Journal of Biological Sciences 6, 556-568.
Jensen, W. (2007). The origin of the oxidation-state concept. JOURNAL OF CHEMICAL EDUCATION 84, 1418-1419.
Jha, D. K., Panda, L., Ramaiah, S., and Anbarasu, A. (2014). Evaluation and Comparison of Radical Scavenging Properties of Solvent Extracts from Justicia adhatoda Leaf Using DPPH Assay. Applied Biochemistry and Biotechnology 174, 2413-2425.
Jia, H. L., Ji, Q. L., Xing, S. L., Zhang, P. H., Zhu, G. L., and Wang, X. H. (2010). Chemical composition and antioxidant, antimicrobial activities of the essential oils of Thymus marschallianus Will. and Thymus proximus Serg. J Food Sci 75, E59-65.
Jimenez-Escrig, A., Dragsted, L. O., Daneshvar, B., Pulido, R., and Saura-Calixto, F. (2003). In Vitro Antioxidant Activities of Edible Artichoke (Cynara scolymus L.) and Effect on Biomarkers of Antioxidants in Rats. Journal of Agricultural and Food Chemistry 51, 5540-5545.
Jiménez-Escrig, A., Rincón, M., Pulido, R., and Saura-Calixto, F. (2001). Guava Fruit (Psidium guajava L.) as a New Source of Antioxidant Dietary Fiber. Journal of Agricultural and Food Chemistry 49, 5489-5493.
Jin, Y., Wang, M., Rosen, R. T., and Ho, C.-T. (1999). Thermal Degradation of Sulforaphane in Aqueous Solution. Journal of Agricultural and Food Chemistry 47, 3121-3123.

224
Joana Gil-Chávez, G., Villa, J. A., Fernando Ayala-Zavala, J., Basilio Heredia, J., Sepulveda, D., Yahia, E. M., and González-Aguilar, G. A. (2013). Technologies for Extraction and Production of Bioactive Compounds to be Used as Nutraceuticals and Food Ingredients: An Overview. Comprehensive Reviews in Food Science and Food Safety 12, 5-23.
Johanningsmeier, S. D., and Harris, G. K. (2011). Pomegranate as a functional food and nutraceutical source. Annu Rev Food Sci Technol 2, 181-201.
Jorgensen, J. H., and Ferraro, M. J. (2009). Antimicrobial susceptibility testing: a review of general principles and contemporary practices. Clinical Infectious Diseases: An Official Publication Of The Infectious Diseases Society Of America 49, 1749-1755.
Joshi, S. C., and Mathela, C. S. (2012). Antioxidant and antibacterial activities of the leaf essential oil and its constituents furanodienone and curzerenone from Lindera pulcherrima (Nees.) Benth. ex hook. f. Pharmacognosy Res 4, 80-4.
Joshi, S. C., Verma, A. R., and Mathela, C. S. (2010). Antioxidant and antibacterial activities of the leaf essential oils of Himalayan Lauraceae species. Food Chem Toxicol 48, 37-40.
Juven, B. J., Kanner, J., Schved, F., and Weisslowicz, H. (1994). Factors that interact with the antibacterial action of thyme essential oil and its active constituents. Journal of Applied Bacteriology 76, 626-631.
K Hahlbrock, a., and Scheel, D. (1989). Physiology and Molecular Biology of Phenylpropanoid Metabolism. Annual Review of Plant Physiology and Plant Molecular Biology 40, 347-369.
Kabuki, T. (2000). Characterization of novel antimicrobial compounds from mango (Mangifera indica L.) kernel seeds. Food chemistry 71, 61.
Kahkonen, M. P., Hopia, A. I., and Heinonen, M. (2001). Berry Phenolics and Their Antioxidant Activity. Journal of Agricultural and Food Chemistry 49, 4076-4082.
Kähkönen, M. P., Hopia, A. I., Vuorela, H. J., Rauha, J. P., Pihlaja, K., Kujala, T. S., and Heinonen, M. (1999). Antioxidant activity of plant extracts containing phenolic compounds. Journal of agricultural and food chemistry 47, 3954.
Kanjee, U., and Houry, W. A. (2013). Mechanisms of acid resistance in Escherichia coli. Annu Rev Microbiol 67, 65-81.
Katalinić, V., Možina, S. S., Skroza, D., Generalić, I., Abramovič, H., Miloš, M., Ljubenkov, I., Piskernik, S., Pezo, I., and Terpinc, P. (2010). Polyphenolic profile, antioxidant properties and antimicrobial activity of grape skin extracts of 14 Vitis vinifera varieties grown in Dalmatia (Croatia). Food Chemistry 119, 715-723.
Katayama, T., and Nagai, I. (1960). Chemical significance of the volatile components of spices in the food preservative viewpoint-IV. Nippon Suisan Gakkaishi 26, 29-32.
Kennedy, D. O., and Wightman, E. L. (2011). Herbal extracts and phytochemicals: plant secondary metabolites and the enhancement of human brain function. Adv Nutr 2, 32-50.
Khanam, Z., Wen, C. S., and Bhat, I. U. H. (2015). Phytochemical screening and antimicrobial activity of root and stem extracts of wild Eurycoma longifolia Jack (Tongkat Ali). Journal of King Saud University - Science 27, 23-30.
Khoddami, A., Wilkes, M. A., and Roberts, T. (2013). Techniques for Analysis of Plant Phenolic Compounds. MOLECULES 18, 2328-2375.
Ko, M.-J., Cheigh, C.-I., and Chung, M.-S. (2014). Optimization of Subcritical Water Extraction of Flavanols from Green Tea Leaves. Journal of Agricultural and Food Chemistry 62, 6828-6833.
Kohanski, M. A., Dwyer, D. J., and Collins, J. J. (2010). How antibiotics kill bacteria: from targets to networks. Nat Rev Microbiol 8, 423-35.
Kretzschmann, F. (1981). Secondary Plant Products. Herausgegeben von E. A. Bell und B. V. Charlwood. 674 Seiten, 1 Abb., 193 Darst., 35 Tab., Springer-Verlag, Berlin, Heidelberg, New York 1980. Preis: 198,- DM. Food / Nahrung 25, 116-116.
Kris-Etherton, P. M., Hecker, K. D., Bonanome, A., Coval, S. M., Binkoski, A. E., Hilpert, K. F., Griel, A. E., and Etherton, T. D. (2002). Bioactive compounds in foods: their role in the prevention of cardiovascular disease and cancer. The American journal of medicine 113, 71-88.
Krishnaiah, D., Sarbatly, R., and Nithyanandam, R. (2011). A review of the antioxidant potential of medicinal plant species. Food and Bioproducts Processing 89, 217-233.
225
Kroll, J. H., Donahue, N. M., Jimenez, J. L., Kessler, S. H., Canagaratna, M. R., Wilson, K. R., Altieri, K. E., Mazzoleni, L. R., Wozniak, A. S., Bluhm, H., Mysak, E. R., Smith, J. D., Kolb, C. E., and Worsnop, D. R. (2011). Carbon oxidation state as a metric for describing the chemistry of atmospheric organic aerosol. Nat Chem 3, 133-9.
Kubec, R., Velíšek, J., Doležal, M., and Kubelka, V. (1997). Sulfur-Containing Volatiles Arising by Thermal Degradation of Alliin and Deoxyalliin. Journal of Agricultural and Food Chemistry 45, 3580-3585.
Kubola, J., and Siriamornpun, S. (2011). Phytochemicals and antioxidant activity of different fruit fractions (peel, pulp, aril and seed) of Thai gac (Momordica cochinchinensis Spreng). Food Chemistry 127, 1138-1145.
Kujala, T., Loponen, J., and Pihlaja, K. (2001). Betalains and phenolics in red beetroot (Beta vulgaris) peel extracts: extraction and characterisation. Zeitschrift für Naturforschung. C, Journal of biosciences 56, 343-8.
Kurilich, A. C., Jeffery, E. H., Juvik, J. A., Wallig, M. A., and Klein, B. P. (2002). Antioxidant Capacity of Different Broccoli (Brassica oleracea) Genotypes Using the Oxygen Radical Absorbance Capacity (ORAC) Assay. Journal of Agricultural and Food Chemistry 50, 5053-5057.
Lake, J. A., Field, K. J., Davey, M. P., Beerling, D. J., and Lomax, B. H. (2009). Metabolomic and physiological responses reveal multi-phasic acclimation of Arabidopsis thaliana to chronic UV radiation. Plant Cell Environ. 2009 Oct;32(10):1377-89. doi: 10.1111/j.1365-3040.2009.02005.x. Epub 2009 Jun 10.
Lapornik, B., Prosek, M., and Golc Wondra, A. (2005). Comparison of extracts prepared from plant by-products using different solvents and extraction time. Journal of Food Engineering 71, 214-222.
Larrosa, M., Llorach, R., Espín, J. C., and Tomás-Barberán, F. A. (2002). Increase of Antioxidant Activity of Tomato Juice Upon Functionalisation with Vegetable Byproduct Extracts. Lebensmittel-Wissenschaft und-Technologie 35, 532-542.
Lavelli, V., Peri, C., and Rizzolo, A. (2000). Antioxidant Activity of Tomato Products As Studied by Model Reactions Using Xanthine Oxidase, Myeloperoxidase, and Copper-Induced Lipid Peroxidation. Journal of Agricultural and Food Chemistry 48, 1442-1448.
Lee, H.-R., Bak, M.-J., Jeong, W.-S., Kim, Y.-C., and Chung, S.-K. (2009). Antioxidant properties of proanthocyanidin fraction isolated from wild grape ( Vitis amurensis ) seed. Journal of the Korean Society for Applied Biological Chemistry 52, 539-544.
Lee, O.-H., and Lee, B.-Y. (2009). Antioxidant and antimicrobial activities of individual and combined phenolics in Olea europaea leaf extract. Bioresource Technology 101, 3751-3754.
Lewis, K., and Ausubel, F. M. (2006). Prospects for plant-derived antibacterials. Nat Biotech 24, 1504-1507. Li, R. C., Nix, D. E., and Schentag, J. J. (1993). New turbidimetric assay for quantitation of viable bacterial
densities. Antimicrobial Agents and Chemotherapy 37, 371-374. Lima, M. B., Andrade, S. I., Harding, D. P., Pistonesi, M. F., Band, B. S., and Araujo, M. C. (2012). Turbidimetric
and photometric determination of total tannins in tea using a micro-flow-batch analyzer. Talanta 88, 717-23.
Liu, C., Han, X., Cai, L., Lu, X., Ying, T., and Jiang, Z. (2011). Postharvest Biology and Technology Postharvest UV-B irradiation maintains sensory qualities and enhances antioxidant capacity in tomato fruit during storage. Postharvest Biology and Technology 59, 232-237.
Lobo, V., Patil, A., Phatak, A., and Chandra, N. (2010). Free radicals, antioxidants and functional foods: Impact on human health. Pharmacognosy Reviews 4, 118-126.
Lombardo, S., Pandino, G., Mauromicale, G., Knödler, M., Carle, R., and Schieber, A. (2010). Influence of genotype, harvest time and plant part on polyphenolic composition of globe artichoke [Cynara cardunculus L. var. scolymus (L.) Fiori]. Food Chemistry 119, 1175-1181.
Louli, V., Ragoussis, N., and Magoulas, K. (2004). Recovery of phenolic antioxidants from wine industry by-products. Bioresource Technology 92, 201-208.
Lucera, A., Costa, C., Conte, A., and Del Nobile, M. A. (2012). Food applications of natural antimicrobial compounds. Front Microbiol 3, 287.
Manach, C., Scalbert, A., Morand, C., Remesy, C., and Jimenez, L. (2004). Polyphenols: food sources and bioavailability. AMERICAN JOURNAL OF CLINICAL NUTRITION 79, 727-747.
226
Manoj, V., Aravind, U., Mohan, H., and Aravindakumar, C. (2011). Reaction of hydroxyl radicals with S-nitrosothiols: Formation of thiyl radical (RS•) as the intermediate. Research on Chemical Intermediates 37, 1113-1122.
Maqsood, S., Benjakul, S., and Shahidi, F. (2013). Emerging Role of Phenolic Compounds as Natural Food Additives in Fish and Fish Products. Critical Reviews in Food Science and Nutrition 53, 162-179.
Maria, D. b., Luzia, M., and Jorge, N. (2011). Emerald Article : Evaluating of the activity antioxidant and fatty acids Evaluating of the activity antioxidant and fatty acids profile of lychee seeds ( Litchi chinensis SONN .). Group.
Marino, M. (2001). Impedance measurements to study the antimicrobial activity of essential oils from Lamiaceae and Compositae. International journal of food microbiology 67, 187.
Martini, S., Addario, C. D., Colacevich, A., Focardi, S., Borghini, F., Santucci, A., Figura, N., and Rossi, C. (2009). International Journal of Antimicrobial Agents Antimicrobial activity against Helicobacter pylori strains and antioxidant properties of blackberry leaves ( Rubus ulmifolius ) and isolated compounds. Analysis 34, 50-59.
Matsuzaki, K. (1998). Magainins as paradigm for the mode of action of pore forming polypeptides. Biochimica et Biophysica Acta (BBA) - Reviews on Biomembranes 1376, 391-400.
Mauricio, R. (1998). Costs of resistance to natural enemies in field populations of the annual plant Arabidopsis thaliana. Am Nat 151, 20-8.
Mazid, M., Khan, T. A., and F, M. (2011). Role of Secondary metabolites in defense mechanisms of plants. Biology and Medicine 3, 232-249.
McCarrell, E. M., Gould, S. W., Fielder, M. D., Kelly, A. F., El Sankary, W., and Naughton, D. P. (2008). Antimicrobial activities of pomegranate rind extracts: enhancement by addition of metal salts and vitamin C. BMC Complement Altern Med 8, 64.
McKnight, T. L., and Hess, D. (2000). Climate zones and types: the Köppen system. Physical Geography: A Landscape Appreciation. Upper Saddle River, NJ: Prentice Hall.
Medina, E., Castro, A., Romero, C., and Brenes, M. (2006a). Comparison of the Concentrations of Phenolic Compounds in Olive Oils and Other Plant Oils: Correlation with Antimicrobial Activity. Journal of Agricultural and Food Chemistry 54, 4954-4961.
Medina, E., de Castro, A., Romero, C., and Brenes, M. (2006b). Comparison of the Concentrations of Phenolic Compounds in Olive Oils and Other Plant Oils: Correlation with Antimicrobial Activity. Journal of Agricultural and Food Chemistry 54, 4954-4961.
Michel, T., Destandau, E., Le Floch, G., Lucchesi, M. E., and Elfakir, C. (2012a). Antimicrobial, antioxidant and phytochemical investigations of sea buckthorn (Hippophaë rhamnoides L.) leaf, stem, root and seed. Food Chemistry 131, 754-760.
Michel, T., Destandau, E., Le, G. t., Elisabeth, M., and Elfakir, C. (2012b). Antimicrobial , antioxidant and phytochemical investigations of sea buckthorn ( Hippophaë rhamnoides L .) leaf , stem , root and seed. Food Chemistry 131, 754-760.
Mirabella, N., Castellani, V., and Sala, S. (2014). Current options for the valorization of food manufacturing waste: a review. Journal of Cleaner Production 65, 28-41.
Mishra, K., Ojha, H., and Chaudhury, N. K. (2012). Estimation of antiradical properties of antioxidants using DPPH assay: A critical review and results. Food Chemistry 130, 1036-1043.
Miyasaki, Y., Rabenstein, J. D., Rhea, J., Crouch, M. L., Mocek, U. M., Kittell, P. E., Morgan, M. A., Nichols, W. S., Van Benschoten, M. M., Hardy, W. D., and Liu, G. Y. (2013). Isolation and characterization of antimicrobial compounds in plant extracts against multidrug-resistant Acinetobacter baumannii. PLoS One 8, e61594.
Moniruzzaman, M., Khalil, M. I., Sulaiman, S. A., and Gan, S. H. (2011). Advances in the Analytical Methods for Determining the Antioxidant Properties of Honey: A Review. African Journal of Traditional, Complementary and Alternative Medicines 9.
Moure, A., Cruz, J. M., Franco, D., Domínguez, J. M., Sineiro, J., Domínguez, H., José Núñez, M., and Parajó, J. C. (2001). Natural antioxidants from residual sources. Food Chemistry 72, 145-171.
Müller, L., Fröhlich, K., and Böhm, V. (2011). Comparative antioxidant activities of carotenoids measured by ferric reducing antioxidant power (FRAP), ABTS bleaching assay (αTEAC), DPPH assay and peroxyl radical scavenging assay. Food Chemistry 129, 139-148.
227
Munuswamy, H., Thirunavukkarasu, T., Rajamani, S., Elumalai, E. K., and Ernest, D. (2013). A review on antimicrobial efficacy of some traditional medicinal plants in Tamilnadu. Journal of Acute Disease 2, 99-105.
Muroi, H., Kubo, A., and Kubo, I. (1993). Antimicrobial activity of cashew apple flavor compounds. Journal of Agricultural and Food Chemistry 41, 1106-1109.
Nagori, K., Singh, M. K., Alexander, A., Kumar, T., Dewangan, D., Badwaik, H., and Tripathi, D. K. (2011). Piper betle L.: A review on its ethnobotany, phytochemistry, pharmacological profile and profiling by new hyphenated technique DART-MS (Direct Analysis in Real Time Mass Spectrometry). Journal of Pharmacy Research 4, 2991-2997.
Naidu, A., and Davidson, P. (2000). Phyto-phenols. In "Natural Food Antimicrobial Systems". CRC Press. Nathan, C. F., and Hibbs, J. B. (1991). Role of nitric oxide synthesis in macrophage antimicrobial activity.
Current Opinion in Immunology 3, 65-70. NCCLS (1991). "Antimicrobial susceptibility testing," 3rd. ed/Ed. National Committee for Clinical Laboratory
Standards, Villanova, Pa. Neffati, M., Sriti, J., Hamdaoui, G. t., Kchouk, M. E., and Marzouk, B. (2011). Salinity impact on fruit yield ,
essential oil composition and antioxidant activities of Coriandrum sativum fruit extracts. Food Chemistry 124, 221-225.
Negi, P. S. (2012). Plant extracts for the control of bacterial growth: efficacy, stability and safety issues for food application. Int J Food Microbiol 156, 7-17.
Negro, C., Tommasi, L., and Miceli, A. (2003). Phenolic compounds and antioxidant activity from red grape marc extracts. Bioresource Technology 87, 41-4.
Nehete, J., Bhatia, M., and Narkhede, M. (2010). In-vitro Evaluation of Antioxidant Activity and Phenolic Content of Costus speciosus (Koen) J.E. Sm. In "Iranian Journal of Pharmaceutical Research", Vol. 9, pp. 271-277.
Neu H. C., G. T. D. (1996). Antimicrobial Chemotherapy. In "Medical Microbiology. 4th edition" (B. S, ed.), Galveston (TX): University of Texas Medical Branch at Galveston.
Nicholson, R. L., and Hammerschmidt, R. (1992). Phenolic Compounds and Their Role in Disease Resistance. Annual Review of Phytopathology 30, 369-389.
Niki, E., and Noguchi, N. (2000). Evaluation of Antioxidant Capacity. What Capacity is being Measured by Which Method? IUBMB Life 50, 323-329.
Nimse, S. B., and Pal, D. (2015). Free radicals, natural antioxidants, and their reaction mechanisms. RSC Adv. 5, 27986-28006.
Nostro, A., Germanò, M. P., D’Angelo, V., Marino, A., and Cannatelli, M. A. (2000). Extraction methods and bioautography for evaluation of medicinal plant antimicrobial activity. Letters in Applied Microbiology 30, 379-384.
Nowakowska, Z. (2007). A review of anti-infective and anti-inflammatory chalcones. European Journal of Medicinal Chemistry 42, 125-137.
Odonovan, P. (2002). Irish consumer preference for organic meat. British food journal 104, 353. Oerlemans, K., Barrett, D. M., Suades, C. B., Verkerk, R., and Dekker, M. (2006). Thermal degradation of
glucosinolates in red cabbage. Food Chemistry 95, 19-29. Oh, M.-M., Carey, E. E., and Rajashekar, C. B. (2009). Environmental stresses induce health-promoting
phytochemicals in lettuce. Plant Physiology and Biochemistry 47, 578-583. Oliveira, I., Baptista, P., Malheiro, R., Casal, S., Bento, A., and Alberto, J. (2011). Influence of strawberry tree (
Arbutus unedo L .) fruit ripening stage on chemical composition and antioxidant activity. FRIN 44, 1401-1407.
Ortega-Ramirez, L. A., Rodriguez-Garcia, I., Leyva, J. M., Cruz-Valenzuela, M. R., Silva-Espinoza, B. A., Gonzalez-Aguilar, G. A., Siddiqui, W., and Ayala-Zavala, J. F. (2014). Potential of medicinal plants as antimicrobial and antioxidant agents in food industry: a hypothesis. J Food Sci 79, R129-37.
Ozsoy, N., Can, A., Yanardag, R., and Akev, N. (2008). Antioxidant activity of Smilax excelsa L. leaf extracts. Food Chemistry 110, 571-583.
Paaver, U., Matto, V., and Raal, A. (2010). Total tannin content in distinct Quercus robur L. galls. JOURNAL OF MEDICINAL PLANTS RESEARCH 4, 702-705.
228
Palafox-carlos, H., Yahia, E., Islas-osuna, M. A., Gutierrez-martinez, P., and Robles-sánchez, M. (2012). Scientia Horticulturae Effect of ripeness stage of mango fruit ( Mangifera indica L ., cv . Ataulfo ) on physiological parameters and antioxidant activity. Scientia Horticulturae 135, 7-13.
Pandey, K. B., and Rizvi, S. I. (2009). Plant polyphenols as dietary antioxidants in human health and disease. Oxidative Medicine and Cellular Longevity 2, 270-278.
Passone, M. A., Resnik, S., and Etcheverry, M. G. (2008). The potential of food grade antioxidants in the control of Aspergillus section Flavi, interrelated mycoflora and aflatoxin B1 accumulation on peanut grains. Food Control 19, 364-371.
Patel, R. P., McAndrew, J., Sellak, H., White, C. R., Jo, H., Freeman, B. A., and Darley-Usmar, V. M. (1999). Biological aspects of reactive nitrogen species. Biochimica et Biophysica Acta (BBA) - Bioenergetics 1411, 385-400.
Pereira, A. P., Ferreira, I. C., Marcelino, F., Valentão, P., Andrade, P. B., Seabra, R., Estevinho, L., Bento, A., and Pereira, J. A. (2007a). Phenolic compounds and antimicrobial activity of olive (Olea europaea L. Cv. Cobrançosa) leaves. Molecules 12, 1153-1162.
Pereira, A. P., Ferreira, I. C. F. R., Marcelino, F., Valentão, P., Andrade, P. B., Seabra, R., Estevinho, L., Bento, A., and Pereira, J. A. (2007b). Phenolic compounds and antimicrobial activity of olive (Olea europaea L. Cv. Cobrançosa) leaves. Molecules (Basel, Switzerland) 12, 1153-62.
Pereira, J. A., Pereira, A. P. G., Ferreira, I. C. F. R., Valentão, P. c., Andrade, P. B., Seabra, R., Estevinho, L. c., and Bento, A. (2006). Table olives from Portugal: phenolic compounds, antioxidant potential, and antimicrobial activity. Journal of Agricultural and Food Chemistry 54, 8425-31.
Perry, C. C., Weatherly, M., Beale, T., and Randriamahefa, A. (2009). Atomic force microscopy study of the antimicrobial activity of aqueous garlic versus ampicillin against Escherichia coli and Staphylococcus aureus. Journal of the Science of Food and Agriculture 89, 958-964.
Peschel, W., Sánchez-Rabaneda, F., Diekmann, W., Plescher, A., Gartzía, I., Jiménez, D., Lamuela-Raventós, R., Buxaderas, S., and Codina, C. (2006). An industrial approach in the search of natural antioxidants from vegetable and fruit wastes. Food Chemistry 97, 137-150.
Philip, M. (2004). The use of the stable free radical diphenylpicrylhydrazyl (DPPH) for estimating antioxidant. Songklanakarin Journal of Science and Technology 26, 211-219.
Plaza, M., Abrahamsson, V., and Turner, C. (2013). Extraction and Neoformation of Antioxidant Compounds by Pressurized Hot Water Extraction from Apple Byproducts. Journal of Agricultural and Food Chemistry 61, 5500-5510.
Posmyk, M. M., Kontek, R., and Janas, K. M. (2009). Antioxidant enzymes activity and phenolic compounds content in red cabbage seedlings exposed to copper stress. Ecotoxicol Environ Saf. 2009 Feb;72(2):596-602. doi: 10.1016/j.ecoenv.2008.04.024. Epub 2008 Sep 17.
Pothitirat, W., and Traidej, M. (2009). Fitoterapia Comparison of bioactive compounds content , free radical scavenging and anti-acne inducing bacteria activities of extracts from the mangosteen fruit rind at two stages of maturity. Fitoterapia 80, 442-447.
Prakash, B., Shukla, R., Singh, P., Kumar, A., Mishra, P. K., and Dubey, N. K. (2010). Efficacy of chemically characterized Piper betle L. essential oil against fungal and aflatoxin contamination of some edible commodities and its antioxidant activity. Int J Food Microbiol 142, 114-9.
Prakash, D., Singh, B. N., and Upadhyay, G. (2007). Food Chemistry Antioxidant and free radical scavenging activities of phenols from onion ( Allium cepa ). Food Chemistry 102, 1389-1393.
Premanath, R., J. Sudisha, N.L. Devi and S.M. Aradhya (2011). Antibacterial and anti-oxidant activities of fenugreek (Trigonella foenum graecum L.) leaves. Vol. 5, pp. 695-705. Res. J. Med. Plant.
Price, M. L., and Butler, L. G. (1977). Rapid visual estimation and spectrophotometric determination of tannin content of sorghum grain. Journal of Agricultural and Food Chemistry 25, 1268-1273.
Prior, R. L., Wu, X., and Schaich, K. (2005). Standardized Methods for the Determination of Antioxidant Capacity and Phenolics in Foods and Dietary Supplements. Journal of Agricultural and Food Chemistry 53, 4290-4302.
Proestos, C., Chorianopoulos, N., Nychas, G. J. E., and Komaitis, M. (2005). RP-HPLC analysis of the phenolic compounds of plant extracts. investigation of their antioxidant capacity and antimicrobial activity. Journal of Agricultural and Food Chemistry 53, 1190-5.
229
Puglia, C. D., and Powell, S. R. (1984). Inhibition of cellular antioxidants: a possible mechanism of toxic cell injury. Environmental Health Perspectives 57, 307-311.
Putnam, A. R., Heisey, R.M. (1983). Allelopathy chemical interaction between plants. What’s New in Plant Physiology 14, 21-24.
Puupponen‐Pimiä, R., Nohynek, L., Meier, C., Kähkönen, M., Heinonen, M., Hopia, A., and Oksman‐Caldentey, K. M. (2001). Antimicrobial properties of phenolic compounds from berries. Journal of applied microbiology 90, 494-507.
Quideau, S., Deffieux, D., Douat-Casassus, C., and Pouységu, L. (2011). Plant Polyphenols: Chemical Properties, Biological Activities, and Synthesis. Angewandte Chemie International Edition 50, 586-621.
Rahman, K. (2007). Studies on free radicals, antioxidants, and co-factors. Clinical Interventions in Aging 2, 219-236.
Ramirez, P., Santoyo, S., Garcia-Risco, M. R., Senorans, F. J., Ibanez, E., and Reglero, G. (2007). Use of specially designed columns for antioxidants and antimicrobials enrichment by preparative supercritical fluid chromatography. Journal of Chromatography A 1143, 234-242.
Ramos, F. A. (2006). Antibacterial and antioxidant activities of quercetin oxidation products from yellow onion (Allium cepa) skin. Journal of agricultural and food chemistry 54, 3551.
Ramos, F. A., Takaishi, Y., Shirotori, M., Kawaguchi, Y., Tsuchiya, K., Shibata, H., Higuti, T., Tadokoro, T., and Takeuchi, M. (2005). Antibacterial and Antioxidant Activities of Quercetin Oxidation Products from Yellow Onion (Allium cepa) Skin. Journal of Agricultural and Food Chemistry 54, 3551-3557.
Rangan, C., and Barceloux, D. G. (2009). Food additives and sensitivities. Dis Mon 55, 292-311. Rathee, J. S., Patro, B. S., Mula, S., Gamre, S., and Chattopadhyay, S. (2006). Antioxidant Activity of Piper
betel Leaf Extract and Its Constituents. Journal of Agricultural and Food Chemistry 54, 9046-9054. Rather, M. A., Dar, B. A., Dar, M. Y., Wani, B. A., Shah, W. A., Bhat, B. A., Ganai, B. A., Bhat, K. A., Anand, R.,
and Qurishi, M. A. (2012). Chemical composition, antioxidant and antibacterial activities of the leaf essential oil of Juglans regia L. and its constituents. Phytomedicine 19, 1185-90.
Rauha, J.-P., Remes, S., Heinonen, M., Hopia, A., Kähkönen, M., Kujala, T., Pihlaja, K., Vuorela, H., and Vuorela, P. (2000). Antimicrobial effects of Finnish plant extracts containing flavonoids and other phenolic compounds. International Journal of Food Microbiology 56, 3-12.
Rauha, J. P. (2000). Antimicrobial effects of Finnish plant extracts containing flavonoids and other phenolic compounds. International journal of food microbiology 56, 3.
Reygaert, W. C. (2014). The antimicrobial possibilities of green tea. Front Microbiol 5, 434. Rice-Evans, C., Miller, N., and Paganga, G. (1997). Antioxidant properties of phenolic compounds. Trends in
Plant Science 2, 152-159. Rice, E. L. (1984). "Allelopathy," Harcourt Brace Jovanich publishers. Riihinen, K., Jaakola, L., Kärenlampi, S., and Hohtola, A. (2008). Organ-specific distribution of phenolic
compounds in bilberry (Vaccinium myrtillus) and ‘northblue’ blueberry (Vaccinium corymbosum x V. angustifolium). Food Chemistry 110, 156-160.
Rodriguez-Burruezo, A., Gonzalez-Mas Mdel, C., and Nuez, F. (2010). Carotenoid composition and vitamin A value in aji (Capsicum baccatum L.) and rocoto (C. pubescens R. & P.), 2 pepper species from the Andean region. J Food Sci 75, S446-53.
Romani, A., Vignolini, P., Galardi, C., Aroldi, C., Vazzana, C., and Heimler, D. (2003). Polyphenolic Content in Different Plant Parts of Soy Cultivars Grown under Natural Conditions. Journal of Agricultural and Food Chemistry 51, 5301-5306.
Rosenfeld, H. J., Samuelsen, R. T., and Lea, P. (1998). The effect of temperature on sensory quality, chemical composition and growth of carrots (Daucus carota L.) I. Constant diurnal temperature. Journal of Horticultural Science and Biotechnology 73.
Santana-Méridas, O., González-Coloma, A., and Sánchez-Vioque, R. (2012). Agricultural residues as a source of bioactive natural products. Phytochemistry Reviews 11, 447-466.
SantiestebanLópez, A. (2007). Susceptibility of food borne bacteria to binary combinations of antimicrobials at selected aw and pH. Journal of applied microbiology 102, 486.
Sato, F. (2003). "Secondary metabolites and biotechnology in plants," Science Publishers Inc, Enfield. Scalbert, A. (1991). Antimicrobial properties of tannins. Phytochemistry 30, 3875-3883.
230
Schaller, A., and Ryan, C. A. (1996). Systemin--a polypeptide defense signal in plants. Bioessays 18, 27-33. Schieber, A., Hilt, P., Streker, P., Endreß, H.-U., Rentschler, C., and Carle, R. (2003). A new process for the
combined recovery of pectin and phenolic compounds from apple pomace. Innovative Food Science & Emerging Technologies 4, 99-107.
Schreiner, M. (2005). Vegetable crop management strategies to increase the quantity of phytochemicals. European Journal of Nutrition 44, 85-94.
Seigler, D. S. (1998). "Plant Secondary metabolism," Kluwer Academic Publishers. Sen, S., De, B., Devanna, N., and Chakraborty, R. (2013). Total phenolic, total flavonoid content, and
antioxidant capacity of the leaves ofMeyna spinosaRoxb., an Indian medicinal plant. Chinese Journal of Natural Medicines 11, 149-157.
Seydim, A. C., and Sarikus, G. (2006). Antimicrobial activity of whey protein based edible films incorporated with oregano , rosemary and garlic essential oils. Vacuum 39, 639-644.
Shahidi, F. (1997). "Natural antioxidants : chemistry, health effects, and applications," AOCS Press, Champaign, Ill.
Shahidi, F., and Zhong, Y. (2007). Measurement of Antioxidant Activity in Food and Biological Systems. 956, 36-66.
Shahidi, F., and Zhong, Y. (2010). Lipid oxidation and improving the oxidative stability. Chemical Society Reviews 39, 4067-4079.
Sharma, O. P., and Bhat, T. K. (2009). DPPH antioxidant assay revisited. Food Chemistry 113, 1202-1205. Sharma, S. K., and Singh, A. P. (2012). In vitro antioxidant and free radical scavenging activity of
Nardostachys jatamansi DC. J Acupunct Meridian Stud 5, 112-8. Shewfelt, R. L., and Brückner, B. (2000). "Fruit and Vegetable Quality: An Integrated Viewgy," CRC Press. Shi, B., Liu, W., Wei, S. P., and Wu, W. J. (2010). Chemical composition, antibacterial and antioxidant activity
of the essential oil of Bupleurum longiradiatum. Nat Prod Commun 5, 1139-42. Siddhuraju, P., Mohan, P. S., and Becker, K. (2002). Studies on the antioxidant activity of Indian Laburnum
(Cassia fistula L.): a preliminary assessment of crude extracts from stem bark, leaves, flowers and fruit pulp. Food Chemistry 79, 61-67.
Siemens, D. H., Garner, S. H., Mitchell-Olds, T., and Callaway, R. M. (2002). Cost of defense in the context of plant competition: Brassica rapa may grow and defend. Ecology 83, 505-517.
Sies, H. (1997). Oxidative stress: oxidants and antioxidants. Experimental Physiology 82, 291-295. Sikkema, J. (1995). Mechanisms of membrane toxicity of hydrocarbons. Microbiology and molecular biology
reviews 59, 201. Silva, B. A., Ferreres, F., Malva, J. O., and Dias, A. C. P. (2005). Phytochemical and antioxidant
characterization of Hypericum perforatum alcoholic extracts. Food Chemistry 90, 157-167. Silva, L. M. R. d., Figueiredo, E. A. T. d., Ricardo, N. M. P. S., Vieira, I. G. P., Figueiredo, R. W. d., Brasil, I. M.,
and Gomes, C. L. (2014). Quantification of bioactive compounds in pulps and by-products of tropical fruits from Brazil. Food Chemistry 143, 398-404.
Simoes, M., Bennett, R. N., and Rosa, E. A. (2009). Understanding antimicrobial activities of phytochemicals against multidrug resistant bacteria and biofilms. Nat Prod Rep 26, 746-57.
Slavin, J. L., and Lloyd, B. (2012). Health benefits of fruits and vegetables. Adv Nutr 3, 506-16. Sreevidya, N., and Mehrotra, S. (2003). Spectrophotometric method for estimation of alkaloids precipitable
with Dragendorff's reagent in plant materials. Journal of AOAC International 86, 1124. Staunton, J., and Weissman, K. J. (2001). Polyketide biosynthesis: A millennium review. Natural Product
Reports 18, 380-416. Stavri, M., Piddock, L. J. V., and Gibbons, S. (2007). Bacterial efflux pump inhibitors from natural sources.
Journal of Antimicrobial Chemotherapy 59, 1247-1260. Stern, J. L. (1996). Phlorotannin-protein interactions. Journal of chemical ecology 22, 1877. Suja, K. P., Jayalekshmy, A., and Arumughan, C. (2004). Free radical scavenging behavior of antioxidant
compounds of sesame (sesamum indicum L.) in DPPH(*) system. Journal of agricultural and food chemistry 52, 912.
Sun, B., Ricardo-da-Silva, J. M., and Spranger, I. (1998). Critical Factors of Vanillin Assay for Catechins and Proanthocyanidins. Journal of Agricultural and Food Chemistry 46, 4267-4274.

231
Taga, I., Lan, C. Q., and Altosaar, I. (2012). Plant essential oils and mastitis disease: their potential inhibitory effects on pro-inflammatory cytokine production in response to bacteria related inflammation. Nat Prod Commun 7, 675-82.
Taghvaei, M., and Jafari, S. M. (2015). Application and stability of natural antioxidants in edible oils in order to substitute synthetic additives. Journal of Food Science and Technology 52, 1272-1282.
Taiz, L., and Zeiger, E. (2002). "Plant physiology," Third/Ed. Sinaeur Associates, Inc.,. Tajkarimi, M. M., Ibrahim, S. A., and Cliver, D. O. (2010). Antimicrobial herb and spice compounds in food.
Food Control 21, 1199-1218. Taylor, P. W. (2013). Alternative natural sources for a new generation of antibacterial agents. Int J
Antimicrob Agents 42, 195-201. Taylor, P. W., Hamilton-Miller, J. M. T., and Stapleton, P. D. (2005). Antimicrobial properties of green tea
catechins. Food science and technology bulletin 2, 71-81. Temple, N. J., and Kaiser Gladwin, K. (2003). Fruit, vegetables, and the prevention of cancer: Research
challenges. Nutrition 19, 467-470. Tiwari, B. K., Valdramidis, V. P., O'Donnell, C. P., Muthukumarappan, K., Bourke, P., and Cullen, P. J. (2009).
Application of natural antimicrobials for food preservation. J Agric Food Chem 57, 5987-6000. Ulrichova, J., and Strnad, M. (2008). Food Chemistry Phenolic acid contents of kale ( Brassica oleraceae L .
var . acephala DC .) extracts and their antioxidant and antibacterial activities. Food Chemistry 107, 19-25.
UNIDO (2007). Industrial biotechnology and biomass utilization. Prospects and challenges for the developing world. United Nations Industrial Development Organization, Vienna.
Van Boekel, M. A. J. S. (2008). Kinetic Modeling of Food Quality: A Critical Review. Comprehensive Reviews in Food Science and Food Safety 7, 144-158.
Van Dyk, J. S., Gama, R., Morrison, D., Swart, S., and Pletschke, B. I. (2013). Food processing waste: Problems, current management and prospects for utilisation of the lignocellulose component through enzyme synergistic degradation. Renewable and Sustainable Energy Reviews 26, 521-531.
Vanholme, R., Demedts, B., Morreel, K., Ralph, J., and Boerjan, W. (2010). Lignin Biosynthesis and Structure. Plant Physiology 153, 895-905.
Vattem, D. A., Lin, Y., Labbe, R. G., and Shetty, K. (2004). Phenolic antioxidant mobilization in cranberry pomace by solid-state bioprocessing using food grade fungus Lentinus edodes and effect on antimicrobial activity against select food borne pathogens. Science 5, 81-91.
Vegara, S., Funes, L., MartÃ, N., Saura, D., Micol, V., and Valero, M. (2011). Bactericidal activities against pathogenic bacteria by selected constituents of plant extracts in carrot broth. Food Chemistry 128, 872-877.
Vegara, S., Funes, L., MartÃ, N., Saura, D., Micol, V., and Valero, M. Bactericidal activities against pathogenic bacteria by selected constituents of plant extracts in carrot broth. Food Chemistry 128, 872-877.
Vergara-Salinas, J. R., Bulnes, P., Zúñiga, M. C., Pérez-Jiménez, J., Torres, J. L., Mateos-Martín, M. L., Agosin, E., and Pérez-Correa, J. R. (2013). Effect of Pressurized Hot Water Extraction on Antioxidants from Grape Pomace before and after Enological Fermentation. Journal of Agricultural and Food Chemistry 61, 6929-6936.
Visioli, F., and Galli, C. (2001). Phenolics from Olive Oil and Its Waste Products. 88, 233-237. Wanasundara, U. N., and Shahidi, F. (1998). Antioxidant and pro-oxidant activity of green tea extracts in
marine oils. Food Chemistry 63, 335-342. Wang, B., Deng, J., Gao, Y., Zhu, L., He, R., and Xu, Y. (2011). The screening toolbox of bioactive substances
from natural products: a review. Fitoterapia 82, 1141-51. Wang, S. Y., Chen, C.-t., and Yin, J.-j. (2010). Effect of allyl isothiocyanate on antioxidants and fruit decay of
blueberries. Food Chemistry 120, 199-204. Wessels, J. G. H. (1996). Fungal hydrophobins: proteins that function at an interface. Trends in Plant Science
1, 9-15. Wiegand, I., Hilpert, K., and Hancock, R. E. W. (2008). Agar and broth dilution methods to determine the
minimal inhibitory concentration (MIC) of antimicrobial substances. Nat. Protocols 3, 163-175. Wijngaard, H. H. (2009). A survey of Irish fruit and vegetable waste and by-products as a source of
polyphenolic antioxidants. Food chemistry 116, 202.

232
Wijngaard, H. H., Rößle, C., and Brunton, N. (2009). A survey of Irish fruit and vegetable waste and by-products as a source of polyphenolic antioxidants. Food Chemistry 116, 202-207.
Wink, M. (2013). Evolution of secondary metabolites in legumes (Fabaceae). South African Journal of Botany 89, 164-175.
Wolfe, K. L., and Liu, R. H. (2003). Apple Peels as a Value-Added Food Ingredient. Journal of Agricultural and Food Chemistry 51, 1676-1683.
Worthington, R. J., and Melander, C. (2013). Combination Approaches to Combat Multi-Drug Resistant Bacteria. Trends in biotechnology 31, 177-184.
Xu, G., Chen, J., Liu, D., Zhang, Y., Jiang, P., and Ye, X. (2008). Minerals, phenolic compounds, and antioxidant capacity of citrus peel extract by hot water. Journal of food science 73, C11-C18.
Yai, H. Antioxidant and antimicrobial activities of crude extracts from mangosteen ( Garcinia mangostana L .) parts and some essential oils. Food Chemistry 589, 583-589.
Yai, H. (2010). Antioxidant and antimicrobial activities of crude extracts from mangosteen ( Garcinia mangostana L .) parts and some essential oils. Food Chemistry 589, 583-589.
Yang, S.-M., Shim, G. Y., Kim, B.-G., and Ahn, J.-H. (2015). Biological synthesis of coumarins in Escherichia coli. Microbial Cell Factories 14, 1-12.
Yanishlieva, N., Gordon, M., and Pokorný, J. (2001). "Antioxidants in food : practical applications," CRC, Boca Raton.
Yeung, R. M. W. (2001). Consumer perception of food risk in chicken meat. Nutrition & food science 31, 270. Yuan, H., Yao, S., You, Y., Xiao, G., and You, Q. (2010). Antioxidant Activity of Isothiocyanate Extracts from
Broccoli. Chinese Journal of Chemical Engineering 18, 312-321. Zhang, L., Li, J., Hogan, S., Chung, H., Welbaum, G. E., and Zhou, K. (2010). Inhibitory effect of raspberries on
starch digestive enzyme and their antioxidant properties and phenolic composition. Food Chemistry 119, 592-599.
Zhishen, J., Mengcheng, T., and Jianming, W. (1999). The determination of flavonoid contents in mulberry and their scavenging effects on superoxide radicals. Food Chemistry 64, 555-559.
Zhu, L., Gunn, C., and Beckman, J. S. (1992). Bactericidal activity of peroxynitrite. Archives of Biochemistry and Biophysics 298, 452-457.

233
ANNEXES

234
Annexe 1. Yields of extracts from plant materials (Chapter 1)
No. Plant material Yield
(g dry matter/100g FW)
1 Alpha-alpha sprouts 2.1
2 Anise leaf 3.6
3 Apple 3.9
4 Artichoke base 3.4
5 Artichoke petal 2.5
6 Asparagus 2.8
7 Avocado 3.4
8 Banana peel 3.9
9 Beet root UV-C treated 6.5
10 Beetroot 6.2
11 Beetroot leaf 3.4
12 Betel leaf 1.7
13 Bitter gourd 2.8
14 Bitter melon peel 4.8
15 Black currant fruit 4.8
16 Black currant leaf 4.2
17 Black currant residue 6.1
18 Black figs 5.8
19 Black grape 37.1
20 Black radish 5.1
21 Black radish purple 12.1
22 Blueberry fruit 5.2
23 Blueberry leaf 10.2
24 Blueberry UV-C treated 6.8
25 Bok Choy 7.1
26 Broccoli leaf 6.3
27 Broccoli florets 5.3
28 Brussel sprouts 19.0
29 Cabbage 7.9
30 Cactus peel 5.6
31 Cantaloupe peel 6.2
32 Cape gooseberry 9.2
33 Carrot 7.0
34 Carrot leaf 4.8
35 Carrot peel 6.8
36 Carrot UV-C treated 7.0

235
Annexe 1. Yields of extracts from plant materials (Chapter 1) (continued)
No. Plant material Yield
(g dry matter/100g FW)
37 Celery 24.7
38 Celery root (Rave) 4.7
39 Celery UV-C treated 24.5
40 Celery oriental 11.5
41 Cherry 12.9
42 Chicory lettuce 3.5
43 Chinese lychi 7.8
44 Coriander 3.7
45 Cranberry fruit 1.3
46 Cranberry leaf 13.1
47 Cress 17.6
48 Cucumber 4.2
49 Cucumber (Canada) 5.2
50 Curry leaf 6.4
51 Custard apple 17.1
52 Dandelion salad 6.8
53 Dandelion 7.8
54 Dandelion root 28.4
55 Dandelion root UV-C treated 25.8
56 Date 32.9
57 Dill 3.6
58 Drum sticks 4.3
59 Endive 6.2
60 Fenugreek leaf 2.9
61 Curly lectuce (Frisse) 2.1
62 Gac fruit peel 3.4
63 Gac fruit (purple) 6.7
64 Grape leaf 3.8
65 Green almond 4.2
66 Green grape 35.5
67 Green pepper 16.7
68 Hops 5.8
69 Horse radish 7.2
70 Indian summer fruit 2.5
71 Indian summer leaf 12.9
72 Italia green pepper 2.2
73 Ivy Gourd 5.6
74 Jewish Mallow 2.5

236
Annexe 1. Yields of extracts from plant materials (Chapter 1) (continued)
No. Plant material Yield
(g dry matter/100g FW)
75 Kantula 2.1
76 Kiwi peel 5.3
77 Kohlrabi 6.5
78 Leafy Kale 3.2
79 Leek 13.1
80 Lemon 3.9
81 Lemon (albido) 5.1
82 Lemon (flavido) 4.8
83 Lime 18
84 Mango 4.2
85 Mangosteen 8.7
86 Molasses- Date 80.1
87 Molasses-Carob 77.7
88 Nicoise 1.1
89 Noni juice 5.4
90 Orange 7.2
91 Orange (albido) 21.9
92 Orange (flavido) 25
93 Oregano 5.6
94 Parsley leaf 4.1
95 Parsnip 2.1
96 Parsnip leaf 6.6
97 Parsnip peel 1.8
98 Pineapple peel 6.1
99 Pineapple leaf 6.7
100 Piper lolot 3.9
101 Pomegranate UV-C treated 10.3
102 Pomelo 5.4
103 Pomegranate 7.2
104 Potato leaf 6.5
105 Potato (mature) 4.6
106 Potato peel 6.0
107 Pumpkin 5.3
108 Radish leaf 2.1
109 Radish peal 3.2
110 Radish purle 12.3
111 Rainbow chard 2.8
112 Rambutan 7.3
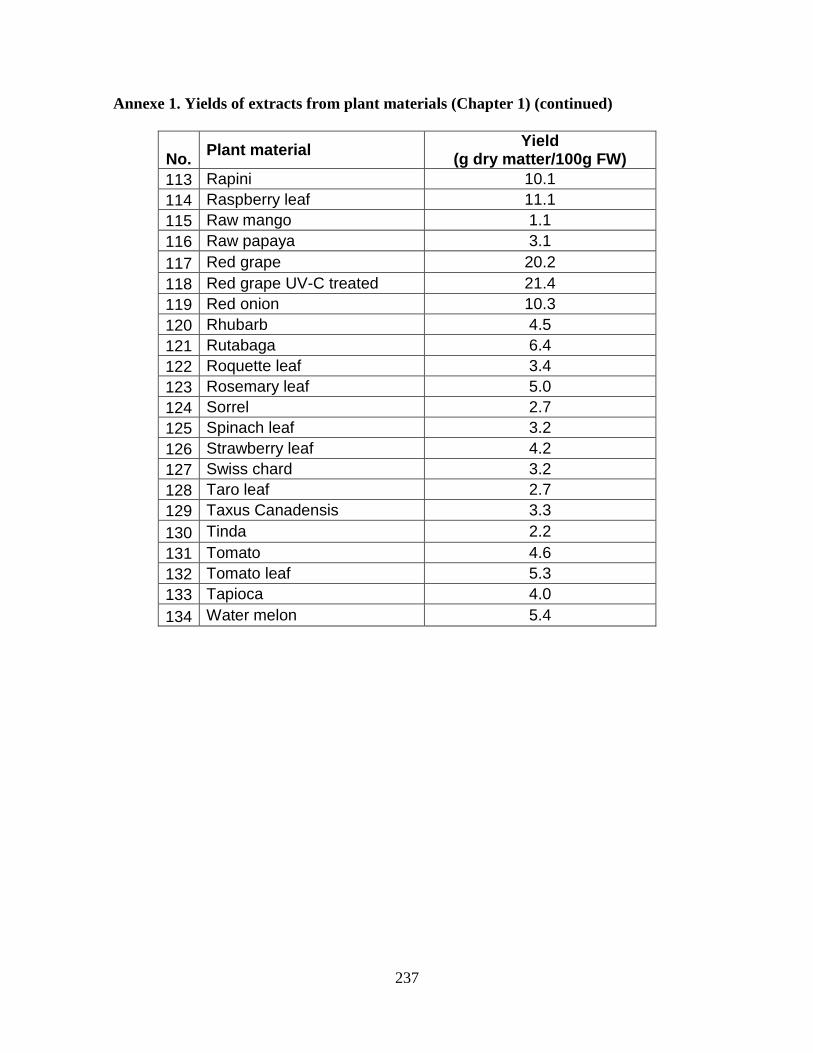
237
Annexe 1. Yields of extracts from plant materials (Chapter 1) (continued)
No. Plant material Yield
(g dry matter/100g FW)
113 Rapini 10.1
114 Raspberry leaf 11.1
115 Raw mango 1.1
116 Raw papaya 3.1
117 Red grape 20.2
118 Red grape UV-C treated 21.4
119 Red onion 10.3
120 Rhubarb 4.5
121 Rutabaga 6.4
122 Roquette leaf 3.4
123 Rosemary leaf 5.0
124 Sorrel 2.7
125 Spinach leaf 3.2
126 Strawberry leaf 4.2
127 Swiss chard 3.2
128 Taro leaf 2.7
129 Taxus Canadensis 3.3
130 Tinda 2.2
131 Tomato 4.6
132 Tomato leaf 5.3
133 Tapioca 4.0
134 Water melon 5.4

238
Annexe 2. Numerical data for figures in Chapter 6
Table A.6.1 Total phytochemical content antioxidant-antimicrobial activities of
pomegranate (for Figure 6.1)
Class of
compound (mg/g dry sample)
Fraction
Hex HE-AE AC-AC ME-ET ME-H2O H2O HH2O
Total polyphenolics 181.82 ± 21.77 216.59 ± 37.64 612.02 ± 87.84 649.18 ± 94.41 726.86 ± 49.29 660.02 ± 54.14 812.03 ± 83.76
Flavonoids 2.11±0.29 2.07±0.05 2.66±0.32 2.79±0.55 2.72±0.54 2.47±0.42 3.39±1.77
Tannins 74.81±2.15 54.02±3.12 136.49±5.14 32.71±2.47 26.38±1.25 24.49±0.98 24.01±1.58
Proanthocyanidins 17.52±7.87 7.88±0.99 46.21±8.94 15.47±2.21 12.95±2.81 10.1±2.79 12.16±3.98
Alkaloids 0.78 ± 0.05 0.55 ± 0.01 5.12 ± 0.13 0.22 ± 0.02 0.52 ± 0.03 0.99 ± 0.06 2.35 ± 0.09
Terpenoids 4.31 ± 0.12 11.05 ± 0.96 0.12 ± 0.00 1.34 ± 0.04 0.29 ± 0.00 0.76 ± 0.01 0.89 ± 0.04
Total yield (%) 7.47±0.13 7.08±0.08 8.81±0.1 35.51±0.64 45.22±1.97 29.81±2.21 52.11±2.83
Table A.6.2 Total phytochemical content antimicrobial antioxidant activity of black currant
residue
Class of compound
(mg/g dry sample)
Fraction
Hex HE-AE AC-AC ME-ET ME-H2O H2O HH2O
Total polyphenolics 84.94 ± 16.20 72.24 ± 13.38 86.82 ± 1.69 250.82 ± 13.30 375.76 ± 8.85 248.08 ± 13.20 445.88 ± 36.57
Flavonoids 44.52±4.18 28.88±3.49 96.2±8.35 128.6±8.57 260.36±12.27 170.16±12.6 175.04±12.53
Tannins 15.95±2 26.32±1.03 53.37±4.01 163.09±7.65 234.35±9.62 169.02±11.68 279.09±22.65
Proanthocyanidins 28.17±9.67 33.58±4.59 31.08±3.44 123.17±11.67 171.08±21.36 105.67±12.69 159.83±12.36
Alkaloids 1.23 0.78 0.11 0.23 0 0.13 0.58
Terpenoids 0.45 0.22 0.23 0 0 0 0.12
Total yield (%) 6.68±0.26 7.29±0.37 9.89±0.55 24.57±0.6 26.17±0.74 24.57±1.26 32.53±1.19
Table A.6.3 Total phytochemical content antimicrobial antioxidant activity of betel leaf
Class of compound
(mg/g dry sample)
Fraction
Hex HE-AE AC-AC ME-ET ME-H2O H2O HH2O
Total polyphenolics 50.65 ± 5.52 67.85 ± 8.47 153.97 ± 20.19 228.26 ± 19.93 262.32 ± 13.68 138.56 ± 15.01 178.51 ± 16.44
Flavonoids 10.71±4.98 10.21±3.18 14.29±8.44 16.52±3.94 18.6±0.69 7.79±1.06 11.36±3
Tannins 38.55±3.25 45.06±2.89 100.48±5.98 100.3±4.32 136.4±4.58 58.76±7.12 103.93±5.01
Proanthocyanidins 5.48±1.64 5.06±1.57 11.94±1.99 6.52±0.79 6.73±2.01 5.72±3.51 6.97±3.85
Alkaloids 36.56 ± 1.34 23.21 ± 0.98 29.45 ± 2.88 11.34 ± 0.56 10.99 ± 0.34 2.99 ± 0.11 3.23 ± 0.39
Terpenoids 83.45 ± 2.11 80.1 ± 4.32 35.66 ± 1.23 27.64 ± 2.01 17.61 ± 0.33 3.02 ± 0.12 5.64 ± 0.67
Total yield (%) 14.29±0.76 16.23±0.39 13.88±0.25 19.28±0.55 27.37±1.66 29.44±0.41 46.97±2.01

239
Table A.6.4 Antioxidant (AO)-antimicrobial (AM) activity of extracts (for Figures 6.2-6.4)
Sample
Activity
Fraction
Hex HE-AE AC-AC ME-ET ME-H2O H2O HH2O
Pomegranate
AO 67.1±2.21 64.54±4.02 74.05±1.56 73.04±2.14 72.89±1.98 74.05±3.7 71.02±4.15
AM 73.96±2.7 68.45±1.42 85.03±4.56 75.7±4.58 71.1±4.35 68.52±2.43 56.66±3.21
Black currant
residue
AO 23.73±1.18 22.35±2.54 58.76±4.73 72.12±1.93 74.42±5.67 76.73±3.4 74.65±3.28
AM 45.69±2.1 50.51±3.6 60.84±1.53 65.35±2.02 73.96±3.08 63.19±1.63 67.07±3.79
Betel leaf
AO 71.44±3.96 70.74±2.54 72.2±4.61 73.76±5.73 74.86±1.74 70.75±3.63 69.56±2.22
AM 79.96±2.7 82.94±2.9 73.33±4.67 67.83±1.39 77.92±5.15 66.64±4.33 69.6±5.48
Table A.6.5 Antibacterial activity against E.coli with varying proportions blends of plant
extracts at total concentration of 5.0 mg/Ml (for Figure 6.5)
Extract (1) Extract (2) Composition, extract (1), (w/w)
Inhibition (%)
Pomegranate Black currant
0.0 76.02
0.25 49.23
0.50 67.04
0.75 95.69
1.00 90.95
Betel leaf Black currant
0.0 79.5
0.25 88.81
0.50 100
0.75 100
1.00 86.82
Pomegranate Betel leaf
0.0 95.81
0.25 87.32
0.50 87.15
0.75 86.45
1.00 93.26
Green tea Cashew
0.0 47.67
0.25 55.78
0.50 82.39
0.75 86.34
1.00 56.24

240
Table A.6.6 Antibacterial activity against B. subtilis with varying proportions blends of
plant extracts at total concentration of 5.0 mg/mL (for Figure 6.6)
Extract (1) Extract (2) Composition, extract (1) % v/v
Inhibition (%)
Pomegrenate Betel leaf
0.0 86.22
0.25 84.73
0.50 87.58
0.75 81.34
1.00 88.43
Green tea Cashew
0.0 30.45
0.25 55.59
0.50 90.02
0.75 87.98
1.00 45.67
Table A.6.7 The MIC against E coli of the mixing of 2 plant extracts and 2 solutions (for
Figure 6.7)
Plant extract Plant compound Composition, Plant extract, % w/w
MIC
Black currant Methyl glyoxal
0.0 1.25
0.25 1.25
0.50 2.5
0.75 2.5
1.00 10
Black currant Mono-caprin
0.0 1.25
0.25 5
0.50 5
0.75 10
1.00 10
Pomegranate Methyl glyoxal
0.0 1.25
0.25 2.5
0.50 2.5
0.75 5
1.00 5
Pomegranate Mono-caprin
0.0 1.25
0.25 5
0.50 5
0.75 5
1.00 5
Copyright © 2022 FDOKUMEN