A Computational Approach to Understand Arabidopsis thaliana and Soybean Resistance to Fusarium...
9
Department of Computer Science Publications Southern Illinois University Carbondale Year A Computational Approach to Understand Arabidopsis thaliana and Soybean Resistance to Fusarium solani (Fsg) Jiazheng Yuan * Mengxia Zhu † M. Javed Iqball ‡ Jack Y. Yang ** David A. Lightfoot †† * Southern Illinois University Carbondale † Southern Illinois University Carbondale, [email protected] ‡ Southern Illinois University Carbondale ** Harvard University †† Southern Illinois University Carbondale, [email protected] Published in Yuan, J., Zhu, M., Iqbal, M. J., Yang, J. Y., Lightfoot, D. A. (2007). A com- putational approach to understand Arabidopsis thaliana and soybean resistance to Fusarium solani (Fsg). Proceedings of the 7th IEEE International Conference on Bioinformatics and Bioengineering, 2007. BIBE 2007, 585 - 592. doi: 10.1109/BIBE.2007.4375620 2007 IEEE. Personal use of this material is permitted. However, permission to reprint/republish this ma- terial for advertising or promotional purposes or for creating new collective works for resale or redistribution to servers or lists, or to reuse any copyrighted component of this work in other works must be obtained from the IEEE. This material is presented to ensure timely dissemination of scholarly and technical work. Copyright and all rights therein are retained by authors or by other copyright holders. All persons copying this information are expected to adhere to the terms and constraints invoked by each author’s copyright. In most cases, these works may not be reposted without the explicit permission of the copyright holder. This paper is posted at OpenSIUC. http://opensiuc.lib.siu.edu/cs pubs/8
-
Upload
independent -
Category
Documents
-
view
3 -
download
0
Transcript of A Computational Approach to Understand Arabidopsis thaliana and Soybean Resistance to Fusarium...
Department of Computer Science
Publications
Southern Illinois University Carbondale Year
A Computational Approach to
Understand Arabidopsis thaliana and
Soybean Resistance to Fusarium solani
(Fsg)
Jiazheng Yuan∗ Mengxia Zhu† M. Javed Iqball‡
Jack Y. Yang∗∗ David A. Lightfoot††
∗Southern Illinois University Carbondale†Southern Illinois University Carbondale, [email protected]‡Southern Illinois University Carbondale∗∗Harvard University††Southern Illinois University Carbondale, [email protected]
Published in Yuan, J., Zhu, M., Iqbal, M. J., Yang, J. Y., Lightfoot, D. A. (2007). A com-putational approach to understand Arabidopsis thaliana and soybean resistance to Fusariumsolani (Fsg). Proceedings of the 7th IEEE International Conference on Bioinformatics andBioengineering, 2007. BIBE 2007, 585 - 592. doi: 10.1109/BIBE.2007.4375620 2007 IEEE.Personal use of this material is permitted. However, permission to reprint/republish this ma-terial for advertising or promotional purposes or for creating new collective works for resaleor redistribution to servers or lists, or to reuse any copyrighted component of this work inother works must be obtained from the IEEE. This material is presented to ensure timelydissemination of scholarly and technical work. Copyright and all rights therein are retainedby authors or by other copyright holders. All persons copying this information are expectedto adhere to the terms and constraints invoked by each author’s copyright. In most cases,these works may not be reposted without the explicit permission of the copyright holder.
This paper is posted at OpenSIUC.
http://opensiuc.lib.siu.edu/cs pubs/8

A Computational Approach to Understand Arabidopsis thaliana and SoybeanResistance to Fusarium solani (Fsg)
Jiazheng Yuan' 2, Mengxia Zhu3, M. Javed Iqball, Jack Y. Yang4, and David A. Lightfoot1'21. Department Plant, Soil Sciences, andAgriculture System, Southern Illinois University at
Carbondale, Carbondale, IL 629012. Department ofPlant Biology, Southern Illinois University at Carbondale, IL 62901
3. Department ofComputer Science, Southern Illinois University at Carbondale, IL 629014. Harvard Medical School, Harvard University, Cambridge, MA 02140
jyua.Asu.,ed ga4082@,siu. edu
Abstract
In this study, we reported the analysis ofArabidopsis thaliana microarray gene expressionprofile of root tissues after the plant was challengedwith fungal pathogen Fusarium solani f. sp. glycines(Fsg). Our microarray analysis showed that theinfection caused 130 transcript abundances (TAs) toincrease by more than 2 fold and 32 out of 130 TAswere increased by more than 3 fold in the root tissues.However, only nineteen ESTs were observed with adecrease in TAs by more than 2 fold and 13 of themwent down more than 3 fold due to the pathogeninfection. In addition, the number of the up-regulatedgenes was nearly seven times more than that of down-regulated genes. The coordinate regulation of adjacentgenes was detected and the distance distribution of thenearest neighbor genes was less likely to be randomlyscattered in genome. The results of this study enabledus to decipher the resistance mechanism to Fsgthrough an integrated computational approach.
1. Introduction
In plants, the same specificity of resistance genes(R genes) has been identified in distantly relatedspecies [1, 2]. Seeking the answer may shed light onthe reasons that lead to the longevity of R genespecificities and the dynamics ofR gene evolution [3].Pto homologs were positioned to syntenic regions inseveral species such as tomato, potato, and pepper butthe Pto locus is mostly conserved betweenLycopersicon esculentum and Lycopersiconpimpinellifolium, suggesting that the locus emergedprior to the divergence of these species [4, 5]. LrlOwas isolated from hexaploid wheat and encodes a CC-NBS-LRR protein [6]. It is a single-copy gene onwheat chromosome lAS. Wheat LR1O andArabidopsis RPM1 proteins possess a significantsequence similarity showing the orthologous
conservation of the RPM1-LrIO type of resistancegenes in these species [6].
Transcriptional changes play a major role in manyplant defense processes [7]. Dissection of alterations intranscript abundance has provided uniqueopportunities to delve into gene function by thecomparison of species, tissue, and time specifictranscription of thousands of genes simultaneously [8,9]. The simultaneous measurement of transcriptabundances of thousands of genes in parallel can serveas an important tool in functional genomics. Withmicroarray analysis, the transcript abundances of theannotated genes of Arabidopsis (>27,500 in 2006) canbe evaluated in parallel using high-density microarraysof sequenced cDNAs (AGI, 2000) or oligomers [10].Microarray experiments allow us to detect significantvariation in mRNA abundance and improveunderstanding of the molecular basis of the plantdefense responses [11]. Global and simultaneousanalysis of expression TA profiles can also be used tofind out what variations in mRNA abundances aresignificant for a certain proportion of the cDNAs andtreatments investigated [12, 13].
Hurst et al. [14] showed that coordinatedregulation of adjacent genes in chromosomal regionsoccurred during the regulation of gene expression inseveral plant species. A microarray approachdemonstrated co-expression patterns for adjacentgenes in the rice genome [15]. The results suggestedthat the net number of co-expressed gene modelsincreased proportionally with genome size. In rice, themajority of the coordinately expressed adjacent genemodel clusters are within 100 kp of each other andabout 10% of the genes in the rice genomedemonstrates coordinated expression patterns thatcorrespond with defined chromatin domains [15]. Inthe co-expressed gene model, gene clusters within thewhole chromatin domain may be expressed in a
1-4244-1509-8/07/$25.00 02007 IEEE 585
Authorized licensed use limited to: Southern Illinois University Carbondale. Downloaded on March 18,2010 at 11:13:13 EDT from IEEE Xplore. Restrictions apply.

similar manner because of covalently modification ofnucelosomes and thereby, chromatin remodelingaround one gene expands along the chromosome toencompass several genes until a boundary element isreached [16].
Sudden death syndrome (SDS) of soybean(Glycine max) caused by Fusarium solani f. sp.glycines (Fsg). Fsg was recently renamed F.virguliforme [17]. Iqbal et al. [1 1] measured changesin transcript abundances (TAs) of 191 known plantdefense and biotic/abiotic stress related genes insoybean roots at five time points over a period of 10days after Fsg inoculation. These genes were chosenfrom a soybean root cDNA library [18] and they had atleast a two-fold TAs increase from day 3 to day 10after the pathogen inoculated to a resistance genotype,RIL23 that carried resistance conferred by beneficialalleles at six quantitative trait loci (QTL) derived frominbred lines 'Essex' x 'Forrest' [11].
Here we analyzed the changes that occurred in theabundance of transcripts corresponding to 10,560Arabidopsis thaliana expressed sequence tags (ESTs).Assays used reverse labeled slides from AFGC afterinoculation of A. thaliana with Fsg. The coordinateregulation of adjacent genes was detected. The nullhypothesis was that an apparent random distribution ofthese genes associated with resistance among thechromosomes should be observed. An orthologanalysis was employed to understand the evolutionaryand developmental roles of the regulated genes basedon investigation of orthologous relationship betweensoybean and Arabidopsis. The comparison study onthe transcriptional activity between soybean andArabidopsis after fungal pathogen Fsg pathogenesisallows us to examine the overall impact of evolutionon both genomes.
2. Materials and methods
Plant materials
Arabidopsis thaliana cv. Columbia plants weregerminated from seeds under conditions at a 16 hphotoperiod with 23°C day and 18°C nighttemperatures and 80 00 (v/v) relative humidity underlight (500BE/M2/sec) in a growth chamber. Plantswere grown on either a soiless Cactus-mix at pH6.5 orMS medium [19]. There were 30 plants per treatmentarranged in a randomized complete block with threeplants per treatment per block. Twenty-one days afterplanting, synchronously growing plants were selectedand roots were collected from both treatment andcontrol.
Inoculation of roots with Fsg spores
The Fsg isolate 'Mont-i' was obtained from Dr.Shiuxian Li at the National Soybean ResearchLaboratory. A spore suspension of Fsg isolate 'Mont-1' was prepared as described [ 1]. The sporesuspension, at 5 x 10⁴ spore ml-1 with sterile distilledwater, was made by adding Fsg spores from severalFsg culture plates. Fsg was cultured on potato dextroseagar medium (PDA, Difco, Detroit, MI) supplementedwith 80 mg ml-' tetracycline and a few drops of Tween20 and was continuously stirred on a stir flask to keepa uniform suspension. The spore suspension waspoured on the growth medium for the infested plantsand the same volume of sterile distilled water wasadded to non-infested plants.
RNA isolation and microarray procedure
RNA was isolated separately from both inoculatedand non-inoculated roots and roots of 30 Arabidopsisthaliana plants that were bulked and ground to a finepowder in liquid nitrogen and RNA was extracted witha RNeasy Plant Mini Kit (Qiagen, Valencia, CA)according to the manufacturer's instructions. RNAsamples were treated with DNase in order to removeany residual DNA in combination with DNasetreatment using the RNase-free DNase kit (QiagenGmbH, Hilden, Germany) according to themanufacturer's instructions. After DNase treatment,RNA was purified on RNeasy mini spin columns(Qiagen, Valencia, CA). The quantity and quality ofthe RNA recovered was determined byspectrophotometry at 260-280 nm and electrophoresison a 1.2 00 (w/v) agarose, 20 00 (v/v) formaldehydegel. The microarray hybridization and slide scanningwere carried out by the facility at AFGC(http://afgc.stanford.edu). Microarrays (16561.xls and27314.xls at ftp://smd-ftp.stanford.edu/smd/organisms/AT/) were used in theexperiment. The mRNA samples corresponding totreatment (infested) and control (non-infested) waslabeled during the cDNA synthesis with Cy3- or Cy5-labeled dUTP and with one technical replicate labeledby reversed dye compared to the first hybridization.
Data analysis
Stringent quality control measures were applied toall stages of data analysis. The Microarray data werenormalized by local (local background value wassubtracted from the intensity value of each spot) andglobal metrics. The procedures described by Pevsner[20] followed to adjust for artifact differences in
1-4244-1509-8/07/$25.00 02007 IEEE 586
Authorized licensed use limited to: Southern Illinois University Carbondale. Downloaded on March 18,2010 at 11:13:13 EDT from IEEE Xplore. Restrictions apply.

intensity of the two labels. Coefficients of means andvariances on the signal intensities in each channel andratio of signals from two replicates were calculated byour C++ program, which was also applied to handlethe missing and extra data values. The average ratiofor a signal microarray from two replicates wascomputed by the equation of [Ratiolst+ (1/Ratio2nd)]/2.The Student's t-test was used to determine thestatistical significance for genes considered betweenand within Microarrays slides (P< 0.05). Unless statedotherwise, all analyses were performed using SASPROC UNIVARIATE (SAS version 9.1 SAS Institute,Inc., Cary, NC) to investigate the normality of distancedistribution of the nearest neighbor genes. Classifieddistance for the nearest neighbor gene wasstandardized as 0-10kb as A, 10-50kb defines as B,50-100kb as C, 100-500kb as D, 500-10OOkb as E,1000-2500kb as F, 2500-500kb as G, and >5000kb asH. Data were also subjected to natural logarithmtransformation in order to reduce experimental error ifany of the data points was not spread symmetrically.
Phylogenetic analyses
Functional sequence analysis was performed onthe amino acid sequences that were derived fromcomplete cds using Cluster X [21] with the defaultsettings. Nucleotide sequences were aligned withClustal W [22]. The results of multiple alignmentswere subjected to phylogenetic analysis using thealgorithm of the MEGA package version 3.1 using theMaximum Parsimony analysis with Kimura twoparameter distances [23]. The Maximum-Parsimonywas assessed by 500 bootstrap replicates. Onlynucleotide sequences were employed in phylogeneticanalysis due to higher stringency consideration for thephylogenetic tree construction.
3. Results
Analysis of expression profile
Analysis of the microarray data demonstrated asignificant variation within and between the slidesafter local and global normalization following theinstruction of Pevsner [20]. Among the transcripts,4196 were highly correlated between the two reverselabeled slides from the 10,560 EST assayed. Theposition and label variations between two replicationsdid not significantly alter the topography betweenslides. A total 130 transcript abundances (TAs) were
increased by more than 2 fold and 32 out of 130 TAswere increased by greater than 3 fold in the roottissues that were infected by the fungal pathogen. Incontrast, only 19 transcript abundances went downmore than 2 fold and 13 ofthem were suppressed morethan 3 fold due to the treatment (data not shown). Thetotal number of up-regulated genes was nearly seventimes greater than that of down-regulated.
Chromosomal distribution of up-regulatedgenes
To exam whether the chromosomal spatialorganization affects gene expression, we calculateddistance of neighbored genes in the genome betweenpairs of the nearest neighbor loci, which was ananalogous to a pair of co-expressed pair of genes.Taking an advantage of rich information from theArabidopsis Information Resource(www.arabidopsis.org), the neighborhoodrelationships between these 130 up-regulated and 19down-regulated genes and their chromosomalpositions have been obtained (Fig.1 A, B). As showedin Table 1, the mean distance of neighbored genes ineach chromosome was ranged as 840-958Kbexception of chromosome II (1,865Kb).Approximately 30%0 adjacent gene pairs with thegenome distance within 100 Kb tended to have similarfold of TA increases, and the range was from 2-5.62.Fifty percent of the gene orientations that were in thesame vicinity on the chromosome was more likely tobe the same (Table 1) Our results indicated thattranscriptional relationship of the nearest neighborgene showed a tendency to occur in the adjacentposition along the chromosome but it is stillinconclusive by the position of each gene. Six ofeighteen pairs of the nearest neighbor genes had thesimilar function, another six possessed differentfunctions, and at least one of the pairs in the remaininggene pairs the function was unknown.
The distance distribution of the nearest neighborgenes was less likely to be randomly scatted in thegenome. From Shapiro-Wilk test for normality, thedistance distribution showed not normal on eachchromosome (W=0.63-0.83, P<0.001). However, thedistribution appeared to correspond better to thenormal distribution than that of the distance ofneighbor gene if the genome distances were classifiedbased on the standardized length of the fragment
1-4244-1509-8/07/$25.00 02007 IEEE 587
Authorized licensed use limited to: Southern Illinois University Carbondale. Downloaded on March 18,2010 at 11:13:13 EDT from IEEE Xplore. Restrictions apply.

Table 1. Relationship of the nearest neighbor genes. The paired neighbor genes were shown in alternated colors. Wvalues (Shapiro-Wilk test) were consisted of two procedures: the nearest neighbor distance and arbitrarily catalogeddistance (classified).
Locus (Nearst Distance S-W test; S-W test; Orietation Description FoldPr<W Pr<W
reverse unKown 2.47forward interferon-related nrotein / IFRD nrotein familv 2.54AT1 G27760 53.7
/A -I GU60u
AT1 G63780 61.9 reverse IMP42.045
2.04
iviean aistance vzb(Chrl)
AT2G02080AT2G02130 18.3
reverse C2H2-type zinc finger protein 2.32forward putative protease inhibitor 11 2.12
I U IUITVVdIrU irLpLTdacoLrIpLIuI LLUZ.
AT2G33830 3.4 reverse dormancy/auxin protein 2.34
Mean distance 1865 0.73; 0.0018 0.87; 0.09
ATU45b4U forward mitogen-activated protein kinase 33.0iAT3G45710 23.9 forward proton-dependent oligopeptide transport 2.9
A 1 bU4060 reverse unKOwn 2.2AT3G48720 8.1 forward transferase family protein 4.22
Mean distance 840 0.69; 0.0004 0.92; 0.05
AT4G27450 reverse unkown 2.01AT4G27700 97.5 reverse rhodanese-like domain-containing protein 2.03Mean distance 958 0.83; 0.0036 0.86; 0.02
(CRhrA)
torward biotin carboxyl carrier protein 2
AI bUIDLou torwarc unKown
AT5G62530 80.7 reverse ALDH12Al (Aldehyde dehydrogenase 12A1) 2.36Mean distance 905 0.68; 0.0001 0.89; 0.01
(Chr5)
1-4244-1509-8/07/$25.00 02007 IEEE 588
Authorized licensed use limited to: Southern Illinois University Carbondale. Downloaded on March 18,2010 at 11:13:13 EDT from IEEE Xplore. Restrictions apply.

(W=0.86-0.92, P=0.09-0.01) and found no prominentcharacteristic changes among the chromosomes (datanot shown). The distribution of classified distancedemonstrated higher level of the randomnessthroughout each of the five Arabidopsis chromosomes,suggesting that this long-range correlation may prevailwithin the genome. There was no significantdifference among the distance distribution before andafter the distance value transformed by naturallogarithm (data not shown). Consequently, the nullhypothesis was rejected that there was an apparentnon-random distribution of these genes associated
with the nearest neighbor genes among thechromosomes. Furthermore, assumptions were notaltered after the preprocessing step of data naturallogarithm transformation.
Phylogenetic analyses homologousinvolved in the resistance
genes
The transcript abundances in the Arabidopsismicroarray data shared homology to the genesinvolved in resistance, signal transduction, plant
Table 2. Thirteen of twenty-eight pairs taxoned together genes from both Arabidopsis and soybean after MP andpairwise distance analyses using MEGA 3.1 program [23]. The pair grouped genes were shown in alternated colors.Accession number Description Bootstrapping value Kim ura-2 distance
DA
AY '2U(bU
INIvI_ IL UOs1'
qm A1416624
Iy I alyIi 1AVAi
'I.bMAMAP F
1 3-Lipoxyqenase
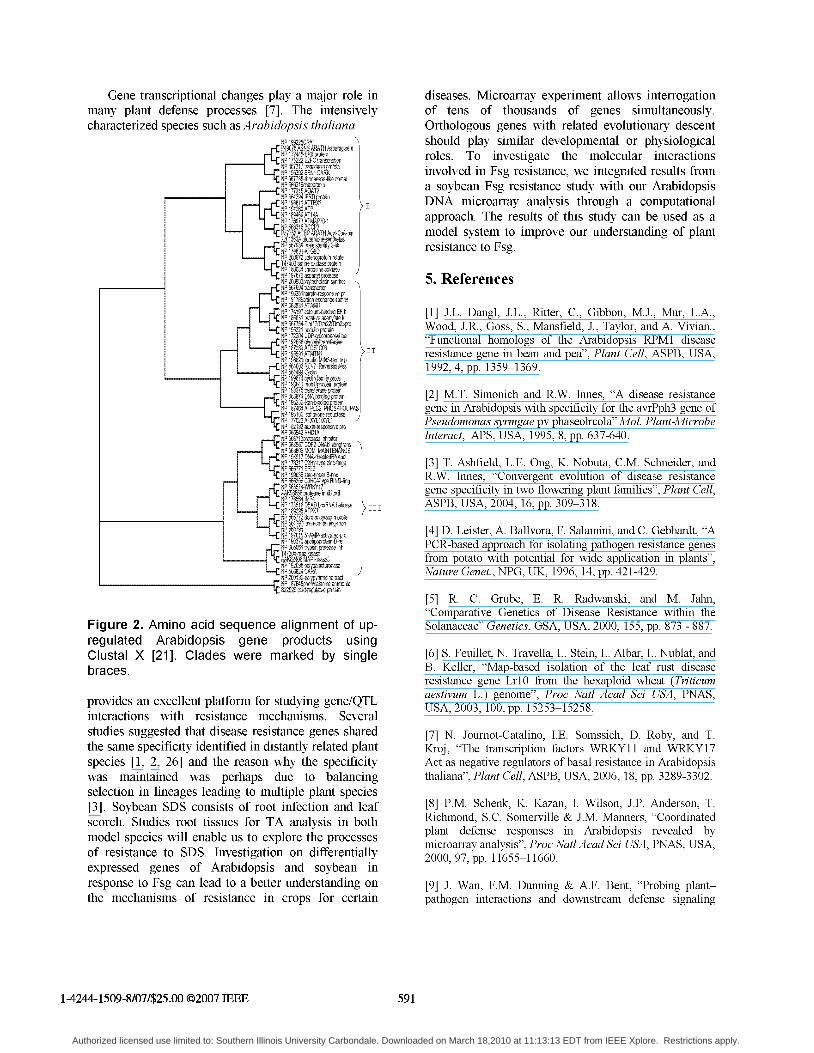
defense and transport of metabolites et al. Those TAswere functionally clustered into three major groups
(clades, Fig. 2) analyzed using CLUSTAL X [21].Maximum Parsimony (MP) analysis compared the up-
regulated Arabidopsis TAs with soybean ESTs fromRIL23 that carried resistance conferred by sixquantitative trait loci (QTL) [11]. Twenty-eight pairsof the genes from both species were grouped togetherand 13 pairs possessed at least one bootstrapping value
with various Kimura two parameter distances (Table2). Seven soybean ESTs showed higher functionidentities with those of the Arabidopsis counterparties,implying that those genes in soybean and Arabidopsismight derived from common ancestors and sharedsimilar function. These genes shared 1 to 1 ratio of thefunctional relationship in those seven paired:NM 11869, AF386961, NM 113674, NM 111048,NM 126269, P49078, NM 119619 of Arabidopsisand A1495119, A144393, A1440894, A1494910,
1-4244-1509-8/07/$25.00 02007 IEEE
INIVI_- U'4bU-- A A A Ot:
589
Authorized licensed use limited to: Southern Illinois University Carbondale. Downloaded on March 18,2010 at 11:13:13 EDT from IEEE Xplore. Restrictions apply.

B1345412, A1443448, A1496621 of soybean.However, their bootstrapping values and Kimura two
A
B
I
Figure 1. The neighborhood relationships among 130up-regulated (A) and 19 down-regulated genes (B) andtheir chromosomal positions in Arabidopsis fivechromosomes.
distances did not always agree with the functionalsimilarity. Interestingly, fair numbers of ESTsequences were not found in the other organism, evenin closely related gene families that were associatedwith the fungal resistance. Exception of several taxahad high bootstrap values, and the majority families orsubfamilies in the higher nodes tended to give lowbootstrap values (data not shown).
4. Discussion
Several studies showed an association betweenfunctionally related genes with neighboring positionsalong the chromosomal regions defines as chromatindomains [14]. The chromosomes of eukaryotes displaynon-homogenous structure with condensed and packedmanner while transcription performs spread unevenlyover the chromosomes based on each individualorganization of the chromosome [24]. Most of the
coordinately expressed neighbor gene model clustersare about 100Kb of genomic sequence in rice [15].These neighbor genes can be organized into a co-expression group. Approximate 10% of the ricegenome shows a coordinated expression pattern [15].However, the mechanism for this co-expressionpattern in the genome is still debatable. To decipherthe relationships between gene co-expression andspatial position along the chromosomes after pathogentreatment, we examined the distance distribution of thenearest neighbor gene pairs throughout the genome ofthese 130 up-regulated Arabidopsis genes. Nearly 30°0adjacent gene pairs whose genome distance was within100 Kb tended to have similar fold of TA increasesand some of those genes contained a similar functionand gene architecture. The distance distribution of thenearest neighbor resistance genes did not appearedrandomly scattered in genome on each chromosome.Almost equal number of the nearest neighbor geneshad either the same or different orientations. Ourresults suggested that functional relationshipsdisplayed a tendency to occur in neighbor positionsalong the chromosomes but it was still inconclusivewith regard to the position of each gene.
Seven gene groups were identified according to theoutcome of functional analysis in this study, showingboth functional and orthologous relationships in thesetwo species. The 1 to 1 ratio of the orthologousfunction relationship was found among those sevenpaired groups, indicating that these gene groups weredescended from a common ancestor and correspondedto well-conserved functions. These 1 to 1 orthologueclasses were presumed to represent conservedfunctions in Arabidopsis and soybean, but they shareddiverse bootstrapping values and distances. Whetheror not it might have begun to diversify nucleotidesequence in one species as a result of gene duplicationis still unknown. Further, only a few of them were thenearest neighbors. The n to n orthologue classes werealso found from the phylogenetic tree (data notshown). This information may represent functions thathave begun to diversify in both species. Thirteen oftwenty-eight pairs ofthe genes from both species weregrouped together and each pair possessed uniquebootstrapping value and Kimura' s phylogeneticdistance (Table 2). Based on the phylogenetic analysis,the organization of soybean phenylalanine ammonia-lyase (PAL) protein was very similar to that of theArabidopsis PAL protein, suggesting the orthologousrelationship of the two PAL proteins. Exception ofseveral taxa appeared with high bootstrap values,majority families or subfamilies in the higher nodestended to give low bootstrap values.
1-4244-1509-8/07/$25.00 02007 IEEE
[[
S|SS6
s.ATI 0094
1q Tf G
,ATI a20s2k-ATI a -e31,ATI 027640N4AT, 029
AT! 01
590
Authorized licensed use limited to: Southern Illinois University Carbondale. Downloaded on March 18,2010 at 11:13:13 EDT from IEEE Xplore. Restrictions apply.
Gene transcriptional changes play a major role inmany plant defense processes [7]. The intensivelycharacterized species such as Arabidopsis thaliana
P49078ASNISARATH Asparainle sNP 17245-Proptein_ {NP 175222 E2FC transcripUonNP 567317trnsduct'n oteinNP 195302SENI DAF
iNP 567785-rhodan1ese-ike domai
4NP 17721NAGAT2Np 564294 Fein
NP Mb IAI NP 1946 ATPNP 176973 ATMAP70-1NP 568E316 BCCP2_LP57752ACBPARATHActCob-in12201136GAiplLiathione-synhetasNIP56793 ralesteriloNS-ik
L:NP 178631-ATG8D- NhP 200672 selenoroptein-relate
T{47403 amirke oxidase proteinMP1
WAN nmdulmtanco
NP 5i67694 tranlspoerrNP 196251hairpinrKesporasive prNP 191786anion exchang-farml.yNP 563831 ATAMvI 1NP 174197 calciurnl-bndim EF hNP 186831 VAtiveadep3ate kNP 5677% Wm7/Tirn2S im23orNP 195221 nodulin proteinNP 172204 U glidoorounosyl traNP 192688qioitrandferseNP 195591 ATMkTN1NP 19821nodu in 03-fSamily pNP 564002 REV7 ReversionilessNP 564499 CyclinNP 199674 cylin family prteiNP 193B4 mobllphoci'n prxteiNlP 193275 transf6rase pro einNP 56874 DNA-binding prtein-NP 1196230-Ran-bindigRoft,inNP 187464ATPLC2 PO PHOLNP 195180 isoflavone reductseNP 177023 ATXLrXYLINP 565942 RH971NP 566713protease inhibitor
NP 5i3806 MOMl MAINTENAUNP 198917 DNA-directdRNAp41NP 178317 C21-2-type zinc-fur>geNP S51571 SPL3NP 19636 zjrinc-fni B-boxNP 566356 CMC4-tpe RING-fqNP 565674-WRK(Yl
NP 1735i16 DEAD boxIRNA helic&NP 189395 TP1K7NP 565772 dormancylauxini proteNP 564797flavir-oeaininrg-monNP 564794NP 197615 5'-AMRla-acted-proNP 190370 apolipoprotein-DreNP 5650)61 trvpsin prtease-ihhT47504-ma kinaseAAK62406 UtP kinaseNP 192098DolqalctumrnaseNP 566824 CANP 2001304po1ygrimidine trctI9P 18764 phelSany~nmeammofli
I I
III
Figure 2. Amino acid sequence alignment of up-regulated Arabidopsis gene products usingClustal X [21]. Clades were marked by singlebraces.
provides an excellent platform for studying gene/QTLinteractions with resistance mechanisms. Severalstudies suggested that disease resistance genes sharedthe same specificity identified in distantly related plantspecies [1, 2, 26] and the reason why the specificitywas maintained was perhaps due to balancingselection in lineages leading to multiple plant species[3]. Soybean SDS consists of root infection and leafscorch. Studies root tissues for TA analysis in bothmodel species will enable us to explore the processesof resistance to SDS. Investigation on differentiallyexpressed genes of Arabidopsis and soybean inresponse to Fsg can lead to a better understanding onthe mechanisms of resistance in crops for certain
diseases. Microarray experiment allows interrogationof tens of thousands of genes simultaneously.Orthologous genes with related evolutionary descentshould play similar developmental or physiologicalroles. To investigate the molecular interactionsinvolved in Fsg resistance, we integrated results froma soybean Fsg resistance study with our ArabidopsisDNA microarray analysis through a computationalapproach. The results of this study can be used as amodel system to improve our understanding of plantresistance to Fsg.
5. References
[1] J.L. Dangl, J.L., Ritter, C., Gibbon, M.J., Mur, L.A.,Wood, J.R., Goss, S., Mansfield, J., Taylor, and A. Vivian.,"Functional homologs of the Arabidopsis RPM1 diseaseresistance gene in bean and pea", Plant Cell, ASPB, USA,1992, 4, pp. 1359-1369.
[2] M.T. Simonich and R.W. Innes, "A disease resistancegene in Arabidopsis with specificity for the avrPph3 gene ofPseudomonas syrmgae pv phaseolrcola" Mol. Plant-MicrobeInteract, APS, USA, 1995, 8, pp. 637-640.
[3] T. Ashfield, L.E. Ong, K. Nobuta, C.M. Schneider, andR.W. Innes, "Convergent evolution of disease resistancegene specificity in two flowering plant families", Plant Cell,ASPB, USA, 2004, 16, pp. 309-318.
[4] D. Leister, A. Ballvora, F. Salamini, and C. Gebhardt, "APCR-based approach for isolating pathogen resistance genesfrom potato with potential for wide application in plants",Nature Genet., NPG, UK, 1996, 14, pp. 421-429.
[5] R. C. Grube, E. R. Radwanski, and M. Jahn,"Comparative Genetics of Disease Resistance within theSolanaceae" Genetics, GSA, USA, 2000, 155, pp. 873 - 887.
[6] S. Feuillet, N. Travella, L. Stein, L. Albar, L. Nublat, andB. Keller, "Map-based isolation of the leaf rust diseaseresistance gene LrlO from the hexaploid wheat (Triticumaestivum L.) genome", Proc Natl Acad Sci USA, PNAS,USA, 2003, 100, pp. 15253-15258.
[7] N. Journot-Catalino, I.E. Somssich, D. Roby, and T.Kroj, "The transcription factors WRKY11 and WRKY17Act as negative regulators of basal resistance in Arabidopsisthaliana", Plant Cell, ASPB, USA, 2006, 18, pp. 3289-3302.
[8] P.M. Schenk, K. Kazan, I. Wilson, J.P. Anderson, T.Richmond, S.C. Somerville & J.M. Manners, "Coordinatedplant defense responses in Arabidopsis revealed bymicroarray analysis", Proc Natl Acad Sci USA, PNAS, USA,2000, 97, pp. 11655-11660.
[9] J. Wan, F.M. Dunning & A.F. Bent, "Probing plant-pathogen interactions and downstream defense signaling
1-4244-1509-8/07/$25.00 02007 IEEE 591
Authorized licensed use limited to: Southern Illinois University Carbondale. Downloaded on March 18,2010 at 11:13:13 EDT from IEEE Xplore. Restrictions apply.

using DNA microarrays", Funct Integr Genomics, Springer,Germany, 2002, 2, pp. 259-273.
[10] D.J. Lockhart and E.A. Winzeler, "Genomics, geneexpression and DNA arrays", Nature NPG, UK, 2000, 405,pp. 827-836.
[11] M.J. Iqbal, S. Yaegashi, R. Ahsan, K. Shopinski, D.A.Lightfoot, "Root response to F. solani f. sp. glycines:Temporal accumulation of transcripts in partially resistantand susceptible soybean". Theoretical and Applied Genetics,Springer, Germany, 2005, 110, pp. 1429-1438.
[12] R.A. Gutierrez, R.M. Ewing, J.M. Cherry, P.J. Green,"Identification of unstable transcripts in Arabidopsis bycDNA microarray analysis: rapid decay is associated with agroup of touch- and specific clock-controlled genes", ProcNatl Acad Sci USA, PNAS, USA, 2002, 99, pp. 11513-11518.
[13] J.C. Lloyd and O.V. Zakhleniuk, "Responses of primaryand secondary metabolism to sugar accumulation revealedby microarray expression analysis of the Arabidopsismutant, pho3", J Exp Bot,, Oxford University Press, UK,2004, 55, pp. 1221-1230.
[14] L.D. Hurst, C. Pal, and M.J. Lercher, "The dynamics ofeukaryotic gene order", Nat. Rev. Genet., NPG, UK, 2004, 5pp. 299-310.
[15] L.G. Ma et al., "A microarray analysis of the ricetranscriptome and its comparison to Arabidopsis", GenomeRes, Cold Spring Harbor, USA, 2005, 15, pp. 1274-1283.
[16] M. Labrador, and V.G. Corces, "Setting the boundariesof chromatin domains and nuclear organization", Cell, CellPress, USA, 2002, 111, pp. 151-154.
[17] T. Aoki, K. O'Donnell, Y. Homma, A.R. Lattanzi,"Sudden death syndrome of soybean is caused by twomorphologically and phylogenetically distinct species withinthe Fusarium solani species complex F. virguliforme inNorth America and F. tucumaniae in South America",Mycologia, MSA, USA, 2003, 95, pp. 660-684.
[18] R. Shoemaker et al., "A compilation of soybean ESTs:generation and analysis", Genome, NRC Research Press,Canada, 2002, 45, pp. 329-338.
[19] T. Murashige and F. Skoog, "A revised medium forrapid growth and bioassays with tobacco tissue cultures",Physiol. Plant. ASPB, USA, 1962, 15, pp. 473-497.
[20] J. Pevsner, Bioinformatics and Functional Genomics,John Wiley & Sons Inc., USA, 2003.
[21] J.D. Thompson, T.J. Gibson, F. Plewniak, F.Jeanmougin, and D.G. Higgins, "The CLUSTAL Xwindows interface: flexible strategies for multiple sequencealignment aided by quality analysis tools", Nucleic AcidsResearch, Oxford University Press, UK, 1997, 25, pp. 4876-4882.
[22] J.D. Thompson, D.G. Higgins, and T.J. Gibson,"CLUSTAL W: improving the sensitivity of progressivemultiple sequence alignment through sequence weighting,position-specific gp penalties and weight matrix choice",Nucleic Acids Research, Oxford University Press, UK, 1994,22, pp. 4673 -4680.
[23] S. Kumar, K. Tamura and M. Nei, "MEGA 3:integrated software for Molecular Evolutionary GeneticsAnalysis sequence alignment", Brief Bioinform, OxfordUniversity Press, UK, 2004, 5, pp. 150-163.
[24] M. Szentirmay, and M. Sawadogo, "Spatialorganization of RNA polymerase II transcription in thenucleus", Nucleic Acids Research, Oxford University Press,UK, 2000, 28, pp. 2019-2025.
[25] R. Hulckelhoven, "Powdery mildew susceptibility andbiotrophic infection strategies", FEMS Microbiology Letters,Elsevier Inc, Netherlands, 2 005, 245, pp. 9-17.
[26] S. Gabriels, et al., "An NB-LRR protein required forHR signalling mediated by both extra- and intracellularresistance proteins", The Plant Journal, 2007, 50, pp. 14-28.
1-4244-1509-8/07/$25.00 02007 IEEE 592
Authorized licensed use limited to: Southern Illinois University Carbondale. Downloaded on March 18,2010 at 11:13:13 EDT from IEEE Xplore. Restrictions apply.