A Compendium of Perspectives on Public Sector RIsk Financing
39
INTERACTIVE PDF INSTRUCTIONS
-
Upload
khangminh22 -
Category
Documents
-
view
0 -
download
0
Transcript of A Compendium of Perspectives on Public Sector RIsk Financing
This interactive PDF allows you to access information easily, search for a specific item, or go directly to the first page of that section.
TAbSClicking on one of the tabs at the side of the page takes you to the first page of that section.
GUIDE TO bUTTONS
go to table of contents
search this PDF
go to next page
go to previous page
Please note: if you are viewing this content on a tablet or mobile device, functionality for Buttons and Tabs will be disabled.

OCTOBER 2016
PaRTnERshiPs: a COmPEndium Of PERsPECTivEs On PuBliC sECTOR Risk finanCing

1
TABLE OF CONTENTS
i. inTROduCTiOn 2
ii. PERsPECTivEs and dEvElOPmEnTs 4
Public sector Risk financing Perspectives in Europe/ middle East/africa By Charles Whitmore, managing director 5
Public sector Risk financing Perspectives in the united states: national flood insurance Program (nfiP) By Jonathan Clark, managing director and Cheryl lorenz, vice President 11
Public sector Risk financing Perspectives in the united states: The market for mortgage Credit Risk (Re)insurance By Jeff krohn, managing director and John Tedeschi, managing director 14
Public sector Risk financing Perspectives in latin america By aidan Pope, managing director 17
Public sector Risk financing Perspectives in asia Pacific By graham Jones, senior vice President 19
Public sector Risk financing Perspectives – Pandemic Risk By Cory anger, global head of ils structuring, gC securities 21
Public sector Risk financing Perspectives – Terror Risk By Emma karhan, managing director 23
Public sector Risk financing Perspectives – sharing visual intelligence for disaster Response By dr. Beverley adams, head of Planning and Response 27
2
i. inTROduCTiOn
MOrE STrATEgiC diSCuSSiONS AMONg gOvErNMENTS, NON-gOvErNMENTAL OrgANizATiONS, ThE SCiENTiFiC ANd ACAdEMiC COMMuNiTiES ANd ThE iNSurANCE iNduSTry wiLL hELp TO prOMOTE BETTEr diSASTEr riSk MANAgEMENT ANd ThE iMpLEMENTATiON OF prE-EvENT iNSurANCE SOLuTiONS.
3
An integrated and coordinated approach to collaboration between the insurance industry, governments and other public bodies is increasingly recognized as an effective method of creating sustainable risk-transfer mechanisms. More strategic discussions among governments, non-governmental organizations, the scientific and academic communities and the insurance industry will help to promote better disaster risk management and the implementation of pre-event insurance solutions.
The protection gap, defined as the cost of uninsured events, presents opportunities for the (re)insurance industry far beyond the catastrophe segment. New risks in areas such as technology, science, medicine, climate change, population growth, food security and urbanization offer challenges and provide opportunities for profitable growth. Some of the risks are very complex or were previously little understood, yet today we better understand risk than at any time in history. we have better science, analytics and tools to understand, measure and price risk. Concurrently, significant market capacity exists due to the inflow of large amounts of capital looking for opportunities to transfer risk.
guy Carpenter is proud to present this compendium of perspectives and developments that are driving public sector entities to consider new initiatives for risk financing. Our compendium provides a survey of recent developments in regions around the world and noteworthy areas of risk and risk mitigation. we offer it as a companion and update to guy Carpenter’s 2015 report: Partnerships: The Way to Public Sector Risk Financing.
we hope that you find the commentary to be informative and actionable. To learn more about the opportunities and how we can help you grow your business, profitably, please contact your guy Carpenter representative.
4
ii. PERsPECTivEs and dEvElOPmEnTs
ThE iNSurANCE iNduSTry hAS A pivOTAL rOLE iN EduCATiNg ANd iNCENTiviziNg iTS pOLiCyhOLdEr BASE TO EMpLOy riSk MiTigATiON MEASurES iN OrdEr TO iMprOvE SOCiETAL rESiLiENCE TO wEAThEr-rELATEd riSk.
51. swiss Re, sigma.
PuBliC sECTOR Risk finanCing PERsPECTivEs in EuROPE/middlE EasT/afRiCa By Charles whitmore, Managing director
inTROduCTiOnOn a global basis, approximately 701 percent of the economic loss caused by natural catastrophe events is not covered
by insurance. This gap, the cost of uninsured events, frequently falls on governments through disaster relief, welfare
payments and infrastructure repair and rebuilding. The ultimate cost of these responses causes a strain on public
balance sheets and an increase in public debt, ultimately burdening taxpayers. The protection gap is increasing in
emerging economies especially where the amount of natural catastrophe economic loss covered by insurance dropped
from 25 percent in 2002 to approximately eight percent in 2014.
The global protection gap may be caused by:
• low insurance penetration rates (prevalent even in advanced markets);
• losses from risks beyond the limits of insurability; and
• losses from emerging risks and unknown exposures, such as cyber or solar storms.
Scientific opinion supports the role of climate change as one of the generally accepted reasons for the increase in
weather volatility in recent years. As this trend is expected to continue in the future, the need for the insurance industry
to assist society in recovering swiftly and sustainably in the post-loss environment continues to increase. The industry
as a whole can also play a crucial role in incentivizing and implementing improved and sustained societal resilience
through considered loss mitigation and risk management measures, which can be established at the point of contact
with new and existing policyholders.
Charles whitmore, Managing director
6
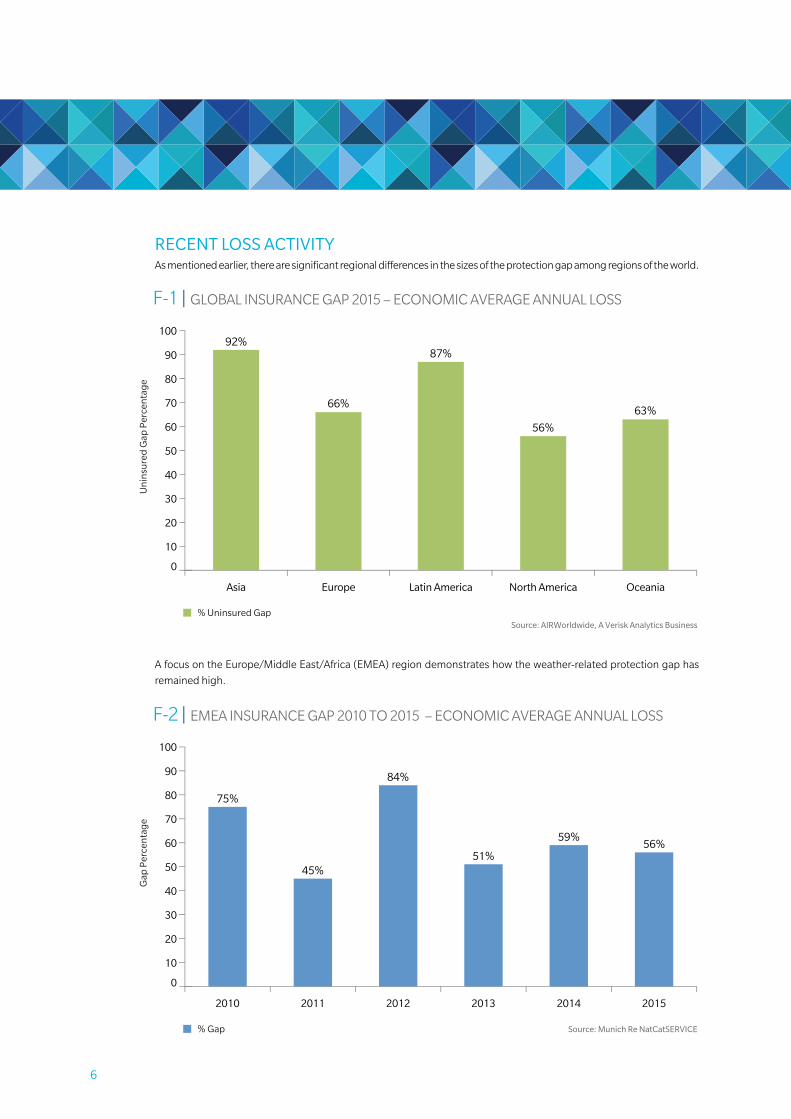
RECEnT lOss aCTiviTyAs mentioned earlier, there are significant regional differences in the sizes of the protection gap among regions of the world.
A focus on the Europe/Middle East/Africa (EMEA) region demonstrates how the weather-related protection gap has
remained high.
F-3 | NATIONAL FIOOD INSURANCE PROGRAM DEBT TO THE U.S. TREASURY
USD
Bill
ions
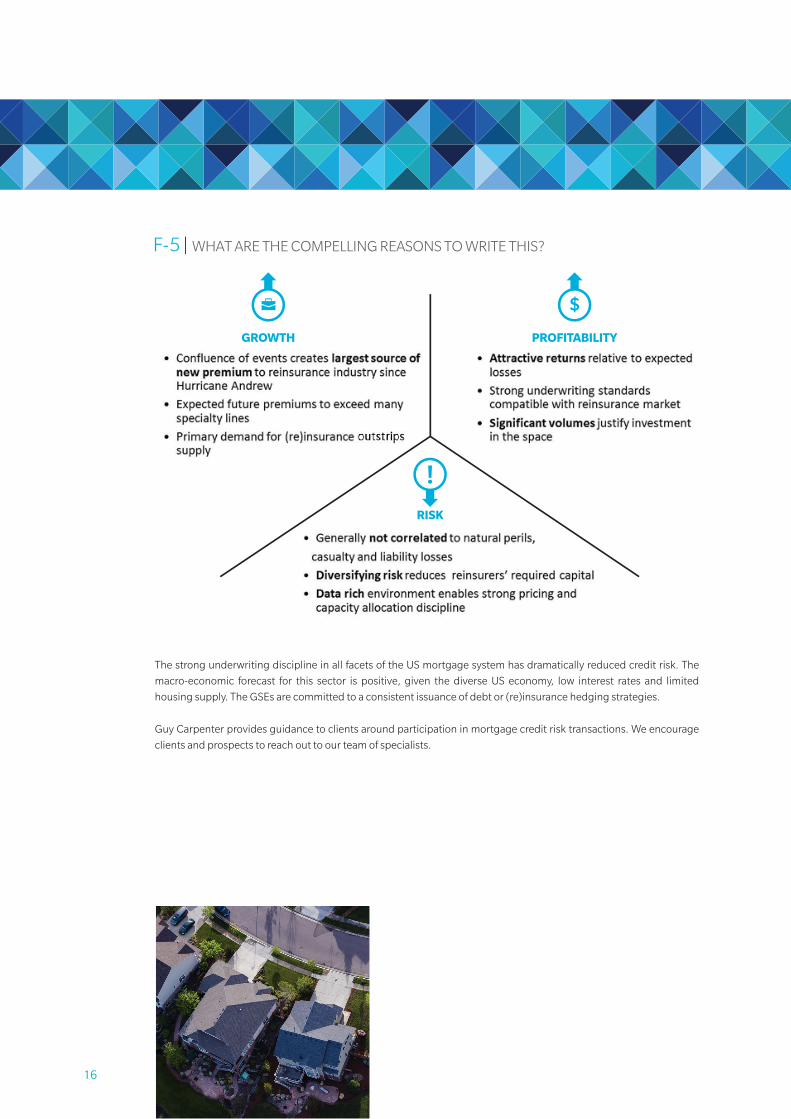
F-5 | WHAT ARE THE COMPELLING REASONS TO WRITE THIS?
F-6 | TERRORISM POOL PRICE INDEX VERSUS CAPACITY
More people live inside the circle than outside.
Risk Spread overSponsor Expected Risk Amount Benchmark Index Measurement Attachment Exhaustion
Year Deal Name Name Maturity Period ($MM) Tranche (in bps) Risk Location Period Level (%) Level (%)
2003 Vita Capital Ltd. Swiss Re 1/1/2007 4 years 400.00 Notes 135 U.S. / U.K. / France / Italy / Switzerland
1 calendar year 130 150
62.00 Class B Notes 90 120 125200.00 Class C Notes 140 115 120100.00 Class D Notes 190 110 11575.00 Class A Notes (wrapped) 19 115 12080.00 Class B Notes 300 110 115129.00 Class B-1 Notes (wrapped) 20 114 11964.50 Class B-2 Notes 120 114 119150.00 Class C Notes 285 110 114100.00 Class D Notes 500 106 110
1/1/2011 4 years 100.00 Class A-IV (wrapped) 21 125 1451/1/2012 5 years 100.00 Class A-V (wrapped) 20 125 1451/1/2011 4 years 70.97 Class A-VI (wrapped) 21 125 1451/1/2012 5 years 129.04 Class A-VII 80 125 1451/1/2011 4 years 90.00 Class B-I 110 120 1251/1/2012 5 years 50.00 Class B-II 112 120 1251/1/2011 4 years 39.38 Class B-III 110 120 1251/1/2012 5 years 50.00 Class B-V (wrapped) 21 120 1251/1/2011 4 years 70.97 Class B-VI (wrapped) 22 120 125
2008 Nathan Ltd. Munich Re 1/15/2013 5 years 100.00 Class A-I 135 U.S. / U.K. / Canada / Germany
2 consecutive calendar years
120 130
2009 Vita Capital IV Ltd. Swiss Re 1/15/2004 5 years 75.00 Class E 650 U.S. / U.K 2 consecutive calendar years
U.S.: 105UK: 112.5
U.S.: 110UK: 120
2010 Vita Capital IV Ltd. Swiss Re 1/15/2014 4 years 50.00 Series II, Class E 525 U.S / U.K 2 consecutive calendar years
U.S.: 105UK: 112.5
U.S.: 110UK: 120
100.0 Series V 280 Canada / Germany CAN: 120, GER: 125
CAN: 130, GER: 135
80.0 Series VI 385US / UK/ Canada /
Germany
U.S. : 105; UK: 115; GER/CAN:
110
U.S.: 110; UK: 120;
GER/CAN: 115
125.00 Class D-1 Notes 270 Canada / Australia CAN: 120, AUS: 135
CAN: 130, AUS: 145
150.00 Class E-1 Notes 340 US / Canada / AustraliaCAN: 110, AUS: 120, U.S.: 105
CAN: 115, AUS: 130, U.S.: 110
Mythen Re 2012-2 1/15/2016 4 years 120.00 Class A (includes US hurricane) 850 U.K. 2 consecu�ve calendar years
125 135
2013 Atlas IX Re SCOR 1/17/2019 6 years 180.00 300 U.S. 2 consecu�ve calendar years
102 104
EUR135.00 Class A 255 France, Japan, U.S. 1 calendar yearFR: 108.1; JP: 108.2; U.S. 104.1
FR: 108.1; JP: 108.2; U.S. 104.2
EUR150.00 Class B 335 France, Japan, U.S. 1 calendar yearFR: 116; JP: 116; U.S. 108
FR: 116; JP: 116; U.S. 109
Vita Capital VI Swiss Re 1/8/2021 5 years 100.00 Class A 290 Australia, Canada and U.K.
1 calendar year
Year 1: AUS: 120; CAN: 115; UK: 120;
Dropdown feature in subsequent
years
Year 1: AUS: 130; CAN: 125; UK: 140;
Dropdown feature in
subsequent years
2 consecu�ve calendar years
Vita Capital IV
2 consecu�ve calendar years2012
2011 Swiss Re
Vita Capital VSwiss Re
4 years
4 years
1/15/2016
1/15/2017
2 consecutive calendar years
2 consecutive calendar years
2007 Vita Capital III Ltd. Swiss Re U.S. / U.K. / Germany / Japan / Canada
2 consecutive calendar years
U.S. / France / Japan2006 Osiris Capital p.l.c. AXA 1/15/2010 4 years
U.S. / U.K. / France / Italy / Switzerland
2 consecutive calendar years
2006 Tartan Capital Ltd. Scottish Re 1/7/2009 3 years U.S.
2005 Vita Capital II Ltd. Swiss Re 1/1/2010 5 years
Benu Capital 5 years1/8/2020AXA
2015
PLACEHOLDER
F-7 | NATURAL CATASTROPHE LOSSES: 1970-2015
Source: Swiss Re, sigma No. 1/2016 and Guy Carpenter.
0
50
100
150
200
250
300
350
400
450
1970 1975 1980 1985 1990 1995 2000 2005 2010 2015
Insured losses Uninsured losses 10 per. Mov. Avg. (Total Insured Losses) 10 per. Mov. Avg. (Total Eco Losses)
USD
Bill
ions
Source: Guy Carpenter from figures reported by FEMA and the NFIP
Source: FreddieMac (www.freddiemac.com) and Fannie Mae (www.fanniemae.com)
F-4 | CUMULATIVE LIMIT PLACED
USD
Bill
ions
.2.81.2
3.6
2.4
5.3
6
5
4
3
2
1
0
2013/2014 2015
Freddie Fannie
2016 YTD
F-8 | TRANSPORTATION TARGETS ATTACKED BY TERRORISTS, 1970 – 2014
Source: START’s Global Terrorism Database, University of Maryland.
0% 10% 20% 30% 40%
Taxi/RickshawSubway
Highway/Road-RelatedAirline Officer/Personnel
Aircra� (not at an airport)Airport
Bus Sta�on/StopBridge/TunnelTrain Related
Bus (excluding tourists)
Percent of Transporta�on Targets
Type
of T
rans
port
a�on
Tar
get
F-9 | TYPES OF BUSINESSES TARGETED BY TERRORIST ATTACKS WORLDWIDE, 1970 – 2014
Source: START’s Global Terrorism Database, University of Maryland.
0 500 1000 1500 2000 2500 3000 3500
Private Security Company/Firm
Mining
Medical/Pharmaceutical
Construction
Farm/Ranch
Gas/Oil
Entertainment/Cultural/Stadium/Casino
Hotel/Resort
Multinational Corporation
Industrial/Textiles/Factory
Restaurant/Bar/Café
Bank/Commerce
Retail/Grocery/Bakery
Number of Targets
2009 2010 2011 2012 2013 2014 2015 2016
100
90
80
70
60
50
40
30
20
10
0
8
7
6
5
4
3
2
1
0
Limit Written Price Index
Source: Guy Carpenter Terrorism database
F-1 | GLOBAL INSURANCE GAP 2015 – ECONOMIC AVERAGE ANNUAL LOSS
% Uninsured GapSource: AIRWorldwide, A Verisk Analytics Business
Un
insu
red
Gap
Per
cen
tag
e
0
10
20
30
40
50
60
70
80
90
100
OceaniaNorth AmericaLatin AmericaEuropeAsia
92%
66%
87%
56%
63%
F-2 | EMEA INSURANCE GAP 2010 TO 2015 – ECONOMIC AVERAGE ANNUAL LOSS
% Gap Source: Munich Re NatCatSERVICE
Gap
Per
cen
tag
e
0
10
20
30
40
50
60
70
80
90
100
201520142013201220112010
75%
45%
84%
51%
59%56%
EUR
Bill
ions
73 Reinsurers41 Reinsurers
GROWTH PROFITABILITY
RISK
Policies cededto Flood Re
Volatility managedthrough outwards
reinsurance
Fund shortages:“Levy 2” capital call
Flood Re
Flood premiums
Flood claims
Levy 1Industry levy(£180m p.a.)
F-3 | NATIONAL FIOOD INSURANCE PROGRAM DEBT TO THE U.S. TREASURY
USD
Bill
ions
F-5 | WHAT ARE THE COMPELLING REASONS TO WRITE THIS?
F-6 | TERRORISM POOL PRICE INDEX VERSUS CAPACITY
More people live inside the circle than outside.
Risk Spread overSponsor Expected Risk Amount Benchmark Index Measurement Attachment Exhaustion
Year Deal Name Name Maturity Period ($MM) Tranche (in bps) Risk Location Period Level (%) Level (%)
2003 Vita Capital Ltd. Swiss Re 1/1/2007 4 years 400.00 Notes 135 U.S. / U.K. / France / Italy / Switzerland
1 calendar year 130 150
62.00 Class B Notes 90 120 125200.00 Class C Notes 140 115 120100.00 Class D Notes 190 110 11575.00 Class A Notes (wrapped) 19 115 12080.00 Class B Notes 300 110 115129.00 Class B-1 Notes (wrapped) 20 114 11964.50 Class B-2 Notes 120 114 119150.00 Class C Notes 285 110 114100.00 Class D Notes 500 106 110
1/1/2011 4 years 100.00 Class A-IV (wrapped) 21 125 1451/1/2012 5 years 100.00 Class A-V (wrapped) 20 125 1451/1/2011 4 years 70.97 Class A-VI (wrapped) 21 125 1451/1/2012 5 years 129.04 Class A-VII 80 125 1451/1/2011 4 years 90.00 Class B-I 110 120 1251/1/2012 5 years 50.00 Class B-II 112 120 1251/1/2011 4 years 39.38 Class B-III 110 120 1251/1/2012 5 years 50.00 Class B-V (wrapped) 21 120 1251/1/2011 4 years 70.97 Class B-VI (wrapped) 22 120 125
2008 Nathan Ltd. Munich Re 1/15/2013 5 years 100.00 Class A-I 135 U.S. / U.K. / Canada / Germany
2 consecutive calendar years
120 130
2009 Vita Capital IV Ltd. Swiss Re 1/15/2004 5 years 75.00 Class E 650 U.S. / U.K 2 consecutive calendar years
U.S.: 105UK: 112.5
U.S.: 110UK: 120
2010 Vita Capital IV Ltd. Swiss Re 1/15/2014 4 years 50.00 Series II, Class E 525 U.S / U.K 2 consecutive calendar years
U.S.: 105UK: 112.5
U.S.: 110UK: 120
100.0 Series V 280 Canada / Germany CAN: 120, GER: 125
CAN: 130, GER: 135
80.0 Series VI 385US / UK/ Canada /
Germany
U.S. : 105; UK: 115; GER/CAN:
110
U.S.: 110; UK: 120;
GER/CAN: 115
125.00 Class D-1 Notes 270 Canada / Australia CAN: 120, AUS: 135
CAN: 130, AUS: 145
150.00 Class E-1 Notes 340 US / Canada / AustraliaCAN: 110, AUS: 120, U.S.: 105
CAN: 115, AUS: 130, U.S.: 110
Mythen Re 2012-2 1/15/2016 4 years 120.00 Class A (includes US hurricane) 850 U.K. 2 consecu�ve calendar years
125 135
2013 Atlas IX Re SCOR 1/17/2019 6 years 180.00 300 U.S. 2 consecu�ve calendar years
102 104
EUR135.00 Class A 255 France, Japan, U.S. 1 calendar yearFR: 108.1; JP: 108.2; U.S. 104.1
FR: 108.1; JP: 108.2; U.S. 104.2
EUR150.00 Class B 335 France, Japan, U.S. 1 calendar yearFR: 116; JP: 116; U.S. 108
FR: 116; JP: 116; U.S. 109
Vita Capital VI Swiss Re 1/8/2021 5 years 100.00 Class A 290 Australia, Canada and U.K.
1 calendar year
Year 1: AUS: 120; CAN: 115; UK: 120;
Dropdown feature in subsequent
years
Year 1: AUS: 130; CAN: 125; UK: 140;
Dropdown feature in
subsequent years
2 consecu�ve calendar years
Vita Capital IV
2 consecu�ve calendar years2012
2011 Swiss Re
Vita Capital VSwiss Re
4 years
4 years
1/15/2016
1/15/2017
2 consecutive calendar years
2 consecutive calendar years
2007 Vita Capital III Ltd. Swiss Re U.S. / U.K. / Germany / Japan / Canada
2 consecutive calendar years
U.S. / France / Japan2006 Osiris Capital p.l.c. AXA 1/15/2010 4 years
U.S. / U.K. / France / Italy / Switzerland
2 consecutive calendar years
2006 Tartan Capital Ltd. Scottish Re 1/7/2009 3 years U.S.
2005 Vita Capital II Ltd. Swiss Re 1/1/2010 5 years
Benu Capital 5 years1/8/2020AXA
2015
PLACEHOLDER
F-7 | NATURAL CATASTROPHE LOSSES: 1970-2015
Source: Swiss Re, sigma No. 1/2016 and Guy Carpenter.
0
50
100
150
200
250
300
350
400
450
1970 1975 1980 1985 1990 1995 2000 2005 2010 2015
Insured losses Uninsured losses 10 per. Mov. Avg. (Total Insured Losses) 10 per. Mov. Avg. (Total Eco Losses)
USD
Bill
ions
Source: Guy Carpenter from figures reported by FEMA and the NFIP
Source: FreddieMac (www.freddiemac.com) and Fannie Mae (www.fanniemae.com)
F-4 | CUMULATIVE LIMIT PLACED
USD
Bill
ions
.2.81.2
3.6
2.4
5.3
6
5
4
3
2
1
0
2013/2014 2015
Freddie Fannie
2016 YTD
F-8 | TRANSPORTATION TARGETS ATTACKED BY TERRORISTS, 1970 – 2014
Source: START’s Global Terrorism Database, University of Maryland.
0% 10% 20% 30% 40%
Taxi/RickshawSubway
Highway/Road-RelatedAirline Officer/Personnel
Aircra� (not at an airport)Airport
Bus Sta�on/StopBridge/TunnelTrain Related
Bus (excluding tourists)
Percent of Transporta�on Targets
Type
of T
rans
port
a�on
Tar
get
F-9 | TYPES OF BUSINESSES TARGETED BY TERRORIST ATTACKS WORLDWIDE, 1970 – 2014
Source: START’s Global Terrorism Database, University of Maryland.
0 500 1000 1500 2000 2500 3000 3500
Private Security Company/Firm
Mining
Medical/Pharmaceutical
Construction
Farm/Ranch
Gas/Oil
Entertainment/Cultural/Stadium/Casino
Hotel/Resort
Multinational Corporation
Industrial/Textiles/Factory
Restaurant/Bar/Café
Bank/Commerce
Retail/Grocery/Bakery
Number of Targets
2009 2010 2011 2012 2013 2014 2015 2016
100
90
80
70
60
50
40
30
20
10
0
8
7
6
5
4
3
2
1
0
Limit Written Price Index
Source: Guy Carpenter Terrorism database
F-1 | GLOBAL INSURANCE GAP 2015 – ECONOMIC AVERAGE ANNUAL LOSS
% Uninsured GapSource: AIRWorldwide, A Verisk Analytics Business
Un
insu
red
Gap
Per
cen
tag
e
0
10
20
30
40
50
60
70
80
90
100
OceaniaNorth AmericaLatin AmericaEuropeAsia
92%
66%
87%
56%
63%
F-2 | EMEA INSURANCE GAP 2010 TO 2015 – ECONOMIC AVERAGE ANNUAL LOSS
% Gap Source: Munich Re NatCatSERVICE
Gap
Per
cen
tag
e
0
10
20
30
40
50
60
70
80
90
100
201520142013201220112010
75%
45%
84%
51%
59%56%
EUR
Bill
ions
73 Reinsurers41 Reinsurers
GROWTH PROFITABILITY
RISK
Policies cededto Flood Re
Volatility managedthrough outwards
reinsurance
Fund shortages:“Levy 2” capital call
Flood Re
Flood premiums
Flood claims
Levy 1Industry levy(£180m p.a.)
7
PuBliC sECTOR sTRaTEgiC iniTiaTivEs in EmEaOrganizations throughout EMEA have significantly increased the establishment of strategic initiatives to close the
protection gap and improve society’s ability to recover from the devastating impact of natural catastrophe losses.
Marsh & McLennan Companies’ risk & insurance Services Segment, comprised of guy Carpenter and Marsh, have
developed resources and expertise to help clients in this area.
smaRT analyTiCs TO EnaBlE ThE QuanTifiCaTiOn Of Risk As economic and insured losses from natural catastrophes such as floods and hurricanes have increased dramatically,
there has been heightened demand for improved measurability and modeling of risk that allows carriers to better
underwrite and manage exposures and to create a more reliable view of previously uninsured risk. Analytics that
measure risks that are perceived to be “uninsurable” can help unlock private sector insurance industry participation.
in Europe, population growth is more modest than in other parts of the world, increasing from 580 million to 740
million, or 27 percent since 1957. in comparison, the total world population increased from 2.8 billion to 7.4 billion, or
161 percent during the same period. while it has grown at slower rates than the rest of the world, Europe has similarly
experienced a steady increase in urbanization leading to increased concentration of insured risk.
rising global temperatures are projected to impact the mid-latitude and polar regions more than the tropics. This
is expected to produce two outcomes. First, the temperature gradient between the poles and the equator will drop,
potentially reducing storm formation. Second, the higher overall temperature will increase evaporation and the amount
of water vapor in the atmosphere, potentially leading to more intense storms. The impact of these two changes leads to
a projection of increased frequency of both extreme rainfall events and extended dry periods in Europe.
As a result of these and other factors, the intergovernmental panel on Climate Change (ipCC) has identified three main
areas of risk for Europe:
1. rising sea levels, coastal erosion and peak river discharges, combined with advancing urbanization, will lead to
greater economic losses as a direct result of flooding;
2. reduction in water availability due to increased abstraction from river and groundwater and increased evaporative
load will result in greater risk of drought conditions, especially in southern Europe; and
3. more frequent occurrence of extreme heat events will impact human health, crops and the generation of wildfires.
The biggest modeling challenge for Europe is for flood. Europe is unusual in that it has countries with small geographies
and comparatively large rivers. Single flood events can hit more than one country and create correlation issues for
insurers and reinsurers. The most notable example of this is the danube river, which touches ten countries as it makes
its way from germany to the Black Sea.
Flood poses particular challenges for modeling: the hydraulic modeling of flood extents requires a high quality digital
terrain model processed specifically for the task by removing features like bridges. The computational demand for
hydraulic modeling is very high, especially as the size of the area to be modeled expands, and flood is also one of the few
perils that humans can directly influence through the construction of defense structures. unfortunately, detailed data
on the presence, construction standard and operational regimes of defenses is not universally available, consequently
considerable effort is needed by modelers to quantify this aspect. Finally, as flood damage occurs in a fairly binary
manner – either you are in the water or not – highly accurate information on the location of the risks to be modeled,
which is often lacking, is essential, especially in developing regions.
despite these challenges, the first models for flood in Europe began appearing in 2004. while commercial vendors
have been slow to address the gap so far, others, including brokers, have been steadily producing models. At guy
Carpenter, we have produced a range of flood models for key countries and a pan-European hailstorm model based
on detailed claims data. This represents an integral part of our effort to provide a means of quantification of risk in
order to enable insurance carriers to price and assume risks that were previously uninsured – and, when impacted by
catastrophe losses, ultimately burdened public sector balance sheets.
F-3 | NATIONAL FIOOD INSURANCE PROGRAM DEBT TO THE U.S. TREASURY
USD
Bill
ions
F-5 | WHAT ARE THE COMPELLING REASONS TO WRITE THIS?
F-6 | TERRORISM POOL PRICE INDEX VERSUS CAPACITY
More people live inside the circle than outside.
Risk Spread overSponsor Expected Risk Amount Benchmark Index Measurement Attachment Exhaustion
Year Deal Name Name Maturity Period ($MM) Tranche (in bps) Risk Location Period Level (%) Level (%)
2003 Vita Capital Ltd. Swiss Re 1/1/2007 4 years 400.00 Notes 135 U.S. / U.K. / France / Italy / Switzerland
1 calendar year 130 150
62.00 Class B Notes 90 120 125200.00 Class C Notes 140 115 120100.00 Class D Notes 190 110 11575.00 Class A Notes (wrapped) 19 115 12080.00 Class B Notes 300 110 115129.00 Class B-1 Notes (wrapped) 20 114 11964.50 Class B-2 Notes 120 114 119150.00 Class C Notes 285 110 114100.00 Class D Notes 500 106 110
1/1/2011 4 years 100.00 Class A-IV (wrapped) 21 125 1451/1/2012 5 years 100.00 Class A-V (wrapped) 20 125 1451/1/2011 4 years 70.97 Class A-VI (wrapped) 21 125 1451/1/2012 5 years 129.04 Class A-VII 80 125 1451/1/2011 4 years 90.00 Class B-I 110 120 1251/1/2012 5 years 50.00 Class B-II 112 120 1251/1/2011 4 years 39.38 Class B-III 110 120 1251/1/2012 5 years 50.00 Class B-V (wrapped) 21 120 1251/1/2011 4 years 70.97 Class B-VI (wrapped) 22 120 125
2008 Nathan Ltd. Munich Re 1/15/2013 5 years 100.00 Class A-I 135 U.S. / U.K. / Canada / Germany
2 consecutive calendar years
120 130
2009 Vita Capital IV Ltd. Swiss Re 1/15/2004 5 years 75.00 Class E 650 U.S. / U.K 2 consecutive calendar years
U.S.: 105UK: 112.5
U.S.: 110UK: 120
2010 Vita Capital IV Ltd. Swiss Re 1/15/2014 4 years 50.00 Series II, Class E 525 U.S / U.K 2 consecutive calendar years
U.S.: 105UK: 112.5
U.S.: 110UK: 120
100.0 Series V 280 Canada / Germany CAN: 120, GER: 125
CAN: 130, GER: 135
80.0 Series VI 385US / UK/ Canada /
Germany
U.S. : 105; UK: 115; GER/CAN:
110
U.S.: 110; UK: 120;
GER/CAN: 115
125.00 Class D-1 Notes 270 Canada / Australia CAN: 120, AUS: 135
CAN: 130, AUS: 145
150.00 Class E-1 Notes 340 US / Canada / AustraliaCAN: 110, AUS: 120, U.S.: 105
CAN: 115, AUS: 130, U.S.: 110
Mythen Re 2012-2 1/15/2016 4 years 120.00 Class A (includes US hurricane) 850 U.K. 2 consecu�ve calendar years
125 135
2013 Atlas IX Re SCOR 1/17/2019 6 years 180.00 300 U.S. 2 consecu�ve calendar years
102 104
EUR135.00 Class A 255 France, Japan, U.S. 1 calendar yearFR: 108.1; JP: 108.2; U.S. 104.1
FR: 108.1; JP: 108.2; U.S. 104.2
EUR150.00 Class B 335 France, Japan, U.S. 1 calendar yearFR: 116; JP: 116; U.S. 108
FR: 116; JP: 116; U.S. 109
Vita Capital VI Swiss Re 1/8/2021 5 years 100.00 Class A 290 Australia, Canada and U.K.
1 calendar year
Year 1: AUS: 120; CAN: 115; UK: 120;
Dropdown feature in subsequent
years
Year 1: AUS: 130; CAN: 125; UK: 140;
Dropdown feature in
subsequent years
2 consecu�ve calendar years
Vita Capital IV
2 consecu�ve calendar years2012
2011 Swiss Re
Vita Capital VSwiss Re
4 years
4 years
1/15/2016
1/15/2017
2 consecutive calendar years
2 consecutive calendar years
2007 Vita Capital III Ltd. Swiss Re U.S. / U.K. / Germany / Japan / Canada
2 consecutive calendar years
U.S. / France / Japan2006 Osiris Capital p.l.c. AXA 1/15/2010 4 years
U.S. / U.K. / France / Italy / Switzerland
2 consecutive calendar years
2006 Tartan Capital Ltd. Scottish Re 1/7/2009 3 years U.S.
2005 Vita Capital II Ltd. Swiss Re 1/1/2010 5 years
Benu Capital 5 years1/8/2020AXA
2015
PLACEHOLDER
F-7 | NATURAL CATASTROPHE LOSSES: 1970-2015
Source: Swiss Re, sigma No. 1/2016 and Guy Carpenter.
0
50
100
150
200
250
300
350
400
450
1970 1975 1980 1985 1990 1995 2000 2005 2010 2015
Insured losses Uninsured losses 10 per. Mov. Avg. (Total Insured Losses) 10 per. Mov. Avg. (Total Eco Losses)
USD
Bill
ions
Source: Guy Carpenter from figures reported by FEMA and the NFIP
Source: FreddieMac (www.freddiemac.com) and Fannie Mae (www.fanniemae.com)
F-4 | CUMULATIVE LIMIT PLACED
USD
Bill
ions
.2.81.2
3.6
2.4
5.3
6
5
4
3
2
1
0
2013/2014 2015
Freddie Fannie
2016 YTD
F-8 | TRANSPORTATION TARGETS ATTACKED BY TERRORISTS, 1970 – 2014
Source: START’s Global Terrorism Database, University of Maryland.
0% 10% 20% 30% 40%
Taxi/RickshawSubway
Highway/Road-RelatedAirline Officer/Personnel
Aircra� (not at an airport)Airport
Bus Sta�on/StopBridge/TunnelTrain Related
Bus (excluding tourists)
Percent of Transporta�on Targets
Type
of T
rans
port
a�on
Tar
get
F-9 | TYPES OF BUSINESSES TARGETED BY TERRORIST ATTACKS WORLDWIDE, 1970 – 2014
Source: START’s Global Terrorism Database, University of Maryland.
0 500 1000 1500 2000 2500 3000 3500
Private Security Company/Firm
Mining
Medical/Pharmaceutical
Construction
Farm/Ranch
Gas/Oil
Entertainment/Cultural/Stadium/Casino
Hotel/Resort
Multinational Corporation
Industrial/Textiles/Factory
Restaurant/Bar/Café
Bank/Commerce
Retail/Grocery/Bakery
Number of Targets
2009 2010 2011 2012 2013 2014 2015 2016
100
90
80
70
60
50
40
30
20
10
0
8
7
6
5
4
3
2
1
0
Limit Written Price Index
Source: Guy Carpenter Terrorism database
F-1 | GLOBAL INSURANCE GAP 2015 – ECONOMIC AVERAGE ANNUAL LOSS
% Uninsured GapSource: AIRWorldwide, A Verisk Analytics Business
Un
insu
red
Gap
Per
cen
tag
e
0
10
20
30
40
50
60
70
80
90
100
OceaniaNorth AmericaLatin AmericaEuropeAsia
92%
66%
87%
56%
63%
F-2 | EMEA INSURANCE GAP 2010 TO 2015 – ECONOMIC AVERAGE ANNUAL LOSS
% Gap Source: Munich Re NatCatSERVICE
Gap
Per
cen
tag
e
0
10
20
30
40
50
60
70
80
90
100
201520142013201220112010
75%
45%
84%
51%
59%56%
EUR
Bill
ions
73 Reinsurers41 Reinsurers
GROWTH PROFITABILITY
RISK
Policies cededto Flood Re
Volatility managedthrough outwards
reinsurance
Fund shortages:“Levy 2” capital call
Flood Re
Flood premiums
Flood claims
Levy 1Industry levy(£180m p.a.)
8
highlighTs Of RECEnT PuBliC sECTOR iniTiaTivEs
flood Re - april 2016Following years of planning by the insurance industry and negotiation with a wide group of stakeholders including
the government, prudential regulatory Authority (prA), the Financial Conduct Authority (FCA) and others, Flood re
launched in April 2016. The overarching aim of the market-based scheme is to ensure better access to more affordable
household insurance for those in high flood risk areas.
Flood re brings long-needed stability to a marketplace recently beset by major flood events. A 25-year initiative,
the value of the scheme reaches beyond providing a framework for the provision of insurance. All stakeholders
are committed to working in unison with government to deliver its objective of boosting public confidence and
understanding; re-establishing a functioning flood insurance market that supports the customer; and strengthening
the overall national understanding of the peril to ensure that robust risk management strategies exist at all levels.
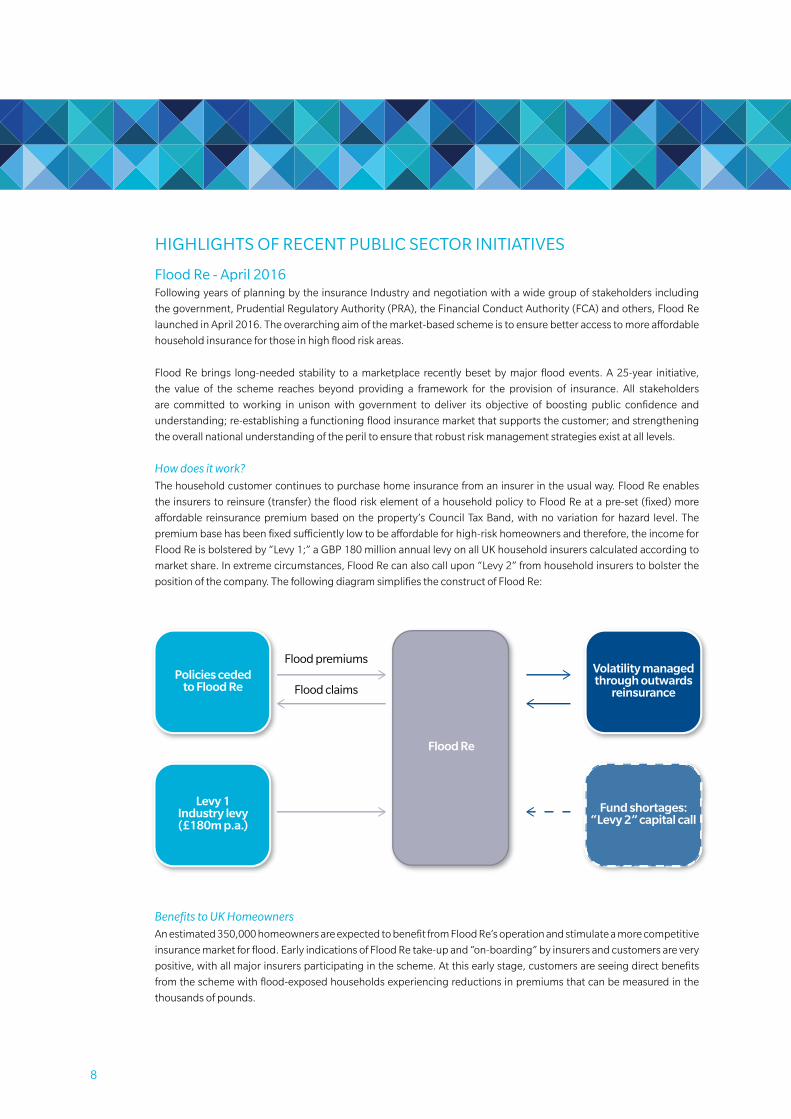
How does it work?The household customer continues to purchase home insurance from an insurer in the usual way. Flood re enables
the insurers to reinsure (transfer) the flood risk element of a household policy to Flood re at a pre-set (fixed) more
affordable reinsurance premium based on the property’s Council Tax Band, with no variation for hazard level. The
premium base has been fixed sufficiently low to be affordable for high-risk homeowners and therefore, the income for
Flood re is bolstered by “Levy 1;” a gBp 180 million annual levy on all uk household insurers calculated according to
market share. in extreme circumstances, Flood re can also call upon “Levy 2” from household insurers to bolster the
position of the company. The following diagram simplifies the construct of Flood re:
Benefits to UK HomeownersAn estimated 350,000 homeowners are expected to benefit from Flood re’s operation and stimulate a more competitive
insurance market for flood. Early indications of Flood re take-up and “on-boarding” by insurers and customers are very
positive, with all major insurers participating in the scheme. At this early stage, customers are seeing direct benefits
from the scheme with flood-exposed households experiencing reductions in premiums that can be measured in the
thousands of pounds.
F-3 | NATIONAL FIOOD INSURANCE PROGRAM DEBT TO THE U.S. TREASURY
USD
Bill
ions
F-5 | WHAT ARE THE COMPELLING REASONS TO WRITE THIS?
F-6 | TERRORISM POOL PRICE INDEX VERSUS CAPACITY
More people live inside the circle than outside.
Risk Spread overSponsor Expected Risk Amount Benchmark Index Measurement Attachment Exhaustion
Year Deal Name Name Maturity Period ($MM) Tranche (in bps) Risk Location Period Level (%) Level (%)
2003 Vita Capital Ltd. Swiss Re 1/1/2007 4 years 400.00 Notes 135 U.S. / U.K. / France / Italy / Switzerland
1 calendar year 130 150
62.00 Class B Notes 90 120 125200.00 Class C Notes 140 115 120100.00 Class D Notes 190 110 11575.00 Class A Notes (wrapped) 19 115 12080.00 Class B Notes 300 110 115129.00 Class B-1 Notes (wrapped) 20 114 11964.50 Class B-2 Notes 120 114 119150.00 Class C Notes 285 110 114100.00 Class D Notes 500 106 110
1/1/2011 4 years 100.00 Class A-IV (wrapped) 21 125 1451/1/2012 5 years 100.00 Class A-V (wrapped) 20 125 1451/1/2011 4 years 70.97 Class A-VI (wrapped) 21 125 1451/1/2012 5 years 129.04 Class A-VII 80 125 1451/1/2011 4 years 90.00 Class B-I 110 120 1251/1/2012 5 years 50.00 Class B-II 112 120 1251/1/2011 4 years 39.38 Class B-III 110 120 1251/1/2012 5 years 50.00 Class B-V (wrapped) 21 120 1251/1/2011 4 years 70.97 Class B-VI (wrapped) 22 120 125
2008 Nathan Ltd. Munich Re 1/15/2013 5 years 100.00 Class A-I 135 U.S. / U.K. / Canada / Germany
2 consecutive calendar years
120 130
2009 Vita Capital IV Ltd. Swiss Re 1/15/2004 5 years 75.00 Class E 650 U.S. / U.K 2 consecutive calendar years
U.S.: 105UK: 112.5
U.S.: 110UK: 120
2010 Vita Capital IV Ltd. Swiss Re 1/15/2014 4 years 50.00 Series II, Class E 525 U.S / U.K 2 consecutive calendar years
U.S.: 105UK: 112.5
U.S.: 110UK: 120
100.0 Series V 280 Canada / Germany CAN: 120, GER: 125
CAN: 130, GER: 135
80.0 Series VI 385US / UK/ Canada /
Germany
U.S. : 105; UK: 115; GER/CAN:
110
U.S.: 110; UK: 120;
GER/CAN: 115
125.00 Class D-1 Notes 270 Canada / Australia CAN: 120, AUS: 135
CAN: 130, AUS: 145
150.00 Class E-1 Notes 340 US / Canada / AustraliaCAN: 110, AUS: 120, U.S.: 105
CAN: 115, AUS: 130, U.S.: 110
Mythen Re 2012-2 1/15/2016 4 years 120.00 Class A (includes US hurricane) 850 U.K. 2 consecu�ve calendar years
125 135
2013 Atlas IX Re SCOR 1/17/2019 6 years 180.00 300 U.S. 2 consecu�ve calendar years
102 104
EUR135.00 Class A 255 France, Japan, U.S. 1 calendar yearFR: 108.1; JP: 108.2; U.S. 104.1
FR: 108.1; JP: 108.2; U.S. 104.2
EUR150.00 Class B 335 France, Japan, U.S. 1 calendar yearFR: 116; JP: 116; U.S. 108
FR: 116; JP: 116; U.S. 109
Vita Capital VI Swiss Re 1/8/2021 5 years 100.00 Class A 290 Australia, Canada and U.K.
1 calendar year
Year 1: AUS: 120; CAN: 115; UK: 120;
Dropdown feature in subsequent
years
Year 1: AUS: 130; CAN: 125; UK: 140;
Dropdown feature in
subsequent years
2 consecu�ve calendar years
Vita Capital IV
2 consecu�ve calendar years2012
2011 Swiss Re
Vita Capital VSwiss Re
4 years
4 years
1/15/2016
1/15/2017
2 consecutive calendar years
2 consecutive calendar years
2007 Vita Capital III Ltd. Swiss Re U.S. / U.K. / Germany / Japan / Canada
2 consecutive calendar years
U.S. / France / Japan2006 Osiris Capital p.l.c. AXA 1/15/2010 4 years
U.S. / U.K. / France / Italy / Switzerland
2 consecutive calendar years
2006 Tartan Capital Ltd. Scottish Re 1/7/2009 3 years U.S.
2005 Vita Capital II Ltd. Swiss Re 1/1/2010 5 years
Benu Capital 5 years1/8/2020AXA
2015
PLACEHOLDER
F-7 | NATURAL CATASTROPHE LOSSES: 1970-2015
Source: Swiss Re, sigma No. 1/2016 and Guy Carpenter.
0
50
100
150
200
250
300
350
400
450
1970 1975 1980 1985 1990 1995 2000 2005 2010 2015
Insured losses Uninsured losses 10 per. Mov. Avg. (Total Insured Losses) 10 per. Mov. Avg. (Total Eco Losses)
USD
Bill
ions
Source: Guy Carpenter from figures reported by FEMA and the NFIP
Source: FreddieMac (www.freddiemac.com) and Fannie Mae (www.fanniemae.com)
F-4 | CUMULATIVE LIMIT PLACED
USD
Bill
ions
.2.81.2
3.6
2.4
5.3
6
5
4
3
2
1
0
2013/2014 2015
Freddie Fannie
2016 YTD
F-8 | TRANSPORTATION TARGETS ATTACKED BY TERRORISTS, 1970 – 2014
Source: START’s Global Terrorism Database, University of Maryland.
0% 10% 20% 30% 40%
Taxi/RickshawSubway
Highway/Road-RelatedAirline Officer/Personnel
Aircra� (not at an airport)Airport
Bus Sta�on/StopBridge/TunnelTrain Related
Bus (excluding tourists)
Percent of Transporta�on Targets
Type
of T
rans
port
a�on
Tar
get
F-9 | TYPES OF BUSINESSES TARGETED BY TERRORIST ATTACKS WORLDWIDE, 1970 – 2014
Source: START’s Global Terrorism Database, University of Maryland.
0 500 1000 1500 2000 2500 3000 3500
Private Security Company/Firm
Mining
Medical/Pharmaceutical
Construction
Farm/Ranch
Gas/Oil
Entertainment/Cultural/Stadium/Casino
Hotel/Resort
Multinational Corporation
Industrial/Textiles/Factory
Restaurant/Bar/Café
Bank/Commerce
Retail/Grocery/Bakery
Number of Targets
2009 2010 2011 2012 2013 2014 2015 2016
100
90
80
70
60
50
40
30
20
10
0
8
7
6
5
4
3
2
1
0
Limit Written Price Index
Source: Guy Carpenter Terrorism database
F-1 | GLOBAL INSURANCE GAP 2015 – ECONOMIC AVERAGE ANNUAL LOSS
% Uninsured GapSource: AIRWorldwide, A Verisk Analytics Business
Un
insu
red
Gap
Per
cen
tag
e
0
10
20
30
40
50
60
70
80
90
100
OceaniaNorth AmericaLatin AmericaEuropeAsia
92%
66%
87%
56%
63%
F-2 | EMEA INSURANCE GAP 2010 TO 2015 – ECONOMIC AVERAGE ANNUAL LOSS
% Gap Source: Munich Re NatCatSERVICE
Gap
Per
cen
tag
e
0
10
20
30
40
50
60
70
80
90
100
201520142013201220112010
75%
45%
84%
51%
59%56%
EUR
Bill
ions
73 Reinsurers41 Reinsurers
GROWTH PROFITABILITY
RISK
Policies cededto Flood Re
Volatility managedthrough outwards
reinsurance
Fund shortages:“Levy 2” capital call
Flood Re
Flood premiums
Flood claims
Levy 1Industry levy(£180m p.a.)
9
There was a high level of collaboration between Flood re and guy Carpenter in the launch of the scheme. working
together, the two teams developed key parts of the business plan submission to the prA; the expected portfolio
composition and build-up analysis; catastrophe modeling and realistic disaster scenario testing; and the design and
testing of operational systems.
A gBp 2.1 billion multi-year reinsurance program was placed to ensure that the scheme could be operationalized.
despite its scale, the placement was completed on time and within budget. Flood re also broke new ground in that
the placement was the first known reinsurance program procured under the European union (Eu) and uk public
procurement regulation, requiring the design of a bespoke reinsurance strategy to meet the regulatory requirements.
British insurance Brokers’ association (BiBa) flood scheme in the united kingdom, guy Carpenter is working with BiBA on a new commercial insurance scheme for businesses
that will provide flood cover for many commercial premises located in flood risk areas. The scheme aims to bring to
market an innovative product to offer flood cover for many business and landlord risks that are ineligible for Flood re.
Property level flood Resilience ProjectThe uk government department for Environment, Food and rural Affairs (dEFrA), working closely with the uk
insurance industry to implement Flood re, also has a wider interest in improving property resilience throughout
the country. Marsh, a leading global insurance broker, through their involvement in BErg (Business Emergency
resilience group) has a leading role in the property Level Flood resilience project, which is designed to implement
the necessary measures and incentives to “make people and their property less vulnerable to the physical and
mental impacts of flooding.” This industry-wide project’s recommendations include the exploration of new building
regulations; the introduction of rigorous independent standards and certifications processes; and the creation of an
independent information portal to help homeowners and small- and medium-sized entities make their properties
more flood resilient.
italy Catastrophe scheme guy Carpenter italy is currently engaged with the italian Association of insurers (ANiA) in a joint initiative to quantify
the risk faced by italian communities from all natural perils exposing the country – earthquake, flood, flash flood,
landslides, mudslides and tsunami. we worked with the italian government in 2014 and 2015 to develop a national
scheme for affordable natural catastrophe insurance for homeowners. we continue our commitment to the italian
insurance industry with the goal of creating a new ppp (private-public-partnership) that combines the efficiency of
private companies with the effectiveness of the State guarantee.
10 2. idf Press Release, april 2016.
ClOsing ThE PROTECTiOn gaPThese trends are likely to support broader product offerings and greater market stability around which the private
sector may close the protection gap in EMEA and in other regions:
• Harness the global insurance industry’s capability to implement risk transfer solutions and promote risk mitigation measures.
A successful public/private approach to managing disaster risk, and the potential impact of climate change requires
the meaningful engagement of a wide spectrum of stakeholders to ensure that any solution is appropriately focused
and sustainable over the medium term. The insurance industry has a critical role in this initiative because of its ability
to use data to identify risk and employ cutting-edge modeling software to quantify, price and underwrite risks –
providing the mechanism to effectively spread and diversify risk worldwide.
The insurance industry has a pivotal role in educating and incentivizing its policyholder base to employ risk mitigation
measures in order to improve societal resilience to weather-related risk. in April 2016, the united Nations Secretary
general hosted a high-level meeting to address the topic of resilience. Subsequently, the insurance development
Forum (idF) was formed, on whose steering group, dan glaser, president & CEO of Marsh and McLennan
Companies, sits. The idF is an industry-wide body that will engage international entities to work together to achieve
a “better understanding and utilization of risk information that could help governments in better deployment of
their resources to build resilience to protect people and their property.”2
• Enhance Public/Private Partnerships.
An integrated and coordinated approach between the insurance industry and governments is increasingly
recognized as the most effective means of creating sustainable and effective risk transfer mechanisms. The approach
involves greater strategic dialogue between governmental departments, non-governmental organizations, the
scientific and academic communities and, of course, the insurance industry to promote a multifaceted approach
to disaster risk management and the implementation of insurance solutions. A joint collaboration may develop the
capacity to share complementary expertise that enables communities to better assess and understand risk; put in
place ex-ante prevention and resilience measures; combine resources to create effective risk transfer solutions; and
enable societies and communities to dramatically speed their recovery, post-loss.
• Improve data collection efforts.
One of the fundamental consequences of an absence of a functioning and comprehensive insurance market is the
resulting lack of useable data. historically, there have been insufficient efforts to systematically collate data relating to risk
exposures in developing and emerging economies. Swift economic development and the resultant dramatic escalation
in insurable values exposed to natural catastrophes, coupled with rapid urbanization in coastal areas and a significant
increase in global interconnectedness may mean that data quality in many emerging economies is limited at best.
Collecting reliable exposure data will help identify areas of underinsurance, enabling policymakers and non-government
organizations to develop risk transfer mechanisms and focus on segments of the population most at need.
• Product transparency and innovation.
The fundamental factors that most contribute to the protection gap, such as low insurance penetration and lack
of insurability, must be addressed at the source. Some insurance products may be too complex for promotion of
increased uptake, language may be confusing and/or archaic and myriad exclusions and clauses may be difficult to
understand. As a result, there is significant room for policyholder misinterpretation, potentially leading to voided
and non-responding policies. The distribution of insurance products also needs to become more streamlined, more
cost-effective and more user-friendly from the customer’s perspective. The use of emerging technology is critical in
creating a cheaper and more customer-friendly insurance purchase experience.
insurers need to innovate by anticipating emerging risks such as new technologies and previously unknown risks;
new products they develop in response to those risks may ensure that society is more resilient to significant loss
scenarios and create opportunities for growth.
113. http://fema.gov/blog/2016-09-21/testing-new-tool-strengthen-flood-insurance
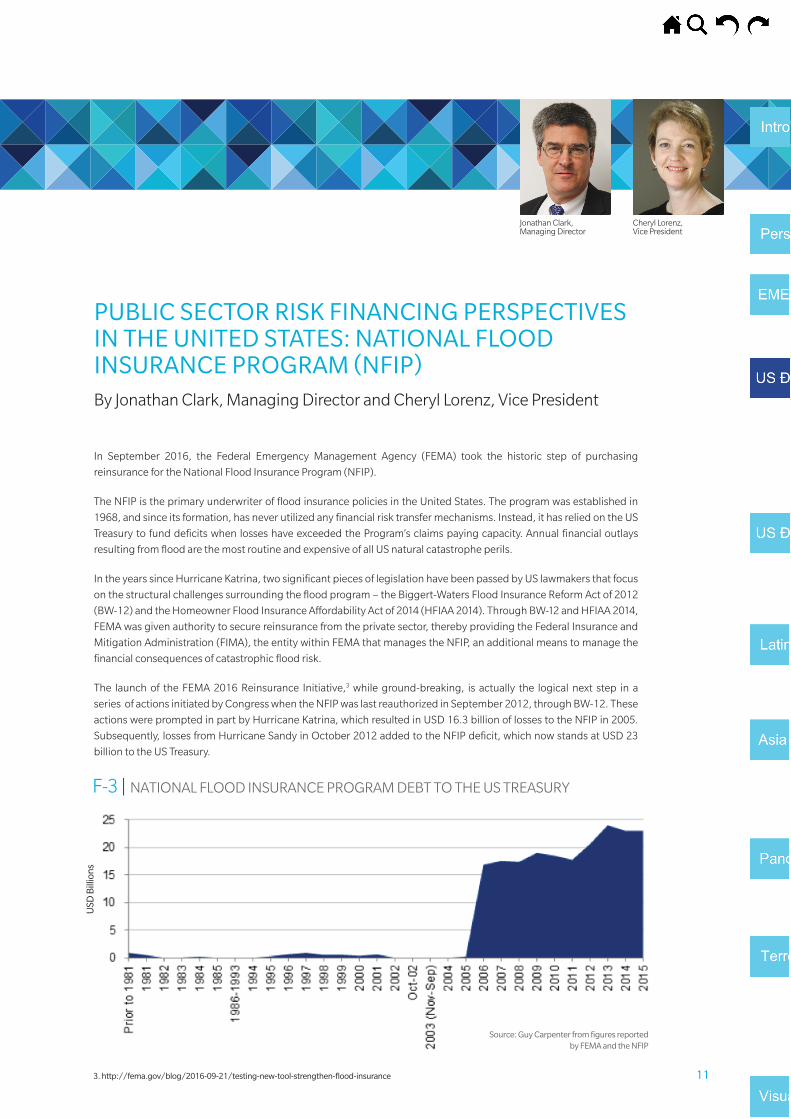
PUBLIC SECTOR RISK FINANCING PERSPECTIVES IN THE UNITED STATES: NATIONAL FLOOD INSURANCE PROGRAM (NFIP)By Jonathan Clark, Managing Director and Cheryl Lorenz, Vice President
In September 2016, the Federal Emergency Management Agency (FEMA) took the historic step of purchasing
reinsurance for the National Flood Insurance Program (NFIP).
The NFIP is the primary underwriter of flood insurance policies in the United States. The program was established in
1968, and since its formation, has never utilized any financial risk transfer mechanisms. Instead, it has relied on the US
Treasury to fund deficits when losses have exceeded the Program’s claims paying capacity. Annual financial outlays
resulting from flood are the most routine and expensive of all US natural catastrophe perils.
In the years since Hurricane Katrina, two significant pieces of legislation have been passed by US lawmakers that focus
on the structural challenges surrounding the flood program – the Biggert-Waters Flood Insurance Reform Act of 2012
(BW-12) and the Homeowner Flood Insurance Affordability Act of 2014 (HFIAA 2014). Through BW-12 and HFIAA 2014,
FEMA was given authority to secure reinsurance from the private sector, thereby providing the Federal Insurance and
Mitigation Administration (FIMA), the entity within FEMA that manages the NFIP, an additional means to manage the
financial consequences of catastrophic flood risk.
The launch of the FEMA 2016 Reinsurance Initiative,3 while ground-breaking, is actually the logical next step in a
series of actions initiated by Congress when the NFIP was last reauthorized in September 2012, through BW-12. These
actions were prompted in part by Hurricane Katrina, which resulted in USD 16.3 billion of losses to the NFIP in 2005.
Subsequently, losses from Hurricane Sandy in October 2012 added to the NFIP deficit, which now stands at USD 23
billion to the US Treasury.
F-3 | NATIONAL FLOOD INSURANCE PROGRAM DEBT TO THE US TREASURY
USD
Bill
ions
F-5 | WHAT ARE THE COMPELLING REASONS TO WRITE THIS?
F-6 | TERRORISM POOL PRICE INDEX VERSUS CAPACITY
More people live inside the circle than outside.
Risk Spread overSponsor Expected Risk Amount Benchmark Index Measurement Attachment Exhaustion
Year Deal Name Name Maturity Period ($MM) Tranche (in bps) Risk Location Period Level (%) Level (%)
2003 Vita Capital Ltd. Swiss Re 1/1/2007 4 years 400.00 Notes 135 U.S. / U.K. / France / Italy / Switzerland
1 calendar year 130 150
62.00 Class B Notes 90 120 125200.00 Class C Notes 140 115 120100.00 Class D Notes 190 110 11575.00 Class A Notes (wrapped) 19 115 12080.00 Class B Notes 300 110 115129.00 Class B-1 Notes (wrapped) 20 114 11964.50 Class B-2 Notes 120 114 119150.00 Class C Notes 285 110 114100.00 Class D Notes 500 106 110
1/1/2011 4 years 100.00 Class A-IV (wrapped) 21 125 1451/1/2012 5 years 100.00 Class A-V (wrapped) 20 125 1451/1/2011 4 years 70.97 Class A-VI (wrapped) 21 125 1451/1/2012 5 years 129.04 Class A-VII 80 125 1451/1/2011 4 years 90.00 Class B-I 110 120 1251/1/2012 5 years 50.00 Class B-II 112 120 1251/1/2011 4 years 39.38 Class B-III 110 120 1251/1/2012 5 years 50.00 Class B-V (wrapped) 21 120 1251/1/2011 4 years 70.97 Class B-VI (wrapped) 22 120 125
2008 Nathan Ltd. Munich Re 1/15/2013 5 years 100.00 Class A-I 135 U.S. / U.K. / Canada / Germany
2 consecutive calendar years
120 130
2009 Vita Capital IV Ltd. Swiss Re 1/15/2004 5 years 75.00 Class E 650 U.S. / U.K 2 consecutive calendar years
U.S.: 105UK: 112.5
U.S.: 110UK: 120
2010 Vita Capital IV Ltd. Swiss Re 1/15/2014 4 years 50.00 Series II, Class E 525 U.S / U.K 2 consecutive calendar years
U.S.: 105UK: 112.5
U.S.: 110UK: 120
100.0 Series V 280 Canada / Germany CAN: 120, GER: 125
CAN: 130, GER: 135
80.0 Series VI 385US / UK/ Canada /
Germany
U.S. : 105; UK: 115; GER/CAN:
110
U.S.: 110; UK: 120;
GER/CAN: 115
125.00 Class D-1 Notes 270 Canada / Australia CAN: 120, AUS: 135
CAN: 130, AUS: 145
150.00 Class E-1 Notes 340 US / Canada / AustraliaCAN: 110, AUS: 120, U.S.: 105
CAN: 115, AUS: 130, U.S.: 110
Mythen Re 2012-2 1/15/2016 4 years 120.00 Class A (includes US hurricane) 850 U.K. 2 consecu�ve calendar years
125 135
2013 Atlas IX Re SCOR 1/17/2019 6 years 180.00 300 U.S. 2 consecu�ve calendar years
102 104
EUR135.00 Class A 255 France, Japan, U.S. 1 calendar yearFR: 108.1; JP: 108.2; U.S. 104.1
FR: 108.1; JP: 108.2; U.S. 104.2
EUR150.00 Class B 335 France, Japan, U.S. 1 calendar yearFR: 116; JP: 116; U.S. 108
FR: 116; JP: 116; U.S. 109
Vita Capital VI Swiss Re 1/8/2021 5 years 100.00 Class A 290 Australia, Canada and U.K.
1 calendar year
Year 1: AUS: 120; CAN: 115; UK: 120;
Dropdown feature in subsequent
years
Year 1: AUS: 130; CAN: 125; UK: 140;
Dropdown feature in
subsequent years
2 consecu�ve calendar years
Vita Capital IV
2 consecu�ve calendar years2012
2011 Swiss Re
Vita Capital VSwiss Re
4 years
4 years
1/15/2016
1/15/2017
2 consecutive calendar years
2 consecutive calendar years
2007 Vita Capital III Ltd. Swiss Re U.S. / U.K. / Germany / Japan / Canada
2 consecutive calendar years
U.S. / France / Japan2006 Osiris Capital p.l.c. AXA 1/15/2010 4 years
U.S. / U.K. / France / Italy / Switzerland
2 consecutive calendar years
2006 Tartan Capital Ltd. Scottish Re 1/7/2009 3 years U.S.
2005 Vita Capital II Ltd. Swiss Re 1/1/2010 5 years
Benu Capital 5 years1/8/2020AXA
2015
PLACEHOLDER
F-7 | NATURAL CATASTROPHE LOSSES: 1970-2015
Source: Swiss Re, sigma No. 1/2016 and Guy Carpenter.
0
50
100
150
200
250
300
350
400
450
1970 1975 1980 1985 1990 1995 2000 2005 2010 2015
Insured losses Uninsured losses 10 per. Mov. Avg. (Total Insured Losses) 10 per. Mov. Avg. (Total Eco Losses)
USD
Bill
ions
Source: Guy Carpenter from figures reported by FEMA and the NFIP
Source: FreddieMac (www.freddiemac.com) and Fannie Mae (www.fanniemae.com)
F-4 | CUMULATIVE LIMIT PLACED
USD
Bill
ions
.2.81.2
3.6
2.4
5.3
6
5
4
3
2
1
0
2013/2014 2015
Freddie Fannie
2016 YTD
F-8 | TRANSPORTATION TARGETS ATTACKED BY TERRORISTS, 1970 – 2014
Source: START’s Global Terrorism Database, University of Maryland.
0% 10% 20% 30% 40%
Taxi/RickshawSubway
Highway/Road-RelatedAirline Officer/Personnel
Aircra� (not at an airport)Airport
Bus Sta�on/StopBridge/TunnelTrain Related
Bus (excluding tourists)
Percent of Transporta�on Targets
Type
of T
rans
port
a�on
Tar
get
F-9 | TYPES OF BUSINESSES TARGETED BY TERRORIST ATTACKS WORLDWIDE, 1970 – 2014
Source: START’s Global Terrorism Database, University of Maryland.
0 500 1000 1500 2000 2500 3000 3500
Private Security Company/Firm
Mining
Medical/Pharmaceutical
Construction
Farm/Ranch
Gas/Oil
Entertainment/Cultural/Stadium/Casino
Hotel/Resort
Multinational Corporation
Industrial/Textiles/Factory
Restaurant/Bar/Café
Bank/Commerce
Retail/Grocery/Bakery
Number of Targets
2009 2010 2011 2012 2013 2014 2015 2016
100
90
80
70
60
50
40
30
20
10
0
8
7
6
5
4
3
2
1
0
Limit Written Price Index
Source: Guy Carpenter Terrorism database
F-1 | GLOBAL INSURANCE GAP 2015 – ECONOMIC AVERAGE ANNUAL LOSS
% Uninsured GapSource: AIRWorldwide, A Verisk Analytics Business
Un
insu
red
Gap
Per
cen
tag
e
0
10
20
30
40
50
60
70
80
90
100
OceaniaNorth AmericaLatin AmericaEuropeAsia
92%
66%
87%
56%
63%
F-2 | EMEA INSURANCE GAP 2010 TO 2015 – ECONOMIC AVERAGE ANNUAL LOSS
% Gap Source: Munich Re NatCatSERVICE
Gap
Per
cen
tag
e
0
10
20
30
40
50
60
70
80
90
100
201520142013201220112010
75%
45%
84%
51%
59%56%
EUR
Bill
ions
73 Reinsurers41 Reinsurers
GROWTH PROFITABILITY
RISK
Policies cededto Flood Re
Volatility managedthrough outwards
reinsurance
Fund shortages:“Levy 2” capital call
Flood Re
Flood premiums
Flood claims
Levy 1Industry levy(£180m p.a.)
Cheryl Lorenz, Vice President
Jonathan Clark, Managing Director
12 4. fEma.gov
The structure of FEMA’s inaugural 2016 placement is designed to support the NFip reinsurance initiative and a larger-
scale program expansion in early January 2017. The reinsurance treaty is designed to transfer risk while simultaneously
providing FiMA with a vehicle to live-test the systems, protocol and processes required to execute a broader scale
program across the global reinsurance market.
FEMA describes their criteria for successful implementation of this 2016 placement:4
• determine and enhance market outreach and placement processes and procedures in advance of early January 2017;
• enhance reinsurance claims payments processes and procedures in advance of January 2017 to ensure reinsurance
recoveries are readily available to pay policyholder claims quickly and effectively; and
• establish and upgrade a full reinsurance program strategy, design and overall operation based on lessons learned.
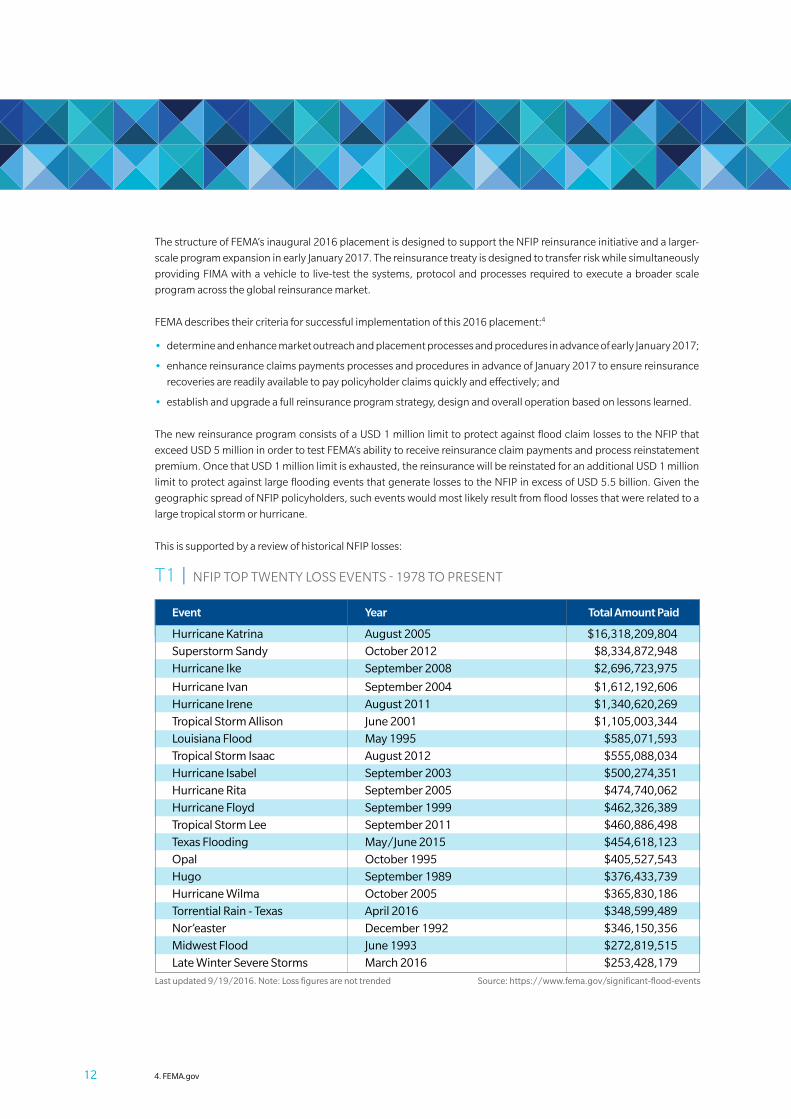
The new reinsurance program consists of a uSd 1 million limit to protect against flood claim losses to the NFip that
exceed uSd 5 million in order to test FEMA’s ability to receive reinsurance claim payments and process reinstatement
premium. Once that uSd 1 million limit is exhausted, the reinsurance will be reinstated for an additional uSd 1 million
limit to protect against large flooding events that generate losses to the NFip in excess of uSd 5.5 billion. given the
geographic spread of NFip policyholders, such events would most likely result from flood losses that were related to a
large tropical storm or hurricane.
This is supported by a review of historical NFip losses:
T1 | NFip TOp TwENTy LOSS EvENTS - 1978 TO prESENT
Event Year Total Amount Paid
hurricane katrina august 2005 $16,318,209,804
superstorm sandy October 2012 $8,334,872,948
hurricane ike september 2008 $2,696,723,975
hurricane ivan september 2004 $1,612,192,606
hurricane irene august 2011 $1,340,620,269
Tropical storm allison June 2001 $1,105,003,344
louisiana flood may 1995 $585,071,593
Tropical storm isaac august 2012 $555,088,034
hurricane isabel september 2003 $500,274,351
hurricane Rita september 2005 $474,740,062
hurricane floyd september 1999 $462,326,389
Tropical storm lee september 2011 $460,886,498
Texas flooding may/June 2015 $454,618,123
Opal October 1995 $405,527,543
hugo september 1989 $376,433,739
hurricane Wilma October 2005 $365,830,186
Torrential Rain - Texas april 2016 $348,599,489
nor’easter december 1992 $346,150,356
midwest flood June 1993 $272,819,515
late Winter severe storms march 2016 $253,428,179
source: https://www.fema.gov/significant-flood-eventslast updated 9/19/2016. note: loss figures are not trended
135. https://www.floods.org/ace-files/documentlibrary/2012_nfiP_Reform/ Reinsuring_
nfiP_insurance_Risk_and_Options_for_Privatizing_the_nfiP_Report.pdf
FEMA indicated that they intend to follow a path toward implementation of a larger-scale reinsurance program over
the next several years. The level of risk that will be transferred to reinsurers in January 2017 is unknown at this time
but FEMA has acknowledged that ultimately their goal is to broaden the NFip’s claims-paying ability and mitigate the
accumulation of future debt.
The NFip reinsurance initiative follows the work FEMA conducted through the Flood insurance risk Study (FirS), which
was required by Congress under Bw-12. FirS focused on two topics: 1) reinsurance and how that might support the
NFip; and 2) options that FEMA could consider for expanding private sector involvement and support around the NFip.
This work provided FEMA with more exposure to the reinsurance industry’s analytics surrounding storm surge and
inland flood modeling, which over time will benefit and support a more robust risk management effort for the NFip.5
lOOking TO ThE fuTuREguy Carpenter believes a fully functional private-public partnership between FEMA, private sector flood insurers and
reinsurers will benefit original policyholders and communities grappling with the challenges of flood risk. The FEMA
2016 reinsurance initiative is a positive step in this regard that aligns closely with FEMA’s advised long-term vision of
increasing the number of flood policies in the united States:
• reinsurers’ interactions with FEMA and their work with NFip data will produce greater familiarity with the nature of
flood losses and exposures and expand availability of uS reinsurance flood capacity over time. An expanded flood
reinsurance market will also benefit primary insurers’ ability to assume risk and improve flood insurance availability,
signaling easier access to flood coverage and potentially lower costs for policyholders.
• greater access to flood data, loss results and more reliable exposure modeling may bring change to the flood insurance/
reinsurance marketplace as new capital sources and alternative risk transfer markets can be engaged – collateralized
reinsurance, catastrophe bonds, sidecars, derivatives and other vehicles may be options. in addition to bringing
capacity to the table, they will spur innovation and promote more efficient pricing through increased competition.
14
PuBliC sECTOR Risk finanCing PERsPECTivEs in ThE uniTEd sTaTEs: ThE maRkET fOR mORTgagE CREdiT Risk (RE)insuRanCEBy Jeff krohn, Managing director and John Tedeschi, Managing director
The global financial crisis of 2008 exposed the uS mortgage industry, taxpayers and the global capital markets to the
full loss potential of residential mortgage credit risk. A total shakeup of the uS housing sector was the result: a return
to prudent underwriting criteria; market standardization in product; private Mortgage insurer Eligibility requirements
(pMiErs); and a Federal housing Finance Agency (FhFA) directive that mandates government sponsored entities
(gSEs) Fannie Mae and Freddie Mac to begin transferring credit risk on the hundreds of billions of dollars of uS
mortgages issued each year.
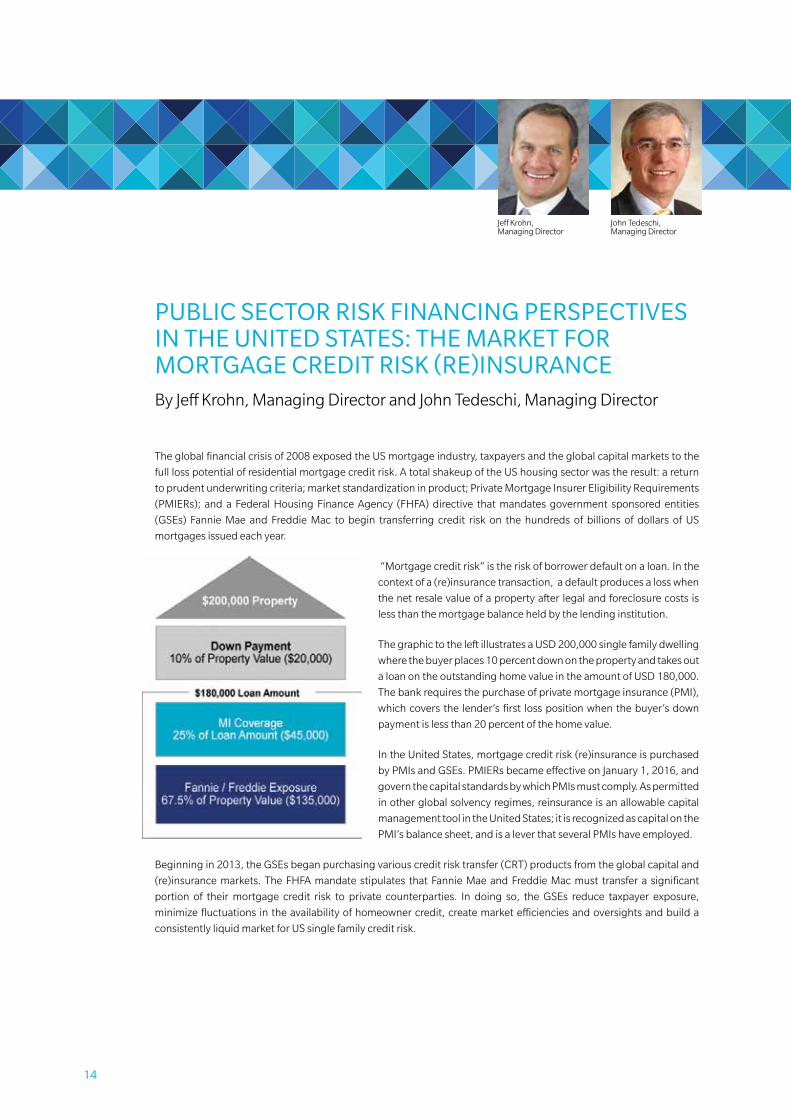
“Mortgage credit risk” is the risk of borrower default on a loan. in the
context of a (re)insurance transaction, a default produces a loss when
the net resale value of a property after legal and foreclosure costs is
less than the mortgage balance held by the lending institution.
The graphic to the left illustrates a uSd 200,000 single family dwelling
where the buyer places 10 percent down on the property and takes out
a loan on the outstanding home value in the amount of uSd 180,000.
The bank requires the purchase of private mortgage insurance (pMi),
which covers the lender’s first loss position when the buyer’s down
payment is less than 20 percent of the home value.
in the united States, mortgage credit risk (re)insurance is purchased
by pMis and gSEs. pMiErs became effective on January 1, 2016, and
govern the capital standards by which pMis must comply. As permitted
in other global solvency regimes, reinsurance is an allowable capital
management tool in the united States; it is recognized as capital on the
pMi’s balance sheet, and is a lever that several pMis have employed.
Beginning in 2013, the gSEs began purchasing various credit risk transfer (CrT) products from the global capital and
(re)insurance markets. The FhFA mandate stipulates that Fannie Mae and Freddie Mac must transfer a significant
portion of their mortgage credit risk to private counterparties. in doing so, the gSEs reduce taxpayer exposure,
minimize fluctuations in the availability of homeowner credit, create market efficiencies and oversights and build a
consistently liquid market for uS single family credit risk.
John Tedeschi, Managing director
Jeff krohn, Managing director
15
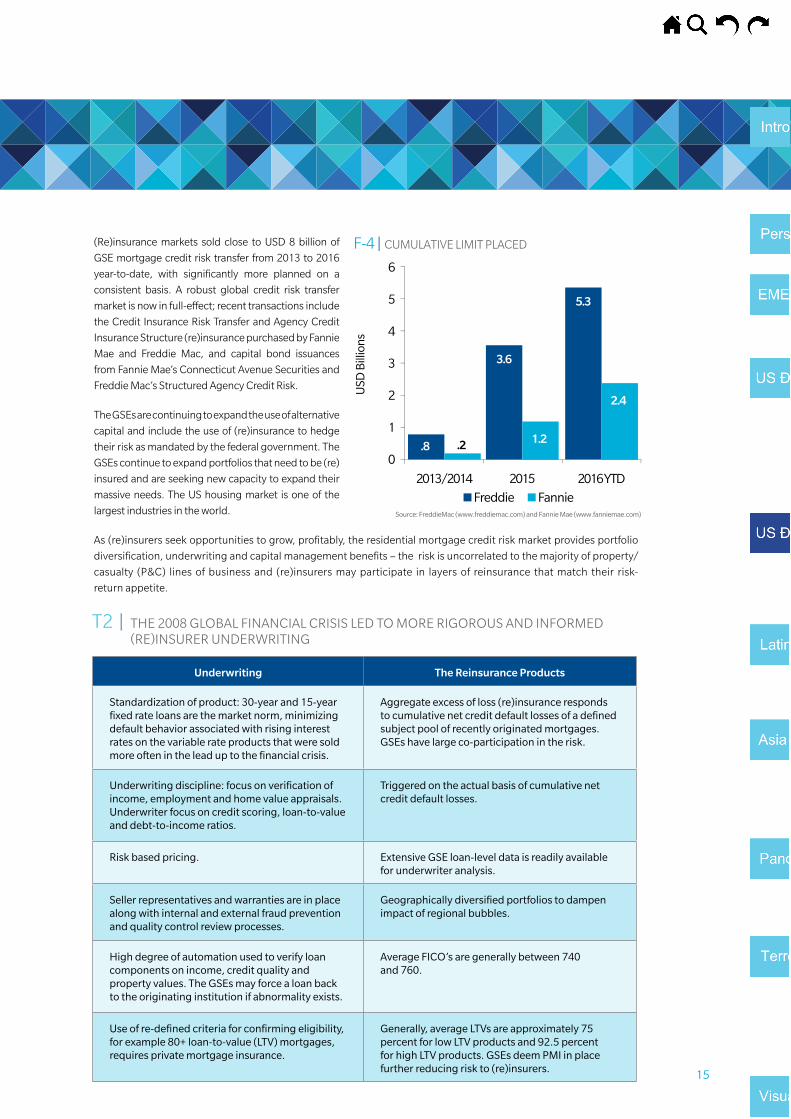
(re)insurance markets sold close to uSd 8 billion of
gSE mortgage credit risk transfer from 2013 to 2016
year-to-date, with significantly more planned on a
consistent basis. A robust global credit risk transfer
market is now in full-effect; recent transactions include
the Credit insurance risk Transfer and Agency Credit
insurance Structure (re)insurance purchased by Fannie
Mae and Freddie Mac, and capital bond issuances
from Fannie Mae’s Connecticut Avenue Securities and
Freddie Mac’s Structured Agency Credit risk.
The gSEs are continuing to expand the use of alternative
capital and include the use of (re)insurance to hedge
their risk as mandated by the federal government. The
gSEs continue to expand portfolios that need to be (re)
insured and are seeking new capacity to expand their
massive needs. The uS housing market is one of the
largest industries in the world.
As (re)insurers seek opportunities to grow, profitably, the residential mortgage credit risk market provides portfolio
diversification, underwriting and capital management benefits – the risk is uncorrelated to the majority of property/
casualty (p&C) lines of business and (re)insurers may participate in layers of reinsurance that match their risk-
return appetite.
F-3 | NATIONAL FIOOD INSURANCE PROGRAM DEBT TO THE U.S. TREASURY
USD
Bill
ions
F-5 | WHAT ARE THE COMPELLING REASONS TO WRITE THIS?
F-6 | TERRORISM POOL PRICE INDEX VERSUS CAPACITY
More people live inside the circle than outside.
Risk Spread overSponsor Expected Risk Amount Benchmark Index Measurement Attachment Exhaustion
Year Deal Name Name Maturity Period ($MM) Tranche (in bps) Risk Location Period Level (%) Level (%)
2003 Vita Capital Ltd. Swiss Re 1/1/2007 4 years 400.00 Notes 135 U.S. / U.K. / France / Italy / Switzerland
1 calendar year 130 150
62.00 Class B Notes 90 120 125200.00 Class C Notes 140 115 120100.00 Class D Notes 190 110 11575.00 Class A Notes (wrapped) 19 115 12080.00 Class B Notes 300 110 115129.00 Class B-1 Notes (wrapped) 20 114 11964.50 Class B-2 Notes 120 114 119150.00 Class C Notes 285 110 114100.00 Class D Notes 500 106 110
1/1/2011 4 years 100.00 Class A-IV (wrapped) 21 125 1451/1/2012 5 years 100.00 Class A-V (wrapped) 20 125 1451/1/2011 4 years 70.97 Class A-VI (wrapped) 21 125 1451/1/2012 5 years 129.04 Class A-VII 80 125 1451/1/2011 4 years 90.00 Class B-I 110 120 1251/1/2012 5 years 50.00 Class B-II 112 120 1251/1/2011 4 years 39.38 Class B-III 110 120 1251/1/2012 5 years 50.00 Class B-V (wrapped) 21 120 1251/1/2011 4 years 70.97 Class B-VI (wrapped) 22 120 125
2008 Nathan Ltd. Munich Re 1/15/2013 5 years 100.00 Class A-I 135 U.S. / U.K. / Canada / Germany
2 consecutive calendar years
120 130
2009 Vita Capital IV Ltd. Swiss Re 1/15/2004 5 years 75.00 Class E 650 U.S. / U.K 2 consecutive calendar years
U.S.: 105UK: 112.5
U.S.: 110UK: 120
2010 Vita Capital IV Ltd. Swiss Re 1/15/2014 4 years 50.00 Series II, Class E 525 U.S / U.K 2 consecutive calendar years
U.S.: 105UK: 112.5
U.S.: 110UK: 120
100.0 Series V 280 Canada / Germany CAN: 120, GER: 125
CAN: 130, GER: 135
80.0 Series VI 385US / UK/ Canada /
Germany
U.S. : 105; UK: 115; GER/CAN:
110
U.S.: 110; UK: 120;
GER/CAN: 115
125.00 Class D-1 Notes 270 Canada / Australia CAN: 120, AUS: 135
CAN: 130, AUS: 145
150.00 Class E-1 Notes 340 US / Canada / AustraliaCAN: 110, AUS: 120, U.S.: 105
CAN: 115, AUS: 130, U.S.: 110
Mythen Re 2012-2 1/15/2016 4 years 120.00 Class A (includes US hurricane) 850 U.K. 2 consecu�ve calendar years
125 135
2013 Atlas IX Re SCOR 1/17/2019 6 years 180.00 300 U.S. 2 consecu�ve calendar years
102 104
EUR135.00 Class A 255 France, Japan, U.S. 1 calendar yearFR: 108.1; JP: 108.2; U.S. 104.1
FR: 108.1; JP: 108.2; U.S. 104.2
EUR150.00 Class B 335 France, Japan, U.S. 1 calendar yearFR: 116; JP: 116; U.S. 108
FR: 116; JP: 116; U.S. 109
Vita Capital VI Swiss Re 1/8/2021 5 years 100.00 Class A 290 Australia, Canada and U.K.
1 calendar year
Year 1: AUS: 120; CAN: 115; UK: 120;
Dropdown feature in subsequent
years
Year 1: AUS: 130; CAN: 125; UK: 140;
Dropdown feature in
subsequent years
2 consecu�ve calendar years
Vita Capital IV
2 consecu�ve calendar years2012
2011 Swiss Re
Vita Capital VSwiss Re
4 years
4 years
1/15/2016
1/15/2017
2 consecutive calendar years
2 consecutive calendar years
2007 Vita Capital III Ltd. Swiss Re U.S. / U.K. / Germany / Japan / Canada
2 consecutive calendar years
U.S. / France / Japan2006 Osiris Capital p.l.c. AXA 1/15/2010 4 years
U.S. / U.K. / France / Italy / Switzerland
2 consecutive calendar years
2006 Tartan Capital Ltd. Scottish Re 1/7/2009 3 years U.S.
2005 Vita Capital II Ltd. Swiss Re 1/1/2010 5 years
Benu Capital 5 years1/8/2020AXA
2015
PLACEHOLDER
F-7 | NATURAL CATASTROPHE LOSSES: 1970-2015
Source: Swiss Re, sigma No. 1/2016 and Guy Carpenter.
0
50
100
150
200
250
300
350
400
450
1970 1975 1980 1985 1990 1995 2000 2005 2010 2015
Insured losses Uninsured losses 10 per. Mov. Avg. (Total Insured Losses) 10 per. Mov. Avg. (Total Eco Losses)
USD
Bill
ions
Source: Guy Carpenter from figures reported by FEMA and the NFIP
Source: FreddieMac (www.freddiemac.com) and Fannie Mae (www.fanniemae.com)
F-4 | CUMULATIVE LIMIT PLACED
USD
Bill
ions
.2.81.2
3.6
2.4
5.3
6
5
4
3
2
1
0
2013/2014 2015
Freddie Fannie
2016 YTD
F-8 | TRANSPORTATION TARGETS ATTACKED BY TERRORISTS, 1970 – 2014
Source: START’s Global Terrorism Database, University of Maryland.
0% 10% 20% 30% 40%
Taxi/RickshawSubway
Highway/Road-RelatedAirline Officer/Personnel
Aircra� (not at an airport)Airport
Bus Sta�on/StopBridge/TunnelTrain Related
Bus (excluding tourists)
Percent of Transporta�on Targets
Type
of T
rans
port
a�on
Tar
get
F-9 | TYPES OF BUSINESSES TARGETED BY TERRORIST ATTACKS WORLDWIDE, 1970 – 2014
Source: START’s Global Terrorism Database, University of Maryland.
0 500 1000 1500 2000 2500 3000 3500
Private Security Company/Firm
Mining
Medical/Pharmaceutical
Construction
Farm/Ranch
Gas/Oil
Entertainment/Cultural/Stadium/Casino
Hotel/Resort
Multinational Corporation
Industrial/Textiles/Factory
Restaurant/Bar/Café
Bank/Commerce
Retail/Grocery/Bakery
Number of Targets
2009 2010 2011 2012 2013 2014 2015 2016
100
90
80
70
60
50
40
30
20
10
0
8
7
6
5
4
3
2
1
0
Limit Written Price Index
Source: Guy Carpenter Terrorism database
F-1 | GLOBAL INSURANCE GAP 2015 – ECONOMIC AVERAGE ANNUAL LOSS
% Uninsured GapSource: AIRWorldwide, A Verisk Analytics Business
Un
insu
red
Gap
Per
cen
tag
e
0
10
20
30
40
50
60
70
80
90
100
OceaniaNorth AmericaLatin AmericaEuropeAsia
92%
66%
87%
56%
63%
F-2 | EMEA INSURANCE GAP 2010 TO 2015 – ECONOMIC AVERAGE ANNUAL LOSS
% Gap Source: Munich Re NatCatSERVICE
Gap
Per
cen
tag
e
0
10
20
30
40
50
60
70
80
90
100
201520142013201220112010
75%
45%
84%
51%
59%56%
EUR
Bill
ions
73 Reinsurers41 Reinsurers
GROWTH PROFITABILITY
RISK
Policies cededto Flood Re
Volatility managedthrough outwards
reinsurance
Fund shortages:“Levy 2” capital call
Flood Re
Flood premiums
Flood claims
Levy 1Industry levy(£180m p.a.)
Underwriting The Reinsurance Products
standardization of product: 30-year and 15-year fixed rate loans are the market norm, minimizing default behavior associated with rising interest rates on the variable rate products that were sold more often in the lead up to the financial crisis.
aggregate excess of loss (re)insurance responds to cumulative net credit default losses of a defined subject pool of recently originated mortgages. gsEs have large co-participation in the risk.
underwriting discipline: focus on verification of income, employment and home value appraisals. underwriter focus on credit scoring, loan-to-value and debt-to-income ratios.
Triggered on the actual basis of cumulative net credit default losses.
Risk based pricing. Extensive gsE loan-level data is readily available for underwriter analysis.
seller representatives and warranties are in place along with internal and external fraud prevention and quality control review processes.
geographically diversified portfolios to dampen impact of regional bubbles.
high degree of automation used to verify loan components on income, credit quality and property values. The gsEs may force a loan back to the originating institution if abnormality exists.
average fiCO’s are generally between 740 and 760.
use of re-defined criteria for confirming eligibility, for example 80+ loan-to-value (lTv) mortgages, requires private mortgage insurance.
generally, average lTvs are approximately 75 percent for low lTv products and 92.5 percent for high lTv products. gsEs deem Pmi in place further reducing risk to (re)insurers.
T2 | ThE 2008 gLOBAL FiNANCiAL CriSiS LEd TO MOrE rigOrOuS ANd iNFOrMEd (rE)iNSurEr uNdErwriTiNg
16
The strong underwriting discipline in all facets of the US mortgage system has dramatically reduced credit risk. The
macro-economic forecast for this sector is positive, given the diverse US economy, low interest rates and limited
housing supply. The GSEs are committed to a consistent issuance of debt or (re)insurance hedging strategies.
Guy Carpenter provides guidance to clients around participation in mortgage credit risk transactions. We encourage
clients and prospects to reach out to our team of specialists.
F-3 | NATIONAL FLOOD INSURANCE PROGRAM DEBT TO THE US TREASURY
USD
Bill
ions
F-5 | WHAT ARE THE COMPELLING REASONS TO WRITE THIS?
F-6 | TERRORISM POOL PRICE INDEX VERSUS CAPACITY
More people live inside the circle than outside.
Risk Spread overSponsor Expected Risk Amount Benchmark Index Measurement Attachment Exhaustion
Year Deal Name Name Maturity Period ($MM) Tranche (in bps) Risk Location Period Level (%) Level (%)
2003 Vita Capital Ltd. Swiss Re 1/1/2007 4 years 400.00 Notes 135 U.S. / U.K. / France / Italy / Switzerland
1 calendar year 130 150
62.00 Class B Notes 90 120 125200.00 Class C Notes 140 115 120100.00 Class D Notes 190 110 11575.00 Class A Notes (wrapped) 19 115 12080.00 Class B Notes 300 110 115129.00 Class B-1 Notes (wrapped) 20 114 11964.50 Class B-2 Notes 120 114 119150.00 Class C Notes 285 110 114100.00 Class D Notes 500 106 110
1/1/2011 4 years 100.00 Class A-IV (wrapped) 21 125 1451/1/2012 5 years 100.00 Class A-V (wrapped) 20 125 1451/1/2011 4 years 70.97 Class A-VI (wrapped) 21 125 1451/1/2012 5 years 129.04 Class A-VII 80 125 1451/1/2011 4 years 90.00 Class B-I 110 120 1251/1/2012 5 years 50.00 Class B-II 112 120 1251/1/2011 4 years 39.38 Class B-III 110 120 1251/1/2012 5 years 50.00 Class B-V (wrapped) 21 120 1251/1/2011 4 years 70.97 Class B-VI (wrapped) 22 120 125
2008 Nathan Ltd. Munich Re 1/15/2013 5 years 100.00 Class A-I 135 U.S. / U.K. / Canada / Germany
2 consecutive calendar years
120 130
2009 Vita Capital IV Ltd. Swiss Re 1/15/2004 5 years 75.00 Class E 650 U.S. / U.K 2 consecutive calendar years
U.S.: 105UK: 112.5
U.S.: 110UK: 120
2010 Vita Capital IV Ltd. Swiss Re 1/15/2014 4 years 50.00 Series II, Class E 525 U.S / U.K 2 consecutive calendar years
U.S.: 105UK: 112.5
U.S.: 110UK: 120
100.0 Series V 280 Canada / Germany CAN: 120, GER: 125
CAN: 130, GER: 135
80.0 Series VI 385US / UK/ Canada /
Germany
U.S. : 105; UK: 115; GER/CAN:
110
U.S.: 110; UK: 120;
GER/CAN: 115
125.00 Class D-1 Notes 270 Canada / Australia CAN: 120, AUS: 135
CAN: 130, AUS: 145
150.00 Class E-1 Notes 340 US / Canada / AustraliaCAN: 110, AUS: 120, U.S.: 105
CAN: 115, AUS: 130, U.S.: 110
Mythen Re 2012-2 1/15/2016 4 years 120.00 Class A (includes US hurricane) 850 U.K. 2 consecu�ve calendar years
125 135
2013 Atlas IX Re SCOR 1/17/2019 6 years 180.00 300 U.S. 2 consecu�ve calendar years
102 104
EUR135.00 Class A 255 France, Japan, U.S. 1 calendar yearFR: 108.1; JP: 108.2; U.S. 104.1
FR: 108.1; JP: 108.2; U.S. 104.2
EUR150.00 Class B 335 France, Japan, U.S. 1 calendar yearFR: 116; JP: 116; U.S. 108
FR: 116; JP: 116; U.S. 109
Vita Capital VI Swiss Re 1/8/2021 5 years 100.00 Class A 290 Australia, Canada and U.K.
1 calendar year
Year 1: AUS: 120; CAN: 115; UK: 120;
Dropdown feature in subsequent
years
Year 1: AUS: 130; CAN: 125; UK: 140;
Dropdown feature in
subsequent years
2 consecu�ve calendar years
Vita Capital IV
2 consecu�ve calendar years2012
2011 Swiss Re
Vita Capital VSwiss Re
4 years
4 years
1/15/2016
1/15/2017
2 consecutive calendar years
2 consecutive calendar years
2007 Vita Capital III Ltd. Swiss Re U.S. / U.K. / Germany / Japan / Canada
2 consecutive calendar years
U.S. / France / Japan2006 Osiris Capital p.l.c. AXA 1/15/2010 4 years
U.S. / U.K. / France / Italy / Switzerland
2 consecutive calendar years
2006 Tartan Capital Ltd. Scottish Re 1/7/2009 3 years U.S.
2005 Vita Capital II Ltd. Swiss Re 1/1/2010 5 years
Benu Capital 5 years1/8/2020AXA
2015
PLACEHOLDER
F-7 | NATURAL CATASTROPHE LOSSES: 1970-2015
Source: Swiss Re, sigma No. 1/2016 and Guy Carpenter.
0
50
100
150
200
250
300
350
400
450
1970 1975 1980 1985 1990 1995 2000 2005 2010 2015
Insured losses Uninsured losses 10 per. Mov. Avg. (Total Insured Losses) 10 per. Mov. Avg. (Total Eco Losses)
USD
Bill
ions
Source: Guy Carpenter from figures reported by FEMA and the NFIP
Source: FreddieMac (www.freddiemac.com) and Fannie Mae (www.fanniemae.com)
F-4 | CUMULATIVE LIMIT PLACED
USD
Bill
ions
.2.81.2
3.6
2.4
5.3
6
5
4
3
2
1
0
2013/2014 2015
Freddie Fannie
2016 YTD
F-8 | TRANSPORTATION TARGETS ATTACKED BY TERRORISTS, 1970 – 2014
Source: START’s Global Terrorism Database, University of Maryland.
0% 10% 20% 30% 40%
Taxi/RickshawSubway
Highway/Road-RelatedAirline Officer/Personnel
Aircra� (not at an airport)Airport
Bus Sta�on/StopBridge/TunnelTrain Related
Bus (excluding tourists)
Percent of Transporta�on Targets
Type
of T
rans
port
a�on
Tar
get
F-9 | TYPES OF BUSINESSES TARGETED BY TERRORIST ATTACKS WORLDWIDE, 1970 – 2014
Source: START’s Global Terrorism Database, University of Maryland.
0 500 1000 1500 2000 2500 3000 3500
Private Security Company/Firm
Mining
Medical/Pharmaceutical
Construction
Farm/Ranch
Gas/Oil
Entertainment/Cultural/Stadium/Casino
Hotel/Resort
Multinational Corporation
Industrial/Textiles/Factory
Restaurant/Bar/Café
Bank/Commerce
Retail/Grocery/Bakery
Number of Targets
2009 2010 2011 2012 2013 2014 2015 2016
100
90
80
70
60
50
40
30
20
10
0
8
7
6
5
4
3
2
1
0
Limit Written Price Index
Source: Guy Carpenter Terrorism database
F-1 | GLOBAL INSURANCE GAP 2015 – ECONOMIC AVERAGE ANNUAL LOSS
% Uninsured GapSource: AIRWorldwide, A Verisk Analytics Business
Un
insu
red
Gap
Per
cen
tag
e
0
10
20
30
40
50
60
70
80
90
100
OceaniaNorth AmericaLatin AmericaEuropeAsia
92%
66%
87%
56%
63%
F-2 | EMEA INSURANCE GAP 2010 TO 2015 – ECONOMIC AVERAGE ANNUAL LOSS
% Gap Source: Munich Re NatCatSERVICE
Gap
Per
cen
tag
e
0
10
20
30
40
50
60
70
80
90
100
201520142013201220112010
75%
45%
84%
51%
59%56%
EUR
Bill
ions
73 Reinsurers41 Reinsurers
GROWTH PROFITABILITY
RISK
Policies cededto Flood Re
Volatility managedthrough outwards
reinsurance
Fund shortages:“Levy 2” capital call
Flood Re
Flood premiums
Flood claims
Levy 1Industry levy(£180m p.a.)
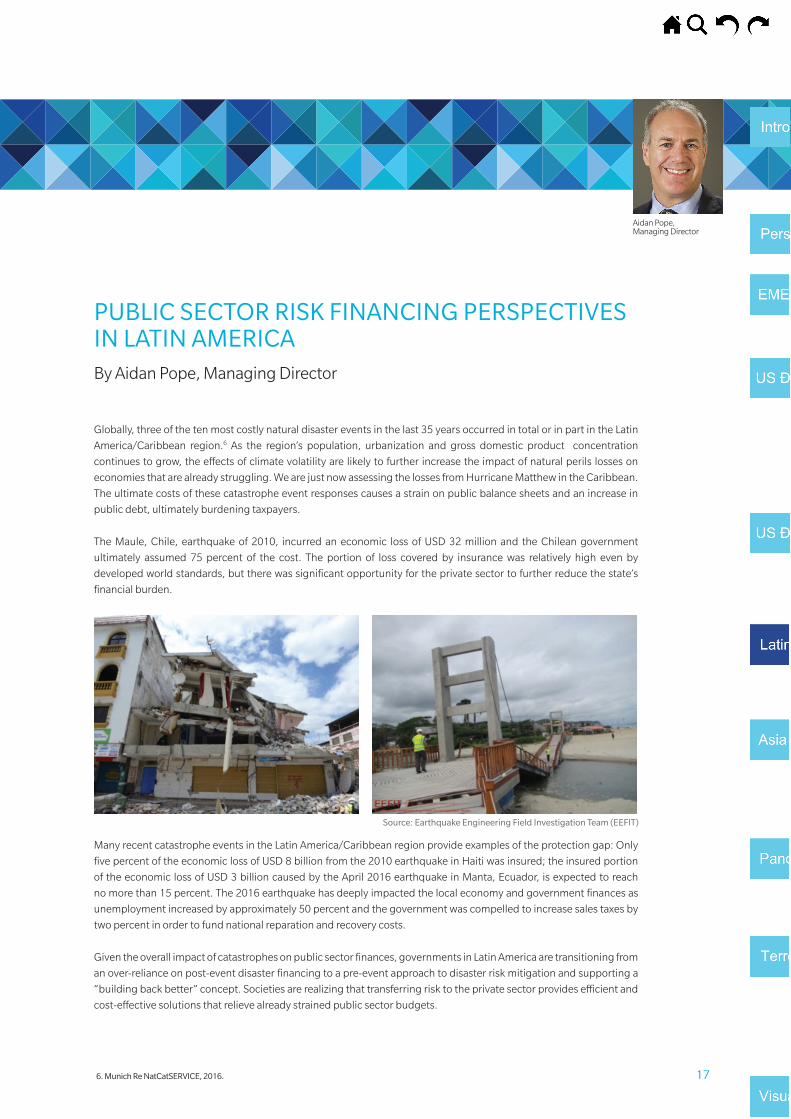
17 6. Munich Re NatCatSERVICE, 2016.
PUBLIC SECTOR RISK FINANCING PERSPECTIVES IN LATIN AMERICABy Aidan Pope, Managing Director
Globally, three of the ten most costly natural disaster events in the last 35 years occurred in total or in part in the Latin
America/Caribbean region.6 As the region’s population, urbanization and gross domestic product concentration
continues to grow, the effects of climate volatility are likely to further increase the impact of natural perils losses on
economies that are already struggling. We are just now assessing the losses from Hurricane Matthew in the Caribbean.
The ultimate costs of these catastrophe event responses causes a strain on public balance sheets and an increase in
public debt, ultimately burdening taxpayers.
The Maule, Chile, earthquake of 2010, incurred an economic loss of USD 32 million and the Chilean government
ultimately assumed 75 percent of the cost. The portion of loss covered by insurance was relatively high even by
developed world standards, but there was significant opportunity for the private sector to further reduce the state’s
financial burden.
Many recent catastrophe events in the Latin America/Caribbean region provide examples of the protection gap: Only
five percent of the economic loss of USD 8 billion from the 2010 earthquake in Haiti was insured; the insured portion
of the economic loss of USD 3 billion caused by the April 2016 earthquake in Manta, Ecuador, is expected to reach
no more than 15 percent. The 2016 earthquake has deeply impacted the local economy and government finances as
unemployment increased by approximately 50 percent and the government was compelled to increase sales taxes by
two percent in order to fund national reparation and recovery costs.
Given the overall impact of catastrophes on public sector finances, governments in Latin America are transitioning from
an over-reliance on post-event disaster financing to a pre-event approach to disaster risk mitigation and supporting a
“building back better” concept. Societies are realizing that transferring risk to the private sector provides efficient and
cost-effective solutions that relieve already strained public sector budgets.
Source: Earthquake Engineering Field Investigation Team (EEFIT)
Aidan Pope, Managing Director
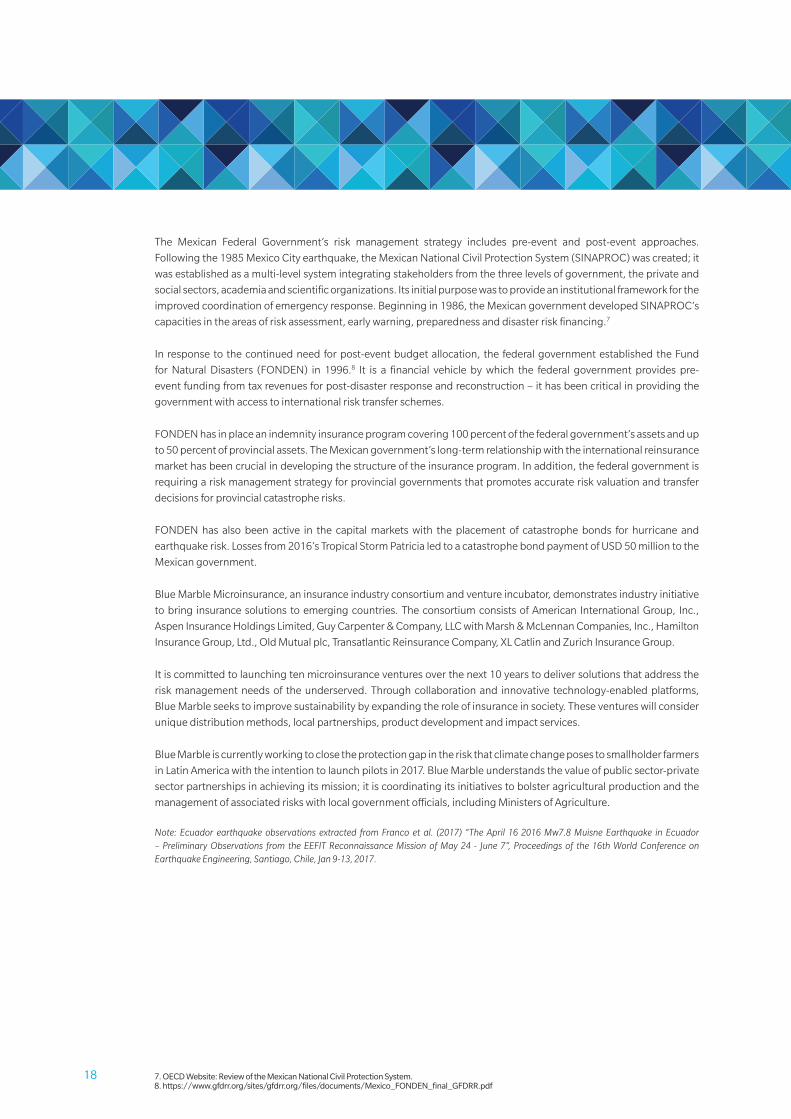
18 7. OECD Website: Review of the Mexican National Civil Protection System. 8. https://www.gfdrr.org/sites/gfdrr.org/files/documents/Mexico_FONDEN_final_GFDRR.pdf
The Mexican Federal Government’s risk management strategy includes pre-event and post-event approaches.
Following the 1985 Mexico City earthquake, the Mexican National Civil Protection System (SINAPROC) was created; it
was established as a multi-level system integrating stakeholders from the three levels of government, the private and
social sectors, academia and scientific organizations. Its initial purpose was to provide an institutional framework for the
improved coordination of emergency response. Beginning in 1986, the Mexican government developed SINAPROC’s
capacities in the areas of risk assessment, early warning, preparedness and disaster risk financing.7
In response to the continued need for post-event budget allocation, the federal government established the Fund
for Natural Disasters (FONDEN) in 1996.8 It is a financial vehicle by which the federal government provides pre-
event funding from tax revenues for post-disaster response and reconstruction – it has been critical in providing the
government with access to international risk transfer schemes.
FONDEN has in place an indemnity insurance program covering 100 percent of the federal government’s assets and up
to 50 percent of provincial assets. The Mexican government’s long-term relationship with the international reinsurance
market has been crucial in developing the structure of the insurance program. In addition, the federal government is
requiring a risk management strategy for provincial governments that promotes accurate risk valuation and transfer
decisions for provincial catastrophe risks.
FONDEN has also been active in the capital markets with the placement of catastrophe bonds for hurricane and
earthquake risk. Losses from 2016’s Tropical Storm Patricia led to a catastrophe bond payment of USD 50 million to the
Mexican government.
Blue Marble Microinsurance, an insurance industry consortium and venture incubator, demonstrates industry initiative
to bring insurance solutions to emerging countries. The consortium consists of American International Group, Inc.,
Aspen Insurance Holdings Limited, Guy Carpenter & Company, LLC with Marsh & McLennan Companies, Inc., Hamilton
Insurance Group, Ltd., Old Mutual plc, Transatlantic Reinsurance Company, XL Catlin and Zurich Insurance Group.
It is committed to launching ten microinsurance ventures over the next 10 years to deliver solutions that address the
risk management needs of the underserved. Through collaboration and innovative technology-enabled platforms,
Blue Marble seeks to improve sustainability by expanding the role of insurance in society. These ventures will consider
unique distribution methods, local partnerships, product development and impact services.
Blue Marble is currently working to close the protection gap in the risk that climate change poses to smallholder farmers
in Latin America with the intention to launch pilots in 2017. Blue Marble understands the value of public sector-private
sector partnerships in achieving its mission; it is coordinating its initiatives to bolster agricultural production and the
management of associated risks with local government officials, including Ministers of Agriculture.
Note: Ecuador earthquake observations extracted from Franco et al. (2017) “The April 16 2016 Mw7.8 Muisne Earthquake in Ecuador – Preliminary Observations from the EEFIT Reconnaissance Mission of May 24 - June 7”, Proceedings of the 16th World Conference on Earthquake Engineering, Santiago, Chile, Jan 9-13, 2017.
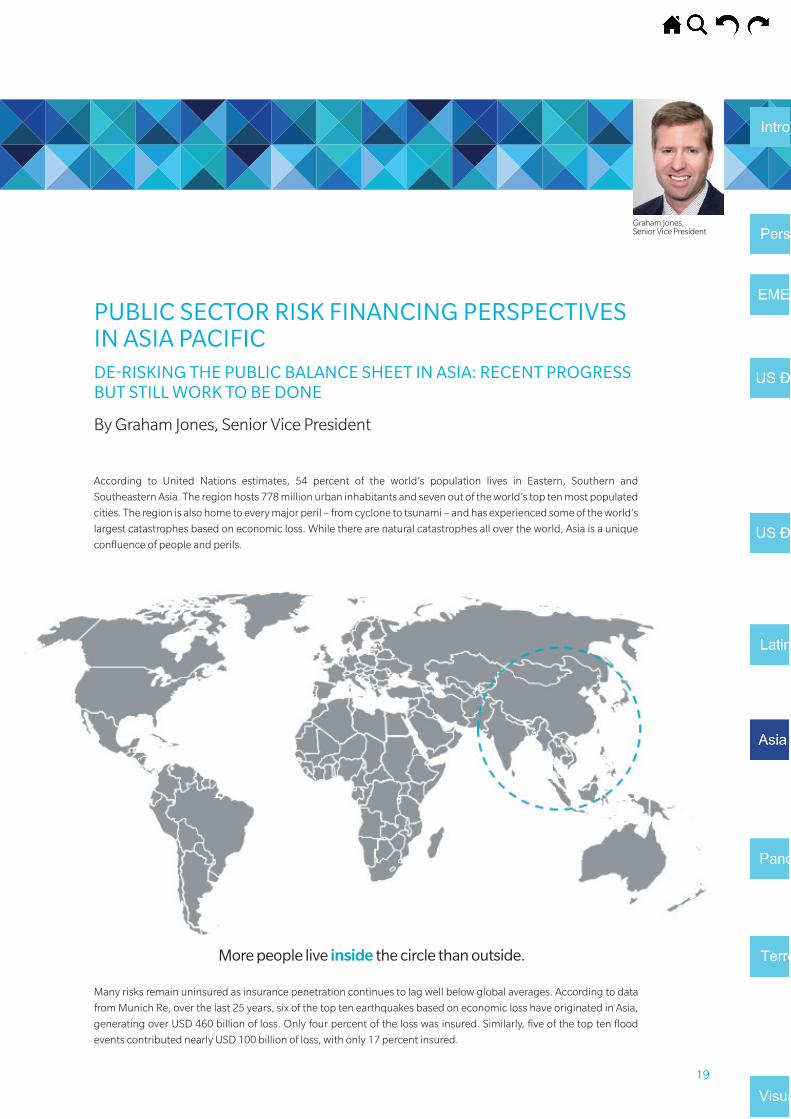
19
PUBLIC SECTOR RISK FINANCING PERSPECTIVES IN ASIA PACIFICDE-RISKING THE PUBLIC BALANCE SHEET IN ASIA: RECENT PROGRESS BUT STILL WORK TO BE DONE
By Graham Jones, Senior Vice President
According to United Nations estimates, 54 percent of the world’s population lives in Eastern, Southern and
Southeastern Asia. The region hosts 778 million urban inhabitants and seven out of the world’s top ten most populated
cities. The region is also home to every major peril – from cyclone to tsunami – and has experienced some of the world’s
largest catastrophes based on economic loss. While there are natural catastrophes all over the world, Asia is a unique
confluence of people and perils.
Many risks remain uninsured as insurance penetration continues to lag well below global averages. According to data
from Munich Re, over the last 25 years, six of the top ten earthquakes based on economic loss have originated in Asia,
generating over USD 460 billion of loss. Only four percent of the loss was insured. Similarly, five of the top ten flood
events contributed nearly USD 100 billion of loss, with only 17 percent insured.
F-3 | NATIONAL FLOOD INSURANCE PROGRAM DEBT TO THE US TREASURY
USD
Bill
ions
F-5 | WHAT ARE THE COMPELLING REASONS TO WRITE THIS?
F-6 | TERRORISM POOL PRICE INDEX VERSUS CAPACITY
More people live inside the circle than outside.
Risk Spread overSponsor Expected Risk Amount Benchmark Index Measurement Attachment Exhaustion
Year Deal Name Name Maturity Period ($MM) Tranche (in bps) Risk Location Period Level (%) Level (%)
2003 Vita Capital Ltd. Swiss Re 1/1/2007 4 years 400.00 Notes 135 U.S. / U.K. / France / Italy / Switzerland
1 calendar year 130 150
62.00 Class B Notes 90 120 125200.00 Class C Notes 140 115 120100.00 Class D Notes 190 110 11575.00 Class A Notes (wrapped) 19 115 12080.00 Class B Notes 300 110 115129.00 Class B-1 Notes (wrapped) 20 114 11964.50 Class B-2 Notes 120 114 119150.00 Class C Notes 285 110 114100.00 Class D Notes 500 106 110
1/1/2011 4 years 100.00 Class A-IV (wrapped) 21 125 1451/1/2012 5 years 100.00 Class A-V (wrapped) 20 125 1451/1/2011 4 years 70.97 Class A-VI (wrapped) 21 125 1451/1/2012 5 years 129.04 Class A-VII 80 125 1451/1/2011 4 years 90.00 Class B-I 110 120 1251/1/2012 5 years 50.00 Class B-II 112 120 1251/1/2011 4 years 39.38 Class B-III 110 120 1251/1/2012 5 years 50.00 Class B-V (wrapped) 21 120 1251/1/2011 4 years 70.97 Class B-VI (wrapped) 22 120 125
2008 Nathan Ltd. Munich Re 1/15/2013 5 years 100.00 Class A-I 135 U.S. / U.K. / Canada / Germany
2 consecutive calendar years
120 130
2009 Vita Capital IV Ltd. Swiss Re 1/15/2004 5 years 75.00 Class E 650 U.S. / U.K 2 consecutive calendar years
U.S.: 105UK: 112.5
U.S.: 110UK: 120
2010 Vita Capital IV Ltd. Swiss Re 1/15/2014 4 years 50.00 Series II, Class E 525 U.S / U.K 2 consecutive calendar years
U.S.: 105UK: 112.5
U.S.: 110UK: 120
100.0 Series V 280 Canada / Germany CAN: 120, GER: 125
CAN: 130, GER: 135
80.0 Series VI 385US / UK/ Canada /
Germany
U.S. : 105; UK: 115; GER/CAN:
110
U.S.: 110; UK: 120;
GER/CAN: 115
125.00 Class D-1 Notes 270 Canada / Australia CAN: 120, AUS: 135
CAN: 130, AUS: 145
150.00 Class E-1 Notes 340 US / Canada / AustraliaCAN: 110, AUS: 120, U.S.: 105
CAN: 115, AUS: 130, U.S.: 110
Mythen Re 2012-2 1/15/2016 4 years 120.00 Class A (includes US hurricane) 850 U.K. 2 consecu�ve calendar years
125 135
2013 Atlas IX Re SCOR 1/17/2019 6 years 180.00 300 U.S. 2 consecu�ve calendar years
102 104
EUR135.00 Class A 255 France, Japan, U.S. 1 calendar yearFR: 108.1; JP: 108.2; U.S. 104.1
FR: 108.1; JP: 108.2; U.S. 104.2
EUR150.00 Class B 335 France, Japan, U.S. 1 calendar yearFR: 116; JP: 116; U.S. 108
FR: 116; JP: 116; U.S. 109
Vita Capital VI Swiss Re 1/8/2021 5 years 100.00 Class A 290 Australia, Canada and U.K.
1 calendar year
Year 1: AUS: 120; CAN: 115; UK: 120;
Dropdown feature in subsequent
years
Year 1: AUS: 130; CAN: 125; UK: 140;
Dropdown feature in
subsequent years
2 consecu�ve calendar years
Vita Capital IV
2 consecu�ve calendar years2012
2011 Swiss Re
Vita Capital VSwiss Re
4 years
4 years
1/15/2016
1/15/2017
2 consecutive calendar years
2 consecutive calendar years
2007 Vita Capital III Ltd. Swiss Re U.S. / U.K. / Germany / Japan / Canada
2 consecutive calendar years
U.S. / France / Japan2006 Osiris Capital p.l.c. AXA 1/15/2010 4 years
U.S. / U.K. / France / Italy / Switzerland
2 consecutive calendar years
2006 Tartan Capital Ltd. Scottish Re 1/7/2009 3 years U.S.
2005 Vita Capital II Ltd. Swiss Re 1/1/2010 5 years
Benu Capital 5 years1/8/2020AXA
2015
PLACEHOLDER
F-7 | NATURAL CATASTROPHE LOSSES: 1970-2015
Source: Swiss Re, sigma No. 1/2016 and Guy Carpenter.
0
50
100
150
200
250
300
350
400
450
1970 1975 1980 1985 1990 1995 2000 2005 2010 2015
Insured losses Uninsured losses 10 per. Mov. Avg. (Total Insured Losses) 10 per. Mov. Avg. (Total Eco Losses)
USD
Bill
ions
Source: Guy Carpenter from figures reported by FEMA and the NFIP
Source: FreddieMac (www.freddiemac.com) and Fannie Mae (www.fanniemae.com)
F-4 | CUMULATIVE LIMIT PLACED
USD
Bill
ions
.2.81.2
3.6
2.4
5.3
6
5
4
3
2
1
0
2013/2014 2015
Freddie Fannie
2016 YTD
F-8 | TRANSPORTATION TARGETS ATTACKED BY TERRORISTS, 1970 – 2014
Source: START’s Global Terrorism Database, University of Maryland.
0% 10% 20% 30% 40%
Taxi/RickshawSubway
Highway/Road-RelatedAirline Officer/Personnel
Aircra� (not at an airport)Airport
Bus Sta�on/StopBridge/TunnelTrain Related
Bus (excluding tourists)
Percent of Transporta�on Targets
Type
of T
rans
port
a�on
Tar
get
F-9 | TYPES OF BUSINESSES TARGETED BY TERRORIST ATTACKS WORLDWIDE, 1970 – 2014
Source: START’s Global Terrorism Database, University of Maryland.
0 500 1000 1500 2000 2500 3000 3500
Private Security Company/Firm
Mining
Medical/Pharmaceutical
Construction
Farm/Ranch
Gas/Oil
Entertainment/Cultural/Stadium/Casino
Hotel/Resort
Multinational Corporation
Industrial/Textiles/Factory
Restaurant/Bar/Café
Bank/Commerce
Retail/Grocery/Bakery
Number of Targets
2009 2010 2011 2012 2013 2014 2015 2016
100
90
80
70
60
50
40
30
20
10
0
8
7
6
5
4
3
2
1
0
Limit Written Price Index
Source: Guy Carpenter Terrorism database
F-1 | GLOBAL INSURANCE GAP 2015 – ECONOMIC AVERAGE ANNUAL LOSS
% Uninsured GapSource: AIRWorldwide, A Verisk Analytics Business
Un
insu
red
Gap
Per
cen
tag
e
0
10
20
30
40
50
60
70
80
90
100
OceaniaNorth AmericaLatin AmericaEuropeAsia
92%
66%
87%
56%
63%
F-2 | EMEA INSURANCE GAP 2010 TO 2015 – ECONOMIC AVERAGE ANNUAL LOSS
% Gap Source: Munich Re NatCatSERVICE
Gap
Per
cen
tag
e
0
10
20
30
40
50
60
70
80
90
100
201520142013201220112010
75%
45%
84%
51%
59%56%
EUR
Bill
ions
73 Reinsurers41 Reinsurers
GROWTH PROFITABILITY
RISK
Policies cededto Flood Re
Volatility managedthrough outwards
reinsurance
Fund shortages:“Levy 2” capital call
Flood Re
Flood premiums
Flood claims
Levy 1Industry levy(£180m p.a.)
Graham Jones, Senior Vice President
20 9. liquidity post-event refers to funds provided within days or weeks of a disaster occurring. This may take the form of contingent loans or catastrophe pools similar to the Pacific Risk assessment and financing initiative pilot.
10. guy Carpenter: Partnerships: The Way to Public sector Risk financing, October 2015.
highlighTs Of RECEnT iniTiaTivEsvarious initiatives in the region continue to provide education and platforms for disaster risk financing. developments
at the local and regional level generally focus on:
• access to liquidity post-event9 and rapid deployment of funds;
• insurance for publically-owned assets; and
• insurance for privately-held assets.
in cooperation with the world Bank, the nations of Myanmar, Cambodia and Lao peoples democratic republic are in
the early phases of exploring sub-regional pooling of risk. while this initiative remains only a pilot program, a larger,
region-wide facility for smaller Asian countries would reduce reliance on government budgets, provide costs savings
through diversification and streamline assess to international (re)insurance markets. Larger Asian countries with higher
gross domestic products may benefit from their own national pooling programs and bypass the regional fund, but may
still leverage the established conduits and knowledge-base of the sub-regional pools.
The philippines has arranged its second disaster-contingent credit product through the world Bank, of uSd 500 million.
As part of the disaster risk Management development policy tied to the loan instrument, the country will evaluate
catastrophe risk transfer solutions at the sovereign and provincial levels by third quarter 2018. Ongoing initiatives
include the establishment of a local government asset pooling mechanism and a residential pool.
in July 2016, the China residential Earthquake insurance pool (CrEip) was jointly established by the China insurance
regulatory Commission (CirC) and Ministry of Finance. in development since 2014, the scheme consists of 45 insurers
distributing policies with basic limits of uSd 7,500 and uSd 3,000 for urban and rural residents, respectively. Coverage
up to a maximum limit of uSd 150,000 is negotiable. The claims process has been simplified with payouts equaling
zero, 50 or 100 percent of the policy limit based on five damage levels.
The scheme would respond via five layers of priority:
1. insured’s deductible;
2. insurance product;
3. reinsurance support;
4. reserve funds available to the pool; and
5. government backstop.
China re p&C assists in insurance product design, rate determination and reinsurance responsibilities. As of September
2016, approximately 15,000 policies were sold totaling approximately uSd 900 million of limit.
daTa and analyTiCsThe emergence of robust risk analytics is one of the most important enablers for transferring public sector risk to the
private sector and de-risking public balance sheets.10 For many years, the Asia (re)insurance market lacked a widely
accepted catastrophe model. Now, independent vendors provide over 60 catastrophe models across the major perils
and territories; projects like the Singapore-based Natural Catastrophe data and Analytics Exchange (NatCatdAX)
Alliance, led by Nanyang Technological university, seek to improve the availability of quality exposure and loss data;
and computing power to run granular analyses required for flood models is more economical than ever.
Alternative capital sources comprise 17 percent of total global reinsurance capital. As early as ten years ago, alternative
capital accounted for only three to five percent of the total. deployment of catastrophe bonds and collateralized
reinsurance primarily occurs in more mature Asian markets such as Japan and Australia, but cedents throughout Asia
may benefit – although indirectly – in the coming years as third party investors search for diversification through new
lines of business and geographies.
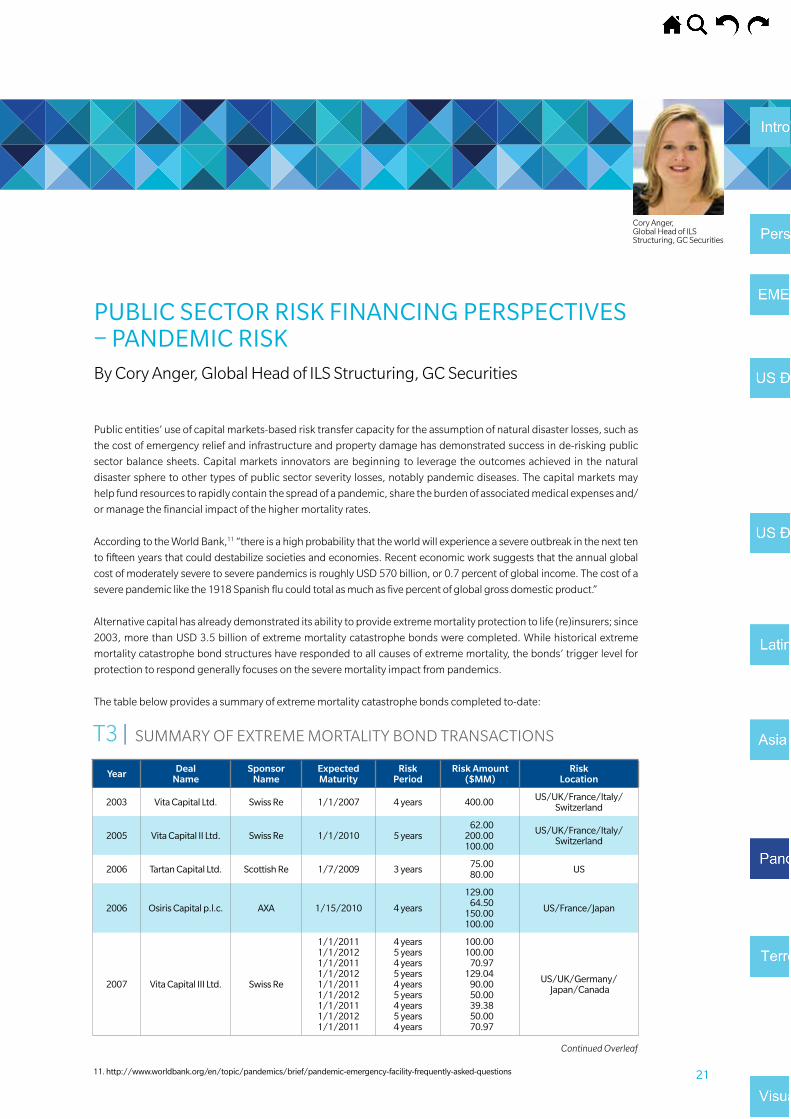
2111. http://www.worldbank.org/en/topic/pandemics/brief/pandemic-emergency-facility-frequently-asked-questions
PuBliC sECTOR Risk finanCing PERsPECTivEs – PandEmiC RiskBy Cory Anger, global head of iLS Structuring, gC Securities
public entities’ use of capital markets-based risk transfer capacity for the assumption of natural disaster losses, such as
the cost of emergency relief and infrastructure and property damage has demonstrated success in de-risking public
sector balance sheets. Capital markets innovators are beginning to leverage the outcomes achieved in the natural
disaster sphere to other types of public sector severity losses, notably pandemic diseases. The capital markets may
help fund resources to rapidly contain the spread of a pandemic, share the burden of associated medical expenses and/
or manage the financial impact of the higher mortality rates.
According to the world Bank,11 “there is a high probability that the world will experience a severe outbreak in the next ten
to fifteen years that could destabilize societies and economies. recent economic work suggests that the annual global
cost of moderately severe to severe pandemics is roughly uSd 570 billion, or 0.7 percent of global income. The cost of a
severe pandemic like the 1918 Spanish flu could total as much as five percent of global gross domestic product.”
Alternative capital has already demonstrated its ability to provide extreme mortality protection to life (re)insurers; since
2003, more than uSd 3.5 billion of extreme mortality catastrophe bonds were completed. while historical extreme
mortality catastrophe bond structures have responded to all causes of extreme mortality, the bonds’ trigger level for
protection to respond generally focuses on the severe mortality impact from pandemics.
The table below provides a summary of extreme mortality catastrophe bonds completed to-date:
Year Deal Name
Sponsor Name
Expected Maturity
Risk Period
Risk Amount ($MM)
Risk Location
2003 vita Capital ltd. swiss Re 1/1/2007 4 years 400.00 us/uk/france/italy/ switzerland
2005 vita Capital ii ltd. swiss Re 1/1/2010 5 years62.00
200.00100.00
us/uk/france/italy/ switzerland
2006 Tartan Capital ltd. scottish Re 1/7/2009 3 years 75.0080.00 us
2006 Osiris Capital p.l.c. aXa 1/15/2010 4 years
129.0064.50
150.00100.00
us/france/Japan
2007 vita Capital iii ltd. swiss Re
1/1/20111/1/20121/1/20111/1/20121/1/20111/1/20121/1/20111/1/20121/1/2011
4 years5 years4 years5 years4 years5 years4 years5 years4 years
100.00100.00
70.97129.04
90.0050.0039.3850.0070.97
us/uk/germany/ Japan/Canada
T3 | SuMMAry OF EXTrEME MOrTALiTy BONd TrANSACTiONS
Continued Overleaf
Cory Anger, global head of iLS Structuring, gC Securities
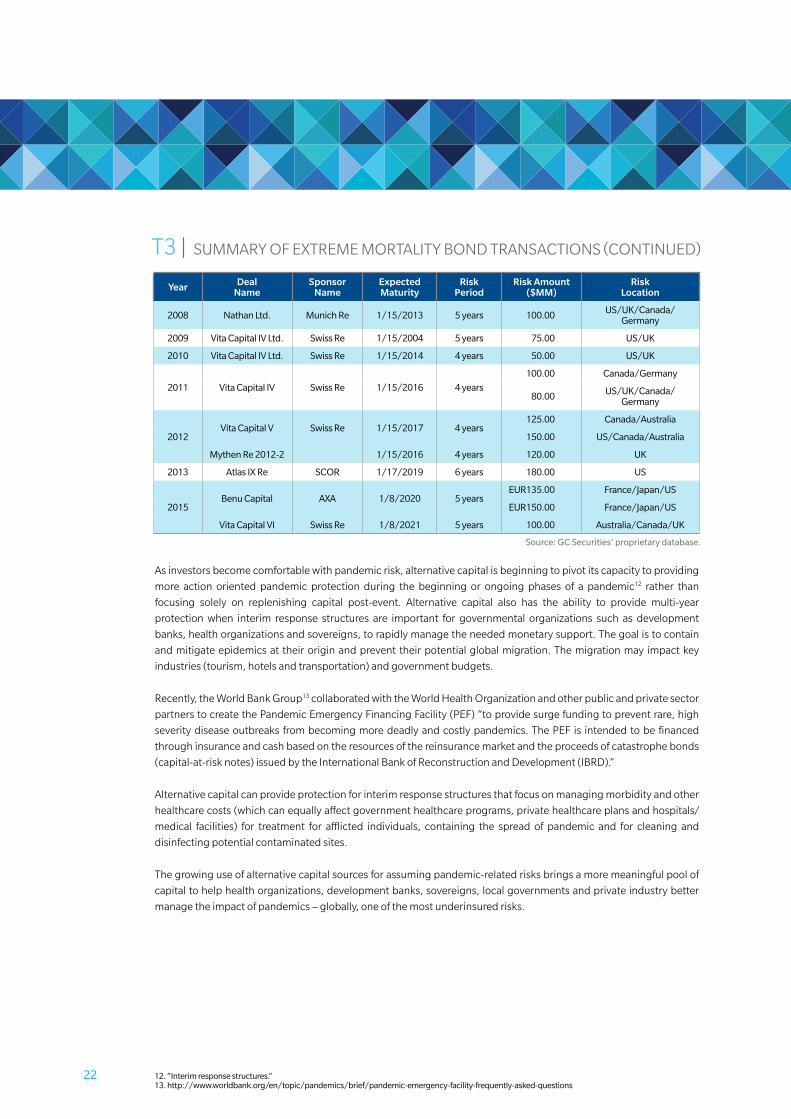
22 12. “interim response structures.”13. http://www.worldbank.org/en/topic/pandemics/brief/pandemic-emergency-facility-frequently-asked-questions
As investors become comfortable with pandemic risk, alternative capital is beginning to pivot its capacity to providing
more action oriented pandemic protection during the beginning or ongoing phases of a pandemic12 rather than
focusing solely on replenishing capital post-event. Alternative capital also has the ability to provide multi-year
protection when interim response structures are important for governmental organizations such as development
banks, health organizations and sovereigns, to rapidly manage the needed monetary support. The goal is to contain
and mitigate epidemics at their origin and prevent their potential global migration. The migration may impact key
industries (tourism, hotels and transportation) and government budgets.
recently, the world Bank group13 collaborated with the world health Organization and other public and private sector
partners to create the pandemic Emergency Financing Facility (pEF) “to provide surge funding to prevent rare, high
severity disease outbreaks from becoming more deadly and costly pandemics. The pEF is intended to be financed
through insurance and cash based on the resources of the reinsurance market and the proceeds of catastrophe bonds
(capital-at-risk notes) issued by the international Bank of reconstruction and development (iBrd).”
Alternative capital can provide protection for interim response structures that focus on managing morbidity and other
healthcare costs (which can equally affect government healthcare programs, private healthcare plans and hospitals/
medical facilities) for treatment for afflicted individuals, containing the spread of pandemic and for cleaning and
disinfecting potential contaminated sites.
The growing use of alternative capital sources for assuming pandemic-related risks brings a more meaningful pool of
capital to help health organizations, development banks, sovereigns, local governments and private industry better
manage the impact of pandemics – globally, one of the most underinsured risks.
source: gC securities’ proprietary database.
Year Deal Name
Sponsor Name
Expected Maturity
Risk Period
Risk Amount ($MM)
Risk Location
2008 nathan ltd. munich Re 1/15/2013 5 years 100.00 us/uk/Canada/ germany
2009 vita Capital iv ltd. swiss Re 1/15/2004 5 years 75.00 us/uk
2010 vita Capital iv ltd. swiss Re 1/15/2014 4 years 50.00 us/uk
2011 vita Capital iv swiss Re 1/15/2016 4 years
100.00 Canada/germany
80.00 us/uk/Canada/ germany
2012vita Capital v swiss Re 1/15/2017 4 years
125.00 Canada/australia
150.00 us/Canada/australia
mythen Re 2012-2 1/15/2016 4 years 120.00 uk
2013 atlas iX Re sCOR 1/17/2019 6 years 180.00 us
2015Benu Capital aXa 1/8/2020 5 years
EuR135.00 france/Japan/us
EuR150.00 france/Japan/us
vita Capital vi swiss Re 1/8/2021 5 years 100.00 australia/Canada/uk
T3 | SuMMAry OF EXTrEME MOrTALiTy BONd TrANSACTiONS (CONTiNuEd)
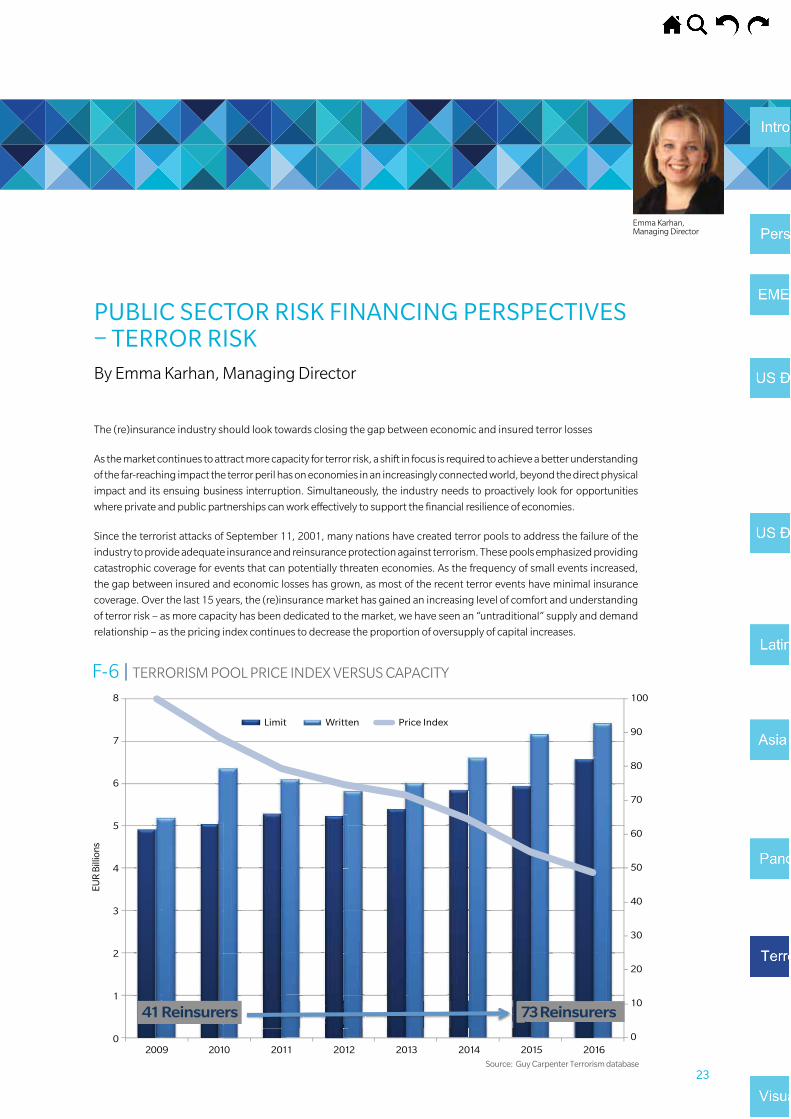
23
PuBliC sECTOR Risk finanCing PERsPECTivEs – TERROR RiskBy Emma karhan, Managing director
The (re)insurance industry should look towards closing the gap between economic and insured terror losses
As the market continues to attract more capacity for terror risk, a shift in focus is required to achieve a better understanding
of the far-reaching impact the terror peril has on economies in an increasingly connected world, beyond the direct physical
impact and its ensuing business interruption. Simultaneously, the industry needs to proactively look for opportunities
where private and public partnerships can work effectively to support the financial resilience of economies.
Since the terrorist attacks of September 11, 2001, many nations have created terror pools to address the failure of the
industry to provide adequate insurance and reinsurance protection against terrorism. These pools emphasized providing
catastrophic coverage for events that can potentially threaten economies. As the frequency of small events increased,
the gap between insured and economic losses has grown, as most of the recent terror events have minimal insurance
coverage. Over the last 15 years, the (re)insurance market has gained an increasing level of comfort and understanding
of terror risk – as more capacity has been dedicated to the market, we have seen an “untraditional” supply and demand
relationship – as the pricing index continues to decrease the proportion of oversupply of capital increases.
F-3 | NATIONAL FIOOD INSURANCE PROGRAM DEBT TO THE U.S. TREASURY
USD
Bill
ions
F-5 | WHAT ARE THE COMPELLING REASONS TO WRITE THIS?
F-6 | TERRORISM POOL PRICE INDEX VERSUS CAPACITY
More people live inside the circle than outside.
Risk Spread overSponsor Expected Risk Amount Benchmark Index Measurement Attachment Exhaustion
Year Deal Name Name Maturity Period ($MM) Tranche (in bps) Risk Location Period Level (%) Level (%)
2003 Vita Capital Ltd. Swiss Re 1/1/2007 4 years 400.00 Notes 135 U.S. / U.K. / France / Italy / Switzerland
1 calendar year 130 150
62.00 Class B Notes 90 120 125200.00 Class C Notes 140 115 120100.00 Class D Notes 190 110 11575.00 Class A Notes (wrapped) 19 115 12080.00 Class B Notes 300 110 115129.00 Class B-1 Notes (wrapped) 20 114 11964.50 Class B-2 Notes 120 114 119150.00 Class C Notes 285 110 114100.00 Class D Notes 500 106 110
1/1/2011 4 years 100.00 Class A-IV (wrapped) 21 125 1451/1/2012 5 years 100.00 Class A-V (wrapped) 20 125 1451/1/2011 4 years 70.97 Class A-VI (wrapped) 21 125 1451/1/2012 5 years 129.04 Class A-VII 80 125 1451/1/2011 4 years 90.00 Class B-I 110 120 1251/1/2012 5 years 50.00 Class B-II 112 120 1251/1/2011 4 years 39.38 Class B-III 110 120 1251/1/2012 5 years 50.00 Class B-V (wrapped) 21 120 1251/1/2011 4 years 70.97 Class B-VI (wrapped) 22 120 125
2008 Nathan Ltd. Munich Re 1/15/2013 5 years 100.00 Class A-I 135 U.S. / U.K. / Canada / Germany
2 consecutive calendar years
120 130
2009 Vita Capital IV Ltd. Swiss Re 1/15/2004 5 years 75.00 Class E 650 U.S. / U.K 2 consecutive calendar years
U.S.: 105UK: 112.5
U.S.: 110UK: 120
2010 Vita Capital IV Ltd. Swiss Re 1/15/2014 4 years 50.00 Series II, Class E 525 U.S / U.K 2 consecutive calendar years
U.S.: 105UK: 112.5
U.S.: 110UK: 120
100.0 Series V 280 Canada / Germany CAN: 120, GER: 125
CAN: 130, GER: 135
80.0 Series VI 385US / UK/ Canada /
Germany
U.S. : 105; UK: 115; GER/CAN:
110
U.S.: 110; UK: 120;
GER/CAN: 115
125.00 Class D-1 Notes 270 Canada / Australia CAN: 120, AUS: 135
CAN: 130, AUS: 145
150.00 Class E-1 Notes 340 US / Canada / AustraliaCAN: 110, AUS: 120, U.S.: 105
CAN: 115, AUS: 130, U.S.: 110
Mythen Re 2012-2 1/15/2016 4 years 120.00 Class A (includes US hurricane) 850 U.K. 2 consecu�ve calendar years
125 135
2013 Atlas IX Re SCOR 1/17/2019 6 years 180.00 300 U.S. 2 consecu�ve calendar years
102 104
EUR135.00 Class A 255 France, Japan, U.S. 1 calendar yearFR: 108.1; JP: 108.2; U.S. 104.1
FR: 108.1; JP: 108.2; U.S. 104.2
EUR150.00 Class B 335 France, Japan, U.S. 1 calendar yearFR: 116; JP: 116; U.S. 108
FR: 116; JP: 116; U.S. 109
Vita Capital VI Swiss Re 1/8/2021 5 years 100.00 Class A 290 Australia, Canada and U.K.
1 calendar year
Year 1: AUS: 120; CAN: 115; UK: 120;
Dropdown feature in subsequent
years
Year 1: AUS: 130; CAN: 125; UK: 140;
Dropdown feature in
subsequent years
2 consecu�ve calendar years
Vita Capital IV
2 consecu�ve calendar years2012
2011 Swiss Re
Vita Capital VSwiss Re
4 years
4 years
1/15/2016
1/15/2017
2 consecutive calendar years
2 consecutive calendar years
2007 Vita Capital III Ltd. Swiss Re U.S. / U.K. / Germany / Japan / Canada
2 consecutive calendar years
U.S. / France / Japan2006 Osiris Capital p.l.c. AXA 1/15/2010 4 years
U.S. / U.K. / France / Italy / Switzerland
2 consecutive calendar years
2006 Tartan Capital Ltd. Scottish Re 1/7/2009 3 years U.S.
2005 Vita Capital II Ltd. Swiss Re 1/1/2010 5 years
Benu Capital 5 years1/8/2020AXA
2015
PLACEHOLDER
F-7 | NATURAL CATASTROPHE LOSSES: 1970-2015
Source: Swiss Re, sigma No. 1/2016 and Guy Carpenter.
0
50
100
150
200
250
300
350
400
450
1970 1975 1980 1985 1990 1995 2000 2005 2010 2015
Insured losses Uninsured losses 10 per. Mov. Avg. (Total Insured Losses) 10 per. Mov. Avg. (Total Eco Losses)
USD
Bill
ions
Source: Guy Carpenter from figures reported by FEMA and the NFIP
Source: FreddieMac (www.freddiemac.com) and Fannie Mae (www.fanniemae.com)
F-4 | CUMULATIVE LIMIT PLACED
USD
Bill
ions
.2.81.2
3.6
2.4
5.3
6
5
4
3
2
1
0
2013/2014 2015
Freddie Fannie
2016 YTD
F-8 | TRANSPORTATION TARGETS ATTACKED BY TERRORISTS, 1970 – 2014
Source: START’s Global Terrorism Database, University of Maryland.
0% 10% 20% 30% 40%
Taxi/RickshawSubway
Highway/Road-RelatedAirline Officer/Personnel
Aircra� (not at an airport)Airport
Bus Sta�on/StopBridge/TunnelTrain Related
Bus (excluding tourists)
Percent of Transporta�on Targets
Type
of T
rans
port
a�on
Tar
get
F-9 | TYPES OF BUSINESSES TARGETED BY TERRORIST ATTACKS WORLDWIDE, 1970 – 2014
Source: START’s Global Terrorism Database, University of Maryland.
0 500 1000 1500 2000 2500 3000 3500
Private Security Company/Firm
Mining
Medical/Pharmaceutical
Construction
Farm/Ranch
Gas/Oil
Entertainment/Cultural/Stadium/Casino
Hotel/Resort
Multinational Corporation
Industrial/Textiles/Factory
Restaurant/Bar/Café
Bank/Commerce
Retail/Grocery/Bakery
Number of Targets
2009 2010 2011 2012 2013 2014 2015 2016
100
90
80
70
60
50
40
30
20
10
0
8
7
6
5
4
3
2
1
0
Limit Written Price Index
Source: Guy Carpenter Terrorism database
F-1 | GLOBAL INSURANCE GAP 2015 – ECONOMIC AVERAGE ANNUAL LOSS
% Uninsured GapSource: AIRWorldwide, A Verisk Analytics Business
Un
insu
red
Gap
Per
cen
tag
e
0
10
20
30
40
50
60
70
80
90
100
OceaniaNorth AmericaLatin AmericaEuropeAsia
92%
66%
87%
56%
63%
F-2 | EMEA INSURANCE GAP 2010 TO 2015 – ECONOMIC AVERAGE ANNUAL LOSS
% Gap Source: Munich Re NatCatSERVICE
Gap
Per
cen
tag
e
0
10
20
30
40
50
60
70
80
90
100
201520142013201220112010
75%
45%
84%
51%
59%56%
EUR
Bill
ions
73 Reinsurers41 Reinsurers
GROWTH PROFITABILITY
RISK
Policies cededto Flood Re
Volatility managedthrough outwards
reinsurance
Fund shortages:“Levy 2” capital call
Flood Re
Flood premiums
Flood claims
Levy 1Industry levy(£180m p.a.)
Emma karhan, Managing director
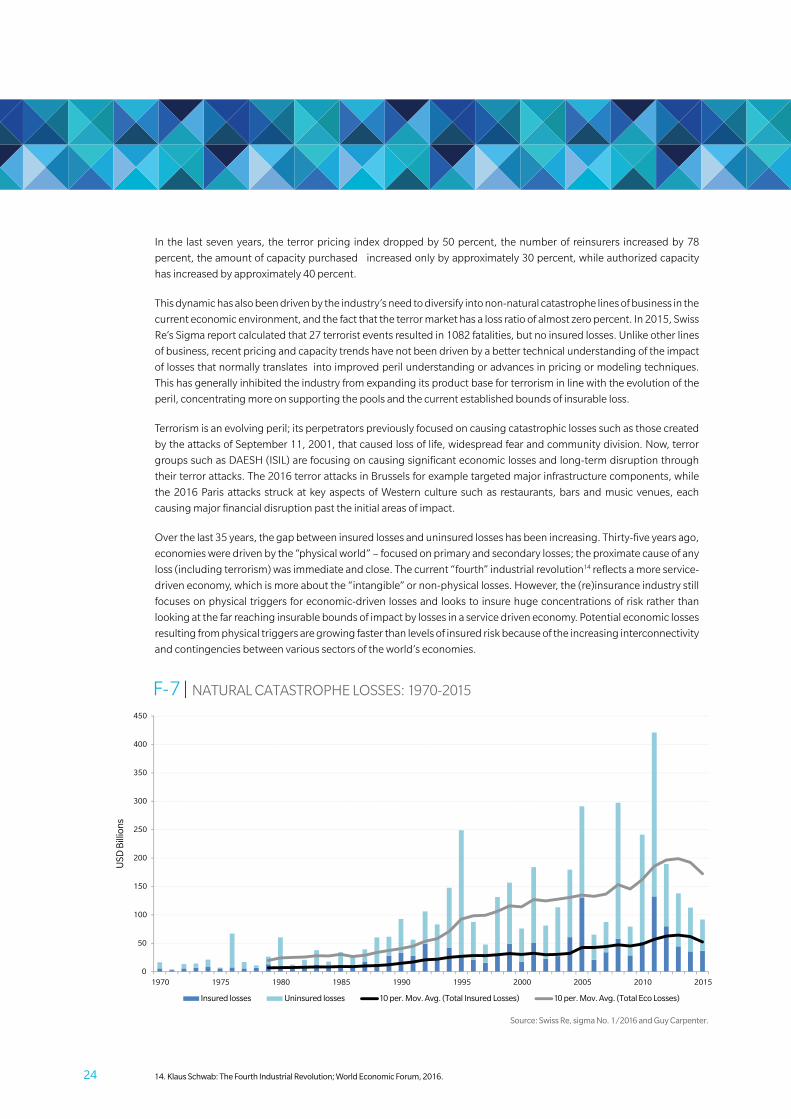
24 14. klaus schwab: The fourth industrial Revolution; World Economic forum, 2016.
in the last seven years, the terror pricing index dropped by 50 percent, the number of reinsurers increased by 78
percent, the amount of capacity purchased increased only by approximately 30 percent, while authorized capacity
has increased by approximately 40 percent.
This dynamic has also been driven by the industry’s need to diversify into non-natural catastrophe lines of business in the
current economic environment, and the fact that the terror market has a loss ratio of almost zero percent. in 2015, Swiss
re’s Sigma report calculated that 27 terrorist events resulted in 1082 fatalities, but no insured losses. unlike other lines
of business, recent pricing and capacity trends have not been driven by a better technical understanding of the impact
of losses that normally translates into improved peril understanding or advances in pricing or modeling techniques.
This has generally inhibited the industry from expanding its product base for terrorism in line with the evolution of the
peril, concentrating more on supporting the pools and the current established bounds of insurable loss.
Terrorism is an evolving peril; its perpetrators previously focused on causing catastrophic losses such as those created
by the attacks of September 11, 2001, that caused loss of life, widespread fear and community division. Now, terror
groups such as dAESh (iSiL) are focusing on causing significant economic losses and long-term disruption through
their terror attacks. The 2016 terror attacks in Brussels for example targeted major infrastructure components, while
the 2016 paris attacks struck at key aspects of western culture such as restaurants, bars and music venues, each
causing major financial disruption past the initial areas of impact.
Over the last 35 years, the gap between insured losses and uninsured losses has been increasing. Thirty-five years ago,
economies were driven by the “physical world” – focused on primary and secondary losses; the proximate cause of any
loss (including terrorism) was immediate and close. The current “fourth” industrial revolution14 reflects a more service-
driven economy, which is more about the “intangible” or non-physical losses. however, the (re)insurance industry still
focuses on physical triggers for economic-driven losses and looks to insure huge concentrations of risk rather than
looking at the far reaching insurable bounds of impact by losses in a service driven economy. potential economic losses
resulting from physical triggers are growing faster than levels of insured risk because of the increasing interconnectivity
and contingencies between various sectors of the world’s economies.
F-3 | NATIONAL FIOOD INSURANCE PROGRAM DEBT TO THE U.S. TREASURY
USD
Bill
ions
F-5 | WHAT ARE THE COMPELLING REASONS TO WRITE THIS?
F-6 | TERRORISM POOL PRICE INDEX VERSUS CAPACITY
More people live inside the circle than outside.
Risk Spread overSponsor Expected Risk Amount Benchmark Index Measurement Attachment Exhaustion
Year Deal Name Name Maturity Period ($MM) Tranche (in bps) Risk Location Period Level (%) Level (%)
2003 Vita Capital Ltd. Swiss Re 1/1/2007 4 years 400.00 Notes 135 U.S. / U.K. / France / Italy / Switzerland
1 calendar year 130 150
62.00 Class B Notes 90 120 125200.00 Class C Notes 140 115 120100.00 Class D Notes 190 110 11575.00 Class A Notes (wrapped) 19 115 12080.00 Class B Notes 300 110 115129.00 Class B-1 Notes (wrapped) 20 114 11964.50 Class B-2 Notes 120 114 119150.00 Class C Notes 285 110 114100.00 Class D Notes 500 106 110
1/1/2011 4 years 100.00 Class A-IV (wrapped) 21 125 1451/1/2012 5 years 100.00 Class A-V (wrapped) 20 125 1451/1/2011 4 years 70.97 Class A-VI (wrapped) 21 125 1451/1/2012 5 years 129.04 Class A-VII 80 125 1451/1/2011 4 years 90.00 Class B-I 110 120 1251/1/2012 5 years 50.00 Class B-II 112 120 1251/1/2011 4 years 39.38 Class B-III 110 120 1251/1/2012 5 years 50.00 Class B-V (wrapped) 21 120 1251/1/2011 4 years 70.97 Class B-VI (wrapped) 22 120 125
2008 Nathan Ltd. Munich Re 1/15/2013 5 years 100.00 Class A-I 135 U.S. / U.K. / Canada / Germany
2 consecutive calendar years
120 130
2009 Vita Capital IV Ltd. Swiss Re 1/15/2004 5 years 75.00 Class E 650 U.S. / U.K 2 consecutive calendar years
U.S.: 105UK: 112.5
U.S.: 110UK: 120
2010 Vita Capital IV Ltd. Swiss Re 1/15/2014 4 years 50.00 Series II, Class E 525 U.S / U.K 2 consecutive calendar years
U.S.: 105UK: 112.5
U.S.: 110UK: 120
100.0 Series V 280 Canada / Germany CAN: 120, GER: 125
CAN: 130, GER: 135
80.0 Series VI 385US / UK/ Canada /
Germany
U.S. : 105; UK: 115; GER/CAN:
110
U.S.: 110; UK: 120;
GER/CAN: 115
125.00 Class D-1 Notes 270 Canada / Australia CAN: 120, AUS: 135
CAN: 130, AUS: 145
150.00 Class E-1 Notes 340 US / Canada / AustraliaCAN: 110, AUS: 120, U.S.: 105
CAN: 115, AUS: 130, U.S.: 110
Mythen Re 2012-2 1/15/2016 4 years 120.00 Class A (includes US hurricane) 850 U.K. 2 consecu�ve calendar years
125 135
2013 Atlas IX Re SCOR 1/17/2019 6 years 180.00 300 U.S. 2 consecu�ve calendar years
102 104
EUR135.00 Class A 255 France, Japan, U.S. 1 calendar yearFR: 108.1; JP: 108.2; U.S. 104.1
FR: 108.1; JP: 108.2; U.S. 104.2
EUR150.00 Class B 335 France, Japan, U.S. 1 calendar yearFR: 116; JP: 116; U.S. 108
FR: 116; JP: 116; U.S. 109
Vita Capital VI Swiss Re 1/8/2021 5 years 100.00 Class A 290 Australia, Canada and U.K.
1 calendar year
Year 1: AUS: 120; CAN: 115; UK: 120;
Dropdown feature in subsequent
years
Year 1: AUS: 130; CAN: 125; UK: 140;
Dropdown feature in
subsequent years
2 consecu�ve calendar years
Vita Capital IV
2 consecu�ve calendar years2012
2011 Swiss Re
Vita Capital VSwiss Re
4 years
4 years
1/15/2016
1/15/2017
2 consecutive calendar years
2 consecutive calendar years
2007 Vita Capital III Ltd. Swiss Re U.S. / U.K. / Germany / Japan / Canada
2 consecutive calendar years
U.S. / France / Japan2006 Osiris Capital p.l.c. AXA 1/15/2010 4 years
U.S. / U.K. / France / Italy / Switzerland
2 consecutive calendar years
2006 Tartan Capital Ltd. Scottish Re 1/7/2009 3 years U.S.
2005 Vita Capital II Ltd. Swiss Re 1/1/2010 5 years
Benu Capital 5 years1/8/2020AXA
2015
PLACEHOLDER
F-7 | NATURAL CATASTROPHE LOSSES: 1970-2015
Source: Swiss Re, sigma No. 1/2016 and Guy Carpenter.
0
50
100
150
200
250
300
350
400
450
1970 1975 1980 1985 1990 1995 2000 2005 2010 2015
Insured losses Uninsured losses 10 per. Mov. Avg. (Total Insured Losses) 10 per. Mov. Avg. (Total Eco Losses)
USD
Bill
ions
Source: Guy Carpenter from figures reported by FEMA and the NFIP
Source: FreddieMac (www.freddiemac.com) and Fannie Mae (www.fanniemae.com)
F-4 | CUMULATIVE LIMIT PLACED
USD
Bill
ions
.2.81.2
3.6
2.4
5.3
6
5
4
3
2
1
0
2013/2014 2015
Freddie Fannie
2016 YTD
F-8 | TRANSPORTATION TARGETS ATTACKED BY TERRORISTS, 1970 – 2014
Source: START’s Global Terrorism Database, University of Maryland.
0% 10% 20% 30% 40%
Taxi/RickshawSubway
Highway/Road-RelatedAirline Officer/Personnel
Aircra� (not at an airport)Airport
Bus Sta�on/StopBridge/TunnelTrain Related
Bus (excluding tourists)
Percent of Transporta�on Targets
Type
of T
rans
port
a�on
Tar
get
F-9 | TYPES OF BUSINESSES TARGETED BY TERRORIST ATTACKS WORLDWIDE, 1970 – 2014
Source: START’s Global Terrorism Database, University of Maryland.
0 500 1000 1500 2000 2500 3000 3500
Private Security Company/Firm
Mining
Medical/Pharmaceutical
Construction
Farm/Ranch
Gas/Oil
Entertainment/Cultural/Stadium/Casino
Hotel/Resort
Multinational Corporation
Industrial/Textiles/Factory
Restaurant/Bar/Café
Bank/Commerce
Retail/Grocery/Bakery
Number of Targets
2009 2010 2011 2012 2013 2014 2015 2016
100
90
80
70
60
50
40
30
20
10
0
8
7
6
5
4
3
2
1
0
Limit Written Price Index
Source: Guy Carpenter Terrorism database
F-1 | GLOBAL INSURANCE GAP 2015 – ECONOMIC AVERAGE ANNUAL LOSS
% Uninsured GapSource: AIRWorldwide, A Verisk Analytics Business
Un
insu
red
Gap
Per
cen
tag
e
0
10
20
30
40
50
60
70
80
90
100
OceaniaNorth AmericaLatin AmericaEuropeAsia
92%
66%
87%
56%
63%
F-2 | EMEA INSURANCE GAP 2010 TO 2015 – ECONOMIC AVERAGE ANNUAL LOSS
% Gap Source: Munich Re NatCatSERVICE
Gap
Per
cen
tag
e
0
10
20
30
40
50
60
70
80
90
100
201520142013201220112010
75%
45%
84%
51%
59%56%
EUR
Bill
ions
73 Reinsurers41 Reinsurers
GROWTH PROFITABILITY
RISK
Policies cededto Flood Re
Volatility managedthrough outwards
reinsurance
Fund shortages:“Levy 2” capital call
Flood Re
Flood premiums
Flood claims
Levy 1Industry levy(£180m p.a.)
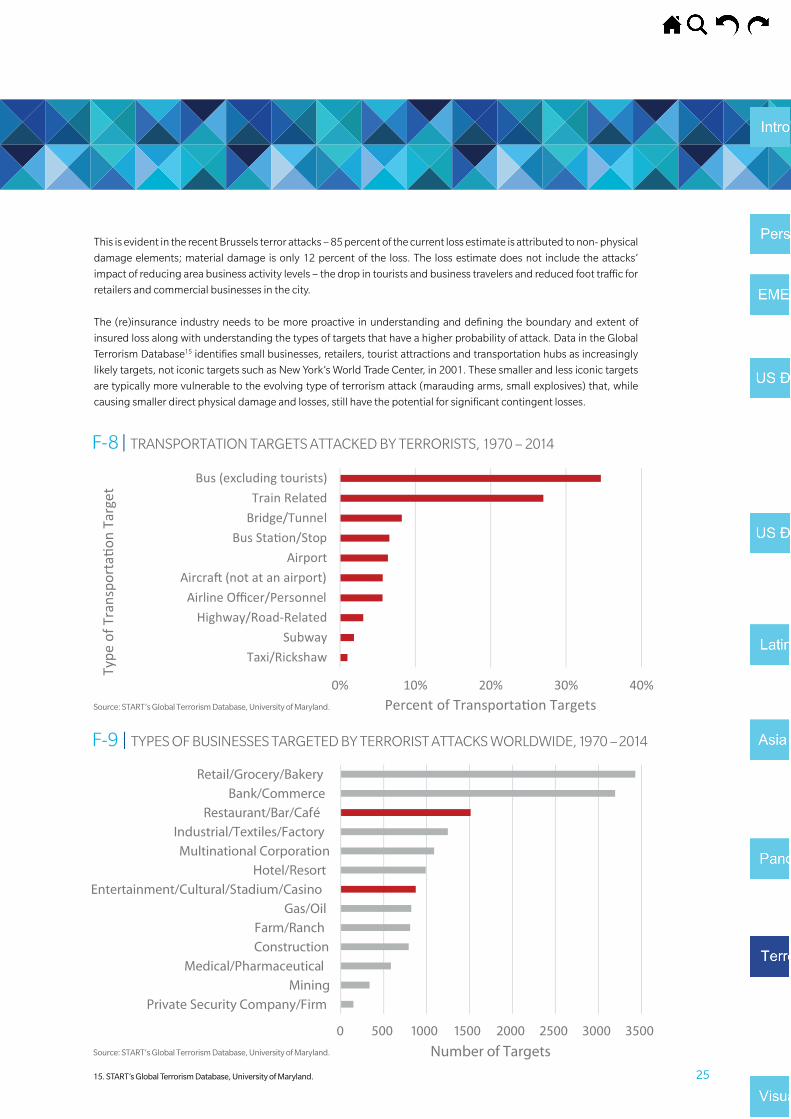
2515. sTaRT’s global Terrorism database, university of maryland.
This is evident in the recent Brussels terror attacks – 85 percent of the current loss estimate is attributed to non- physical
damage elements; material damage is only 12 percent of the loss. The loss estimate does not include the attacks’
impact of reducing area business activity levels – the drop in tourists and business travelers and reduced foot traffic for
retailers and commercial businesses in the city.
The (re)insurance industry needs to be more proactive in understanding and defining the boundary and extent of
insured loss along with understanding the types of targets that have a higher probability of attack. data in the global
Terrorism database15 identifies small businesses, retailers, tourist attractions and transportation hubs as increasingly
likely targets, not iconic targets such as New york’s world Trade Center, in 2001. These smaller and less iconic targets
are typically more vulnerable to the evolving type of terrorism attack (marauding arms, small explosives) that, while
causing smaller direct physical damage and losses, still have the potential for significant contingent losses.
F-3 | NATIONAL FIOOD INSURANCE PROGRAM DEBT TO THE U.S. TREASURY
USD
Bill
ions
F-5 | WHAT ARE THE COMPELLING REASONS TO WRITE THIS?
F-6 | TERRORISM POOL PRICE INDEX VERSUS CAPACITY
More people live inside the circle than outside.
Risk Spread overSponsor Expected Risk Amount Benchmark Index Measurement Attachment Exhaustion
Year Deal Name Name Maturity Period ($MM) Tranche (in bps) Risk Location Period Level (%) Level (%)
2003 Vita Capital Ltd. Swiss Re 1/1/2007 4 years 400.00 Notes 135 U.S. / U.K. / France / Italy / Switzerland
1 calendar year 130 150
62.00 Class B Notes 90 120 125200.00 Class C Notes 140 115 120100.00 Class D Notes 190 110 11575.00 Class A Notes (wrapped) 19 115 12080.00 Class B Notes 300 110 115129.00 Class B-1 Notes (wrapped) 20 114 11964.50 Class B-2 Notes 120 114 119150.00 Class C Notes 285 110 114100.00 Class D Notes 500 106 110
1/1/2011 4 years 100.00 Class A-IV (wrapped) 21 125 1451/1/2012 5 years 100.00 Class A-V (wrapped) 20 125 1451/1/2011 4 years 70.97 Class A-VI (wrapped) 21 125 1451/1/2012 5 years 129.04 Class A-VII 80 125 1451/1/2011 4 years 90.00 Class B-I 110 120 1251/1/2012 5 years 50.00 Class B-II 112 120 1251/1/2011 4 years 39.38 Class B-III 110 120 1251/1/2012 5 years 50.00 Class B-V (wrapped) 21 120 1251/1/2011 4 years 70.97 Class B-VI (wrapped) 22 120 125
2008 Nathan Ltd. Munich Re 1/15/2013 5 years 100.00 Class A-I 135 U.S. / U.K. / Canada / Germany
2 consecutive calendar years
120 130
2009 Vita Capital IV Ltd. Swiss Re 1/15/2004 5 years 75.00 Class E 650 U.S. / U.K 2 consecutive calendar years
U.S.: 105UK: 112.5
U.S.: 110UK: 120
2010 Vita Capital IV Ltd. Swiss Re 1/15/2014 4 years 50.00 Series II, Class E 525 U.S / U.K 2 consecutive calendar years
U.S.: 105UK: 112.5
U.S.: 110UK: 120
100.0 Series V 280 Canada / Germany CAN: 120, GER: 125
CAN: 130, GER: 135
80.0 Series VI 385US / UK/ Canada /
Germany
U.S. : 105; UK: 115; GER/CAN:
110
U.S.: 110; UK: 120;
GER/CAN: 115
125.00 Class D-1 Notes 270 Canada / Australia CAN: 120, AUS: 135
CAN: 130, AUS: 145
150.00 Class E-1 Notes 340 US / Canada / AustraliaCAN: 110, AUS: 120, U.S.: 105
CAN: 115, AUS: 130, U.S.: 110
Mythen Re 2012-2 1/15/2016 4 years 120.00 Class A (includes US hurricane) 850 U.K. 2 consecu�ve calendar years
125 135
2013 Atlas IX Re SCOR 1/17/2019 6 years 180.00 300 U.S. 2 consecu�ve calendar years
102 104
EUR135.00 Class A 255 France, Japan, U.S. 1 calendar yearFR: 108.1; JP: 108.2; U.S. 104.1
FR: 108.1; JP: 108.2; U.S. 104.2
EUR150.00 Class B 335 France, Japan, U.S. 1 calendar yearFR: 116; JP: 116; U.S. 108
FR: 116; JP: 116; U.S. 109
Vita Capital VI Swiss Re 1/8/2021 5 years 100.00 Class A 290 Australia, Canada and U.K.
1 calendar year
Year 1: AUS: 120; CAN: 115; UK: 120;
Dropdown feature in subsequent
years
Year 1: AUS: 130; CAN: 125; UK: 140;
Dropdown feature in
subsequent years
2 consecu�ve calendar years
Vita Capital IV
2 consecu�ve calendar years2012
2011 Swiss Re
Vita Capital VSwiss Re
4 years
4 years
1/15/2016
1/15/2017
2 consecutive calendar years
2 consecutive calendar years
2007 Vita Capital III Ltd. Swiss Re U.S. / U.K. / Germany / Japan / Canada
2 consecutive calendar years
U.S. / France / Japan2006 Osiris Capital p.l.c. AXA 1/15/2010 4 years
U.S. / U.K. / France / Italy / Switzerland
2 consecutive calendar years
2006 Tartan Capital Ltd. Scottish Re 1/7/2009 3 years U.S.
2005 Vita Capital II Ltd. Swiss Re 1/1/2010 5 years
Benu Capital 5 years1/8/2020AXA
2015
PLACEHOLDER
F-7 | NATURAL CATASTROPHE LOSSES: 1970-2015
Source: Swiss Re, sigma No. 1/2016 and Guy Carpenter.
0
50
100
150
200
250
300
350
400
450
1970 1975 1980 1985 1990 1995 2000 2005 2010 2015
Insured losses Uninsured losses 10 per. Mov. Avg. (Total Insured Losses) 10 per. Mov. Avg. (Total Eco Losses)
USD
Bill
ions
Source: Guy Carpenter from figures reported by FEMA and the NFIP
Source: FreddieMac (www.freddiemac.com) and Fannie Mae (www.fanniemae.com)
F-4 | CUMULATIVE LIMIT PLACED
USD
Bill
ions
.2.81.2
3.6
2.4
5.3
6
5
4
3
2
1
0
2013/2014 2015
Freddie Fannie
2016 YTD
F-8 | TRANSPORTATION TARGETS ATTACKED BY TERRORISTS, 1970 – 2014
Source: START’s Global Terrorism Database, University of Maryland.
0% 10% 20% 30% 40%
Taxi/RickshawSubway
Highway/Road-RelatedAirline Officer/Personnel
Aircra� (not at an airport)Airport
Bus Sta�on/StopBridge/TunnelTrain Related
Bus (excluding tourists)
Percent of Transporta�on Targets
Type
of T
rans
port
a�on
Tar
get
F-9 | TYPES OF BUSINESSES TARGETED BY TERRORIST ATTACKS WORLDWIDE, 1970 – 2014
Source: START’s Global Terrorism Database, University of Maryland.
0 500 1000 1500 2000 2500 3000 3500
Private Security Company/Firm
Mining
Medical/Pharmaceutical
Construction
Farm/Ranch
Gas/Oil
Entertainment/Cultural/Stadium/Casino
Hotel/Resort
Multinational Corporation
Industrial/Textiles/Factory
Restaurant/Bar/Café
Bank/Commerce
Retail/Grocery/Bakery
Number of Targets
2009 2010 2011 2012 2013 2014 2015 2016
100
90
80
70
60
50
40
30
20
10
0
8
7
6
5
4
3
2
1
0
Limit Written Price Index
Source: Guy Carpenter Terrorism database
F-1 | GLOBAL INSURANCE GAP 2015 – ECONOMIC AVERAGE ANNUAL LOSS
% Uninsured GapSource: AIRWorldwide, A Verisk Analytics Business
Un
insu
red
Gap
Per
cen
tag
e
0
10
20
30
40
50
60
70
80
90
100
OceaniaNorth AmericaLatin AmericaEuropeAsia
92%
66%
87%
56%
63%
F-2 | EMEA INSURANCE GAP 2010 TO 2015 – ECONOMIC AVERAGE ANNUAL LOSS
% Gap Source: Munich Re NatCatSERVICE
Gap
Per
cen
tag
e
0
10
20
30
40
50
60
70
80
90
100
201520142013201220112010
75%
45%
84%
51%
59%56%
EUR
Bill
ions
73 Reinsurers41 Reinsurers
GROWTH PROFITABILITY
RISK
Policies cededto Flood Re
Volatility managedthrough outwards
reinsurance
Fund shortages:“Levy 2” capital call
Flood Re
Flood premiums
Flood claims
Levy 1Industry levy(£180m p.a.)
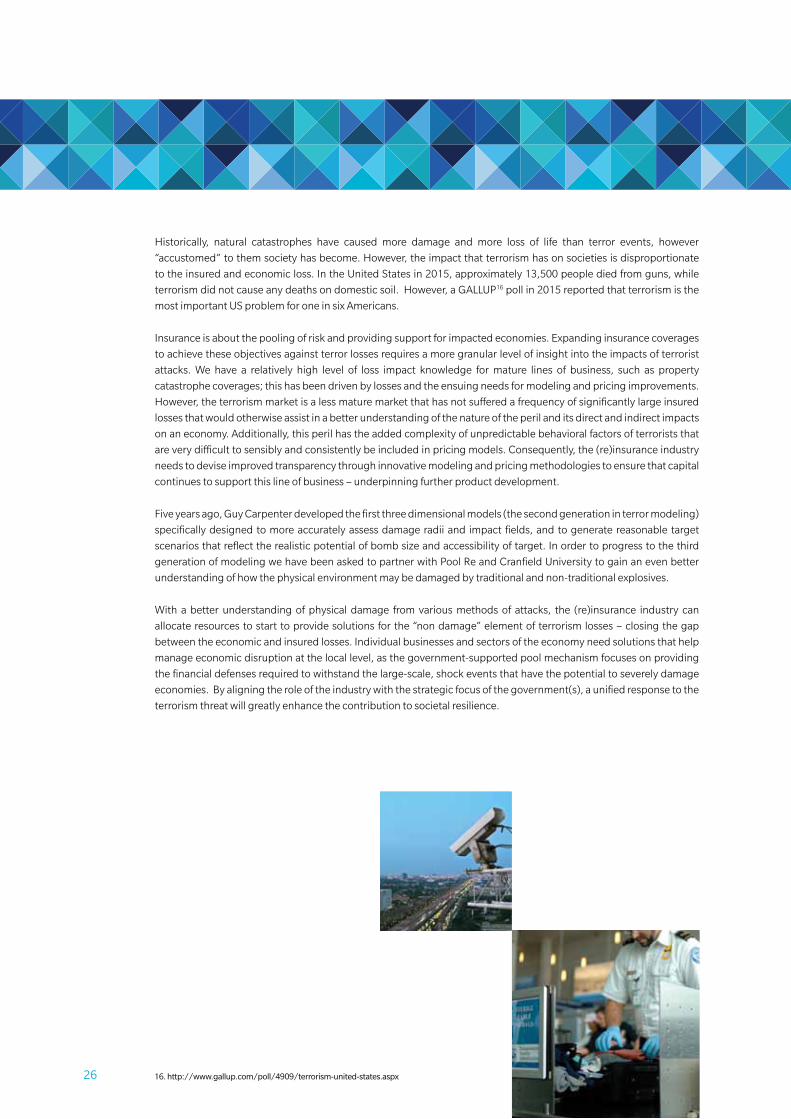
26 16. http://www.gallup.com/poll/4909/terrorism-united-states.aspx
historically, natural catastrophes have caused more damage and more loss of life than terror events, however
“accustomed” to them society has become. however, the impact that terrorism has on societies is disproportionate
to the insured and economic loss. in the united States in 2015, approximately 13,500 people died from guns, while
terrorism did not cause any deaths on domestic soil. however, a gALLup16 poll in 2015 reported that terrorism is the
most important uS problem for one in six Americans.
insurance is about the pooling of risk and providing support for impacted economies. Expanding insurance coverages
to achieve these objectives against terror losses requires a more granular level of insight into the impacts of terrorist
attacks. we have a relatively high level of loss impact knowledge for mature lines of business, such as property
catastrophe coverages; this has been driven by losses and the ensuing needs for modeling and pricing improvements.
however, the terrorism market is a less mature market that has not suffered a frequency of significantly large insured
losses that would otherwise assist in a better understanding of the nature of the peril and its direct and indirect impacts
on an economy. Additionally, this peril has the added complexity of unpredictable behavioral factors of terrorists that
are very difficult to sensibly and consistently be included in pricing models. Consequently, the (re)insurance industry
needs to devise improved transparency through innovative modeling and pricing methodologies to ensure that capital
continues to support this line of business – underpinning further product development.
Five years ago, guy Carpenter developed the first three dimensional models (the second generation in terror modeling)
specifically designed to more accurately assess damage radii and impact fields, and to generate reasonable target
scenarios that reflect the realistic potential of bomb size and accessibility of target. in order to progress to the third
generation of modeling we have been asked to partner with pool re and Cranfield university to gain an even better
understanding of how the physical environment may be damaged by traditional and non-traditional explosives.
with a better understanding of physical damage from various methods of attacks, the (re)insurance industry can
allocate resources to start to provide solutions for the “non damage” element of terrorism losses – closing the gap
between the economic and insured losses. individual businesses and sectors of the economy need solutions that help
manage economic disruption at the local level, as the government-supported pool mechanism focuses on providing
the financial defenses required to withstand the large-scale, shock events that have the potential to severely damage
economies. By aligning the role of the industry with the strategic focus of the government(s), a unified response to the
terrorism threat will greatly enhance the contribution to societal resilience.
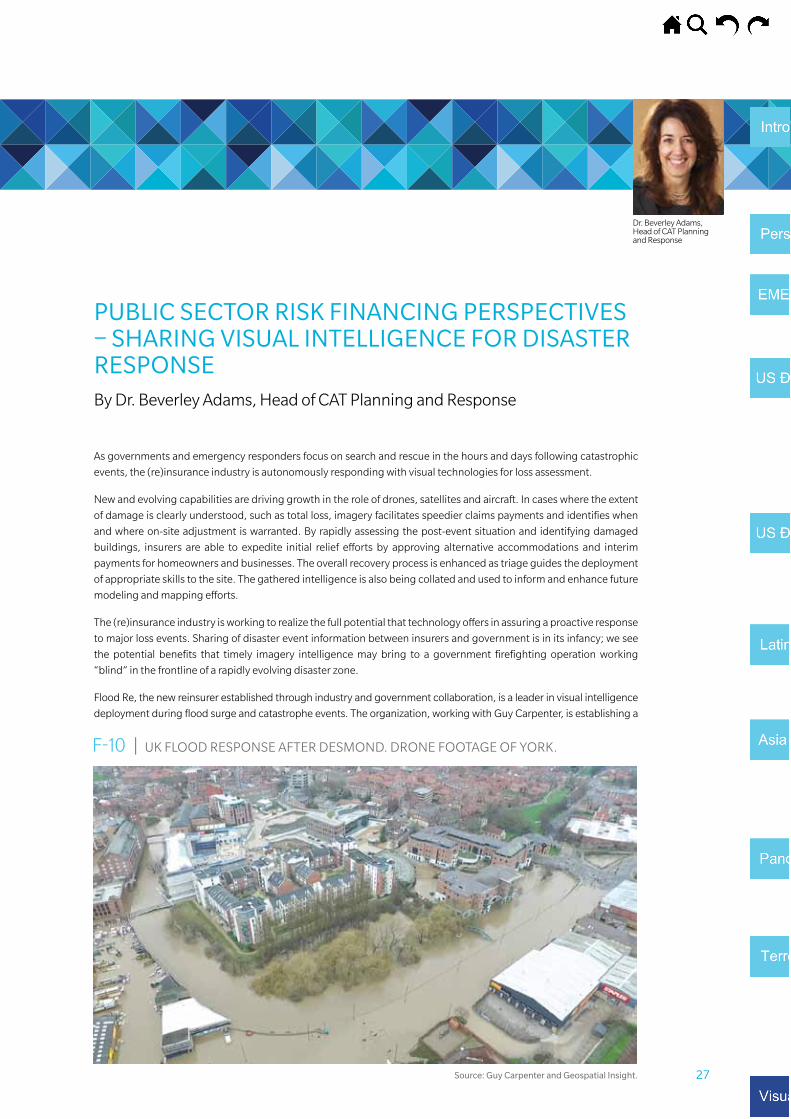
27
PuBliC sECTOR Risk finanCing PERsPECTivEs – shaRing visual inTElligEnCE fOR disasTER REsPOnsEBy dr. Beverley Adams, head of CAT planning and response
As governments and emergency responders focus on search and rescue in the hours and days following catastrophic
events, the (re)insurance industry is autonomously responding with visual technologies for loss assessment.
New and evolving capabilities are driving growth in the role of drones, satellites and aircraft. in cases where the extent
of damage is clearly understood, such as total loss, imagery facilitates speedier claims payments and identifies when
and where on-site adjustment is warranted. By rapidly assessing the post-event situation and identifying damaged
buildings, insurers are able to expedite initial relief efforts by approving alternative accommodations and interim
payments for homeowners and businesses. The overall recovery process is enhanced as triage guides the deployment
of appropriate skills to the site. The gathered intelligence is also being collated and used to inform and enhance future
modeling and mapping efforts.
The (re)insurance industry is working to realize the full potential that technology offers in assuring a proactive response
to major loss events. Sharing of disaster event information between insurers and government is in its infancy; we see
the potential benefits that timely imagery intelligence may bring to a government firefighting operation working
“blind” in the frontline of a rapidly evolving disaster zone.
Flood re, the new reinsurer established through industry and government collaboration, is a leader in visual intelligence
deployment during flood surge and catastrophe events. The organization, working with guy Carpenter, is establishing a
F-10 | uk FLOOd rESpONSE AFTEr dESMONd. drONE FOOTAgE OF yOrk.
source: guy Carpenter and geospatial insight.
dr. Beverley Adams, head of CAT planning and response
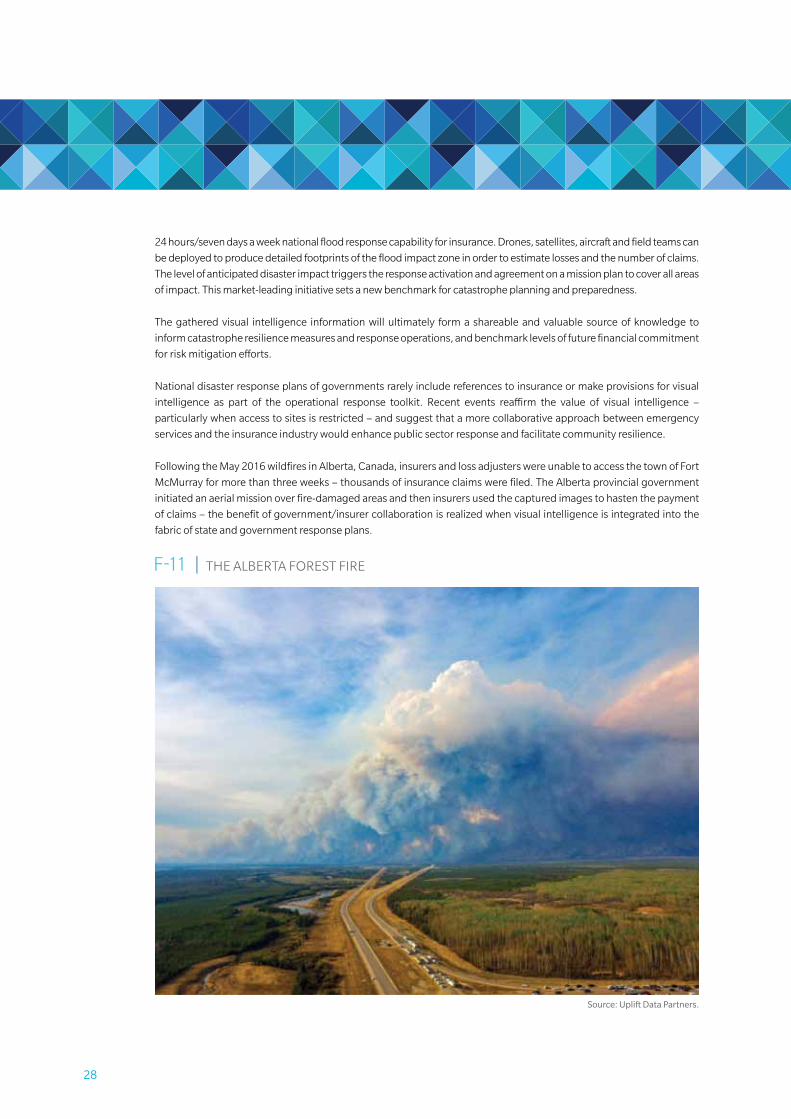
28
24 hours/seven days a week national flood response capability for insurance. drones, satellites, aircraft and field teams can
be deployed to produce detailed footprints of the flood impact zone in order to estimate losses and the number of claims.
The level of anticipated disaster impact triggers the response activation and agreement on a mission plan to cover all areas
of impact. This market-leading initiative sets a new benchmark for catastrophe planning and preparedness.
The gathered visual intelligence information will ultimately form a shareable and valuable source of knowledge to
inform catastrophe resilience measures and response operations, and benchmark levels of future financial commitment
for risk mitigation efforts.
National disaster response plans of governments rarely include references to insurance or make provisions for visual
intelligence as part of the operational response toolkit. recent events reaffirm the value of visual intelligence –
particularly when access to sites is restricted – and suggest that a more collaborative approach between emergency
services and the insurance industry would enhance public sector response and facilitate community resilience.
Following the May 2016 wildfires in Alberta, Canada, insurers and loss adjusters were unable to access the town of Fort
McMurray for more than three weeks – thousands of insurance claims were filed. The Alberta provincial government
initiated an aerial mission over fire-damaged areas and then insurers used the captured images to hasten the payment
of claims – the benefit of government/insurer collaboration is realized when visual intelligence is integrated into the
fabric of state and government response plans.
F-11 | ThE ALBErTA FOrEST FirE
source: uplift data Partners.
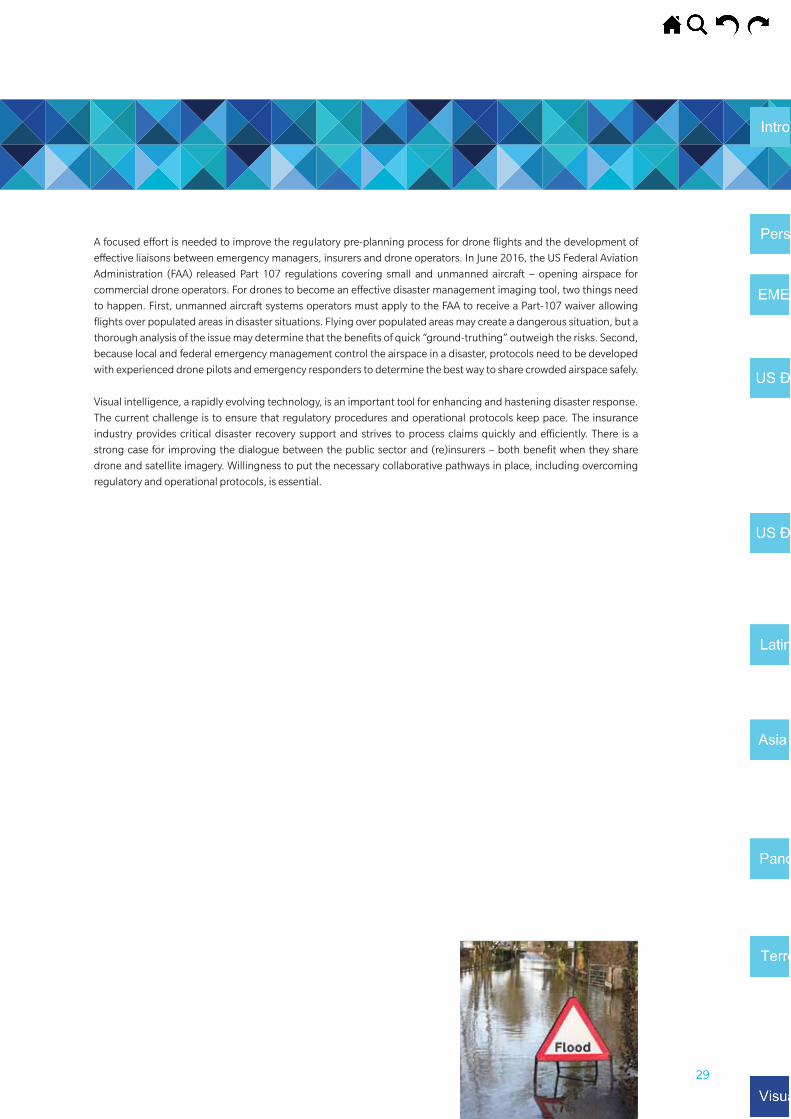
29
A focused effort is needed to improve the regulatory pre-planning process for drone flights and the development of
effective liaisons between emergency managers, insurers and drone operators. in June 2016, the uS Federal Aviation
Administration (FAA) released part 107 regulations covering small and unmanned aircraft – opening airspace for
commercial drone operators. For drones to become an effective disaster management imaging tool, two things need
to happen. First, unmanned aircraft systems operators must apply to the FAA to receive a part-107 waiver allowing
flights over populated areas in disaster situations. Flying over populated areas may create a dangerous situation, but a
thorough analysis of the issue may determine that the benefits of quick “ground-truthing” outweigh the risks. Second,
because local and federal emergency management control the airspace in a disaster, protocols need to be developed
with experienced drone pilots and emergency responders to determine the best way to share crowded airspace safely.
visual intelligence, a rapidly evolving technology, is an important tool for enhancing and hastening disaster response.
The current challenge is to ensure that regulatory procedures and operational protocols keep pace. The insurance
industry provides critical disaster recovery support and strives to process claims quickly and efficiently. There is a
strong case for improving the dialogue between the public sector and (re)insurers – both benefit when they share
drone and satellite imagery. willingness to put the necessary collaborative pathways in place, including overcoming
regulatory and operational protocols, is essential.

30
guy Carpenter, gC Securities and Marsh are committed to helping our clients understand the evolving landscape and
advising them as they engage and take advantage of promising opportunities. we believe these opportunities will
expand as public and private sector entities work more closely to improve societies’ resilience to risk. guy Carpenter’s
public Sector Specialty practice is a global team focusing on the unique risk management needs of governmental
agencies and entities.
31
COnTaCT usFor additional information on guy Carpenter solutions, please contact your representative or visit your local office
or guycarp.com
For media or general inquiries:
Jennifer Ainslie
+44 207 357 2058
32
aBOuT guy CaRPEnTERguy Carpenter & Company, llC is a leading global risk and reinsurance specialist. since 1922, the company has delivered integrated reinsurance and capital market solutions to clients across the globe. as a most trusted and valuable reinsurance broker and strategic advisor, guy Carpenter leverages its intellectual capital to anticipate and solve for a range of business challenges and opportunities on behalf of its clients. With over 2,300 professionals in more than 60 offices around the world, guy Carpenter delivers a powerful combination of broking expertise, strategic advisory services and industry-leading analytics to help clients achieve profitable growth. for more information on guy Carpenter’s complete line-of-business expertise and range of business units, including gC specialties, gC analytics®, gC fac®, global strategic advisory, gC securities*, Client services and gC micro Risk solutions®, please visit www. guycarp. com and follow guy Carpenter on linkedin and Twitter @guyCarpenter.
guy Carpenter is a wholly owned subsidiary of marsh & mclennan Companies (nysE: mmC), a global professional services firm offering clients advice and solutions in the areas of risk, strategy, and people. With annual revenue of $13 billion and 60,000 colleagues worldwide, marsh & mclennan Companies provides analysis, advice, and transactional capabilities to clients in more than 130 countries through: marsh, a leader in insurance broking and risk management; mercer, a leader in talent, health, retirement, and investment consulting; and Oliver Wyman, a leader in management consulting. marsh & mclennan is committed to being a responsible corporate citizen and making a positive impact in the communities in which it operates. visit www.mmc.com for more information and follow us on linkedin and Twitter @mmC_global.
*securities or investments, as applicable, are offered in the united states through gC securities, a division of mmC securities llC, a us registered broker-dealer and member finRa/nfa/siPC. main Office: 1166 avenue of the americas, new york, ny 10036. Phone: (212) 345-5000. securities or investments, as applicable, are offered in the European union by gC securities, a division of mmC securities (Europe) ltd. (mmCsEl), which is authorized and regulated by the financial Conduct authority, main office 25 The north Colonnade, Canary Wharf, london E14 5hs. Reinsurance products are placed through qualified affiliates of guy Carpenter & Company, llC. mmC securities llC, mmC securities (Europe) ltd. and guy Carpenter & Company, llC are affiliates owned by marsh & mclennan Companies. This communication is not intended as an offer to sell or a solicitation of any offer to buy any security, financial instrument, reinsurance or insurance product.
Disclaimerguy Carpenter & Company, llC provides this report for general information only. The information contained herein is based on sources we believe reliable, but we do not guarantee its accuracy, and it should be understood to be general insurance/reinsurance information only. guy Carpenter & Company, llC makes no representations or warranties, express or implied. The information is not intended to be taken as advice with respect to any individual situation and cannot be relied upon as such. Please consult your insurance/reinsurance advisors with respect to individual coverage issues.
statements concerning tax, accounting, legal or regulatory matters should be understood to be general observations based solely on our experience as reinsurance brokers and risk consultants, and may not be relied upon as tax, accounting, legal or regulatory advice, which we are not authorized to provide. all such matters should be reviewed with your own qualified advisors in these areas.
Readers are cautioned not to place undue reliance on any historical, current or forward-looking statements. guy Carpenter & Company, llC undertakes no obligation to update or revise publicly any historical, current or forwardlooking statements, whether as a result of new information, research, future events or otherwise.
This document or any portion of the information it contains may not be copied or reproduced in any form without thepermission of guy Carpenter & Company, llC, except that clients of guy Carpenter & Company, llC need not obtain such permission when using this report for their internal purposes.
The trademarks and service marks contained herein are the property of their respective owners.
Guy Carpenter Report
© 2016 guy Carpenter & Company, llC
m2488.10.16.1000k | © 2016 guy CaRPEnTER & COmPany, llC | guyCaRP.COm