2019 – Compendium - Nsb.lk
280
-
Upload
khangminh22 -
Category
Documents
-
view
0 -
download
0
Transcript of 2019 – Compendium - Nsb.lk


With a legacy associated with trust, safety, and strength, we are on a momentous journey to the future to provide 360° financial solutions to our customers. At present, we are at an exciting juncture where the ever-unfolding digital landscape and all its possibilities have dissolved the traditional boundaries between sectors. As we venture forward on this journey, we reinforce our commitment to foster a savings culture, our pledge to sustainability, and our responsibility to serve the Nation.
Our journey is inspired. Our journey is momentous.
A momentous journey to the futureInspired by an unfolding digital era

Governance Financial Reports Supplementary Information
194 National Savings Bank │ Annual Report 2019
Contents
Book - 01 Integrated Annual Report 2019
P. 04
Preamble04 About this Report07 NSB at a glance10 Milestones11 Highlights12 Chairperson’s Message16 General Manager/CEO’s Review
P. 19
Our Value Creation Model A comprehensive discussion of the Bank’s value creation process guided by NSB’s Vision, Mission, Values, and the Strategy. This section includes NSB’s Business Model that presents an overview of the value creation process. Further, it presents the operating environment and outlines the Bank’s stakeholder engagement process, materiality identification process, and sustainability policy which contributes to the formulation of the Bank’s strategy.
20 Our Sustainable Business Model22 Operating Environment49 Strategy and Resource Allocation 70 Integrated Stakeholder
Engagement 78 Materiality Matters
P. 89
Management Discussion and AnalysisThis section is a comprehensive overview of NSB’s operations, performance, challenges, and future outlook according to each capital. Further, it outlines NSB’s position with regard to sustainability as a binding part of our business operations and performance.
90 Financial Capital112 Manufactured Capital120 Intellectual Capital130 Human Capital144 Social and Relationship Capital162 Natural Capital170 GRI Content Index in
Accordance with Core Criteria
P. 175
GovernanceAn overview of the integrated system of corporate governance, compliance and the risk management framework of NSB. Corporate governance at NSB results in efficient operations, improved access to capital, risk mitigation and safeguarding of the stakeholders.
176 Board of Directors180 Corporate Management182 Executive Management184 Chief Managers185 Statement on Corporate
Governance186 Statement on Risk Management

Governance Financial Reports Supplementary Information
195Annual Report 2019 │ National Savings Bank
Book - 02Compendium
P. 187
Financial ReportsNSB’s financial performance and position for the year 2019 as depicted by the Income Statement, Statement of Comprehensive Income and Statement of Financial Position. The Financial Statements along with the Notes to the Financial Statements are depicted in Book 02 Compendium under Financial Reports.
188 Income Statement189 Statement of Comprehensive
Income190 Statement of Financial Position192 Corporate Information
Governance(P. 196)196 Corporate Governance233 Report of the Board
Audit Committee237 Report of the Board Human
Resource and Remuneration Committee
239 Report of the Board Nomination Committee
241 Report of the Board Integrated Risk Management Committee
244 Report of the Board Credit Committee
246 Report of the Board Information Technology Strategy Committee
248 Risk Management
Financial Reports(P. 275)276 Financial Calendar277 Annual Report of Board of Directors283 Statement of Directors’ Responsibility for Financial Reporting285 Directors’ Statement on Internal Control over Financial Reporting287 Independent Assurance Report on Internal Control288 Independent Assurance Report291 General Manager/CEO’s and Senior Deputy General Manager’s
(Finance and Planning) Statement of Responsibility293 Auditor General’s Report 295 Content of Financial Statements296 Income Statement297 Statement of Comprehensive Income298 Statement of Financial Position300 Statement of Changes in Equity304 Statement of Cash Flows306 Notes to the Financial Statements
Supplementary Information(P. 425)426 Products and Services430 Income Statement in US Dollars431 Statement of Comprehensive
Income in US Dollars432 Statement of Financial Position
in US Dollars433 Basel III Disclosures as per
Schedule III of Banking Act Direction No. 1 of 2016
446 D-SIB Assessment Exercise – 2019448 Other Disclosure Requirements
as required by CBSL455 Statistical Indicators 2010-2019457 Analysis of Deposits458 Correspondent Banks459 Exchange Companies461 Eurogiro Members462 Glossary of Financial and
Banking Terms

Governance Financial Reports Supplementary Information
196 National Savings Bank │ Annual Report 2019
Corporate Governance
Message from Chairperson
Dear Stakeholders
We believe that the way we approach governance and leadership in our business supports our overall value creation process. To achieve sustained value, we need to establish and maintain trust with our stakeholders, which would be impossible without embracing governance as a business enabler. The Board of Directors of the Bank therefore are committed to ensure that the tone for good governance is integrated in the thinking process and the way the Bank operates at all levels.
The new diverse Board of the Bank was appointed in January 2020 with strong commercial and technical skills to appropriately deliberate, advise and make informed decisions on relevant matters; and objectively and effectively discharge its governance role and responsibilities to the shareholder. (Refer page 176 on Profile of Board of Directors).
The sound governance structure, processes and practices ensured that the Bank is well-managed and controlled with minimal negative impacts to our functions even in the absence of a Board, until the new appointments were made (Refer page 201 for full details of the Changes in the Board and the Board Subcommittees).
During the year 2019, the Board held 17 scheduled meetings primarily focusing on strategy, large and material transactions, IT and IT security, operating and financial performance review, risk management, review of policy framework and governance updates and regulatory considerations. The Bank has formulated a Corporate Social Responsibility and Sustainability Committee (CSRSC) with the objective of being conscious of the dynamic
interdependencies of economic, social and environmental interests and to reconcile them in daily business activities to ensure long-term value creation for stakeholders.
Our Board remains focused on how the Bank delivers solutions that put the customer at the heart of everything we do. The Bank is conscious of ever-increasing understanding of the criticality of technology in delivering customer service. During the year, the Board spent considerable time reviewing the delivery of our IT resilience and digital transformation with the new core banking solution.
This report sets out our approach to governance in practice, the work of the Board during 2019 and the activities carried out by the Board Committees in the year 2019. The report also contains the Bank’s status of compliance with the Banking Act Direction No. 12 of 2007 for Licensed Specialised Banks. The Bank also voluntarily adopted the revised Code of Best Practice on Corporate Governance issued by The Institute of Chartered Accountants of Sri Lanka.
Looking forward in 2020, our corporate governance priorities will continue to deliver and oversee the implementation of the Bank’s strategy while delivering the best quality service to the customers.
Ms Keasila JayawardanaChairperson
24 March 2020Colombo

Governance Financial Reports Supplementary Information
197Annual Report 2019 │ National Savings BankCorporate Governance
Our approach to corporate governance
At NSB our approach to governance extends beyond compliance. We firmly believe that our approach to governance and leadership in our business creates shared value by underpinning responsive thinking and responsible behaviour through enhanced accountability, effective leadership, robust risk management, clear performance management and greater transparency. In our way forward to achieve sustained value we embrace governance as a business enabler in order to maintain trust with our stakeholders now and in the future.
In an ever evolving and complex regulatory environment, banks are expected to adapt to those changes quickly to entrench good governance practices while being proactive to the changes in regulatory landscape. We constantly review our governance framework to ensure that we have embraced the world class banking practices and robust institutional frameworks to act in the best interest of our stakeholders.
We are committed to the highest level of governance and strive to foster a culture that values and rewards exemplary ethical standards, personal and corporate integrity and respect for others. In our aspiration to be a responsible corporate citizen, we follow regulatory requirements, voluntary codes and internal elements of corporate governance applicable to the Bank.
Governance supports our strategy.The Board is cognisant that a well governed Bank which has embraced best practices inspires the stakeholder confidence, lowers the cost of capitals, builds an inclusive governance framework and aspires to be sustainable. The shape and prospects
and long-term viability of the Bank will be determined by the decisions and actions taken by the Board in directing the Bank. The Board ensures that the Bank is fully-pledged to comply with applicable laws, regulations and best practices on governance. This will support the Bank to be a responsible corporate citizen while going forward with strategy implementation. The Board monitors the implementation of the Bank’s strategy through an Action Plan that operationalises the strategies and kept abreast of the achievements and risks associated with in fulfilling the strategies. Long-term sustainability is a key focus of the Board and it monitors economic, social, governance, and environmental outcomes on a continuous basis.
The corporate governance framework of the Bank is mandated by the regulatory framework as well as voluntary codes and internal elements.
Regulatory requirements z NSB Act No. 30 of 1971 and
amendments therein z Banking Act No. 30 of 1988 and
amendments therein z All Directions issued to Licensed
Specialised Banks by the Central Bank of Sri Lanka (CBSL) particularly the Banking Act Direction No.12 of 2007 on Corporate Governance
z Inland Revenue Act No. 24 of 2017 and amendments thereto
z Shop and Office Act No. 19 of 1954 and amendments thereto
z Code of Best Practice in Corporate Governance for Public Enterprises in Sri Lanka
Voluntary codes relevant to the Bank
z Code of Best Practice on Corporate Governance issued by the CA Sri Lanka for the Governance Code issued in 2017.
Internal elements z Board Charter z Board Subcommittee Charters z Code of Conduct z Board approved policies and
procedures
Governance structure
A well-architectured governance structure and processes ensure that the Bank is well managed and controlled. The Bank has a well-defined governance structure with clearly defined delegation of authority. The governance processes in place ensure that we deliver against this strategy to create value for ourselves and our stakeholders – now and the way forward. The Board of Directors being the custodians of governance serves as the apex decision-making authority of the Bank. The responsibilities of the Board are cascaded down to the Board Committees, Management Committees and the Management. The Board of Directors assisted by Board Committees provides ethical and effective leadership towards the achievement of the Bank’s strategy and ensures that the Bank is managed within the agreed risk appetite. Management and the Management Committees are responsible for execution of the strategies directed and approved by the Board. Strategic business lines are responsible and accountable for carrying out operations assuming risk upon agreed risk levels.
Refer page 198 for the Governance structure of the Bank.

Governance Financial Reports Supplementary Information
198 National Savings Bank │ Annual Report 2019 Corporate Governance
Governance Structure of National Savings Bank
Shareholder The Government of Sri Lanka
Auditor/Auditor General
Internal Audit
Compliance
Risk Management
Regulators
Board of Directors
Management CommitteesGeneral Manager/CEO
Corporate Management
Main Board
Board Audit Committee
Board Integrated Risk
Management Committee
Board Human Resources
and Remuneration Committee
Board Nomination Committee
Board Credit Committee
Board Information Technology and
Strategy Committee
Mandatory Committees Non-Mandatory Committees
CM
C
AL
CO
CC
PR
CIC
EC TNIC
BO
SC
IT S
C
MK
TC
OR
MC
PD
C
HR
C
CP
C M
ajor
CP
C M
inor
EP
C
CSR
SC
CMC Corporate Management CommitteeALCO Assets Liability Management CommitteeCC Credit CommitteeIC Investment CommitteeEC Equity CommitteeTNIC Tender and New Investment Committee PRC Performance Review CommitteeBOSC Branch Operations Steering CommitteeIT SC IT Steering Committee
MKTC Marketing CommitteeORMC Operational Risk Management CommitteePDC Product Development CommitteeHRC Human Resources CommitteeCPC Major Corporate Procurement Committee – MajorCPC Minor Corporate Procurement Committee – Minor EPC Executive Procurement CommitteeCSRSC Corporate Social Responsibility and Sustainability Committee
Appointment f low
Responsibility f low – Direct
Administrative f low
Dialogue
GRI 102-18

Governance Financial Reports Supplementary Information
199Annual Report 2019 │ National Savings BankCorporate Governance
Board of Directors
The Board of Directors is the ultimate authority responsible for corporate governance across the Bank, and for providing ethical and effective stewardship towards the achievement of the Bank’s strategy within the agreed risk appetite level. They meaningfully contribute to leading the Bank by bringing diversity to Board deliberations and create sustained value by constructively challenging the Management. A clear division of responsibilities of Board ensures that no Director has unfettered powers in decision-making. The Board monitors and holds Corporate Management accountable for the Bank’s operational performance, financial performance and effective internal control systems and Management is open and transparent with the Board, bringing all significant matters to its attention. In-depth interactions between the Board and the Corporate Management strengthen the Bank’s decision-making and ensures an appropriate balance of power. These engagements take place with mutual respect and candour.
The Board assumes collective responsibility for:
And has adopted a stakeholder inclusive approach in the execution of its governance roles and responsibilities.
Board of Directors
Accountability
Policy
Oversight
Strategy
Roles responsibilities and powers of the Board
The roles and responsibilities and the powers reserved to the Board are given in the Board Charter as listed below.
Powers reserved to the Board z To act as the final decision-
making authority with regard to any matter related to the Bank subject to restrictions made in the Board Charter or any other laws/ regulations in force.
z To arrive at suitable decisions on financial matters subject to provisions of the approved Procurement Manual of the Bank and other applicable laws/regulations in force.
z To formulate policies and guidelines to govern all activities of the Bank in order to ensure that most favourable business initiatives are taken at all levels.
z To inquire into any matter pertaining to performance, management or administration of the Bank by way of calling for reports, appointment of a committee or any other suitable method as decided by the Board.
Roles and responsibilities of the Board
z Engage in any macro level matter which requires direction/guidance from the Board of Directors.
z Maintaining regular monitoring and supervision across overall functions of the Bank.
z Taking appropriate actions based on recommendations made by any Board Subcommittee, any Director, General Manager/CEO or any other committee exercising powers delegated by the Board.
z Monitoring and evaluating the performance of the Bank and also performance of KMPs including General Manager/CEO.
z Appointment of General Manager/CEO and, placements and promotions in line with the Terms of Reference of BHRRC and BNC.
Board composition
The Board is constituted in terms of the NSB Act. The Board Charter details the roles and responsibilities bestowed upon the Board. The present Board comprises of six Directors who are eminent professionals in their chosen fields of expertise and skills to carry out deliberations on matters set before the Board. One Directors is Independent Non-Executive and six Directors are Non-Independent Non-Executive. The Chairman has overall responsibility

Governance Financial Reports Supplementary Information
200 National Savings Bank │ Annual Report 2019 Corporate Governance
for the leadership of the Board and for ensuring its effectiveness. The Board ensures that the Bank manages risk effectively, monitors financial performance and reporting and ensures that appropriate and effective internal controls and procedures are in place. It provides and encourages entrepreneurial leadership across the Bank within this framework.
Profiles of the Board of Directors for the year 2019, including their qualifications and skills, other significant appointments and membership of the Board Committees are given on pages 201 to 205.
Board skills and expertise
As a financial intermediary, the Bank needs a broad range of skills to ensure the value creation in the interest of all stakeholders. The Board determines the required composition of skills in response to the rapidly changing environment and shifts in the Bank’s long-term strategy. Having the right mix of skills and expertise ensures that a united Board as a united team is well equipped to guide and drive the Bank’s strategy the way forward and in the process of value creation. Our Board is equipped with skills and experience specifically in the fields of banking, finance, economics, research, planning, strategy development, IT, cybersecurity, humanities, management, administration and international relations.
Board process
The Board meets at least once in six weeks based on an agreed meeting schedule as per the NSB Act. Additional meetings are convened based on the requirements to do so. Directors regularly attend the meetings and actively participate in the deliberations. Details of attendance at Board meetings are given on page 204. The Chairman is responsible for determining the agenda of meetings with assistance of the Secretary to the Board in consultation with the General Manager/CEO. The agenda is circulated to the Board members along with the relevant Board papers prior to one week of the Board meeting by the Secretary to the Board. This process allows the Board for timely preparation and make deliberations and informed decision. On exceptional situations, urgent Board papers are submitted at short notice or tabled during the meetings. Adequately detailed minutes of the meetings and the decisions made therein are maintained to access by Directors. Board members also can request certain items to be included in the agenda for discussion and decision-making.
Conflicts of interest
The members of the Board are committed to act in the best interest of the Bank, in good faith and avoid undue conflicts of interest whether financially or otherwise. Directors are required to inform the Board promptly of conflicts or potential conflicts of interest that they may have in relation to particular items of business. Directors are obliged to excuse themselves from discussions of decisions on any matters in which they have a conflict of interest.
A standard agenda item is included for members to declare whether any of them have any conflict of interest in respect of a matter on the agenda and minuted accordingly. Any banking facilities provided to the Directors are in compliance with the authorisation given by the CBSL. Directors annually declare their interest and necessary procedures are in place to ensure that there is no conflict of interest.
During the year 2019, none of the Directors had a significant interest in any contract or arrangement entered into by the Bank or its subsidiaries other than as disclosed in Note 49.5.2 of the Financial Statements.
Board meetings
The Board of Directors held 17 scheduled meetings during the year inclusive of special meetings. The Board meetings are held at least once in every six weeks according to the provision of NSB Act and special meetings are held when the need arises. In the governance process to deliver against the strategies, the Board dedicated their time in providing clear directions to the Corporate Management in formulation of the Bank’s three-year Strategic Business Plan which was consequently reviewed and approved by the Board. During the year, the Board continued to devote time on capital management, reviewed the performance and implementation of Strategic Business Plan and deliberated on matters that require further attention, acquisition of fully-owned subsidiary; Sri Lanka Savings Bank, risk management, compliance and corporate governance.The details of meetings of the Board and Board Committees are given on page 204.

Governance Financial Reports Supplementary Information
201Annual Report 2019 │ National Savings BankCorporate Governance
Board of Directors for the year 2019
Name Tenor Qualifications Experience Previous key appointments
Mr R M P Rathnayake
ChairmanNon-Independent Non-executive Ex-officio Director
19 November 2018 – 19 February 2019
z Master of Science in Agriculture and Natural Resource Management from Agricultural University of Norway
z Bachelor of Science degree in Agri-Economics from University of Peradeniya
z Postgraduate Diploma in Natural Resource Management from Agricultural University of Norway
z 23 years of experience in executive positions in the public service
z Member of Board of Directors of various government agencies including Licensed State Banks
z Alternative Director at Asian Infrastructure Investment Bank, Beijing China
Mr Jayaraja Chandrasekera
Chairman Non-Independent Non-Executive Director
5 March 2019 – 25 November 2019
z Master of Business Administration from the University of Sunderland, UK
z Postgraduate Diploma in Strategic Management.
z Member of the Association of Professional Bankers, Sri Lanka
z Held Senior Corporate Management positions in Sri Lanka’s leading private commercial bank, Hatton National Bank PLC, during his career spanning over 35 years.
z Held Senior Corporate Management positions and handled Banking and Bancassurance related responsibilities during his longterm of experience in the Financial Services Industry
z Member of the Board of Directors of Pan Asia Banking Corporation (PABC Bank) since 2015
Mr Anil Rajakaruna
Non-IndependentNon-Executive Director
28 February 2019 to 5 December 2019
z Holds First in Laws (LLB, Part 1) from the University of Colombo
z Diploma in External Affairs from the Centre for Bandaranaike International Studies
z Attorney-at-Law with 22 years of experience
z 22 years of experience in Legal Profession
z Third term of Directorship with NSB including the period of serving as Working Director of the Bank during 2002-2004 and 02.11.2015 to 31.12.2018 as a Director
z Vice Chairman, Compensation Board and a Council Member, University of Colombo.

Governance Financial Reports Supplementary Information
202 National Savings Bank │ Annual Report 2019 Corporate Governance
Name Tenor Qualifications Experience Previous key appointments
Mr U G R Ariyaratne
Non-Independent Non-ExecutiveEx-officio Director(Independent Director from 31 August 2018 to 24 October 2019)
w.e.f. 31 August 2018 z Bachelor of Commerce from the University of Kelaniya
z Master in Sociology and Postgraduate Diploma in Regional Planning from the University of Kelaniya
z Postgraduate Diploma in Education from the University of Peradeniya
z Certificate of Public Administration and Certificate of General Management and Capacity Building Programme for SLAS Class I Officer from Sri Lanka Institute of Development Administration (SLIDA)
z He has 23 years of experience in public service
z Postmaster General, Department of Post (from August 2018 to date)
z Resource person at MDTU, North Western Provincial Council and Police, Service Training Centre, North Central Province
z District Secretary of the District Secretariat of Polonnaruwa
z Additional Secretary of Social Development, Additional Secretary of Rural Development at the Ministry of Social Empowerment and Welfare, Director General of Coconut Development Authority
Mr P Algama
Non-Independent Non-ExecutiveEx-officio Director
28 February 2019 – 22 January 2020
z Bachelor of Commerce from the University of Kelaniya
z Master of Business Administration from Nanyang Technological University, Singapore and the Sloan School of Management of the Massachusetts Institute of Technology (MIT) Boston, USA
z Associate Member of the CPA Australia
z 18 years of service at the Ministry of Finance
z He has served at the Ministry of Finance and Planning, he has served as the Director of Department of Public Enterprises, Director/Deputy Director Budget (Economic Infrastructure Development Cluster) at the Department of National Budget and Assistant Director of Department of State Accounts
z Member of the Board of Directors of State Mortgage and Investment Bank, Postgraduate Institute of Management, State Plantation Corporation, Sri Lanka Film Corporation, Sri Lanka Savings Bank Limited, Civil Aviation Authority of Sri Lanka, Arthur C Clarke Institute for Modern Technologies and the Sri Lanka Insurance Corporation.
z Treasurer and the Committee member of the Institute of Public Finance and Development Accountancy (IPFDA).

Governance Financial Reports Supplementary Information
203Annual Report 2019 │ National Savings BankCorporate Governance
Name Tenor Qualifications Experience Previous key appointments
Mr Ajith Pathirana
Non-IndependentNon-Executive Director
12 March 2019 – 2 December 2019
z Attorney-at-Law z Possesses experience of more than 29 years in Legal Profession
z Unofficial Magistrate, a Justice of Peace, and a practitioner in Criminal Law and has appeared in many prominent cases in courts throughout the country.
z Second term of Directorship with NSB and NSB Fund Management Company Ltd.
z Secretary of the Bar Association of Sri Lanka (BASL)
z Senior Committee Member of BASL and held Chairmanship on many committees of the BASL
Dr D Shanmugasundaram
Independent Non-Executive Director
3 September 2018 – 9 April 2019
z Honorary Doctorate in Business Administration
z Extensive experience in the executive positions in public and private sector
z Member of the Board of Directors of Eswaran Brothers Exports (Pvt) Ltd, Eswaran Brothers (Ceylon) Ltd, Esika (Pvt) Ltd, Eswaran Brothers Duty Free (Pvt) Ltd.,V T V Foundation Ltd, Wow Events & Productions (Pvt) Ltd and Chairman of Eco Solar Rays (Pvt) Ltd.
z Chairman of Union Development and Investment Co. (Pvt) Ltd. and the Vice Chairman of Rajathi Group of Companies.
z Member of the Board of Directors, of Road Development Authority, Ceylon Ceramic Corporation, Lanka Walltiles PLC and Breeze Hotels Ltd.
Mr Nazri Nizar
Non-IndependentNon-Executive Director(Independent Director from 26 March 2019 to 24 October 2019)
26 March 2019 to 20 November 2019
z Bachelor of Science in Business Administration from University of Pennsylvania with a major in Economics
z Co-Founder and Managing Director of Richardson Group and Managing Director of Richardson Projects (Pvt) Limited, Richardson Outdoor (Pvt) Limited, Richardson Engineering (Pvt) Limited and Richardson Technologies (Pvt) Limited.

Governance Financial Reports Supplementary Information
204 National Savings Bank │ Annual Report 2019 Corporate Governance
Our Board in 2019
Skills and experience
BC
D
E
FG
A
A – Leadership – 31.8%
B – Economics, banking, finance – 18.2%
C – Research, planning, strategy development – 9.1%
D – Management, administration – 22.7%
E – Information technology, cybersecurity – 4.5%
F – Humanities, international relations – 4.5%
G – Law – 9.1%
Diversity of age%
2018 2019
100
80
60
40
20
0
Younger than 60 years Older than 60 years
Age diversity
Average age57 years
30 40 50 60 70
57
Board Subcommittees
The Board is empowered through its Charter to delegate its powers, discretions and authorities to any committee or committees as it thinks fit to ensure that delegation promotes independent judgement and assists with the balance of power and effective discharge of duties. The Board Committees are responsible for overseeing matters relating to their respective authorities within the remit of terms of reference. The Board however continues to retain the
responsibility for committee decisions. Four mandatory committees; Board Audit Committee (BAC), Board Human Resource and Remuneration Committee (BHRRC), Board Nomination Committee (BNC) and Board Integrated Risk Management Committee (BIRMC) were formed as required by the Banking Act Direction No. 12 of 2007 while other two committees were formed by considering the business, evolving governance requirements, risk management and industry best practices. The Board Committees report to the Board. The Board has defined the roles and responsibilities
of each committee and provided specific levels of discretion within which they can operate. The Secretary to the Board is also the Secretary to all Subcommittees. Minutes of the meetings shall be submitted to the Board for information, review, comment and required approval.
Terms of reference, composition, roles and responsibilities, attendance of members, activities carried out during the year 2019 and the focus for 2020 and beyond under each committee are given in respective committee report on page 232 to 247.
Composition and attendance of Board / Board Subcommittees
Name of the Director Director status Age Board BAC BHRRC BNC BIRMC BCC BITSC
Below 60 years
Above 60 years
Mr R M P Rathnayake, Chairman (Resigned w.e.f. 19.02.2019)
NED/NID x 2/2 NA 1/1 NA NA NA NA
Mr H N J Chandrasekera Chairman(Resigned w.e.f. 25.11.2019)
NED/NID x 15/15 NA 12/12 NA NA 7/7 3/3
Mr A K Seneviratne, Ex-officio Director(Ceased to be a Director w.e.f. 28.02.2019)
NED/NID x 2/2 2/2 NA NA NA NA NA

Governance Financial Reports Supplementary Information
205Annual Report 2019 │ National Savings BankCorporate Governance
Name of the Director Director status Age Board BAC BHRRC BNC BIRMC BCC BITSC
Below 60 years
Above 60 years
Mr U G R Ariyaratne Ex-officio Director (Appointed w.e.f. 31.08.2018)
NED/NIDID from 31 August 2018 to 24 October 2019
x 15/17 2/2 0/1 5/5 4/4 4/4 1/3
Dr D Shanmugasundaram Director(Resigned w.e.f. 09.04.2019)
NED/ID x 4/4 2/2 1/1 2/2 1/1 NA NA
Mr Anil RajakarunaDirector (Resigned w.e.f. 05.12.2019)
NED/NID x 15/15 2/2 11/12 5/5 1/1 3/3 NA
Mr Ajith PathiranaDirector(Resigned w.e.f. 02.12.2019)
NED/NID x 15/15 NA 8/12 NA NA 6/7 NA
Mr Nazri NizarDirector(Resigned w.e.f. 20.11.2019)
NED/NIDID from 26 March 2019 to 24 October 2019
x 7/12 3/4 NA 0/2 NA NA 2/3
Mr P AlgamaEx-officio Director(Resigned w.e.f. 22.01.2020)
NED/NID x 11/13 4/4 NA NA 2/4 NA NA
NED – Non-Executive Director NID – Non-Independent Director ID – Independent Director
Appointment, re-election and resignation of Directors
As a State-owned Bank, the appointment of Directors to the National Savings Bank is done as per the NSB Act No. 30 of 1971 and its amendments therein. Accordingly, of the seven Directors appointed by the Minister responsible for state banks while one shall be Secretary to the Treasury or his nominee and the other shall be the Postmaster – General or his nominee as per the NSB Act. The Central Bank of Sri Lanka approves appointments made if the required criteria for fit and propriety are met. The maximum period a Director can serve is restricted to nine years as per the provisions of the Banking Act Direction No. 12 of 2007 on Corporate Governance.
The resignations and re-election of Directors are also done as per the NSB Act No. 30 of 1971 and its amendments
therein where the Central Bank of Sri Lanka is duly informed. The details of the member of Directors and the changes that took place in the year 2019 are given on page 204.
Board induction and training
The Bank identifies the importance of well-focused induction and training to ensure new Directors are adequately briefed and have the requisite knowledge of the Bank and its operations enabling them to contribute fully to Board deliberations. This further outlines the Directors’ fiduciary and statutory duties and provides guidance on all legal and governance related obligations. The Board of Directors of the Bank are provided with training and access to Board Pack Solution and the Board Manual which includes NSB Act No. 30 of 1971 and the amendments therein, Directions issued by the Central Bank of Sri Lanka, Board Charter, Board Committee Charters, other relevant statutes,
circulars and other relevant documents on appointment. Directors receive informative updates and training throughout their tenor from the Secretary to the Board which assist in keeping directors abreast of economic, regulatory and industry trends. Directors participate the training/knowhow programmes organised by the regulator or any other authority.
Access to information
Directors have unrestricted access to all information, as well as the resources required to carry out their duties and responsibilities. Access to external specialist advice is available to directors at the Bank’s expense, in terms of the NSB Act No. 30 of 1971 and the amendments therein on independent professional advice. The Directors are provided with an electronic board paper system where the Board papers are circulated through the system allowing adequate time to Directors for the required deliberations.

Governance Financial Reports Supplementary Information
206 National Savings Bank │ Annual Report 2019 Corporate Governance
Key focus areas in 2019
The Board as the custodians of governance, sets the strategy and oversee the delivery of those strategies while establishing the culture, values and the standards of the Bank. The Board monitors financial performance and reporting and ensures that the risk is managed effectively within the risk appetite level of the Bank. It provides the business leadership across the Bank within the governance framework in the process of value creation and distribution. Below are details of the main topics discussed and decisions taken by the Board during the year 2019 and the resulting outcomes.
Board activities in 2019 Outcomes
Ethics, leadership and corporate citizenship z Disclosed related party exposures z Disclosed and proactively monitored conflict of interest z Where relevant, participated in induction, training and
development programmes
z Independent, informed and effective decision-making on material transactions
z Ethical and effective leadership that results in achievement of strategic priorities which creates a positive impact on value creation
z A responsible corporate citizen z Continuous competency development of directors
Strategy, performance and reporting z Two-day outbound workshop to review the Bank’s Strategic Business
Plan 2020–2022 by constructively challenging strategic direction z Approved Budget 2020 and Revised Budget 2020 z Approved performance measures and targets for assessing
achievement of strategic priorities z Considered and approved material acquisitions, disposals,
investments and capital expenditure z Approved review of strategic policies and newly introduced policies
to ensure effective implementation of strategy
z A well-governed Bank that is operated for the purpose and committed for value creation and delivery
z Achievement of the Bank’s mission and values through its strategies
z Stakeholder confidence that increase contribution to the value creation
Risk, oversight and compliance z Considered and approved the risk appetite framework of the Bank z Reviewed and evaluated strategic risks and associated opportunities z Considered and approved cybersecurity updates z Oversaw technology and information management z Considered liquidity, capital adequacy status and approved
dividend payments z Approved annual financial statements and interim financial
statements
z Proper governance structures and processes in place to ensure effective control is established in the Bank
z Risk and compliance management practices are inculcated in the Bank that supports achieving its strategic priorities
z Responsible and ethical usage of information and technology
z The Bank is in compliance with rules and regulations
Stakeholder relations z Identified material stakeholders and directed the formulation and
implementation of stakeholder engagement strategies z Directed the management facilitating regular and pertinent
communication with the shareholder
z Adoption of a stakeholder inclusive approach in the execution of governance roles and responsibilities
z Reasonable balance between the needs and interest and expectation of stakeholder needs and the best interest of the Bank
z Integration of environmental, social and governance policies and practices in to the Bank’s strategy in order to long term value creation
Corporate governance z Considered independent Board evaluation and Board Subcommittee
evaluation z Considered the corporate governance directions issued by the
regulatory authorities and assessed the status of compliance
z Continuous improvement in the performance and effectiveness of the Board
z Compliance with regulatory directions and guidelines

Governance Financial Reports Supplementary Information
207Annual Report 2019 │ National Savings BankCorporate Governance
Management committees
In addition to the Board Committees, the Bank has constituted Management Committees. These have been established under a Board approved terms of reference. The General Manager/CEO acts as the Chairman of all Management Committees according to the terms of reference of those committees. The Committees deliberate on matters which are critical to the operations of the Bank as described in the table below:
Management committee Objective and responsibilities Composition
Corporate Management Committee (CMC)
Oversee on matters relating to policy and strategy formulation, implementation of the policies and strategies at the operational level.
All Officers serving the Bank in the capacity of Deputy General Manager and above.
Asset and Liability Management Committee (ALCO)
Maintaining the market and liquidity risk within the predetermined risk appetite level in order to optimise the return
General Manager/CEO, Senior DGMs, KMPs from the Divisions of Finance and Planning, Research and Development, International, Operations, Credit, Treasury and Risk Management.
Investment Committee (IC) Periodic review of Investment Policy of the Bank and oversee on the investment activities of the Bank within overall risk appetite level of the Bank.
General Manager/CEO, Senior DGMs, KMPs from the Divisions of Finance & Planning, Research & Development, International, Credit, Treasury, Legal and Risk Management.
Credit Committee (CC) Periodic review of the Credit Policies of the Bank, implementation of the policies and engage in maintaining a healthy credit portfolio to optimise the returns within the risk appetite of the Bank.
General Manager/CEO, Senior DGMs, KMPs from the Divisions and Finance and Planning, Research and Development, Operations, Credit, Treasury, Legal and Risk Management.
Performance Review Committee (PRC)
Review of financial performance, progress of ongoing activities, withdrawal activities and any other support functions of the Bank that facilitates the performance.
General Manager/CEO, Senior DGMs, all DGMs, all Consultant and Heads of Divisions, all AGMs, Compliance Officer and any other Members appointed by the Committee.
Branch Operations Steering Committee (BOSC)
Oversee the reinforcement of the branch operations within the delegated financial authority.
General Manager/CEO, Senior DGMs, KMPs from the Divisions of Finance and Planning, Research and Development, Legal and Premises.
Information Technology Steering Committee
Ensuring the IT strategies are aligned with the business strategy of the Bank.
General Manager/CEO, Senior DGMs, KMPs from the Divisions of Finance and Planning, Research and Development, International, Operations, Credit, Treasury, Legal, Human Resource Development, Marketing, Information Technology, Compliance and Risk Management.
Operational Risk Management Committee (ORMC)
Manage operational risk of the Bank while overseeing the implementation of the operational risk management techniques and maintain the integrity of internal controls through taking relevant measures.
General Manager/CEO, Senior DGMs, KMPs from the Divisions of Research and Development, Operations, Human Resource Development, Information Technology, Support Services, Premises, Legal, Risk Management, Compliance and Information Security.

Governance Financial Reports Supplementary Information
208 National Savings Bank │ Annual Report 2019 Corporate Governance
Management committee Objective and responsibilities Composition
Product Development Committee (PDC)
Oversee on long-term value creation through innovative products development to face the increasing competition.
General Manager/CEO, Senior DGMs, KMPs from the Divisions of Research and Development, Operations, International, Information Technology, Marketing and Planning.
Human Resource Committee (HRC)
Development of human resources in line with the Bank’s strategic objectives.
General Manager/CEO, Senior DGMs, KMPs from the Divisions of Finance and Planning, Human Resource Development, Credit and Legal.
Marketing Committee Provide with marketing advice, expertise and assistance to the Board and the Corporate Management, review and direct all aspects of marketing activities of the Bank
General Manager/CEO, Senior DGMs, KMPs from the Divisions of Finance and Planning, Operations and Marketing.
Corporate Social Responsibility and Sustainability Committee
Support value creation for key stakeholders by integrating ethical, social and environmental responsibility into daily business activities as defined by the corporate objectives that is linked to sustainability performance and development.
General Manager/CEO, Senior DGMs, all DGMs, all Consultants, Heads of Divisions, and all AGMs.
Corporate Procurement Committee (Minor)
Smooth functioning of the procurement process of the Bank
General Manager/CEO, KMPs from Finance and Planning, Operations, Representative from Ministry of Finance
Corporate Procurement Committee (Major)
Smooth functioning of the procurement process of the Bank
General Manager/CEO, KMPs from Finance and Planning, Operations, Representative from Ministry of Finance
Executive Procurement Committee (EPC)
Smooth functioning of the procurement process of the Bank
Senior DGMs, DGM (Credit), Chief Manager (Finance)

Governance Financial Reports Supplementary Information
209Annual Report 2019 │ National Savings BankCorporate Governance
Board’s role in risk management
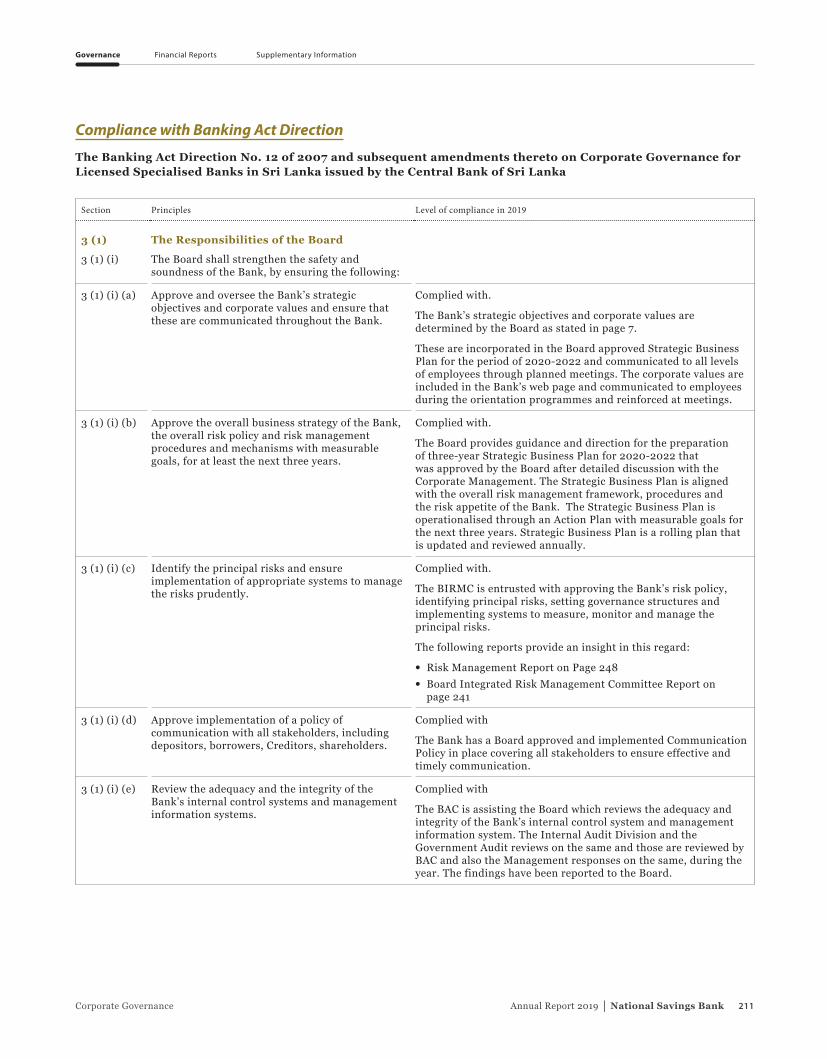
The Board identifies aligning risk management as an integral part of the business strategy of the Bank. Prudent oversight on risk management is deeply rooted within the Board and it has established and delegated its responsibility to the BIRMC in discharging its duties in relation to the risk management function of the Bank. Accordingly, the Bank has formulated a strong risk management framework, risk appetite limits and tolerance limits and mechanism to monitor the risk profile of the Bank. The Board monitors the risk profile of the Bank based on the reports submitted through BIRMC on a regular basis. Clarifications were sought from the Management for any deviations from the agreed risk appetite levels and required guidance was given to take mitigation actions. The risks involved in the business was considered and deeply discussed and reviewed during the deliberation on Strategic Business Plan that ensured the risk relating to long-term strategic planning process was well addressed.
Roles of Chairman and CEO
In line with the NSB Act of 1971 and the amendments therein, directives of CBSL and industry best practices, the Bank ensures that the appointment and delegation to management contribute to role clarity and effective exercise of authority and responsibility. The roles of Chairman and the General Manager/CEO are separate, with their individual responsibilities clearly defined. The separation of responsibilities is designed to ensure that no single person has unfettered decision-making powers and that appropriate balances of power and authority exist. The Chairman is a Non-Independent Non-Executive Director while the General Manager is a Key Management Personnel appointed by the Board who will be the Chief Executive Officer and not a Board member. The Board Charter clearly defines the roles and responsibilities of the Chairman and General Manager/CEO.
Chairman is responsible for leading the Board, facilitating effective functioning of the Board, preserving order, ensuring the Board’s effectiveness and highest standards of corporate governance within the Bank. Also sets the agenda in consultation with the General Manager/CEO and the Board Secretary. Chairman ensures that the Board receives adequate information to make informed decisions in discharging the Board’s duties, effective participation of members at the Board meetings, maintains effective communication with shareholder as well as open lines of communication with Key Management Personnel.
The General Manager/CEO is responsible for designing, developing and the execution of the Bank’s strategy and day-to-day management of the business within the approved risk appetite levels as entrusted by the Board of Directors. The General Manager/CEO provides the leadership to the Corporate Management Team and delegates aspects of his/her own authority, as permitted in the corporate governance framework, to members of the Corporate Management. Also chairs the Management Committees and ensures that the Board receives accurate, timely and clear information about the Bank’s performance. The General Manager/CEO also ensures that good corporate governance and highest standards are applied and maintained when carrying out the affairs of the Bank.
Role of Board secretary
The Secretary to the Board has a key role to play in ensuring that Board procedures are both followed and regularly reviewed to ensure good corporate governance within the Bank. The responsibilities of the Secretary to the Board is summarised below:
z Maintaining minutes of all meetings of the Board and its subcommittees.
z Ensure regulatory and statutory compliance by the Board of Directors.
z Ensure effective functioning of the Board.
z Provide professional advice to the Directors on relevant laws and regulations and also to ensure compliance with principles of corporate governance and other related regulatory framework.
z Ensure that the Board is well informed of the decisions made at the Board Subcommittees and their outcomes.
The appointment and the removal of the Secretary to the Board is a matter involving the whole Board under the advice of BNC as it is a Key Management Personnel position.
Directors’ remuneration and level and make up of remuneration
As per the NSB Act No. 30 of 1971 and the amendments therein, the remuneration of the Directors is determined by the relevant Minister. No Director is involved in determining his/her own remuneration. The Board Human Resource and Remuneration Committee (BHRRC) makes recommendations to the Board regarding the remuneration of the General Manager/CEO and the Key Management Personnel on the basis of salaries determined by the Collective Agreement, which is reviewed once in three years. The Bank has put in place a Board approved Remuneration Policy for Key Management Personnel. Based on the recommendations by the Committee, the Board makes recommendations to the respective Minister responsible for state banks who grants final approval in accordance with the provisions of NSB Act and amendments therein. The Board Human Resource Remuneration Committee comprise of three Non-Executive Directors.

Governance Financial Reports Supplementary Information
210 National Savings Bank │ Annual Report 2019 Corporate Governance
Board and Board Subcommittee evaluation
The Board and the Board Subcommittees annually conduct their own appraisal to ensure that the Board is discharging their duties according to the Board Charter which includes the responsibilities outlined in the Banking Act Direction No. 12 of 2007 and other applicable rules and regulations as well as best practices on corporate governance. In the process of evaluation, each Director fills a Board Performance Evaluation Form which is submitted to the Nomination Committee by the Secretary to the Board.
Since there were changes to the Board in November 2019 where the Directors appointed by the relevant Minister resigned prior to end December 2019, the annual evaluations for the year ended 2019 was not conducted. The Bank will continue to carryout these evaluations according to the Directions of the Central Bank of Sri Lanka and the industry best practices in the future.
Appraisal of CEO
The Board assess the performance of the General Manager/CEO with the assistance of the BHRRC on an annual basis based on the criteria according to financial and non-financial targets of the Strategic Business Plan agreed with the General Manager/CEO at the beginning of the year. Changes in the operating environment are given the due consideration when making the appraisal. The Chairman discusses with the General Manager/CEO and gives formal and informal feedback. The feedback to the appraisal by the General Manager/CEO is given due consideration prior to the approval.
Governance Financial Reports Supplementary Information
211Annual Report 2019 │ National Savings BankCorporate Governance
Compliance with Banking Act Direction
The Banking Act Direction No. 12 of 2007 and subsequent amendments thereto on Corporate Governance for Licensed Specialised Banks in Sri Lanka issued by the Central Bank of Sri Lanka
Section Principles Level of compliance in 2019
3 (1) The Responsibilities of the Board
3 (1) (i) The Board shall strengthen the safety and soundness of the Bank, by ensuring the following:
3 (1) (i) (a) Approve and oversee the Bank’s strategic objectives and corporate values and ensure that these are communicated throughout the Bank.
Complied with.
The Bank’s strategic objectives and corporate values are determined by the Board as stated in page 7.
These are incorporated in the Board approved Strategic Business Plan for the period of 2020-2022 and communicated to all levels of employees through planned meetings. The corporate values are included in the Bank’s web page and communicated to employees during the orientation programmes and reinforced at meetings.
3 (1) (i) (b) Approve the overall business strategy of the Bank, the overall risk policy and risk management procedures and mechanisms with measurable goals, for at least the next three years.
Complied with.
The Board provides guidance and direction for the preparation of three-year Strategic Business Plan for 2020-2022 that was approved by the Board after detailed discussion with the Corporate Management. The Strategic Business Plan is aligned with the overall risk management framework, procedures and the risk appetite of the Bank. The Strategic Business Plan is operationalised through an Action Plan with measurable goals for the next three years. Strategic Business Plan is a rolling plan that is updated and reviewed annually.
3 (1) (i) (c) Identify the principal risks and ensure implementation of appropriate systems to manage the risks prudently.
Complied with.
The BIRMC is entrusted with approving the Bank’s risk policy, identifying principal risks, setting governance structures and implementing systems to measure, monitor and manage the principal risks.
The following reports provide an insight in this regard:
z Risk Management Report on Page 248 z Board Integrated Risk Management Committee Report on
page 241
3 (1) (i) (d) Approve implementation of a policy of communication with all stakeholders, including depositors, borrowers, Creditors, shareholders.
Complied with
The Bank has a Board approved and implemented Communication Policy in place covering all stakeholders to ensure effective and timely communication.
3 (1) (i) (e) Review the adequacy and the integrity of the Bank’s internal control systems and management information systems.
Complied with
The BAC is assisting the Board which reviews the adequacy and integrity of the Bank’s internal control system and management information system. The Internal Audit Division and the Government Audit reviews on the same and those are reviewed by BAC and also the Management responses on the same, during the year. The findings have been reported to the Board.

Governance Financial Reports Supplementary Information
212 National Savings Bank │ Annual Report 2019 Corporate Governance
Section Principles Level of compliance in 2019
3 (1) (i) (f) Identify and designate Key Management Personnel, as defined in the International Accounting Standards.
Complied with
Key Management Personnel (KMP) are defined in the International Accounting Standards, who are in a position to significantly influence policy, direct activities and exercise control over business activities, operations and risk management. Appointment of all designated KMPs are recommended by the BNC and approved by the Board.
The Bank has identified KMPs as per the CBSL Direction on Corporate Governance
3 (1) (i) (g) Define the areas of authority and key responsibilities for Directors themselves and for Key Management Personnel (KMP).
Complied with
Areas of authority of the Board of Directors are governed by Section 7 of NSB Act. The Board Charter prepared in accordance with the NSB Act details the areas of authority and key responsibilities of the Board of Directors. BHRRC discuss the areas of authority and key responsibility for KMPs and recommend to appoint.
3 (1) (i) (h) Ensure that there is appropriate oversight of the affairs of the Bank by Key Management Personnel (KMP) that is consistent with Board policy.
Complied with
The Board reviews the performance of the Bank against the Strategic Business Plan and receives reports from Board Subcommittees on financial reporting, internal control, risk management and other relevant matters delegated to those committees. Further, KMPs make regular presentation on the matters under their purview and are called by the Board to explain the matters under their purview.
3 (1) (i) (i) Periodically assess the effectiveness of the Board of Directors’ own governance practices, including: the selection, nomination and election of Directors and Key Management Personnel; the management of conflicts of interests; and the determination of weaknesses and implementation of changes, where necessary.
Generally, a self-evaluation of the performance of the Board is carried out annually assessing its own governance practices. However, subsequent to the political changes that took place in the country, the Board did not complete the full term of the year to carry out the self evaluation. Related Party Transaction Policy is in place to manage the conflict of interest. Quarterly declarations of the Board of Directors in respect of related parties and their interests are obtained from Directors to monitor conflict, if any.
3 (1) (i) (j) Ensure that the Bank has an appropriate succession plan for Key Management Personnel.
A Board approved Succession Plan for the KMPs is in place to ensure readiness and reviewed by the BNC in 2019.
3 (1) (i) (k) Meet regularly, on a need basis, with the Key Management Personnel to review policies, establish communication lines and monitor progress towards corporate objectives.
Complied with
KMPs are regularly involved in discussions at the meeting of Board and its Subcommittees on progress towards performance, strategy, policy and other matters pertaining to their area of responsibility. Additionally, the KMPs make presentations on key items in the agenda under their purview and are called by the Board and its Subcommittees’ relation to the material matters in there are with regard to policies towards corporate objectives.
3 (1) (i) (l) Understand the regulatory environment and ensure that the Bank maintains an effective relationship with regulators.
Complied with
The Directors are furnished with all the applicable regulatory requirements on appointment. The KMPs brief on the regulatory developments to the Board of Directors enabling them to effectively discharge their duties. Additionally, Compliance Officer brief the members of BIRMC on regulatory developments.
Additionally, the Compliance Officer informs the Board about all returns submitted to the regulator monthly by monthly Compliance reports which are monitored by the Board.

Governance Financial Reports Supplementary Information
213Annual Report 2019 │ National Savings BankCorporate Governance
Section Principles Level of compliance in 2019
3 (1) (i) (m) Exercise due diligence in the hiring and oversight of External Auditors.
Complied with.
The Auditor General is the External Auditor of the Bank in terms of the provisions of Article 154 of the Constitution of the Democratic Socialist Republic of Sri Lanka and section 37 in NSB Act.
3 (1) (ii) The Board shall appoint the Chairman and the Chief Executive Officer and define and approve the functions and responsibilities of the Chairman and the Chief Executive Officer in line with Direction 3 (5) of these Directions.
Under the provisions of Section 11(1) of the NSB Act No. 30 of 1971 as amended by Act No. 28 of 1995 the Chairman is appointed by the Minister. Section 26 (1) of the NSB Act states that the Board shall appoint a fit and proper person to be the General Manager of the Bank who shall be the Chief Executive Officer of the Bank. Chairman and CEO’s functions and responsibilities have been defined and approved by the Board. The responsibilities of Chairman and the CEO are defined in line with the Section 3 (5) of this Direction which is given on page 209 which are included in the Board Charter.
3 (1) (iii) The Board shall meet regularly, and Board meetings shall be held at least twelve times a year at approximately monthly intervals. Such regular Board meetings shall normally involve active participation in person of a majority of Directors entitled to be present. Obtaining the Board’s consent through the circulation of written resolutions/papers shall be avoided as far as possible.
Complied with
Regular Board meetings are held each month with the active participation of Directors and the attendance at Board meetings is given on page 204 along with the number of meetings. The Bank has taken every measure to minimise obtaining the approval through circulation where it is done on an urgency or needy basis and such resolutions are ratified by the Board at the next Board meeting.
3 (1) (iv) The Board shall ensure that arrangements are in place to enable all Directors to include matters and proposals in the agenda for regular Board meetings where such matters and proposals relate to the promotion of business and the management of risks of the Bank.
Complied with
Notice of meeting is circulated one week prior to the meeting and Directors may submit proposals for inclusion in the agenda on discussion with the Chairman on matters relating to the business of the Bank.
3 (1) (v) The Board procedures shall ensure that notice of at least 7 days is given of a regular Board meeting to provide all Directors an opportunity to attend. For all other Board meetings, reasonable notice may be given.
Complied with
Notice of meetings along with the agenda and the Board Papers to be discussed are circulated seven days prior to the meeting to provide the Directors with additional time to attend on the matters and submit any urgent proposals.
3 (1) (vi) The Board procedures shall ensure that a Director, who has not attended at least two-thirds of the meetings in the period of 12 months immediately preceding or has not attended the immediately preceding three consecutive meetings held, shall cease to be a Director.
Complied with
The Directors are apprised of their attendance in accordance with the Banking Act Direction No. 12 of 2007. Details of Directors’ attendance are given on page 204.
3 (1) (vii) The Board shall appoint a Company Secretary who satisfies the provisions of Section 43 of the Banking Act No. 30 of 1988.
Complied with
The Secretary to the Board of National Savings Bank is an Attorney-at-Law that complies with the provisions of Section 43 of the Banking Act No. 30 of 1988. The Board Secretary is primarily responsible for handling secretariat work to the Board and the other functions specified in the statutes and other regulations.
3 (1) (viii) All Directors shall have access to advice and services of the Company Secretary with a view to ensuring that Board procedures and all applicable rules and regulations are followed.
Complied with
All the Directors have the full access, to obtain advices and services of the Secretary to ensure that the Board procedures are followed with and the applicable rules and regulations are complied with.

Governance Financial Reports Supplementary Information
214 National Savings Bank │ Annual Report 2019 Corporate Governance
Section Principles Level of compliance in 2019
3 (1) (ix) The Company Secretary shall maintain the minutes of Board meetings and such minutes shall be open for inspection at any reasonable time, on reasonable notice by any Director.
Complied with
The Secretary to the National Savings Bank maintains the minutes of the Board meetings and circulates same to all Board members, After approval of the draft minutes by the Chairman/Chairperson. The minutes are reviewed and approved by the Board members at the next Board meeting.
3 (1) (x) Minutes of Board meetings shall be recorded in sufficient detail so that it is possible to gather from the minutes, as to whether the Board acted with due care and prudence in performing its duties.
The minutes shall also serve as a reference for regulatory and supervisory authorities to assess the depth of deliberations at the Board meetings. Therefore, the minutes of a board meeting shall clearly contain or refer to the following:
(a) a summary of data and information used by the Board in its deliberations;
(b) the matters considered by the Board; (c) the fact-finding discussions and the issues of
contention or dissent which may illustrate whether the Board was carrying out its duties with due care and prudence;
(d) the testimonies and confirmations of relevant executives which indicate compliance with the Board’s strategies and policies and adherence to relevant laws and regulations;
(e) the Board’s knowledge and understanding of the risks to which the Bank is exposed and an overview of the risk management measures adopted; and
(f) the decisions and Board resolutions.
Complied with
Minutes of the meetings are kept covering the given criteria.
3 (1) (xi) There shall be a procedure agreed by the Board to enable Directors, upon reasonable request, to seek independent professional advice in appropriate circumstances, at the Bank’s expense.
The Board shall resolve to provide separate independent professional advice to Directors to assist the relevant Director or Directors to discharge his/her/ their duties to the Bank.
Complied with
Section 27 of the National Savings Bank Act states that the Board can obtain independent professional advice as and when required in discharging its duties. The Board Charter also details that the Directors upon reasonable request can seek independent professional advice in appropriate circumstances, at the Bank’s expense.
3 (1) (xii) Directors shall avoid conflicts of interests, or the appearance of conflicts of interest, in their activities with, and commitments to, other organisations or related parties.
Complied with
The Directors make declarations of their interest at appointment and when there is a change. Related Party Disclosure Policy is in place that details on the Conflict of interest and the matters and actions to be taken on such situations. Directors withdraw from the meeting, abstain from participating in discussions, voicing their opinion or approving in situations where there is a conflict of interest.
3 (1) (xiii) The Board shall have a formal schedule of matters specifically reserved to it for decision to ensure that the direction and control of the Bank is firmly under its authority.
Complied with
The Board Charter details the powers reserved for the Board in discharging duties. Additionally, the Board has put in place systems and controls to facilitate discharging its duties.

Governance Financial Reports Supplementary Information
215Annual Report 2019 │ National Savings BankCorporate Governance
Section Principles Level of compliance in 2019
3 (1) (xiv) The Board shall, if it considers that the Bank is, or is likely to be, unable to meet its obligations or is about to become insolvent or is about to suspend payments due to depositors and other creditors, forthwith inform the Director of Bank Supervision of CBSL of the situation of the Bank prior to taking any decision or action.
Complied with
The Bank is solvent, and no such situation has arisen during the year to challenge its solvency.
3 (1) (xv) The Board shall ensure that the Bank is capitalised at levels as required by the Monetary Board in terms of the capital adequacy ratio and other prudential grounds.
Complied with
The Board monitors capital adequacy and other prudential measures to ensure compliance with regulatory requirements, and the Bank’s defined risk appetite. The Bank complies with the minimum capital adequacy requirements.
3 (1) (xvi) The Board shall publish in the Bank’s Annual Report, an annual corporate governance report setting out the compliance with Direction 3 of these Directions.
Complied with
This report forms part of the Corporate Governance Report of the Bank which is given on page 196.
3 (1) (xvii) The Board shall adopt a scheme of self-assessment to be undertaken by each Director annually and maintain records of such assessments.
Complied with
The Bank has adopted a scheme of self-assessment to be undertaken by every Director, annually which is maintained by the Secretary to the Board.
3 (2) Board’s Composition
3 (2) (i) The number of Directors on the Board shall not be less than 7 and not more than 13.
Complied with
As per Section 8 (1) of NSB Act the Board comprises seven Directors including the Chairman.
3 (2) (ii) (a) The total period of service of a Director other than a Director who holds the position of Chief Executive Officer shall not exceed nine years.
Complied with
The present Board of the Bank have been in the office for a period less than nine years. Details of their tenor are given on pages 176 to 179. The tenors of the Board existed during the year 2019 are given on pages 201 to 203.
3 (2) (ii) (b) A Director who has completed nine years as at 1 January 2008, or who completes such term at any time prior to 31 December 2008, may continue for a further maximum period of three years commencing 1 January 2009.
Complied with
3 (2) (iii) An employee of a bank may be appointed, elected or nominated as a director of the Bank (hereinafter referred to as an “Executive Director”) provided that the number of Executive Directors shall not exceed one third of the number of directors of the Board. In such an event, one of the Executive Directors shall be the Chief Executive Officer of the Bank.
Not Applicable
National Savings Bank Act No. 70 of 1971 and the amendments therein does not have provisions for an Executive Director in National Savings Bank.
3 (2) (iv) The Board shall have at least three Independent Non-Executive Directors or one third of the total number of Directors, whichever is higher.
The category of Directorship is given on pages 204 to 205.
3 (2) (v) In the event an alternate Director is appointed to represent an Independent Director, the person so appointed shall also meet the criteria that apply to the Independent Director.
Not Applicable
No alternate Director has been appointed to represent any Independent Director.

Governance Financial Reports Supplementary Information
216 National Savings Bank │ Annual Report 2019 Corporate Governance
Section Principles Level of compliance in 2019
3 (2) (vi) Non-Executive Directors shall be persons with credible track records and/or have necessary skills and experience to bring an independent judgement to bear on issues of strategy, performance and resources.
Complied with
The Directors’ profiles including the necessary information are mentioned on pages 201 to 203.
3 (2) (vii) A meeting of the Board shall not be duly constituted, although the number of Directors required to constitute the quorum at such meeting is present, unless more than one-half of the number of Directors present at such meeting are Non-Executive Directors.
Complied with
As per the National Savings Bank Act the quorum of the Board is four which is more than one-half of the Directors and all seven of the Directors are Non-Executive Directors.
3 (2) (viii) The Independent Non-Executive Directors shall be expressly identified as such in all corporate communications that disclose the names of Directors of the Bank.
Complied with
The independent NEDs are expressly identified as such in all corporate communications that disclose the names of the Directors of the Bank. The composition of the Board by category of the Directors, including the names of the Chairman, Non-Executive Directors, Independent and Non-Independent Directors are given on page 204.
3 (2) (ix) There shall be a formal, considered and transparent procedure for the appointment of new Directors to the Board. There shall also be procedures in place for the orderly succession of appointments to the Board.
Complied with
Appointments of Directors are carried as per the NSB Act under Section 8 (1) (a). Accordingly, five Directors are appointed by the Minister under whose purview the Bank comes in. One Director shall be the Secretary to the Treasury, or his nominee and the other Directors shall be the Postmaster General or his nominee.
3 (2) (x) All Directors appointed to fill a casual vacancy shall be subject to election by shareholders at the first general meeting after their appointment.
Not Applicable
This does not arise since the Directors are appointed by the subject Minister.
3 (2) (xi) If a director resigns or is removed from office, the Board shall: (a) announce the Director’s resignation or
removal and the reasons for such removal or resignation including but not limited to information relating to the relevant Director’s disagreement with the bank, if any and
Complied with
The Government of Sri Lanka, the sole shareholder of the Bank makes the appointments as well as removal of Directors through the Minister under whose purview the Bank falls in. Any resignation is also referred to the same Minister. The Central Bank of Sri Lanka are kept informed of the resignations.
(b) Issue a statement confirming whether or not there are any matters that need to be brought to the attention of shareholders.
The shareholder of the Bank is the Government of Sri Lanka and the changes to five members of the Board of Directors except the Ex-Officio Directors is carried out by the Government through the subject Minister.
3 (2) (xii) A Director or an employee of a bank shall not be appointed, elected or nominated as a Director of another bank except where such bank is a subsidiary company or an associate company of the first mentioned bank.
Neither Directors nor employees of the National Savings Bank are appointed as Directors of another Bank, except for the appointment of Senior Deputy General Manager Mr K B Wijeyaratne to the Regional Development Bank (RDB) as per the requirement of the constitution of RDB, Pradeshiya Sanwardana Bank Act No. 41 of 2008.
3 (3) Criteria to assess the fitness and propriety of Directors
3 (3) (i) (a), & (b)
The age of a person who serves as a Director shall not exceed 70 years.
Complied with
There are no Directors who are over 70 years of age.
3 (3) (ii) A person shall not hold office as a Director of more than 20 companies/entities/institutions inclusive of subsidiaries or associate companies of the Bank.
Complied with
No Director holds directorships of more than 20 companies/entities/institutions inclusive of Subsidiaries or associate companies of the Bank.

Governance Financial Reports Supplementary Information
217Annual Report 2019 │ National Savings BankCorporate Governance
Section Principles Level of compliance in 2019
3 (4) Management functions delegated by the Board
3 (4) (i) The Directors shall carefully study and clearly understand the delegation arrangements in place.
Complied with
Delegation of authority is in place. The Board reviews and approves the delegation arrangements and ensures that the extent of delegation addresses the needs of the Bank while enabling the Board to discharge its functions effectively without any hindrances.
3 (4) (ii) The Board shall not delegate any matters to a Board Committee, Chief Executive Officer, Executive Directors or Key Management Personnel, to an extent that such delegation would significantly hinder or reduce the ability of the Board as a whole to discharge its functions.
3 (4) (iii) The Board shall review the delegation processes in place on a periodic basis to ensure that they remain relevant to the needs of the Bank.
3 (5) The Chairman and Chief Executive Officer
3 (5) (i) The roles of Chairman and Chief Executive Officer shall be separated and shall not be performed by the Same individual.
Complied with
There is a clear separation of duties between the roles of the Chairman and the General Manager/CEO. A Board Charter is in place defining the responsibilities of the Chairman and the General Manager/CEO.
3 (5) (ii) The Chairman shall be a Non-Executive Director and preferably an Independent Director as well.
In the case where the Chairman is not an Independent Director, the Board shall designate an Independent Director as the Senior Director with suitably documented terms of reference.
The designation of the Senior Director shall be disclosed in the Bank’s Annual Report.
Chairman of the Bank is a Non-Independent Non-Executive Director. However, the Bank has not appointed a Senior Director although Chairman is not an Independent Director.
3 (5) (iii) The Board shall disclose in its corporate governance report, the identity of the Chairman and the Chief Executive Officer and the nature of any relationship.
Complied with
The identity of the Chairman and the General Manager/CEO are disclosed in Annual Report on pages 176 and 179.
The Board is cognisant that there are no relationships of any kind of financial, business, family, any other material/relevant relationship between the Chairman and the General Manager/CEO. Also, there are no relationships among the other Board members.
3 (5) (iv) The Chairman shall: provide leadership to the Board; ensure that the Board works effectively and discharges its responsibilities; and ensure that all key and appropriate issues are discussed by the Board in a timely manner.
Complied with
The Chairman provides leadership to the Board and ensures that the Board functions effectively in discharging its responsibilities. The Board in a timely manner discusses all key issues.
3 (5) (v) The Chairman shall be primarily responsible for drawing up and approving the agenda for each Board meeting.
Complied with
The Secretary to the Board draws up the agenda for the meetings in consultation with the Chairman.

Governance Financial Reports Supplementary Information
218 National Savings Bank │ Annual Report 2019 Corporate Governance
Section Principles Level of compliance in 2019
3 (5) (vi) The Chairman shall ensure that all Directors are properly briefed on issues arising at Board meetings and also ensure that Directors receive adequate information in a timely manner.
Complied with
The Chairman ensures that the Board is sufficiently briefed and informed regarding the matters arising at the Board meetings. The following procedures are in place to ensure that:
z Circulation of Board papers including the minutes of the previous meeting seven days prior to the Board meeting giving them sufficient time to review and call for additional information and clarification and after the meeting to follow up on issues consequent to the meeting
z Clarification of matters by KMPs when required
3 (5) (vii) The Chairman shall encourage all Directors to make a full and active contribution to the Board’s affairs and take the lead to ensure that the Board acts in the best interests of the Bank.
Complied with
The list of functions and responsibilities of the Chairman is included in the Board charter.
3 (5) (viii) The Chairman shall facilitate the effective contribution of Non-Executive Directors in particular and ensure constructive relations between Executive and Non-Executive Directors.
Complied with
The entire Board consists of Non-Executive Directors
3 (5) (ix) The Chairman shall not engage in activities involving direct supervision of Key Management Personnel or any other executive duties whatsoever.
Complied with
Chairman is a Non-Independent Non-Executive Director and he is not involved directly in executive functions to supervise KMPs or any other executive duties whatsoever.
3 (5) (x) The Chairman shall ensure that appropriate steps are taken to maintain effective communication with shareholders and that the views of shareholders are communicated to the Board.
Complied with
The Bank keeps effective communication with the shareholder; Government of Sri Lanka. The Ex-Officio Director appointed as per the National Savings Bank Act acts as the channel of communication between the Board and the shareholder.
3 (5) (xi) The Chief Executive Officer shall function as the apex executive-in-charge of the day-to-day management of the Bank’s operations and business.
Complied with
The day-to-day operations of the Bank have been delegated to the General Manager/CEO. The Board Charter specifically details such authorities of the General Manager/CEO.
3 (6) Board Appointed Committees
3 (6) (i) Each bank shall have at least four board committees as set out in Directions 3 (6) (ii), 3 (6) (iii), 3 (6) (iv) and 3 (6) (v) of these Directions. Each committee shall report directly to the Board. All committees shall appoint a secretary. The board shall present a report of the performance on each committee, on their duties and roles at the annual general meeting.
Complied with
The Board has established six committees with written Terms of Reference. Board Secretary acts as Secretary to all six committees. Board Audit Committee, Board Integrated Risk Management Committee, Board Human Resources and Remuneration Committee, Board Nominations Committee, Board Credit Committee and Board Information Technology Strategy Committee directly submit reports through the Chairmen of the respective Board committees to the Board.
3 (6) (ii) The following rules shall apply in relation to the Audit Committee:
3 (6) (ii) (a)
The Chairman of the Committee shall be an Independent Non-Executive Director who possesses qualifications and experience in accountancy and/or audit.
The Chairman of the Board Audit Committee is Non-Executive and Non-Independent.
All the members of the Board appointed as per the NSB Act

Governance Financial Reports Supplementary Information
219Annual Report 2019 │ National Savings BankCorporate Governance
Section Principles Level of compliance in 2019
3 (6) (ii) (b) All members of the Committee shall be Non-Executive Directors.
Complied with
All the Directors of the Bank are Non-Executive Directors, hence all members in the committee are Non-Executive Directors.
3 (6) (ii) (c) The Committee shall make recommendations on matters in connection with:
(i) the appointment of the External Auditor for audit services to be provided in compliance with the relevant statutes;
(ii) the implementation of the Central Bank guidelines issued to Auditors from time to time;
(iii) the application of the relevant accounting standards; and
(iv) the service period, audit fee and any resignation or dismissal of the Auditor; provided that the engagement of the Audit partner shall not exceed five years, and that the particular Audit partner is not re-engaged for the audit before the expiry of three years from the date of the completion of the previous term.
The Auditor General is the External Auditor of the Bank as per the statutes. Hence, the committee has no role to play in the engagement of the External Auditor.
3 (6) (ii) (d) The Committee shall review and monitor the External Auditor’s independence and objectivity and the effectiveness of the audit processes in accordance with applicable standards and best practices.
Complied with
Since the Auditor General is the External Auditor the independence and objectivity are maintained and guaranteed by the constitution of Sri Lanka. Effectiveness of the audit process is discussed with the Superintendent of the Government Audit at Board Audit Committee meetings.
3 (6) (ii) (e) The Committee shall develop and implement a policy on the engagement of an External Auditor to provide non-audit services.
Not Applicable since the Auditor General is the External Auditor of the Bank.
3 (6) (ii) (f) The Committee shall, before the audit commences, discuss and finalise with the External Auditors the nature and scope of the audit.
Not Applicable
The scope and the extent of audit have been determined by the Auditor General as the External Auditor.
3 (6) (ii) (g) The Committee shall review the financial information of the Bank, in order to monitor the integrity of the Financial Statements of the Bank, its Annual Report, accounts and quarterly reports prepared for disclosure, and the significant financial reporting judgments contained therein. In reviewing the bank’s annual report and accounts and quarterly reports before submission to the board, the committee shall focus particularly on: (i) major judgemental areas; (ii) any changes in accounting policies and practices; (iii) significant adjustments arising from the audit; (iv) the going concern assumption; and (v) the compliance with relevant accounting standards and other legal requirements.
Complied with
The Board Audit Committee has reviewed the quarterly Financial Statements and Annual Report of the Bank prepared for the disclosure purposes as and when ready for the publication. The Internal Audit Division submits a separate review report on the Financial Statements on each instance including the deviation in major judgemental areas, change in accounting policies etc., in the review report to the attention of Board Audit Committee. The BAC makes recommendation to the Board on the above based on the requirement to do so.
3 (6) (ii) (h) The Committee shall discuss issues, problems and reservations arising from the interim and final audits, and any matters the Auditor may wish to discuss including those matters.
Complied with
The BAC discusses issues, problems and reservations arising from the interim and final audits. The representative of the Auditor General was present at the committee meetings throughout.

Governance Financial Reports Supplementary Information
220 National Savings Bank │ Annual Report 2019 Corporate Governance
Section Principles Level of compliance in 2019
3 (6) (ii) (i) The Committee shall review the External Auditor’s management letter and the management’s response thereto.
Complied with
The Board Audit Committee reviews the External Auditor’s Report issued under the Sections 14 (2) (c) and 13 (7) (a) of the Finance Act annually and the management response thereon.
3 (6) (ii) (j) The Committee shall take the following steps with regard to the internal audit function of the Bank:
i Review the adequacy of the scope, functions and resources of the internal audit department, and satisfy itself that the department has the necessary authority to carry out its work;
Complied with
The Annual Audit Plan for the year 2019 prepared by the Internal Audit Division was submitted to the BAC was approved which includes the scope, functions and resource requirements relating to the plan.
ii Review the internal audit program and results of the internal audit process and, where necessary, ensure that appropriate actions are taken on the recommendations of the internal audit department;
Complied with
The Committee reviews the internal audit plan and the results of the internal audit procedures and ensures that appropriate actions are taken for improvements.
iii Review any appraisal or assessment of the performance of the Head and senior staff members of the internal audit department;
Complied with
iv Recommend any appointment or termination of the Head, senior staff members and outsourced service providers to the internal audit function;
Complied with
No such situation has arisen during the year.
v. Ensure that the committee is appraised of resignations of senior staff members of the Internal Audit Department; including the chief Internal Auditor and any outsourced service providers, and to provide an opportunity to the resigning senior staff members and outsourced service providers to submit reasons for resigning;
Complied with
No such situation has arisen during the year.
vi. Ensure that the Internal Audit function is independent of the activities it audits and that it is performed with impartiality, proficiency and due professional care;
Complied with
According to the Governance structure of the Bank, Deputy General Manager (Audit) reports directly to the BAC and is independent of any operations of the Bank.
3 (6) (ii) (k) The Committee shall consider the major findings of internal investigations and management’s responses thereto;
Complied with
The Board Audit Committee has reviewed major findings and management responses thereto. It also ensures that the recommendations of such investigations were implemented.
3 (6) (ii) (i) The Chief Finance Officer, the Chief Internal Auditor and a representative of the External Auditors may normally attend meetings. The Committee has had at least two meetings with the External Auditors without the Executive Directors being present.
Complied with
The General Manager/CEO, Deputy General Manager (Finance and Planning)/Senior Deputy General Manager, Deputy General Manager (Audit) and a representative from Auditor General’s Office normally attends the meetings. Six meetings were held during the year 2019 and the representative of Auditor General’s Office has attended four meetings.
All Directors of the Bank are Non-Executive Directors. Therefore, no such requirement has arisen to conduct meetings without Executive Directors.

Governance Financial Reports Supplementary Information
221Annual Report 2019 │ National Savings BankCorporate Governance
Section Principles Level of compliance in 2019
3 (6) (ii) (m) The Committee shall have:i explicit authority to investigate into any
matter within its terms of reference;ii the resources which it need to do so;iii full access to information; andiv Authority to obtain external professional
advice and to invite outsiders with relevant experience to attend, if necessary.
Complied with
According to the Board Audit Charter, the Committee has been empowered with:
z Explicit authority to investigate into any matter within its Terms of Reference
z The resources which it needs to do so z Full access to information and z Authority to obtain external professional advice and to invite
outsiders with relevant experience to attend, if necessary.
Refer BAC report on pages 233 to 236.
3 (6) (ii) (n) The Committee shall meet regularly, with due notice of issues to be discussed and shall record its conclusions in discharging its duties and responsibilities
Complied with
The BAC has scheduled regular meetings. Additional meetings are schedules when required. The Committee met six times during the year. Members of the BAC are served with due notice of issues to be discussed and conclusions in discharging its duties and responsibilities are recorded in the minutes of the meetings maintained by the Secretary to the BAC/Secretary to the Board of National Savings Bank.
3 (6) (ii) (o) The Board shall disclose in an informative way:i details of the activities of the Audit
Committee;ii the number of audit committee meetings held
in the year; andiii details of attendance of each individual
director at such meetings.
Complied with
The Report of the BAC on pages 233 to 236 disclose the following:
z Details of the activities of the Audit Committee z The number of BAC meetings held during the year 2019 z Details of attendance of each individual director at such
meetings
3 (6) (ii) (p) The Secretary of the Committee is the Company Secretary or the Head of the Internal Audit function and shall record and keep detailed minutes of the committee meetings
Complied with
The Secretary to the Board of National Savings Bank acts as Secretary to the BAC and detailed minutes are maintained.
3 (6) (ii) (q) The Committee shall review arrangements by which employees of the Bank may, in confidence, raise concerns about possible improprieties in financial reporting, internal control or other matters. Accordingly, the Committee shall ensure that proper arrangements are in place for the fair and independent investigation of such matters and for appropriate follow-up action and to act as the key representative body for overseeing the Bank’s relations with the External Auditor.
Complied with
The Bank has a Board approved Fraud Risk Management and Whistle-Blowing Policy in place which covers these aspects.
3 (6) (iii) The following rules shall apply in relation to the Human Resources and Remuneration Committee:
3 (6) (iii) (a) The Committee shall determine the remuneration policy (salaries, allowances and other financial payments) relating to Directors, Chief Executive Officer (CEO) and Key Management Personnel of the Bank.
Remuneration of the Directors is decided by the subject Minister as per the Section 10 of the NSB Act No. 30 of 1971 and the amendments therein. The remuneration of the General Manager/CEO and KMPs is determined by the BHRRC based on the collective agreement and approved by the Board of the Bank.

Governance Financial Reports Supplementary Information
222 National Savings Bank │ Annual Report 2019 Corporate Governance
Section Principles Level of compliance in 2019
3 (6) (iii) (b) The Committee shall set goals and targets for the Directors, CEO and the Key Management Personnel.
Complied with.
All the Directors of the Bank are Non-Executive Directors of whom five are appointed by the subject Ministry and the other two being Ex-Officio Directors according to the Section 8 of the NSB Act No. 30 of 1971 and the amendments therein. Therefore, specific goals and targets are not set for them.
Goals and targets for the General Manager/CEO and the KMPs are set based on the Strategic Business Plan which are detailed in the Action Plan. These are linked to Key Performance Indicators of KMPs.
3 (6) (iii) (c) The Committee shall evaluate the performance of the CEO and Key Management Personnel against the set targets and goals periodically and determine the basis for revising remuneration, benefits and other payments of performance-based incentives.
Complied with
3 (6) (iii) (d) The CEO shall be present at all meetings of the Committee, except when matters relating to the CEO are being discussed.
Complied with
The General Manager/CEO attends all meetings of the Committee, except when matters relating to the General Manager/CEO are being discussed.
3 (6) (iv) The following rules shall apply in relation to the Nomination Committee:
3 (6) (iv) (a) The Committee shall implement a procedure to select/appoint new Directors, CEO and Key Management Personnel.
Not Applicable.
The five Directors are appointed by the subject Minister while the other two directors being the Ex-officio Directors as per the NSB Act.
According to the Section 11, the Minster shall nominate one of the Directors of the Board to be its Chairman.
As per the Section 26, the Board shall appoint a fit and proper person to be the General Manager of the Bank who shall be the Chief Executive Officer of the Bank.
Appointment of KMPs is compiled with. Board of Directors appoints KMPs with the recommendation of Board Nomination Committee.
3 (6) (iv) (b) The Committee shall consider and recommend (or not recommend) the re-election of current Directors.
Not applicable.
Five Directors are appointed by the Minister while two Directors are Ex-Officio as per the NSB Act.
3 (6) (iv) (c) The Committee shall set the criteria for eligibility to be considered for appointment or promotion to the post of CEO and the key management positions.
Complied with
The General Manager is appointed based on the accepted procedure with the approval of Board of Directors as per the NSB Act No. 30 of 1971 and the amendments therein. The Board approved promotion scheme is available which stipulates the attributes required to be eligible to or promoted to other key management positions.
3 (6) (iv) (d) The Committee shall ensure that Directors, CEO and Key Management Personnel are fit and proper persons to hold office as specified in the criteria given in Direction 3 (3) and as set out in the statutes.
Complied with
Signed affidavit and declarations of Directors and General Manager/CEO are obtained by the Board Secretary and the same are obtained from the KMPs by the Human Resource Development Division and forwarded to the Central Bank for assessing the fitness and propriety.

Governance Financial Reports Supplementary Information
223Annual Report 2019 │ National Savings BankCorporate Governance
Section Principles Level of compliance in 2019
3 (6) (iv) (e) The Committee shall consider and recommend from time to time, the requirements of additional/ new expertise and the succession arrangements for retiring Directors and Key Management Personnel.
Complied with
Appointment of the Chairman, Directors and the General Manager/CEO are carried out according to the NSB Act No. 30 of 1971 and the amendments therein. A Board approved Succession Plan for the KMPs is in place. Appointments of KMPs are made by the Board of Directors according to the Succession Plan based on the recommendations of BNC.
3 (6) (iv) (f) The Committee shall be chaired by an Independent Director. The CEO may be present at meetings by invitation.
The Committee is chaired by the Non-Independent Non-Executive Director.
3 (6) (v) The Board Integrated Risk Management Committee:
3 (6) (v) (a) The Committee shall consist of at least three Non-Executive Directors, Chief Executive Officer and Key Management Personnel supervising broad risk categories, i.e. credit, market, liquidity, operational and strategic risks. The Committee shall work with Key Management Personnel very closely and make decisions on behalf of the Board within the framework of the authority and responsibility assigned to the Committee.
Complied with
The Committee comprises of three Non-Executive Directors, General Manager/CEO and the Chief Risk Officer who is responsible for supervising broad risk categories, i.e. credit, market, liquidity, operational and strategic risks. Compliance Officer participates at all Committee meetings by invitation. Any other KMP and staff are invited based on the requirement. The Committee works closely with KMPs within the framework of authority and responsibility assigned.
3 (6) (v) (b) The Committee shall assess all risks, i.e. credit, market, liquidity, operational and strategic risks to the Bank on a monthly basis through appropriate risk indicators and management information. In the case of subsidiary companies and associate companies, risk management shall be done, both on a bank basis and group basis.
Complied with
The Board has approved the Policies on Credit Risk Management, Market and Liquidity Risk Management, Operational Risk Management on the recommendation of the BIRMC that provides the framework for assessment and management of risks.
The Risk Management Division submits monthly reports on risk indicators both on a bank basis and group basis based on the pre -defined risk appetite levels which are reviewed by the Committee.
3 (6) (v) (c) The Committee shall review the adequacy and effectiveness of all management level committees such as the credit committee and the asset-liability committee to address specific risks and to manage those risks within quantitative and qualitative risk limits as specified by the Committee.
Complied with
The Committee reviews reports of management levels committees such as the Credit Committee, Investment Committee and the Asset and Liability Management Committee (ALCO) to assess the adequacy and effectiveness in addressing specific risks and to ensure those risks are managed within quantitative and qualitative risk limits as specified by the risk appetite level of the Bank which reviewed on a regular basis.
The adequacy and effectiveness of all management level committees are reviewed by the BIRMC.
3 (6) (v) (d) The Committee shall take prompt corrective action to mitigate the effects of specific risks.
Complied with
3 (6) (v) (e) The Committee shall meet at least quarterly to assess all aspects of risk management including updated Business Continuity Plans (BCP).
Complied with
During the year the, Committee had four (04) meetings. Details of meetings and attendance are given on page 241.
3 (6) (v) (f) The Committee shall take appropriate actions against the officers responsible for failure to identify specific risks and take prompt corrective actions as recommended by the Committee, and/or as directed by the Director of Bank Supervision.
Complied with
The Bank has established a disciplinary action procedure to address such issues. No necessities have arisen during the year.

Governance Financial Reports Supplementary Information
224 National Savings Bank │ Annual Report 2019 Corporate Governance
Section Principles Level of compliance in 2019
3 (6) (v) (g) The Committee shall submit a risk assessment report within a week of each meeting to the Board seeking the Board’s views, concurrence and/or specific directions.
Complied with
The detailed minutes of the meetings are submitted to the next immediate Board meeting along with the recommendations and the Risk Management Reports.
3 (6) (v) (h) The Committee shall establish a compliance function to assess the Bank’s compliance with laws, regulations, regulatory guidelines, internal controls and approved policies on all areas of business operations. A dedicated compliance officer selected from Key Management Personnel shall carry out the compliance function and report to the Committee periodically.
Complied with
The compliance function has been established to assess the Bank’s compliance with laws, regulations, regulatory guidelines, internal controls and approved policies on areas of business operations. This function is headed by a dedicated Compliance Officer (CO). CO submits reports periodically to the BIRMC/BAC/Board.
3 (7) Related Party Transactions
3 (7) (i) The Board shall take the necessary steps to avoid any conflicts of interest that may arise from any transaction of the Bank with any person,
Complied with
The Board approved Related Party Transactions Policy is in place covering related parties, their transactions and restrictions on offering more favourable treatment to related parties in order to avoid any conflict of interest by the Board of Directors.
Directors are requested to declare their related party transactions individually. These transactions are monitored through an automated system.
3 (7) (ii) The type of transaction with related parties that shall be covered by this Direction.
Complied with
The Related Party Transactions Policy approved by the Board, covers the following transactions:
(a) The grant of any type of accommodation, as defined in the Monetary Board’s Directions on maximum amount of accommodation;
(b) The creation of any liabilities of the Bank in the form of deposits, borrowings and investments;
(c) The provision of any services of a financial or non-financial nature to the Bank or received from the Bank;
(d) The creation or maintenance of reporting lines and information flows between the Bank and any related parties, which may lead to sharing of potentially proprietary, confidential or otherwise sensitive information that may give benefits to such related parties.
Information in this regard is disclosed in Note 49.5 on “Related Party Disclosures”.
3 (7) (iii) The Board shall ensure that the Bank does not engage in transactions with related parties as defined in Direction 3 (7) (i) above, in a manner that would grant such parties “more favourable treatment” than that accorded to other constituents of the Bank carrying on the same business.
Complied with
Annual declarations are obtained from the Directors where such transactions would be identified. System is also developed to capture any transaction with “more favourable treatment” than that accorded to other constituents of the Bank carrying on the same business and reported to the Board periodically.
Transactions (if any) carried out with Related Parties in the normal course of business are disclosed in Note 49.5 to the Financial Statements “Related Party Disclosures” on page 392.

Governance Financial Reports Supplementary Information
225Annual Report 2019 │ National Savings BankCorporate Governance
Section Principles Level of compliance in 2019
3 (7) (iv) A bank shall not grant any accommodation to any of its Directors or to a close relation of such director unless such accommodation is sanctioned at a meeting of its Board of Directors, with not less than two-thirds of the number of directors other than the director concerned, voting in favour of such accommodation.
Complied with
No such instances were recorded
3 (7) (v) (a) Where any accommodation has been granted by a bank to a person or a close relation of a person or to any concern in which the person has a substantial interest, and such person is subsequently appointed as a Director of the Bank, steps shall be taken by the Bank to obtain the necessary security as may be approved for that purpose by the Monetary Board, within one year from the date of appointment of the person as a director.
Complied with
The Secretary to the Board obtains declarations from all the Directors prior to the appointment as a Director and they are requested to declare any further transactions.
Employees of the Bank are aware of the requirement to obtain the necessary security as defined by the Monetary Board, if a need arises.
The Compliance Division monitors the processes with this regulation.
3 (7) (v) (b) Where such security is not provided by the period as provided in Direction 3 (7) (v) (a) above, the bank shall take steps to recover any amount due on account of any accommodation, together with interest, if any, within the period specified at the time of the grant of accommodation or at the expiry of a period of eighteen months from the date of appointment of such director, whichever is earlier.
3 (7) (v) (c) Any Director who fails to comply with the above sub-directions shall be deemed to have vacated the office of Director and the bank shall disclose such fact to the public.
3 (7) (v) (d) This sub-direction, however, shall not apply to a Director who at the time of the grant of the accommodation was an employee of the bank and the accommodation was granted under a scheme applicable to all employees of such bank.
3 (7) (vi) A bank shall not grant any accommodation or “more favourable treatment” other than on the basis of a scheme applicable to the employees of such bank.
Complied with
No favourable treatment/accommodation provided to employees of the Bank other than staff benefits. Employees of the Bank are informed through circular instructions to refrain from granting favourable treatments to other employees or close relations.
3 (7) (vii) No accommodation granted by a bank under Direction 3 (7) (v) and 3 (7) (vi) above, nor any part of such accommodation, nor any interest due thereon shall be remitted without the prior approval of the Monetary Board and any remission without such approval shall be void and of no effect.
Complied with
No such instances were recorded.
3 (8) Disclosures
3 (8) (i) The Board shall ensure that:
3 (8) (i) (a) annual audited Financial Statements and quarterly Financial Statements are prepared and published in accordance with the formats prescribed by the supervisory and regulatory authorities and applicable accounting standards, and that,
Complied with

Governance Financial Reports Supplementary Information
226 National Savings Bank │ Annual Report 2019 Corporate Governance
Section Principles Level of compliance in 2019
3 (8) (i) (b) Such statements are published in the newspapers in an abridged form, in Sinhala, Tamil and English.
Complied with
3 (8) (ii) The Board shall ensure that the following minimum disclosures are made in the Annual Report:
3 (8) (ii) (a) A statement to the effect that the Annual Audited Financial Statements have been prepared in line with applicable accounting standards and regulatory requirements, inclusive of specific disclosures.
Complied with
Disclosure on the compliance with applicable accounting standards and regulatory requirements, in preparation of the Annual Audited Financial Statements have been made on the “Statement of Directors’ Responsibility for Financial Reporting” on pages 283 and 284 and “General Manager’s/CEO and Senior Deputy General Manager’s (Finance and Planning) Statement of Responsibility” on pages 291 to 292.
3 (8) (ii) (b) A report by the Board on the Bank’s internal control mechanism that confirms that the financial reporting system has been designed to provide reasonable assurance regarding the reliability of financial reporting, and that the preparation of Financial Statements for external purposes has been done in accordance with relevant accounting principles and regulatory requirements.
Complied with
The Annual report includes the following reports where the Board confirms that the financial reporting system has been designed to provide reasonable assurance regarding the reliability of financial reporting and the preparation of Financial Statements for external purposes has been done in accordance with relevant accounting principles and regulatory requirements:
Annual Report of the Board of Directors on page 277.
Statement of Directors’ Responsibility for Financial Reporting on pages 283 and 284.
Directors’ Statement on Internal Control over Financial Reporting on pages 285 and 286.
3 (8) (ii) (c) The External Auditor’s certification on the effectiveness of the internal control mechanism referred to in Direction 3 (8) (ii) (b) above, in respect of any statements prepared or published after 31 December 2008.
Complied with
Refer Independent Assurance Report on Internal Controls on page 287.
3 (8) (ii) (d) Details of directors:i including names, fitness and propriety,ii transactions with the Bank, andiii the total of fees/remuneration paid by
the Bank.
Complied with
Profiles of the Directors are given on page 201.
Refer Note 49.5 to the Financial Statements on page 392.
Refer Note 49.5 to the Financial Statements on page 392.
3 (8) (ii) (e) Total net accommodation as defined in 3 (7) (iii) granted to each category of related parties. The net accommodation granted to each category of related parties shall also be disclosed as a percentage of the Bank’s regulatory capital.
Complied with
The net accommodations granted as a percentage of Bank’s regulatory capital are given in Note 49.5.3 to the Financial Statements on page 392.
3 (8) (ii) (f) The aggregate values of remuneration paid by the Bank to its Key Management Personnel and the aggregate values of the transactions of the Bank with its Key Management Personnel, set out by broad categories such as remuneration.
Complied with
Details are given in Note 49.5.1 to the Financial Statements on page 392.

Governance Financial Reports Supplementary Information
227Annual Report 2019 │ National Savings BankCorporate Governance
Section Principles Level of compliance in 2019
3 (8) (ii) (g) The External Auditor’s certification of the compliance with these Directions in the annual corporate governance reports
Complied with
The Bank has obtained a certificate from the Auditor General on the level of compliance with the Corporate Governance Direction No. 12 of 2007. All findings of the Auditor have been incorporated in this Corporate Governance Report and any recommendations will be dealt with in 2020.
3 (8) (ii) (h) A report setting out details of the compliance with prudential requirements, regulations, laws, internal controls and measures taken to rectify any material non-compliance.
Complied with
The Statement of Directors’ Responsibility for Financial Reporting on pages 283 and 284 clearly sets out the details regarding compliance with prudential requirements, regulations, laws and internal controls.
A statement of the regulatory and supervisory concerns on lapses in the Bank’s risk management, or non-compliance with these Directions that have been pointed out by the Director of Bank Supervision of CBSL if so directed by the Monetary Board to be disclosed to the public, together with the measures taken by the Bank to address such concerns.
Not Applicable.
Monetary Board has not directed any disclosures to be made public during the year.
3 (9) Transitional and other general provisions Complied with
The Bank has complied with the applicable transitional provisions.
Compliance requirement of the Corporate Governance Direction No. 12 of 2007
The Auditor General has performed procedures in accordance with the principles set out in Sri Lanka Standards on Related Services 4,400 – Engagements to Perform Agreed – Upon Procedures Regarding Financial Information issued by The Institute of Charted Accountants of Sri Lanka to meet the compliance requirement of the Direction No. 12 of 2007 on Corporate Governance issued by the Central Bank of Sri Lanka. His findings given on his report dated 22 May 2020 were not materially different to the matters disclosed above and did not identify any significant inconsistencies to those reported above by the Board.
M A P Muhandiram Ms Keasila Jayawardana Secretary to the Board Chairperson
22 May 2020Colombo

Governance Financial Reports Supplementary Information
228 National Savings Bank │ Annual Report 2019 Corporate Governance
Compliance with the Code of Best Practice on Corporate Governance issued by The Institute of Chartered Accountants of Sri Lanka
Code reference
Principles
A Directors
A.1 The Board
The Board of National Savings Bank comprises seven Non-Executive Directors including the Chairman which is laid down in the National Savings Bank Act No. 30 of 1971 and the amendments therein. Five Directors of the Bank are appointed by the Minister as per the NSB Act and the two Ex-officio Directors; one shall be the Secretary to the Treasury or his nominee and the other shall be the Postmaster General or his nominee.
The Board headed by the Chairman is the apex decision-making body of the Bank.
Details of the Directors during the year 2019 are given on pages 201 to 203. Details of the present Board of Directors are given on page 176 to 179.
A.1.1 Regular meetings
The Board has met regularly during the year by adhering to the statute. During the year, the Board has convened 17 meetings. Complying with the respective Charters, the Board Subcommittees met regularly during the year. The regularity of the Board meetings and the structure and process of submitting information had been agreed to and documented by the Board. Details of Board meetings and Subcommittee meetings are given on pages 204 and 205.
A.1.2 Roles and Responsibilities of the Board
The Board Charter details the responsibilities entrusted to the Board which includes setting the strategic direction of the Bank, determining the risk appetite, financial reporting, compliance with laws and regulations, sound corporate governance, sustainable business development in corporate strategy and safeguarding the Bank. The Board appointed 06 Subcommittees assisted the Board in discharging the responsibilities in the year 2019. The Board is assisted by the Secretary to the Board.
A.1.3 The Board act in accordance with the laws of the country
The Board has an approved procedure in place to ensure that the Bank is in compliance with related laws, CBSL Directions and Guidelines and international best practices with regard to the operations. This includes procedures where by the Board can require the Bank to obtain independent professional advice and the expenses thereon are borne by the Bank.
A.1.4 Access to advice and services of the Secretary and appointment or removal of the Secretary to the Board
All the Directors have the ability to obtain advices and services of the Secretary to the Board who is responsible for ensuring that the Board procedures are followed with and the applicable rules and regulations are complied with.
The appointment and the removal of the Secretary to the Board is a matter involving the whole Board under the advice of BNC as it is a Key Management Personnel position.
As per the Section 30 of NSB Act, no Director of the Bank shall be liable for any loss or damage suffered by the Bank unless such loss or damage was caused by his misconduct or wilful default.
A.1.5 Independent judgement
The Board of Directors of the Bank has no vested interest and take independent decisions on matters relating to the Board including strategy, performance, resource allocation, risk management, compliance, and standards business of conduct.
A.1.6 Dedicate adequate time and effort to matters of the Board and the Company
Board meetings and Board Subcommittee meetings are scheduled well in advance and the relevant papers are generally circulated one week prior to the meeting through electronic means to ensure that the Directors are having sufficient time to review the papers and call for additional information and clarification, and after a meeting to follow up on issues consequent to the meeting. Given that, in exceptional situations there is a provision to circulate the papers closer to the meeting. This is supplemented by giving sufficient time to be familiarise with business operations, risks and controls.

Governance Financial Reports Supplementary Information
229Annual Report 2019 │ National Savings BankCorporate Governance
Code reference
Principles
A.1.7 Calls for resolutions
As per the NSB Act, Chairman shall upon written requisition from any two Directors, call a special meeting of the Board where they feel it is in the best interest of the Bank to do so. In case of a special meeting, notice should be given to all Directors prior to four days of the meeting.
A.1.8 Training of Directors
The Board of Directors of the Bank gets adequate training on appointment. Refer page 205 for details.
A.2 Division of responsibilities of Chairman and Chief Executive Officer (CEO)
The positions of the Chairman and the Chief Executive Officer have been separated in line with the best practices in order to maintain the balance of power and authority which is clearly defined in the Board Charter. Chairman of the Bank is a Non-Independent, Non-Executive Director while CEO is not a member of the Board.
A.3 Chairman’s role
The Chairman provides a leadership role in order to preserve good governance and facilitates the effective functioning of the Board. Chairman is responsible for maintaining open lines of communication with KMPs and contributes on strategic and operational matters. The agenda of the meeting is developed in consultation with General Manager/CEO, Directors and the Secretary to the Board, taking into consideration the matters relating to strategy, performance, resource allocation, risk management, and compliance. Sufficiently detailed information of matters included in agenda is provided to Directors in a timely manner. All Directors are made aware of their duties and responsibilities and Board Subcommittee Structures. All Directors are encouraged to make an effective contribution and obtain information necessary to discuss matters on the agenda and arrive at an informed decision. The views of Directors on issues under considerations are ascertained and recorded in minutes.
A.4 Financial acumen
The Board possesses the required financial acumen and knowledge to offer guidance on matters relating to finance where some of the Directors being professionally qualified in fields of finance/accounting and/or having Senior Management positions and/or directorships.
A.5 Board balance
The Board of the Bank comprises seven Non-Executive Directors appointed as per the NSB Act. The Board of Directors annually submit a signed and dated deceleration of their independence/non-independence.
A.6 Supply of information
The Management provides appropriate and timely information to the Board generally, seven days prior to the Board meetings or Board Subcommittee meetings to discharge their duties and responsibilities effectively. Chairman ensures that the Board is adequately briefed on the matters discussed and the KMPs are requested to be present during the meetings to be present where deemed necessary. Any Director who is unable to attend a meeting is updated on proceedings through formally documented minutes of the meeting, prior to the next meeting which are discussed at the same. The agenda of the meetings and papers required, are generally circulated prior to seven days and the minutes of the previous meeting are generally circulated at least two weeks after the meeting.
A.7 Appointments to the Board
As a state-owned Bank, five Directors are appointed by the Minister in charge under whose purview the Bank comes in while two Directors are Ex-officios according to the NSB Act. The Bank has complied with the required regulatory requirements relating to appointment of new Directors. Refer Section Corporate Governance on page 205 for details.
A.8 Re-election
As per the NSB Act, the term of a Directors is three years unless otherwise he vacates office early by death, resignation or removal of holding office. Refer Section Corporate Governance on page 205 for the details of Appointment and Re-election of Directors.

Governance Financial Reports Supplementary Information
230 National Savings Bank │ Annual Report 2019 Corporate Governance
Code reference
Principles
A.9 Appraisal of Board performance
The Board annually assess their own performance to ensure that the Board is discharging their responsibilities satisfactorily. The evaluation process requires each Director to fill a Board Performance Evaluation Form.
The responses are gathered and submitted to the Board Nomination Committee which will be submitted to the Board post review of Board Nomination Committee.
The Board Subcommittee also follow the same procedure. Due to the change that took place to the Board in December 2019, these evaluations were not carried out.
A.10 Disclosure of information in respect of Directors
The information specified in the Code with regard to Directors are disclosed in this Annual Report as follows. Name, qualifications, expertise, material business interest and brief profiles are given on pages 201 to 203.
Details of whether a Director is Executive, Non-Executive and/or Independent, Non-Independent are given on pages 204 and 205.
Related party transactions are given on Note 49.5 to the Financial Statements on page 392.
Membership of Board Subcommittees and attendance at Board and Board Subcommittee are given on pages 204 to 205.
A.11 Appraisal of Chief Executive Officer/General Manager (CEO)
Performance of the General Manager/CEO is assessed annually based on the financial and non-financial target given in the strategic business plan with the assistance of BHRRC. The final report is submitted to the Board.
B Directors’ remuneration
B.1 In accordance with the NSB Act and its amendments therein, the Directors’ remuneration is decided by the relevant Minister.
No Director is involved in deciding his/her own remuneration. The Board Human Resource and Remuneration Committee (BHRRC) makes recommendations to the Board regarding the remuneration of the General Manager/CEO and the Key Management Personnel on the basis of collective agreements, which are reviewed once in three years. The Bank has put in place a Board-approved Remuneration Policy for Key Management Personnel. Based on the recommendations by the Committee, the Board makes recommendations to the respective Minister responsible for state banks who grants final approval in accordance with the provisions of NSB Act and amendments therein. The BHRRC comprise three Non-Executive Directors. Refer pages 237 and 238 on details of the Board Human Resource and Remuneration Committee.
B.2 Level and make up of remuneration
As a state-owned Bank, the level and make up of remuneration is determined by the subject Minister according to the NSB Act.
B.3 Disclosure of remuneration
Directors' remuneration and level and make up of remuneration on page 209.
Details of Directors’ total remuneration Refer Note 49.5 to the Financial Statements on page 392. Members of the BHRRC and their Report – Refer pages 237 and 238.
C Relations with shareholder
C.1 Constructive use of AGM and conduct of General Meetings
As a state-owned Bank, NSB is conducting regular meetings with the subject Ministry.
C.2 Communication with shareholder
The Government of Sri Lanka is the sole shareholder of the Bank. An officer from the Ministry of Finance is appointed to the Board representing the shareholder (Government). The Annual Report is placed before the Parliament of Sri Lanka and is open to question by the Parliament. Therefore, this Annual Report is presented to the Parliament through the Ministry of Finance under whose purview the Bank comes in.

Governance Financial Reports Supplementary Information
231Annual Report 2019 │ National Savings BankCorporate Governance
Code reference
Principles
C.3 Disclosure of major and material transactions
There were no “Major transactions” that would have materially affected the Bank’s or the Group’s net assets base, nor any material related party transactions except those disclosed in:
Annual Report of Board of Directors on pages 277 to 282 and Note 49.5 to the Financial Statements on page 392.
D Accountability and audit
D.1 Financial and business reporting (Annual Report)
This Annual Report presents a balanced and understandable review of the Bank’s financial position, performance, business model, governance structure, risk management, internal controls and challenges, opportunities and prospects. The Bank has taken all measures to ensure Annual Report including the financial statements as well as interim financial statements which are reviewed by BAC prior to publication are giving a true and fair view and has been prepared in accordance with the relevant laws and regulations. The Annual Report contains following disclosures which are required by the Code:
z Management Discussion and Analysis – refer pages 89 to 174. z Annual Report of the Board of Directors – refer pages 277 to 282. z Statement of Directors’ Responsibility for Financial Reporting – refer pages 283 and 284. z Directors’ Statement on Internal Controls – refer pages 285 and 286. z General Manager/CEO’s and Senior Deputy General Manager’s (Finance and Planning) Statement of Responsibility –
refer pages 291 and 292. z Related Party Transactions – refer pages 388 to 394.
The net assets value of the Bank is disclosed in Note 50 to the Financial Statements on page 395.
D.2 Risk management and internal control
The Board is responsible for determining the risk appetite in achieving its strategic objectives, formulating and implementing appropriate processes of risk management and sound system of internal control to safeguard shareholder’s investments and the assets of the Bank. The BIRMC assist the Board in discharging its duties with regard to risk management while BAC assist in discharging the Board’s duties relating to processed and effectiveness of risk management and internal control. The summary of responsibilities of respective Committees are given under each Subcommittee Report. The Committees are formulated according to the Banking Act No. 12 of 2007 on Corporate Governance, Code of Best Practice on Corporate Governance issued by The Institute of Chartered Accountants of Sri Lanka and the Bank’s policies. The BIRMC is supported by the Risk Management Division and pages 248 to 274 includes a comprehensive report on how the Bank is managing the risk.
D.3 Audit Committee
The BAC comprises three Non-Executive Directors. The Senior Director of the Bank is a Member of the BAC. A summary of the scope of the BAC as per the Terms of Reference are given in the Report of BAC on pages 233 to 236 in the Annual Report. The Terms of Reference is prepared in accordance with the Code. Review of the Internal Controls are done by the Internal Audit Division and reports are regularly reported to the BAC. The external assurance on effectiveness of Internal Controls was obtained from the External Auditor, which is Auditor General and produced on page 287 in this Annual Report.
D.4 Related Party Transactions Review Committee
The Bank has not formed a Board-Related Party Transactions Review Committee for monitoring the related party transactions of Directors and KMPs. However, the Bank has a Board approved related party transactions policy in place which covers related parties, their transactions and restrictions on offering non-favourable treatment to related parties in order to avoid conflict of interest of Board of Directors.
D.5 Code of business conduct and ethics
The Bank has Code of Business Conduct and Ethics that is internally developed and approved by the Board which applies to all employees of the Bank including KMPs. All officers of the Bank are required to furnish an annual asset liability declaration to the Human Resource Development Division. All the Directors furnish their annual assets and liability declaration to the relevant Ministry.
The Bank has set applicable policies and procedures to identify and deal with any possible infringements.
The Bank has put in place a Procurement Guidelines to ensure transparent procurement practices are applied.

Governance Financial Reports Supplementary Information
232 National Savings Bank │ Annual Report 2019 Corporate Governance
Code reference
Principles
D.6 Corporate governance disclosures
The Directors are required to disclose the extent to which the Bank adheres to established principles and practices of good corporate governance. The following reports includes the Bank’s compliance with the good governance principles and practices.
The Corporate Governance Report from pages 196 to 227.
Compliance with the Code of Best Practice on Corporate Governance issued by The Institute of Chartered Accountants of Sri Lanka on pages 228 to 232.
E and F Shareholder and other investors
The Bank is incorporated under an Act of Parliament, the NSB Act and the Government of Sri Lanka is the sole shareholder. The Bank is having regular and structured dialogue with the GOSL based on the mutual understanding of objectives through the subject Ministry as and when required.
G Internet of things and cybersecurity
The Bank has a Board approved Information Security Policy (ISP) in place. The Bank has appointed a Chief Information Security Officer (CISO) who independently monitors and informs the Board on implementation and any exceptions if any with regard to cybersecurity risk management through BIRMC. Furthermore, Board Information Technology Strategy Committee appraises the Board on cyber risk management practices applied at the Bank and informs the Board accordingly. The Bank conducts four external and four internal vulnerability assessments each year.
H Environment, Society and Governance (ESG)
H.1 ESG Reporting
Sustainability business approach involves a holistic approach to value creation while embracing opportunities and managing risk. In its sustainability approach to the business, the Bank considers economic, social, and environmental values created through its strategy in the short, medium and long term. The sustainability reporting requires the Bank to recognise, measure and disclose and be accountable to internal and external stakeholders. Information required by the Code is given in the following sections of the Annual Report:
z Management Discussion and Analysis – refer pages 89 to 174. z Corporate Governance – refer pages 196 to 227. z Stakeholders – refer pages 70 to 77. z Materiality – refer pages 78 to 88. z This Annual Report has been in accordance with IIRC Framework, and the GRI guidelines.

Governance Financial Reports Supplementary Information
233Annual Report 2019 │ National Savings Bank
Report of the Board Audit Committee
Composition of the committee
Brief profiles of the members of the Board Audit Committee during 2019 are given on pages 201 to 203 under the Corporate Governance Report.
In 2020
The Board of the Bank was reconstituted in January 2020 with the change that took place in the Government and the Board has decided to reconstitute the Board Audit Committee as follows:
Ms Manohari Abeysekera Chairperson/Non-Independent Non-Executive Director
Dr M K C Senanayake Member/Non-Independent Non-Executive Director
Profiles of the above members are given on pages 176 to 179
Regular attendees by invitation
Deputy General Manager (Audit) Deputy General Manager (Finance and Planning)/Senior Deputy General Manager.
Secretary to the committee
The Board Secretary functions as the Secretary to the Board Audit Committee.
Meetings
Name Eligibleto attend
Attended
Mr A K Seneviratne 02 02Dr D Shanmugasundaram 02 02Mr U G R Ariyaratne 02 02Mr P Algama 04 04Mr Nazri Nizar 04 03Mr Anil Rajakaruna 02 02
During the financial year ended December 31, 2019 the Committee held 6 meetings and quorum of the Committee is two-thirds as per the Charter of the BAC.
The Superintendent of Audit, Auditor General’s Department as the representative of the Auditor General attended 04 BAC meetings on invitation as an Observer. The Senior Management including General Manager/CEO of the bank participated the meetings by invitation on a need basis.
In 2019
The Board of Directors of the National Savings Bank which consists of seven Directors and being constituted under the provisions of Section 8 (1), its sub-section of NSB Act No. 28 of 1995 and members for all the Sub- Committees including the Board Audit Committee members are being appointed out of the said Seven (07) members who possess necessary qualifications, skills and experience to serve BAC.
During the year under review, the Board Audit Committee comprised the following Non-Executive Directors:
Mr A K SeneviratneChairman/Non-Independent Non-Executive Director (until his resignation from the Board of National Savings Bank on 28 February 2019)
Dr D ShanmugasundaramMember/Independent Non-Executive Director (until his resignation from the Board of National Savings Bank on 9 April 2019)
Mr U G R Ariyaratne Member/Independent Non-Executive Director (until his resignation from the Board Audit Committee on 14 March 2019)
Pursuant to the resignation of Mr A K Seneviratne, Dr D Shanmugasundaram and Mr U G R Ariyaratne, the Committee comprised of the following Non-Executive Directors:
Mr P AlgamaChairman/Non-Independent Non-Executive Director
Mr Nazri NizarMember/Non-Independent (Independent until 24 October 2019) Non-Executive Director (until his resignation from the Board of National Savings Bank on 20 November 2019) Mr Anil Rajakaruna Member/Non-Independent Non-Executive Director (from 29 July 2019 until his resignation from the Board of National Savings Bank on 5 December 2019)

Governance Financial Reports Supplementary Information
234 National Savings Bank │ Annual Report 2019 Report of the Board Audit Committee
Charter of the board audit committee
The Charter of the BAC has been approved by the Board of Directors and renewed regularly, clearly defines the Terms of Reference of the Committee. The Committee Charter was last reviewed in year 2018 by taking into consideration the new developments in the banking sector.
The Board Audit Committee (BAC) of the Bank was constituted in accordance with the Banking Act Direction No. 12 of 2007 on “Corporate Governance for Licensed Specialised Banks” issued by the Central Bank of Sri Lanka under Section 3 (6) (ii) and its subsequent amendments, provision of the Public Enterprises Guidelines for Good Governance and “Code of Best Practice on Corporate Governance” issued by the Institute of Chartered Accountants of Sri Lanka.
The Committee is empowered by the Board of Directors in discharging its responsibilities and fulfilling its oversight responsibilities for:
(a) The integrity of the Bank’s Financial Statements
(b) The effectiveness of the Bank’s risk management function
(c) The performance of the Bank’s internal audit function; and
(d) The performance of the Bank’s external audit function.
The Charter also stipulates the functions and responsibilities, and the authority of the Committee. The Charter Checklist was used to assist the Committee to assess its compliance to the Charter in performing Committee’s functions and discharging its responsibilities.
Reporting
The Committee is directly reporting to the Board of Directors about its activities along with the minutes of the meetings. BAC provides Open Avenue of communication between internal
audit, external audit and the Board of Directors. The Committee is of the view that Terms of Reference (TOR) of the Committee were compiled within all material aspects.
Activities in 2019
Financial reporting
The Committee reviewed the Financial Statements of the Bank, in order to monitor the integrity of the Financial Statements and quarterly reports prepared for disclosure, and the significant financial reporting judgment contained therein prior to their release. The Committee shall focus on major judgment areas, any changes in accounting policies and practices, significant adjustments arising from the audit, the going concern assumption and compliance with relevant accounting standards and other legal requirements to evidence the Financial Statements give a true and fair view on financial position and performance of the Bank.
The Committee reviewed the ‘Report on the review of Financial Statement for the year ended 2018 which was submitted along with findings by the Internal Audit Division and reviewed the draft Financial Statement submitted on quarterly basis.
Implementation of Basel III
The Committee during the year reviewed the progress and compliance on the implementation of Banking Act Direction No. 1 of 2016 with regard to the capital and liquidity requirements. The Bank has fully complied with requirements of the above-mentioned Direction as at December 2019.
Internal Capital Adequacy Assessment Process (ICAAP)
As per the Section 10 of the Banking Act Direction No. 1 of 2016 requires an independent review on the integrity, accuracy and reasonableness of the capital assessment process of the
Bank. The Committee has reviewed the effectiveness of the internal control mechanism to meet the regulatory requirements on ICAAP.
Identification of risks and control measures
The Directors of the Bank and its subsidiaries are responsible for identifying and evaluating risks and its impact on business operations and financial reporting. The Bank adapt risk-based audit approach and the Committee assessed the effectiveness of the Bank’s internal control over financial reporting in line with the Banking Act Direction No. 12 of 2007, Section 3 (8) (ii) (b) and prepared based on the guidelines issued by The Institute of Chartered Accountants of Sri Lanka (CA Sri Lanka).
BAC reviewed and assessed the Bank’s risk management process, including the adequacy of the overall control environment and controls in areas of significant risks. Further, BAC reviewed and assesses the Bank’s system of internal controls for detecting accounting and financial reporting errors and misappropriation of assets, legal violations, and non-compliance with the corporate code of conduct. In this regard, reviews the related findings and recommendations of the External and Internal Auditors, together with Management’s responses.
The Directors’ Statement on Internal Control and the Auditor General’s Report on Internal Control are provided in pages 285 to 287. In this regard, the Committee is of the view that necessary procedures and checks are in place to provide reasonable assurance and the Bank is in compliance with the aforesaid requirements.
Internal audit and inspection
The BAC ensures that, the internal audit function is independent of the activities it audits. It reviewed the adequacy of the scope, functions and resources of the Internal Audit Division, and also

Governance Financial Reports Supplementary Information
235Annual Report 2019 │ National Savings BankReport of the Board Audit Committee
satisfied itself that the Division had the necessary authority to carry out its work.
The Internal Audit Division of the Bank carried out audit of Branches, Divisions and other Units as per the Annual Audit Plan. The frequency of audit was determined by the level of risk assessed. The Audit Plan was approved by the BAC for implementation. The approved audit plan for the year 2019 has been achieved by the end of 2019.
The Internal Audit Division carried out audit checks to ensure compliance with policies and procedures and the effectiveness of the internal control systems and reports its findings in respect of any non-compliance. Audits were carried out to provide an independent and objective report on operational and management activities.
BAC reviewed findings of regular audit examinations and information system audits carried out by the Internal Audit Division. Further, the Committee reviewed the reports on internal investigations carried out during the period from December 2018 to August 2019, Report on Fraudulent Withdrawals of the Bank and reviewed the performance of senior staff members of the Audit & Vigilance Division for the year.
The Internal Audit Manual of the Bank summarises the operations of the internal audit function and delineates the policies, standards and procedures which will generally govern the internal audit function.
The Internal Audit Charter is used in order to assist the Internal Audit Division to discharge its duties effectively and independently. The Charter includes the scope, functions, responsibilities, authorities, reporting procedure and independence and objectivity of the Internal Audit Division.
External audit
By statute, the Auditor General is the External Auditor of the Bank. Meetings with the External Auditor, without executive management were held at least twice during the engagement. They were also provided with the opportunities of meeting the Committee independently, to discuss and express their views on any matter of significance.
Effectiveness of the audit process is discussed with the Superintendent of the Government Audit at BAC meetings. The Committee ensured the provision of all information and documents required by the External Auditor for the purpose of audit.
The Committee during the year, z Reviewed the Report of the Auditor
General that was submitted to the Parliament on the financial statements of the Bank for the year ended 31, December 2018, the Management Letter and the responses made thereon by the Corporate Management of the Bank and followed up the required corrective measures.
z Reviewed and discussed the significant reports submitted by the Auditor General’s Department where deemed necessary actions were initiated.
Monitoring of internal controls z Follow up mechanism for rectification
of issues identified during audits have been strengthened
z Periodical review of reports on disciplinary matters and investigations
z Review of common instances of frauds/irregularities in order to take initiatives to avoid recurrence
z Directions to expedite investigations/disciplinary inquires
Ethics and good governance
The Committee continuously reviewed and emphasised on endurance of good corporate governance practices in the Bank.
In this regard, the Fraud Risk Management and Whistle-blowing Policy of the National Savings Bank are key element for safeguarding the Bank’s integrity. It is aimed at enhancing the Bank’s transparency and underpinning its system for combating practices that might damage its activities and reputation and provide a means for early detection of fraud and other problematic situations.
The BAC reviewed on a quarterly basis all the cases of frauds. During the quarterly review, the BAC scrutinized statistical information as well as details of each fraud, action taken thereon and issue directions on the punitive and preventive aspects of frauds, where necessary. The BAC had the right to, at any time; request a briefing regarding any preliminary investigation and findings.
Sri Lanka accounting standards
The Committee reviewed and revised the decisions on adoption of new and revised Sri Lanka Accounting Standards (LKASs)/Sri Lanka Financial Reporting Standards (SLFRS) applicable to the Bank and made required recommendations therein.
Compliance
The Committee reviewed the effectiveness of the system for monitoring compliance with laws and regulations and the results of Management's investigation and follow-up (including disciplinary action) of any instances of non-compliance.

Governance Financial Reports Supplementary Information
236 National Savings Bank │ Annual Report 2019 Report of the Board Audit Committee
Focus for 2020 and beyond z Continue to focus on financial
systems, processes, internal controls used by the Bank are responding to the complex requirements of the external and internal environment and operating effectively.
z Monitoring and making required developments based on the independent reviews of the Auditor General through assessing the impacts to the Bank.
Committee evaluation
Committee annually conducted an evaluation of the effectiveness of the Committee and results are communicated to the Board. However, in respect of year 2019, an evaluation about the Audit Committee has not been conducted consequent to the changes that took place in the Board
Board Audit Committee
Strategic drivers Stakeholders Material risks
Promoting organic growth Shareholder Credit riskLeading by example Regulatory bodies and Government Market riskReinforcing risk culture Customers Operational risk
Liquidity riskStrategic risk
Reputational risk
Refer pages 58 to 67 for more details Refer pages 70 to 77 for more details Refer pages 248 to 271 for more details
during the latter part of year 2019 as a result of the change in the government. The new Committee will evaluate its performance as has been the practice.
The Committee wishes to draw attention to the fact that none of the members currently serving on the Committee were present during the period covered by this report, i.e., the year ended 31 December 2019. The report, therefore, is based on records, the authenticity of which has been verified and established beyond doubt. The present Committee, therefore, is completely convinced that this report is accurate and free of material misstatements.
Manohari Abeysekera ChairpersonBoard Audit Committee
24 March 2020Colombo

Governance Financial Reports Supplementary Information
237Annual Report 2019 │ National Savings Bank
Report of the Board Human Resource and Remuneration Committee
Composition of the committee
In 2019
During the year under review, the Board Human Resource and Remuneration Committee comprised the following Non-Executive Directors:
Mr R M P Rathnayake,Chairman/ Non-Independent Non-Executive Director (until his resignation from the Board of National Savings Bank on 19 February 2019)
Dr D ShanmugasundaramMember/Independent Non-Executive Director (until his resignation from the Committee on 14 March 2019)
Mr U G R Ariyaratne Member/Independent Non-Executive Director (until his resignation from the Committee on 14 March 2019)
Pursuant to the resignation of Mr R M P Rathnayake, Dr D Shanmugasundaram and Mr U G R Ariyaratne, the Committee comprised of the following Non-Executive Directors:
Mr H N J ChandrasekeraChairman/Non-Independent Non-Executive Director (until his resignation from the Board of National Savings Bank on 25 November 2019)
Mr Ajith PathiranaMember/Non-Independent Non-Executive Director (until his resignation from the Board of National Savings Bank on 2 December 2019)
Mr Anil Rajakaruna Member/Non-Independent Non-Executive Director (until his resignation from the Board of National Savings Bank on 5 December 2019)
Brief profiles of the members of the Board Human Resource and Remuneration Committee during 2019 are given on pages 201 to 203 under the Corporate Governance Report.
In 2020
The Board of the Bank was reconstituted in January 2020 with the change that took place in the Government and the Board has decided to reconstitute the Board Human Resource and Remuneration Committee as follows:
Ms Keasila Jayawardana Chairperson/Non-Independent Non-Executive Director
Dr Thiran De Silva Member/Non-Independent Non-Executive Director
Mr U G R AriyaratneMember/Non-Independent Non-Executive Director
Profiles of the above members are given on pages 176 to 179.
The Board Human Resource and Remuneration Committee (BHRRC) constituted in terms of the provisions of Section 3 (6) (i) and (iii) of Banking Act Direction No. 12 of 2007 issued by the Monetary Board of the Central Bank of Sri Lanka (CBSL)
under Section 76 J (1) of the Banking Act No. 30 of 1988, as amended. The Committee reports directly to the Board of Directors.
Regular attendees by invitation
The General Manager/CEO provides information to the Committee and attends all meetings of the Committee, except when matters relating to the General Manager/CEO are being discussed.
The Assistant General Manager (Human Resource Development) and Senior Management of the Bank participated the meetings by invitation on a need basis.
Secretary to the committee
The Board Secretary functions as the Secretary to BHRRC.
Meetings
The Committee meetings are held quarterly however based on the needs, meetings are being fixed accordingly 13 meetings were held during the year 2019 and quorum of the Committee is two as per the Charter of the BHRRC
Attendance of the Committee members during the year are as follows:
Name Eligibleto attend
Attended
Mr R M P Rathnayake 01 01Dr D Shanmugasundaram 01 01Mr U G R Ariyaratne 01 00Mr H N J Chandrasekera 12 12Mr Anil Rajakaruna 12 11Mr Ajith Pathirana 12 08

Governance Financial Reports Supplementary Information
238 National Savings Bank │ Annual Report 2019 Report of the Board Human Resource and Remuneration Committee
Charter of the BHRRC
The Board Human Resource and Remuneration Committee (BHRRC) constituted in terms of the provisions of Section 3 (6) (i) and (iii) of Banking Act Direction No. 12 of 2007 issued by the Monetary Board of the Central Bank of Sri Lanka (CBSL) under Section 76 J (1) of the Banking Act No. 30 of 1988, as amended. The Committee reports directly to the Board of Directors and the proceedings of committee meetings have been regularly reported to the Board of Directors.
The Role and Responsibilities of the Committee as per the Charter includes the followings:
The Committee is responsible for determining the remuneration policy (salaries, allowances and other financial payments) relating to the General Manager/CEO and Key Management Personnel of the Bank other than the remunerations determined by the Collective Agreement.
The Committee set goals and targets for General Manager/CEO and the Key Management Personnel. Further, evaluated the performance of the General Manager/CEO and Key Management Personnel against the set targets and goals periodically and determine the basis for revising remuneration, benefits and other payments of performance-based incentives.
The Committee reviewed all significant Human Resource Policies, initiatives, salary structures besides terms and conditions relating to staff
at senior executive level. In this process, necessary information and recommendations were obtained from the General Manager/CEO and the Senior Management of the Bank.
Activities during the year 2019
Important activities attended and carried out by the Committee during the year 2019 were as follows:
z Evaluation of Key Performance Indicators (KPI) of Key Management Personnel (KMPs) for 2018 (General Manager/CEO, Senior DGM, all DGMs, all Consultants, Compliance Officer and all AGMs).
z Reviewed the recruitment, promotion and upgrading of staff based on the requirement of the Bank.
z Revisited and provided a value addition to staff welfare benefit scheme of the Bank.
z Consideration of appeals submitted by staff on HR-related matters.
z Reviewed the effect of punishment on staff promotions.
z Review of recruitment methodology. z Recruitment of Trainees.
Focus for 2020 and beyond z Continue to assure the Bank is
maintaining the relevance of Remuneration Policy.
z Continue to focus on development of human resource strategy to inculcate an engaged employee culture
z Meeting the responsibilities of the Charter.
Committee evaluation
Committee annually conducted an evaluation of the effectiveness of the Committee and results are communicated to the Board. However, in respect of year 2019, an evaluation about the Committee has not been conducted consequent to the changes that took place in the Board during the latter part of year 2019 as a result of the change in the government. The new Committee will evaluate its performance as has been the practice.
The Committee wishes to draw attention to the fact that none of the members currently serving on the Committee were present during the period covered by this report, i.e., the year ended 31 December 2019. The report, therefore, is based on records, the authenticity of which has been verified and established beyond doubt. The present Committee, therefore, is completely convinced that this report is accurate and free of material misstatements.
Kesila Jayawardena ChairpersonBoard Human Resource and Remuneration Committee
24 March 2020Colombo
Board Human Resource and Remuneration Committee
Strategic drivers Stakeholders Material risks
Heightening customer experience Customers Strategic riskEnhancing employee engagement Employees Operational riskLeading by example Shareholders Reputational riskPromoting organic growth Regulatory bodies and GovernmentReinforcing risk culture
Refer pages 58 to 67 for more details Refer pages 70 to 77 for more details Refer pages 248 to 271 for more details

Governance Financial Reports Supplementary Information
239Annual Report 2019 │ National Savings Bank
Report of the Board Nomination Committee
Composition of the committee
The Board appointed Nomination Committee (BNC) comprises of the three Non-Executive Directors.
In 2019
During the year under review, the BNC comprised the following Non-Executive Directors:
Mr Anil Rajakaruna Chairman/Non-Independent Non-Executive Director (until his resignation from the Board of National Savings Bank on 5 December 2019)
Mr U G R AriyaratneMember/Non-Independent (Independent until 24 October 2019) Non-Executive Director
Dr D Shanmugasundaram Member/Independent Non-Executive Director (until his resignation from the Board of National Savings Bank on 9 April 2019)
Mr Nazri NizarMember/Independent Non-Executive Director (from 29 July 2019 to 29 August 2019)
Mr Ajith PathiranaMember/Non-Independent Non-Executive Director (until his resignation from the Board of National Savings Bank on 2 December 2019)
Brief profiles of the members of the Board Nomination Committee during 2019 are given on pages 201 to 203 under the Corporate Governance Report.
In 2020
The Board of the Bank was reconstituted in January 2020 with the change that took place in the Government and the Board has decided to reconstitute the Committee as follows:
Mr U G R Ariyaratne Chairman/Non-Independent Non-Executive Director
Dr Thiran De Silva Member/Non-Independent Non-Executive Director
Dr M K C Senanayake Member/Non-Independent Non-Executive Director
Profiles of the above members are given on pages 176 to 179.
Regular attendees by invitation
The General Manager/CEO provide information to the Committee and attends meetings of the Committee on invitation.
Secretary to the committee
The Secretary to the Board, functions as the Secretary to the BNC also.
Meetings
During the final year ended 31 December 2019 five Nomination Committee meetings were held and quorum of the Committee is two-thirds as per the charter of the BNC.
Attendance of the Committee members during the year are as follows:
Name Eligibleto attend
Attended
Mr Anil Rajakaruna 05 05Mr U G R Ariyaratne 05 05Dr D Shanmugasundaram 02 02Mr Nazri Nizar 01 00Mr Ajith Pathirana 01 01

Governance Financial Reports Supplementary Information
240 National Savings Bank │ Annual Report 2019 Report of the Board Nomination Committee
Charter of the committee
The Board of Directors has established the Board Nomination Committee (BNC) in compliance with the Banking Act Direction No. 12 of 2007, Corporate Governance for Licensed Specialised Banks in Sri Lanka issued by the Monetary Board of the Central Bank of Sri Lanka under section 76 J (1) of the Banking Act No. 30 of 1988 as amended, to ensure Board oversight and control over selection of Key Management Personnel.
Role and responsibilities of the committee
The Board Nomination Committee is responsible for implementing a procedure to select/appoint General Manager/CEO and Key Management Personnel, setting out criteria such as qualifications, experience and key attributes required for eligibility to be considered for appointment or promotion to the post of General Manager/CEO and the Key Management Positions.
Further, the Committee shall ensure that the Directors, General Manager/CEO and Key Management Personnel are fit and proper persons to hold office specified in the criteria given in Direction 3 (3) and as set out in the Statutes. The Committee shall also consider and recommend from time to time, the requirements of additional/new expertise and succession arrangements for retiring Key Management Personnel.
Activities during the year 2019
Important activities attended and carried out by the Committee during the year were as follows:
z Review and approval for proposed Cadre for the Bank – 2019
z Review the Succession Plan of the Bank – 2020
z Interviews for posts of Special Grades in banking and non-banking streams, and Key Management Personnel (KMPs) (initiate interviews for posts of Assistant General Managers- Special Grade)
z Evaluation of Directors’ Self-Assessment Scheme for the year 2018.
Focus for 2020 and beyond z Continuous monitoring of review
on matters relating to KMPs and adherence to the compliance on regulatory requirements
z Continuous monitoring of the succession plan and the Bank’s adherence.
z Meeting the responsibilities of the Charter
Committee evaluation
Committee annually conducted an evaluation of the effectiveness of the Committee and results are communicated to the Board. However, in respect of year 2019, an evaluation about the Committee has not been conducted consequent to the changes that took place in the Board during the latter part of year 2019 as a result of the change in the government. The new Committee will evaluate its performance as has been the practice.
U G R Ariyaratne Chairman Board Nomination Committee
24 March 2020Colombo
Board Nomination Committee
Strategic drivers Stakeholders Material risks
Promoting organic growth Shareholders Strategic riskLeading by example Regulatory bodies and Government Reputational riskReinforcing risk culture
Refer pages 58 to 67 for more details Refer pages 70 to 77 for more details Refer pages 248 to 271 for more details

Governance Financial Reports Supplementary Information
241Annual Report 2019 │ National Savings Bank
Report of the Board Integrated Risk Management Committee
Composition of the committee
In 2019
During the year under review, the Board Integrated Risk Management Committee (BIRMC) comprised three Non-Executive Directors.
The following members functioned as members of BIRMC for the year 2019:
Board members:
Mr P Algama Chairman/Non-Independent Non-Executive Director
Mr U G R AriyaratneMember/Non-Independent (Independent until 24 October 2019) Non-Executive Director
Dr D Shanmugasundaram Member/Independent Non-Executive Director (until his resignation from the Board of National Savings Bank on 9 April 2019)
Mr Anil Rajakaruna Member/Non-Independent Non-Executive Director (until his resignation from the Board of National Savings Bank on 05 December 2019)
Non-Board members:
General Manager/CEOChief Risk Officer
Brief profiles of the members of the Board Integrated Risk Management Committee during 2019 are given on pages 201 to 203 under the Corporate Governance Report.
In 2020
The Board of the Bank was reconstituted in January 2020 with the change that took place in the Government and the Board has decided to reconstitute the Committee as follows:
Dr M K C Senanayake Chairman/Non-Independent Non-Executive Director
Ms Manohari Abeysekera Member/Non-Independent Non-Executive Director
Profiles of the above members are given on pages 176 to 179.
Regular attendees by invitation
The Committee requested other DGMs, AGMs, Compliance Officer, and Chief Managers to be present at the meetings as and when required.
Secretary to the committee
The Secretary to the Board, functions as the Secretary to the BIRMC.
Meetings
BIRMC meets on a quarterly basis however based on the needs, meetings are being fixed accordingly. During the year 2019, NSB convened four meetings and minimum quorum of the Committee is two-thirds as per the charter of the BIRMC.
Attendance of the Committee members during the year are as follows:
Name Eligibleto attend
Attended
Mr P Algama 04 02Mr U G R Ariyaratne 04 04Dr D Shanmugasundaram 01 01Mr Anil Rajakaruna 01 01

Governance Financial Reports Supplementary Information
242 National Savings Bank │ Annual Report 2019 Report of the Board Integrated Risk Management Committee
Charter of the committee
The Board of Directors has established the Board Integrated Risk Management Committee (BIRMC) in compliance with the Banking Act Direction No. 12 of 2007, Corporate Governance for Licensed Specialised Banks in Sri Lanka, issued by the Monetary Board of Central Bank of Sri Lanka under the power vested in the Monetary Board, in terms of the Banking Act No. 30 of 1988.
The Terms of Reference set out by the Board of Directors, includes the following:
z To assist the Board of Directors in fulfilling its responsibilities relating to risk management and establishing an effective risk management framework.
z To implement the Integrated Risk Management Policy and other risk-related policies approved by the Bank and periodic updating of the Bank-wide Risk Management Framework.
z Ensure that all credit, market, operational and strategic risks faced by the Bank are identified, measured, monitored, and managed adequately.
z To work with Key Management Personnel very closely on all critical risk areas and make suitable recommendation to the Board within the framework of the authority and responsibility assigned to the Committee.
z Identify, review, report and recommend on risk of new operational developments and compliance related to those concerns.
z Review implementation and compliance with the Basel III directions issued by CBSL.
The Committee reviews policies, reports and proposals on risk and compliance related to the Bank. BIRMC grants approval for proposals within its mandate and recommends proposals/reports to the Board of Directors which required to be scrutinised by the Board.
Respective chapter/segment on risk management presents detailed introduction over risk management functions of the Bank and its significance. BIRMC is supported by Risk Management, Compliance Divisions and other operational divisions in discharging its responsibilities.
Activities during the year 2019
The Committee assesses all main risks such as Operational, Credit, Market, Liquidity etc., which can adversely affect to the Bank. It maintains close relationship with the Key Management Personnel and the Board to fulfil its statutory, fiduciary and regulatory responsibilities for risk management.
Effectiveness of the risk management process is annually audited by the Internal Audit Division of the Bank.
Important activities attended and carried out by the Committee during the year were as follows:
z Review of reports on Risk Appetite of the Bank, Tolerance Limits and other reports highlighting different aspects of risk of the Bank (i.e. credit risk, market risk, liquidity risk, operational risk, HR risk, technical risk, cybersecurity risk etc.)
z Review of different risk limits and grant necessary approvals.
z Reviewing of adequacy of measures and standards maintained by the Bank to meet internationally-recognised norms in the industry, regulations/guidelines of the regulator-Central Bank of Sri Lanka and Internal Capital Adequacy Assessment Process (ICAAP) in line with audit concerns on ICAAP document.
z Follow-up progress of rectification process of supervisory concerns raised by the Central Bank of Sri Lanka at their examination.
z Review periodic reports on Related Party Transactions, key issues of the Bank such as financial frauds, Fraud Risk Management – Whistle Blowing Policy.
z Review of compliance assessments on Bank and its core functions such as pawning, credit, human resource management, maintaining KYC (Know Your Customer) requirement etc.
z Continuous monitoring and review over status of Banks compliance with Basel III standards.
z Annual review of Compliance Programme and Compliance Manual.
Focus for 2020 and beyond z Continue to focus on macro and micro
environmental factors, markets, local and international risk factors.
z Continuous oversight on the implementation of risk and compliance strategy of the Bank
z Assessment of the local as well as international trends in the area of risk management.
z Continuous oversight on being a cyber resilient bank in the journey towards digitalisation.
z Continue to focus on evolving regulatory requirements according to the trends in the market and the Bank’s approach to risk management and compliance.
Committee evaluation
Committee annually conducted an evaluation of the effectiveness of the Committee and results are communicated to the Board. However, in respect of year 2019, an evaluation about the Committee has not been conducted consequent to the changes that took place in the Board during the latter part of year 2019 as a result of the change in the government. The new Committee will evaluate its performance as has been the practice.

Governance Financial Reports Supplementary Information
243Annual Report 2019 │ National Savings BankReport of the Board Integrated Risk Management Committee
The Committee wishes to draw attention to the fact that none of the members currently serving on the Committee were present during the period covered by this report, i.e., the year ended 31 December 2019. The report, therefore, is based on records, the authenticity of which has been verified and established beyond doubt. The present Committee, therefore, is completely convinced that this report is accurate and free of material misstatements.
Dr M K C Senanayake ChairmanBoard Integrated Risk Management Committee
24 March 2020Colombo
Board Integrated Risk Management Committee
Strategic drivers Stakeholders Material risks
Heightening customer experience Customers Credit riskEnhancing employee engagement Employees Market riskReinforcing risk culture Shareholders Operational riskPromoting organic growth Regulatory bodies and Government Liquidity riskLeading by example Suppliers and Service Providers Reputational risk
Society and Environment Strategic risk
Refer pages 58 to 67 for more details Refer pages 70 to 77 for more details Refer pages 248 to 271 for more details

Governance Financial Reports Supplementary Information
244 National Savings Bank │ Annual Report 2019
Report of the Board Credit Committee
Composition of the committee
The Board Credit Committee (BCC) comprised three Non-Executive Directors.
In 2019
During the year under review, the BCC comprised the following Non-Executive Directors:
Mr H N J ChandrasekeraChairman / Non-Independent Non-Executive Director (until his resignation from the Board of National Savings Bank on 25 November 2019)
Mr Ajith PathiranaMember/Non-Independent Non-Executive Director
Mr Anil Rajakaruna Member/ Non-Independent Non-Executive Director (until his resignation from the Committee on 29 July 2019)
Mr U G R AriyaratneMember/Non-Independent (Independent until 24 October 2019) Non-Executive Director
Brief profiles of the members of the Board Credit Committee during 2019 are given on pages 201 to 203 under the Corporate Governance Report.
In 2020
The Board of the Bank was reconstituted in January 2020 with the change that took place in the Government and the Board has decided to reconstitute the Committee as follows:
Ms Keasila Jayawardena Chairperson/Non-Independent Non-Executive Director
Mr Eranga Jayewardene Member/Independent Non-Executive Director
Ms Manohari Abeysekera Member/Non-Independent Non-Executive Director
Profiles of the above members are given on pages 176 to 179.
Regular attendees by invitation
General Manager/CEO, DGM (Credit) and DGM (Operations) attended meetings during the year as invitees.
Secretary to the committee
The Secretary to the Board, functions as the Secretary to the BCC.
Meetings
During the financial year ended 31st December 2019 seven BCC meetings were held. The quorum for a meeting is two members.
Attendance of the Committee members during the year are as follows:
Name Eligibleto attend
Attended
Mr H N J Chandrasekera 07 07Mr Ajith Pathirana 07 06Mr Anil Rajakaruna 03 03Mr U G R Ariyaratne 04 04

Governance Financial Reports Supplementary Information
245Annual Report 2019 │ National Savings BankReport of the Board Credit Committee
Charter of the committee
The Board of Directors has established the Board Credit Committee (BCC) in compliance with the Banking Act Direction No 12 of 2007, Corporate Governance for Licensed Specialised Banks in Sri Lanka issued by the Monetary Board of the Central Bank of Sri Lanka under Section 76 J (1) of the Banking Act No. 30 of 1988 as amended and National Savings Bank Act No. 30 of 1971 as amended, to conduct periodic reviews on the Credit Policy and Investment Policy of the Bank as and when required, and to engage in approving of credit facilities and investments within the limits delegated to.
Roles and responsibilities of the committee
Reviews and recommends the Banks strategic objectives with respect to credit and investment including policies, procedures and other related policy level documents.
Assists the Board of Directors through efficient and effective management relating to Credit Policy and Investment Policy of the Bank in order to promote and reinforce a sound, robust and healthy credit risk acceptance and management culture.
Approves and advises on the pricing of Loans and Advances and Investments in accordance with the recommendations by Assets and Liability Management Committee (ALCO).
Ensuring implementation of appropriate systems to manage risks and strengthen internal controls and management information systems with respect to credit aspect of the Bank.
Activities during the year 2019
The Committee approved the credit and investment proposals and other specific reports which prerequisite the approval of the Board in line with the lending and investment policies and credit risk appetite of the Bank in order to ensure the efficient and effective performance over the credit and investment direction of the Bank.
Focus for 2020 and beyond z Maintaining a healthy credit book and
investment book while enabling the risk appetite.
z Proactive risk management strengthen internal controls and management information systems with respect to credit aspects of the Bank.
z Continuous monitoring on the adherence to Board approved limits
Committee evaluation
Committee annually conducted an evaluation of the effectiveness of the Committee and results are communicated to the Board. However, in respect of year 2019, an evaluation about the Committee has not been conducted consequent to the changes that took place in the Board during the latter part of year 2019 as a result of the change in the government. The new Committee will evaluate its performance as has been the practice.
The Committee wishes to draw attention to the fact that none of the members currently serving on the Committee were present during the period covered by this report, i.e., the year ended 31st December 2019. The report, therefore, is based on records, the authenticity of which has been verified and established beyond doubt. The present Committee, therefore, is completely convinced that this report is accurate and free of material misstatements.
Ms Keasila Jayawardena ChairpersonBoard Credit Committee
24 March 2020Colombo
Board Credit Committee
Strategic drivers Stakeholders Material risks
Heightening customer experience Customers Strategic riskPromoting organic growth Shareholders Credit riskLeading by example Regulatory bodies and GovernmentReinforcing risk culture
Refer pages 58 to 67 for more details Refer pages 70 to 77 for more details Refer pages 248 to 271 for more details

Governance Financial Reports Supplementary Information
246 National Savings Bank │ Annual Report 2019
Report of the Board Information Technology Strategy Committee
Composition of the committee
The Board Information Technology Strategy Committee (BITSC) comprised three Non-Executive Directors.
In 2019
During the year under review, the BITSC comprised the following Non-Executive Directors:
Mr H N J ChandrasekeraChairman/Non-Independent Non-Executive Director (until his resignation from the Board of National Savings Bank on 25 November 2019) Mr U G R AriyaratneMember/Non-Independent (Independent until 24 October 2019) Non-Executive Director
Mr Nazri NizarMember/Non-Independent (Independent until 24 October 2019) Non-Executive Director (until his resignation from the Board of National Savings Bank on 20 November 2019)
Brief profiles of the members of the Board Information Technology Strategy Committee during 2019 are given on pages 201 to 203 under the Corporate Governance Report.
In 2020
The Board of the Bank was reconstituted in January 2020 with the change that took place in the Government and the Board has decided to reconstitute the Committee as follows:
Dr Thiran De Silva Chairman/Non-Independent Non-Executive Director
Mr Eranga Jayewardene Member/Independent Non-Executive Director
Ms Manohari Abeysekera Member/Non-Independent Non-Executive Director
Profiles of the above members are given on pages 176 to 179.
Regular attendees by invitation
The General Manager/CEO provide information to the Committee and attends meetings of the Committee on invitation.
Secretary to the committee
The Secretary to the Board, functions as the Secretary to the BITSC also.
Meetings
During the financial year ended 31 December 2019, three BITSC meetings were held and quorum of the Committee is two-thirds as per the charter of the BITSC.
Attendance of the Committee members during the year are as follows:
Name Eligibleto attend
Attended
Mr H N J Chandrasekera 03 03Mr U G R Ariyaratne 03 01Mr Nazri Nizar 03 02

Governance Financial Reports Supplementary Information
247Annual Report 2019 │ National Savings BankReport of the Board Information Technology Strategy Committee
Charter of the committee
The Board of Directors of the Bank has established the Board Information Technology Strategy Committee (BITSC) in compliance with the Banking Act Direction No. 12 of 2007, Corporate Governance for Licensed Specialised Banks in Sri Lanka issued by the Monetary Board of the Central Bank of Sri Lanka under section 76 J (1) of the Banking Act No. 30 of 1988 as amended.
The BITSC was established in order to ensure the Banks reliance over Information Technology and oversee the Bank’s strategic objectives in accordance with the Information and Communication Technology (ICT).
Role and responsibilities of the Committee
Establish and review Information Technology Governance Framework to ensure leadership support, organisational structure and Bank’s IT process, value delivery, IT risk management, resource management and performance management.
Ensure adequacy and effectiveness of Business Continuity Management and Disaster Recovery of Information Communication Technology Systems of the Bank.
Ensure adequacy and effectiveness of Information Systems Security according to CBSL directions and international best practices.
Activities attended by the committee during the year 2019
The Committee approved policies and procedures in order to enhance information technology infrastructure, enabling the banking functions more linked with the emerging technologies to ensure efficient and effective implementation over the strategies of the Bank. Moreover, the Committee foresees the need of customer’s data protection and ensures all necessary policies and procedures have been taken against the information security.
Focus for 2020 and beyond z Continuous focus to stay ahead of
the cybersecurity related matters. z Maintenance of IT Governance
Framework as a core function of strength
z Continuous scanning of innovations and agility in the market to defense against disintermediation and position on growth.
Committee evaluation
Committee annually conducted an evaluation of the effectiveness of the Committee and results are communicated to the Board. However, in respect of year 2019, an evaluation about the Committee has not been conducted consequent to the changes that took place in the Board during the latter part of year 2019 as a result of the change in the government. The new Committee will evaluate its performance as has been the practice.
The Committee wishes to draw attention to the fact that none of the members currently serving on the Committee were present during the period covered by this report, i.e., the year ended 31 December 2019. The report, therefore, is based on records, the authenticity of which has been verified and established beyond doubt. The present Committee, therefore, is completely convinced that this report is accurate and free of material misstatements.
Dr Thiran De Silva Chairman Board Information Technology Strategy Committee
24 March 2020Colombo
Board Information Technology Strategy Committee
Strategic drivers Stakeholders Material risks
Heightening customer experience Customers Strategic riskReinforcing risk culture Employees Reputational riskPromoting organic growth Shareholders Operational riskLeading by example Regulatory bodies and Government
Refer pages 58 to 67 for more details Refer pages 70 to 77 for more details Refer pages 248 to 271 for more details

Governance Financial Reports Supplementary Information
248 National Savings Bank │ Annual Report 2019 Risk Management
Risk Management
Risk management is about understanding the uncertainties and developing strategies to minimise impact on the achievement of objectives or to derive benefits from them. With the technological advancement, shifting societal expectations, competitive landscape, increased regulatory oversight and uncertain macroeconomic conditions resulting from natural, geopolitical and health consequences in the environment, banks are increasingly exposed to greater levels of uncertainty and therefore require innovative and robust risk management practices.
The scope of risk management is not limited to NSB, but also extends to the fully-owned subsidiaries, NSB Fund Management Company and Sri Lanka Savings Bank which was acquired during the year. This report mainly elaborates risk management in the Bank considering the materiality
of the Bank's operation in the NSB Group (Bank contributes 98.5% to consolidated assets and 92.8% to consolidated capital).
As Sri Lanka’s largest state-owned savings bank, the Board and Management understands that effective risk management is important to the financial well-being of our customers and the broader economy. Thus, the Bank’s overall objective is to manage these risks in a manner that balances serving the interests of its customers and government on one hand and solvency on the other hand.
Risk governance
Bank is committed to ensure that its risk management practices reflect a high standard of governance. This enables the Board and the Senior
Management to effectively and prudently undertake risk-taking activities. The Board operates as the highest level in the governance framework.
Board, through the risk oversight role ensures that Senior Management has established an integrated framework to manage various risk exposures and to ensure internal policies are appropriately established and complied with.
Board Integrated Risk Management Committee (BIRMC) assists the Board in fulfilling its risk related responsibilities to recommend an effective risk management framework to the Board. Key purposes of BIRMC are to establish risk appetite, evaluate the risk profile against risk appetite and recommend the Internal Capital Adequacy Assessment Process (ICAAP).
Risk Governance at the Board level is supported by following key documentary components:
Risk Governance at
Board Level
Risk Management Policy framework documents the Risk Management approach and describes how the Bank ensures comprehensive management of risks across the Bank to support achieving its strategic objectives. Risk management policy framework consists of the following: Intergrated Risk Management Policy, Credit Risk Management Policy, Market and Liquidity Risk Management Policy, Operational Risk Management Policy, Risk Management Disclosure Policy, Stress Testing Policy, ICAAP Policy.
Risk Management Policy Framework
RAS articulates the types and degree of risk the Bank is prepared to accept (Risk Appetite) and the level of risk that the Bank must operate within (Risk Tolerances).
Risk Appetite Statement (RAS)
SBP summairses the Bank’s approach to achieve its strategic objectives. The Plan has a rolling three-year duration and reflects material risks arising in the process of implementation.
Strategic Business Plan (SBP)
Figure 1: Risk governance supportive documents

Governance Financial Reports Supplementary Information
249Annual Report 2019 │ National Savings BankRisk Management
The policies and practices used by the Bank to manage risks are typically debated by the Board Audit Committee (BAC). It monitors the effectiveness and efficiency of internal control processes and internal audit function. BAC ensures integrity of information, usage of appropriate accounting policies and monitor legal and regulatory compliance issues.
Senior Management has taken steps to improve the rigour of governance over both financial and non-financial risks by establishing Management Committee framework focusing on identifying and understanding existing and emerging risks, trends and issues across all the business lines providing better insights to informed decision making.
Credit Committee (CC), Asset and Liability Management Committee (ALCO) and Investment Committee (IC) manage and monitor the key financial risks whereas Operational Risk Management Committee (ORMC), and Information Security Committee (ISC)
monitor the key non-financial risk areas related to information systems.
The Board has delegated responsibilities in business operations to Management Committees such as, Corporate Management Committee (CMC), Performance Review Committee (PRC), Marketing Committee (MKTC), Product Development Committee (PDC), Human Resource Committee (HRC), Action Plan Review (APR), IT Review Committee (ITRC), IT Steering Committee (ITSC), Branch Operations Steering Committee (BOSC), Corporate Procurement Committee (CPC), Executive Procurement Committee (EPC) and Corporate Social Responsibility and Sustainability Committee (CSRSC).
Risk Management Division (RMD) headed by the Chief Risk Officer (CRO)participates in BIRMC and Management Committees. RMD consists of three units namely, Credit Risk Management Unit (CRMU), Market Risk Management Unit (MRMU)/Treasury Middle Office (TMO) and Operational Risk Management Unit (ORMU). RMD
independently monitors all risks against the Board approved policies, processes and limits. Independent findings from risk evaluations are reported to Management Committees, BIRMC and Board to facilitate in managing risks and to take preventive & corrective actions.
Compliance Division headed by the Compliance Officer is committed to ensure adherence to all provisions and guidelines applicable. The Division is duly updated of the changing compliance environment and follows up with relevant divisions/branches to ensure that the new directions are properly communicated among relevant staff members.
Information Security Division (ISD) headed by Chief Information Security Officer is responsible for planning, directing and coordinating the Bank's information security policies, setting procedures and guidelines to ensure that all information systems are functional, secure and safeguarded throughout the Bank and are in compliance with privacy and customer trust.
Board of Directors Approve overall Risk Appetite
CC ALCO ORMC IC ISC
GM/CEOMonitor and manage the risk adjusted performance
RMDRisk assessment,
reporting and control
ISDInformation Security
ComplianceEnsure adherence to applicable
regulations and guidelines
Board Integrated Risk Management Committee
• Formulate risk appetite framework• Review the overall risk profile• Approve the risk management framework• Approve ICAAP
Internal AuditAssess the adequacy and effectiveness of the control framework and the management assurance process
Board of Directors
• Consider the adequacy and effectiveness of control framework
• Review the report on control issues
Ass
uran
ceB
oard
ove
rsig
htR
isk
adju
sted
per
form
ance
Figure 2: Risk management governance structure

Governance Financial Reports Supplementary Information
250 National Savings Bank │ Annual Report 2019 Risk Management
Risk management framework
Sound corporate governance principles coupled with the ‘Three Lines of Defence Model’ are entrenched to risk management framework of the Bank. Risk management framework enables appropriate development and implementation of strategies, policies and procedures for identifying, assessing, measuring, mitigating monitoring and reporting risk to ensure
prudent risk management. Ownership and responsibility for risk management lies with all individuals engaged in business operations.
The Three Lines of Defense model places accountability for risk ownership. This model recognises that the business is in a best position to make optimal long-term risk-reward decisions that consider the full end-to-end value chain. Risk and Compliance functions provide the guidance, advice and assurance
for the business owners accountable for decision-making to manage the risk, while Audit provides independent assurance to the Board, regulators and other stakeholders of the effectiveness of risk management, internal controls and governance.
Regulators and External Auditors provide valuable inputs to strengthen internal controls and risk management framework, which is an additional assurance to the stakeholders.
Senior Management
Board/Board Subcommittees
First Line of Defence
Business UnitesBranches/operational divisions are accountable for identifying/addressing the risks in their respective business areas to operate within a sound control environment.
All staff members attached to branches/operational divisions are aware/responsible for the risks taken and to abide by the internal controls/risk management practices.
Second Line of Defence
Risk Management, Compliance and Information SecurityRMD as the risk oversight division engages in formulating risk management policy framework, risk aggregation, escalation and risk reporting.
Compliance Division focuses on overseeing compliance with laws, rules and regulations applicable to the business operations.
ISD ensures the information security throughout the Bank.
(Divisions independently report to BIRMC and Board)
Third Line of Defence
Internal AuditInternal Audit Division (IAD) ensures the adequacy of internal controls, risk management functions and compliance function by conducting independent and regular audits on the implementation of risk management practices, compliance functions and internal controls.
(IAD reports the audit findings to the Board through BAC)
Ext
erna
l Aud
it
Reg
ulat
or
Figure 3: Lines of defence in risk management
Risk culture
Culture is the collection of values, skills and habits that equip employees and directors to understand the risks and make sound judgements in the absence of definitive rules, regulations or market signals. The employees at all levels understand the risk in respective business operations. Risk culture is a key driver to ensure risk and return trade off and managing of the risks and capital levels.
Risk policies and procedures
Integrated risk management policy framework and the operational level policies and procedures provide guidance to the business on the management of each material risk.
Integrated risk management policy framework summarises the principles and practices to be used by the Bank in identifying and assessing its
material risks, quantifying the risk appetite and tolerances for material risks and to clearly understand the types of risk outcomes to which the Bank is intolerant.

Governance Financial Reports Supplementary Information
251Annual Report 2019 │ National Savings BankRisk Management
Infrastructure
Risk management framework is supported by necessary systems, processes and skills required for the management of the Bank’s material risk types.
Key risk management processes in place include:
z Credit risk management solutions with Bank specific credit rating and scoring models.
z Process to assess the risk adjusted returns at transaction level and portfolio level for credit and investments.
z Market risk assessment models and middle office monitoring.
z Key Operational Risk Indicator (KORI) Indexes, Loss event data collection process and Risk and Control Self-Assessment (RCSA) process.
z ICAAP used in combination with other risk management practices (including stress testing) to understand, manage and quantify the risks. The outcomes of which are used in decision-making, strategic planning and capital planning.
Bank improves the risk management framework on an ongoing basis to strengthen evaluating, monitoring and managing of material risks assumed in the course of its operations. Risk management policies, procedures and systems of the Bank are established in line with the guidelines issued by the CBSL and the international best practices introduced by the Basel Committee.
Risk appetite
The risk appetite statement is a key component of the risk management framework. Risk appetite is the level
of risks the Bank is willing to take for achieving its objectives. It reflects the key aspects of business and stakeholder expectations.
Risk appetite is an integral element of business planning process. Risk appetite statement of the Bank enhances value by aligning business operations and risks. It facilitates the staff at business divisions to understand the level of risk they are prepared to take in pursuit of daily business operations to take decisions risk consciously.
The Bank uses top down approach in setting risk appetite at corporate level using qualitative and quantitative parameters that minimise adverse impacts to values and financial position. Quantitative risk appetite at corporate level focuses mainly on capital adequacy, liquidity, profitability and other prudential requirements.
z Track relevance and effectiveness
z Implement controls/mitigants
z Risk transfer/acceptance
z Strategic business plan and budget
z Analysis of financial and non-financial information
z Scenario analysis z Stress testing
z Articulate risk appetite statement and limits
z Quantify impact of risks
z Monitor against risk appetite and limits
z Report to Management Committees, BIRMC and Board
Identify
Control and correct
Measure
Monitor and report
Figure 4: Implementing risk appetite framework

252 National Savings Bank │ Annual Report 2019
Governance Financial Reports Supplementary Information
The qualitative statements mainly include risks for which the Bank has zero risk appetite. At business line level, risk appetite limits are by risk types namely credit, equity, interest rate, forex and operational.
Convergence of top down and bottom up approach is used at divisional and product line level to set more prudent risk appetite levels using limit structures, budgeted levels and KORIs.
Capital adequacy and leverage
Tier I Capital
Dec. 2019
Mar.2019
Jun.2019
Sep. 2019
14
13
12
11
10
9
%
Tier 1 CAR RAL RTL Trigger
Total Capital
Dec. 2019
Mar.2019
Jun.2019
Sep. 2019
18
16
14
12
10
8
%
Total CAR RAL RTL Trigger
Leverage%
Leverage ratio RAL RTL Trigger
Dec. 2019
Mar.2019
Jun.2019
Sep. 2019
6
5
4
3
2
1
Liquidity
SLAR%
SLAR RAL RTL Trigger
Dec. 2019
Mar.2019
Jun.2019
Sep. 2019
75
60
45
30
15
0
NSFR%
NSFR RAL RTL Trigger
Dec. 2019
Mar.2019
Jun.2019
Sep. 2019
200
160
120
80
40
0
LCR%
LCR RAL RTL Trigger
Dec. 2019
Mar.2019
Jun.2019
Sep. 2019
375
300
225
150
75
0
Bank’s risk appetite statement is approved by the Board of Directors on an annual basis or more frequently in the event of unexpected changes to the risk environment, with the aim of ensuring that they are consistent with the business strategy, regulatory environment and stakeholders’ expectations.
Risk Management

Governance Financial Reports Supplementary Information
253Annual Report 2019 │ National Savings BankRisk Management
Cre
dit
Op
erat
iona
l
Market
Risk Wheel
Reputational
Strategic
LiquidityLegalCompliance
Model
Outsourcing
Business disruption
Cyber risk
Theft and fraud
Commodity
Equity
Fore
ign
curr
ency
Bas
is
Yie
ld c
urve
Rep
rici
ng
Residual
Concentration
Settlement
Default
Figure 6: The risk wheel
Profitability
ROE%
ROE RAL RTL Trigger
Dec. 2019
Mar.2019
Jun.2019
Sep. 2019
20
16
12
8
4
0
ROA%
ROA RAL RTL Trigger
Dec. 2019
Mar.2019
Jun.2019
Sep. 2019
1.2
1.1
1.0
0.9
0.8
0.7
NIM%
NIM RAL RTL Trigger
Dec. 2019
Mar.2019
Jun.2019
Sep. 2019
3.2
3.0
2.8
2.6
2.4
2.2
Figure 5: Strategic level key risk indicators
The Bank is above the risk appetite limits set for the liquidity and leverage. The capital adequacy ratio is within regulatory minimum, however the Bank desires to maintain higher level of capital as a buffer to cover pillar II risks.
There is an improvement in profitability indicators against 2018, however remains below the risk appetite of the Bank. These variations in the indicators are acceptable within the specific performance.
As a result of continuous exposure to both financial and non-financial risks driven by internal and external sources such as credit, market, liquidity, operational, compliance, reputation and strategic, it is mandatory to promoting an integrated risk management framework to minimise the adverse impact on performance and the overall functions of the Bank.
Risk management framework is implemented in an integrated manner to cover a broad spectrum of emerging and existing main risks with controls and governance established for each area as appropriate.

Governance Financial Reports Supplementary Information
254 National Savings Bank │ Annual Report 2019 Risk Management
Credit risk
Credit Risk is the risk of potential financial loss arising from the inability or failure of a borrower or counterparty to meet its financial or contractual obligations to the Bank.
Credit risk to the Bank comprises counterparty default risk, concentration risk, settlement risk, and residual credit risk.
The Bank is exposed to credit risk both from on and off-balance sheet credit exposures. The maximum exposure to credit risk grew by 11.33% to Rs. 1,102.72 Bn. in 2019 which represents 95.2% of the Bank’s total assets. Loans and advances, and debt and other instruments are the major sources of credit risk to the Bank.
On and off-balance sheet exposure
A
B
A
2019
A
A
B
2018
2019%
2018%
A – On-balance sheet exposure 98.3 99.1
B – Off-balance sheet exposure 1.7 0.9
Figure 7: On and off-balance sheet exposure
As at 31 December
Maximum exposure to credit risk
2019Rs. ’000
Maximum exposure to credit risk
2018Rs. ’000
Change
%
Cash and cash equivalents 5,376,715 3,434,524 57Balances with central banks – – –
Placements with banks 12,364,469 17,588,445 (30)
Derivative financial instruments 11,622 4,740,106 (100)
Financial assets recognised through profit or loss
– measured at fair value 11,459,882 16,680,382 (31)
– designated at fair value – – –
Financial assets at amortised cost
– loans and advances 454,394,957 422,894,740 7
– debt and other instruments 615,634,321 518,947,969 19
Financial assets measured at fair value through other comprehensive income
3,478,811 6,184,430 (44)
Gross total 1,102,720,778 990,470,596 11
Table 1: Maximum credit risk exposures
Portfolio mix
B
A
2019
A
B
2018
2019%
2018%
A – Retail 63.1 58.8
B – Corporate 36.9 41.2
Figure 8: Loans and advances portfolio mix
Retail lending portfolio had given the highest contribution to the growth in loans and advances portfolio (15.29% YoY) against the negative contribution from corporate lending portfolio (-3.69% YoY). Personal loans reported the highest growth (7.47%) during the year, increasing the composition to 50.50% of the retail loan portfolio.

Governance Financial Reports Supplementary Information
255Annual Report 2019 │ National Savings BankRisk Management
Retail loan portfolio
B
C
D
2019
F
A
B
C
D
2018
FE
A
E
2019%
2018%
A – House and property loans 25.6 27.5
B – Personal loans 50.5 49.4
C – Loans against deposits 10.5 10.7
D – Pawning 11.8 11.0
E – Auto 0.1 0.1
F – Other staff loan 1.6 1.4
Figure 9: Retail lending portfolio
Corporate lending and investment exposures
A
B
CD
2019
A
B
CD
2018
2019%
2018%
A – Corporate loans – SOEs & GOSL 76.7 73.6
B – Loans to banks 10.6 13.4
C – Corporate loans – Other 6.0 6.2
D – Other instruments 6.7 6.8
Figure 10: Corporate lending portfolio
Risk review
Risk component Description Monitoring/management tools Exposure YoY change in impact*
Counterparty default risk
Possible impact due to failure of counterparties to meet contractual obligations with the Bank according to the agreed terms.
z Limit monitoring z Monitoring of early warning indicators,
NPA trends z Loan Review Mechanism (LRM) z Credit rating/scoring, stress testing
High
Concentration risk Uneven distribution of counterparties in credit to an industry sector or geographical region.
z Herfindahl – Hirschman Index (HHI) z Limit monitoring z Stress testing
Moderate
Settlement risk Possible impact due to failure of delivering on the terms of a contract at the time of settlement.
z Limit monitoring z Monitoring of early warning indicators,
NPA trends
Moderate
Residual risk Possible impact from any remaining risks after all other risks have been eliminated, hedged or otherwise accounted.
z Collateralisation z Monitoring of valuation/revaluation z Monitoring of LTV ratios
Moderate
* YoY change in impact on earnings and capital
Increase in impact No change Decrease in impact
Table 2: Credit risk review
Counterparty default risk
Counterparty default risk is the most significant element of credit risk arises from the risk that parties are unable to meet their payment obligations under agreed terms and conditions.
Credit risk management process comprises credit risk management techniques and tools formulated according to the regulations and guidelines provided by the regulator and Basel requirements. Customer due diligence, counterparty exposure limits (i.e. single borrower limits and group/sector exposure limits), internal credit scoring/rating systems, post disbursement loan monitoring and Loan Review Mechanism (LRM) are established to manage and monitor the counterparty default risk.
The Bank’s gross NPL ratio of 1.57% in 2019 is below the industry gross NPL ratio of 4.7%, however, above the NPL level of 2018 (i.e. 1.44%). According to SLFRS 9 classification, for the year 2019, the credit impaired (stage 3) loans stood at 1.99% (Rs. 9.14 Bn.) from the gross loans and advances. There are

Governance Financial Reports Supplementary Information
256 National Savings Bank │ Annual Report 2019 Risk Management
no impaired (Stage 3) debt and other instruments reported for the year. Stage 3 loan percentage over total impaired loans stood at 2.14%. Reducing the credit portfolio quality resulted in an impairment charge of Rs. 0.44 Bn. (against Rs. 1.13 Bn. in 2018) resulting a cumulative impairment allowance of Rs. 4.27 Bn. as at year end.
Age analysis of NPL
5
4
3
2
1
0
%
3 months < Special mention < 6 months (LHS) 6 months < Sub standard < 12 months (LHS) 12 months < Doubtful <18 months (LHS) 18 months < Loss (LHS) NPL ratio (RHS)
2018 20192015 2016 2017
100
80
60
40
20
0
%
Source: MIS – December 2019
Figure 11: NPL ratio and age analysis of NPL
Impairment provision
20192017 2018
3,000
2,400
1,800
1,200
600
0
35
28
21
14
7
0
Rs. Mn. %
Specific provision (Rs. Mn.) Specific provision coverage (%)
Figure 12: Provision cover
Cross border counterparties expose
the Bank to cross border risk, resulting from default honouring contractual obligations as a result of change in policies and regulations of respective countries, including the foreign currency risk exposures. Cross border credit exposure of the Bank is limited to exposure to the Maldives which represents 0.14% of total assets only.
Concentration riskConcentration risk is the risk of an adverse development in a specific single counterparty, industry sectors, product or geography leading to a disproportionate deterioration in the risk profile of the Bank’s credit exposures to that counterparty, industry sector, product or geography.
To assess the concentration in the
credit portfolio, the Bank uses the HHI. Risk Appetite Statement defines a moderate risk appetite towards sector concentration considering the business model and the contribution to achieve the development goals of the Government. The Bank monitors credit exposures against counterparty limits and the name concentrations are within the risk appetite. High geographical concentration to the Western Province is due to all large loans being booked at the head office Credit Division.
The Bank has taken measures such as monitoring portfolio concentration limits and stress testing to manage concentration risk.
Sector concentration
AB
E
C
DI
HG F
2019
AB
C
E
FG
H
DI
2018
2019%
2018%
A – Agriculture and fishing 7.2 4.9
B – Tourism 0.0 0.0
C – Transport 0.4 0.3
D – Construction 27.9 27.2
E – Financial and business services 2.5 6.2
F – Infrastructure 15.5 17.9
G – Power and energy 2.8 1.6
H – Education 8.0 8.5
I – Other customers 35.7 33.4
Figure 13: Sector concentration
Geographical concentration
A B
G
H
CD
E
F
I
2019
A B C
H
DEF
G
I
2018
2019%
2018%
A – Central Province 5.9 5.4
B – Eastern Province 2.0 1.8
C – North Central Province 3.4 3.3
D – North Western Province 6.0 5.5
E – Northern Province 2.7 2.5
F – Sabaragamuwa Province 4.3 3.9
G – Southern Province 6.3 5.3
H – Uva Province 4.0 3.7
I – Western Province 65.4 68.6
Figure 14: Geographical concentration

Governance Financial Reports Supplementary Information
257Annual Report 2019 │ National Savings BankRisk Management
Settlement risk
Settlement risk is arising from failure of the counterparty to deliver counter value, usually the underlying asset or cash value of the contract, as per the terms of the contract at the time of settlement. Settlement risk is closely associated with default risk along with any timing difference in settlement.
A comprehensive limit framework is in place to monitor counterparty settlement risk from credit and other trading transactions.
Residual credit risk
Residual credit risk is identified as remaining amount of risk after control mechanisms mitigate the inherent risks of the Bank. Risk governance framework is incorporated with strong control mechanisms to processes and procedures and risk mitigation techniques such as collateralisation subject to LTV ratio define at policy level and recovery procedures to maintain residual credit risk is within appetite level.
With the increase in composition of personal loans backed by personal guarantee, there is an increase in residual risk in credit, however 23.3% of the credit profile is backed by government guarantee and 17.0% of credit profile is backed by property mortgages.
Credit risk management
Effective management of credit risk is a critical component of a comprehensive risk management approach and essential for the long-term success of any bank.
The goal of credit risk management of the Bank is to maximise the return by safeguarding the quality of the credit portfolios.
The Bank exerts a set of risk management tools and techniques to manage the credit risk inherent at portfolio level as well as at transaction
level. Monitoring of exposures against limit framework, early warning indicators, key risk indicators are certain tools used to identify the risk areas. Credit risk policy framework, processes, guidelines, risk rating and scoring and LRM enable reducing risk in credit processes.
Risk rating and scoring
Risk rating and scoring models are used to assess the credit worthiness of the counterparties. Credit score provides a single scale score which reflects the creditworthiness of the counterparty to a specific product.
Credit rating of the Bank comprehensively assesses the obliger and facility risk and assign with a rating grade from a scale of nine internal rating grades for corporate borrowers. However, rating models are yet to be validated.
Corporate borrower rating
AC
D
B
A – Investment – 60.0%
B – Sub Investment – 10.0%
C – Default – 0.0%
D – Unrated – 30.0%
Retail borrower rating
D
A
B
CA – Investment – 37.0%
B – Sub Investment – 0.4%
C – Default – 0.0%
D – Unrated – 62.6%
Figure 15: Rating grade – corporate loan portfolio
Figure 16: Scoring grade – Retail loan portfolio
In year 2019 among property mortgage loans, 76.8% were backed by immovable property with less than 50% of LTV ratio. The property mortgages accepted as collateral are revalued based on the Bank’s policy on Valuation and Revaluation of Immovable Property developed in compliance with the CBSL directions.
Loan portfolio – Collateral wise
A – Personal guarantee – 32.3%
B – Treasury guarantee – 23.3%
C – Unsecured – 5.1%
D – Gold – 7.6%
E – Cash – 6.8%
F – Other – 6.5%G – Lease receivables – 1.4%
H – Movable property – 0.0%
I – Corporate guarantee – 0.0%
J – Immovable property – 17.0%
K – Immovable property: LTV less than 50% – 76.8%
L – Immovable property: LTV between 50%-75% –21.3%
M – Immovable property: LTV more than 75% – 2.0%
A
M
LK
CD E
FG H
IB
J
Figure 17: Collateral wise loan portfolio and LTV distribution of loans backed by immovable property

Governance Financial Reports Supplementary Information
258 National Savings Bank │ Annual Report 2019 Risk Management
LRM is used as an effective tool to mitigate credit risk by prompt identification and rectification of gaps in credit granting and documentation process throughout the Bank. This process ensures quality assurance of the credit process and the credit quality. Gaps identified are communicated to CC and BIRMC/Board for early rectification.
Market risk
Market Risk is defined as the potential to change the market value of the Bank’s trading and investment positions resulting from changes in interest rates, credit spreads, foreign exchange rates, equity prices, commodity prices and other relevant parameters, such as market volatility and market implied default probabilities. Majority of Bank’s on and off-balance sheet exposures are subject to market risk.
The Bank has no direct exposure for commodity price risk. However, changes in world commodity prices such as gold prices and crude oil prices indirectly affect the business activities of the Bank.
Unfavourable movements in interest rates, equity prices and exchange rates cause decline of market value of portfolios, actual and effective earnings and future cash flows of financial instruments.
As at 31 December 2019 Market risk measurement Primary market risk factor
Carrying amountRs. ’000
(Audited)
Trading portfolio
Rs. ’000(Audited)
Non-trading portfolio
Rs. ’000(Audited)
IRR Fx Equity
Assets subject to market risk 1,103,794,284 14,950,316 1,088,843,969Cash and cash equivalents 5,376,715 5,376,715 √ √Placements with banks 12,364,469 12,364,469 √ √Derivative financial instruments 11,622 11,622 √Financial assets measured at fair value 11,459,882 11,459,882 √ √Financial assets at amortised cost– Loans and receivables 454,394,957 454,394,957 √ √Financial assets at amortised cost– Debt and other instruments 615,634,321 615,634,321 √Financial assets measured at fair value through OCI 3,478,811 3,478,811 √
Right of used assets 1,073,507 1,073,507 √
Liabilities subject to market risk 1,107,090,079 1,107,090,079Due to banks 35,045,251 35,045,251 √Financial liabilities at amortised cost– Due to depositors 1,016,574,286 1,016,574,286 √Financial liabilities at amortised cost– Due to other borrowers 21,203,242 21,203,242 √ √Lease liability 1,066,882 1,066,882 √Debt securities issued 26,691,711 26,691,711 √Retirement benefit obligations 6,508,707 6,508,707 √
Table 3: Market risk exposure

Governance Financial Reports Supplementary Information
259Annual Report 2019 │ National Savings BankRisk Management
The Bank has a mandatory requirement to hold 60% of customer deposits in Government Securities. In the year 2019, the Bank held 60.88% of the deposits and 53.45% of total assets in Government Securities (Trading and Banking book) exposing to interest rate risk accompanied by changes in yields/interest rates.
Equity investment is relatively insignificant (0.81%) of total
investments. 33.9% of equity investments are for trading purpose and the remaining 66.1% are strategic investments. The Bank’s risk appetite to equity instruments is limited to 1% of the asset base; for the year under consideration total equity investments was 0.45% of total assets.
The Bank’s foreign currency operations include foreign currency trading, accepting foreign currency deposits
and remittances, borrowing, lending, placements and derivatives.
Risk review
Market risk of the Bank is reviewed for both trading and non-trading portfolios in terms of Interest Rate Risk, Foreign Exchange (FX) Risk and Equity Price Risk. The Bank reviews the market risk profile of the Bank using different methodologies and models.
Risk component Description Monitoring/management tools Exposure YoY change in impact*
Interest rate risk
Repricing risk The risk arises from timing differences between rate changes or cash flows from rate sensitive on and off-balance sheet assets and liabilities.
z Monitoring repricing gap limits z Limits on Rate Sensitive Assets
(RSA) and Rate Sensitive Liabilities (RSL)
High
Yield curve risk Risk of short-term rates changing by more or less than the change in long-term rates.
z Sensitivity/Stress Testing with rate shocks
High
Basis risk Risk from unequal movements in rate indices on RSAs and RSLs with the same maturity or re-pricing dates
z Sensitivity of rate shocks on RSAs and RSLs
High
Foreign exchange risk
Possible impact on earnings and capital arising from adverse changes in exchange rates arising out of maturity mismatches in Foreign Currency (FCY) positions
z Limit monitoring z FX VaR z Stress testing
Medium
Equity risk Possible losses arising from changes in equity market prices
z Limit monitoring z Equity VaR z Marking to market Fair Value
Through Profit and Loss (FVPL) and Fair Value Through Other Comprehensive Income (FVOCI) portfolio on daily basis.
Low
Commodity risk Possible negative impact on earnings due to changes in prices of commodities (Gold)
z Indirect impact on value of collateral against pawning advances
Low
* YoY change in impact on earnings and capital
Increase in impact Decrease in impact No change
Table 4: Market risk review
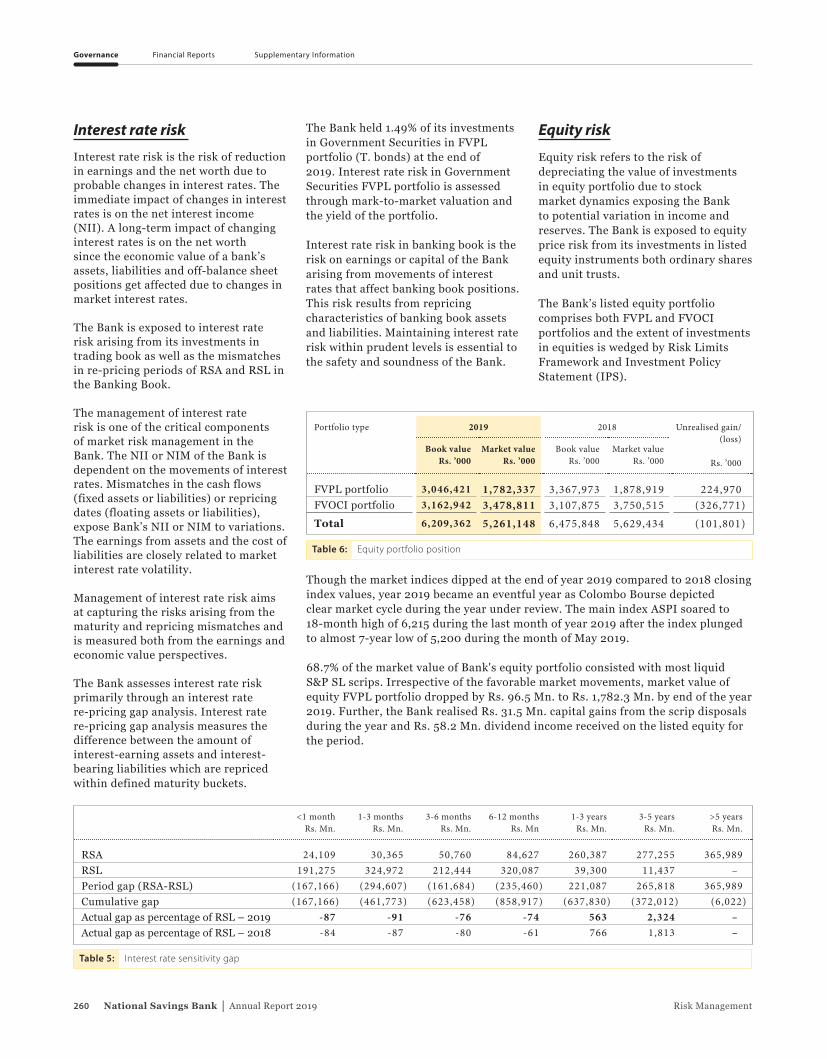
Governance Financial Reports Supplementary Information
260 National Savings Bank │ Annual Report 2019 Risk Management
Interest rate risk
Interest rate risk is the risk of reduction in earnings and the net worth due to probable changes in interest rates. The immediate impact of changes in interest rates is on the net interest income (NII). A long-term impact of changing interest rates is on the net worth since the economic value of a bank’s assets, liabilities and off-balance sheet positions get affected due to changes in market interest rates.
The Bank is exposed to interest rate risk arising from its investments in trading book as well as the mismatches in re-pricing periods of RSA and RSL in the Banking Book.
The management of interest rate risk is one of the critical components of market risk management in the Bank. The NII or NIM of the Bank is dependent on the movements of interest rates. Mismatches in the cash flows (fixed assets or liabilities) or repricing dates (floating assets or liabilities), expose Bank’s NII or NIM to variations. The earnings from assets and the cost of liabilities are closely related to market interest rate volatility.
Management of interest rate risk aims at capturing the risks arising from the maturity and repricing mismatches and is measured both from the earnings and economic value perspectives.
The Bank assesses interest rate risk primarily through an interest rate re-pricing gap analysis. Interest rate re-pricing gap analysis measures the difference between the amount of interest-earning assets and interest-bearing liabilities which are repriced within defined maturity buckets.
<1 monthRs. Mn.
1-3 months Rs. Mn.
3-6 months Rs. Mn.
6-12 months Rs. Mn
1-3 years Rs. Mn.
3-5 years Rs. Mn.
>5 years Rs. Mn.
RSA 24,109 30,365 50,760 84,627 260,387 277,255 365,989RSL 191,275 324,972 212,444 320,087 39,300 11,437 –Period gap (RSA-RSL) (167,166) (294,607) (161,684) (235,460) 221,087 265,818 365,989Cumulative gap (167,166) (461,773) (623,458) (858,917) (637,830) (372,012) (6,022)Actual gap as percentage of RSL – 2019 -87 -91 -76 -74 563 2,324 –Actual gap as percentage of RSL – 2018 -84 -87 -80 -61 766 1,813 –
Table 5: Interest rate sensitivity gap
The Bank held 1.49% of its investments in Government Securities in FVPL portfolio (T. bonds) at the end of 2019. Interest rate risk in Government Securities FVPL portfolio is assessed through mark-to-market valuation and the yield of the portfolio.
Interest rate risk in banking book is the risk on earnings or capital of the Bank arising from movements of interest rates that affect banking book positions. This risk results from repricing characteristics of banking book assets and liabilities. Maintaining interest rate risk within prudent levels is essential to the safety and soundness of the Bank.
Equity risk
Equity risk refers to the risk of depreciating the value of investments in equity portfolio due to stock market dynamics exposing the Bank to potential variation in income and reserves. The Bank is exposed to equity price risk from its investments in listed equity instruments both ordinary shares and unit trusts.
The Bank’s listed equity portfolio comprises both FVPL and FVOCI portfolios and the extent of investments in equities is wedged by Risk Limits Framework and Investment Policy Statement (IPS).
Portfolio type 2019 2018 Unrealised gain/(loss)
Rs. ’000Book value
Rs. ’000Market value
Rs. ’000Book value
Rs. ’000Market value
Rs. ’000
FVPL portfolio 3,046,421 1,782,337 3,367,973 1,878,919 224,970FVOCI portfolio 3,162,942 3,478,811 3,107,875 3,750,515 (326,771)Total 6,209,362 5,261,148 6,475,848 5,629,434 (101,801)
Table 6: Equity portfolio position
Though the market indices dipped at the end of year 2019 compared to 2018 closing index values, year 2019 became an eventful year as Colombo Bourse depicted clear market cycle during the year under review. The main index ASPI soared to 18-month high of 6,215 during the last month of year 2019 after the index plunged to almost 7-year low of 5,200 during the month of May 2019.
68.7% of the market value of Bank's equity portfolio consisted with most liquid S&P SL scrips. Irrespective of the favorable market movements, market value of equity FVPL portfolio dropped by Rs. 96.5 Mn. to Rs. 1,782.3 Mn. by end of the year 2019. Further, the Bank realised Rs. 31.5 Mn. capital gains from the scrip disposals during the year and Rs. 58.2 Mn. dividend income received on the listed equity for the period.

Governance Financial Reports Supplementary Information
261Annual Report 2019 │ National Savings BankRisk Management
Equity portfolio composition (Book value of investments)
B
C
D
2019 A
B
C
D
2018 A
2019%
2018%
A – Listed equity FVPL 47.5 50.5
B – Unit trusts 1.5 1.5
C – Listed equity FVOCI 47.3 44.6
F – Unlisted equity FVOCI 3.7 3.4
Figure 18: Equity portfolio composition (Book value of investments)
Foreign currency risk
FX risk is the possible impact on earnings and capital resulting from unanticipated and unfavourable fluctuations in exchange rates. During 2019 USD/LKR average spot rate fluctuated in the range of Rs. 174.11 - Rs. 182.95 (Source: Bloomberg). The rupee appreciation was 0.67% for the year.
During the year under review, the Bank successfully redeemed the obligation on USD 250 Mn. bond issued in 2014. The capital repayment was swapped with CBSL. The Bank successfully funded Rupee and US Dollar requirements to redeem the SWAP and the respective coupon payments during the year under review.
Further, foreign currency exposure of the Bank has increased during the year due to disbursement of corporate loans in foreign currency and USD borrowings undertaken during 2018.
<1 month
1-3 months
3-6 months
6-12 months
1-3 years
3-5 years
>5 years
Total
USD (8,238,016) 20,175,746 (884,504) (4,422,255) (11,295,167) 3,060,000 2,553,000 948,804
EURO 6,037,904 2,388,134 1,208,851 (368,919) – – – 9,265,971
GBP 97,123 1,871,170 940,169 (2,439,013) – – – 469,448
SGD 2,633 – – – – – – 2,633
AUD (2,977) 2,383,985 2,276,544 (4,079,316) – – – 578,236
JPY 74,795 – – – – – – 74,795
CHF 3,791 – – – – – – 3,791
Table 7: Currency wise maturity gaps for FX operations
FX risk is associated with the unhedged positions in all the foreign currencies. Bank, under Standardised Measurement Approach allocates capital for foreign currency risk considering the Net Foreign Currency Exposure (NFCE). Net Open Position (NOP) is monitored on daily basis against internal alert limits.
During first quarter of the year, CBSL revised the NOP (long) limit for the Bank under three phases to facilitate accumulation of USD for repayments.
Daily NOP against regulatory and internal limits – 2019USD ’000
NOP Internal limit (long) Internal limit (short) Regulator limit (long) Regulator limit (short)
Jan. Dec.Nov.Oct.Sep.Aug.Jul.Jun.MayApr.Mar.Feb.
40,000
30,000
20,000
10,000
0
-10,000
Figure 19: Daily NOP against internal limits

Governance Financial Reports Supplementary Information
262 National Savings Bank │ Annual Report 2019 Risk Management
Market risk management
The Bank has taken every measure to systematically identify, measure, monitor and manage the market risk based on market risk management framework and exposures within the Board approved risk appetite.
MRMU and TMO identify market risks through portfolio and transaction analysis, limit monitoring and by using internally developed models and matrices.
Limits monitoring: The Bank has set in place a risk appetite and risk limits framework to monitor Treasury operations as a function of TMO. Risk limits comprising exposure limits, dealer limits, counterparty limits, settlement limits, etc. to capture the risks in Treasury Front Office operations. These limits are reviewed on yearly basis or occurrence of an internal or external event which changes the risk environment. Approval of the Board/BIRMC is obtained for the risk limits.
Scope of TMO/ MRMU monitoring expands to interest rates, equity prices and FX rates, against the risk limits on a daily basis and closely monitors dealers’ adherence to the market and trading best practices via dealing room voice records monitoring and operations monitoring to ensure adherence to provisions imposed under the Banking Act Directions No. 06 of 2019, Market Conduct and Practices for Treasury Operations of Licensed Banks in Sri Lanka. Exceptions if any are reported to IC, ALCO and the Board.
Value at Risk (VaR): This is a technique for estimating potential losses on risk positions as a result of movements in market rates and prices over a specified time horizon and to a given level of confidence.
The Bank calculates the Equity VaR and Fx VaR in compliance with Basel III;
for a 99% confidence level and 10 day holding period considering historical data for a period of 365 days to monitor against the risk appetite of the Bank.During the year under review, the Equity VaR remained within the risk appetite for 98.3% of the trading days. However, FX VaR has surpassed the risk appetite in 87.5% of trading days.
Equity VaR against appetite limits – 2019USD ’000
Equity VaR
Jan. Dec.Nov.Oct.Sep.Aug.Jul.Jun.MayApr.Mar.Feb.
125
100
75
50
25
0
Figure 20: Equity VaR
FX VaR – 2019USD
FX VaR
Jan. Dec.Nov.Oct.Sep.Aug.Jul.Jun.MayApr.Mar.Feb.
350,000
280,000
210,000
140,000
70,000
0
Figure 21: FX VaR

Governance Financial Reports Supplementary Information
263Annual Report 2019 │ National Savings BankRisk Management
Liquidity risk
Liquidity risk arises where the Bank fails to maintain or generate adequate liquid funds to meet on or off-balance sheet contractual and contingent financial obligations in full as they fall due or only do so at materially disadvantageous terms. The efficient management of liquidity is essential to the Bank in retaining the confidence of the customers, counterparties, regulator and other stakeholders.
The Bank has established control framework for managing liquidity risk which is designed to ensure the maintenance of sufficient amount of quality liquidity resources and a funding profile that is appropriate and adequate to meet the liquidity risk appetite.
Funding diversification by product
B
C D E
2019
A
B
CD
2018
EA
2019%
2018%
A – Savings deposits 19.9 20.2
B – Fixed deposits 72.6 65.1
C – Repo borrowings 4.0 7.5
D – US Dollar borrowings 1.1 6.6
E – Subordinated debts 2.4 0.6
Figure 22: Funding diversification by product
The Bank has access to a wider spectrum of retail deposits and other institutional deposits through its branch network and counts on that stable funding as the primary source of funds. Alternatively, the Bank has also approached low cost foreign currency borrowing opportunities.
Access to retail deposits (i.e. Savings and FDs) through island wide network of branches enables reducing funding concentration risk.
Liquidity risk management
The Bank manages liquidity within the liquidity risk management framework in compliance with respective directions of the regulator and within the risk appetite framework. Liquidity risk management ensures that the Bank has appropriate amount, diversification and tenor of liquidity to support its asset base at all times.
The Bank manages liquidity risk by following best practices aligned to Basel III requirements. RMD monitors the funding concentration of the Bank both by significant counterparty and significant product to ensure that funding diversification is maintained across products and within risk appetite.

Governance Financial Reports Supplementary Information
264 National Savings Bank │ Annual Report 2019 Risk Management
Governance Framework
Solutions and Systems
Liquidity Risk Management
and Reporting
Board oversight including approval of Risk Management Policy
Framework and frequent reviews
Oversight
Categorise portfolio positions into liquidity buckets and review
Liquidity Classification
Determine Risk Appetite Limits for Statutory and other liquidity indicators
and limit monitoring
Liquidity Limits
Regulatory reports disclosures on a periodic basis
Reporting and Disclosures
Conduct periodic reviews to assess liquidity risk management strategy, processes and liquidity positions under normal and stressed conditions
Assessment, Management and Periodic Review
25
3
4
1
Figure 23: Liquidity management process
Regulatory ratios
Statutory Liquid Asset Ratio (SLAR)and Liquidity Coverage Ratio (LCR) are monitored on a monthly basis, whereas the Net Stable Funding Ratio (NSFR) is monitored on a quarterly basis.
The Bank has successfully maintained liquidity requirements under Basel III, LCR in excess of 100% and SLAR in excess of 20% to ensure compliance with the minimum regulatory requirements. This is mainly due to the mandatory requirement to invest 60% of the deposits in Government securities.
Bank is well above the regulatory minimum for Basel III Net Stable Funding Ratio (NSFR).
December2019
%
December2018
%
RegulatoryMinimum
%
SLAR – DBU 60 55 20LCR – Rupee 278 245 100LCR – All currency 277 321 100NSFR 175 147 100
Table 9: Statutory liquidity ratios

Governance Financial Reports Supplementary Information
265Annual Report 2019 │ National Savings BankRisk Management
Flow approach
Under the flow approach, liquidity gap analysis is one of the methods used by the Bank to assess liquidity risk. Liquidity gaps are periodically calculated, monitored and used for sensitivity analysis and stress testing.
High liquidity gap in less than one-year maturity buckets can be observed; however adverse impact on liquidity is low due to categorisation of savings deposits. Term deposits less than one year, considered as an outflow that has a tendency to rollover based on historical behaviour patterns.
Bank Up to 3 monthsRs. ’000
3-12 monthsRs. ’000
1-3 years
Rs. ’000
3-5 years
Rs. ’000
More than 5 years
Rs. ’000
Total
Rs. ’000
Assets with contractual maturityCash and cash equivalents 5,376,718 – – – – 5,376,718 Balances with central banks – – – – – – Placements with banks 2,949,684 9,414,785 – – – 12,364,469 Derivative financial instruments – – 11,622 – – 11,622 Financial assets recognised through profit or loss 532,739 1,443,835 51,730 3,965,012 5,466,566 11,459,882 Financial assets at amortised cost – loans and advances 31,018,749 73,911,004 134,262,802 80,148,900 135,053,502 454,394,957 Financial assets at amortised cost – debt and other instruments 18,997,560 51,954,060 126,072,425 193,141,220 225,469,056 615,634,321 Financial assets measured at fair value through other comprehensive income – – – – 3,478,811 3,478,811 Investments in subsidiaries – – – – 4,811,000 4,811,000 Property, plant and equipment – – – – 14,163,454 14,163,454 Right of used assets 67,064 183,944 384,935 206,523 231,041 1,073,507 Investment properties – – – – – – Goodwill and intangible assets – – – – – – Deferred tax assets – – – – – – Other assets 1,494,490 9,607,760 9,049,258 8,479,918 6,566,497 35,197,923
60,437,004 146,515,388 269,832,772 285,941,573 395,239,927 1,157,966,664
Liabilities with contractual maturityDue to banks 17,986,097 11,112,581 5,946,572 – – 35,045,250 Derivative financial instruments – – – – – – Financial liabilities recognised through profit or loss – – – – – – Financial liabilities at amortised cost – due to depositors 480,253,272 517,531,380 13,675,940 5,113,695 – 1,016,574,287 Financial liabilities at amortised cost – due to other borrowers 18,007,848 3,195,394 – – – 21,203,242 Lease Liability 39,587 135,305 330,776 224,533 336,681 1,066,882 Debt securities issued – 691,711 19,677,000 6,323,000 – 26,691,711 Retirement benefit obligations – – – – 6,508,707 6,508,707 Deferred tax liabilities 2,880 8,856 58,883 351,075 125,556 547,250 Other liabilities 3,974,564 1,523,085 200,537 168,640 84,638 5,951,464 Due to subsidiaries 547 – – – – 547 Stated capital/assigned capital – – – – 9,400,000 9,400,000 Statutory reserve fund – – – – 3,562,872 3,562,872 Retained earnings – – – – 4,464,442 4,464,442 Other reserves – – – – 26,950,010 26,950,010
520,264,795 534,198,312 39,889,708 12,180,943 51,432,906 1,157,966,664 Maturity gap (459,827,791) (387,682,924) 229,943,064 273,760,630 343,807,021 – Cumulative gap (459,827,791) (847,510,715) (617,567,651) (343,807,021) – –
Table 10: Maturity profile of assets and liabilities

Governance Financial Reports Supplementary Information
266 National Savings Bank │ Annual Report 2019 Risk Management
Strong monitoring of maturity gap analysis of assets and liabilities enable foreseeing adverse liquidity levels. The Bank was able to manage funding requirements during the year by utilising the government securities portfolio to increase borrowings.
Stock approach
Bank monitors liquidity ratios under stock approach namely net loans to total assets ratio, loans to customer deposits ratio, liquid assets to short-term liabilities ratio, purchased funds to total assets ratio, commitments to total loans ratio and ratio of (large liabilities – temporary investments) to (earning assets – temporary investments) to manage the funding and liquidity risks.
Increase in exposure to repo borrowing and increase in institutional deposits, adversely affected the purchased funds to total assets ratio.
Liquidity ratios under stock approach%
Net loans to total assets
Purchased funds to total assets
Commitments to total loans
Loans to deposits
Liquid assets to short-term liabilities
Large liabilities – Temporary investments/ earning assets – Temporary investments
2018 20192015 2016 2017
80
60
40
20
0
-20
Figure 24: Liquidity ratios under stock approach
Operational risk
Operational risk is the risk of loss resulting from inadequate or failed internal processes, people and systems or from external events. Operational risk includes legal risk but excludes reputational and strategic risk.
Operational Risk cannot be fully diversified or eliminated due to the imperfection of people, processes and systems. However, it can be managed to be within the level of risk tolerance.
The Bank is exposed to a broad range of operational risks through its daily operations and is aware of the emerging operational risk concerns. The role of operational risk management is reviewed on a yearly basis considering the impact from existing and emerging trends, such as IT disruptions, Data compromise, Regulatory Risk, Theft and Fraud, Outsourcing and Model Risk etc.

Governance Financial Reports Supplementary Information
267Annual Report 2019 │ National Savings BankRisk Management
Theft and fraud is the most common operational risk with the advancement of technology and digitalisation, focus is made on cyber frauds. Internal control structure of the Bank acts as the First Line of Defence to minimise theft and frauds.
During the year Bank took several measures to minimise fraud risk from cyber bandits.
Theft and Fraud
Regulatory changes in areas such as capital, leverage ratios, funding liquidity are expected to have considerable implications for Bank’s risk management process.
The regulator (CBSL) and the Government are increasingly demanding the Bank to comply with both local and global regulatory standards.
The Bank adheres to all applicable regulations and is prepared to comply with potential future changes as well.
Compliance/regulatory risk
Data can be compromised through cyber theft, unauthorised access, accidental disclosure, and employee negligence.
Bank's Board approved information security framework ensures appropriate actions are taken to assure the confidentiality of sensitive data and information.
Cybersecurity and data compromise
Increasing dependence on model will require better understanding and managing of model risk. Model errors stem from issues with data quality, technical or implementation issues and correction inconsistencies. These are mitigated through sophisticated model development, improving data quality and continuous monitoring of model outputs.
Model risk
The business disruptions can be driven from man-made, natural or technical disasters. The costs from such disruption are harder to quantify from financial terms and can impact the overall resilience of the Bank. Business continuity management ensures minimising of disruptions to critcal business operations.
Business disruptions
Outsourcing risk emerged due to growing reliance on external service providers/vendors. Several actions are taken to manage the risk from outsourcing such as vendor due diligence, entering to Non-Disclosure Agreements (NDA) etc. as per the outsourcing policy of the Bank.
Outsourcing
Figure 25: Existing and emerging operational risks

Governance Financial Reports Supplementary Information
268 National Savings Bank │ Annual Report 2019 Risk Management
Risk review
Operational risk is reviewed in terms of material risks to the Bank. Bank has a very low tolerance for operational risks, which impact business – critical functions.
Risk component of operational risk Description Monitoring/management tools Exposure YOY change in impact*
Theft and fraud risk Fraudulent activities by internal or external party
z Fraud risk management and whistle-blowing process
z Internal controls z Key Operational Risk Indicators (KORIs)
monitoring z Loss event monitoring z RCSA
High
Cyber risk and data compromise
Cyber crimes/data breaches and system outages
z Internal controls z Information security
management system z KORIs monitoring z Incident reporting
High
Compliance/ regulatory risk
Failure in meeting regulatory requirements
z Compliance programme and examinations
z KORIs monitoring z Compliance risk scorecard
High
Legal risk Inadequate/failure to comply with legal requirements
z Legal clearance on all contractual obligations
z KORIs monitoring
Moderate
*YoY change in impact on earnings and capital
Increase in impact No change Decrease in impact
Figure 26: Operational risk review
Operational losses for the financial year 2019 was 0.66% of the average audited gross income for last three years, which is far below the internal alert level reflecting the “tone at the top” effectiveness of the governance structures and processes and procedures in place to manage operational risk.
The trend line demonstrates the Bank’s consistency in maintaining losses at minimal levels over the last five-year period.
Actual operational losses against risk appetite and tolerance limit%
Actual Risk appetite level
Risk tolerance level
2018 20192015 2016 2017
3.0
2.4
1.8
1.2
0.6
0
Figure 27: Actual operational losses against risk appetite and tolerance limit
Operational risk managements
The Bank takes a comprehensive approach to manage operational risk embedded in all operational areas and manages operational risk based on the Board approved operational risk framework.
Branches and staff attached to divisions are the primary owners of operational risk. They are provided with adequate training which assist in identifying inherent risks in their area of responsibility. System controls, access controls, segregation of duties, clear lines of authority and responsibility, dual checks for authorisation and verification of transactions, physical

Governance Financial Reports Supplementary Information
269Annual Report 2019 │ National Savings BankRisk Management
controls over assets, proper record keeping, reconciliations, audit trails and audit logs are a part of the internal control structure, which is the base for operational risk management. ORMU in RMD identifies the risks with the intention of implementing corrective actions to address process and control deficiencies.
The Bank uses different tools and techniques to manage and minimise operational risk exposures.
Loss event data collection and analysis: Basel Accord defines the loss data base as a key component of sound operational risk management and one of the criteria to be met for being eligible to use advanced capital models.
The Bank’s loss event data collection process captures both internal and external loss event data. Bank has a documented procedure for identification, collection and recognition of internal loss data from all geographic locations to facilitate timely regulatory reporting and recognition. Further the Bank’s external loss event data base captures operational loss event reports published by similar institutions.
Collected data is classified into Basel Level II loss event categories and subject to stringent analysis to identify the nature, root causes and the probability of occurrence to take process improvements and risk mitigation actions. During the year 2019, highest frequency was reported from physical asset damages, business disruptions and system failures respectively. The severity of the events was manageable since the events have not exceeded the tolerable levels.
Apart from the operational risks materialised within, Bank is continuously attentive to emerging risks such as cyberattacks and hacking, information security breaches, regulatory requirements etc.
Frequency of loss event data
2018 2019
%
CPBP BDSFDPA EDPMIF EF EPWS
50
40
30
20
10
0
Severity of loss event data
2018 2019
%
CPBP BDSFDPA EDPMIF EF EPWS
100
80
60
40
20
0
Figure 28: Frequency of loss event data Figure 29: Severity of loss event data
IF – Internal FundEF – External FundEDPM – Execution, Delivery and Process ManagementDPA – Damage to Physical AssetsBDSF – Business Disruption and System FailuresCPBP – Client, Products and Business PracticesEPWS – Employee Practices and Workplace Safety
Key operational risk indicators monitoring: KORIs are used to enhance the risk monitoring and risk reporting as those demonstrate the changes in risk factors in terms of frequency and impact. KORIs measure the potential risk related to a specific action and act as an early-warning system to alert the Bank’s financial, operational, reputational, compliance or strategic issues.
The Bank’s KORIs dashboard covers key business operations and support services to identify and assess operational risk profile in a risk matrix covering audit issue management, business continuity management, information security management, product quality, process quality and compliance. KORIs are defined under each area to assess the risk based on predefined threshold limits. These threshold limits are revised annually or more frequently considering the changes in operational environment.
Risk control self-assessment:RCSA forms an integral element of the overall operational risk framework, as it provides an opportunity to the Bank to integrate and coordinate its risk identification and risk management efforts to improve understanding, control and oversight of its operational risks. Underlying assumption in RCSA is that, business process owners/first line of defense is in a best position to understand their own risks. This helps in raising awareness on risks that need immediate attention and to prioritise addressing operational weaknesses in a structured manner.
RMD in coordination with the process owners conduct RCSA in critical functions to identify process level risks and to update the risk register of the Bank at process level.
Customer complaints management: Customer complaint management process of the Bank includes recording and responding within the benchmark time upon receipt of a complaint to ensure an effective customer service.

Governance Financial Reports Supplementary Information
270 National Savings Bank │ Annual Report 2019 Risk Management
ORMU considers customer complaints as a source of identifying operational weaknesses and risks in the Bank’s operations. Customer complaint data is analysed periodically and relevant findings are reported to ORMC to take further risk mitigation actions.
Information security
Technology advancement within the financial services systems has changed the Bank’s business model to a greater extent and therefore the Bank enforces the governance in information security management to provide a safe banking service to customers in terms of accuracy, control, integrity and confidentiality of the information from the emerging vulnerabilities in Information Communication Technology.
Internally the Bank has put in place a Board approved Information Security Governance Framework to protect the Bank’s critical information assets.
ISD is responsible for implementing Information Security Risk Management Framework. ISD carries out independent risk assessments on information systems with the assistance of external expertise service providers and assessment results are used to recommend risk treatments or risk mitigants. The Bank has continuously taken IT security initiatives to improve resilience towards evolving cyber threats. During the year 2019, following initiatives have been taken to minimise information security vulnerabilities and enhance security posture:
i PCI-DSS (Payment Card Industry – Data Security Standard)
PCI-DSS is an information security standard for organisations that handle branded credit/debit cards from the major card schemes.
It is one of the most accepted international standards for payment card security and is based on specific technical and operational controls for card operations and related
information systems. Presently the Bank provides Mastercard and Visa branded debit card for customers and PCI-DSS assures the safety of card holders’ data.
The Bank remains the only state bank to achieve PCI-DSS compliance.
ii Security Operations Centre (SOC)
The Bank implemented a 24 X 7 X 365 operated SOC under the ISD with the support of a competent third party. Incident response capabilities are further strengthened to meet international standards.
As for the preparedness to achieve requirements in CBSL consultation paper on Technology Risk Resilience, the Bank achieved proposed requirements for 2019. This enhanced the Information Security Management System and will continue enhancing and maintenance of implemented controls through regular Management Committee reviews and technical reviews.
Business continuity management system
Business Continuity Management (BCM) ensures continuous service delivery to customers and stakeholders without interruptions. It has a paramount importance in an IT driven banking environment.
Bank has in place a Business Continuity Plan (BCP) governance structure, policy documents, processes and systems approved by the Board to ensure business continues with minimum interruptions to business activities from natural, man-made or IT driven disasters.
BCP coordinators are assigned with the responsibilities for effective implementation, testing and monitoring of the BCP policy framework.
Risk transfer
Outsourcing is used as an effective cost-saving and a risk transfer strategy. Bank’s outsourcing operations are conducted in accordance with the Board approved Outsourcing Policy and other regulatory requirements.
The risk arising from outsourcing of business operations are managed by the Outsourcing Monitoring Unit of Administration Division to ensure the compliance with the guidelines issued by the CBSL.
Bank conducts due diligence exercises to ensure the service providers’ capability to perform the activities outsourced. ORMC monitors the effectiveness of the outsourcing function and risk management practices conduct by the Administration Division.
Insurance plays a key role as an operational risk mitigant to transfer key insurable risk to an insurance service provider. Insurance policies are used to cover “low frequency high impact” events such as damage to physical assets due to natural disasters and fraudulent activities etc.
The adequacy of the insurance policies is continuously reviewed considering the existing and emerging risks to the Bank. Insurance function is centralised within the Administration Division; which is monitored through the ORMC.
Legal risk
Basel Accord defines legal risk as a part of operational risk. Legal risk includes, but not limited to risk of losses due to inaccurately drafted contracts and their execution, absence of written agreements or inadequate agreement resulting in fines, penalties and punitive damages. Legal risk is managed through:
z Ensuring all applicable laws are fully taken into consideration in business operations when entering into contractual relationships with third parties such as customers or service providers.

Governance Financial Reports Supplementary Information
271Annual Report 2019 │ National Savings BankRisk Management
z Ensuring all such contractual relationships are supported by required documentation.
z Establishing mechanisms to ensure conformity to laws and regulations when introducing/reviewing products and processes.
The responsibilities of managing legal risk is delegated to the business owners with the guidance of Legal Division. Legal Division engages in strategic management of legal risk of the Bank.
Compliance and regulatory risk
Compliance and regulatory risk is directly resulted from non-compliance with applicable laws and regulations, codes of conducts and standards of practice in the banking industry. This may lead to regulatory sanction, financial losses, disruption in business operations and reputation damages. Compliance policy framework includes the Board approved Compliance Policy, Anti-Money Laundering Policy, Related Party Transaction Policy and Compliance Manual which specify on how the compliance risk is managed by the Bank. The Compliance Division headed by the Compliance Officer directly reports to the Board through BIRMC and takes measures to mitigate the compliance risk of the Bank. During the year 2019, following initiatives taken to minimise the compliance and regulatory risk of the Bank;
– Implementation of Anti-Money Laundering (AML) software
– Ensure timely review of applicable policies and procedures
– Extending compliance assessment process to long distance branches
– Creating awareness through training sessions
– Assessing and monitoring of supervisory concerns
Reputational risk
Reputation risk is the risk of adversities to earnings or solvency due to negative stakeholder perception on business practices and financial condition. Management of reputational risk is highly important for financial institutions to maintain the public confidence in its operations.
With the new developments in communication channels there is an increase in social connectivity through social media by sharing ideas, information, views, facts and feelings to reach a common understanding. This may expand the exposure to reputation risk.
Reputational risk is broadly managed through systems and controls adopted for all other risk as reputational risk is driven by a wide range of other business risks which are managed by the policies, procedures, Code of Conduct and Business Ethics. The Bank uses various channels to communicate with the customers, other stakeholders and to safeguard the damages to the reputation from adverse communications.
Bank has a zero-risk appetite for reputational losses. Thus, RMD closely monitors the reputational vulnerabilities using tools such as KORIs, customer complaint analysis and predefined qualitative criterion used in the scorecard approach.
Strategic risk
Strategic risk can be considered as the risk of loss arising due to unsuccessful business plan or inability to implement suitable business plan, failure to respond promptly to the changes in the business environment and inadequate resource allocation causing adverse impact on earnings and capital of the Bank. Missing out on potential upside
opportunities can also be considered under strategic risk.
Responsibility for strategy development rests with the divisional heads through the strategic planning and budgeting process which aligns the Bank’s vision, mission and the risk appetite. Strategic risk could arise due to worsening of general economic and market conditions locally and globally beyond expectations. The inputs from the Research Division are incorporated in formulating business strategies for the Bank.
The Board has the oversight responsibility towards the strategy risk of the Bank, which is monitored by the Senior Management through frequent reviews. A scorecard-based model is used to assess the strategic risk within the ICAAP.
Capital management
The Bank requires a strong capital position in order to satisfy regulatory capital requirements, provide financial security to its depositors/creditors, maintain leeway for future business expansion and generate adequate return to its shareholders.
Managing capital assure resilience of the Bank while generating stakeholder return. Hence, the Bank strives to manage capital more efficiently by achieving the optimum balance between performance and risk and conduct stringent monitoring of the Risk Weighted Asset (RWA) mix and changes in the risk profile. Capital management process is in line with the guidelines issued by the CBSL.
The Banking Act Direction No. 01 of 2016, introduced capital requirements under Basel III for Licensed Banks commencing from 1 July 2017 with specified timelines to increase minimum capital ratios which is to be fully implemented by 1 January 2019.
However, according to the Banking Act Directions No. 12 of 2019 on Domestic Systemically Important Banks, NSB is

Governance Financial Reports Supplementary Information
272 National Savings Bank │ Annual Report 2019 Risk Management
not further considered as a Domestic Systemically Important Bank (D-SIB)and applying of higher loss absorption is not required. Hence, as per Banking Act Direction No. 11 of 2019, Amendments to Directions on Capital Requirements under Basel III for Licensed Commercial Banks & Licensed Specialised Banks it is required to maintain the minimum capital ratios as prescribed in the Table 11 below.
During 2019, the Bank acquired Sri Lanka Savings Bank for a total purchase consideration of Rs. 3.1 Bn. Bank obtained the approval of the Monetary Board to exclude the investment from the total regulatory adjustments to Common Equity Tier 1 (CET1) for a period of 3 years. However, the investment is credit risk weighted by applying a 250% risk weight.Bank paid Rs. 2 Bn. dividend for the year 2019 against the Rs. 500 Mn. in the previous year.
The Bank achieved the regulatory minimum requirements set for capital adequacy during the year 2019. CET1 ratio position decreased during the year to 12.02% as at 31 December 2019, from 13.08% as at 31 December 2018. In the absence of qualifying additional Tier 1 capital instruments, Bank’s CET1 ratio is equal to Total Tier 1 Capital ratio.
Total Capital ratio decreased to 14.35% as at 31 December 2019 against 15.90% as at 31 December 2018.
Capital level Bank and Group% Rs. Mn.
Total Capital
CET 1/Tier 1
CET 1/Tier 1
2018 2019
Total Capital
20
16
12
8
4
0
2,500
2,000
1,500
1,000
500
0
Bank Group Dividend Payment
Figure 30: Capital level Bank and Group
The Bank's subsidiaries contributed positively to CAR at group level. The total capital ratio for the Group is 16.27% as at December 2019. As the 100% state-owned savings bank, there are limited options available to raise capital externally. The only regulatory capital instrument available under Basel III is the shares issued to the Government of Sri Lanka. Hence, the most preferable source to augment the capital is retained earnings.
Ratios (%) Regulatory minimum
Actual as at 31 December 2019
Actual as at 31 December 2018
Bank Group Bank Group
CET1 plus CCB 7.00 12.02 13.90 13.08 13.90
Tier1 plus CCB 8.50 12.02 13.90 13.08 13.90
Total Capital plus CCB 12.50 14.35 16.27 15.90 16.65
Table 11: Regulatory ratios – Actual vs. regulatory minimum
ICAAP promotes an integrated approach, combining risk management practices and strategic business planning to gain operational efficiencies, growth and solvency.
Internal Capital Adequacy Assessment Process (ICAAP) – Pillar II
The ICAAP comprises risk appetite, stress testing and capital planning concepts along with a sound risk management framework to capture all material risks. This enables combining the business performance, risk management actions and risk sensitive capital in a more rational manner to establish a level of internal capital commensurate with the Bank’s risk profile.
The Bank has a Board approved ICAAP Policy which is in line with the CBSL directions on Basel III Pillar II guidelines issued to banks on the conduct of the Supervisory Review & Evaluation Process (SREP) and international best practices.
Bank’s ICAAP is governed by four principles which are fundamentals for the Bank and the regulator. The process involves integrating risk to decision-making, comprehensive risk assessment, reviewing of internal controls, monitoring, reporting and stress testing risks with the oversight responsibility of the Board.
Risk assessment captures both Pillar I and Pillar II risks. Pillar I risks deal with regulatory capital requirements whilst Pillar II risks deal with economic capital.
The Bank has internal models to assess and quantify the risk profile and internal capital requirements. Internal limits are set covering the internal capital requirement to provide effective assessment with regard to capital adequacy. Comprehensively documented ICAAP is discussed and approved by ALCO and the Board through BIRMC prior to submitting to the regulator.

Governance Financial Reports Supplementary Information
273Annual Report 2019 │ National Savings BankRisk Management
Stress testing
Stress Testing is an integral part of ICAAP under Pillar II. The Bank’s stress testing framework is governed by the Board approved Stress Testing Policy and guidelines issued by CBSL. The Bank’s stress testing framework includes stress tests on all the material risks such as credit risk, interest rate risk in trading book and banking book, operational risk, liquidity risk, concentration risk and residual credit risk. The Bank has defined
three levels of increasing adversity, i.e. minor, medium and major (or Low, Medium and High) for the stress testing purposes.
Stress testing provides understanding on ability of the Bank to withstand unforeseen scenarios of varying severity under adverse economic, political and physical changes in the environment in which it operates.
The Bank uses sensitivity analysis to measure the impact of individual
market factor movements on specific instruments or portfolios, including interest rates, foreign exchange rates and equity prices, such as the effect of a one basis point change in yield.
The Bank mainly uses sensitivity analysis to identify the impact on trading and banking book due to adverse interest rate fluctuations and reports are submitted to ALCO on a periodic basis. These reports are instrumental in asset and liability management, and pricing decisions of the Bank.
Rs. ’000 FVPL FVOCI Total
Unrealised gain/(loss) of G sec portfolio against cost at the end of 2019 154,887 – 154,887Change in M2M value
100 bps increase in yield (429,607) – (429,607)
200 bps increase in yield (832,432) – (832,432)
100 bps decrease in yield 458,611 – (1,262,040)
200 bps decrease in yield 948,663 – 948,663
Table 12: Sensitivity analysis-interest rate risk in trading book – Government Securities
100 bp rate shock on negative gaps <1 month
Rs. Mn.
1-3 months Rs. Mn.
3-6 months Rs. Mn.
6-12 months Rs. Mn
1-3 years
Rs. Mn.
3-5 years
Rs. Mn.
>5 years
Rs. Mn.
Total
Rs. Mn.
Stand-alone level Gap (167,171) (294,690) (161,791) (235,460) 221,036 261,853 360,523 (15,700)
Impact on NII (1,608) (2,462) (1,020) (613) – – – (5,702)
Consolidated level Gap (169,632) (301,411) (159,624) (234,691) 224,115 263,305 360,789 (17,149)Impact on NII (1,631) (2,519) (1,006) (611) – – – (5,767)
Table 13: Sensitivity analysis – Assessment of yield curve risk in banking book
The results obtained from stress testing exercise are used in setting of risk appetite and risk limits, capital planning, strategic business planning and to manage the risks in critical business operations to support proactive decision-making.

Governance Financial Reports Supplementary Information
274 National Savings Bank │ Annual Report 2019 Risk Management
Risk area Scenario Impact to CAR
Low%
Medium%
High%
Credit risk Credit risk – Increase in PD due to an economic downturn (Low – 10%, Medium – 20%, High – 30%) (0.12) (0.24) (0.36)
Market risk Interest rate risk: Increase in market yield (FVPL portfolio) (Low 50bps, Medium 100bps, High 200bps) (0.08) (0.16) (0.31)
Equity price risk: Decline in market prices (Low – 15%, Medium – 20%, High – 25%) (0.04) (0.6) (0.8)
FX risk: LKR depreciation (Low – 5%, Medium – 10%, High – 15%) (0.03) (0.05) (0.14)
Operational risk Increase in operational losses classified under Basel II loss event categories (0.05) (0.06) (0.08)
Table 14: Impact to the capital adequacy at different stress levels
Future outlook
With the strategic changes in business operations due to upgrading of technological infrastructure will enable strengthen of the risk management infrastructure supporting continuous developments in the risk management framework in compliance with the internal best practices and CBSL regulatory framework.
Minimum disclosure requirements – Pillar III
Minimum disclosure requirements were introduced by the CBSL within the Basel III Framework to allow the market participants to gauge the capital adequacy and risk exposures of the Bank.
Refer page 433 to 445 for minimum disclosure requirements as per Banking Act No. 01 of 2016.

Financial Reports276 277 283Financial Calendar
Annual Report of Board of Directors
Statement of Directors’ Responsibility for Financial Reporting
285 287 288Directors Statement on Internal Control Over Financial Reporting
Independent Assurance Report on Internal Control
Independent Assurance Report
291 293 295General Manager/CEO’s and Senior Deputy General Manager’s (Finance and Planning) Statement of Responsibility
Auditor General’s Report Content of Financial Statements
296 297 298Income Statement Statement of
Comprehensive Income
Statement of Financial Position
300 304 306Statement of Changes in Equity
Statement of Cash Flows
Notes to the Financial Statements

Governance Financial Reports Supplementary Information
276 National Savings Bank │ Annual Report 2019
Financial Calendar
Financial Calendar 2019
Publication of Interim Financial Statements for the quarter ended 31 March 2019 31 May 2019
Publication of Interim Financial Statements for the quarter ended 30 June 2019 30 August 2019
Publication of Interim Financial Statements for the quarter ended 30 September 2019 29 November 2019
Publication of Financial Statements (Audited) for the quarter ended 31 December 2019 31 March 2020
Proposed Financial Calendar 2020
Publication of Interim Financial Statements for the quarter ended 31 March 2020 29 May 2020
Publication of Interim Financial Statements for the quarter ended 30 June 2020 31 August 2020
Publication of Interim Financial Statements for the quarter ended 30 September 2020 30 November 2020
Publication of Financial Statements (Audited) for the quarter ended 31 December 2020 31 March 2021

Governance Financial Reports Supplementary Information
277Annual Report 2019 │ National Savings Bank
Annual Report of Board of Directors
General
The Directors of the National Savings Bank have pleasure in presenting their Integrated Annual Report on the affairs of the Bank together with the Audited Financial Statements of the Bank and Consolidated Financial Statements for the year ended 31 December 2019. We ascertain that it gives the strategic picture of the Bank’s business that explains how the Bank creates and sustains value over the years and in the future.
The Annual Financial Statements reviewed and recommended by the Board Audit Committee (BAC) were approved by the Board of Directors on 24 March 2020. The Audited Financial Statements were authorized to be issued on 24 March 2020. The Report also includes certain disclosures required to be made under the Banking Act No. 30 of 1988 and amendments thereto and the Banking Act Direction No. 12 of 2007 on Corporate Governance for Licensed Specilised Banks issued by the Central Bank of Sri Lanka (CBSL) and subsequent amendments thereto. The Annual Report and Financial Statements, together with the Auditor General’s Report will be submitted to the Minister of Finance, on or before 31 May 2020 as per Circular No. PED/27 of 27 January 2005, issued by the Director General of the Department of Public Enterprises to be placed before the Parliament of Sri Lanka.
National Savings Bank is incorporated in Sri Lanka by National Savings Bank Act No. 30 of 1971 and was granted the status of Licensed Specialised Bank in terms of Banking Act No. 30 of 1988. The Bank has been assigned [SL] AAA (Stable) long-term credit rating by ICRA Lanka Limited. It has also been awarded international credit rating B with Negative outlook by Standard and Poor's Rating services.
Review of business
Principal activities of the Bank
The principal activity of the National Savings Bank is promoting of savings among the people of Sri Lanka and profitable investments of savings so mobilised. Accordingly, during the year under review, the principal activities of the bank were, retail banking, corporate banking, trade financing, treasury dealing and investments, correspondence banking and money remittance facilities, pawning, foreign currency operations and other financial services.
Vision, Mission and Values
The Bank’s Vision, Mission and Values are given on Page 7 of this Annual Report. All permanent employees are being abided by the Code of Conduct of the Bank and the Government Oath with the view of maintaining the highest ethical standards in achieving the Vision and Mission of the Bank.
Government guarantee
The Government of Sri Lanka guarantees the repayment of the monies deposited with the Bank together with interest thereon.
Subsidiaries of the Bank
NSB Fund Management Company Ltd and Sri Lanka Savings Bank Limited are the Bank’s two Subsidiaries. The principal activity of the NSB Fund Management Company is dealing in Government Securities as a primary dealer authorised by the Central Bank of Sri Lanka.
Sri Lanka Savings Bank’s principal activities are mobilising savings and time deposits, providing loans, lease, hire purchase, pawning and other credit facilities, and settling of the
deposit liabilities of defaulted Pramuka Savings and Development Bank Limited (PSDBL) with reconstruction of loan accounts of PSDBL.
Details of the transactions are given in Note 24 to the Financial Statements.
Changes to the Group structure
Bank has fully acquired Sri Lanka Savings Bank Limited on 11th October 2019 for Rs. 3.111 Bn. and there were no significant changes in the nature of the principal activities of the Bank and the Group.
Review of business performance
The overall review of financial performance of the Bank and the Group for the financial year 2019 are provided in the Chairperson’s Message (page 12), General Manager/CEO’s Review (page 16),The “Management Discussion and Analysis” on pages 90 to 174 and Audited Financial Statements (pages 296 to 305) provides a comprehensive review on key business lines and the state of affairs of the Bank. These reports form an integral part of the Annual Report.
Branch network expansions
Widening the Bank’s presence in the island, one branch was added to the network during the year under review. At the end of the year the Bank has 256 branches in its network. The ATMs/CRMs network was further expanded enhancing customer convenience. The Bank installed 26 CRMs during the year across the island bringing out the total ATMs/CRMs to 334 excluding peer banks’ ATMs through which customers of NSB can transact.

Governance Financial Reports Supplementary Information
278 National Savings Bank │ Annual Report 2019 Annual Report of Board of Directors
Preparation of Financial Statements
The Financial Statements are prepared in accordance with the Sri Lanka Accounting Standards (SLFRSs/LKASs) laid down by The Institute of Chartered Accountants of Sri Lanka and comply with the requirements of Banking Act No 30 of 1988 and amendments thereto and regulatory requirements inclusive of specific disclosures. The Financial Statements of the Bank and the Group for the year ended 31st December 2019 duly certified by the Senior Deputy General Manager – Finance and Planning and approved and signed by the General Manager/CEO and two Directors including Chairperson of the Bank are given on pages 296 to 305 which form an integral part of the Annual Report of the Bank.
Accounting policies and changes during the year
The Bank and the Group prepared its Financial Statements in accordance with Sri Lanka Accounting Standards (SLFRSs/LKASs). The Bank and the Group have adopted SLFRS 16 on “Leases” from 1 January 2019. SLFRS 16 requires the recognition of lease liabilities and right-of-use assets for leases previously classified as operating leases in accordance with LKAS 17 on “Leases”. However Bank opted not to restate Financial Statements of prior periods permitted by the paragraph 5 (b) of the Appendix C of SLFRS 16 and to recognise lease liability and the right-of-use assets in line with the paragraph 8 (a) and 8 (b) i of the Appendix C of SLFRS 16. The accounting policies adopted in preparation of Financial Statements are given on pages 306 to 322 in this report.
Directors’ responsibilities for financial reporting
The Directors are responsible for the preparation of the Financial Statements that will reflect a true and fair view of the state of affairs of the Bank as at 31 December 2019 and its profit for the year then ended. The Directors are of the view that the Financial Statements appearing on pages 296 to 305 have been prepared in conformity with the requirements of the Sri Lanka Accounting Standards (SLFRSs/ LKASs) and the Banking Act No. 30 of 1988 and its amendments, the NSB Act No. 30 of 1971 and amendments thereto. The Statement of Directors’ Responsibility for Financial Reporting appearing on page 283 of this Annual Report describes in detail the Directors’ Responsibilities in relation to Financial Statements, which form an integral part of the Annual Report of the Board of Directors.
Auditor’s Report
The Auditor General has carried out the audit of the Financial Statements of the Bank and the Consolidated Financial Statements of the Group for the year ended 31 December 2019. Further, the Auditor General has carried out the audit of NSB Fund Management Company and Sri Lanka Savings Bank Limited. In 2019, the continuous audit was carried out throughout the year for the Bank. Issues identified in their reports were submitted to the management regularly
for prompt action. Having confirmed the accuracy of the financial reporting, the Financial Statements, together with the necessary data and information were made available to the Auditor General for examination. The Auditor General’s opinion on the Financial Statements appears on page 293 of this Annual Report.
Future developments
An overview of the future developments of the Bank is given in the Chairperson’s Message (page 12), General Manager/CEO’s Review (page 16) and “Management Discussion and Analysis” on pages 90 to 174 in the Integrated Annual Report 2019.
Gross income
The gross income of the Bank for 2019 was Rs. 121,929 Mn. (2018 – Rs. 111,902 Mn.) while the Group’s income was Rs. 125,810 Mn. (2018 – Rs. 112,760 Mn.). Analysis of the gross income is given in Note 3 to the Financial Statements.
Dividends and reserves
Results and appropriation
The profit before income tax of the Bank and the Group amounted to Rs. 10,462 Mn. and Rs. 13,092 Mn. (2018 – Rs. 7,941 Mn. and Rs. 7,944 Mn.). The profit after tax of the Bank and the Group stood at Rs. 6,698 Mn. and Rs. 9,030 Mn. respectively (2018 – Rs. 4,500.1 Mn. and Rs. 4,500.2 Mn.).
Annual Report of Board of Directors

Governance Financial Reports Supplementary Information
279Annual Report 2019 │ National Savings BankAnnual Report of Board of Directors
Details of profit relating to the Bank are given in the following Table:
2019Rs. Mn.
2018Rs. Mn.
Profit for the year after payment of all expenses and providing for depreciation, expected credit losses and contingencies before VAT, NBT, DRL and income tax 15,659 11,171VAT on financial services 3,046 2,578NBT on financial services 366 344Debt repayment levy (DRL) 1,785 308Provision for income tax 3,763 3,441Net profit after tax 6,698 4,500Other comprehensive income for the year, net of tax (3,911) (1,320)
Total comprehensive income for the year 2,787 3,181
Appropriations:Transfer to statutory reserve (335) (225)Contribution to the National Insurance Trust Fund (NITF) (67) (45)Contribution to the consolidated Fund/dividend (2,000) (500)
Provision for taxation
The Income Tax Rate applicable for the Group on its operation was 28%, the Group’s operations are liable for Value Added Tax on Financial Services at the rate of 15% and Nation Building Tax at the rate of 2%.The Group is also liable for Debt Repayment Levy (DRL) at 7% on financial services with effect from 1 October 2018 to 31 December 2019.
The Bank and the Group provided deferred tax on all known timing differences under the liability method in accordance with Sri Lanka Accounting Standard (LKAS) 12 – “Income Taxes”. Information of Income Tax expenditure and Deferred Taxation are given in Notes 13 and 30 respectively on pages 332 and 366.
Dividends, taxes and levies/contribution to nation
The Bank contributed Rs. 11,347 Mn. by way of dividends, taxes and levies
to the Government in 2019 (2018 – Rs. 7,536 Mn.). This consisted of:
2019Rs. Mn.
2018Rs. Mn.
Income tax 3,763 3,441Value added tax 3,046 2,578Nation building tax 366 344Special fee 320 320Debt repayment levy 1,785 308Contribution to the Consolidated Fund 2,000 500Contributions to National Insurance Trust Fund 67 45
Total contribution to the Nation 11,347 7,536
Reserves
The total reserves of the Bank stood at Rs. 34,977 Mn. as at 31 December 2019 (2018 – Rs. 33,696 Mn.). The Bank’s Reserves consist of:
2019Rs. Mn.
2018Rs. Mn.
Statutory reserve fund 3,563 3,228Revaluation reserve 7,793 7,793Retained earnings 4,464 3,985Other reserves 19,157 18,690
Total reserves 34,977 33,696
Information on changes of reserves is given in the Statement of Changes in Equity on page 300.
Service charges to Postmaster General (PMG)
Service charges to the PMG for 2019 amounting to Rs. 153 Mn. has been provided for on the same basis as in 2018.
Retirement benefits and obligations
The Bank maintains two Pension Funds namely: Staff Pension Fund I and Staff Pension Fund II. Further the Bank maintains a Widows’/Widowers’ and Orphans Pension Fund as well as a Post-Employment Medical Scheme. Details are given on pages 372 to 382 in Notes to the Financial Statements.
Property, plant and equipment and capital expenditure
The total Net Book Value of Property, Plant and Equipment of the Bank and the Group as at the year end 2019 was Rs. 14,163 Mn. and Rs. 14,457 Mn. respectively (2018 – Rs. 13,466 Mn. in the Bank and Rs. 13,469 Mn. in the Group). Details are given in Notes to the Financial Statements as follows:
Note 26 to the Financial Statements:Property, Plant and Equipment on page 358.
Note 29 to the Financial Statements:Goodwill and Intangible Assets on page 365.
Note 48.1 to the Financial Statements:Capital Commitments on page 388.
The total capital expenditure incurred by the Bank on the acquisition of Property, Plant & Equipment and Intangible Assets (Including capital work-in-progress) during the year amounted to Rs. 2,207 Mn. (2018 – Rs. 2,067 Mn.) and Group amounted to Rs. 2,212 Mn. (2018 – Rs. 2,067 Mn.),

Governance Financial Reports Supplementary Information
280 National Savings Bank │ Annual Report 2019 Annual Report of Board of Directors
the details of which are given in Notes 26. (a) and 26. (b) to the Financial Statements on pages 360 to 361 of this Annual Report.
Market Value of Freehold Property
The Bank carried out a revaluation on entire class of Freehold Land and Buildings of the Bank in December 2017 by professionally qualified independent valuers and brought in to the Financial Statements in the same year. The revaluation process was carried out as per the Central bank of Sri Lanka Direction No. 1 of 2014 on “Valuation of Immovable Property of Licensed Specialised Banks”. The Board of Directors is on the view that revalued amounts are not in excess of the current market values.
Stated Capital and Shareholding
Stated capital
The authorised share capital of the Bank is Rs. 10 Bn. which is made of One Billion ordinary shares of Rs. 10/- each. The issued share capital of the Bank as at 31 December 2019 stood at Rs. 9.4 Bn. The Secretary to the Treasury in his official capacity holds the entirety of the issued share capital. The details are given on pages 383 and 386 in Notes 43 on Stated Capital/Assigned Capital and Note 46.1 on Unclaimed Deposit Reserve.
Shareholding
The Government of Sri Lanka is the sole shareholder of the National Savings Bank.
Borrowed capital
The Bank issued an International Bond for a value of USD 250 Mn. in September 2014,which matured in September 2019. Information of Borrowed capital is given in Note 37.1 on page 371 of this Annual Report.
Issue of subordinated debenture
Subordinated liabilities of the Bank as at December 31, 2019 consisted Rs. 6 Bn. Rated, Unsecured Subordinated and Redeemable debentures of Rs. 100 issued on 29 December 2016 as Private Placement. This Debenture is eligible for the Tier II Capital of the Bank. The details of debentures outstanding as at the date of Financial Position are given in Note 37.2 of the Financial Statements on page 371 on Subordinated Liabilities.
Issue of senior debenture
Outstanding debenture of the Bank as at December 31, 2019 consisted of Rs. 20 Bn. Unlisted Rated, Senior Unsecured Redeemable debentures of Rs. 100/- issued on 28 August 2019 as Private Placement. Information on Senior Debenture is given in Note 37.3 on page 372 of this Annual Report.
Share information
The basic earnings per share and net assets value per share of the Bank 2019 were Rs. 7.13 (2018 – Rs. 6.72) and Rs. 47.21 (2018 – Rs. 45.85) respectively for the period under review. The details are given in Note 14 on basic earnings per ordinary share on page 334 and Note 50 on net assets value per ordinary share on page 395.
Corporate Sustainability and Responsibility (CSR)
The programmes carried out under the Corporate Social Responsibility are detailed on pages 160 to 161 in this Annual Report.
Board of Directors
Information of the Directors during the year 2019.
The Board of Directors comprises seven Directors including the Chairman and two Ex Officio Members representing the Ministry of Finance and the Postmaster General as per the Section 11 (1) of the NSB Act No. 30 of 1971 as amended by Act No. 28 of 1995. The Minister of Finance appoints the Chairman and other four Directors. The following were the Directors during the year and their brief profiles appear on pages 201 to 203 of this Annual Report.
Name Date of appointment Membership status
Mr R M P Rathnayake, Chairman (up to 19.02.2019) 19.11.2018 NED/NIDMr H N J Chandrasekera, Chairman (up to 25.11.2019) 05.03.2019 NED/NIDMr A K Seneviratne, Director (Ex-officio) (up to 28.02.2019) 27.05.2015 NED/NIDMr U G R Ariyaratne, Director (Ex-officio) 31.08.2018 NED/NID (ID until 24.10.2019)Dr D Shanmugasundaram, Director (up to 09.04.2019) 03.09.2018 NED/IDMr Anil Rajakaruna, Director (up to 05.12.2019) 28.02.2019 NED/NIDMr Ajith Pathirana, Director (up to 02.12.2019) 12.03.2019 NED/NIDMr Nazri Nizar, Director (up to 20.11.2019) 26.03.2019 NED/NID (ID until 24.10.2019)Mr P Algama, Director (Ex Officio) (up to 22.01.2020) 28.02.2019 NED/NID
NED – Non-Executive Director, NID – Non-Independent Director, ID – Independent Director
The details on current composition of the Board and the profiles of the members are given on pages 177 to 179 of the Annual Report.

Governance Financial Reports Supplementary Information
281Annual Report 2019 │ National Savings BankAnnual Report of Board of Directors
List of Directors of the Subsidiaries of the Bank
Names of the Directors of NSB Fund Management Co. Ltd. during the year 2019 are as follows:
Mr R M P Rathnayake – Chairman, (until 19 February 2019)
Mr H N J Chandrasekera – Chairman (w.e.f. 14 March 2019)
Mr S D N Perera
Mr Ajith Pathirana
Mr D S Kudahetty
Ms R E Dangalla
Mr K D A G Wickramasinghe
Mr K D M P Weerasinghe
Names of the Directors of Sri Lanka Savings Bank Limited appointed on 24 October 2019 are as follows:
Mr H N J Chandrasekera, Chairman
Mr U G R Ariyaratne
Mr Anil Rajakaruna
Mr Ajith Pathirana
Mr Nazri Nizar
Mr P Algama
Board subcommittees
The Board of Directors while assuming the overall responsibility and accountability has also appointed four mandatory Board Sub Committees namely; Board Audit Committee, Board Human Resource and Remuneration Committee, Board Nomination Committee and Board Integrated Risk Management Committee as required by the Banking Act Direction No. 12 of 2007 on “Corporate Governance for Licensed Specialised Banks in Sri Lanka” issued by the CBSL to ensure oversight control over affairs of the Bank.
The Board of Directors has also appointed two other voluntary Board Sub Committees namely; Board Credit Committee and Board Information Technology Strategy Committee to assist the Board in discharging its
duties. The Terms of Reference of these Board Sub Committees conform to the recommendations made by regulatory bodies such as CBSL and NSB Act as well as voluntary codes issued by the CA Sri Lanka.
The composition of both mandatory and voluntary Board Sub Committees as at 31 December 2019 and the details of the attendance by Directors at meetings are disclosed in pages 204 to 205 and the Reports of these Sub Committee are given on pages 233 to 247.
Directors’ Meetings
The details of Directors’ meetings which comprise of Board Meetings and Board Sub Committee Meetings and the attendance are given in the Corporate Governance Report on pages 204 to 205 of the Annual report.
Directors’ Interests in Contracts
Directors’ interests in contracts with the Bank, both direct and indirect are referred to in Note 49.5.2 to the Financial Statements on page 392. These interests have been declared at the Board meetings. The Directors do not have any direct or indirect interest in other contracts or proposed contracts with the Bank.
Directors’ Interest in Debentures issued by the Bank
There were no Debentures registered in the name of any Director.
Directors’ Remuneration and Other Benefits
Details of Directors’ emoluments and other benefits in respect of the Bank and the Group for the financial year 2019 are given in Note 49.5.1 to the Financial Statements on page 392.
Related party transactions
The Directors have also disclosed the transactions if any, that could be classified as related party transactions in terms of Sri Lanka Accounting Standard (LKAS) 24 – “Related Party Disclosures” which is adopted in the preparation of the Financial Statements. Those transactions disclosed by the Directors are given in Note 49.5.3 on page 392 to the Financial Statements forming part of the Annual Report of the Board of Directors.
Environmental protection
The Group and the Bank have not, to the best of their knowledge, engaged in activity, which was detrimental to the environment. Specific measures taken to protect the environment are given on pages 162 to 169.
Statutory Payments
The Directors, to the best of their knowledge and belief, are satisfied that all statutory payments due to the Government, other regulatory bodies and in relation to the employees have been made in time.
Events after the reporting date
No circumstances have arisen since the Reporting date which would require adjustments to, or disclosure in the accounts, other than those disclosed in Note 52 to the Financial Statements on page 395.
Going Concern
The Board of Directors have reviewed and satisfied that the Bank has ample resources to continue its operations in the foreseeable future. Furthermore, the Directors are not aware of any material uncertainties that may cast significant doubt upon the Bank’s ability to continue as a going concern, such as restrictions or plan to curtail operations.

Governance Financial Reports Supplementary Information
282 National Savings Bank │ Annual Report 2019 Annual Report of Board of Directors
Risk management, internal controls and management information systems
The Board of Directors assumes overall responsibility for managing risk. For this purpose, the Board of Directors has instituted and implemented an effective and comprehensive system of internal controls and management information systems in the Bank. Internal control systems have been redesigned to mitigate the risks to which the Bank is exposed, to provide reasonable assurance against material misstatements or loss. There is an ongoing process for identifying, evaluating and managing the risks that are faced by the Bank. The specific measures taken by the Bank in mitigating the risk are detailed on pages 248 to 274 in Risk Management Report and Board Integrated Risk Management Report on pages 241 to 243 of this Report.
Appointment of Auditors, their remuneration
The Auditor General is the Auditor of National Savings Bank in terms of the provisions of Article 154 of the Constitution of the Democratic Socialist Republic of Sri Lanka.
The expenses incurred in respect of audit fees and other services rendered during the accounting period are given in Note 12 to the Financial Statements on page 332.
Regulatory supervision
As a regulatory supervisory body, the Central Bank of Sri Lanka carried out a periodic examination of the records and affairs of the Bank to ascertain compliance with directives issued by the Central Bank of Sri Lanka. It also determines whether required financial indicators are being maintained at the required level so that the interests of the stakeholders, particularly depositors are safeguarded.
Corporate governance
In the management of the Bank, the Directors have placed emphasis on conforming with, the best Corporate Governance Practices and Procedures. Accordingly, the Directors have declared that:
(a) The Bank has complied with applicable laws and regulations in conducting its business and have not engaged in any activity breaching the relevant laws and regulations.
(b) They have declared all material interest in contracts involving the Bank and refrained from involving any matter which they have a material interest.
(c) The business is a going concern and the Board of Directors have reviewed the Strategic Business Plan and is satisfied that the Bank is having adequate resources to accelerate the future momentum of NSB in foreseeable future. Thus, the Financial Statements of the Bank and its subsidiaries are prepared based on the going concern assumption.
(d) The Bank has disclosed in the Financial Statements on Related Party Transactions.
(e) The Bank has conducted a review on internal controls which covers financial, operational and compliance controls, risk management and have obtained a reasonable assurance of their effectiveness and adherence.
Sustainability
When formulating its business strategies, the Bank has considered the sustainability aspects, the details of which are disclosed in pages 51 to 53.
Human resources
The Bank continued to develop and maintain dedicated and highly-motivated employees who are committed to create sustainable value through high quality service. Significant investments have been made in the development of quality of Human Capital of the Bank. The policies and procedures adopted by the Bank to upgrade Human Capital is described in the Annual Report 2019 on pages 130 to 143.
Outstanding litigation
In the opinion of the Directors and the Bank’s lawyers, outstanding litigation against the Bank disclosed in Note 51 to the Financial Statements on page 395 will not have a material impact on the financial position of the Bank or its future operations.
Acknowledgement of the contents of the report
The Board of Directors hereby acknowledge the contents of this Annual Report.
By Order of the Board,
Ms Keasila JayawardenaChairperson
M A P Muhandiram Secretary to the Board
24 March 2020Colombo

Governance Financial Reports Supplementary Information
283Annual Report 2019 │ National Savings Bank
Statement of Directors’ Responsibility for Financial ReportingThe responsibility of the Directors in relation to the Financial Statements of the National Savings Bank (the Bank) and Consolidated Financial Statements of the Bank and its Subsidiaries (the Group) are set out in this statement.
Financial Statements
The Directors of the Bank are responsible for ensuring that the Bank and the Group keep proper books of accounts of all the transactions and prepare Financial Statements in accordance with Generally Accepted Accounting Principles, Sri Lanka Accounting Standards and Sri Lanka Financial Reporting Standards that give a true and fair view of the financial position of the Bank and the Group at the end of each financial year in compliance with the relevant statutory requirements. The Financial Statements comprise of the Statement of Financial Position as at December 31, 2019, the Income Statement and the Statement of Comprehensive Income, Statement of Changes in Equity and Statement of Cash Flows for the year ended 2019 and Significant Accounting Policies and Notes thereto.
Accordingly, the Board of Directors confirm that, the Financial Statements of the Bank and its Subsidiaries give a true and fair view of the:
1. Financial Position of the Bank and its Subsidiaries as at 31 December 2019; and
2. Financial performance of the Bank and its Subsidiaries for the financial year then ended.
In preparing these Financial Statements, the Directors are required to ensure that:
1. The accounting policies adopted to prepare the Financial Statements which are depicted in pages 306 to 322 were appropriate according to the existing financial reporting frame work. These policies were consistently applied and adequately disclosed.
2. Reasonable and prudent judgments have been made where necessary to ensure the proper reflection of the form and substance of transaction when preparing the Financial Statements.
3. The Financial Statements of the Bank and the Group are prepared in accordance with the Sri Lanka Accounting Standards (SLFRS/LKASs).
As per the provisions of the Finance Act No. 38 of 1971, the Banking Act No. 30 of 1988 and Section 7 (i) of NSB Act No. 30 of 1971, the Board of Directors is required to control and administer the affairs and the business of the Bank.
The Board of Directors ensures that the Financial Statements comply with the prescribed format issued by the Central Bank for Licensed Banks.
The Board of Directors are also responsible for ensuring that proper accounting records which correctly record and explain the Bank’s financial position, with reasonable accuracy at any point of time is determined by the Bank, enabling preparation of the Financial Statements.
The Board of Directors accepts the responsibility for the integrity and objectivity of the Financial Statements presented in this Annual Report (Financial Statements are exhibited
on pages 296 to 305). The Financial Statements for the year 2019 prepared and presented in this Annual Report are consistent with the underlying books of accounts and are in conformity with the requirements of Sri Lanka Accounting Standards, Sri Lanka Accounting and Auditing Standards Act No. 15 of 1995 and Banking Act No. 30 of 1988 and amendments thereto.
Internal controls
The Board of Directors has been responsible for taking reasonable measures and care to safeguard the assets of the Bank and the Group, detect frauds and other irregularities and has also instituted an effective and comprehensive system of internal controls and an effective system of monitoring its effectiveness which includes internal audit and applied and practiced within predetermined procedures and limits. The Directors ensure that the Financial Statements are reviewed by them directly at their regular meetings and also through the Board Audit Committee. The Directors’ Statement on Internal Control Over Financial Reporting is given on page 285 of this Annual Report and Auditor General’s Assurance Report on the Bank’s Internal Control is given on page 287.
Audit report
The Auditor General has been made available with all records of the Bank including the Financial Statements by the Board of Directors and provided every opportunity to undertake the inspections they considered appropriate all of which the Auditor General’s Department has examined and have expressed the Auditor General’s opinion which appears as reported by him on page 293 of this Annual Report.

Governance Financial Reports Supplementary Information
284 National Savings Bank │ Annual Report 2019 Statement of Directors’ Responsibility for Financial Reporting
Compliance report
The Directors confirm that to the best of their knowledge and belief that all taxes, duties and levies payable by the Bank and the Group and all contributions and taxes payable on behalf of and in respect of employees of the Bank and the Group, and all other known statutory dues to the Government and the other relevant regulatory and statutory authorities which were due and payable by the Bank and the Group as at the date of Statement of Financial Position have been paid or where relevant provided for. Further, the Directors have confirmed that after considering the financial position, operating conditions and regulatory and other factors and such matters required to be addressed in the ‘Code of Best Practice on Corporate Governance Code’ issued by CA Sri Lanka.
The Bank and the Group have adequate resources to continue in operation for the foreseeable future and to justify the application of the going concern basis in preparing these Financial Statements and the Board has taken all necessary measures to comply with the directives issued by the Central Bank of Sri Lanka.
By Order of the Board,
M A P MuhandiramSecretary to the Board
24 March 2020Colombo

Governance Financial Reports Supplementary Information
285Annual Report 2019 │ National Savings Bank
Directors’ Statement on Internal Control over Financial Reporting
Responsibility
This report has been issued in line with the Banking Act Direction No. 12 of 2007, Section 3 (8)(ii)(b), and prepared based on principles D.1.5 of Code of Best Practice on Corporate Governance 2017 issued by CA Sri Lanka (Code) the Board of Directors presents this report on internal control.
The Board of Directors (The Board) is responsible for ensuring that an adequate and effective system of internal control is established and maintained at the National Savings Bank. However, such a system is designed to manage the Bank’s significant risk areas within acceptable risk parameters, rather than eliminating the risk of failure to achieve business objectives of the Bank. Accordingly, the system of internal controls can only provide reasonable but not absolute assurance against material misstatement of management and financial information and records or against financial losses or frauds.
The Board has established an ongoing process for identifying, evaluating and managing the significant risks faced by the Bank and this process includes enhancing the system of internal controls as and when there are changes to business environment or regulatory requirements and other guidelines. The process is regularly reviewed by the Board and confirmed the compliance with the Guidance for Directors of the Bank’s on the Directors Statement on Internal Controls issued by The Institute of Chartered Accountants of Sri Lanka. The Board has assessed the internal control system taking into principles for the assessment of internal Control System as given in that guidance.
The Board is of the view that the system of internal controls in place is sound and adequate to provide reasonable assurance regarding the reliability of financial reporting, and the preparation of Financial Statements for external purposes and is in accordance with the relevant accounting principles and regulatory requirements.
The Management assists the Board in the implementation of the Board’s policies and procedures on risk and control by identifying and assessing the risks faced by the Bank, and in the design, operation and monitoring of suitable internal controls to mitigate and control these risks.
Key features of the process adopted in applying and reviewing the design and effectiveness of the internal control system on financial reporting
The Board has also put in place the system of reviewing the design and the effectiveness of system of internal control periodically. The key processes, among other things include the following:
z The Board Subcommittees have been established with defined scopes and functions to assist the Board in ensuring the effectiveness of the Bank’s operations and that the Bank’s operations are in accordance with the corporate objectives, strategies, and policies and business directions that have been approved.
z The Board Audit Committee (BAC) reviews periodically the internal control issues identified by the Internal Audit Division of the Bank, the External Auditors, Regulatory Authorities and corrective actions taken to rectify such deficiencies. The Auditor General carries out
the external audit of the Bank. The Superintendent of the Government Audit is generally invited to BAC meetings.
z The BAC reviews the internal audit function with particular emphasis on the scope of audits and quality of the same. The activities attended to by the BAC during the year 2019 are set out in the Board Audit Committee report appearing on page 233 of this Annual Report. The Internal Audit Division of the Bank carries out audit of branches, divisions and other units as per the Annual Audit Plan. The frequency of audit is determined by the level of risk assessed. The Audit Plan is approved by the BAC for implementation. The Internal Audit Division carries out audit checks to ensure compliance with policies and procedures and the effectiveness of the internal control systems and reports its findings in respect of any non-compliance. Audits are carried out to provide an independent and objective report on operational and management activities. The findings of the audits are submitted to the BAC for review at their periodic meetings. The activities of the BAC, along with minutes of the Committee meetings are submitted for information of the Board on a periodic basis.
z The Board Integrated Risk Management Committee (BIRMC) has been established by the Board to assist the Board to oversee the overall management of principal areas of risk of the Bank. The Board has also established an independent Compliance Unit which ensures that Bank’s activities are conducted in accordance with applicable laws, regulations and regulatory directives and any issues of non-compliance are reported to BIRMC periodically. The report on the Risk Assessment is submitted by the BIRMC to the Board periodically.

Governance Financial Reports Supplementary Information
286 National Savings Bank │ Annual Report 2019 Directors’ Statement on Internal Control over Financial Reporting
z Management level committees have also been functioning with appropriate empowerment to ensure effective management and supervision of Bank’s core areas in the day-to-day business operations. The assessment covered only the process applied by the Bank and did not include the processes carried out by its Subsidiaries.
The Bank adopted the new Sri Lanka Accounting Standards Comprising LKAS and SLFRS in 2012. Since adoption of such Sri Lanka Accounting Standards, continue monitoring and progressive enhancement on processes to comply with new requirements of recognition, measurement, classification and disclosure are being made.
The Board also has taken into consideration the requirements of the Sri Lanka Accounting Standard – SLFRS 16 on “Leases” that is effective from 1 January 2019. Accordingly, the impact has been assessed and incorporated into the Financial Statements.
Confirmation
Based on the above processes, the Board of Directors confirms that the financial reporting system of the Bank has been designed to provide reasonable assurance regarding their liability of financial reporting and the preparation of Financial Statements for external purposes has been done in accordance with Sri Lanka Accounting Standards and regulatory requirements of the Central Bank of Sri Lanka.
Review of the statement by the external Auditors
The External Auditors, the Auditor General has reviewed the above Directors’ Statement on Internal Control over financial reporting for the year ended 31 December 2019 and report to the Board of Directors that nothing has come to their attention that causes them to believe that the statement is inconsistent with their understanding of the process adopted by the Board in the review of the design and effectiveness of the internal control system over financial reporting of the Bank. Their Report on the Statement of Internal Control over Financial Reporting is given on page 287 of this annual report.
By Order of the Board,
Ms Keasila JayawardenaChairperson
Manohari AbeysekeraChairperson – Board Audit Committee/Director
Dr Kapila SenanayakeDirector
24 March 2020Colombo

Governance Financial Reports Supplementary Information
287Annual Report 2019 │ National Savings Bank
The Chairperson
National Savings Bank
Independence Assurance Report of the Auditor General to the Board of Directors on the Directors’ Statement on Internal Control of National Savings Bank.
IntroductionThis report is to provide assurance on the Directors’ Statement on Internal Control over financial reporting (“Statement”) of National Savings Bank included in the annual report for the year ended 31 December 2019.
Management’s responsibilityManagement is responsible for the preparation and presentation of the Statement in accordance with the “Guidance for Directors of Bank on the Directors’ Statement on Internal Control” issued in compliance with the section 3 (8) (ii) (b) of the Banking Act Direction No. 12 of 2007, by the Institute of Chartered Accountants of Sri Lanka.
My responsibilities and compliance with SLSAE 3050 (revised)My responsibility is to assess whether the statement is both supported by the documentation prepared by or for directors and appropriately reflects the process the directors have adopted in
reviewing the design and effectiveness of the internal control of the National Savings Bank.
I conducted this engagement in accordance with Sri Lanka Standard on Assurance Engagements SLSAE 3050 (Revised) – Assurance Report for Banks on Directors’ Statement on Internal Control issued by the Institute of Chartered Accountants of Sri Lanka.
This standard required that I plan and perform procedures to obtain limited assurance about whether management has prepared, in all material aspects, the statement on internal control.
For the purpose of this engagement, I am not responsible for updating or reissuing any reports, nor have I, in the course of this engagement, performed and audit or review of the financial information.
Summary of work performedI conducted my engagement to assess whether the statement is supported by the documentation prepared by or for Directors; and appropriately reflected the process the Directors have adopted in reviewing the system of internal control over financial reporting of the Bank.
The procedures performed were limited primarily to inquiries of Bank personnel and the existence of documentation on a sample basis that supported the process adopted by the Board of Directors.
SLSAE 3050 (Revised) does not require me to consider whether the Statement covers all risks and controls, or to form an opinion on the effectiveness of the Bank’s risk and control procedures. SLSAE 3050 (Revised) also does not require me to consider whether the processes described to deal with material internal control aspects of any significant problems disclosed in the annual report will, in fact, remedy the problems.
The Procedures selected depend on my judgment, having regard to my understanding of the nature of the bank, the event or transaction in respect of which the statement has been prepared.
I believe that the evidence I have obtained is sufficient and appropriate to provide a basis for my conclusion.
My conclusionBased on the procedures performed, nothing has come to my attention that causes me to believe that the Statement included in the annual report is inconsistent with my understanding of the process the Board of Directors has adopted in the review of the design and effectiveness of internal control system over the financial reporting of the Bank.
W P C WickramaratneAuditor General
Independent Assurance Report on Internal Control

Governance Financial Reports Supplementary Information
288 National Savings Bank │ Annual Report 2019
Independent Assurance Report
KPMG Tel : +94 - 11 542 6426(Chartered Accountants) Fax : +94 - 11 244 587232A, Sir Mohamed Macan Markar Mawatha, : +94 - 11 244 6058P. O. Box 186, : +94 - 11 254 1249Colombo 00300, Sri Lanka. Internet : www.kpmg.com/lk
M.R. Mihular FCA P.Y.S. Perera FCA C.P. Jayatilake FCAT.J.S. Rajakarier FCA W.W.J.C. Perera FCA Ms. S. Joseph FCAMs. S.M.B. Jayasekara ACA W.K.D.C Abeyrathne FCA S.T.D.L. Perera FCAG.A.U. Karunaratne FCA R.M.D.B. Rajapakse FCA Ms. B.K.D.T.N. Rodrigo FCAR.H. Rajan ACA M.N.M. Shameel ACA Ms. C.T.K.N. Perera ACAA.M.R.P. Alahakoon ACA
Principals - S.R.I. Perera FCMA(UK), LLB, Attorney-at-Law, H.S. Goonewardene ACA, Ms. P.M.K. Sumanasekara FCA
Independent Assurance Report to National Savings Bank
We have been engaged by the Directors of National Savings Bank (“ the Bank”) to provide reasonable assurance and limited assurance in respect of the Sustainability Indicators as identified below for the year ended 31 December 2019. The Sustainability Indicators are included in National Savings Bank’s Integrated Annual Report for the year ended 31 December 2019 (the “Report”).
The reasonable assurance sustainability indicators covered by our reasonable assurance engagement are:
Assured Sustainability Indicators as per statutory Financial Statements (audited) for the year ended 31 December 2019, dated 24 March 2020 and the audit report dated 30 March 2020 thereon
Integrated Annual
Report page
Financial highlights 11
The limited assurance sustainability indicators covered by our limited assurance engagement are:
Limited assurance –sustainability indicators
Integrated Annual Report
page
Non-financial highlights 9Information provided on followingFinancial capital 90-11Manufactured capital 112-119Intellectual capital 120-129Human capital 130-143Social and relationship capital 144-161Natural capital 162-169
Our conclusions
Our conclusion has been formed on the basis of, and is subject to, the matters outlined in this Report. We believe that the evidence we have obtained is sufficient and appropriate to provide a basis for our conclusions.
Reasonable assurance-sustainability indicators
In our opinion, the Reasonable Assurance-Sustainability Indicators, as defined above, for the year ended 31 December 2019 are, in all material respects, prepared and presented in accordance with the Consolidated Set of Global Reporting Initiative Sustainability Reporting Standards Guidelines.
Limited assurance-sustainability indicators
Based on the limited assurance procedures performed and evidence obtained, as described below, nothing has come to our attention that causes us to believe that the Limited Assurance Sustainability Indicators, as defined above, for the year ended 31 December 2019, have not in all material respects, been prepared and presented in accordance with the Consolidated Set of Global Reporting Initiative Sustainability Reporting Standards Guidelines.
Management’s responsibility
Management is responsible for the preparation and presentation of the Reasonable Assurance Sustainability Indicators and the Limited Assurance Sustainability Indicators in accordance with the Consolidated Set of Global Reporting Initiative Sustainability Reporting Standards Guidelines.
These responsibilities includes establishing such internal controls as Management determines are necessary to enable the preparation of the Reasonable Assurance Sustainability Indicators and the Limited Assurance Sustainability Indicators that are free from material misstatement whether due to fraud or error.
Management is responsible for preventing and detecting fraud and for identifying and ensuring that the Bank complies with laws and regulations applicable to its activities.
Management is also responsible for ensuring that staff involved with the preparation and presentation of the description and Report are properly trained, information systems are properly updated and that any changes in reporting encompass all significant business units.

Governance Financial Reports Supplementary Information
289Annual Report 2019 │ National Savings BankIndependent Assurance Report
Our responsibility
Our responsibility is to express a reasonable assurance conclusion on the Bank’s preparation and presentation of the Reasonable Assurance Sustainability Indicators and a limited assurance conclusion on the preparation and presentation of the Limited Assurance Sustainability Indicators included in the Report, as defined above.
We conducted our assurance engagement in accordance with Sri Lanka Standard on Assurance Engagements SLSAE 3000: Assurance Engagements other than Audits or Reviews of Historical Financial Information (SLSAE 3000) issued by The Institute of Chartered Accountants of Sri Lanka.
We have complied with the independence and other ethical requirements of the Code of Ethics issued by the Institute of Chartered Accountants of Sri Lanka.
SLSAE 3000 requires that we plan and perform the engagement to obtain reasonable assurance about whether the Reasonable Assurance Sustainability Indicators are free from material misstatement and limited assurance about whether the Limited Assurance Sustainability Indicators are free from material misstatement.
Reasonable Assurance Over Reasonable Assurance Sustainability Indicators
The procedures selected in our reasonable assurance engagement depend on our judgement, including the assessment of the risks of material misstatement of the Reasonable Assurance Sustainability Indicators whether due to fraud or error.
In making those risk assessments, we have considered internal control relevant to the preparation and presentation of the Reasonable Assurance Sustainability Indicators in order to design assurance procedures that are appropriate in the circumstances, but not for the purposes of expressing a conclusion as to the effectiveness of the Bank's internal control over the preparation and presentation of the Report.
Our engagement also included assessing the appropriateness of the Reasonable Assurance Sustainability Indicators, the suitability of the criteria, being the Consolidated Set of Global Reporting Initiative Sustainability Reporting Standards Guidelines, used by the Bank in preparing and presenting the Reasonable Assurance Sustainability Indicators within the Report, obtaining an understanding of the compilation of the financial and non-financial information to the sources from which it was obtained, evaluating the reasonableness of estimates made by the Bank, and recomputation of the calculations of the Reasonable Assurance Sustainability Indicators.
Limited Assurance on the Assured Sustainability Indicators
Our limited assurance engagement on the Limited Assurance Sustainability Indicators consisted of making enquiries, primarily of persons responsible for the preparation of the Limited Assurance Sustainability Indicators, and applying analytical and other procedures, as appropriate. These procedures included:
z interviews with Senior Management and relevant staff at corporate and selected site level concerning sustainability strategy and policies for material issues, and the implementation of these across the business;
z enquiries of management to gain an understanding of the Bank's processes for determining material issues for the Bank’s key stakeholder groups;
z enquiries of relevant staff at corporate and selected site level responsible for the preparation of the Limited Assurance Sustainability Indicators;
z enquiries about the design and implementation of the systems and methods used to collect and report the Limited Assurance Sustainability Indicators, including the aggregation of the reported information;
z comparing the Limited Assurance Sustainability Indicators to relevant underlying sources on a sample basis to determine whether all the relevant information has been appropriately included in the Report;
z reading the Limited Assurance Sustainability Indicators presented in the Report to determine whether they are in line with our overall knowledge of, and experience with, the sustainability performance of the Bank;
z reading the remainder of the Report to determine whether there are any material misstatements of fact or material inconsistencies based on our understanding obtained as part of our assurance engagement.
The procedures performed in a limited assurance engagement vary in nature and timing from, and are less in extent than for, a reasonable assurance engagement, and consequently the level of assurance obtained in a limited assurance engagement is substantially lower than the assurance that would have been obtained had a reasonable assurance engagement been performed. Accordingly, we do not express a reasonable assurance conclusion on the Limited Assurance Sustainability Indicators.

Governance Financial Reports Supplementary Information
290 National Savings Bank │ Annual Report 2019 Independent Assurance Report
Purpose of our report
In accordance with the terms of our engagement, this assurance report has been prepared for the Bank for the purpose of assisting the Directors in determining whether the Bank’s Reasonable and Limited Assurance Sustainability Indicators are prepared and presented in accordance with the Consolidated Set of Global Reporting Initiative Sustainability Reporting Standards Guidelines and for no other purpose or in any other context.
Restriction of use of our report
Our report should not be regarded as suitable to be used or relied on by any party wishing to acquire rights against us other than the Bank, for any purpose or in any other context. Any party other than the Bank who obtains access to our report or a copy thereof and chooses to rely on our report (or any part thereof) will do so at its own risk. To the fullest extent permitted by law, we accept or assume no responsibility and deny any liability to any party other than the Bank for our work, for this independent assurance report, or for the conclusions we have reached.
Chartered AccountantsColombo1 April 2020

Governance Financial Reports Supplementary Information
291Annual Report 2019 │ National Savings Bank
General Manager/CEO’s and Senior Deputy General Manager’s (Finance and Planning) Statement of Responsibility
Compliance
The Financial Statements of the National Savings Bank (the Bank) and the Consolidated Financial Statements of the Bank and its Subsidiaries (the Group) as at 31 December 2019 are prepared and presented in compliance with the following:
z National Savings Bank Act No. 30 of 1971 and amendments thereto.
z Finance Act No. 38 of 1971. z Sri Lanka Accounting and Auditing
Standards Act No. 15 of 1995. z Banking Act No. 30 of 1988 and
amendments thereto and Directions, Determinations and Guidelines issued by the Central Bank of Sri Lanka (CBSL) there under relating to Financial Statements formats and disclosure of information.
z Sri Lanka Financial Reporting Standards/Sri Lanka Accounting Standards (SLFRSs/LKASs) issued by The Institute of Chartered Accountants of Sri Lanka (CA Sri Lanka).
z Code of Best Practices on Corporate Governance 2017 issued by The Institute of Chartered Accountants of Sri Lanka (CA Sri Lanka).
z The Banking Act Direction No. 12 of 2007 on Corporate Governance issued by the CBSL.
The formats used in the preparation of the Financial Statements and disclosures made, comply with the specified formats prescribed by the Central Bank of Sri Lanka which are also in compliance with the disclosure requirements of the Sri Lanka Accounting Standard 1 (LKAS 1) – ‘Presentation of Financial Statements’. The Bank and the Group present the financial results to its users on a quarterly basis.
The Accounting Policies used in the preparation of the Financial Statements are appropriate and are consistently applied by the Bank and the Group. The Significant Accounting Policies and estimates that involved a high degree of judgment and complexity were discussed with the Bank’s External Auditors and the Board Audit Committee (BAC).
There were no changes to the Accounting Policies and methods of computation since the publication of the Annual Report for the year ended 31 December 2018, except for the accounting policies and methods of computation adopted to be in compliant with the requirements of the Sri Lanka Accounting Standard SLFRS 16 on “Leases”, which became effective for Annual Financial periods from 1 January 2019. SLFRS 16 requires the recognition of lease liabilities and right-of-use assets for leases previously classified as operating leases in accordance with LKAS 17 on “Leases”. As permitted by paragraph 5 (b) of the Appendix C of SLFRS 16, the Bank opted not to restate Financial Statements of prior periods and to recognise lease liability and right-of-use assets in line with the paragraph 8 (a) and 8 (b) i of the Appendix C of SLFRS 16. Accordingly comparative information has not been amended to comply with the current presentation.
We confirm that to the best of our knowledge, the Financial Statements, Significant Accounting Policies and other financial information included in this Annual Report, fairly present in all material aspects of the assets, liabilities, results of the operations and the cash flows of the Bank and the Group during the year under review and given a true and fair view of the Financial
Statements. We also confirm that the Bank and the Group have adequate resources to continue in operation and have applied the going concern basis in preparing these Financial Statements.
Responsibility of internal control and procedures
We are responsible for establishing, implementing and maintaining Internal Controls and Procedures of the Bank and its Subsidiaries. We ensure that effective Internal Controls and Procedures are in place ensuring material information relating to the Bank and the Group is made known to us for safeguarding assets, preventing and detecting fraud and/ or error as well as other irregularities, which are reviewed, evaluated and updated on an ongoing basis. We are satisfied that there were no significant deficiencies and weaknesses in the design or operation of the Internal Controls and Procedures, to the best of our knowledge. We confirm, based on our evaluations, that there were no significant deficiencies and material weaknesses in the design or operation of internal controls and procedures, to the best of our knowledge. We confirm, based on our evaluations, that there were no significant deficiencies and material weaknesses in the design or operation of internal controls and any fraud that involved management or other employees. The Bank’s Internal Auditors also conduct periodic reviews to ensure that the established Internal Controls over Financial Reporting and Procedures are consistently followed. However, there are inherent limitations that should be recognised in weighing the assurance provided by any system of internal control and accounting.

Governance Financial Reports Supplementary Information
292 National Savings Bank │ Annual Report 2019 General Manager/CEO’s and Senior Deputy General Manager’s (Finance and Planning) Statement of Responsibility
Directors’ Statement on Internal Control over Financial Reporting is provided on page 285 of this Annual Report. The Auditor General have audited the effectiveness of the Internal Controls over financial reporting adapted by the Bank and have given an unqualified opinion is provided on page 287 of this Annual Report.
External audit
The Financial Statements of the Bank and its Subsidiaries were audited by the Auditor General. The Auditor General’s Report on the Bank’s Consolidated Financial Statements is given on page 293. of this Annual Report. The Board Audit Committee, inter alia, reviewed all Internal Audit and Inspection Programmes, the efficiency of Internal Control Systems and Procedures and also reviewed the Significant Accounting Policies and their adherence to statutory and regulatory requirements, the details of which are given in the Board Audit Committee report on pages 233 to 236 of this Annual Report. To ensure complete independence, the Auditor General and the Internal Auditors have full and free access to the members of the Board Audit Committee to discuss any matter of substance.
Confirmation
We confirm that to the best of our knowledge
z The Bank and the Group have complied with all applicable laws and regulations and prudential requirements
z There are no material non- compliances and
z There are no material litigations that are pending against the Bank and the Group other than those disclosed in Note 51 on page 395 of the Financial Statements.
z All taxes, duties, levies and all statutory payments payable by the Bank and the Group and all contributions, levies and taxes payable on behalf of and in respect of the employees of the Bank and the Group as at 31 December 2019 have been paid, or where relevant, provided for.
Damitha RathnayakeActing General Manager/CEO
Kithsiri WijeyaratneSenior Deputy General Manager(Finance and Planning)
24 March 2020Colombo

Governance Financial Reports Supplementary Information
293Annual Report 2019 │ National Savings Bank
Auditor General’s Report
Chairperson
National Savings Bank Report of the Auditor General on the Financial Statements and Other Legal and Regulatory Requirements of the National Savings Bank and its subsidiaries for the year ended 31 December 2019 in terms of Section 12 of the National Audit Act No. 19 of 2018.
1. Financial Statements1.1 Opinion
The audit of the financial statements of the National Savings Bank (the “Bank”) and the Consolidated Financial Statements of the Bank and its subsidiaries (“Group”) for the year ended 31 December 2019 comprising the statement of financial position as at 31 December 2019 and the Income statement, statement of comprehensive income, statement of changes in equity and cash flow statement for the year then ended, and notes to the financial statements, including a summary of significant accounting policies, was carried out under my direction in pursuance of provisions in Article 154(1) of the Constitution
of the Democratic Socialist Republic of Sri Lanka read in conjunction with provisions of the National Audit Act No. 19 of 2018. My report to Parliament in pursuance of provisions in Article 154 (6) of the Constitution will be tabled in due course.
In my opinion, the accompanying financial statements of the Bank and the Group give a true and fair view of the financial position of the Bank and the Group as at 31 December 2019, and of their financial performance and cash flows for the year then ended in accordance with Sri Lanka Accounting Standards.
1.2 Basis for Opinion
I conducted my audit in accordance with Sri Lanka Auditing Standards (SLAuSs). My responsibilities, under those standards are further described in the Auditor’s Responsibilities for the Audit of the Financial Statements section of my report. I believe that the audit evidence I have obtained is sufficient and appropriate to provide a basis for my opinion.
1.3 Responsibilities of Management and Those Charged with Governance for the Financial Statements
Management is responsible for the preparation of financial statements that give a true and fair view in accordance with Sri Lanka Accounting Standards, and for such internal control as management determine is necessary to enable the preparation of financial statements that are free from material misstatement, whether due to fraud or error.
In preparing the financial statements, management is responsible for assessing the Group’s ability to continue as a going concern, disclosing, as applicable, matters related to going concern and using the going concern basis of accounting unless management either intends to liquidate the Group or to cease operations, or has no realistic alternative but to do so.
Those charged with governance are responsible for overseeing the Bank’s and the Group’s financial reporting process.

Governance Financial Reports Supplementary Information
294 National Savings Bank │ Annual Report 2019 Auditor General’s Report
As per Section 16(1) of the National Audit Act No. 19 of 2018, the Group is required to maintain proper books and records of all its income, expenditure, assets and liabilities, to enable annual and periodic financial statements to be prepared of the Group.
1.4 Auditor’s Responsibilities for the Audit of the Financial Statements
My objective is to obtain reasonable assurance about whether the financial statements as a whole are free from material misstatement, whether due to fraud or error, and to issue an auditor’s report that includes my opinion. Reasonable assurance is a high level of assurance, but is not a guarantee that an audit conducted in accordance with Sri Lanka Auditing Standards will always detect a material misstatement when it exists. Misstatements can arise from fraud or error and are considered material if, individually or in the aggregate, they could reasonably be expected to influence the economic decisions of users taken on the basis of these financial statements.
As part of an audit in accordance with Sri Lanka Auditing Standards, I exercise professional judgment and maintain professional scepticism throughout the audit. I also:
z Identify and assess the risks of material misstatement of the financial statements, whether due to fraud or error, design and perform audit procedures responsive to those risks, and obtain audit evidence that is sufficient and appropriate to provide a basis for my opinion. The risk of not detecting a material misstatement resulting from fraud is higher than for one resulting from error, as fraud may involve collusion, forgery, intentional omissions, misrepresentations, or the override of internal control.
z Obtain an understanding of internal control relevant to the audit in order to design audit procedures that are
appropriate in the circumstances, but not for the purpose of expressing an opinion on the effectiveness of the Group’s internal control.
z Evaluate the appropriateness of accounting policies used and the reasonableness of accounting estimates and related disclosures made by the management.
z Conclude on the appropriateness of the management’s use of the going concern basis of accounting and based on the audit evidence obtained, whether a material uncertainty exists related to events or conditions that may cast significant doubt on the Group’s ability to continue as a going concern. If I conclude that a material uncertainty exists, I am required to draw attention in my auditor’s report to the related disclosures in the financial statements or, if such disclosures are inadequate, to modify my opinion. My conclusions are based on the audit evidence obtained up to the date of my auditor’s report. However, future events or conditions may cause the Group to cease to continue as a going concern.
z Evaluate the overall presentation, structure and content of the financial statements, including the disclosures, and whether the financial statements represent the underlying transactions and events in a manner that achieves fair presentation.
I communicate with those charged with governance regarding, among other matters, significant audit findings, including any significant deficiencies in internal control that I identify during my audit.
2. Report on Other Legal and Regulatory Requirements
National Audit Act, No. 19 of 2018 includes specific provisions for following requirements.
z I have obtained all the information and explanation that required for the audit and as far as appears from my examination, proper accounting records have been kept by the Bank
as per the requirement of section 12 (a) of the National Audit Act, No. 19 of 2018.
z The financial statements presented is consistent with the preceding year as per the requirement of section 6 (1) (d) (iii) of the National Audit Act, No. 19 of 2018.
z The financial statements presented includes all the recommendations made by me in the previous year as per the requirement of section 6 (1) (d) (iv) of the National Audit Act, No. 19 of 2018.
Based on the procedures performed and evidence obtained which were limited to matters that are material, nothing has come to my attention;
z to state that any member of the governing body of the Bank has any direct or indirect interest in any contract entered into by the Bank which are out of the normal course of business as per the requirement of section 12 (d) of the National Audit Act, No. 19 of 2018;
z to state that the Bank has not complied with any applicable written law, general and special directions issued by the governing body of the Bank as per the requirement of section 12 (f) of the National Audit Act, No. 19 of 2018;
z to state that the Bank has not performed according to its powers, functions and duties as per the requirement of section 12 (g) of the National Audit Act, No. 19 of 2018;
z to state that the resources of the Bank had not been procured and utilized economically, efficiently and effectively within the time frames and in compliance with the applicable laws as per the requirement of section 12 (h) of the National Audit Act, No. 19 of 2018.
W P C Wickramaratne
Auditor General

Governance Financial Reports Supplementary Information
295Annual Report 2019 │ National Savings Bank
Pagenumber
Primary Financial StatementsIncome statement 296Statement of comprehensive income 297Statement of financial position 298Statement of changes in equity – Bank 300Statement of changes in equity – Group 302Statement of cash flows 304
Notes to the Financial Statements – General1. Reporting entity 3062. Accounting policies: 3062.1 Basis of preparation 3062.2 Changes in accounting policies 3092.3 Fair value measurement 3112.4 Significant accounting policies – general 3112.5 Significant accounting policies –
recognition of assets and liabilities312
2.6 Significant accounting policies – recognition of income and expenses for financial instruments
322
2.7 Significant accounting policies – taxation 3222.8 Statement of cash flows 3222.9 Regulatory provisions 3222.10 Events after the reporting period 3222.11 Accounting standards issued but not yet
effective as at reporting date322
Notes to the Financial Statements – Income Statement3. Gross income 3234. Net interest income 3235. Net fee and commission income 3256. Net gain/(loss) from trading 3277. Net fair value gains/(losses) from financial
instrument at fair value through profit or loss327
8. Net gains/(losses) from derecognition of financial assets
328
9. Net other operating income 32810. Impairment charges 32911. Personnel expenses 33012. Other expenses 33213. Tax expenses 33214. Earnings per share (EPS) 334
Notes to the Financial Statements – Statement of Financial Position: Assets15. Analysis of financial instruments
by measurement basis335
16. Cash and cash equivalents 33817. Balances with central banks 33818. Placements with banks 33819. Derivative financial instruments 339
Pagenumber
20. Financial assets recognised through profit or loss 34321. Financial assets at amortised cost –
loans and advances346
22. Financial assets at amortised cost – debt and other instruments
351
23. Financial assets at fair value through other comprehensive income
353
24. Investments in subsidiaries 35725. Investment in associates and joint ventures 35826. Property, plant and equipment 35827. Right of use assets 36328. Investment properties 36429. Goodwill and intangible assets 36530. Deferred tax assets/liabilities 36631. Other assets 366
Notes to the Financial Statements – Statement of Financial Position: liabilities and equity32. Due to banks 36733. Derivative financial instruments 36834. Financial liabilities recognised through profit or loss 36835. Financial liabilities at amortised cost: 36835. Due to depositors 36835. Due to debt securities holders 36835. Due to other borrowers 36836. Lease liability 36937. Debt securities issued 37038. Retirement benefit obligations 37239. Current tax liabilities 38240. Other provisions 38241. Other liabilities 38342. Due to subsidiaries 38343. Stated capital/assigned capital 38344. Statutory reserve fund 38445. Retained earnings 38446. Other reserves 38447. Non-controlling interest 387
Notes to the Financial Statements – Other disclosures48. Contingent liabilities and commitments 38749. Related party disclosures 38850. Net assets value per ordinary share 39551. Litigation against the Bank and the Group 39552. Events occurring after the reporting date 39553. Comparative figures 39654. Financial risk management 39655. Maturity analysis 41556. Fair value of financial instruments 41957. Capital management (as per regulatory reporting) 424
Content of Financial Statements

Governance Financial Reports Supplementary Information
296 National Savings Bank │ Annual Report 2019
The Notes to the Financial Statements disclosed on pages 306 to 424 are integral parts of these Financial Statements.
Income Statement
Bank Group
For the year ended 31 DecemberNote
2019Rs. ’000
2018Rs. ’000
Change %
2019Rs. ’000
2018Rs. ’000
Change %
Gross income 3 121,929,059 111,902,078 9 125,810,171 112,760,454 12Interest income 118,729,784 110,506,931 7 120,351,774 111,718,948 8Less: Interest expenses 89,897,770 85,622,275 5 90,868,139 86,460,269 5
Net interest income 4 28,832,014 24,884,656 16 29,483,635 25,258,679 17Fee and commission income 1,261,268 1,005,262 25 1,269,521 1,008,482 26Less: Fee and commission expenses 131,954 141,196 (7) 136,838 144,685 (5)
Net fee and commission income 5 1,129,314 864,066 31 1,132,683 863,797 31Net gain/(loss) from trading 6 1,491,610 (707,433) 311 1,963,229 (1,062,421) 285Net fair value gains/(losses) from financial instruments at fair value through profit or loss 7 – – – –Net gains/(losses) from derecognition of financial assets 8 22,021 6,906 219 22,021 6,906 219Net other operating income 9 424,376 1,090,412 (61) 2,203,626 1,088,539 102
Total operating income 31,899,335 26,138,607 22 34,805,194 26,155,500 33Less: Impairment charges 10 565,536 871,049 (35) 590,700 870,994 (32)
Net operating income 31,333,799 25,267,558 24 34,214,494 25,284,506 35
Less: Expenses Personnel expenses 11 10,157,926 9,262,705 10 10,217,978 9,302,548 10Depreciation and amortisation expenses 1,042,933 638,795 63 1,048,095 639,779 64Other expenses 12 4,474,053 4,194,979 7 4,461,457 4,160,782 7
Operating profit before value added tax (VAT), nation building tax (NBT) and debt repayment levy (DRL) on financial services 15,658,887 11,171,079 40 18,486,964 11,181,397 65Less: VAT on financial services 3,045,921 2,577,657 18 3,208,584 2,584,220 24 NBT on financial services 366,157 343,688 7 383,614 344,563 11 DRL on financial services 1,785,171 308,371 479 1,803,225 308,371 485
Operating profit after VAT, NBT and DRL on financial services 10,461,638 7,941,364 32 13,091,541 7,944,243 65
Share of profits of associates and joint ventures – – – – – –
Profit before income tax 10,461,638 7,941,364 32 13,091,541 7,944,243 65
Less: Income tax expenses 13 3,763,405 3,441,213 9 4,061,569 3,444,056 18Profit for the year 6,698,233 4,500,151 49 9,029,972 4,500,187 101
Profit attributable to:Equity holders of the Bank 6,698,233 4,500,151 49 9,029,972 4,500,187 101Non-controlling interests – – – – – –
Profit for the year 6,698,233 4,500,151 49 9,029,972 4,500,187 101
Earnings per share on profit Basic earnings per ordinary share (Rs.) 14 7.13 6.72 6 9.61 6.72 43Diluted earnings per ordinary share (Rs.) 7.13 6.72 6 9.61 6.72 43
Profit for the year 6,698,233 4,500,151 49 9,029,972 4,500,187 101

Governance Financial Reports Supplementary Information
297Annual Report 2019 │ National Savings Bank
The Notes to the Financial Statements disclosed on pages 306 to 424 are integral parts of these Financial Statements.
Statement of Comprehensive Income
Bank Group
For the year ended 31 December 2019Rs. ’000
2018Rs. ’000
Change %
2019Rs. ’000
2018Rs. ’000
Change %
Profit for the year 6,698,233 4,500,151 49 9,029,972 4,500,187 101
Items that will be reclassified to income statementExchange differences on translation of foreign operations – – – – – –Net gains/(losses) on cash flow hedges – (291,924) (100) – (291,924) (100)Net gains/(losses) on investments in debt instruments measured at fair value through other comprehensive income – – – – – –
Share of profits of associates and joint ventures – – – – – –
Debt instruments at fair value through other comprehensive income 127,928 (127,741) 200 227,305 (149,144) 252Less: Fair value gains/(losses) transferred to income statement on disposal of debt instrument at fair value through other comprehensive income (13,717) 1,370 (1,101) (13,717) 1,370 (1,101)Less: Tax expense relating to items that will be reclassified to income statement – – – – – –
Total items that will be reclassified to income statement 114,211 (418,295) 127 213,588 (439,698) 149
Items that will not be reclassified to income statementChange in fair value on investments in equity instruments designated at fair value through other comprehensive income (324,635) (690,435) (53) (320,297) (690,435) (54)Change in fair value attributable to change in the Bank's own credit risk on financial liabilities designated at fair value through profit or loss – – – – – –Remeasurement of post-employment benefit obligations (3,700,967) (210,861) 1,655 (3,702,344) (211,258) 1,653Changes in revaluation surplus – – – – – –Share of profits of associates and joint ventures – – – – – –Less: Tax expense relating to items that will not be reclassified to income statement – – – – – –
Total items that will not be reclassified to income statement (4,025,602) (901,296) 347 (4,022,641) (901,694) 346
Other comprehensive income for the year, net of taxes (3,911,391) (1,319,591) 196 (3,809,053) (1,341,392) 184
Total comprehensive income for the year 2,786,842 3,180,560 (12) 5,220,919 3,158,795 65
Attributable to:Equity holders of the Bank 2,786,842 3,180,560 (12) 5,220,919 3,158,795 65Non-controlling interests – – – – – –
Total comprehensive income for the year 2,786,842 3,180,560 (12) 5,220,919 3,158,795 65

Governance Financial Reports Supplementary Information
298 National Savings Bank │ Annual Report 2019
Statement of Financial Position
Bank Group
As at 31 DecemberNote
2019Rs. ’000
2018Rs. ’000
Change%
2019Rs. ’000
2018Rs. ’000
Change %
AssetsCash and cash equivalents 16 5,376,715 3,434,524 57 5,564,824 3,436,929 62 Balances with central banks 17 – – – 58 177 (67)Placements with banks 18 12,364,469 17,588,445 (30) 15,745,184 17,588,445 (10)Derivative financial instruments 19 11,622 4,740,106 (100) 11,622 4,740,106 (100)Financial assets recognised through profit or loss 20
– measured at fair value 11,459,882 16,680,382 (31) 22,130,273 26,867,533 (18)– designated at fair value – – – – – –
Financial assets at amortised cost– loans and advances 21 454,394,957 422,894,740 7 456,636,285 422,919,713 8 – debt and other instruments 22 615,634,321 518,947,969 19 619,567,786 522,973,159 18
Financial assets measured at fair value through other comprehensive income 23 3,478,811 6,184,430 (44) 4,626,582 7,788,560 (41)Investments in subsidiaries 24 4,811,000 1,700,000 183 – – – Investments in associates and joint ventures 25 – – – – – – Property, plant and equipment 26 14,163,454 13,465,755 5 14,457,494 13,468,776 7 Right of used assets 27 1,073,507 – 100 1,130,868 – 100 Investment properties 28 – – – 333,315 – 100 Goodwill and intangible assets 29 – – – – – – Deferred tax assets 30 – – – 338 73 363 Other assets 31 35,197,923 31,209,216 13 35,370,115 31,532,684 12
Total assets 1,157,966,664 1,036,845,567 12 1,175,574,745 1,051,316,155 12
LiabilitiesDue to banks 32 35,045,251 77,119,146 (55) 36,139,122 83,615,264 (57)Derivative financial instruments 33 – 1,533 (100) – 1,533 (100)Financial liabilities recognised through profit or loss 34 – – – – – – Financial liabilities at amortised cost 35
– due to depositors 1,016,574,286 839,574,411 21 1,015,635,421 839,574,411 21 – due to debt securities holders – – – – – – due to other borrowers 21,203,242 14,804,802 43 32,808,023 21,750,178 51
Lease liability 36 1,066,882 – 100 1,121,441 – 100 Debt securities issued 37 26,691,711 52,389,133 (49) 26,955,697 52,389,133 (49)Retirement benefit obligations 38 6,508,707 3,830,795 70 6,536,687 3,832,777 71 Current tax liabilities 39 – – – 565,704 – 100 Deferred tax liabilities 30 547,250 582,463 (6) 548,014 582,463 (6)Other provisions 40 – – – – – – Other liabilities 41 5,951,464 5,447,277 9 7,430,415 5,452,317 36 Due to subsidiaries 42 547 750 (27) – – –
Total liabilities 1,113,589,340 993,750,308 12 1,127,740,523 1,007,198,076 12

Governance Financial Reports Supplementary Information
299Annual Report 2019 │ National Savings BankStatement of Financial Position
Bank Group
As at 31 DecemberNote
2019Rs. ’000
2018Rs. ’000
Change%
2019Rs. ’000
2018Rs. ’000
Change %
EquityStated capital/assigned capital 43 9,400,000 9,400,000 – 9,400,000 9,400,000 – Statutory reserve fund 44 3,562,872 3,227,960 10 3,571,214 3,227,960 11 Retained earnings 45 4,464,442 3,984,674 12 7,233,981 4,561,045 59 Other reserves 46 26,950,010 26,482,625 2 27,629,027 26,929,074 3
Total shareholders’ equity 44,377,324 43,095,259 3 47,834,222 44,118,079 8 Non-controlling interests 47 – – – – – –
Total equity 44,377,324 43,095,259 3 47,834,222 44,118,079 8
Total equity and liabilities 1,157,966,664 1,036,845,567 12 1,175,574,745 1,051,316,155 12
Contingent liabilities and commitments 48 10,355,197 4,481,397 131 10,691,602 4,481,397 139
Memorandum informationNumber of employees 4,715 4,512 Number of branches 256 255
Note: Amounts stated are net of impairment and depreciation.
The Notes to the Financial Statements disclosed on pages 306 to 424 are integral parts of these Financial Statements.
CertificationI certify that the above Financial Statements give a true and fair view of the state of affairs of National Savings Bank and the Group as at 31 December 2019 and its profit for the year ended.
Kithsiri Wijeyaratne
Senior Deputy General Manager (Finance and Planning)
The Board of Directors is responsible for the preparation and presentation of these Financial Statements.
Approved and signed for and on behalf of the Board,
Ms Keasila Jayawardena Dr Kapila Senanayake Damitha Rathnayake
Chairperson Director Acting General Manager/CEO
24 March 2020
ColomboSri Lanka

Governance Financial Reports Supplementary Information
300 National Savings Bank │ Annual Report 2019
Bank
Stated capital/ assigned capital
Rs. ’000
Statutory reserve fund
Rs. ’000
Revaluation reserve
Rs. ’000
OCI reserve
Rs. ’000
Cash flow hedging reserve
Rs. ’000
Other reservesRs. ’000
Retained earningsRs. ’000
Total equity
Rs. ’000
Balance as at 1 January 2018 6,700,000 3,002,952 7,793,317 1,345,237 291,924 18,859,461 1,102,798 39,095,691 Prior years Adjustment* – – – – – – (637,406) (637,406)Restated opening balance as at 1 January 2018 6,700,000 3,002,952 7,793,317 1,345,237 291,924 18,859,461 465,392 38,458,285 Profit for the year 2018 – – – – – – 4,500,151 4,500,151 Other comprehensive income (net of tax) – – – (816,806) (291,924) – (210,861) (1,319,591)
Total comprehensive income for the year – – – (816,806) (291,924) – 4,289,290 3,180,560
Transactions with equity holders, recognised directly in equity
Transfers to/from reserves during the year – 225,008 – – – – (225,008) –Contribution to consolidated fund-dividend/levy – – – – – – (500,000) (500,000)Contribution to national insurance trust fund – – – – – – (45,002) (45,002)Transfers to unclaimed deposits reserve/issued share capital 2,700,000 – – – – (698,587) – 2,001,413
Total transactions with equity holders 2,700,000 225,008 – – – (698,587) (770,009) 1,456,411
Balance as at 31 December 2018 9,400,000 3,227,960 7,793,317 528,430 – 18,160,874 3,984,674 43,095,259
Impact of adopting SLFRS 16 – – – – – – (115,604) (115,604)Opening balance under SLFRS 16 9,400,000 3,227,960 7,793,317 528,430 – 18,160,874 3,869,070 42,979,655 Profit for the year 2019 – – – – – – 6,698,233 6,698,233
Other comprehensive income (net of tax) – – – (210,424) – – (3,700,967) (3,911,391)
Total comprehensive income for the year – – – (210,424) – – 2,997,266 2,786,842
Transactions with equity holders, recognised directly in equity
Transfers to/from reserves during the year – 334,912 – – – – (334,912) – Contribution to consolidated fund-dividend/levy – – – – – – (2,000,000) (2,000,000)Contribution to national insurance trust fund – – – – – – (66,982) (66,982)Transfers to unclaimed deposits reserve – – – – – 677,811 – 677,811
Total transactions with equity holders – 334,912 – – – 677,811 (2,401,894) (1,389,171)
Balance as at 31 December 2019 9,400,000 3,562,872 7,793,317 318,006 – 18,838,685 4,464,442 44,377,324
The Notes to the Financial Statements disclosed on pages 306 to 424 are integral parts of these Financial Statements.
*Please refer note 53 comparative figures.
Statement of Changes in Equity

Governance Financial Reports Supplementary Information
301Annual Report 2019 │ National Savings BankStatement of Changes in Equity
Bank
Stated capital/ assigned capital
Rs. ’000
Statutory reserve fund
Rs. ’000
Revaluation reserve
Rs. ’000
OCI reserve
Rs. ’000
Cash flow hedging reserve
Rs. ’000
Other reservesRs. ’000
Retained earningsRs. ’000
Total equity
Rs. ’000
Balance as at 1 January 2018 6,700,000 3,002,952 7,793,317 1,345,237 291,924 18,859,461 1,102,798 39,095,691 Prior years Adjustment* – – – – – – (637,406) (637,406)Restated opening balance as at 1 January 2018 6,700,000 3,002,952 7,793,317 1,345,237 291,924 18,859,461 465,392 38,458,285 Profit for the year 2018 – – – – – – 4,500,151 4,500,151 Other comprehensive income (net of tax) – – – (816,806) (291,924) – (210,861) (1,319,591)
Total comprehensive income for the year – – – (816,806) (291,924) – 4,289,290 3,180,560
Transactions with equity holders, recognised directly in equity
Transfers to/from reserves during the year – 225,008 – – – – (225,008) –Contribution to consolidated fund-dividend/levy – – – – – – (500,000) (500,000)Contribution to national insurance trust fund – – – – – – (45,002) (45,002)Transfers to unclaimed deposits reserve/issued share capital 2,700,000 – – – – (698,587) – 2,001,413
Total transactions with equity holders 2,700,000 225,008 – – – (698,587) (770,009) 1,456,411
Balance as at 31 December 2018 9,400,000 3,227,960 7,793,317 528,430 – 18,160,874 3,984,674 43,095,259
Impact of adopting SLFRS 16 – – – – – – (115,604) (115,604)Opening balance under SLFRS 16 9,400,000 3,227,960 7,793,317 528,430 – 18,160,874 3,869,070 42,979,655 Profit for the year 2019 – – – – – – 6,698,233 6,698,233
Other comprehensive income (net of tax) – – – (210,424) – – (3,700,967) (3,911,391)
Total comprehensive income for the year – – – (210,424) – – 2,997,266 2,786,842
Transactions with equity holders, recognised directly in equity
Transfers to/from reserves during the year – 334,912 – – – – (334,912) – Contribution to consolidated fund-dividend/levy – – – – – – (2,000,000) (2,000,000)Contribution to national insurance trust fund – – – – – – (66,982) (66,982)Transfers to unclaimed deposits reserve – – – – – 677,811 – 677,811
Total transactions with equity holders – 334,912 – – – 677,811 (2,401,894) (1,389,171)
Balance as at 31 December 2019 9,400,000 3,562,872 7,793,317 318,006 – 18,838,685 4,464,442 44,377,324
The Notes to the Financial Statements disclosed on pages 306 to 424 are integral parts of these Financial Statements.
*Please refer note 53 comparative figures.

Governance Financial Reports Supplementary Information
302 National Savings Bank │ Annual Report 2019 Statement of Changes in Equity
Group
Stated capital/ assigned capital
Rs. ’000
Statutory reserve fund
Rs. ’000
Revaluation reserve
Rs. ’000
OCI reserve
Rs. ’000
Cash flow hedging reserve
Rs. ’000
Other reservesRs. ’000
Retained earningsRs. ’000
Total equity
Rs. ’000
Balance as at 1 January 2018 6,700,000 3,002,952 7,793,317 1,228,420 291,924 19,444,122 1,679,540 40,140,278 Prior years Adjustment* – – – – – – (637,406) (637,406)Restated opening balance as at 1 January 2018 6,700,000 3,002,952 7,793,317 1,228,420 291,924 19,444,122 1,042,134 39,502,872 Profit for the year 2018 – – – – – – 4,500,187 4,500,187 Other comprehensive income (net of tax) – – – (838,210) (291,924) – (211,258) (1,341,392)
Total comprehensive income for the year – – – (838,210) (291,924) – 4,288,929 3,158,795
Transactions with equity holders, recognised directly in equity
Transfers to/from reserves during the year – 225,008 – – – 9 (225,016) – Contribution to consolidated fund-dividend/levy – – – – – – (500,000) (500,000)Withholding tax on dividend – – – – – – – – Contribution to national insurance trust fund – – – – – – (45,002) (45,002)Transfers to unclaimed deposits reserve/issued share capital 2,700,000 – – – – (698,587) – 2,001,413
Total transactions with equity holders 2,700,000 225,008 – – – (698,578) (770,018) 1,456,411
Balance as at 31 December 2018 9,400,000 3,227,960 7,793,317 390,210 – 18,745,544 4,561,045 44,118,079
Impact of adopting SLFRS 16 – – – – – – (115,604) (115,604)Opening balance under SLFRS 16 9,400,000 3,227,960 7,793,317 390,210 – 18,745,544 4,445,441 44,002,475 Profit for the year 2019 – – – – – – 9,029,972 9,029,972
Other comprehensive income (net of tax) – – – (106,709) – – (3,702,344) (3,809,053)
Total comprehensive income for the year – – – (106,709) – – 5,327,628 5,220,919
Transactions with equity holders, recognised directly in equity
Transfers to/from reserves during the year – 343,254 – – – 128,852 (472,106) – Contribution to consolidated fund-dividend/levy – – – – – – (2,000,000) (2,000,000)Contribution to national insurance trust fund – – – – – – (66,982) (66,982)Transfers to unclaimed deposits reserve – – – – – 677,811 – 677,811
Total transactions with equity holders – 343,254 – – – 806,663 (2,539,088) (1,389,171)
Balance as at 31 December 2019 9,400,000 3,571,214 7,793,317 283,501 – 19,552,207 7,233,981 47,834,222
The Notes to the Financial Statements disclosed on pages 306 to 424 are integral parts of these Financial Statements.
*Please refer note 53 comparative figures.

Governance Financial Reports Supplementary Information
303Annual Report 2019 │ National Savings BankStatement of Changes in Equity
Group
Stated capital/ assigned capital
Rs. ’000
Statutory reserve fund
Rs. ’000
Revaluation reserve
Rs. ’000
OCI reserve
Rs. ’000
Cash flow hedging reserve
Rs. ’000
Other reservesRs. ’000
Retained earningsRs. ’000
Total equity
Rs. ’000
Balance as at 1 January 2018 6,700,000 3,002,952 7,793,317 1,228,420 291,924 19,444,122 1,679,540 40,140,278 Prior years Adjustment* – – – – – – (637,406) (637,406)Restated opening balance as at 1 January 2018 6,700,000 3,002,952 7,793,317 1,228,420 291,924 19,444,122 1,042,134 39,502,872 Profit for the year 2018 – – – – – – 4,500,187 4,500,187 Other comprehensive income (net of tax) – – – (838,210) (291,924) – (211,258) (1,341,392)
Total comprehensive income for the year – – – (838,210) (291,924) – 4,288,929 3,158,795
Transactions with equity holders, recognised directly in equity
Transfers to/from reserves during the year – 225,008 – – – 9 (225,016) – Contribution to consolidated fund-dividend/levy – – – – – – (500,000) (500,000)Withholding tax on dividend – – – – – – – – Contribution to national insurance trust fund – – – – – – (45,002) (45,002)Transfers to unclaimed deposits reserve/issued share capital 2,700,000 – – – – (698,587) – 2,001,413
Total transactions with equity holders 2,700,000 225,008 – – – (698,578) (770,018) 1,456,411
Balance as at 31 December 2018 9,400,000 3,227,960 7,793,317 390,210 – 18,745,544 4,561,045 44,118,079
Impact of adopting SLFRS 16 – – – – – – (115,604) (115,604)Opening balance under SLFRS 16 9,400,000 3,227,960 7,793,317 390,210 – 18,745,544 4,445,441 44,002,475 Profit for the year 2019 – – – – – – 9,029,972 9,029,972
Other comprehensive income (net of tax) – – – (106,709) – – (3,702,344) (3,809,053)
Total comprehensive income for the year – – – (106,709) – – 5,327,628 5,220,919
Transactions with equity holders, recognised directly in equity
Transfers to/from reserves during the year – 343,254 – – – 128,852 (472,106) – Contribution to consolidated fund-dividend/levy – – – – – – (2,000,000) (2,000,000)Contribution to national insurance trust fund – – – – – – (66,982) (66,982)Transfers to unclaimed deposits reserve – – – – – 677,811 – 677,811
Total transactions with equity holders – 343,254 – – – 806,663 (2,539,088) (1,389,171)
Balance as at 31 December 2019 9,400,000 3,571,214 7,793,317 283,501 – 19,552,207 7,233,981 47,834,222
The Notes to the Financial Statements disclosed on pages 306 to 424 are integral parts of these Financial Statements.
*Please refer note 53 comparative figures.

Governance Financial Reports Supplementary Information
304 National Savings Bank │ Annual Report 2019
Statement of Cash Flows
Bank Group
For the year ended 31 December 2019Rs. ’000
2018Rs. ’000
2019Rs. ’000
2018Rs. ’000
Cash flows from operating activitiesInterest receipts 116,116,735 108,759,712 117,913,757 109,734,424 Interest payments (82,583,128) (85,287,503) (83,544,584) (86,068,354)Net commission receipts 1,129,314 864,066 1,132,683 863,797 Trading income 415,692 546,667 507,130 563,393 Payment to employees (9,576,038) (8,944,003) (9,636,090) (8,983,846)VAT, NBT and DRL on financial services (4,926,687) (3,372,310) (5,092,470) (3,379,748)Receipts from other operating activities 336,670 283,187 2,115,916 281,314 Payment on other operating activities (4,449,742) (3,731,927) (4,432,794) (3,697,730)
Operating profit before change in operating assets and liabilities 16,462,816 9,117,889 18,963,548 9,313,250
(Increase)/decrease in operating assetsBalances with Central Bank of Sri Lanka – – – – Placements with banks 5,088,591 6,015,111 1,707,876 6,015,111 Derivative financial instruments 4,744,070 (3,671,316) 4,744,070 (3,671,316)Financial assets at FVPL 5,926,456 (10,995,919) 5,681,883 (18,404,137)Financial assets at amortised cost – loans and advances (31,733,787) (48,291,029) (33,889,390) (49,603,184)Financial assets at amortised cost – debt and other instrument (94,261,299) 37,230,245 (94,172,565) 37,060,618 Proceeds from the sale and maturity of financial investments – – – – Other assets (4,185,579) (4,947,187) (4,034,303) (4,989,400)
(114,421,548) (24,660,094) (119,962,429) (33,592,308)
Increase/(decrease) in operating liabilitiesDue to Bank (42,196,267) 28,385,587 (48,579,868) 34,111,452 Derivative financial instruments (1,533) (956,937) (1,533) (956,937)Financial liabilities at amortised cost – due to depositors 170,677,338 101,633,538 169,738,473 101,633,538 Financial liabilities at amortised cost – due to debt securities holders – – – – Financial liabilities at amortised cost – due to other borrowers 6,287,565 2,699,945 10,919,340 4,894,246 Debt securities issued (25,677,100) (107,552,900) (25,413,114) (107,552,900)Other liabilities (382,265) (494,589) 1,698,978 (533,749)
108,707,738 23,714,644 108,362,276 31,595,650
Net cash generated from operating activities before income tax 10,749,007 8,172,439 7,363,395 7,316,592 Income tax paid (3,798,618) (3,365,813) (3,530,579) (3,506,148)
Net cash (used in)/from operating activities 6,950,389 4,806,626 3,832,816 3,810,444

Governance Financial Reports Supplementary Information
305Annual Report 2019 │ National Savings BankStatement of Cash Flows
Bank Group
For the year ended 31 December 2019Rs. ’000
2018Rs. ’000
2019Rs. ’000
2018Rs. ’000
Cash flows from investing activitiesPurchase of property, plant and equipment (1,505,419) (1,742,224) (1,509,763) (1,742,579)Proceeds from the sale of property, plant and equipment 14,804 7,474 14,808 7,474 Net (increase)/decrease in finance instruments at fair value through other comprehensive income 2,373,158 (1,309,089) 2,902,903 (1,114,522)Proceeds from the sale and maturity of financial investments – – – – Net purchase/improvement to investment properties – – (333,315) – Net cash flow from acquisition of investment in subsidiaries and associates (3,111,000) (800,000) – – Dividends received from investment in subsidiaries and associates – – – –
Net cash (used in)/from investing activities (2,228,457) (3,843,839) 1,074,633 (2,849,627)
Cash flows from financing activitiesNet proceeds from the issue of subordinated debt – – – – Repayment of subordinated debt – – – – Interest paid on subordinated debt (780,000) (780,000) (780,000) (780,000)Contribution to consolidated fund-dividend/levy (2,000,000) (500,000) (2,000,000) (500,000)
Net cash from financial activities (2,780,000) (1,280,000) (2,780,000) (1,280,000)
Net increase/(decrease) in cash and cash equivalents 1,941,932 (317,213) 2,127,449 (319,183)
Cash and cash equivalents at the beginning of the year 3,351,975 3,669,188 3,354,558 3,673,741 Exchange difference in respect of cash and cash equivalent – – – –
Cash and cash equivalents at the end of the year 5,293,907 3,351,975 5,482,007 3,354,558
Reconciliation of cash and cash equivalentsCash in hand 941,102 699,401 947,240 699,411 Balances with bank 4,436,403 2,735,350 4,618,378 2,737,745 Money at call and short notice – – – – Balances with Central banks – – 58 177 Due to banks (83,598) (82,775) (83,669) (82,775)
5,293,907 3,351,975 5,482,007 3,354,558
The Notes to the Financial Statements disclosed on pages 306 to 424 are integral parts of these Financial Statements.

Governance Financial Reports Supplementary Information
306 National Savings Bank │ Annual Report 2019 Notes to the Financial Statements
Notes to the Financial Statements
1. Reporting entity
1.1 Corporate information
National Savings Bank (NSB) is a licensed specialised Bank incorporated in 1972 under the National Savings Bank Act No. 30 of 1971 and domiciled in Sri Lanka. It is a licensed specialised bank regulated under the Banking Act No. 30 of 1988 and amendments thereto. The registered office of the Bank is located at No. 255, “Savings House”, Galle Road, Colombo 03, Sri Lanka.
The staff strength of the Bank as at 31 December 2019 was 4,715. (2018-4,512) The Bank possesses 256 Branches, and 334 ATMs of its Service Outlets and 653 Post Offices and 3,410 Sub-Post Offices as its agency network.
1.2 Consolidated Financial Statements
The Consolidated Financial Statements for the year ended 31 December 2019 comprise of the Bank (Parent) and its two fully-owned Subsidiaries, NSB Fund Management Company Ltd. and Sri Lanka Savings Bank Limited.
The Bank is fully owned by the Government of Sri Lanka. The Bank is the ultimate parent of the Group. The Financial Statements of the Bank and its Subsidiaries have a common financial year which ends on 31 December. The Financial Statements of the “Bank” and the “Group” are prepared for the twelve months period ended 31 December each year to be tabled in Parliament. Bank has fully acquired Sri Lanka Savings Bank Limited on 11 October 2019 and consolidated the last three (3) months profit to the Group.
1.3 Principal activities and nature of operations
GRI 102-2
Bank
The principal activities of the Bank continued to be the promotion of savings among the people of Sri Lanka and profitable investment of savings so mobilised. NSB is providing wide range of solutions such as accepting deposits, corporate and retail credit, trade financing, loan to Government project, pawning, internet banking, sms banking etc. As per the National Savings Bank Act No. 30 of 1971, the Bank is required to invest in government securities a minimum of 60% out of its deposits. Bank has fully acquired Sri Lanka Savings Bank Limited on 11 October 2019 for Rs. 3.111 Bn.
Subsidiaries
NSB Fund Management Company Ltd.
NSB Fund Management Company Ltd., acts as a primary dealer and engaged in dealing in Government Securities.
Sri Lanka Savings Bank Limited
The principal activities of the Bank are mobilising savings and time deposits, providing loans, lease, hire purchase, pawning and other credit facilities, and settling of the deposit liabilities of defaulted Pramuka Saving and Development Bank Limited (PSDBL) with reconstruction of loan accounts of PSDBL.
2. Accounting policies
The accounting policies set out below have been applied consistently in all periods when presenting the Financial Statements, unless otherwise indicated. These policies of the Bank are also
consistently applied by the Group where applicable and deviations if any have been disclosed accordingly.
2.1 Basis of preparation2.1.1 Statement of compliance
The Consolidated Financial Statement of the Group and the Separate Financial Statements of the Bank which comprise the Income Statement, Statement of Comprehensive Income, Statement of Financial Position, Statement of Changes in Equity, Statement of Cash Flows and Notes to the Financial Statements have been prepared and presented in accordance with the Sri Lanka Accounting Standards (LKASs and SLFRSs) issued by the Institute of Chartered Accountants of Sri Lanka and are in compliance with the information required by the Banking Act No. 30 of 1988 and subsequent amendments thereto. These Financial Statements, except for the information in cash flow have been prepared following the accrual basis of accounting.
The formats used in the preparation of Financial Statements and the disclosures made therein also comply with the specified formats prescribed by the Central Bank of Sri Lanka for the preparation, presentation and publication of Annual Audited Financial Statements of Licensed Banks.
2.1.2 Responsibility for Financial Statements
The Board of Directors is responsible for the preparation and presentation of the Financial Statements of the Group and the Bank as per the provisions of the National Savings Bank Act No. 30 of 1971 and amendments thereto and the Sri Lanka Accounting Standards.

Governance Financial Reports Supplementary Information
307Annual Report 2019 │ National Savings BankNotes to the Financial Statements
2.1.3 Approval of Financial Statements by the Board of Directors
The Financial Statements of the Bank and the Group for the year ended 31 December 2019 were approved on 24 March 2020, by the Board of Directors.
2.1.4 Basis of measurement
The Consolidated Financial Statements have been prepared on a historical cost basis, except for the following material items in the Statement of Financial Position, which are measured at fair value.
(i) Financial assets measured at fair value though other comprehensive income, (Note 23)
(ii) Derivative financial instruments, (Note 19 and 33)
(iii) Financial assets and liabilities recognised through profit or loss (Note 34)
(iv) Financial assets and liabilities designated at fair value through profit or loss, (Note 20)
(v) Land and buildings which are measured at cost at the time of acquisition subsequently measured at revalued amounts, which are the fair values at the date of revaluation. (Note 26)
(vi) Liability for employee defined benefits obligations are recognised at the present value of the defined benefit obligation less the fair value of the plan assets. (Note 38)
2.1.5 Functional and presentation currency
The Consolidated Financial Statements are presented in Sri Lankan Rupees (Rs.) which is the currency of the primary economic environment in which Group operates and all values are rounded to the nearest thousand Rupees, unless indicated otherwise. There was no change in the Group’s presentation and functional currency during the year under review.
2.1.6 Presentation of Financial Statements
The assets and liabilities of the Bank and the Group presented in the Statement of Financial Position are grouped by their nature and listed in an order that reflects their relative liquidity and maturity pattern.
No adjustment has been made for inflationary factors affecting the Financial Statements. An analysis of maturity patterns of assets and liabilities of the Bank and the Group is presented in Note 55 on page 415.
2.1.7 Going concern
The Board of Directors/Management of the Bank has made an assessment of its ability to continue as a going concern and is satisfied that it has the resources to continue in business for the foreseeable future. Furthermore, the Management is not aware of any material uncertainties that may cast significant doubt upon the Group’s ability to continue as a going concern. Therefore, the Financial Statements are prepared on the going concern basis.
2.1.8 Materiality and aggregation
Each material class of similar items are presented separately in the Financial Statements. Items of dissimilar nature or functions are presented separately unless they are immaterial as permitted by the Sri Lanka Accounting Standard – LKAS 01 on “Presentation of Financial Statements”.
2.1.9 Comparative information
Comparative information including quantitative, narrative and descriptive information is disclosed in respect of the previous period in the Financial Statements in order to enhance the understanding of the current period’s Financial Statements and to enhance the inter period comparability. The comparative information is re classified where necessary for the better presentation and to conform to the current year’s presentation.
Comparative information is presented in Note 53 on page 396.
2.1.10 Rounding
The amounts in the Financial Statements have been rounded-off to the nearest rupees thousands, except where otherwise indicated as permitted by the Sri Lanka Accounting Standard – LKAS 1 on “Presentation of Financial Statements” (LKAS 1).
2.1.11 Offsetting
Financial assets and financial liabilities are offset, and the net amount reported in the Statement of Financial Position (SOFP), only when there is a legally enforceable right to offset the recognised amounts and there is an intention to settle on a net basis or to realise the assets and settle the liabilities simultaneously. Income and expenses are not offset in the Income Statement, unless required or permitted by an Accounting Standard or Interpretation (issued by the IFRS Interpretations Committee and Standard Interpretations Committee) and as specifically disclosed in the Significant Accounting Policies of the Bank.
2.1.12 Significant accounting judgements, estimates and assumptions
The preparation of Financial Statements of the Bank and the Group in conformity with Sri Lanka Accounting Standards requires the management to make judgments, estimates and assumptions that affect the application of accounting policies and the reported amounts of assets, liabilities, income and expenses. Actual results may differ from these estimates.
Estimates and underlying assumptions are reviewed on an ongoing basis. Revisions to accounting estimates are recognised in the period in which the estimate is revised and in any future periods affected.

Governance Financial Reports Supplementary Information
308 National Savings Bank │ Annual Report 2019 Notes to the Financial Statements
The significant areas of estimation, critical judgements and assumptions in applying accounting policies that have most significant effect on the amounts recognised in the Financial Statements of the Bank and the Group are as follows:
A. Significant accounting judgement
Information about judgements made in applying Accounting Policies that have the most significant effects on the amounts recognised in these Financial Statements is included in Notes 2.1.12.1 below.
2.1.12.1 Classification of financial assets and liabilities
As per SLFRS 9, the significant accounting policies of the Group provides scope for financial assets to be classified and measured into different categories, namely, at amortised cost, Fair Value Through Other Comprehensive Income (FVOCI) and Fair Value Through Profit Or Loss (FVPL) based on the following criteria;
z The entity’s business model for managing the financial assets as set out in Note 2.5.1.4.1 on page 312.
z The contractual cash flow characteristics of the financial assets as set out in Note 2.5.1.4.2 on page 313.
B. Assumptions and estimation uncertainties
Information about assumptions and estimation uncertainties that have a significant risk of resulting in material adjustments are included in Notes 2.1.12.2 to 2.1.12.9 below.
2.1.12.2 Fair value of financial instruments
Where the fair value of financial assets and financial liabilities recorded in the Statement of Financial Position cannot be derived from active markets, they are determined using the valuation techniques that include the use of mathematical models. The inputs to these models are derived from observable market data where possible,
but where observable market data are not available, judgement is required to establish fair values.
Methodologies used for valuation of financial instruments and fair value hierarchy are described in more detail in Note 56 to the Financial Statements on page 419.
2.1.12.3 Impairment losses on financial assets
The measurement of impairment losses both under SLFRS 9 and LKAS 39 across all categories of financial assets requires judgement, in particular, the estimation of the amount and timing of future cash flows and collateral values when determining impairment losses.
Accordingly, the Group reviews its individually significant loans and advances at each reporting date to assess whether an impairment loss should be provided in the Income Statement. In particular, the Management’s judgement is required in the estimation of the amount and timing of future cash flows when determining the impairment loss. These estimates are based on assumptions about a number of factors and hence actual results may differ, resulting in future changes to the impairment allowance made.
The individual impairment provision applies to financial assets evaluated individually for impairment and is based on Management’s best estimate of the present value of the future cash flows that are expected to be received. In estimating these cash flows, Management makes judgements about a borrower’s financial situation and the net realisable value of any underlying collateral. Each impaired asset is assessed on its merits, and the workout strategy and estimate of cash flows considered recoverable.
A collective impairment provision is established for:
z groups of homogeneous loans and advances that are not considered individually significant; and
z groups of assets that are individually significant but that were not found to be individually impaired.
As per SLFRS 9, the Group’s Expected Credit Loss (ECL) calculations are outputs of complex models with a number of underlying assumptions regarding the choice of variable inputs and their interdependencies. Elements of the ECL models that are considered accounting judgements and estimates include:
z The Group’s criteria for qualitatively assessing whether there has been a significant increase in credit risk and if so allowances for financial assets measured on a Life Time Expected Credit Loss (LTECL) basis;
z The segmentation of financial assets when their ECL is assessed on a collective basis;
z Development of ECL models, including the various statistical formulas and the choice of inputs;
z Determination of associations between macro-economic inputs, such as GDP growth, inflation, interest rates, exchange rates and unemployment and the effect on Probability of Default (PDs), Exposure at Default (EAD) and Loss Given Default (LGD);
z Selection of forward-looking macro-economic scenarios and their probability weightings, to derive the economic inputs into the ECL models.
2.1.12.4 Revaluation of property, plant and equipment
The freehold land and buildings of the Bank and the Group are reflected at revalued amounts. The Group engaged independent professional valuers to determine the fair value of freehold land and buildings in terms of Sri Lanka Accounting Standard (SLFRS 13) – “Fair Value Measurement”.
The methods and key assumptions used to determine the fair value of the freehold land and buildings are further explained in Note 2.3 to the Financial Statements.

Governance Financial Reports Supplementary Information
309Annual Report 2019 │ National Savings BankNotes to the Financial Statements
2.1.12.5 Useful Life time of property, plant and equipment
The Group reviews the residual values, useful lives and methods of depreciation of property, plant and equipment at each reporting date. Judgement of the management is exercised in the estimation of these values, rates, methods and hence they are subject to uncertainty.
2.1.12.6 Impairment of non-financial assets
The Group assess at each reporting date whether there is an indication that an asset other than deferred tax asset, may be impaired. If any indication exists, or when annual impairment testing for an asset is required, the Group estimates the asset’s recoverable amount. Where the carrying amount of an asset exceeds its recoverable amount, the asset is considered impaired and is written down to its recoverable amount.
2.1.12.7 Deferred tax asset
Deferred tax assets are recognised in respect of tax losses to the extent that it is probable that future taxable profits will be available against which such tax losses can be utilised. Judgement is required to determine the amount of deferred tax assets that can be recognised, based upon the likely timing and level of future taxable profits, together with the future tax-planning strategies.
2.1.12.8 Defined benefit obligation
The cost of the defined benefit plans and the present value of their obligations are determined using actuarial valuations. The actuarial valuation involves making assumptions about discount rates, expected rates of return on assets, future salary increases, mortality rates and future pension increases.
In determining the appropriate discount rate, management considers the interest rates of Sri Lanka Government Bonds.
The mortality rate is based on publicly available mortality tables. Future salary increases, and pension increases are based on expected future inflation rates and expected future salary increase rate of the Bank.
Due to the long-term nature of these plans, such estimates are subject to significant uncertainty.
2.1.12.9 Provisions, commitments and contingencies
The Group receives legal claims against it in the normal course of business. Management makes judgments as to the likelihood of any claim succeeding in making provisions. The time of concluding legal claims is uncertain, as is the amount of possible outflow of economic benefits. Timing and cost ultimately depend on the due process in respective legal jurisdiction.
2.2 Changes in accounting policies
In these Financial Statements, the Group have applied SLFRS 16 Leases for the first time. The nature and effect of the changes as a result of adoption of this new accounting standard are described below:
2.2.1 Sri Lanka Accounting Standard (SLFRS 16) – Leases
This Standard sets out the principles for the recognition, measurement, presentation and disclosure of leases. The objective is to ensure that lessees and lessors provide relevant information in a manner that faithfully represents those transactions. This information gives a basis for users of Financial Statements to assess the effect that leases have on the financial position, financial performance and cash flows of an entity. This Standard supersedes the following Standard and Interpretations:
(a) LKAS 17 Leases;
(b) IFRIC 4 Determining whether an Arrangement contains a Lease;
(c) SIC-15 Operating Leases—Incentives; and
(d) SIC-27 Evaluating the Substance of Transactions Involving the Legal Form of a Lease.
Set out below are the accounting policy of the Group upon adoption of SLFRS 16, which have been applied from the date of initial application of 1 January 2019.
2.2.1.1 Identifying a lease
A contract is a lease if the contract conveys the right to control the use of an identified asset for a period of time in exchange for consideration. Hence, at inception of a contract, Group assesses whether the contract is, or contains, a lease by considering following aspects.
1. Availability of identified asset
2. Group right to control the use of the identified asset
3. Group right to obtain substantially all economic benefits from use of the identified asset
4. Group right to direct the use of the identified asset
Accordingly, Group identifies all the Rent Agreements (except short term agreements, less than twelve months and low value agreements) entered by the Group for operating a branch and for using machineries contain a lease under SLFRS 16: Leases.
2.2.1.2 Right-of-use assets
The Group recognises right-of-use assets at the commencement date of the lease (i.e., the date as specified in the Lease Agreement). Right-of-use assets are measured at cost, less any accumulated depreciation and impairment losses, and adjusted for any remeasurement of lease liabilities. The cost of right-of-use assets includes the amount of lease liabilities recognised, and lease payments made at or before the commencement date less any lease incentives received. Unless the Group is reasonably certain to obtain ownership of the leased asset at the end of the lease term, the recognised right-of-use assets are depreciated on a straight-line basis over the shorter of its estimated useful life and the lease term. Right-of-use assets are subject to impairment.

Governance Financial Reports Supplementary Information
310 National Savings Bank │ Annual Report 2019 Notes to the Financial Statements
2.2.1.3 Lease liability
At the commencement date of the lease, the Group recognises lease liabilities measured at the present value of lease payments to be made over the lease term. The lease payments include fixed payments (including in- substance fixed payments) less any lease incentives receivable, variable lease payments that depend on an index or a rate, and amounts expected to be paid under residual value guarantees. The lease payments also include the exercise price of a purchase option reasonably certain to be exercised by the Group and payments of penalties for terminating a lease, if the lease term reflects the Group exercising the option to terminate. The variable lease payments that do not depend on an index or a rate are recognised as expense in the period on which the event or condition that triggers the payment occurs. Calculating the present value of lease payments, the Group uses the Treasury Bond rate (The tenure of the Treasury Bond should be identical to the lease term) at the lease commencement date if the interest rate implicit in the lease is not readily determinable. After the commencement date, the amount of lease liabilities is increased to reflect the accretion of interest and reduced for the lease payments made. In addition, the carrying amount of lease liabilities is remeasured if there is a modification, a change in the lease term, a change in the in-substance fixed lease payments or a change in the assessment to purchase the underlying asset.
2.2.1.4 Short-term leases and leases of low-value assets
The Group applies the short-term lease recognition exemption to its short-term leases (i.e., those leases that have a lease term of 12 months or less from the commencement date and do not contain a purchase option). It also applies the lease of low-value assets recognition exemption that are considered of low value. Lease payments on short- term leases and leases of low-value assets are
recognised as expense on a straight-line basis over the lease term. The Group considers the leases of low value assets, if the value of the underlying asset is less than or equal to Rs. 1 Mn.
2.2.1.5 Significant judgement in determining the lease term of contracts with renewal options
The Group determine the lease term as the non-cancellable term of the lease, together with any periods covered by an option to extend the lease if it is reasonably certain to be exercised, or any periods covered by an option to terminate the lease, if it is reasonably certain not to be exercised. The Group applies judgement in evaluating whether it is reasonably certain to exercise the option to renew. That is, it considers all relevant factors that create an economic incentive for it to exercise the renewal. After the commencement date, the Group reassesses the lease term if there is a significant event or change in circumstances that is within its control and affects its ability to exercise (or not to exercise) the option to renew. The Group uses hindsight in determining the lease term where the contract contains options to extend or terminate the lease. Accordingly, the Group identified the lease term as the number of years based on the period covered by the Rent Agreement signed by the Group and the lessor.
2.2.1.6 Measurement
The Group adopted SLFRS 16 using the modified retrospective method of adoption with the date of initial application of 1 January 2019. Under this method, the standard is applied retrospectively with the cumulative effect of initially applying the standard recognised at the date of initial application. Since the Group applies SLFRS 16 using the modified retrospective approach.
z the Group leaves comparatives as previously reported
z any difference between asset and liability is recognised in opening retained earnings at transition
z measure ROU asset as if SLFRS 16 had been applied from lease commencement (but using discounting rate at date of transition)
Initial measurement of the right of use asset and the lease liabilityThe Right-Of-Use (ROU) Asset is initially measured at the present value of all the lease rentals adjusted to any advances made outstanding as at 1 January 2019. The lease liability is initially measured at the present value of the future lease rentals over the remaining lease period at commencement date.
Subsequent measurement of the right of use asset and the lease liabilityAfter the commencement date the Group measure the ROU asset applying a cost model. The assets are ammortised to the balance lease term as at 01st January 2019, using the straight-line method. The Lease liability subsequently measure by increasing with the lease interest and reducing with the lease payments.
Discount rate The lessee has to apply the Incremental borrowing rate to discount the future rental payments. That is “The rate of interest that a lessee would have to pay to borrow over a similar term, and with a similar security, the funds necessary to obtain an asset of a similar value to the right-of-use asset in a similar economic environment”. The Group applies a single discount rate for leases with similar lease periods.
z Separating components of a contract
The Group elects to consistently apply as a practical expedient not to separate non-lease components from lease components, and instead account for each lease component and any associated non-lease components as a single lease component.
z Initial direct costs
The Group excludes the initial direct costs from the measurement of the right-of-use asset at the date of initial application as a practical expedient.

Governance Financial Reports Supplementary Information
311Annual Report 2019 │ National Savings BankNotes to the Financial Statements
2.3 Fair value measurement
“Fair value” is the price that would be received to sell an asset or paid to transfer a liability in an orderly transaction between market participants at the measurement date in the principal or, in its absence, the most advantageous market to which the Group has access at that date. The fair value of a liability reflects its non-performance risk.
The Group measures the fair value of an instrument using the quoted price in an active market for that instrument. A market is regarded as active if transactions for the asset or liability take place with sufficient frequency and volume to provide pricing information on an ongoing basis.
If there is no quoted pricing in an active market, then the Group uses valuation techniques that maximise the use of relevant observable inputs and minimise the use of unobservable inputs. The chosen valuation technique incorporates all the factors that market participants would consider in pricing a transaction.
The fair value of an asset or a liability is measured using the assumptions that market participants would use the fair value hierarchy when pricing the asset or liability, if market participants act in their economic best interest.
The Group recognises transfers between levels of the fair value hierarchy as of the end of the reporting period during which the change has occurred.
A fair value measurement of a non-financial asset considers a market participant’s ability to generate economic benefits by using the asset in its highest and best use or by selling it to another market participant that would use the asset in its highest and best use. External professional valuers are involved for valuation of significant assets such as land and building.
An analysis of fair value measurement of financial assets and liabilities is provided in Note 56 on pages 419 to 424.
2.4 Significant accounting policies – General2.4.1 Basis of consolidation
The Financial Statements of the Bank and the Group comprise of the Financial Statements of the Bank and its Subsidiaries in terms of the SLFRS 10 – “Consolidated Financial Statements” and LKAS 27 – “Consolidated and Separate Financial Statements”.
2.4.1.1 Business combinations
Business combinations are accounted for using the acquisition method when control is transferred to the Group as per Sri Lanka Accounting Standard – SLFRS 3 on “Business Combinations” (SLFRS 3). The consideration transferred in the acquisition and identifiable net assets acquired are measured at fair value. Any goodwill that arises is tested annually for impairment. Any gain on a bargain purchase is recognised in profit or loss immediately. Transaction costs are expensed as incurred, except if they are related to the issue of debt or equity securities.
The consideration transferred does not include amounts related to the settlement of pre-existing relationships. Such amounts are generally recognised in profit or loss.
Any contingent consideration is measured at fair value at the date of acquisition. If an obligation to pay contingent consideration that meets the definition of a financial instrument is classified as equity, then it is not remeasured and settlement is accounted for within equity. Otherwise, subsequent changes in the fair value of the contingent consideration are recognised in profit or loss.
2.4.1.2 Non-Controlling Interests (NCI)
Details of NCI are given in Note 47 on page 387.
2.4.1.3 Subsidiaries
The Financial Statements of the subsidiaries are fully consolidated from the date on which control is transferred to the Bank and continued to be consolidated until the date when such control ceases. The Control exists where the Bank has the power to govern the financial and operating policies of an entity so as to obtain benefits from its activities. The Financial Statements of the Bank’s Subsidiaries for the purpose of consolidation are prepared for the same Reporting period as that of National Savings Bank, using consistent accounting policies.
2.4.1.4 Loss of control
When the Group loses control over a subsidiary, it derecognises the assets and liabilities of the subsidiary, and any related NCI and other components of equity. Any resulting gain or loss is recognised in profit or loss. Any interest retained in the former subsidiary is measured at fair value when control is lost.
2.4.1.5 Transactions eliminated on consolidation
All intra–group balances, income and expenses and unrealised gains and losses resulting from intra-group transactions are eliminated in full in preparing the Consolidated Financial Statements. Refer Note 49.3 and 49.4 – transaction with subsidiary companies on pages 390 and 391.
2.4.2 Foreign currency transactions and balances
All foreign currency transactions are translated into the functional currency, which is Sri Lankan Rupees, using the exchange rates prevailing at the dates on which the transactions were affected.

Governance Financial Reports Supplementary Information
312 National Savings Bank │ Annual Report 2019 Notes to the Financial Statements
Monetary assets and liabilities denominated in foreign currencies at the reporting date are retranslated to Sri Lankan Rupees using the middle exchange rate ruling at that date. All exchange differences arising on the settlement of monetary items or on translating monetary items at rates different to those at which they are initially recorded are recognised in the Income Statement in the period in which they arise.
Non-monetary items that are measured in terms of historical cost in a foreign currency are translated to functional currency using the exchange rates at the dates of the initial transactions. Non-monetary items measured at fair value in foreign currency are translated using the exchange rates at the date when the fair value was determined.
The Statement of Financial Position of Foreign Currency Banking Unit is translated to Sri Lankan Rupees at the middle rate of exchange ruling at the reporting date. The transactions of the Foreign Currency Banking Unit have been recorded in accordance with the above policy and the resulting gains/losses are recognised in the Income Statement.
2.5 Significant accounting policies – Recognition of assets and liabilities
Financial Instruments
SLFRS 9 – “Financial Instrument” replaces LKAS 39 for annual periods on or after 1 January 2018. The Bank elected, as a policy choice permitted under SLFRS 9, to continue to apply hedge accounting in accordance with LKAS 39.
2.5.1 Financial instruments – Initial recognition, classification and subsequent measurement
2.5.1.1 Date of recognition
The Group initially recognises loans and advances, deposits and subordinated liabilities, etc., on the
date on which they are originated. Loans and advances to customers are recognised when funds are transferred to the customers’ accounts. The Bank recognises balances due to depositors when funds are transferred to the Bank. All other financial instruments (including regular-way purchases and sales of financial assets) are recognised on the trade date, which is the date on which the Group becomes a party to the contractual provisions of the instrument.
2.5.1.2 Recognition and initial measurement of financial instruments
The classification of financial instruments at initial recognition depends on their contractual terms and the business model for managing the instruments, as described in Notes 2.5.1.4.1 and 2.5.1.4.2.
Financial instruments are initially measured at their fair value (as defined in Note 56), except in the case of financial assets and financial liabilities recorded at FVPL, transaction costs are added to, or subtracted from, this amount. Trade receivables are measured at the transaction price. When the fair value of financial instruments at initial recognition differs from the transaction price, the Bank and the Group accounts for the Day 1 profit or loss, as described below.
2.5.1.3 “Day 1” profit or loss
When the transaction price differs from the fair value of other observable current market transactions in the same instrument, or fair value based on a valuation technique whose variables include only data from observable markets, the Group immediately recognises the difference between the transaction price and fair value (a “Day 1” profit or loss). In cases where fair value is determined using data which is not observable, the difference between the transaction price and model value is only recognised in the Statement of Comprehensive Income when the inputs become observable, or
when the instrument is derecognised the difference between transaction price and fair value is recognised in Income Statement. The “Day 1 loss” arising in the case of loans granted to employees at concessionary rates under uniformly applicable schemes is deferred and amortised using Effective Interest Rates (EIR) in “Interest Income and Personnel Expenses” over the remaining service period of the employees or tenure of the loan whichever is shorter.
2.5.1.4 Classification and subsequent measurement of financial assets
The Group classifies all of its financial assets based on the business model for managing the assets and the asset’s contractual terms, measured at either:
z Amortised cost, z Fair Value Though Other
Comprehensive Income (FVOCI), z Fair Value through Profit or Loss
(FVPL)
The Bank and the Group classifies and measures its derivative and trading portfolio at FVPL as explained in Note 2.5.1.6. The Group may designate financial instruments at FVPL, if so doing eliminates or significantly reduces measurement or recognition inconsistencies.
2.5.1.4.1 Business model assessmentThe Bank and the Group determines its business model at the level that best reflects how it manages groups of financial assets to achieve its business objective.
The Bank’s business model is not assessed on an instrument-by-instrument basis, but at a higher level of aggregated portfolios and is based on observable factors such as:
z How the performance of the business model and the financial assets held within that business model are evaluated and reported to the entity’s key management personnel,

Governance Financial Reports Supplementary Information
313Annual Report 2019 │ National Savings BankNotes to the Financial Statements
z The risks that affect the performance of the business model (and the financial assets held within that business model) and, in particular, the way those risks are managed,
z How managers of the business are compensated, (for example, whether the compensation is based on the fair value of the assets managed or on the contractual cash flows collected)
z The expected frequency, value and timing of sales are also important aspects of the Bank’s assessment,
The business model assessment is based on reasonably expected scenarios without taking “worst case” or “stress case” scenarios into account. If cash flows after initial recognition are realised in a way that is different from the Bank’s original expectations, the Bank does not change the classification of the remaining financial assets held in that business model but incorporates such information when assessing newly originated or newly purchased financial assets going forward.
2.5.1.4.2 Assessment of whether contractual cash flows are solely payments of principal and interest (SPPI test)As a second step of its classification process, the Group assesses the contractual terms of financial assets to identify whether they meet the SPPI test.
“Principal” for the purpose of this test is defined as the fair value of the financial asset at initial recognition and may change over the life of the financial asset (for example, if there are repayments of principal or amortisation of the premium/discount).
The most significant elements of interest within a lending arrangement are typically the consideration for the time value of money and credit risk. To make the SPPI assessment, the Group applies judgement and considers relevant factors such as the currency in which the financial asset is denominated, and the period for which the interest rate is set.
In contrast, contractual terms that introduce a more than de minimise exposure to risks or volatility in the contractual cash flows that are unrelated to a basic lending arrangement do not give rise to contractual cash flows that are solely payments of principal and interest on the amount outstanding. In such cases, the financial asset is required to be measured at FVPL.
Refer Notes 2.5.1.4.3 to 2.5.1.4.5 below for details on different types of financial assets recognised on the Statement of Financial Position.
2.5.1.4.3 Financial assets measured at amortised costA financial asset is measured at amortised cost if it meets both of the following conditions and is not designated as at FVPL:
z The asset is held within a business model whose objective is to hold assets to collect contractual cash flows; and
z The contractual terms of the financial asset give rise on specified dates to cash flows that are solely payments of principal and interest on the principal amount outstanding.
Financial assets measured at amortised cost are given below:
(a) Cash and cash equivalents Details of “Cash and cash
equivalents” are given in Note 16 on page 338.
(b) Balances with central banks Details of “Balances with central
banks” are given in Note 17 on page 338.
(c) Placements with banks Details of “Placement with banks”
are given in Note 18 on page 338.
(d) Financial assets at amortised cost – Loans and advances
Details of “loans and advances” are given in Note 21 on page 346.
(e) Financial assets at amortised cost – Debt and other instruments
Details of “debt and other instruments” are given in Note 22 on page 351.
2.5.1.4.4 Financial assets measured at FVOCIFinancial assets measured at FVOCI include debt and equity instruments measured at fair value through other comprehensive income.
Financial assets measured at FVOCI are given in Notes (a) and (b) below:
(a) Debt instruments measured at FVOCI
Debt instruments are measured at FVOCI if they are held within a business model whose objective is to hold for collection of contractual cash flows and for selling financial assets, where the asset’s cash flows represent payments that are solely payments of principal and interest on principal outstanding.
Details of “Debt instruments at FVOCI” are given in Note 23 on pages 353 to 356.
(b) Equity instruments designated at FVOCI
Upon initial recognition, the Group elects to classify irrevocably some of its equity investments held for strategic and statutory purposes as equity instruments at FVOCI. Details of “Equity instruments at FVOCI” are given in Note 23 on pages 353 to 356.
2.5.1.4.5 Financial assets measured at FVPLAs per SLFRS 9, all financial assets other than those classified at amortised cost or FVOCI are classified as measured at FVPL. Financial assets at fair value through profit or loss include financial assets that are held for trading or managed and whose performance is evaluated on a fair value basis as they are neither held to collect contractual cash flows nor held both to collect contractual cash flows and to sell financial assets and financial assets

Governance Financial Reports Supplementary Information
314 National Savings Bank │ Annual Report 2019 Notes to the Financial Statements
designated upon initial recognition at fair value through profit or loss which are discussed in below:
(a) Financial assets designated at fair value through profit or loss
Financial assets designated at fair value through profit or loss are recorded in the SOFP at fair value. Changes in fair value are recorded in “Net gain or loss on financial assets and liabilities designated at fair value through profit or loss”. Interest earned is accrued in “Interest Income”, using the EIR, while dividend income is recorded in “Other operating income” when the right to receive the payment has been established.
The Group do not have any designated financial assets upon initial recognition as fair value through profit or loss as at the end of the reporting period.
2.5.1.5 Classification and subsequent measurement of financial liabilities
As per SLFRS 9, the Group classifies financial liabilities, other than financial guarantees and loan commitments into one of the following categories:
z Financial liabilities at fair value through profit or loss, and within this category as –
– Held-for-trading; or
– Designated at fair value through profit or loss;
z Financial liabilities measured at amortised cost.
The subsequent measurement of financial liabilities depends on their classification. SLFRS 9, largely retains the existing requirements in LKAS 39 for the classification of financial liabilities.
2.5.1.5.1 Financial liabilities at fair value through profit or lossThe Group do not have any designated financial liabilities at fair value through profit or loss as at the end of the reporting period.
2.5.1.5.2 Financial liabilities at amortised costFinancial liabilities issued by the Group that are not designated at FVPL are classified as financial liabilities at amortised cost under “Due to banks”, “Due to depositors”, “Due to debt securities holders”, “due to other borrowers”, or “Debt security issued” as appropriate, where the substance of the contractual arrangement results in the Group having an obligation either to deliver cash or another financial asset to the holder, or to satisfy the obligation other than by the exchange of a fixed amount of cash or another financial asset for a fixed number of own equity shares. The Group classifies capital instruments as financial liabilities or equity instruments in accordance with the substance of the contractual terms of the instrument.
After initial recognition, such financial liabilities are subsequently measured at amortised cost using the EIR (Effective Interest Rate) method. Amortised cost is calculated by taking into account any discount or premium on acquisition and fees or costs that are an integral part of the EIR.
The EIR amortisation is included in “Interest expense” in the Income Statement. Gains and losses too are recognised in the Income Statement when the liabilities are derecognised as well as through the EIR amortisation process.
(a) Due to banks Details of “Due to banks” are given
in Note 32 on page 367.
(b) Due to depositors Details of “Due to depositors” are
given in Note 35 on page 368.
(c) Due to debt securities holders Details of “Due to debt securities
holders” are given in Note 35 on page 368.
(d) Due to other borrowers Details of “Due to other borrowers”
are given in Note 35 on page 368.
(e) Debt securities issued Details of “Debt securities issued”
are given in Note 37 on page 370.
2.5.1.6 Derivative assets and liabilities
Derivative assets and liabilities are broadly classified into derivatives recorded at fair value through profit or loss and derivatives held for risk management purposes.
2.5.1.6.1 Derivatives recorded at fair value through profit or lossA derivative is a financial instrument or other contract with all three of the following characteristics:
z Its value changes in response to the change in a specified interest rate, financial instrument price, commodity price, foreign exchange rate, index of prices or rates, credit rating or credit index, or other variable, provided that, in the case of a non-financial variable, it is not specific to a party to the contract (i.e., the “underlying”).
z It requires no initial net investment or an initial net investment that is smaller than would be required for other types of contracts expected to have a similar response to changes in market factors.
z It is settled at a future date.
The Bank enters into derivative transactions with various counterparties. These include interest rate swaps, credit default swaps, cross-currency swaps, forward foreign exchange contracts and foreign currencies. Derivatives are recorded at fair value and carried as assets when their fair value is positive and as liabilities when their fair value is negative. The notional amount and fair value of such derivatives are disclosed separately in Note 19 and 33. Changes in the fair value of derivatives are included in net trading income unless hedge accounting is applied. Hedge accounting disclosures are provided in Note 19 on pages 339 to 342.

Governance Financial Reports Supplementary Information
315Annual Report 2019 │ National Savings BankNotes to the Financial Statements
2.5.1.6.2 Derivatives held for risk management purposes and hedge accountingDerivatives held for risk management purposes include all derivative assets and liabilities that are not classified as trading assets and liabilities. Derivatives held for risk management purposes are measured at fair value in the SOFP.
2.5.1.6.2.1 Fair value hedges
When a derivative is designated as the hedging instrument in a hedge of the change in fair value of a recognised asset or liability or a firm commitment that could affect the profit or loss, changes in the fair value of the derivative are recognised immediately in profit or loss in the same line item as the hedged item that is attributable to the hedged risk.
If the hedging derivative expires or is sold, terminated or exercised, or the hedge no longer meets the criteria for fair value hedge accounting, or the hedge designation is revoked, then hedge accounting is discontinued prospectively. However, if the derivative is novated to a central counterparty by both parties as a consequence of laws or regulations without changes in its terms except for those are necessary for the novation, then the derivative is not considered as expired or terminated.
Any adjustment up to the point of discontinuation to a hedged item for which the effective interest method is used is amortised to profit or loss as part of the recalculated EIR of the item over its remaining life. The Group do not have any fair value hedge as at the end of the reporting period.
2.5.1.6.2.2 Cash flow hedges
When a derivative is designated as the hedging instrument in a hedge of the variability in cash flows attributable to a particular risk associated with a recognised asset or liability that could affect the profit or loss, the effective portion of changes in the fair value of the derivative are recognised in OCI
and presented in the hedging reserve within equity. Any ineffective portion of changes in the fair value of the derivative is recognised immediately in profit or loss.
The amount recognised in OCI is reclassified to profit or loss as a reclassification adjustment in the same period as the hedged cash flows affect profit or loss, and in the same line item in the Statement of Profit or Loss and OCI.
If the hedging derivative expires or is sold, terminated or exercised, or the hedge no longer meets the criteria for cash flow hedge accounting, or the hedge designation is revoked, then hedge accounting is discontinued prospectively. However, if the derivative is novated to a central counterparty by both parties as a consequence of laws or regulations without changes in its terms except for those are necessary for the novation, then the derivative is not considered as expired or terminated. The Group do not have any cashflow hedge as at the end of the reporting period.
2.5.1.6.3 Embedded derivativesAn embedded derivative is a component of a hybrid instrument that also includes a non-derivative host contract with the effect that some of the cash flows of the combined instrument vary in a way similar to a stand-alone derivative. An embedded derivative cause some or all of the cash flows that otherwise would be required by the contract to be modified according to a specified interest rate, financial instrument price, commodity price, foreign exchange rate, index of prices or rates, credit rating or credit index, or other variable, provided that, in the case of a non-financial variable, it is not specific to a party to the contract. A derivative that is attached to a financial instrument, but is contractually transferable independently of that instrument, or has a different counterparty from that instrument, is not an embedded derivative, but a separate financial instrument.
As per SLFRS 9, Derivatives may be embedded in another contractual arrangement (a host contract). The Group treats derivatives embedded in financial liabilities and non-financial host contracts as separate derivatives if:
z The host contract is not itself carried at FVPL;
z The terms of the embedded derivative would meet the definition of a derivative if they were contained in a separate contract; and
z The economic characteristics and risks of the embedded derivative are not closely related to the economic characteristics and risks of the host contract.
As at the reporting date the Group do not have embedded derivatives.
2.5.1.7 Reclassification of financial assets and liabilities
As per SLFRS 9, Financial assets are not reclassified subsequent to their initial recognition, except and only in those rare circumstances when the Group changes its objective of the business model for managing such financial assets which may include the acquisition, disposal or termination of a business line.
Financial Liabilities are not reclassified as such reclassifications are not permitted by SLFRS 9.
2.5.1.7.1 Measurement of reclassification of financial assets
2.5.1.7.1.1 Reclassification of Financial Instruments at ‘Fair value through profit or loss
– to Fair value through other comprehensive income
The fair value on reclassification date becomes the new gross carrying amount. The EIR is calculated based on the new gross carrying amount. Subsequent changes in the fair value is recognised in OCI.

Governance Financial Reports Supplementary Information
316 National Savings Bank │ Annual Report 2019 Notes to the Financial Statements
– to amortised cost
The fair value on reclassification date becomes the new carrying amount. The EIR is calculated based on the new gross carrying amount.
2.5.1.7.1.2 Reclassification of Financial Instruments at “Fair value through other comprehensive income”
– to fair value through profit or loss
The accumulated balance in OCI is reclassified to profit and loss on the reclassification date.
– to amortised cost
The financial asset is reclassified at fair value. The cumulative balance in OCI is removed and is used to adjust fair value on the reclassification date. The adjusted amount becomes the amortised cost.
EIR determined at initial recognition and gross carrying amount are not adjusted as a result of reclassification.
2.5.1.7.1.3 Reclassification of financial instruments at “Amortised Cost”
– to fair value through other comprehensive income
The asset is remeasured to fair value, with any difference recognised in OCI. EIR determined at initial recognition is not adjusted as a result of reclassification.
– to fair value through profit or loss
The fair value on the reclassification date becomes the new carrying amount. The difference between amortised cost and fair value is recognised in profit and loss.
Bank and the Group do not have any reclassification of financial instrument for the reporting period.
2.5.1.8 Derecognition of financial assets and financial liabilities
2.5.1.8.1 Financial assetsThe Group derecognises a financial asset (or where applicable a part thereof) when the contractual rights to the cash flows from the financial asset expire or it transfers the rights to receive the contractual cash flows in a transaction in which substantially all risks and rewards of ownership of the financial asset are transferred or in which the Group neither transfers nor retains substantially all risks and rewards of ownership and it does not retain control of the financial asset.
On derecognition of a financial asset, the difference between the carrying amount of the asset (or the carrying amount allocated to the portion of the asset derecognised) and the sum of the consideration received (including any new asset obtained less and new liability assumed) and any cumulative gain or loss that had been recognised in OCI is recognised in profit or loss.
However, cumulative gain/loss recognised in OCI in respect of equity investment securities designated as at FVOCI is not recognised in profit or loss on derecognition of such securities as per SLFRS 9. Any interest in transferred financial assets that qualify for derecognition that is created or retained by the Group is recognised as a separate asset or liability.
The Group enters into transactions whereby it transfers assets recognised on its SOFP, but retains either all or substantially all risks and rewards of the transferred assets or a portion of them. In such cases, the transferred assets are not derecognised.
When the Group has transferred its right to receive cash flows from an asset or has entered into a pass-through arrangement and has neither transferred nor retained substantially all the risks and rewards of the asset nor transferred control of the asset,
the asset is recognised to the extent of the Group’s continuing involvement in the asset. In that case, the Group also recognises an associated liability. The transferred asset and the associated liability are measured on the basis that reflected the rights and obligations that the Group has retained.
2.5.1.8.2 Financial liabilitiesThe Group derecognises a financial liability when its contractual obligations are discharged, cancelled or expired.
2.5.1.9 Modification of financial assets and financial liabilities
2.5.1.9.1 Financial assetsIf the terms of a financial asset are modified, the Group evaluates whether the cash flows of the modified asset are substantially different. If the cash flows are substantially different, then the contractual rights to cash flows from the original financial asset are deemed to have expired. In this case, the original financial asset is derecognised, and a new financial asset is recognised at fair value.
As per SLFRS 9, if the cash flows of the modified asset carried at amortised cost are not substantially different, then the modification does not result in derecognition of the financial asset. In this case, the Group recalculates the gross carrying amount of the financial asset and recognises the amount arising from adjusting the gross carrying amount as a modification gain or loss in profit or loss. If such a modification is carried out because of financial difficulties of the borrower, then the gain or loss is presented together with impairment losses. In other cases, it is presented as interest income.
2.5.1.9.2 Financial liabilitiesWhere an existing financial liability is replaced by another from the same lender on substantially different terms or the terms of an existing liability are substantially modified, such an exchange or modification is treated as

Governance Financial Reports Supplementary Information
317Annual Report 2019 │ National Savings BankNotes to the Financial Statements
a derecognition of the original liability and the recognition of a new liability. In this case, a new financial liability based on the modified terms is recognised at fair value. The difference between the carrying amount of the financial liability extinguished and the new financial liability with modified terms is recognised in profit or loss.
2.5.1.10 Offsetting of financial instruments
Financial assets and financial liabilities are offset, and the net amount reported in the SOFP if, and only if, there is a currently enforceable legal right to offset the recognised amounts and there is an intention to settle on a net basis, or to realise the assets and settle the liabilities simultaneously. Bank and the Group do not have offset any financial instrument for the reporting period.
2.5.1.11 Amortised cost and gross carrying amount
The “amortised cost” of a financial asset or financial liability is the amount at which the financial asset or financial liability is measured on initial recognition minus the principal repayments, plus or minus the cumulative amortisation using the EIR method of any difference between that initial amount and the maturity amount and, for financial assets, adjusted for any ECL allowance.
The “gross carrying amount of a financial asset” is the amortised cost of a financial asset before adjusting for any ECL allowance.
2.5.1.12 Fair value of financial instruments
Fair value measurement of financial instruments including the fair value hierarchy is explained in Note 2.3 and 56 on pages 311 and 419.
2.5.2 Impairment of financial assets
2.5.2.1 Individual assessment of impairment
For the financial assets above a predetermined threshold (i.e. for individually significant financial assets), if there is objective evidence that an impairment loss had been incurred, the amount of the loss was measured as the difference between the asset’s carrying amount and the present value of estimated future cash flows (excluding future expected credit losses that had not been incurred).
The calculation of the present value of the estimated future cash flows of a collateralised financial asset reflects the cash flows that may result from foreclosure less costs for obtaining and selling the collateral, whether or not foreclosure was probable. Details of Individual assessment of impairment are given in Note 21. (d) on page 348.
2.5.2.2 Individually significant assessment and not impaired individually
Loans which are individually significant but not impaired will be assessed collectively for impairment either under Stage 1 or Stage 2 based on the criteria whether there has been significant credit deterioration since origination.
While establishing significant credit deterioration the Group will consider the following criterias:
z Other changes in the rates or terms of an existing financial instrument that would be significantly different if the instrument was newly originated.
z Significant changes in external market indicators of credit risk for a particular financial instrument or similar financial instrument.
z Other Information related to the borrower, such as changes in the price of a borrower’s debt/equity instrument.
z An actual/expected internal credit rating downgrade for the borrower or decrease in behavioural score used to assess credit risk internally.
z Existing or forecast adverse changes in business, financial or economic condition that are expected to cause significant change in the borrower’s ability to meet its obligation.
z An Actual or expected significant change in the operating results of the borrower in relating to actual/expected decline in revenue, increase in operating risk, working capital deficiency, Decrease in Asset quality, Increase in gearing, liquidity management problems.
z Significant increase in credit risk on other financial instruments of the same borrower.
z An Actual or expected significant adverse change in the regulatory, economic or technological environment of the borrower that result in a significant change in the borrower’s ability to meet the debt obligation.
2.5.2.3 Overview of the ECL principles
The adoption of SLFRS 9 has fundamentally changed the Group’s loan loss impairment method by replacing LKAS 39’s incurred loss approach with a forward-looking ECL approach.
From 1 January 2018, the Group have been recording the allowance for expected credit losses for all loans and other debt financial assets not held at FVPL, together with loan commitments and financial guarantee contracts, in this section all referred to as ‘financial instruments’. Equity instruments are not subject to impairment under SLFRS 9.
The ECL allowance is based on the credit losses expected to arise over the life of the asset (the lifetime expected credit loss or LTECL), unless there has been no significant increase in credit risk since origination, in which case, the allowance is based on the 12 months’

Governance Financial Reports Supplementary Information
318 National Savings Bank │ Annual Report 2019 Notes to the Financial Statements
expected credit loss (12mECL). The Group’s policies for determining if there has been a significant increase in credit risk are set out in Note 2.5.2.7 on page 319.
The 12mECL is the portion of LTECLs that represent the ECLs that result from default events on a financial instrument that are possible within the 12 months after the reporting date. Both LTECLs and 12mECLs are calculated on either an individual basis or a collective basis, depending on the nature of the underlying portfolio of financial instruments.
The Group has established a policy to perform an assessment, at the end of each reporting period, of whether a financial instrument’s credit risk has increased significantly since initial recognition, by considering the change in the risk of default occurring over the remaining life of the financial instrument.
Based on the above process, the Bank and the Group's its loans into Stage 1, Stage 2 and Stage 3 as described below:
Stage 1: z When loans are first recognised,
the Bank recognises an allowance based on 12mECLs. Stage 1 loans also include facilities where the credit risk has improved, but not originally credit impaired on initial recognition and the loan has been reclassified from Stage 2.
Stage 2: z When a loan has shown a significant
increase in credit risk since origination, the Bank records an allowance for the LTECLs. Stage 2 loans also include facilities, where the credit risk has improved, and the loan has been reclassified from Stage 3.
z Credit facilities, where contractual payments of a customer are more than 30 days past due, other than the credit facilities categorised under Stage 3 below, subject to the rebuttable presumption as stated in SLFRS 9.
Stage 3: z Credit facilities where contractual
payments of a customer are more than 90 days past due, subject to the rebuttable presumption as stated in SLFRS 9.
z All restructured loans, which are restructured more than twice.
z All rescheduled loans. z All credit facilities/customers
classified as non-performing as per CBSL Directions.
z When the risk rating of a customer or an instrument has been downgraded to B+ by an external credit rating agency and/or when there is a two-notch downgrade in the Banks internal rating system.
z Credit facilities/customers in which significant increase in credit risk (refer Note 2.5.2.7).
For financial assets for which the Bank has no reasonable expectations of recovering either the entire outstanding amount, or a proportion thereof, the gross carrying amount of the financial asset is reduced. This is considered a (partial) derecognition of the financial asset.
2.5.2.4 The calculation of ECL
The Group calculates ECL to measure the expected cash shortfalls, discounted at an approximation to the EIR. A cash shortfall is the difference between the cash flows that are due to an entity in accordance with the contract and the cash flows that the entity expects to receive.
The mechanics of the ECL calculations are outlined below and the key elements are, as follows:
z Probability of Default (PD)
The Probability of default is an estimate of the likelihood of default over a given time horizon. A default may only happen at a certain time over the assessed period, if the facility has not been previously derecognised and is still in the portfolio.
z Exposure at Default (EAD)
The Exposure at Default is an estimate of the exposure at a future default date, taking into account expected changes in the exposure after the reporting date, including repayments of principal and interest, whether scheduled by contract or otherwise, expected draw downs on committed facilities, and accrued interest from missed payments.
z Loss Given Default (LGD)
The Loss Given Default is an estimate of the loss arising in the case where a default occurs at a given time. It is based on the difference between the contractual cash flows due and those that the lender would expect to receive, including from the realisation of any collateral. It is usually expressed as a percentage of the EAD.
The maximum period for which the credit losses are determined is the contractual life of a financial instrument unless the Bank has the legal right to call it earlier. Impairment losses and releases are accounted for and disclosed separately from modification losses or gains that are accounted for as an adjustment of the financial asset’s gross carrying value.The mechanics of the ECL method are summarised below:
Stage 1:
The 12mECL is calculated as the portion of LTECLs that represent the ECLs that result from default events on a financial instrument that are possible within the 12 month after the reporting date. The Group calculates the 12mECL allowance based on the expectation of a default occurring in the 12 months following the reporting date. These expected 12-month default probabilities are applied to a forecast EAD and multiplied by the expected LGD and discounted by an approximation to the original EIR.
Stage 2:
When a loan has shown a significant increase in credit risk since origination, the Group records an allowance for the

Governance Financial Reports Supplementary Information
319Annual Report 2019 │ National Savings BankNotes to the Financial Statements
LTECLs. The mechanics are similar to those explained above, but PDs and LGDs are estimated over the lifetime of the instrument. The expected cash shortfalls are discounted by an approximation to the original EIR.
Stage 3:
For loans considered credit-impaired, the Group recognises the lifetime expected credit losses for these loans. The method is similar to that for Stage 2 assets, with the PD set at 100%.
2.5.2.5 Debt instruments measured at fair value through OCI
The ECLs for debt instruments measured at FVOCI do not reduce the carrying amount of these financial assets in the SOFP, which remains at fair value. Instead, an amount equal to the allowance that would arise if the assets were measured at amortised cost is recognised in OCI as an accumulated impairment amount, with a corresponding charge to profit or loss. The accumulated loss recognised in OCI is recycled to the profit and loss upon derecognition of the assets. Bank and the Group do not have any debt instrument measured at fair value through OCI subject to impairment as at reporting period.
2.5.2.6 Forward looking information
In its ECL models, the Bank relies on a broad range of forward looking information as economic inputs, such as:
z GDP growth z Unemployment rates z Inflation rates z Exchange rates z Interest rates
The inputs and models used for calculating ECLs may not always capture all characteristics of the market at the reporting date. To reflect this, qualitative adjustments or overlays are occasionally made as temporary adjustments when such differences are significantly material.
2.5.2.7 Significant increase in credit risk
The Group continuously monitors all assets subject to ECL, in order to determine whether an instrument or a portfolio of instruments is subject to 12mECL or LTECL, the Group assess whether there has been a significant increase in credit risk since initial recognition. The Group considers reasonable and supportable information that is relevant and available without undue cost or effort. This includes both quantitative and qualitative information analysis based on the Banks historical experience & expert credit assessment and including forward looking information. Accordingly the Group considers the significant increase in credit risk when one of the following factors/condition are met.
z When contractual payments of a customer are more than 30 days past due (subject to the rebuttable presumption in the SLFRS 9)
z When the risk rating of a customer or an instrument has been downgraded to B+ by an external credit rating agency
z Re-structured facilities z Secondary qualitative indicators
triggering a significant increase in credit risk for an asset, such as moving a customer/facility to watch list.
z When reasonable and supportable forecasts of future economic conditions directly affect the performance of a customer/group of customers, portfolios or instruments.
z When there is a significant change in the geographical locations or natural catastrophes that directly impact the performance of a customer/group of customers or an instrument;
z When the value of collateral is significantly reduced and/or realisability of collateral is doubtful.
z When a customer is subject to litigation, that significantly affects the performance of the credit facility;
z Frequent changes in the senior management of an institutional customer
z Delay in the commencement of business operations/projects by more than two years from the originally agreed date;
z Modification of terms resulting in concessions, including extensions, deferment of payments, waiver of covenants etc.;
z When the customer is deceased/insolvent
z When the Bank is unable to contact or find the customer
z A fall of 50% or more in the turnover and/or profit before tax of the customer when compared to the previous year; and
z Erosion in net-worth by more than 25% when compared to the previous year.
2.5.2.8 Definition of default and credit impaired assets
The Group considers loans and advances to other customers be defaulted when:
z The borrower is unlikely to pay its obligations to the Group in full, without recourse by the Group to actions such as realising security (if any is held); or
z The borrower becomes 90 days past due on its contractual payments.
In addition, the Group classifies the financial investments under Stage 3 when the external credit rating assigned to the particular investment is “default”.
2.5.3 Property, Plant and Equipment (PPE)
Details of property, plant and equipment are given in Note 26 on page 358.
2.5.3.1 Depreciation
Details of “Depreciation” are given in Note 26 on pages 358.

Governance Financial Reports Supplementary Information
320 National Savings Bank │ Annual Report 2019 Notes to the Financial Statements
2.5.3.2 Borrowing costs
As per the Sri Lanka Accounting Standard – LKAS 23 on “Borrowing Costs”, the Group capitalises borrowing costs that are directly attributable to the acquisition, construction or production of a qualifying asset as part of the cost of the asset. A qualifying asset is an asset which takes a substantial period of time to get ready for its intended use or sale. Other borrowing costs are recognised in the profit or loss in the period in which they occur. Bank and the Group do not have any capitalise borrowing cost for the reporting period.
2.5.4 Intangible assets
Details of intangible assets are given in Note 29 on page 365.
2.5.5 Impairment of non-financial assets
The Group assess at each reporting date whether there is an indication that an asset other than deferred tax asset, may be impaired. If any indication exists, or when annual impairment testing for an asset is required, the Group estimates the asset’s recoverable amount. Where the carrying amount of an asset exceeds its recoverable amount, the asset is considered impaired and is written down to its recoverable amount.
2.5.6 Retirement benefit obligation
2.5.6.1 Defined benefit pension plans
2.5.6.1.1 Staff Pension Fund – IThe Bank operates a defined benefit pension plan, for the permanent staff members who have joined the Bank prior to 1 October 1995, which requires contributions to be made to a separately administered fund. The cost of providing benefits under the defined benefit pension plan-I is determined using the Projected Unit Credit actuarial valuation method. Actuarial gains and losses are recognised in the other comprehensive income in the period in which they arise.
The defined benefit asset or liability is calculated as the present value of the defined benefit obligation less past service costs not yet recognised and less the fair value of planned assets out of which the obligations are to be settled directly, less actuarial losses not yet recognised. The value of the defined benefit liability is borne by the Bank and recognised in the profit or loss. The value of any asset is restricted to the sum of any actuarial losses and past service cost not yet recognised and the present value of any economic benefits available in the form of refunds from the plan or reductions in the future contributions to the plan.
The latest actuarial valuation was carried out as of 31 December 2019, by Mr M Poopalanathan, AIA, of Messrs Actuarial & Management Consultants (Pvt) Ltd., a firm of professional Actuaries.
The principal financial assumptions used in the valuation as at 31 December 2019 are as follows:
Interest/discount rate 11.00% p.a.Increase in cost of living allowances 4.50% p.a.Increase in average basic salary 6.50% p.a.
The assets of the fund are held separately from these of the Bank and are independently administrated by the Trustees as per the provisions of the Trust Deed and are subject to annual audit by Independent External Auditors. The Financial Statements of the pension I as well as the Auditor’s Report are tabled and reviewed by the Board of Trustees and Board of directors of the Bank. They are also submitted for review of the disclosure of the Bank, as the Bank has an obligation of ensuring that funding is made at optimum levels. Pension is payable monthly as long as the participant is alive.
Details of Staff pension fund I are given in Note 38. (a) 1. on pages 373 to 375.
2.5.6.1.2 Un-funded pension liabilityThe past service cost not funded is recognised in other comprehensive income immediately upon actuarial valuation. The actuarial valuation as at 31 December 2019 indicated a past service cost deficit of Rs. 4,682 Mn. which has been provided in full. The details of Unfunded Pension Liability are given in Note 38 (a).1. on pages 373 to 375.
2.5.6.1.3 Staff Pension Fund – IIThe Bank established and operates a defined benefit pension plan, for the permanent staff members who have joined the Bank on or after 1 October 1995, which requires the Bank to monthly contribute 12% of members’ gross salary to a separately administered fund. The cost of providing benefits under the defined benefit pension plan is determined using the Projected Unit Credit actuarial valuation method. Actuarial gains and losses are recognised in the other comprehensive income in the period in which they arise.
The defined benefit asset or liability is calculated as the present value of the defined benefit obligation less past service costs not yet recognised and less the fair value of planned assets out of which the obligations are to be settled directly, less actuarial losses not yet recognised. The value of the defined benefit liability is borne by the Bank and recognised in the profit or loss. The value of any asset is restricted to the sum of any actuarial losses and past service cost not yet recognised and the present value of any economic benefits available in the form of refunds from the plan or reductions in the future contributions to the plan.
The latest actuarial valuation was carried out as of 31 December 2019, by Mr M Poopalanathan, AIA, of Messrs Actuarial & Management Consultants (Pvt) Ltd., a firm of professional Actuaries.

Governance Financial Reports Supplementary Information
321Annual Report 2019 │ National Savings BankNotes to the Financial Statements
The principal financial assumptions used in the valuation as at 31st December 2019 are as follows:
Interest/discount rate 11.00% p.a.Increase in cost of living allowances 4.50% p.a.Increase in average basic salary 6.50% p.a.
The assets of the fund are held separately from these of the Bank and are independently administrated by the Trustees as per the provisions of the Trust Deed and are subject to annual audit by Independent External Auditors. The Financial Statements of the pension II as well as the Auditor’s Report are tabled and reviewed by the Board of Trustees and Board of directors of the Bank. They are also submitted for review of the disclosure of the Bank, as the Bank has an obligation of ensuring that funding is made at optimum levels. Pension is payable monthly as long as the participant is alive.
Details of Staff Pension Fund II are given in Note 38. (a) 2. on pages 376 to 378.
2.5.6.1.4 Widows’/Widowers’ and Orphans Pension FundEffective from 2013 December, the Bank has established a “Widows’/Widowers’ and Orphans” Pension Scheme for the members of Pension scheme – II. Members of Pension Scheme II are opting for be members of the Widows’/Widowers’ and Orphans Pension Scheme. The Bank does not contribute to the Fund while Bank’s employees monthly contribute 5% of their basic salary, to the Fund.
2.5.6.2 Gratuity
With the establishment of Staff Pension Scheme II, employees who joined the Bank on or after 1st October 1995 become members of the Pension Scheme II, thus they are not entitle to the rights and privileges under Service Gratuity Scheme. However, a minimum period of 120 months uninterrupted active service in the Bank at the time of retirement is required to be eligible
for any retirement benefit under this pension scheme. Therefore, employees who retire before 10 years of service and whose services are terminated after five years other than by retirement are eligible to receive a terminal gratuity under the Payment of Gratuity Act No. 12 of 1983, at the rate of half of the gross salary applicable to the last month of the financial year, for each year of continuous service.
Probability of occurrence of such event is rare according to management’s judgment and past experiences. A gratuity provision is not maintained in the Financial Statements unless a significant liability is estimated at reporting date. Where a gratuity is paid to an employee in such event under Payment of Gratuity Act No. 12 of 1983, it is recognised as a gratuity expense in the Income Statement in the same year.
2.5.6.3 Post-employment medical benefits
The Bank has a contributory medical assistance scheme for the retired employees. The assets of the plan are held independently of the Bank’s assets and administered by Boards of Trustees, representing the management and the employees, as provided in the trust deed of the fund.
The Bank contributes to the contributory medical scheme an amount determined by the Management of the Bank based on actuarial recommendation made from time to time. Accordingly, a sum of Rs. 187.4 Mn. has been provided from the profit of 2019.
Details of Post-employment medical benefits are given in Note 38. (a) 3. on page 378.
2.5.6.4 Defined contribution plans
Details of Defined contribution plans are given in Note 11 on page 330.
2.5.7 Other liabilities
Details of other liabilities are given in Note 41 on page 383.
2.5.8 Provisions
Provisions are recognised when the Group has a present obligation (legal or constructive) as a result of a past event, and it is probable that an outflow of resources embodying economic benefits will be required to settle the obligation and a reliable estimate can be made of the amount of the obligation. The expenses relating to any provision is presented in the Income Statement net of any reimbursement.
2.5.8.1 Provision for Fraudulent Withdrawals
The total value of fraudulent withdrawals identified as at 31 December 2019 was Rs. 112.6 Mn. A provision of Rs. 105.8 Mn. already exists in the account.
2.5.9 Contingent liabilities and commitments
This includes Bank guarantees, Letter of credit, undrawn credit facilities, other indirect credit facilities and capital commitment. The Bank guarantees are contracts that require the Group to make specified payments to reimburse the holder for a loss that it incurs because a specified debtor fails to make payment when it is due in accordance with the terms of a debt instrument. Undrawn loan commitments and Letters of Credits are commitments under which, over the duration of the commitment, the Bank is required to provide a loan with pre-specified terms to the customer.
Effective from 1 January 2018, these contracts are subject to the assessment of impairment under SLFRS 09.
Details of contingent liabilities and Commitments are given in Note 48 on pages 387 to 388.
2.5.10 Earnings Per Share (EPS)
Details of “Basic and Diluted EPS” are given in Note 14 on pages 334.

Governance Financial Reports Supplementary Information
322 National Savings Bank │ Annual Report 2019 Notes to the Financial Statements
2.6 Significant accounting policies – Recognition of income and expenses for financial instruments
Revenue is recognised to the extent that it is probable that the economic benefits will flow to the Bank and the revenue can be reliably measured. Details of “income and expenses” are given in Notes 3 to 13 on pages 323 to 333.
2.6.1 Interest income and expenses
Details of “interest income and expenses” are given in Note 3 to 4 on page 323 to 325.
2.6.2 Fee and commission income
Details of “Commission income and expenses” are given in Note 5 on page 325.
2.6.3 Net trading income
Details of “Net gains/(losses) from trading” are given in Note 6 on page 327.
2.6.4 Dividend income
Dividend income is recognised when the right to receive income is established. Usually, this is the ex-dividend date for quoted equity securities. Details of “Dividend income” is given in Note 9 on page 328.
2.6.5 Rent income
Rent income is recognised in profit or loss on an accrual basis. Details of “Rent income” is given in Note 9 on page 328.
2.7 Significant accounting policies – Taxation
2.7.1 Current taxation
Details of current taxation are given in Note 13 on page 332.
2.7.2 Deferred taxation
Details of deferred taxation are given in Notes 13 and 30 on pages 332 and 366 respectively.
2.7.3 Value Added Tax on Financial Services (VAT)
VAT on financial services is calculated in accordance with Section 25A of Value Added Tax Act No. 14 of 2002 and subsequent amendments thereto.VAT on financial services is payable at 15% on operating profit before value added tax and nation building tax on financial services adjusted for emoluments of employees and economic depreciation.
2.7.4 Nation Building Tax on Financial Services (NBT)
NBT on financial services is calculated in accordance with Nation Building Tax (Amendment) Act No. 10 of 2014. NBT on financial services is payable at 2% on same base subjected to value added tax on financial services. Effective from 1 December 2019 NBT was abolished by the Government.
2.7.5 Debt Repayment Levy on Financial Services (DRL)
The New Finance Act No. 35 of 2018 has imposed a new tax termed the “Debt Repayment Levy” (DRL) which is a temporary levy (From 1 October 2018 to 31 December 2021) charged on banks and Financial Institution's as indicated in the Budget 2018. DRL on financial services is payable at 7% on same base subjected to value added tax on financial services. Effective from 1 January 2020 DRL was abolished by the Government.
2.7.6 Economic Service Charge (ESC)
As per the provisions of the Economic Service Charge (ESC) Act No. 13 of 2006 and subsequent amendments there to, ESC is payable on liable gross turn over of the Bank at 0.5% and is deductible from the income tax payments. Unclaimed ESC can be carried forward and set off against the income tax payable in the two subsequent years. As approved by the cabinet and instructed by the ministry of Finance, ESC has been abolished with effect from 1 January 2020.
2.8 Statement of Cash Flows
The Statement of Cash Flows has been prepared by using the “Direct Method” of preparing cash flows in accordance with the LKAS 7. Cash and cash equivalents comprise short term, highly liquid investment that is readily convertible to known amounts of cash and are subject to an insignificant risk of changes in value. The cash and cash equivalents include cash in hand, balances with banks and money at call and short notice. The Statement of Cash Flows is given on page 304.
2.9 Regulatory Provisions2.9.1 Deposit insurance scheme
The Bank calculates the insurance premium on eligible deposit base at the rate of 0.10% which is the applicable statutory rate based on capital adequacy ratio of the Bank. The Bank has remitted the applicable premium within a period of 15 days from the end of each quarter as stipulated by the Direction.
2.9.2 Crop Insurance Levy (CIL)
As per the provisions of the section 14 of the Finance Act No. 12 of 2013, the CIL was introduced with effect from 1st April 2013 and is payable to the National Insurance Trust Fund. Currently, the CIL is payable at 1% of the profit after tax.
2.10 Events after the reporting period
Details of Events after reporting date are given in Note 52 on page 395.
2.11 Accounting standards issued but not yet effective as at reporting date
Any SLFRSs that have impact to bank and the Group did not published by the Institute of Chartered Accountants of Sri Lanka as at the reporting period.

Governance Financial Reports Supplementary Information
323Annual Report 2019 │ National Savings BankNotes to the Financial Statements
3. Gross income
Accounting policy
Gross revenue is recognised to the extent that it is probable that the economic benefits will flow to the Group and the revenue can be reliably measured. The specific recognition criteria must also be met before revenue recognition is discussed under respective income notes.
Bank Group
For the year ended 31 December 2019Rs. ’000
2018Rs. ’000
2019Rs. ’000
2018Rs. ’000
Interest income 118,729,784 110,506,931 120,351,774 111,718,948Fee and commission income 1,261,268 1,005,262 1,269,521 1,008,482Net gain/(loss) from trading 1,491,610 (707,433) 1,963,229 (1,062,421)Net fair value gains/(losses) from financial instruments at fair value through profit or loss – – – –Net gains/(losses) from derecognition of financial assets 22,021 6,906 22,021 6,906Net other operating income 424,376 1,090,412 2,203,626 1,088,539
Gross income 121,929,059 111,902,078 125,810,171 112,760,454
4. Net interest income
Accounting policy
Recognition of interest income and interest expensesFor all financial instruments measured at amortised cost, interest-bearing financial assets classified as fair value through other comprehensive income and financial instruments measured at fair value through profit or loss, interest income or expense is recorded using the EIR, which is the rate that exactly discounts estimated future cash payments or receipts through the expected life of the financial instrument or a shorter period, where appropriate, to the net carrying amount of the financial asset or financial liability. The calculation takes into account all contractual terms of the financial instrument (for example, prepayment options) and includes any fees or incremental costs that are directly attributable to the instrument and are an integral part of the EIR, but not future credit losses.
The carrying amount of the financial asset or financial liability is adjusted if the Group revises its estimates of payments or receipts. The adjusted carrying amount is calculated based on the original EIR and the change in carrying amount is recorded as interest income for financial assets and interest expense for financial liabilities. However, for a reclassified financial asset for which the Bank subsequently increases its estimates of future cash receipts as a result of increased recoverability of those cash receipts, the effect of that increase are recognised as an adjustment to the EIR from the date of the change in estimate.
When calculating the EIR for financial instruments other than credit-impaired assets, the Bank estimates future cash flows considering all contractual terms of the financial instrument, but not expected credit losses (ECLs). For credit-impaired financial assets which are classified under Stage 3, a credit-adjusted EIR is calculated using estimated future cash flows including ECLs. The credit-adjusted EIR is the interest rate that, at original recognition, discounts the estimated future cash flows (including credit losses) to the amortised cost.
Once the recorded value of a financial asset or a group of similar financial assets has been reduced due to an impairment loss, interest income continues to be recognised using the rate of interest used to discount the future cash flows for the purpose of measuring the impairment loss.

Governance Financial Reports Supplementary Information
324 National Savings Bank │ Annual Report 2019 Notes to the Financial Statements
4. Net interest income (contd.)
Bank Group
For the year ended 31 December 2019Rs. ’000
2018Rs. ’000
2019Rs. ’000
2018Rs. ’000
4. (a) Interest income Cash and cash equivalents 39,263 27,501 39,263 27,501Balances with central banks – – –Placements with banks 1,416,393 1,867,470 1,530,935 1,867,470Derivative financial instruments – – – –Financial assets recognised through profit or loss– Measured at fair value 1,051,706 814,915 1,908,594 1,489,010– Designated at fair value – – – –Financial assets at amortised cost– Loans and advances 58,097,923 49,905,753 58,186,998 49,866,308– Debt and other instruments 58,021,604 57,733,319 58,477,881 58,150,208Financial assets measured at fair value through other comprehensive income 102,895 157,972 208,103 318,450
Total interest income 118,729,784 110,506,931 120,351,774 111,718,948
4. (b) Interest expensesDue to banks 4,482,281 5,305,589 4,655,295 5,544,866Financial liabilities recognised through profit or loss – – – –Financial liabilities at amortised cost– Due to depositors 75,966,478 68,955,361 75,936,502 68,955,361– Due to debt securities holders – – – –– Due to other borrowers 6,382,353 927,510 7,204,295 1,526,227Debt securities issued 3,066,658 10,433,816 3,072,047 10,433,816
Total interest expenses 89,897,770 85,622,275 90,868,139 86,460,269
Net interest income 28,832,014 24,884,656 29,483,635 25,258,679
Interest income Vs Interest expenseRs. Mn. %
20192017 2018
Interest income (LHS)
Interest expenses (LHS) NIM (RHS)
125,000
100,000
75,000
50,000
25,000
0
3.0
2.8
2.6
2.4
2.2
0

Governance Financial Reports Supplementary Information
325Annual Report 2019 │ National Savings BankNotes to the Financial Statements
4. Net interest income (contd.) 4. (c) Net interest income from Sri Lanka Government Securities
Bank Group
For the year ended 31 December 2019Rs. ’000
2018Rs. ’000
2019Rs. ’000
2018Rs. ’000
Interest income 57,620,467 57,237,192 59,038,290 58,460,191Less: Interest expenses – – – –
Net interest income from Sri Lanka Government Securities 57,620,467 57,237,192 59,038,290 58,460,191
4. (d) Notional tax credit for withholding tax on Government Securities on secondary market transactions
In accordance with the Section 137 of the Inland Revenue Act No. 10 of 2006 and amendment thereto, the Group is entitled to a notional tax credit equivalent to 1/9th of the interest income derived from the market transaction in Government Securities up to 31 March 2018. From 1 April 2018 onward, Group is not entitled to get notional tax credit based on the provision of Inland Revenue Act No. 24 of 2017.
Accordingly, the net income earned by the Group from the secondary market transactions for 2019 in Government Securities, has not been grossed up in the Financial Statements and It had been grossed up in the Financial Statement up to 31 March 2018 which the resulting notional tax credit amounted to Rs. 1,235 Mn. (2018) for the Bank and Rs. 1,243.5 Mn. (2018) for the Group.
4. (e) Notional tax receivable
The notional tax receivable is given in Note 31 on page 366 to the Financial Statements after deducting the recoverable amounts.
5. Net fee and commission income
Accounting policy
The Group earns fee and commission income from range of services it provides to customers which can be divided into the following two categories.
(a) Fee and commission income earned from services that are provided over a certain period of time: Fee and commission earned for the provision of services over a period of time are accrued over that period.
(b) Fee and commission income from providing transaction services:
Fee and commission income arising from renegotiating or participating in the negotiation of a transaction for a third party are recognised on completion of the underlying transaction. Fees or components of fees that are linked to a certain performance are recognised as the related services are performed.
Fees and commission expenses relating to transaction and service are expensed as the services are received. Fee and commission expenses are recognised on an accrual basis.

Governance Financial Reports Supplementary Information
326 National Savings Bank │ Annual Report 2019 Notes to the Financial Statements
5. Net fee and commission income (contd.)
Bank Group
For the year ended 31 December 2019Rs. ’000
2018Rs. ’000
2019Rs. ’000
2018Rs. ’000
Fee and commission income 1,261,268 1,005,262 1,269,521 1,008,482Fee and commission expenses (131,954) (141,196) (136,838) (144,685)
Net fee and commission income 1,129,314 864,066 1,132,683 863,797
ComprisingLoans 1,070,717 849,434 1,071,091 849,434Cards (10,320) (53,299) (10,320) (53,299)Trade and remittances – – – –Investment banking 19,672 17,640 19,673 17,640Deposits 26,743 24,999 26,752 24,999Guarantees 8,778 9,302 8,778 9,302Others 13,724 15,990 16,709 15,720
Net fee and commission income 1,129,314 864,066 1,132,683 863,797
Fee and commission income Vs Fee and commission expense Rs. Mn.
20192017 2018
Fee and commission income
Fee and commission expenses
1,500
1,200
900
600
300
0

Governance Financial Reports Supplementary Information
327Annual Report 2019 │ National Savings BankNotes to the Financial Statements
6. Net gain/(loss) from trading
Accounting policy
Net trading income includes all gains and losses and related dividend for “financial assets recognised through profit or loss” other than interest income and include income from foreign exchange.
Dividend income is recognised when the Group’s right to receive the payment is established.
Bank Group
For the year ended 31 December 2019Rs. ’000
2018Rs. ’000
2019Rs. ’000
2018Rs. ’000
Foreign exchangeFrom banks – – – –From other customers 140,567 171,015 140,567 171,015
Fixed income securities 1,178,660 (591,815) 1,650,279 (946,802)Equity securities 156,797 (309,451) 156,797 (309,451)Derivative financial instruments 15,586 22,817 15,586 22,817
Total 1,491,610 (707,433) 1,963,229 (1,062,421)
7. Net fair value gains/(losses) from financial instruments at fair value through profit or loss
Accounting policy
Net fair value gains/(losses) includes all unrealised gains and losses from changes in fair value of “financial assets and financial liabilities recognised through profit or loss”.
Bank Group
For the year ended 31 December 2019Rs. ’000
2018Rs. ’000
2019Rs. ’000
2018Rs. ’000
Gains on financial assets at fair value through profit or loss – – – –Losses on financial assets at fair value through profit or loss – – – –Gains on financial liabilities at fair value through profit or loss – – – –Losses on financial liabilities at fair value through profit or loss – – – –
Total – – – –

Governance Financial Reports Supplementary Information
328 National Savings Bank │ Annual Report 2019 Notes to the Financial Statements
8. Net gains/(losses) from derecognition of financial assets
Accounting policy
“Net gains/(losses) from derecognition of financial assets” comprise gains less losses related to financial assets measured at fair value through other comprehensive income and derecognised asset at amortised cost.
Bank Group
For the year ended 31 December 2019Rs. ’000
2018Rs. ’000
2019Rs. ’000
2018Rs. ’000
Recognised at:Fair value through profit or loss – – – –Amortised cost – – – –Fair value through other comprehensive income 22,021 6,906 22,021 6,906
Total 22,021 6,906 22,021 6,906
9. Net other operating income
Accounting policy
i. Gain/(Loss) on disposal of property, plant and equipmentThe gains or losses on the disposal of property, plant and equipment is determined on the difference between the carrying amount of the assets at the time of disposal and the proceeds of disposal, net of disposal costs. This is recognised in other operating income in the year in which significant risks and rewards of ownership are transferred to the buyer.
ii. Foreign exchange gain/(loss)Foreign currency positions are revalued at each reporting date. Gains and losses arising from changes in exchange rates are included in Income Statement in the period in which they arise.
iii. Dividend incomeDividend earned from financial assets measured at fair value through other comprehensive income is recognised when the Group’s right to receive the payment is established.
Bank Group
For the year ended 31 December 2019Rs. ’000
2018Rs. ’000
2019Rs. ’000
2018Rs. ’000
Gain/(Loss) on investment properties – – – –Gain/(Loss) on sale of property, plant and equipment 11,432 (25,884) 11,436 (25,884)Gain/(Loss) on revaluation of foreign exchange 77,838 843,326 77,838 843,326Recovery of loans written off – – – –Less: Loans written off – – – –Dividend income 218,717 162,601 218,717 162,601Rent income 15,842 15,738 14,143 13,864Other income 100,547 94,631 232,002 94,632Gain from Bargain purchase* – – 1,649,490 –
Total 424,376 1,090,412 2,203,626 1,088,539
*Bank has paid Rs. 3,111 Mn. to acquire 100% ownership of Sri Lanka Savings Bank (SLSB) on 11 October 2019. Net asset of the SLSB as at acquired date was Rs. 4,760.49 Mn. and NSB has recognised difference as gain from bargain purchased.

Governance Financial Reports Supplementary Information
329Annual Report 2019 │ National Savings BankNotes to the Financial Statements
10. Impairment charges
Accounting policy
The Group recognise the changes in the impairment provisions for all financial instruments, which are assessed as per Sri Lanka Financial Reporting Standard – SLFRS 9 on “Financial Instruments”. The measurement of impairment losses under SLFRS 9 across all categories of financial assets requires judgement, in particular, the estimation of the amount and timing of future cash flows and collateral values when determining impairment losses and the assessment of a significant increase in credit risk. These estimates are driven by a number of factors, changes in which can result in different levels of allowances. The Bank’s ECL calculations are outputs of complex models with a number of underlying assumptions regarding the choice of variable inputs and their interdependencies. The methodology adopted for impairment is explained in Note 21 (d) to the Financial Statements.
Bank Group
For the year ended 31 December 2019Rs. ’000
2018Rs. ’000
2019Rs. ’000
2018Rs. ’000
Impairment charge (Note 10.1) 549,912 851,462 575,076 851,407Write-off/waive off 15,624 19,587 15,624 19,587
Total 565,536 871,049 590,700 870,994
10.1 Impairment charge
Bank Group
For the year ended 31 December 2019Rs. ’000
2018Rs. ’000
2019Rs. ’000
2018Rs. ’000
Cash and cash equivalentsStage 1 563 130 567 130
Placement with banksStage 1 (1,035) 2,191 (275) 2,191
Financial assets at amortised cost – loans and advances [Note 21 (d)] Stage 1 (9,458) 483,565 11,876 483,565 Stage 2 (1,347) 143,916 (1,476) 143,916 Stage 3 431,437 484,055 434,631 484,055
Financial assets at amortised cost – debt instruments [Note 22 (b)] Stage 1 (471) (262,395) (470) (262,450) Stage 2 5,852 – 5,852 – Stage 3 – – – –Financial assets measured at fair value through other comprehensive income [Note 23 (b)] – – – –Contingent liabilities and commitments (Note 48) – – – –Investment in subsidiaries [Note 24 (a)] – – – –Investments in associates and joint ventures (Note 25) – – – –Property, plant and equipment (Note 26) – – – –Investment properties (Note 27) – – – –Others (Note 31.1) 124,372 – 124,372 –
Total 549,912 851,462 575,076 851,407

Governance Financial Reports Supplementary Information
330 National Savings Bank │ Annual Report 2019 Notes to the Financial Statements
11. Personnel expenses
Accounting policy
i Defined contribution plansThe Group operates a defined contribution plan. The contribution payable to a defined contribution plan is in proportion to the services rendered to the Group by the employees and is recorded as an expense under “Personnel expenses”. Unpaid contributions are recorded as a liability. The Group contributes to the following defined contribution plans:
(a) Employees’ Provident Fund
The Bank and employees contribute 12% and 8% respectively of the employee’s monthly gross salary (excluding overtime) to the Provident Fund. The Bank’s Provident Fund is an approved fund under the Employees’ Provident Fund Act. The Bank guarantees 8% p.a. return to the members of the Employees’ Provident Fund.
Subsidiary Companies and its employees contribute 12% and 8% respectively to the Employees Provident Fund (EPF) maintained by Central Bank of Sri Lanka.
(b) Employees’ Trust Fund
The Group contributes 3% of the employee’s monthly gross salary (excluding overtime) to the Employees’ Trust Fund maintained by the Employees Trust Fund Board.
ii Defined benefit plansContribution to defined benefit plans are recognised in the Income Statement based on an independent actuarial valuation carried out separately for each defined benefit plan in accordance with Sri Lanka Accounting Standard LKAS – 19 on “Employee Benefits”.
Bank Group
For the year ended 31 December 2019Rs. ’000
2018Rs. ’000
2019Rs. ’000
2018Rs. ’000
Salary and bonus 8,274,021 7,493,963 8,317,516 7,525,513Contributions to defined contribution/benefit plans 736,058 682,797 746,725 684,250Provision for defined benefit obligations (Note 38) 851,466 826,392 855,599 826,743Share based expenses – – – –Others 296,381 259,553 298,138 266,043
Total 10,157,926 9,262,705 10,217,978 9,302,548
11. (a) Contribution – Staff pension fund – I
Bank Group
For the year ended 31 December 2019Rs. ’000
2018Rs. ’000
2019Rs. ’000
2018Rs. ’000
Amount recognised as expense 400,483 522,936 400,483 522,936
The latest actuarial valuation was carried out as of 31 December 2019, by Mr M Poopalanathan, AIA, of Messrs Actuarial & Management Consultants (Pvt) Ltd., a firm of professional Actuaries. (Refer Note 38. (a) 1 on page 373)

Governance Financial Reports Supplementary Information
331Annual Report 2019 │ National Savings BankNotes to the Financial Statements
11. Personnel expenses (contd.)11. (b) Contribution – Staff pension fund – II
Bank Group
For the year ended 31 December 2019Rs. ’000
2018Rs. ’000
2019Rs. ’000
2018Rs. ’000
Amount recognised as expense 263,549 167,786 264,257 167,786
Pension scheme II has been established for the employees who joined the Bank on or after 1 October 1995. Actuarial valuation was carried out by Mr M Poopalanathan, AIA, of Messrs Actuarial & Management Consultants (Pvt) Ltd., a firm of professional Actuaries, on 31 December 2019. (Refer Note 38. (a) 2 on page 376)
11. (c) Contribution – Retired staff medical scheme
Bank Group
For the year ended 31 December 2019Rs. ’000
2018Rs. ’000
2019Rs. ’000
2018Rs. ’000
Amount recognised as expense 187,434 135,670 187,434 135,670
Retired staff medical scheme has been established for the all employees of the Bank. Actuarial valuation was carried out by Mr M Poopalanathan, AIA, of Messrs Actuarial & Management Consultants (Pvt) Ltd., a firm of professional Actuaries, on 31 December 2019. (Refer Note 38. (a) 3 on page 378)
11. (d) Contribution – Gratuity
Bank Group
For the year ended 31 December 2019Rs. ’000
2018Rs. ’000
2019Rs. ’000
2018Rs. ’000
Amount recognised as expense – – 3,425 351
The staff members of the subsidiary companies are not entitled for pension scheme and hence they are eligible to continue as the members of Gratuity plan as per the provision of Gratuity. Act No. 12 of 1983.
Total provision for defined benefit obligations
Bank Group
For the year ended 31 December 2019Rs. ’000
2018Rs. ’000
2019Rs. ’000
2018Rs. ’000
Total provision for defined benefit obligations 851,466 826,392 855,599 826,743
The staff members of the subsidiary companies are not entitled for pension scheme and hence they are continue to the members of Gratuity plan as per the provision of Gratuity Act No. 12 of 1983. (Refer Note 38. (a) 4 on page 381)

Governance Financial Reports Supplementary Information
332 National Savings Bank │ Annual Report 2019 Notes to the Financial Statements
12. Other expenses
Accounting policy
Other operating expenses are recognised in the Statement of Profit or Loss on the basis of a direct association between the cost incurred and the earning of specific items of income. All expenditure incurred in the running of the business and maintaining the property, plant and equipment in a state of efficiency has been charged to the Statement of Profit or Loss in arriving at the profit of the year. Provisions in respect of other expenses are recognised when the Group has a present obligation (legal or constructive) as a result of a past event, it is probable that an outflow of resources embodying economic benefits will be required to settle the obligation and a reliable estimate can be made of the amount of the obligation. Expenses of depreciation and amortisation of property plant and equipment and intangible assets are separated from other expenses and disclosed in the face of income statement.
Bank Group
For the year ended 31 December 2019Rs. ’000
2018Rs. ’000
2019Rs. ’000
2018Rs. ’000
Directors’ emoluments 1,086 1,890 2,206 2,895Auditors’ remunerations 3,840 4,087 8,177 4,677Non-audit fees to auditors – – – –Professional and legal expenses 34,663 21,369 34,663 21,369Operating lease expenses – – – –Special fees paid to Treasury 320,000 320,000 320,000 320,000Office administration and establishment expenses 3,484,954 3,267,647 3,496,756 3,272,909Others 629,510 579,986 599,654 538,931
Total 4,474,053 4,194,979 4,461,457 4,160,782
13. Tax expenses
Accounting policy
As per Sri Lanka Accounting Standard – LKAS 12 on “Income Taxes”, tax expense is the aggregate amount included in determination of profit or loss for the period in respect of current and deferred taxes. Income tax expense is recognised in Income Statement, except to the extent it relates to items recognised directly in Equity or Other Comprehensive Income (OCI).
Current taxationCurrent tax assets and liabilities consist of amounts expected to be recovered from or paid to the Commissioner General of Inland Revenue in respect of the current as well as prior years. The tax rates and tax laws used to compute the amount are those that are enacted or subsequently enacted at the reporting date. Accordingly, provision for taxation is made on the basis of the accounting profit for the year as adjusted for taxation purpose in accordance with the provision of the Inland Revenue Act No. 24 of 2017 and the amendment thereto, at the rates specified in Note 13. (a).
Deferred taxationDeferred tax is provided using the liability method on temporary differences at the reporting date between the tax bases of assets and liabilities and their carrying amounts for financial reporting purpose.
Deferred tax assets are recognised for all deductible temporary differences, carry forward of unused tax credits and unused tax losses, to the extent that it is probable that taxable profits will be available against which they can be used.

Governance Financial Reports Supplementary Information
333Annual Report 2019 │ National Savings BankNotes to the Financial Statements
The carrying amount of a deferred tax asset is reviewed at each reporting date and reduced to the extent it is no longer probable that sufficient taxable profit will be available to allow all or part of the deferred tax asset to be utilised. Unrecognised deferred tax asset are reassessed at each reporting date and are recognise to the extent that is probable that future taxable profit will allow the deferred tax asset to be recovered.
Deferred tax assets and liabilities are measured at the tax rate that are expected to apply in the year when the assets are realised or the liabilities are settled, based on tax rates and tax laws that have been enacted or subsequently enacted at the reporting date.
Bank Group
For the year ended 31 December 2019Rs. ’000
2018Rs. ’000
2019Rs. ’000
2018Rs. ’000
Current tax expensesCurrent year 3,798,619 3,359,383 4,096,283 3,362,374Prior year’s (over)/under provision – 6,430 – 6,430
Deferred tax expensesEffect of change in tax rates – – – –Temporary differences [refer Note 13 (b)] (35,213) 75,400 (34,714) 75,252Prior year’s provision – – – –
Total 3,763,405 3,441,213 4,061,569 3,444,056
Effective tax rate (%) 35.97 43.33 31.02 43.35Effective tax rate (excluding deferred tax) (%) 36.31 42.38 31.29 42.41
13. (a) Reconciliation of tax expenses
Bank Group
For the year ended 31 December 2019Rs. ’000
2018Rs. ’000
2019Rs. ’000
2018Rs. ’000
Profit before tax 10,461,638 7,941,364 13,091,541 7,944,243Income tax for the period (Accounting profit @ 28%) 2,929,259 2,223,582 3,665,632 2,224,388
Adjustment in respect of current income tax of prior periodsAdd: Tax effect of expenses that are not deductible for tax purposes 2,003,368 1,884,775 2,065,735 1,888,211(Less): Tax effect of expenses that are deductible for tax purposes 1,134,008 748,974 1,635,083 750,225
Tax expense for the period 3,798,619 3,359,383 4,096,283 3,362,374
13. (b) The deferred tax (credit)/charge in the Income Statement comprises the following:
Bank Group
For the year ended 31 December 2019Rs. ’000
2018Rs. ’000
2019Rs. ’000
2018Rs. ’000
Deferred tax assets – – (265) (148)Deferred tax liabilities (35,213) 75,400 (34,449) 75,400
Deferred tax (credit)/charge to Income Statement (35,213) 75,400 (34,714) 75,252
*Bank apply income tax rate 24% for deferred tax calculation as Government's propose to change tax rate from 28% to 24% for the 2020 Y/A.
13. Tax expenses (contd.)

Governance Financial Reports Supplementary Information
334 National Savings Bank │ Annual Report 2019 Notes to the Financial Statements
14. Earnings per share
Accounting policy
The Group presents basic and diluted earnings per share (EPS) data for its ordinary shares. Basic EPS is calculated by dividing the profit or loss for the year attributable to ordinary shareholders of the Bank by the weighted average number of ordinary shares outstanding during the year. Diluted EPS is determined by adjusting the profit or loss attributable to the ordinary shareholders and the weighted average number of ordinary shares outstanding for the effects of all dilutive potential ordinary shares, if any.
Bank Group
For the year ended 31 December 2019Rs. ’000
2018Rs. ’000
2019Rs. ’000
2018Rs. ’000
Net profit attributable to ordinary equity holders 6,698,233 4,500,151 9,029,972 4,500,187Net profit attributable to ordinary equity holders adjusted for the effect of dilution 6,698,233 4,500,151 9,029,972 4,500,187Weighted average number of ordinary shares for basic earnings per share 940,000 670,000 940,000 670,000Effect of dilution – – – –Weighted average number of ordinary shares adjusted for the effect of dilution 940,000 670,000 940,000 670,000
Basic earnings per ordinary share 7.13 6.72 9.61 6.72
Diluted earnings per ordinary share 7.13 6.72 9.61 6.72
14. (a) Weighted average number of ordinary shares for basic and diluted earnings per share
Outstanding number of shares Weight average number of shares
2019Rs. ’000
2018Rs. ’000
2019Rs. ’000
2018Rs. ’000
Number of shares in issue as at 1 January 940,000 670,000 940,000 670,000Add: Number of shares issued during the year – 270,000 – –
Number of ordinary shares basic and diluted earnings per share 940,000 940,000 940,000 670,000

Governance Financial Reports Supplementary Information
335Annual Report 2019 │ National Savings BankNotes to the Financial Statements
15. Analysis of financial instruments by measurement basis
Accounting policy
The carrying amounts of financial instruments by category as defined in Sri Lanka Financial Reporting Standard – SLFRS 9 on “Financial Instruments” under headings of the Statement of Financial Position are summarised below:
15. (a) Bank – 2019
NoteAC
Rs. ’000FVPL
Rs. ’000FVOCI
Rs. ’000Total
Rs. ’000
AssetsCash and cash equivalents 16 5,376,715 – – 5,376,715Balances with central banks 17 – – – –Placements with banks 18 12,364,469 – – 12,364,469Derivative financial instruments 19 – 11,622 – 11,622Loans and advances 21 454,394,957 – – 454,394,957Debt instruments 20, 22 & 23 615,634,321 9,677,545 – 625,311,866Equity instruments 20 & 23 – 1,782,337 3,478,811 5,261,148
Total financial assets 1,087,770,463 11,471,504 3,478,811 1,102,720,778
NoteAC
Rs. ’000FVPL
Rs. ’000Total
Rs. ’000
LiabilitiesDue to banks 32 35,045,251 – 35,045,251Derivative financial instruments 33 – – –Financial liabilities– Due to depositors 35 1,016,574,286 – 1,016,574,286– Due to debt securities holders 35 – – –– Due to other borrowers 35 21,203,242 – 21,203,242Debt securities issued 37 26,691,711 – 26,691,711
Total financial liabilities 1,099,514,490 – 1,099,514,490
AC – Financial assets/liabilities measured at amortised cost
FVPL – Financial assets/liabilities measured at fair value through profit or loss
FVOCI – Financial assets measured at fair value through other comprehensive income

Governance Financial Reports Supplementary Information
336 National Savings Bank │ Annual Report 2019 Notes to the Financial Statements
15. Analysis of financial instruments by measurement basis (contd.)15. (b) Bank – 2018
NoteAC
Rs. ’000FVPL
Rs. ’000FVOCI
Rs. ’000Total
Rs. ’000
AssetsCash and cash equivalents 16 3,434,524 – – 3,434,524 Balances with central banks 17 – – – – Placements with banks 18 17,588,445 – – 17,588,445 Derivative financial instruments 19 – – 4,740,106 4,740,106 Loans and advances 21 422,894,740 – – 422,894,740 Debt instruments 20, 22 & 23 518,947,969 14,801,463 2,433,915 536,183,347 Equity instruments 20 & 23 – 1,878,919 3,750,515 5,629,434
Total financial assets 962,865,678 16,680,382 10,924,536 990,470,596
NoteAC
Rs. ’000FVPL
Rs. ’000Total
Rs. ’000
LiabilitiesDue to banks 32 77,119,146 – 77,119,146Derivative financial instruments 33 – 1,533 1,533Financial liabilities– Due to depositors 35 839,574,411 – 839,574,411– Due to debt securities holders 35 – – –– Due to other borrowers 35 14,804,802 – 14,804,802Debt securities issued 37 52,389,133 – 52,389,133
Total financial liabilities 983,887,492 1,533 983,889,025
15. (c) Group – 2019
NoteAC
Rs. ’000FVPL
Rs. ’000FVOCI
Rs. ’000Total
Rs. ’000
AssetsCash and cash equivalents 16 5,564,824 – – 5,564,824Balances with central banks 17 58 – – 58Placements with banks 18 15,745,184 – – 15,745,184Derivative financial instruments 19 – 11,622 – 11,622Loans and advances 21 456,636,285 – – 456,636,285Debt instruments 20, 22 & 23 619,567,786 20,347,936 1,009,706 640,925,428Equity instruments 20 & 23 – 1,782,337 3,616,876 5,399,213
Total financial assets 1,097,514,137 22,141,895 4,626,582 1,124,282,615

Governance Financial Reports Supplementary Information
337Annual Report 2019 │ National Savings BankNotes to the Financial Statements
15. Analysis of financial instruments by measurement basis (contd.)15. (c) Group – 2019 (contd.)
NoteAC
Rs. ’000FVPL
Rs. ’000Total
Rs. ’000
LiabilitiesDue to banks 32 36,139,122 – 36,139,122Derivative financial instruments 33 – – –Financial liabilities– Due to depositors 35 1,015,635,421 – 1,015,635,421– Due to debt securities holders 35 – – –– Due to other borrowers 35 32,808,023 – 32,808,023Debt securities issued 37 26,955,697 – 26,955,697
Total financial liabilities 1,111,538,263 – 1,111,538,263
15. (d) Group – 2018
NoteAC
Rs. ’000FVPL
Rs. ’000FVOCI
Rs. ’000Total
Rs. ’000
AssetsCash and cash equivalents 16 3,436,929 – – 3,436,929Balances with central banks 17 177 – – 177Placements with banks 18 17,588,445 – – 17,588,445Derivative financial instruments 19 – – 4,740,106 4,740,106Loans and advances 21 422,919,713 – – 422,919,713Debt instruments 20, 22 & 23 522,973,159 24,988,614 4,037,045 551,998,818Equity instruments 20 & 23 – 1,878,919 3,751,515 5,630,434
Total financial assets 966,918,423 26,867,533 12,528,666 1,006,314,622
NoteAC
Rs. ’000FVPL
Rs. ’000Total
Rs. ’000
LiabilitiesDue to banks 32 83,615,264 – 83,615,264Derivative financial instruments 33 – 1,533 1,533Financial liabilities– Due to depositors 35 839,574,411 – 839,574,411– Due to debt securities holders 35 – – –– Due to other borrowers 35 21,750,178 – 21,750,178Debt securities issued 37 52,389,133 – 52,389,133
Total financial liabilities 997,328,986 1,533 997,330,519

Governance Financial Reports Supplementary Information
338 National Savings Bank │ Annual Report 2019 Notes to the Financial Statements
16. Cash and cash equivalents
Accounting policy
Cash and cash equivalents includes cash in hand, balances with banks, money at call and short notice that are subject to an insignificant risk of change in their value. Cash and cash equivalents are carried at amortised cost less impairment in the Statement of Financial Position. Balances with banks, and money at call and short notice are subject to the impairment as per SLFRS 9 on “Financial Instrument”.
Bank Group
As at 31 December 2019Rs. ’000
2018Rs. ’000
2019Rs. ’000
2018Rs. ’000
Cash in hand 941,102 699,401 947,240 699,411Balances with banks 4,436,403 2,735,350 4,618,378 2,737,745Money at call and short notice – – – –
Gross total 5,377,505 3,434,751 5,565,618 3,437,156Less: Impairment (790) (227) (794) (227)
Net Total 5,376,715 3,434,524 5,564,824 3,436,929
17. Balances with central banks
Bank Group
As at 31 December 2019Rs. ’000
2018Rs. ’000
2019Rs. ’000
2018Rs. ’000
Statutory balances with central banks
Central Bank of Sri Lanka – – 58 177
Total – – 58 177
18. Placements with banks
Accounting policy
Placement with banks include short-term deposits placed in banks that are subjected to insignificant risk of changes in fair value, and are used by the Bank and the Group in the management of its short-term commitments. They are recorded in the Financial Statements at their face values or the gross values less impairment, where appropriate. The Group has calculated impairment provision as per SLFRS 9 on “Financial Instrument” based on external rating of particular bank.

Governance Financial Reports Supplementary Information
339Annual Report 2019 │ National Savings BankNotes to the Financial Statements
18. Placements with banks (contd.)
Bank Group
As at 31 December 2019Rs. ’000
2018Rs. ’000
2019Rs. ’000
2018Rs. ’000
Placements with banks – Sri LankaBank of Ceylon 7,000,981 4,968,528 7,599,131 4,968,528People’s Bank 833,289 – 1,590,962 –Commercial Bank of Ceylon – 294,392 – 294,392National Development Bank 848,492 2,606,216 848,492 2,606,216Seylan Bank PLC 2,835,003 8,683,222 2,835,003 8,683,222Development Finance Corporation of Ceylon (DFCC) 371,445 633,275 371,445 633,275Union Bank of Colombo 477,245 405,834 477,245 405,834Regional Development Bank – – 802,595 –Housing Development Finance Corporation Bank – – 626,639 –State Mortgage & Investment Bank – – 597,565 –
Gross total 12,366,455 17,591,466 15,749,077 17,591,466
Less: Impairment (1,986) (3,021) (3,893) (3,021)
Net total 12,364,469 17,588,445 15,745,184 17,588,445
19. Derivative financial instruments
Accounting policy
Derivatives are financial instruments that derive their value in response to changes in interest rates, financial instrument prices, commodity prices, foreign exchange rates, credit risk and indices. Derivatives are categorised as “trading” unless they are designated as hedging instruments. The Group uses derivatives such as interest rate swaps and forward foreign exchange contracts.
Derivatives recorded at fair value through profit or lossDerivatives except for derivatives used as hedging instruments are recorded at fair value and carried as assets when their fair value is positive and as liabilities when their fair value is negative. Changes in the fair value of derivatives are included in “Net trading income”.
Derivatives used as hedge instrumentsThe Group entered into derivative contacts to hedge against the foreign exchange rate or interest rate. These derivatives are measured at fair value. The Group adopts hedge accounting mismatch to eliminate the accounting resulting from volatility in the Financial Statements between derivatives measured at fair value and the financial asset or liability (hedge exposure) measured at cost/amortised cost, if hedge is efficient.
Cash flow hedgeCash flow hedge is measured at fair value at the end of each reporting period.
If a hedge of the exposure to variability in cash flow, the effective portion of changes in the fair value of derivatives that are designated and qualify as cash flow hedges is recognised in Other Comprehensive Income within “cash flow hedge” – fair value gain/(loss). Any gain or losses in fair value relating to an ineffective portion is recognised immediately in the Income Statements.

Governance Financial Reports Supplementary Information
340 National Savings Bank │ Annual Report 2019 Notes to the Financial Statements
The accumulated gains and losses recognised in Other Comprehensive Income are reclassified to the Income Statement in the periods in which the hedged item will affect profit or loss. However, when the forecast transaction that is hedged result in the recognised of a non-financial assets or a non-financial liability, the gains and losses previously recognised in Other Comprehensive Income are removed from equity and included in the initial measurement of the cost of the asset or liability.
When a hedging instrument expires or is sold, or when a hedge no longer meet the criteria for hedge accounting, any cumulative gain or loss recognised in Other Comprehensive Income at that time remains in equity until the forecast transaction is eventually recognised in the Income Statement. When a forecast transaction is no longer expected to occur, the cumulative gain or loss that was recognised in Other Comprehensive Income is immediately reclassified to the Income Statement.
19.1 Derivative assetsBank and Group
As at 31 December Assets 2019
Rs. ’000
Notional amount – 2019
Rs. ’000
Assets 2018
Rs. ’000
Notional amount – 2018
Rs. ’000
Interest rate derivativesInterest rate swaps* [Note 19. 1] 11,622 2,000,000 – –
Foreign currency derivativesCurrency swaps [Note 19. 2 (b)] – – 4,740,106 45,551,031
Total 11,622 2,000,000 4,740,106 45,551,031
*Interest rate swap for 2018 is recorded as liability.
19.1 Swap agreement
Details Description of the hedge
Swap Instrument Counterparty – DFCC Bank
Notional amount – Rs. 2,000 Mn.
Swap Item 2000 Mn. Term Loan to Sri Lanka Telecom (SLT) by DFCC
The period when the cash flows are expected to occur Semi annual interest payment
Termination of agreement 20 February 2021
Base interest rate 6 months AWPLR (Average weighted prime lending rate)
19. Derivative financial instruments (contd.)

Governance Financial Reports Supplementary Information
341Annual Report 2019 │ National Savings BankNotes to the Financial Statements
19. Derivative financial instruments (contd.)19.2 Foreign currency SWAPs
The Bank has raised USD 750 Mn. on 18 September 2013 through foreign borrowings for a period of five years against which two swaps agreements have been entered into with the Central Bank of Sri Lanka for USD 183.425 Mn. and USD 187.5 Mn. with annual and monthly renewal basis respectively.
The Bank has also raised USD 250 Mn. on 10 September 2014 through foreign borrowings for a period of five years against which a swap agreement has been entered into with the Central Bank of Sri Lanka for USD 249.31 Mn. with monthly renewal basis.
The objective of the swaps is to hedge the risk of the foreign currency denominated above-mentioned borrowings (only the capital portion) attributable to changes in LKR/USD exchange rate.
A brief description of the swaps is given below:
19.2 (a) Swap agreement 1
Details Description of the hedge
Hedge instrument Swap contract – 1USD 183.425 Mn. agreement was expired on 12 September 2018
Hedge Item 5 years USD denominated Senior Note – USD 750 Mn. with interest payable semi annually Capital is fully paid on 18 September 2018.
The period when the cash flows are expected to occur Swap contract – 1Expired
The amount recognised in Other Comprehensive Income during the year
None
Fair value of hedged item as at 31 December 2019 None
Fair value of hedged instrument as at 31 December 2019 Swap contract – 1Nil
Any forecast transaction for which hedge accounting had previously been used but which is no longer expected to occur
None
The amount that was reclassified from equity to profit or loss during the year
None

Governance Financial Reports Supplementary Information
342 National Savings Bank │ Annual Report 2019 Notes to the Financial Statements
19. Derivative financial instruments (contd.)
19.2 Foreign currency SWAPs (contd.)19.2 (b) Swap agreements 3
Details Description of the hedge
Hedge instrument Swap ContractCounter party – Central Bank of Sri Lanka Notional amount – USD 249.31 Mn. 99.72% of the total foreign borrowings.
The Bank has renewed the above agreement with Central Bank on 25 January 2018 for a Notional amount of USD 249.31 Mn. at a premium.
Hedge item 5 years USD denominated Senior Note – USD 250 Mn. with interest payable semi annually. Capital is repayable on 10 September 2019 in full.
The period when the cash flows are expected to occur Swap Contract – 3 Expired
The amount recognised in Other Comprehensive Income during the year
None
Fair value of hedged item as at 31 December 2019 None
Fair value of hedged instrument as at 31 December 2019 None
Any forecast transaction for which hedge accounting had previously been used but which is no longer expected to occur
None
The amount that was reclassified from equity to profit or loss during the year
None
19.2 (c) Amount recognised in Other Comprehensive Income relating to the currency swaps
Bank Group
For the year ended 31 December 2019Rs. ’000
2018Rs. ’000
2019Rs. ’000
2018Rs. ’000
Swap agreement – 01 – (291,924) – (291,924)

Governance Financial Reports Supplementary Information
343Annual Report 2019 │ National Savings BankNotes to the Financial Statements
20. Financial assets recognised through profit or loss
Accounting policy
Financial assets are classified as financial assets recognised through profit or loss if they are acquired principally for the purpose of selling or repurchasing in the near term or holds as a part of a portfolio that is managed together for short-term profit or position taking and recorded to fair value. This category also includes derivative financial instruments entered into by the Group that are not designated as hedging instruments in hedge relationships. Financial asset shall be measured at fair value through profit or loss unless it is measured at amortised cost or fair value through other comprehensive income as per SLFRS 9 on “Financial Instruments”.
Financial assets recognised through profit or loss are recorded in the Statement of Financial Position at fair value. Changes in fair value are recognised in “Net gain/(loss) from trading” while interest income and expenses are recorded in “Net interest income” according to the terms of the contract, or when the right to the payment has been established. Dividend income and realised gain or losses are recorded in “Net gain/(loss) from trading”.
The Group evaluates its financial assets recognised through profit or loss, other than derivatives, to determine whether the intention to sell them in the near term is still appropriate. When the Group is unable to trade these financial assets due to inactive markets and Management’s intention to sell them in the foreseeable future significantly changes, the Group may elect to reclassify these financial assets, in rare circumstances.
Bank Group
As at 31 December 2019Rs. ’000
2018Rs. ’000
2019Rs. ’000
2018Rs. ’000
Measured at fair valueSri Lanka Government Securities
Treasury Bills – – 6,655,355 661,361Treasury Bonds 9,677,545 14,801,463 13,692,581 24,327,253
Equity securities [Note 20 (b)] 1,782,337 1,878,919 1,782,337 1,878,919
Subtotal 11,459,882 16,680,382 22,130,273 26,867,533Designated at fair value – – – –
Total 11,459,882 16,680,382 22,130,273 26,867,533
20. (a) Analysis
Bank Group
As at 31 December 2019Rs. ’000
2018Rs. ’000
2019Rs. ’000
2018Rs. ’000
By collateralisationPledged as collateral – – 10,216,289 9,595,990Unencumbered 11,459,882 16,680,382 11,913,984 17,271,543
Gross total 11,459,882 16,680,382 22,130,273 26,867,533
By currencySri Lankan Rupee 11,459,882 16,680,382 22,130,273 26,867,533United States Dollar – – – –
Gross total 11,459,882 16,680,382 22,130,273 26,867,533

Governance Financial Reports Supplementary Information
344 National Savings Bank │ Annual Report 2019 Notes to the Financial Statements
20. Financial assets recognised through profit or loss (contd.)20. (b) Equity securities (quoted) – Bank and Group
As at 31 December 2019 2018
Number of shares
CostRs. ’000
Market valueRs. ’000
Number of shares
CostRs. ’000
Market valueRs. ’000
1. Banks, finance and insurance
Commercial Bank of Ceylon PLC 1,007,399 141,001 95,703 991,418 139,295 114,013Commercial Bank of Ceylon PLC (NV) 278,511 34,332 23,116 273,294 33,862 25,963DFCC Bank 430,000 85,787 39,517 430,000 85,787 39,990Hatton National Bank PLC (NV) 293,163 50,465 39,724 287,649 49,599 48,469Lanka ORIX Leasing Co. Holding PLC – – – 2,860 323 257LOLC Finance PLC 3,628,769 40,148 14,152 4,550,000 50,340 15,470Sampath Bank PLC 556,917 147,608 90,443 534,925 142,425 125,707Union Bank PLC – – – 245,000 6,009 2,695
499,341 302,655 507,640 372,564
2. Chemical and pharmaceuticals
CIC Holdings PLC 68,029 7,792 4,082 135,839 15,558 5,379CIC Holdings PLC (NV) – – – 13,700 1,183 411Haycarb PLC 169,474 31,751 32,200 447,211 83,786 58,137
39,543 36,282 100,527 63,927
3. Construction and engineeringAccess Engineering PLC 3,470,023 132,692 75,647 3,470,023 132,692 48,927Colombo Dockyard PLC 1,212,327 270,607 75,164 1,234,706 275,603 68,650
403,299 150,811 408,295 117,577
4. Diversified holdingsAitken Spence PLC 2,493,516 294,681 115,948 2,493,516 294,681 119,190Browns Investments PLC 2,927,153 14,636 14,636 13,017,669 65,088 24,734C T Holdings PLC – – – 10,133 802 1,728Hayleys PLC 123,026 41,512 21,517 123,026 41,512 23,006Hemas Holdings PLC 673,843 71,659 53,907 650,000 69,656 57,720John Keells Holdings PLC 911,630 152,795 152,789 1,039,610 174,244 166,026Richard Pieris & Company PLC 2,924,320 27,557 34,507 6,463,907 60,911 67,871Vallibel One PLC 3,269,832 75,511 57,222 3,269,832 75,511 55,587
678,351 450,526 782,405 515,862

Governance Financial Reports Supplementary Information
345Annual Report 2019 │ National Savings BankNotes to the Financial Statements
20. Financial assets recognised through profit or loss (contd.)20. (b) Equity securities (quoted) – Bank and Group (contd.)
As at 31 December 2019 2018
Number of shares
CostRs. ’000
Market valueRs. ’000
Number of shares
CostRs. ’000
Market valueRs. ’000
5. Hotels and travelsAsian Hotels & Properties PLC 1,366,132 106,609 55,328 1,366,132 106,609 58,607Aitken Spence Hotel Holdings PLC 2,102,133 188,903 56,968 2,102,133 188,903 56,759Ceylon Hotels Corporation PLC 3,975,017 128,776 46,905 3,975,017 128,776 47,700John Keells Hotels PLC 2,011,205 37,557 23,330 5,541,205 103,475 43,221Lighthouse Hotels PLC 1,175,667 71,492 43,382 1,175,667 71,492 34,330Mahaweli Reach Hotels PLC – – – 133,300 4,884 1,733Marawila Resorts PLC 699,556 5,915 1,399 699,556 5,915 1,259The Kingsbury PLC 2,871,666 65,038 37,619 2,871,666 65,038 43,649Jetwing Symphony PLC 1,300,000 19,500 14,690 1,300,000 19,500 15,600
623,790 279,621 694,592 302,858
6. Investment trustsRenuka Holdings PLC (NV) 466,438 11,307 6,297 466,438 11,307 6,857
11,307 6,297 11,307 6,857
7. Land and propertyOverseas Reality (Ceylon) PLC 943,473 23,777 15,096 943,473 23,777 15,567
23,777 15,096 23,777 15,567
8. ManufacturingTeejay Lanka PLC 360,404 11,954 14,704 425,429 14,110 13,826Lanka Ceramic PLC 89,190 12,068 12,362 89,191 12,069 11,675Royal Ceramics Lanka PLC 1,748,679 221,888 154,758 1,748,679 221,888 130,452Tokyo Cement Company (Lanka) PLC 473,992 19,971 22,752 688,992 29,030 17,363Tokyo Cement Company (Lanka) PLC (NV) 611,060 22,602 23,954 611,060 22,602 14,054
Alumex PLC 121,295 2,074 1,795 121,295 2,074 1,637
290,557 230,325 301,773 189,007
9. Power and energyLVL Energy Fund PLC 4,606,600 46,066 34,550 4,606,600 46,066 38,695
46,066 34,550 46,066 38,695

Governance Financial Reports Supplementary Information
346 National Savings Bank │ Annual Report 2019 Notes to the Financial Statements
20. Financial assets recognised through profit or loss (contd.)20. (b) Equity securities (quoted) – Bank and Group (contd.)
As at 31 December 2019 2018
Number of shares
CostRs. ’000
Market valueRs. ’000
Number of shares
CostRs. ’000
Market valueRs. ’000
10. TelecommunicationDialog Axiata PLC 3,738,360 81,332 45,982 3,738,360 81,332 37,757
81,332 45,982 81,332 37,757
11. TradingBrown & Company PLC 793,717 253,948 57,862 985,000 315,149 60,085
253,948 57,862 315,149 60,085
12. Unit trustComtrust Equity Fund 556,793 10,000 9,321 556,793 10,000 9,869Ceybank Unit Trust 7,604,797 85,110 163,009 7,604,797 85,110 148,294
95,110 172,330 95,110 158,163
Total 3,046,421 1,782,337 3,367,973 1,878,919
21. Financial assets at amortised cost – Loans and advances
Accounting policy
Loans and advances include non-derivative financial assets with fixed or determinable payments that are not quoted in an active market, other than:
z Those that the Group intends to sell immediately or in the near term and those that the Group, upon initial recognition, designates as at fair value through profit or loss
z Those that the Group, upon initial recognition, designates financial assets measured at fair value through other comprehensive income
z Those for which the Group may not recover substantially all of its initial investment, other than due to credit deterioration
“Loans and advances” include amounts due from banks and other customers. After initial measurement, loans and advances are subsequently measured at amortised cost using the EIR, less allowance for impairment. Amortised cost is calculated by taking into account any discount or premium on acquisition and fees and costs that are an integral part of the EIR. The amortisation is included in “Interest income” in the Income Statement. The losses arising from impairment are recognised in “Impairment charge for loans and other losses” in the Income Statement.
From 1 January 2018, the Bank only measures loans and advances at amortised cost if both of the following conditions are met:
z The financial asset is held within a business model with the objective to hold financial assets in order to collect contractual cash flows
z The contractual terms of the financial asset give rise on specified dates to cash flows that are solely payments of principal and interest (SPPI) on the principal amount outstanding
Details of business model and SPPI test are given in Notes 2.5.1.4.1 and 2.5.1.4.2 on pages 312 and 313.

Governance Financial Reports Supplementary Information
347Annual Report 2019 │ National Savings BankNotes to the Financial Statements
21. Financial assets at amortised cost – Loans and advances (contd.)
Bank Group
As at 31 December 2019Rs. ’000
2018Rs. ’000
2019Rs. ’000
2018Rs. ’000
Gross loans and advancesNon-credit impaired 31,896,777 28,819,417 31,916,413 28,844,390Stage 1 387,398,241 385,084,341 389,417,668 385,084,341Stage 2 30,227,995 6,433,037 30,437,953 6,433,037Stage 3 9,138,886 6,404,254 10,668,447 6,404,254
Gross loan and advances 458,661,898 426,741,049 462,440,480 426,766,022
(Less): Accumulated impairment under:Stage 1 1,601,273 1,610,731 1,707,088 1,610,731Stage 2 271,001 272,348 314,032 272,348Stage 3 2,394,667 1,963,230 3,783,076 1,963,230Total Impairment 4,266,941 3,846,309 5,804,195 3,846,309Net loans and advances 454,394,957 422,894,740 456,636,285 422,919,713
21. (a) Analysis by product
Bank Group
As at 31 December 2019Rs. ’000
2018Rs. ’000
2019Rs. ’000
2018Rs. ’000
By productTrade finance – – – –Central Bank Treasury Bills – – – –Lease rental and hire purchase receivable (21. e) – – 472,747 –Pawning 36,754,318 29,893,320 36,792,150 29,893,320Staff loans 7,565,685 6,103,442 7,689,104 6,103,442
Term loansShort term 922,161 6,080,407 922,161 6,080,407Long term 408,213,779 380,231,640 411,338,726 380,231,640
OthersSri Lanka Government Securities – – – –Loan to Government 2,075,000 2,075,000 2,075,000 2,075,000Securities purchased under resale agreements 3,130,955 2,357,240 3,150,592 2,382,213
Gross total 458,661,898 426,741,049 462,440,480 426,766,022

Governance Financial Reports Supplementary Information
348 National Savings Bank │ Annual Report 2019 Notes to the Financial Statements
21. Financial assets at amortised cost – Loans and advances (contd.)21. (b) Analysis by currency
Bank Group
As at 31 December 2019Rs. ’000
2018Rs. ’000
2019Rs. ’000
2018Rs. ’000
By currencySri Lankan Rupee 447,213,959 407,437,834 450,992,541 407,462,807United States Dollar 11,447,939 19,303,215 11,447,939 19,303,215
Gross total 458,661,898 426,741,049 462,440,480 426,766,022
21. (c) Analysis by industry
Bank Group
As at 31 December 2019Rs. ’000
2018Rs. ’000
2019Rs. ’000
2018Rs. ’000
By industryAgriculture and fishing 32,854,359 20,817,480 33,543,973 20,817,480Manufacturing – – 960,704 –Tourism 46,264 38,746 136,981 38,746Transport 1,695,189 1,356,593 1,763,130 1,356,593Construction/housing 128,128,654 116,223,402 128,361,035 116,223,402Traders – – 708,986 –New economy – – 13,462 –
OthersFinancial and business services 11,663,968 26,413,837 11,663,968 26,413,837Infrastructure 71,020,455 76,286,787 71,020,455 76,286,787Power and energy 12,674,792 6,801,197 12,674,792 6,801,197Education 36,724,769 36,362,632 36,724,769 36,362,632
Personal/pawning/other 163,853,448 142,440,375 164,868,223 142,465,348
Gross total 458,661,898 426,741,049 462,440,480 426,766,022
21. (d) Movements in impairment during the year
Accounting policy
Individual assessment of impairmentFor financial assets carried at amortised cost (such as amounts due from banks, loans and advances to customers as well as financial assets at amortised cost – debt and other instruments), the Group first assesses individually whether objective evidence of impairment exists for financial assets that are individually significant, or collectively for financial assets that are not individually significant. If the Group determines that no objective evidence of impairment exists for an individually assessed financial asset, it includes the asset in a group of financial assets with similar credit risk characteristics and collectively assesses them for impairment.
Assets that are individually assessed for impairment and for which an impairment loss is, or continues to be, recognised are not included in a collective assessment of impairment.

Governance Financial Reports Supplementary Information
349Annual Report 2019 │ National Savings BankNotes to the Financial Statements
If there is objective evidence that an impairment loss has been incurred, the amount of the loss is measured as the difference between the assets’ carrying amount and the present value of estimated future cash flows (excluding future expected credit losses that have not yet been incurred). The carrying amount of the asset is reduced through the use of a provision account and the amount of the loss is recognised in the Income Statement. Interest income continues to be accrued on the reduced carrying amount at the rate of interest used to discount the future cash flows for the purpose of measuring the impairment loss. The interest income is recorded as part of “Interest and similar income”.
The present value of the estimated future cash flows is discounted at the financial asset’s original EIR. If a loan has a variable interest rate, the discount rate for measuring any impairment loss is the current EIR. If the Group has reclassified trading assets to loans and receivables, the discount rate for measuring any impairment loss is the new EIR determined at the reclassification date. The calculation of the present value of the estimated future cash flows of a collateralised financial asset reflects the cash flows that may result from foreclosure less costs for obtaining and selling the collateral, whether or not foreclosure is probable.
Loans together with the associated allowance are written off when there is no realistic prospect of future recovery and all collateral has been realised or has been transferred to the Group. If, in a subsequent year, the amount of the estimated impairment loss increased or decreased because of an event occurring after the impairment was recognised, the previously recognised impairment loss is increased or reduced by adjusting the allowance account. If a future write-off is later recovered, the recovery is credited to the “Credit loss expense”.
Collective assessment of impairmentIf the Group determines that no objective evidence of impairment exists for an individually assessed financial asset, it includes the asset in a group of financial assets with similar credit risk characteristics and collectively assesses them for impairment.
Future cash flows on a group of financial assets that are collectively evaluated for impairment are estimated on the basis of expected loss experience for assets with credit risk characteristics similar to those in the Group. Expected loss experience is adjusted on the basis of current observable date to reflect the effect of current conditions on which the historical loss experience is based and to remove the effect of conditions in the historical period that do not exist currently. Estimates of changes in future cash flows reflect, and are directionally consistent with, changes in related observable data from year to year (such as changes in unemployment rates, property prices, commodity prices, payment status, or other factors that are indicative of incurred losses in the Group and their magnitude). The methodology and assumptions used for estimating future cash flows are reviewed regularly to reduce any differences between loss estimates and actual loss experience.
Write-off of loans and advancesThe Bank’s accounting policy for write-off under SLFRS 9 remains the same as it was under LKAS 39. Loans (and the related impairment allowance accounts) are normally written off, either partially or in entirety, when there is no realistic prospect of recovery and all possible steps have been exhausted in recovering dues. Where loans are secured, this is generally after receipt of any proceeds from the realisation of security. If the amount to be written off is greater than the accumulated loss allowance, the difference is first treated as an addition to the allowance that is then applied against the gross carrying amount. If a write-off is later recovered, the recovery is credited to “Other operating income”.
Collateral valuationThe Group uses collateral where possible to mitigate the risk on financial assets. The collateral comes in various forms such as cash, gold, Government Securities. To the extent possible, the Bank uses active market data for valuing financial assets held as collaterals.
Details of impairment policy are given in Note 2.5.2 on page 317.
21. Financial assets at amortised cost – Loans and advances (contd.)21. (d) Movements in impairment during the year (contd.)

Governance Financial Reports Supplementary Information
350 National Savings Bank │ Annual Report 2019 Notes to the Financial Statements
Bank Group
As at 31 December 2019Rs. ’000
2018Rs. ’000
2019Rs. ’000
2018Rs. ’000
Stage 1
Balance as at 1 January 1,610,731 1,127,166 1,610,731 1,127,166Acquisition through business combinations – – 84,481 –Charge/(Write back) to Income Statement (9,458) 483,565 11,876 483,565Write-off during the year – – – –Other movements – – – –
Balance as at 31 December 1,601,273 1,610,731 1,707,088 1,610,731
Stage 2
Balance as at 1 January 272,348 128,432 272,348 128,432Acquisition through business combinations – – 43,159 –Charge/(Write back) to Income Statement (1,347) 143,916 (1,476) 143,916Write-off during the year – – – –Other movements – – – –
Balance as at 31 December 271,001 272,348 314,032 272,348
Stage 3
Balance as at 1 January 1,963,230 1,479,175 1,963,230 1,479,175Acquisition through business combinations – – 1,389,693 –Charge/(Write back) to Income Statement 447,061 503,642 450,255 503,642Write-off during the year (15,624) (19,587) (15,624) (19,587)Other movements – – (4,478) –
Balance as at 31 December 2,394,667 1,963,230 3,783,076 1,963,230
Total impairment provision as at 31 December 4,266,941 3,846,309 5,804,195 3,846,309
21. (e) Lease and hire purchase receivables
Bank Group
As at 31 December 2019Rs. ’000
2018Rs. ’000
2019Rs. ’000
2018Rs. ’000
Gross lease and hire purchased receivables – – 473,018 –Unearned interest income – – (271) –
Net lease and hire purchased receivables – – 472,747 –
21. Financial assets at amortised cost – Loans and advances (contd.)21. (d) Movements in impairment during the year (contd.)

Governance Financial Reports Supplementary Information
351Annual Report 2019 │ National Savings BankNotes to the Financial Statements
22. Financial assets at amortised cost – Debt and other instruments
Accounting policy
Financial assets at amortised cost – debt and other instruments are non-derivative financial assets with fixed or determinable payments and fixed maturities, which the Group has the intention and ability to hold to maturity. After initial measurement, financial assets at amortised cost – debt and other instruments are subsequently measured at amortised cost using the EIR, less impairment. Amortised cost is calculated by taking into account any discount or premium on acquisition and fees that are an integral part of the EIR. The amortisation is included in “Interest and similar income” in the Income Statement. The losses arising from impairment of such investments are recognised in the Income Statement line “Impairment charges”.
Bank Group
As at 31 December 2019Rs. ’000
2018Rs. ’000
2019Rs. ’000
2018Rs. ’000
Sri Lanka Government SecuritiesTreasury Bills 21,007,006 21,005,363 21,007,006 21,005,363Treasury Bonds 581,623,525 484,786,616 585,301,537 488,460,612Sri Lanka Development Bonds (SLDB) 416,550 178,560 416,550 178,560
Corporate debt instruments 9,163,833 7,653,898 9,419,428 8,005,137Trust certificates 3,437,861 5,332,605 3,437,861 5,332,605Commercial papers – – 6,000 –Other investments – – 165,595 –
Gross total 615,648,775 518,957,041 619,753,977 522,982,276Less: Impairment (14,454) (9,072) (186,191) (9,117)
Net total 615,634,321 518,947,969 619,567,786 522,973,159
22. (a) Analysis
Bank Group
As at 31 December 2019Rs. ’000
2018Rs. ’000
2019Rs. ’000
2018Rs. ’000
By collateralisationPledged as collateral 48,813,600 69,160,408 52,120,996 72,546,833Unencumbered 566,835,175 449,796,633 567,632,981 450,435,443
Gross total 615,648,775 518,957,041 619,753,977 522,982,276
By currencySri Lankan Rupee 615,232,225 518,778,481 619,337,427 522,803,716United States Dollar 416,550 178,560 416,550 178,560
Gross total 615,648,775 518,957,041 619,753,977 522,982,276

Governance Financial Reports Supplementary Information
352 National Savings Bank │ Annual Report 2019 Notes to the Financial Statements
22. Financial assets at amortised cost – Debt and other instruments (contd.) 22. (b) Movements in impairment during the year
Bank Group
As at 31 December 2019Rs. ’000
2018Rs. ’000
2019Rs. ’000
2018Rs. ’000
Stage 1
Opening balance as at 1 January 9,072 271,467 9,117 271,567Acquisition through business combinations – – 98 –Charge/(Write back) to Income Statement (471) (262,395) (470) (262,450)Write-off during the year – – – –Other movements – – – –
Balance as at 31 December 8,601 9,072 8,745 9,117
Stage 2
Balance as at 1 January – – – –Charge/(Write back) to Income Statement 5,852 – 5,852 –Write-off during the year – – – –Other movements – – – –
Balance as at 31 December 5,852 – 5,852 –
Stage 3
Balance as at 1 January – – – –Acquisition through business combinations – – 171,595 –Charge/(Write back) to Income Statement – – – –Write-off during the year – – – –Other movements – – – –
Balance as at 31 December – – 171,595 –
Total impairment provision as at 31 December 14,453 9,072 186,191 9,117

Governance Financial Reports Supplementary Information
353Annual Report 2019 │ National Savings BankNotes to the Financial Statements
23. Financial assets at fair value through other comprehensive income
Accounting policy
Financial Assets at Fair Value through Other Comprehensive Income include equity and debt securities. Equity investments classified as Fair Value through Other Comprehensive Income are those which are held as strategic investment. Debt securities in this category are those which are intended to be held for an indefinite period of time and which may be sold in response to needs for liquidity or in response to changes in the market conditions.
After initial measurement, financial assets at fair value through other comprehensive income are subsequently measured at fair value. Financial assets at fair value through other comprehensive income can be divided into two categories as follows:
i. Equity instruments fair value through other comprehensive income
Upon initial recognition, the Bank occasionally elects to classify irrevocably some of its equity investments as equity instruments at FVOCI when they meet the definition of Equity under LKAS 32 on “Financial Instruments: Presentation” and are not held for trading. Such classification is determined on an instrument-by-instrument basis.
“Unrealised gains and losses are recognised directly in equity (Other Comprehensive Income) in the “OCI reserve”. Gains and losses on these equity instruments are never recycled to profit. Dividends are recognised in profit or loss as other operating income when the right of the payment has been established, except when the Bank benefits from such proceeds as a recovery of part of the cost of the instrument, in which case, such gains are recorded in OCI. Equity instruments at FVOCI are not subject to an impairment assessment”.
Equity investments under FVOCI that do not have quoted market price and whose fair value cannot be reliably measured shall be measured at cost.
ii. Debt instruments at fair value through other comprehensive income
The Bank applies the new category under SLFRS 9 of debt instruments measured at FVOCI when both of the following conditions are met:
z The instrument is held within a business model, the objective of which is achieved by both collecting contractual cash flows and selling financial assets
z The contractual terms of the financial asset meet the SPPI test
These instruments largely comprise assets that had previously been classified as financial investments available for sale under LKAS 39.
Interest earned whilst holding financial asset at fair value through other comprehensive income is recognised as interest income using the EIR. The losses arising from impairment of such investments are recognised in the Income Statement in “Impairment charges”.
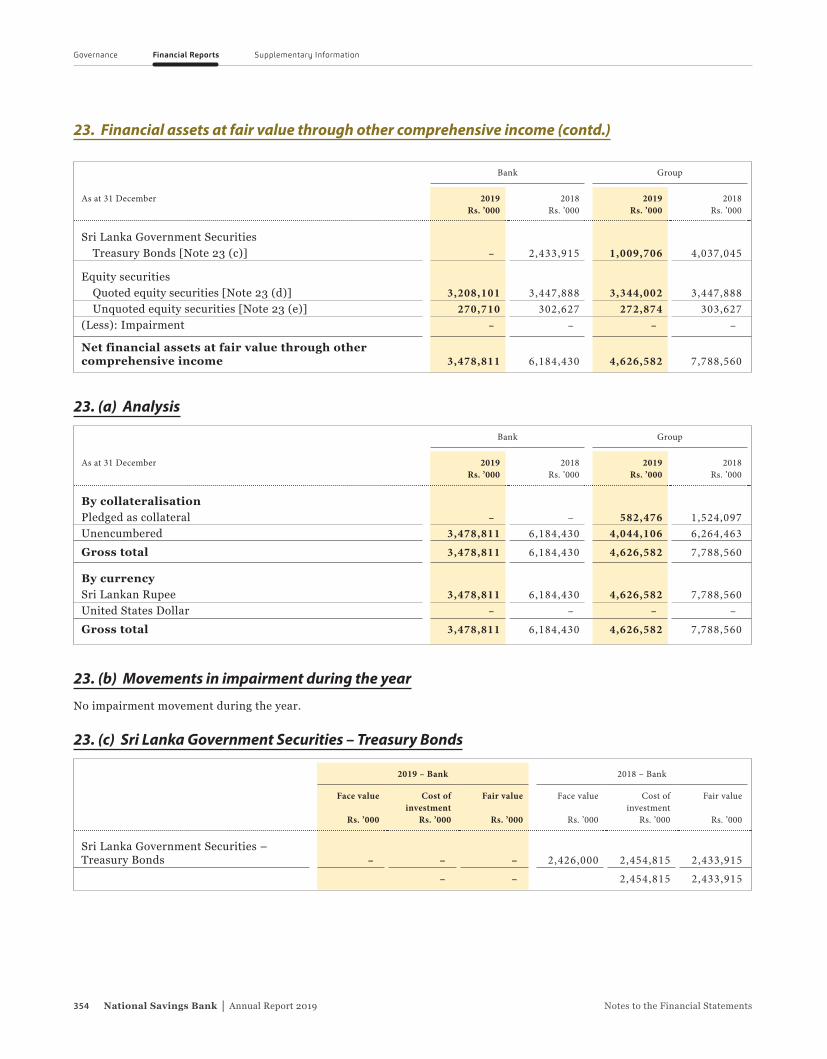
Governance Financial Reports Supplementary Information
354 National Savings Bank │ Annual Report 2019 Notes to the Financial Statements
Bank Group
As at 31 December 2019Rs. ’000
2018Rs. ’000
2019Rs. ’000
2018Rs. ’000
Sri Lanka Government SecuritiesTreasury Bonds [Note 23 (c)] – 2,433,915 1,009,706 4,037,045
Equity securitiesQuoted equity securities [Note 23 (d)] 3,208,101 3,447,888 3,344,002 3,447,888Unquoted equity securities [Note 23 (e)] 270,710 302,627 272,874 303,627
(Less): Impairment – – – –
Net financial assets at fair value through other comprehensive income 3,478,811 6,184,430 4,626,582 7,788,560
23. (a) Analysis
Bank Group
As at 31 December 2019Rs. ’000
2018Rs. ’000
2019Rs. ’000
2018Rs. ’000
By collateralisationPledged as collateral – – 582,476 1,524,097Unencumbered 3,478,811 6,184,430 4,044,106 6,264,463
Gross total 3,478,811 6,184,430 4,626,582 7,788,560
By currencySri Lankan Rupee 3,478,811 6,184,430 4,626,582 7,788,560United States Dollar – – – –
Gross total 3,478,811 6,184,430 4,626,582 7,788,560
23. (b) Movements in impairment during the year
No impairment movement during the year.
23. (c) Sri Lanka Government Securities – Treasury Bonds
2019 – Bank 2018 – Bank
Face value
Rs. ’000
Cost of investment
Rs. ’000
Fair value
Rs. ’000
Face value
Rs. ’000
Cost of investment
Rs. ’000
Fair value
Rs. ’000
Sri Lanka Government Securities – Treasury Bonds – – – 2,426,000 2,454,815 2,433,915
– – 2,454,815 2,433,915
23. Financial assets at fair value through other comprehensive income (contd.)

Governance Financial Reports Supplementary Information
355Annual Report 2019 │ National Savings BankNotes to the Financial Statements
23. Financial assets at fair value through other comprehensive income (contd.)
2019 – Group 2018 – Group
Face value
Rs. ’000
Cost of investment
Rs. ’000
Fair value
Rs. ’000
Face value
Rs. ’000
Cost of investment
Rs. ’000
Fair value
Rs. ’000
Sri Lanka Government Securities – Treasury Bonds 900,000 1,104,773 1,009,706 3,951,000 4,267,031 4,037,045
1,104,773 1,009,706 4,267,031 4,037,045
23. (d) Quoted investments – Equity securities – Bank and Group
2019 – Bank 2018 – Bank
Number of shares
CostRs. ’000
Fair valueRs. ’000
Number of shares
CostRs. ’000
Fair valueRs. ’000
Hatton National Bank PLC 11,515,728 1,689,969 1,983,008 11,346,652 1,655,816 2,428,184Sri Lanka Telecom PLC 13,158,700 445,643 419,763 13,158,700 445,642 307,913People’s Leasing & Finance PLC 44,990,502 805,318 805,330 43,668,157 784,405 711,791
2,940,930 3,208,101 2,885,863 3,447,888
2019 – Group 2018 – Group
Number of shares
CostRs. ’000
Fair valueRs. ’000
Number of shares
CostRs. ’000
Fair valueRs. ’000
Hatton National Bank PLC 11,515,728 1,689,969 1,983,008 11,346,652 1,655,816 2,428,184
Sri Lanka Telecom PLC 13,158,700 445,643 419,763 13,158,700 445,642 307,913
People’s Leasing & Finance PLC 44,990,502 805,318 805,330 43,668,157 784,405 711,791
National Development Bank 15,634 971 1,563 – – –
Commercial Bank of Ceylon PLC 212 7 20 – – –
Lanka ORIX Leasing Company 200 1 36 – – –
Sampath Bank PLC 3,609 83 586 – – –
Watawala Plantation PLC 4,046 20 105 – – –
Trans Asia Hotel PLC 4,000 35 279 – – –
Lanka Ceramic PLC 917 24 127 – – –
Lanka Walltile PLC 117 2 8 – – –
Kelani Valley Plantations PLC 5,500 198 490 – – –
Hapugastenna Plantations PLC 100 3 2 – – –
Aitken Spence PLC 18,000 160 837 – – –
Pan Asia Bank PLC 10,298,499 96,012 131,821 – – –
Hatton Plantations PLC 4,000 – 28 – – –
3,038,446 3,344,002 2,885,863 3,447,888

Governance Financial Reports Supplementary Information
356 National Savings Bank │ Annual Report 2019 Notes to the Financial Statements
23. Financial assets at fair value through other comprehensive income (contd.)23. (e) Unquoted investments – Equity securities
2019 – Bank 2018 – Bank
Number of shares
CostRs. ’000
Cost/fair valueRs. ’000
Number of shares
CostRs. ’000
Cost/fair valueRs. ’000
Investment – Credit Information Bureau 30,450 57,364 57,364 30,450 57,364 57,364Investment – Associated Newspapers of Ceylon Limited 20,000 127 127 20,000 127 127Investment – Regional Development Bank (RDB) 16,452,126 164,521 213,219 16,452,126 164,521 245,136(Less): Impairment – – – –
222,012 270,710 222,012 302,627
2019 – Group 2018 – Group
Number of shares
CostRs. ’000
Cost/fair valueRs. ’000
Number of shares
CostRs. ’000
Cost/fair valueRs. ’000
Investment – Credit Information Bureau 32,093 57,528 57,528 30,450 57,364 57,364Investment – Associated Newspapers of Ceylon Limited 20,000 127 127 20,000 127 127Investment – Regional Development Bank (RDB) 16,452,126 164,521 213,219 16,452,126 164,521 245,136Investment – Sri Lanka Financial Services Bureau Ltd. 200,000 2,000 2,000 100,000 1,000 1,000Pramuka Merchant Corporation 500,000 5,000 5,000 – – –Prime Development & Constructions 230,000 2,300 2,300 – – –Janashakthi Life 2,500,000 25,000 25,000 – – –Janashakthi Holding 1,000,000 10,000 10,000 – – –Vanik Incorporation 17,000 176 176 – – –(Less): Impairment – (42,476) – –
266,652 272,874 223,012 303,627
All unquoted equities in financial assets measured at fair value through other comprehensive income (except RDB) are recorded at cost, since its fair value can not be reliably estimated. There is no active market for these investments and Bank intends to hold it for the long term. The investment in RDB shares have been fair valued using a valuation model based on observable data.

Governance Financial Reports Supplementary Information
357Annual Report 2019 │ National Savings BankNotes to the Financial Statements
24. Investments in subsidiaries
Accounting policy
Investments in subsidiary companies are accounted at cost less allowance for impairment in Financial Statements of the Bank. The net assets of subsidiary company are reviewed at each Reporting date to determine whether there is any indication of impairment. If any such indication exists, then the recoverable amount of investment is estimated and the impairment loss is recognised to the extent of its loss in net assets.
2019 2018 2019 2018
As at 31 December% %
CostRs. ’000
Valuation*Rs. ’000
CostRs. ’000
Valuation*Rs. ’000
Unquoted equity investmentsNSB Fund Management Co. Ltd.(170,000,000 ordinary shares of Rs. 10.00 each) 100 100 1,700,000 3,337,123 1,700,000 2,722,821Sri Lanka Savings Bank Limited (8,204,464 ordinary shares)** 100 – 3,111,000 4,892,391 – –(Less): Impairment [Refer 24. (d)] – – – –Net total 4,811,000 8,229,514 1,700,000 2,722,821
* The Valuation of investments in subsidiaries have been carried out on net asset basis as at 31 December 2019 based on audited Financial Statements.
24. (a) Acquisition and disposal of subsidiary
The National Savings Bank acquired 100% equity stake in Sri Lanka Savings Bank Limited (SLSBL) as fully own subsidiary by paying Rs. 3,111 Mn. on 11 October 2019 with the special approval of CBSL. The fair value of assets and liabilities of the investee (SLSBL) are given below:
As at 31 December SLSBLRs. ’000
2019Rs. ’000
Placements with banks 5,693,179 5,693,179 Loans and advances 2,205,551 2,205,551 Debt and other instruments 716,931 716,931 Financial assets measured at fair value through other comprehensive income 131,728 131,728 Property, plant and equipment 288,695 288,695 Right of used assets 16,462 16,462 Investment properties 333,315 333,315 Intangible assets 287 287 Other assets 65,625 65,625 Due to depositors (1,089,200) (1,089,200)Due to other borrowers (1,371,915) (1,371,915)Lease liability (15,772) (15,772)Debt securities issued (264,130) (264,130)Retirement benefit obligations (21,195) (21,195)Current tax liabilities (418,858) (418,858)Other liabilities (1,588,729) (1,588,729)Net Identifiable assets and liabilities 4,681,974 4,681,974 Gain from Bargain purchase (Refer Note 9) 1,649,490 1,649,490
3,032,484 3,032,484

Governance Financial Reports Supplementary Information
358 National Savings Bank │ Annual Report 2019 Notes to the Financial Statements
24. (b) Satisfied by
As at 31 December SLSBLRs. ’000
2019Rs. ’000
Analysis of cash and cash equivalents on acquisition of subsidiaryCash consideration 3,111,000 3,111,000 Cash in hand and at bank acquired (97,201) (97,201)Due to Bank/over draft 18,685 18,685
3,032,484 3,032,484
24. (c) Interest Income and profit of acquire
From the date of acquisition , SLSB contributed Interest income of Rs. 246.34 Mn. and Profit before and after taxation (PBT, PAT) of Rs. 212.41 Mn. and Rs. 166.84 Mn. respectively to the consolidated result of the Group.
No disposal has been occurred during the year 2019.
24. (d) Movements in impairment during the year
No impairment movements during the year 2019.
25. Investment in associates and joint venturesNo investment in associates and joint ventures.
26. Property, plant and equipment
Accounting policy
Basis of recognitionProperty, plant and equipment are recognised if it is probable that future benefits associated with the asset will flow to the Group and cost of the asset can be reliably measured. Property, plant and equipment are initially measured at cost including costs directly attributable to the acquisition of the asset.
Basis of measurementAn item of property, plant and equipment that qualifies for recognition as an asset is initially measured at cost. Cost includes expenditure that is directly attributable to the acquisition of the asset and subsequent costs. The self-constructed assets includes the cost of materials and direct labour, any other costs directly attributable to bring the asset to a working condition for its intended use and the cost of dismantling and removing the items and restoring the site on which they are located and capitalised borrowing costs. Purchased software which is integral to the functionality of the related equipment is capitalised as part of computer equipment.
When parts of an item of property, plant and equipment have different useful lives, they are accounted for as separate items (major components) of property, plant and equipment.
Cost modelThe Group applies cost model to property, plant and equipment except for freehold land and buildings and records at cost of purchase or construction together with any incidental expenses thereon less accumulated depreciation and any accumulated impairment losses.

Governance Financial Reports Supplementary Information
359Annual Report 2019 │ National Savings BankNotes to the Financial Statements
Revaluation modelThe Group applies the revaluation model to the entire class of freehold land and buildings. Such properties are carried at a revalued amount, being their fair value at the date of revaluation less any subsequent accumulated depreciation and subsequent accumulated impairment losses. Freehold land and buildings of the Group are revalued every three years or more frequently, if the fair values are substantially different from their carrying amounts to ensure that the carrying amounts do not differ materially from the fair values at the reporting date.
On revaluation of an asset, any increase in the carrying amount is recognised in Other Comprehensive Income and accumulated in equity, under capital reserve or used to reverse a previous revaluation decrease relating to the same asset, which was charged to Income Statement. In this circumstance, the increase is recognised as income to the extent of the previous write down. Any decrease in the carrying amount is recognised as an expense in the Income Statement or debited in the Other Comprehensive Income to the extent of any credit balance existing in the capital reserve in respect of that asset. The decrease recognised in Other Comprehensive Income reduces the amount accumulated in equity under capital reserves. Any balance remaining in the Revaluation Reserve in respect of an asset is transferred directly to Retained Earnings on retirement or disposal of the asset.
DerecognitionProperty, plant and equipment are derecognised on disposal or when no future economic benefits are expected from its use. Any gain or loss arising on derecognition of the asset (calculated as the difference between the net disposal proceeds and the carrying amount of the asset) is recognised in “Other operating income” in the Income Statement in the year the asset is derecognised.
Capital work-in-progressThese are expenses of capital nature directly incurred in the construction of buildings, major plant and machinery and system development, awaiting capitalisation. These are stated in the Statement of Financial Position at cost less any accumulated impairment losses. Capital work-in-progress is transferred to the relevant asset when it is in the location and condition necessary for it to be capable of operating in the manner intended by Management.
Borrowing costsThere were no capitalised borrowing costs related to the acquisition of property, plant and equipment by the Bank.
DepreciationDepreciation is recognised in profit or loss on the straight-line method to write down the cost of property and equipment to their residual values over their estimated useful lives. Land is not depreciated. Depreciation rates for the identified classes of assets are as follows:
Improvement to rent/leasehold buildingEffective from 1 January 2017 the Bank has decided to capitalised the improvement to rent/leasehold building. The improvement will be amortised over the lease period effective from same date.
Category of asset Depreciation period
Leasehold properties, improvement to rent/leasehold Over the period of lease
Freehold buildings 20-40 years
Office, sundry equipment and furniture and fittings 5-10 years
Motor vehicles 5 years
Computer hardware 4-5 years
Computer software 4-5 years
The Group provides depreciation of an assets commence from the date when they are available for use to the date of disposal of the asset.
26. Property, plant and equipment (contd.)

Governance Financial Reports Supplementary Information
360 National Savings Bank │ Annual Report 2019 Notes to the Financial Statements
26. Property, plant and equipment (contd.)26. (a) Property, plant and equipment – Bank – 2019
Land and buildings
Rs. ’000
Leasehold properties,
improvement to rent/leasehold
buildings*Rs. ’000
Computer hardware
Rs. ’000
Computer software
Rs. ’000
Office sundry equipment,
furniture and fittings**
Rs. ’000
Motor vehicle
Rs. ’000
Building work-in- progress
Rs. ’000
Total
Rs. ’000
Cost/fair value
Opening balance as at 1 January 2019 10,234,299 634,944 2,618,916 1,342,326 1,960,815 365,656 508,847 17,665,803
Additions 438,560 183,870 428,332 262,718 359,522 106,804 427,295 2,207,101
Disposals/Transfer – (115,413) (52,696) – (82,606) (13,175) (527,772) (791,662)
Closing balance as at 31 December 2019 10,672,859 703,401 2,994,552 1,605,044 2,237,731 459,285 408,370 19,081,242
(Less): Accumulated depreciation
Opening balance as at 1 January 2019 52,203 96,077 1,835,348 766,251 1,138,244 311,926 – 4,200,048
Charge for the year 62,302 39,331 274,965 239,917 152,457 35,377 – 804,349
Disposals – – (51,692) – (21,741) (13,175) – (86,608)
Closing balance as at 31 December 2019 114,505 135,408 2,058,621 1,006,168 1,268,960 334,128 – 4,917,789
(Less): Impairment – – – – – – – –
Net book value as at 31 December 2019 10,558,354 567,993 935,931 598,876 968,771 125,157 408,370 14,163,454
26. (a) Property, plant and equipment – Bank – 2018
Land and buildings
Rs. ’000
Leasehold properties,
improvement to rent/leasehold
buildings*Rs. ’000
Computer hardware
Rs. ’000
Computer software
Rs. ’000
Office sundry equipment,
furniture and fittings**
Rs. ’000
Motor vehicle
Rs. ’000
Building work-in- progress
Rs. ’000
Total
Rs. ’000
Cost/fair value
Opening balance as at 1 January 2018 10,020,133 548,011 2,270,025 958,764 1,734,483 349,602 186,111 16,067,129
Adjustments – – – – – – – –
Additions 346,816 125,447 382,245 390,052 349,027 16,068 457,471 2,067,126
Revaluation – – – – – – – –Depreciation adjustment for revalued assets – – – – – – – –
Disposals (132,650) (38,514) (33,354) (6,490) (122,695) (14) (134,735) (468,452)
Closing balance as at 31 December 2018 10,234,299 634,944 2,618,916 1,342,326 1,960,815 365,656 508,847 17,665,803
(Less): Accumulated depreciation
Opening balance as at 1 January 2018 – 77,296 1,659,278 578,456 1,079,467 276,948 – 3,671,444
Charge for the year 52,203 18,781 208,131 187,796 136,893 34,992 – 638,795Depreciation adjustment for revalued assets – – – – – – – –
Disposals – – (32,061) – (78,116) (14) – (110,191)
Closing balance as at 31 December 2018 52,203 96,077 1,835,348 766,251 1,138,244 311,926 – 4,200,048
(Less): Impairment – – – – – – – –
Net book value as at 31 December 2018 10,182,095 538,867 783,568 576,075 822,571 53,730 508,847 13,465,755

Governance Financial Reports Supplementary Information
361Annual Report 2019 │ National Savings BankNotes to the Financial Statements
26. Property, plant and equipment (contd.)26. (b) Property, plant and equipment – Group – 2019
Land and buildings
Rs. ’000
Leasehold properties,
improvement to rent/leasehold
buildings*Rs. ’000
Computer hardware
Rs. ’000
Computer software***
Rs. ’000
Office sundry equipment,
furniture and fittings**
Rs. ’000
Motor vehicle
Rs. ’000
Building work-in- progress
Rs. ’000
Total
Rs. ’000
Cost/fair value
Opening balance as at 1 January 2019 10,234,299 634,944 2,624,715 1,344,696 1,962,946 365,655 508,847 17,676,103Acquisition through business combinations 286,520 – 40,325 10,380 51,582 44,241 – 433,048
Additions 438,560 183,870 429,274 263,293 362,799 106,804 427,295 2,211,894
Disposals – (115,413) (52,808) – (83,741) (13,175) (527,772) (792,908)
Closing balance as at 31 December 2019 10,959,379 703,401 3,041,507 1,618,369 2,293,586 503,525 408,370 19,528,138
(Less): Accumulated depreciation
Opening balance as at 1 January 2019 52,203 96,077 1,839,213 768,354 1,139,554 311,926 – 4,207,328Acquisition through business combinations 2,592 – 38,880 10,093 48,292 44,210 – 144,066
Charge for the year 62,356 39,331 276,063 240,310 153,339 35,409 – 806,808
Disposals – – (51,804) – (22,578) (13,175) – (87,557)
Closing balance as at 31 December 2019 117,151 135,408 2,102,352 1,018,758 1,318,607 378,369 – 5,070,644
(Less): Impairment – – – – – – –
Net book value as at 31 December 2019 10,842,228 567,993 939,155 599,611 974,979 125,156 408,370 14,457,494
26. (b) Property, plant and equipment – Group – 2018
Land and buildings
Rs. ’000
Leasehold properties,
improvement to rent/leasehold
buildings*Rs. ’000
Computer hardware
Rs. ’000
Computer software
Rs. ’000
Office sundry equipment,
furniture and fittings**
Rs. ’000
Motor vehicle
Rs. ’000
Building work-in- progress
Rs. ’000
Total
Rs. ’000
Cost/fair value
Opening balance as at 1 January 2018 10,020,133 548,011 2,275,565 961,134 1,736,518 349,601 186,111 16,077,074
Additions 346,816 125,447 382,504 390,052 349,123 16,068 457,471 2,067,481
Disposals (132,650) (38,514) (33,354) (6,490) (122,695) (14) (134,735) (468,452)
Closing balance as at 31 December 2018 10,234,299 634,944 2,624,715 1,344,696 1,962,946 365,655 508,847 17,676,103
(Less): Accumulated depreciation
Opening balance as at 1 January 2018 – 77,296 1,662,384 580,479 1,080,633 276,948 – 3,677,740
Charge for the year 52,203 18,781 208,890 187,875 137,038 34,992 – 639,779
Disposals – – (32,061) – (78,116) (14) – (110,191)
Closing balance as at 31 December 2018 52,203 96,077 1,839,213 768,354 1,139,554 311,926 – 4,207,328
(Less): Impairment – – – – – – – –
Net book value as at 31 December 2018 10,182,096 538,867 785,502 576,342 823,392 53,729 508,847 13,468,776
* Leasehold properties, improvement to rent/leasehold buildings include work-in-progress of improvement to rent/leasehold building amounting to Rs. 32.44 Mn. as at 31 December 2019.
** Office, sundry equipment and furniture and fittings include work-in-progress of office equipment amounting to Rs. 46.24 Mn. as at 31 December 2019.*** Computer Software includes work-in-progress software projects amounting to Rs. 63 Mn. as at 31 December 2019.

Governance Financial Reports Supplementary Information
362 National Savings Bank │ Annual Report 2019 Notes to the Financial Statements
26. Property, plant and equipment (contd.)26. (c) Revaluation/fair valuation
The Bank has revalued its land and buildings, by professionally qualified independent valuers. The revaluation was carried out by taking into account the observable prices in active market or recent market transactions on arm’s length basis. Accordingly a, revaluation surplus, amounting to Rs. 4,478.48 Mn. had been credited to the Revaluation Reserve Account in 2017 and Rs. 11.73 Mn. had been adjusted to the same in relation to the prior year.
26. (d) Land and buildings of the Bank
Land and building balance include freehold land value of Rs. 8,093.8 Mn.
26. (e) Property, plant and equipment pledged as security for liabilities
There were no items of property, plant and equipment pledged as securities for liabilities.
26. (f) Fully-depreciated property, plant and equipment
The initial cost of fully-depreciated property, plant and equipment, which are still in use as at reporting date is as follows:
Bank Group
As at 31 December 2019Rs. ’000
2018Rs. ’000
2019Rs. ’000
2018Rs. ’000
Computer hardware 1,367,666 1,367,141 1,407,813 1,368,083Office equipment, furniture and fittings 368,154 310,827 403,394 311,475Intangible assets – Computer software 472,864 470,562 474,834 472,531Sundry equipments/Motor vehicles and others 526,666 431,765 571,821 432,679

Governance Financial Reports Supplementary Information
363Annual Report 2019 │ National Savings BankNotes to the Financial Statements
27. Right of used assets
Accounting policy
The Group’s right of used assets consist of the value of capitalised lease agreement held.
Basis of recognitionThe Group recognises right-of-use assets at the commencement date of the lease (i.e. the date as specified in the Lease Agreement), which is the present value of lease payments to be made over the lease term.
Basis of measurementRight-of-use assets are measured at cost, less any accumulated depreciation and impairment losses, and adjusted for any remeasurement of lease liabilities. The cost of right-of-use assets includes the amount of lease liabilities recognised, and lease payments made at or before the commencement date less any lease incentives received.
Useful economic life and amortisationUnless the Group is reasonably certain to obtain ownership of the leased asset at the end of the lease term, the recognised right-of-use assets are depreciated on a straight-line basis over the shorter of its estimated useful life and the lease term. Right-of-use assets are subject to impairment.
Bank Group
As at 31 December 2019Rs. ’000
2018Rs. ’000
2019Rs. ’000
2018Rs. ’000
Capitalised value of right of used assetsOpening balance – – – –Acquisition through business combinations – – 22,647 –Addition 1,312,091 – 1,355,693 –Less:Disposal – – – –Termination/Transfers – – – –Impairment – – – –
Closing balance 1,312,091 – 1,378,340 –
Less Accumulated amortisation of right of used assetsOpening balance – – – –Acquisition through business combinations – – 6,185 –Charge for the year 238,585 – 241,287 –Disposal – – – –Termination/Transfers – – – –Closing balance 238,585 – 247,472 –
Carrying value as at 31 December 1,073,507 – 1,130,868 –

Governance Financial Reports Supplementary Information
364 National Savings Bank │ Annual Report 2019 Notes to the Financial Statements
28. Investment properties
Accounting policy
The Bank do not have investment properties and Group do have investment properties due to acqusition of Sri Lanka Savings Bank Limited (SLSB) on 11 October 2019.
Investment on land or a building or part of a building or both, held to earn rentals or capital appreciation or both, are classified as investment property.
Cost modelInvestment properties excluding investment buildings are measured (initially) at cost (LKAS 40 Sec. 56), including transaction costs. Fair value of Investment properties is measured by the Management on annual basis and is disclosed separately in Notes to the Financial Statement.
Fair valueAfter recognition as investment buildings, whose fair value can be measured reliably shall be carried at a revalued amount, being its fair value at the date of the revaluation less any subsequent accumulated depreciations and subsequent accumulated impairment losses. Revaluation shall be made at every five (5) years to ensure that the carrying amount does not differ materially from that, which would be determined using fair value at the end of the reporting period. Rent receivable is spread on a straight-line basis over the period of the lease. Where an incentive (such as a rent-free period) is given to a tenant, the carrying value of the investment property excludes any amount reported as a separate asset as a result of recognising rental income on this basis.
28. (a) Cost of investment properties
Bank Group
As at 31 December 2019Rs. ’000
2018Rs. ’000
2019Rs. ’000
2018Rs. ’000
LandOpening balance – – – –Acquisition through business combinations – – 316,095Addition – – – –Revaluation gain – – – –Transfer from property, plant and equipment – – – –Transfer to property, plant and equipment – – – –Impairment – – – –
Closing balance – – 316,095 –
Building
Opening balance – – – –Acquisition through business combinations – – 17,220Addition – – – –Revaluation gain – – – –Transfer from property, plant and equipment – – – –Transfer to property, plant and equipment – – – –Impairment – – – –
Closing balance – – 17,220 –

Governance Financial Reports Supplementary Information
365Annual Report 2019 │ National Savings BankNotes to the Financial Statements
28. Investment properties (contd.)28. (b) Accumulated depreciation of investment properties
Bank Group
As at 31 December 2019Rs. ’000
2018Rs. ’000
2019Rs. ’000
2018Rs. ’000
Opening balance – – – –Change for the year – – – –Transfer from property, plant and equipment – – – –Transfer to property, plant and equipment – – – –
Closing balance – – – –
Net book value as at 31 December – – 333,315 –
SLSB has adopted policy to revalue investment properties by every five years time, thus investment properties are measured at fair value as per the LKAS 40 and revaluation done every five years time.
29. Goodwill and intangible assets
Accounting policy
The Group’s intangible assets consist of the value of purchased computer software.
Basis of recognitionAn intangible asset is recognised only when its cost can be measured reliably and it is probable that the expected future economic benefits that are attributable to it will flow to the Group.
Basis of measurementIntangible assets acquired separately are measured on initial recognition at cost. The cost of intangible assets acquired in a business combination is their fair value as at the date of acquisition. Following initial recognition, intangible assets are carried at cost less any accumulated amortisation and any accumulated impairment losses.
Useful economic life and amortisationThe useful lives of intangible assets are assessed to be either finite or indefinite. Intangible assets with finite lives are amortised over the useful economic life. The amortisation period and the amortisation method for an intangible asset with a finite useful life are reviewed at least at each financial year end. Changes in the expected useful life or the expected pattern of consumption of future economic benefits embodied in the asset are accounted for by changing the amortisation period or method, as appropriate, and they are treated as changes in accounting estimates. The amortisation expense on intangible assets with finite lives is recognised in the Income Statement in the expense category consistent with the function of the intangible asset.
DerecognitionIntangible assets are derecognised on disposal or when no future economic benefits are expected from its use. Any gain or loss arising on derecognition of the asset (calculated as the difference between the net disposal proceeds and the carrying amount of the asset) is recognised in “Other operating income” in the Income Statement in the year the asset is derecognised.
The Group does not possess intangible assets with indefinite useful economic life. The estimated economic life of the Group’s computer software is four years (25% per annum).
The Bank and Group do not have any intangible assets except computer software which has been disclosed under the property, plant and equipment in Note 26.

Governance Financial Reports Supplementary Information
366 National Savings Bank │ Annual Report 2019 Notes to the Financial Statements
30. Deferred tax assets/liabilities
Accounting policy
Detailed discussion on deferred tax is given in Note 13 on page 332.
30. (a) Deferred tax assets
Bank Group
As at 31 December 2019Rs. ’000
2018Rs. ’000
2019Rs. ’000
2018Rs. ’000
Opening balance – – 73 (75)Charge for the year recognised in– Profit and loss – – 265 148– Other comprehensive income – – – –
Closing balance – – 338 73
30. (b) Deferred tax liabilities
Bank Group
As at 31 December 2019Rs. ’000
2018Rs. ’000
2019Rs. ’000
2018Rs. ’000
Deferred tax liabilities 582,463 507,063 582,463 507,063Income Statement [refer Note 13. (b)] (35,213) 75,400 (34,449) 75,400
Net deferred tax liabilities 547,250 582,463 548,014 582,463
31. Other assets
Bank Group
As at 31 December 2019Rs. ’000
2018Rs. ’000
2019Rs. ’000
2018Rs. ’000
CostNotional Tax/WHT receivable [refer Note 4 (e)] 2,695,348 5,761,291 2,695,348 5,769,803Receivables [refer Note 31.1] 5,402,236 4,714,573 5,505,679 5,029,529Receivable form treasury on interest (senior citizen) 17,134,591 12,066,623 17,134,591 12,066,623Deposits and prepayments 599,420 273,541 608,996 273,541Advance payment to Treasury (refer Note 31.2) 3,840,000 4,160,000 3,840,000 4,160,000Advance payment made to pension II (refer Note 36) – 260,021 – 260,021Sundry debtors 28,344 17,633 28,365 17,633Prepaid employee compensation 5,254,774 3,790,398 5,254,774 3,790,398Other assets 243,211 165,136 302,362 165,136
Total 35,197,923 31,209,216 35,370,115 31,532,684

Governance Financial Reports Supplementary Information
367Annual Report 2019 │ National Savings BankNotes to the Financial Statements
31.1 Receivables
Bank Group
As at 31 December 2019Rs. ’000
2018Rs. ’000
2019Rs. ’000
2018Rs. ’000
CostReceivables 5,526,608 4,714,573 5,655,156 5,029,529Less: Impairment (124,372) – (149,477) –
Net receivables 5,402,236 4,714,573 5,505,679 5,029,529
31.2 Advance payment to Treasury
At the request of Treasury, the Bank paid an advance of Rs. 6,000 Mn. in 2012 and Rs. 2,000 Mn. in 2013 as confirmed by the Treasury to be set off against the profit within a period of six years starting from 2014. Effective from 1 January 2016, Treasury has agreed to set off the balance amount of Rs. 5,333 Mn. against the profit within a period of 10 years. There after Treasury has agreed to set off the balance amount of Rs. 4,800 Mn. against the profit within a period of 15 years effective from 1 January 2017.
32. Due to banks
Accounting policy
Due to banks represents overdrafts, call money borrowings, borrowing from banks and Repos by the subsidiary. Subsequent to initial recognition deposits are measured at their amortised cost using EIR method. Interest paid/payable on these dues are recognised in the Income Statement under interest expense. Foreign currency borrowings as at the reporting date are translated to the functional currency at the middle exchange rate of the functional currency at that date. Foreign currency differences arising on retranslation at the reporting date are recognised in profit or loss.
Bank Group
As at 31 December 2019Rs. ’000
2018Rs. ’000
2019Rs. ’000
2018Rs. ’000
Foreign currency borrowings (Note 32.1) 12,022,691 18,183,425 12,022,691 18,183,425Securities sold under repurchase (Repo) agreements 22,938,962 58,852,946 24,032,762 65,349,064Other facilities 83,598 82,775 83,669 82,775
Total 35,045,251 77,119,146 36,139,122 83,615,264
32.1 Foreign currency borrowings
Name of lender Loan value
(USD Mn.)
Capital outstanding
(USD Mn.)
Date of borrowing
Date of maturity
Commerzebank Finance and Covered Bond S.A. 100 66.66 31.10.2018 31.10.2021

Governance Financial Reports Supplementary Information
368 National Savings Bank │ Annual Report 2019 Notes to the Financial Statements
33. Derivative financial instrumentsBank and Group
As at 31 December Liabilities
2019Rs. ’000
Notional amount
2019 Rs. ’000
Liabilities
2018Rs. ’000
Notional amount
2018 Rs. ’000
Interest rate derivativesInterest rate swaps – – 1,533 2,000,000
Total – – 1,533 2,000,000
34. Financial liabilities recognised through profit or loss
The Bank and the Group do not have instruments under the financial liabilities recognised through profit or loss.
35. Financial liabilities at amortised cost
Accounting policy
i. Due to depositorsDue to depositors include savings deposits and term deposits. Subsequent to initial recognition deposits are measured at their amortised cost using EIR method. Interest paid/payable on deposits are recognised in the Income Statement under interest expense.
ii. Securities sold under repurchase agreements Securities sold under agreements to repurchase at a specified future date are not derecognised from the Statement of Financial Position as the Group retains substantially all the risks and rewards of ownership. The corresponding cash received is recognised in the Consolidated Statement of Financial Position as financial liability reflecting as a loan received by the Group, including accrued interest as a liability within “Securities sold under repurchase agreements”, reflecting the transaction’s economic substance. The difference between the sale and repurchase prices is treated as interest expenses and is accrued over the life of agreement using the EIR.
Bank Group
As at 31 December 2019Rs. ’000
2018Rs. ’000
2019Rs. ’000
2018Rs. ’000
Due to depositors 1,016,574,286 839,574,411 1,015,635,421 839,574,411Due to debt securities holders – – – –Due to other borrowers 21,203,242 14,804,802 32,808,023 21,750,178
Total 1,037,777,528 854,379,213 1,048,443,444 861,324,589

Governance Financial Reports Supplementary Information
369Annual Report 2019 │ National Savings BankNotes to the Financial Statements
35. Financial liabilities at amortised cost (contd.)35.1 Analysis of amount due to depositors35.1 (a) By product
Bank Group
As at 31 December 2019Rs. ’000
2018Rs. ’000
2019Rs. ’000
2018Rs. ’000
Savings deposits 218,550,833 198,321,926 219,130,009 198,321,926Fixed deposits 798,023,453 641,252,485 796,505,412 641,252,485
Total 1,016,574,286 839,574,411 1,015,635,421 839,574,411
35.1 (b) By currency
Bank Group
As at 31 December 2019Rs. ’000
2018Rs. ’000
2019Rs. ’000
2018Rs. ’000
Sri Lankan Rupee 1,004,709,134 828,694,912 1,003,770,269 828,694,912United State Dollar 8,449,477 7,341,154 8,449,477 7,341,154Euro 1,323,498 1,314,681 1,323,498 1,314,681Great Britain Pound 1,139,598 1,195,739 1,139,598 1,195,739Australian Dollar 951,798 1,027,574 951,798 1,027,574Japanese Yen 781 351 781 351
Total 1,016,574,286 839,574,411 1,015,635,421 839,574,411
36. Lease liability
Accounting policy
Initial measurement of lease liabilityThe lease liability is initially measured at the present value of the future lease rentals over the remaining lease period at commencement date.
Subsequent measurement of lease liabilityThe lease liability subsequently measure by increasing with the lease interest and reducing with the lease payments.
Discount rateThe discount rate applied to determine the present value of future rentals was the Treasury Bond Rates for periods which are similar to lease periods published by the Central Bank. The period of the Treasury Bond is identical to lease tenure. If the Treasury Bond Rate is not available for the applicable tenure, the rate of the tenure which is lower than the lease tenure applied.

Governance Financial Reports Supplementary Information
370 National Savings Bank │ Annual Report 2019 Notes to the Financial Statements
36. (a) Lease liability
Bank Group
As at 31 December 2019Rs. ’000
2018Rs. ’000
2019Rs. ’000
2018Rs. ’000
Opening balance – – – –Acquisition through business combinations – – 15,772Addition during the year 1,232,152 – 1,272,874 –Lease interest for the year 94,343 – 95,106 –Less: Paid during the year (259,613) – (262,311) –
Closing balance 1,066,882 – 1,121,441 –
36. (b) Maturity analysis – Lease liability
Bank Group
As at 31 December 2019Rs. ’000
2018Rs. ’000
2019Rs. ’000
2018Rs. ’000
Amount payable within one year 174,892 – 188,079 –Amount payable within one to three years 330,776 – 349,438 –Amount payable within three to five years 224,533 – 232,241 –Amount payable after five years 336,681 – 351,683 –
Total 1,066,882 – 1,121,441 –
37. Debt securities issued
Bank Group
As at 31 December 2019Rs. ’000
2018Rs. ’000
2019Rs. ’000
2018Rs. ’000
Issued by the BankSenior notes issued (Note 37.1) – 46,382,722 – 46,382,722Subordinated liabilities (Note 37.2) 6,006,411 6,006,411 6,006,411 6,006,411Debentures (Note 37.3) 20,685,300 – 20,685,300 –
Issued by other subsidiariesUnsecured subordinated debentures – – 263,986 –
Total 26,691,711 52,389,133 26,955,697 52,389,133
Due within 1 year 691,711 46,389,133 767,172 46,389,133Due after 1 year 26,000,000 6,000,000 26,188,525 6,000,000
Total 26,691,711 52,389,133 26,955,697 52,389,133

Governance Financial Reports Supplementary Information
371Annual Report 2019 │ National Savings BankNotes to the Financial Statements
37. Debt securities issued (contd.)37.1 Senior notes issued
Accounting policy
These represent the funds borrowed by the Bank for long-term funding requirement. It consists of borrowings through international bonds (USD denominated). Subsequent to initial recognition debt securities issued are measured at their amortised cost using EIR method. Interest paid/payable is recognised in profit or loss.
Foreign currency denominated debt securities as at the reporting date are translated to the functional currency at the middle exchange rate of the functional currency at that date. Foreign currency differences arising on retranslation at the reporting date are recognised in profit or loss.
Effective annual yield
Bank Group
Category Face value Issuedrate
%
Repaymentterms
Issue date Maturitydate
2019
%
2018
%
2019
Rs. ’000
2018
Rs. ’000
2018
Rs. ’000
2018
Rs. ’000
Issued by the Bank250 Mn. US Dollar senior note
USD 250 Mn. 5.150 At maturity 10September
2014
10September
2019
– 5.21 – 46,382,722 – 46,382,722
Total – 46,382,722 – 46,382,722
37.2 Subordinated liabilities
Accounting policy
These represent the funds borrowed by the Group for long term funding requirements. Subsequent to initial recognition these are measured at their amortised cost using the EIR method, except where the Group designates them at fair value through profit or loss. Interest paid/payable is recognised in profit or loss.
Primary objective of issuing debenture is to increase the capital of the bank in order to enhance the Capital Adequacy Ratio and reduce the maturity mismatch between the asset and liability portfolio of the bank.
The Bank intends to utilize the entire proceeds of the issue to expand its asset base in the ordinary course of business.
Outstanding subordinated liabilities of the Bank as at December 31, 2019 consisted of Rs. 6,000,000,000 Rated, Unsecured Subordinated and Redeemable debentures of Rs. 100/- issued on 29 December 2016 as Private Placement under the provision of the NSB Act No. 30 of 1971. NSB Fund Management Co. Ltd. is act as Trustee for this debenture issue. The debenture carry AA+(lka) rating from the Fitch Rating Lanka.
Effective annual yield
Bank Group
Category Face value
Rs. ’000
Interestrate
%
Repaymentterms
Issue date Maturitydate
2019
%
2018
%
2019
Rs. ’000
2018
Rs. ’000
2018
Rs. ’000
2018
Rs. ’000
Issued by the BankFixed Rate – 13% 6,000,000 13 p.a. Semi-
annually29
December2016
29December
2021
13.42 13.42 6,000,000 6,000,000 6,000,000 6,000,000
Interest payable 6,411 6,411 6,411 6,411
Total 6,006,411 6,006,411 6,006,411 6,006,411
In the event of the winding-up of the issuer, the above liabilities would be subordinated to the claims of depositors and all other creditors of the issuer.

Governance Financial Reports Supplementary Information
372 National Savings Bank │ Annual Report 2019 Notes to the Financial Statements
37. Debt securities issued (contd.)37.3 Debentures
Accounting policy
These represent the funds borrowed by the Group for long term funding requirements. Subsequent to initial recognition these are measured at their amortised cost using the EIR method, except where the Group designates them at fair value through profit or loss. Interest paid/payable is recognised in profit or loss. The objective of the issue of the Debenture is to part finance the funding requirement of unwinding the USD/LKR Swap agreement with Central Bank of Sri Lanka.
Outstanding debenture of the Bank as at December 31, 2019 consisted of Rs. 20 Bn. unlisted Rated, Senior Unsecured Redeemable debentures of Rs. 100/- issued on 28 August 2019 as Private Placement under the provision of the NSB Act No. 30 of 1971. NSB Fund Management Co. Ltd. is act as Trustee for this debenture issue. The debenture carry (SL) AAA (Stable) rating from the ICRA Lanka.
Effective annual yield
Bank Group
Category Face value
Rs. ’000
Interestrate
%
Repaymentterms
Issue date Maturitydate
2019
%
2018
%
2019
Rs. ’000
2018
Rs. ’000
2018
Rs. ’000
2018
Rs. ’000
Issued by the BankFixed Rate – 3 year 13,677,000 11 p.a. Annually 10
September2019
10September
2022
11.00 – 13,677,000 – 13,677,000 –
Fixed Rate – 5 year 6,323,000 11.25 p.a. Annually 10September
2019
10September
2024
11.25 – 6,323,000 – 6,323,000 –
Interest payable 685,300 – 685,300 –
Total 20,685,300 – 20,685,300 –
38. Retirement benefit obligations
Accounting policy
The unfunded past service cost is recognised in Other Comprehensive Income immediately upon actuarial valuation.
Bank Group
As at 31 December 2019Rs. ’000
2018Rs. ’000
2019Rs. ’000
2018Rs. ’000
Provision for Pension Scheme I [Note 38. (a) 1] 4,681,606 2,596,088 4,681,606 2,596,088Provision for Pension Scheme II [Note 38. (a) 2] 87,155 – 87,155 –Provision for Medical Assistance Scheme [Note 38. (a) 3] 1,739,946 1,234,707 1,739,946 1,234,707Provision for gratuity [Note 38. (a) 4] – – 27,980 1,982
Total 6,508,707 3,830,795 6,536,687 3,832,777

Governance Financial Reports Supplementary Information
373Annual Report 2019 │ National Savings BankNotes to the Financial Statements
38. Retirement benefit obligations (contd.)38. (a) Defined benefit plans
The Bank has two separate pension schemes established, Pension Scheme I for permanent employees joined before 1 October 1995 and Pension Scheme II for permanent employees joined on or after 1 October 1995 and a medical assistance scheme for retired employees.
The assets of these schemes are held independently of the Bank’s assets and administered by Boards of Trustees/Managers, representing the Management and the employees, as provided in the trust deed/rules of the respective funds.
All the funds are subject to annual audits independent to the audit of the Bank, by a firm of Chartered Accountants appointed by the members and actuarial valuations are carried out at least once in every two years, as per the rules governing these funds.
38. (a) 1 National Savings Bank Employees’ Pension Scheme I
Pension Scheme I
An actuarial valuation of the Pension Scheme I was carried out as at 31 December 2019 by Mr M Poopalanathan, AIA, of Messrs Actuarial & Management Consultants (Pvt) Ltd., a firm of professional Actuaries, on 31 December 2019.
Projected Unit Credit Method was used to allocate the actuarial present value of the projected benefits earned by employees to date of 31 December 2019.
Bank Group
2019Rs. ’000
2018Rs. ’000
2019Rs. ’000
2018Rs. ’000
(a) Net asset/(liability) recognised in Statement of Financial PositionPresent value of defined benefit obligation (18,209,182) (16,184,005) (18,209,182) (16,184,005)Fair value of plan assets 13,527,576 13,587,917 13,527,576 13,587,917
Total (4,681,606) (2,596,088) (4,681,606) (2,596,088)
(b) Amount recognised in Income StatementCurrent service cost 88,952 117,515 88,952 117,515Interest cost on benefit obligation 311,531 405,421 311,531 405,421
Net benefit expense 400,483 522,936 400,483 522,936
(c) Amount recognised in Other Comprehensive Income (OCI)Experience (gain)/loss 664,380 801,418 664,380 801,418(Gain)/loss due to changes in assumptions 1,170,697 (1,105,366) 1,170,697 (1,105,366)Actuarial gain/(loss) on plan assets 250,441 149,435 250,441 149,435Difference in interest income on plan assets – – – –
Total 2,085,518 (154,513) 2,085,518 (154,513)
(d) Changes in fair value of plan assets are as follows:Opening fair value of plan assets 13,587,917 13,552,607 13,587,917 13,552,607Expected return on plan assets 1,630,550 1,387,932 1,630,550 1,387,932Actual employer contribution 400,483 522,936 400,483 522,936Benefits paid (1,840,933) (1,726,123) (1,840,933) (1,726,123)Actuarial gain/(loss) on plan assets (250,441) (149,435) (250,441) (149,435)
Closing fair value of plan assets 13,527,576 13,587,917 13,527,576 13,587,917

Governance Financial Reports Supplementary Information
374 National Savings Bank │ Annual Report 2019 Notes to the Financial Statements
38. Retirement benefit obligations (contd.)38. (a) Defined benefit plans (contd.)38. (a) 1 National Savings Bank Employees’ Pension Scheme I (contd.)
Bank Group
2019Rs. ’000
2018Rs. ’000
2019Rs. ’000
2018Rs. ’000
(e) Changes in present value of defined benefit obligation are as follows:Opening defined benefit obligation 16,184,005 16,303,208 16,184,005 16,303,208Interest cost 1,942,081 1,793,353 1,942,081 1,793,353Current service cost 88,952 117,515 88,952 117,515Benefits paid (1,840,933) (1,726,123) (1,840,933) (1,726,123)(Gain)/loss due to changes in assumptions 1,170,697 (1,105,366) 1,170,697 (1,105,366)Actuarial (gain)/loss on obligation 664,380 801,418 664,380 801,418
Closing defined benefit obligation 18,209,182 16,184,005 18,209,182 16,184,005
(f) Plan assets consists of followings:Treasury Bonds 6,513,697 6,918,796 6,513,697 6,918,796Commercial paper 147,891 – 147,891 –Fixed deposits 400,019 501,333 400,019 501,333Securities purchased under resale agreements 186,636 139,087 186,636 139,087Debentures 5,677,233 5,816,455 5,677,233 5,816,455Trust certificates 203,048 103,063 203,048 103,063Cash at Bank 34,653 82 34,653 82
Other assets 364,399 109,101 364,399 109,101
Total 13,527,576 13,587,917 13,527,576 13,587,917
Bank & Group
2019Rs. ’000
(g) Maturity profile of defined benefit obligation – present value of expected accrued benefit paymentsDistribution of present value of defined benefit obligation in future years Less than one year 1,914,651Between 1-2 years 3,336,179Between 3-5 years 4,017,986Between 6-10 years 4,511,347
Beyond 10 years 4,429,019
Total 18,209,182

Governance Financial Reports Supplementary Information
375Annual Report 2019 │ National Savings BankNotes to the Financial Statements
38. Retirement benefit obligations (contd.)38. (a) Defined benefit plans (contd.)38. (a) 1 National Savings Bank Employees’ Pension Scheme I (contd.)
Pension Scheme I2019
Pension Scheme I2018
(h) Actuarial assumptionFuture salary increment rate (%) 6.50 6.50Discount rate (%) 11.00 12.00Increase in future Cost of Living Allowance (COLA) (%) 4.50 4.50Mortality GA 1983 mortality table GA 1983 mortality tableRetirement age 60 years 57 yearsNormal form of payment Monthly Monthly
Turnover rate
Age 2019 %
2018 %
20 0.3 225 0.3 1.530 0.3 135 0.3 140 0.3 145 0.3 150 10.0 155 10.0 –
56 10.0 –
57 10.0 –
58 10.0 –
59 10.0 –
(i) Increase/decrease in the following assumptions will have an impact on the present value of defined benefit obligation as illustrated below:
Bank and Group 2019 Bank and Group 2018
Pension Scheme I Pension Scheme I
1% increase 1% decrease 1% increase 1% decrease
Future salary increment rate 18,279,812 18,141,628 16,239,064 16,131,138Discount rate 17,044,094 19,530,292 15,206,625 17,289,679

Governance Financial Reports Supplementary Information
376 National Savings Bank │ Annual Report 2019 Notes to the Financial Statements
38. Retirement benefit obligations (contd.)38. (a) Defined benefit plans (contd.)38. (a) 2 National Savings Bank Employees’ Pension Scheme II
An actuarial valuation of the Pension Scheme II was carried out as at 31 December 2019 by Mr M Poopalanathan, AIA, of Messrs Actuarial & Management Consultants (Pvt) Ltd., a firm of professional Actuaries, on 31 December 2019.
Projected Unit Credit Method was used to allocate the actuarial present value of the projected benefits earned by employees to date of 31 December 2019.
Bank Group
As at 31 December 2019Rs. ’000
2018Rs. ’000
2019Rs. ’000
2018Rs. ’000
(a) Net asset/(liability) recognised in Statement of Financial PositionPresent value of defined benefit obligation (3,013,446) (1,918,831) (3,013,446) (1,918,831)Fair value of plan assets 2,926,971 2,178,685 2,926,971 2,178,685Adjustment (680) 167 (680) 167
Total (87,155) 260,021 (87,155) 260,021
(b) Amount recognised in Income StatementCurrent service cost 295,440 172,533 295,440 172,533Interest cost on benefit obligation (31,183) (4,747) (31,183) (4,747)
FMC contribution (708) – – –
Net benefit expense 263,549 167,786 264,257 167,786
(c) Amount recognised in Other Comprehensive Income (OCI)Provision adjustment – – – –Experience (gain)/loss 79,048 463,865 79,048 463,865(Gain)/loss due to changes in assumptions 500,048 (355,768) 500,048 (355,768)Actuarial gain/(loss) on plan assets 31,114 (15,379) 31,114 (15,379)Difference in interest income on plan assets – – – –
610,210 92,718 610,210 92,718
(d) Changes in fair value of plan assets are as follows:Opening fair value of plan assets 2,178,685 1,527,607 2,178,685 1,527,607Expected return on plan assets 261,442 167,682 261,442 167,682Actual employer contribution 528,138 473,974 528,138 473,974Benefits paid (10,180) (5,957) (10,180) (5,957)Actuarial gain/(loss) on plan assets (31,114) 15,379 (31,114) 15,379
Closing fair value of plan assets 2,926,971 2,178,685 2,926,971 2,178,685

Governance Financial Reports Supplementary Information
377Annual Report 2019 │ National Savings BankNotes to the Financial Statements
38. Retirement benefit obligations (contd.)38. (a) Defined benefit plans (contd.)38. (a) 2 National Savings Bank Employee’s Pension Scheme II (contd.)
Bank Group
As at 31 December 2019Rs. ’000
2018Rs. ’000
2019Rs. ’000
2018Rs. ’000
(e) Changes in present value of defined benefit obligation are as follows:Opening defined benefit obligation 1,918,831 1,481,223 1,918,831 1,481,223Interest cost 230,259 162,935 230,259 162,935Current service cost 295,440 172,533 295,440 172,533Benefits paid (10,180) (5,957) (10,180) (5,957)(Gain)/loss due to changes in assumptions 500,048 (355,768) 500,048 (355,768)Actuarial (gain)/loss on obligation 79,048 463,865 79,048 463,865
Closing defined benefit obligation 3,013,446 1,918,831 3,013,446 1,918,831
(f) Plan assets consist of followings:Treasury Bonds 2,034,186 1,864,180 2,034,186 1,864,180Treasury Bills – 37,418 – 37,418Debentures 3,260 – 3,260 –Fixed deposits 900,481 225,867 900,481 225,867Securities purchased under resale agreements – 74,632 – 74,632Savings 83 56 83 56Other assets/(liabilities) (7,439) (23,468) (7,439) (23,468)
Total 2,930,571 2,178,685 2,930,571 2,178,685
Bank & Group
2019Rs. ’000
(g) Maturity profile of defined benefit obligation – present value of expected accrued benefit paymentsDistribution of present value of defined benefit obligation in future years Less than one year 15,559Between 1-2 years 44,388Between 3-5 years 93,334Between 6-10 years 263,794
Beyond 10 years 2,596,371
Total 3,013,446

Governance Financial Reports Supplementary Information
378 National Savings Bank │ Annual Report 2019 Notes to the Financial Statements
Pension Scheme I2019
Pension Scheme I2018
(h) Actuarial assumptionFuture salary increment rate (%) 6.50 6.50Discount rate (%) 11.00 12.00Increase in future Cost of Living Allowance (COLA) (%) 4.50 4.50Mortality GA 1983 mortality table GA 1983 mortality tableRetirement age 60 years 57 yearsNormal form of payment Monthly Monthly
Turnover rate
Age 2019 %
2018 %
20 0.3 225 0.3 1.530 0.3 135 0.3 140 0.3 145 0.3 150 10.0 155 10.0 –
56 10.0 –
57 10.0 –
58 10.0 –
59 10.0 –
(i) Increase/decrease in the following assumptions will have an impact on the present value of defined benefit obligation as illustrated below:
Bank and Group
2019 2018
1% increase 1% decrease 1% increase 1% decrease
Future salary increment rate 3,367,065 2,719,816 2,153,504 1,718,957Discount rate 2,425,873 3,796,297 1,636,760 2,274,599
38. (a) 3 Medical Assistance Scheme for the Retired Employees of NSB
An actuarial valuation of the Medical Assistance Scheme for the Retired Employees was carried out as at 31 December 2019 by Mr M Poopalanathan, AIA, of Messrs Actuarial & Management Consultants (Pvt) Ltd., a firm of professional Actuaries, on 31 December 2019.
Projected Unit Credit Method was used to allocate the actuarial present value of the projected benefits earned by employees to date of 31 December 2019.

Governance Financial Reports Supplementary Information
379Annual Report 2019 │ National Savings BankNotes to the Financial Statements
38. Retirement benefit obligations (contd.)38. (a) Defined benefit plans (contd.)38. (a) 3 Medical Assistance Scheme for the Retired Employees of NSB (contd.)
As at 31 December 2019Rs. ’000
2018Rs. ’000
(a) Net asset/(liability) recognised in Statement of Financial PositionPresent value of defined benefit obligation (2,540,783) (1,523,918)Fair value of plan assets 800,837 289,211
Total (1,739,946) (1,234,707)
(b) Amount recognised in Income StatementCurrent service cost 39,269 24,475Interest cost on benefit obligation 148,165 111,195
Net benefit expense 187,434 135,670
(c) Amount recognised in Other Comprehensive Income (OCI) Provision adjustment – (28,608)Experience (gain)/loss 858,204 467,826(Gain)/loss due to changes in assumptions 151,996 (132,004)Actuarial gain/(loss) on plan assets 8,637 (10,960)Contribution from employees (13,598) (8,688)
Total 1,005,239 287,565
(d) Changes in fair value of plan assets are as follows:Opening fair value of plan assets 289,211 283,336Expected return on plan assets 34,705 21,010Actual employer contribution 687,434 135,670Actual participants’ contribution 13,598 8,688Benefits paid (215,474) (170,454)Actuarial gain/(loss) on plan assets (8,637) 10,960
Closing fair value of plan assets 800,837 289,211
(e) Changes in present value of defined benefit obligation are as follows:Opening defined benefit obligation 1,523,918 1,230,477Provision adjustment – (28,608)Interest cost 182,870 132,206Current service cost 39,269 24,475Benefits paid (215,474) (170,454)(Gain)/loss due to changes in assumptions 151,996 (132,004)Actuarial (gain)/loss on obligation 858,204 467,826
Closing defined benefit obligation 2,540,783 1,523,918

Governance Financial Reports Supplementary Information
380 National Savings Bank │ Annual Report 2019 Notes to the Financial Statements
38. Retirement benefit obligations (contd.)38. (a) Defined benefit plans (contd.)38. (a) 3 Medical Assistance Scheme for the Retired Employees of NSB (contd.)
As at 31 December 2019Rs. ’000
2018Rs. ’000
(f) Plan assets consists of followings:Treasury Bonds 191,143 214,229Commercial paper 100,000 –Fixed deposits 329,669 73,275Securities purchased under resale agreements 100 10,075Trust certificate 208,734 31,666Savings 50 51Other payable (28,859) (40,084)
Total 800,837 289,211
Bank and Group
2019Rs. ’000
(g) Maturity profile of defined benefit obligation – present value of expected accrued benefit paymentsDistribution of present value of defined benefit obligation in future years Less than one year 197,580Between 1-2 years 363,232Between 3-5 years 465,189Between 6-10 years 584,812
Beyond 10 years 929,970
Total 2,540,783
2019%
2018%
(h) Actuarial assumptionMedical cost inflation rate 5.00 5.00Discount rate 11.00 12.00
Bank and Group
20191% increase 1% decrease
(i) Increase/decrease in the following assumptions will have an impact on the present value of defined benefit obligation as illustrated below :Medical cost escalation rate 2,832,377 2,719,816 Discount rate 2,320,495 2,294,480

Governance Financial Reports Supplementary Information
381Annual Report 2019 │ National Savings BankNotes to the Financial Statements
38. Retirement benefit obligations (contd.)38. (a) Defined benefit plans (contd.)38. (a) 4 Gratuity plan – Bank and Group
Bank
With the establishment of Pension Scheme II, employees who joined the Bank on or after 1 October 1995 have become members of the Pension Scheme II, thus are not entitle to the rights and privileges under Service Gratuity Scheme. However, where there are payment of termination gratuity before the entitlement pension of Bank recognise the expense on cash basis.
Group
The staff members of the subsidiary company is not entitled for pension scheme and hence they are continue to the members of Gratuity plan as per the Payment of Gratuity Act No. 12 of 1983.
Bank Group
As at 31 December 2019Rs. ’000
2018Rs. ’000
2019Rs. ’000
2018Rs. ’000
(a) Net benefit expense (recognised under personal expenses)Current service cost – – 275 202Interest cost on benefit obligation – – 3,150 149
Net benefit expense – – 3,425 351
(b) Provision for gratuityDefined benefit obligation as at 1 January – – 1,982 1,234Acquisition through business combinations – – 21,195 –Interest cost – – 3,150 149Current service cost – – 275 202Benefits paid – – – –Actuarial (gain)/loss on obligation (recognised in OCI) – – 1,378 397
Defined benefit obligation as at 31 December – – 27,980 1,982
FMC SLSB
2019%
2018%
2019%
(c) Actuarial assumptionFuture salary increment rate 8.33 8.33 20Discount rate 10.44 12.11 11Mortality – – A67/70

Governance Financial Reports Supplementary Information
382 National Savings Bank │ Annual Report 2019 Notes to the Financial Statements
38. Retirement benefit obligations (contd.)38. (a) Defined benefit plans (contd.)38. (a) 4 Gratuity plan – Bank and Group (contd.)
FMC – 2019
Staff turnover rate and average future working lifetimeAge group 30-34 35-39 40<Staff turnover rate – % 0 0 0Average future working lifetime – years 30 23 16
(d) Increase/decrease in the following assumptions will have an impact on the present value of defined benefit obligation as illustrated below:
Values appearing in the Financial Statements are very sensitive to the changes in financial and non-financial assumptions used.A sensitivity was carried out as follows:
FMC
2019 2018
1% increase 1% decrease 1% increase 1% decrease
Future salary increment rate 511 (433) 349 (295)Discount rate (422) 505 (284) 296
AssumptionsFinancial assumptions – Rate of discount, salary increment rateDemographic assumptions – Mortality, staff turn over, disability, retirement age
39. Current tax liabilities
Bank Group
As at 31 December 2019Rs. ’000
2018Rs. ’000
2019Rs. ’000
2018Rs. ’000
Balance as at 1 January – – (27,862) 137,344Acquisition through business combinations – – 418,858 –Charge for the year – – 297,664 2,991Payment during the year – – (122,956) (168,197)
Balance as at 31 December – – 565,704 (27,862)
Note: Current tax asset classified in other assets.
40. Other provisions
No value to be disclosed under other provisions.

Governance Financial Reports Supplementary Information
383Annual Report 2019 │ National Savings BankNotes to the Financial Statements
41. Other liabilities
Accounting policy
Other liabilities include provisions made in account of interests, fees and expenses, pensions, leave encashment and other expenses. These liabilities are recorded at amounts expected to be payable at reporting date.
Bank Group
As at 31 December 2019Rs. ’000
2018Rs. ’000
2019Rs. ’000
2018Rs. ’000
Sundry creditors 250,968 172,333 262,268 172,333Salary related payable 1,229,896 935,974 1,230,102 935,974Other tax payable 839,093 646,009 843,348 646,009Other payables 3,631,507 3,692,960 5,094,697 3,698,001
Total 5,951,464 5,447,277 7,430,415 5,452,317
42. Due to subsidiaries
Bank Group
As at 31 December 2019Rs. ’000
2018Rs. ’000
2019Rs. ’000
2018Rs. ’000
Payable to FMC 547 750 – –
Total 547 750 – –
Note: Refer Note 49.3 – Related party transactions on page 390.
43. Stated capital/Assigned capital
Bank Group
As at 31 December 2019Rs. ’000
2018Rs. ’000
2019Rs. ’000
2018Rs. ’000
Authorised One billion ordinary shares of Rs. 10.00 each as at 1 January 10,000,000 10,000,000 10,000,000 10,000,000
Balance as at 1 January (issued and fully paid)940 Mn. ordinary shares of Rs. 10.00 each 9,400,000 6,700,000 9,400,000 6,700,000
Issue of ordinary shares during the year – 2,700,000 – 2,700,000Total 9,400,000 9,400,000 9,400,000 9,400,000

Governance Financial Reports Supplementary Information
384 National Savings Bank │ Annual Report 2019 Notes to the Financial Statements
44. Statutory reserve fund
The statutory reserve fund is maintained as per the requirements under Section 20 (1) of the Banking Act No. 30 of 1988. Accordingly, the fund is built up by allocating a sum equivalent to not less than 5% of the profit after tax, but before declaring any dividend or any profit that are transferred to elsewhere until the reserve is equal to 50% of the Bank’s stated capital and thereafter sum equivalent to 2% of such profit until the amount of said reserve fund is equal to the stated capital of the Bank.
The balance in the statutory reserve fund will be used only for the purposes specified in the Section 20 (2) of the Banking Act No. 30 of 1988.
Bank Group
As at 31 December 2019Rs. ’000
2018Rs. ’000
2019Rs. ’000
2018Rs. ’000
Opening balance 3,227,960 3,002,952 3,227,960 3,002,952Transfer during the period – 5% of profit after tax 334,912 225,008 343,254 225,008
Closing balance 3,562,872 3,227,960 3,571,214 3,227,960
45. Retained earnings
Bank Group
As at 31 December 2019Rs. ’000
2018Rs. ’000
2019Rs. ’000
2018Rs. ’000
Balance as at 1 January 3,984,674 1,102,798 4,561,045 1,679,540Prior years Adjustment/PYA (refer Note 53) – (637,406) – (637,406)Impact of adopting SLFRS 16 (115,604) – (115,604) –Restated opening balance under SLFRS 16 and PYA 3,869,070 465,392 4,445,441 1,042,134Profit for the year 6,698,233 4,500,151 9,029,972 4,500,187Other comprehensive income (3,700,967) (210,861) (3,702,344) (211,258)Transfers to other reserves (334,912) (225,008) (472,106) (225,016)Contribution to National Insurance Trust Fund (66,982) (45,002) (66,982) (45,002)Dividend/levy (2,000,000) (500,000) (2,000,000) (500,000)Balance as at 31 December 4,464,442 3,984,674 7,233,981 4,561,045
46. Other reservesBank 2019
Opening balance at 1 January 2019
Rs. ’000
Movement/transfersRs. ’000
Closing balance at31 December 2019
Rs. ’000
General reserve 17,740,879 – 17,740,879Revaluation reserve 7,793,317 – 7,793,317OCI reserve 528,430 (210,424) 318,006Cash flow hedging reserve – – –Foreign currency translation reserve – – –Other reserves (refer Notes 46.1 and 46.2) 419,999 677,811 1,097,810
Total 26,482,625 467,386 26,950,010

Governance Financial Reports Supplementary Information
385Annual Report 2019 │ National Savings BankNotes to the Financial Statements
46. Other reserves (contd.)
Bank 2018
Opening balance at 1 January 2018
Rs. ’000
Movement/transfersRs. ’000
Closing balance at31 December 2018
Rs. ’000
General reserve 17,740,879 – 17,740,879Revaluation reserve 7,793,317 – 7,793,317OCI reserve 1,345,237 (816,806) 528,430Cash flow hedging reserve 291,924 (291,924) –Foreign currency translation reserve – – –Other reserves (refer Notes 46.1 and 46.2) 1,118,586 (698,587) 419,999
Total 28,289,941 (1,807,316) 26,482,625
Group 2019
Opening balance at 1 January 2019
Rs. ’000
Movement/transfersRs. ’000
Closing balance at31 December 2019
Rs. ’000
General reserve 17,740,879 – 17,740,879Revaluation reserve 7,793,317 – 7,793,317OCI reserve 390,211 (106,709) 283,502Cash flow hedging reserve – – –Foreign currency translation reserve – – –Other reserves (refer Notes 46.1, 46.2 and 46.3) 1,004,668 806,663 1,811,331
Total 26,929,074 699,954 27,629,027
Group 2018
Opening balance at 1 January 2018
Rs. ’000
Movement/transfersRs. ’000
Closing balance at31 December 2018
Rs. ’000
General reserve 17,740,879 – 17,740,879Revaluation reserve 7,793,317 – 7,793,317OCI reserve 1,228,420 (838,210) 390,211Cash flow hedging reserve 291,924 (291,924) –Foreign currency translation reserve – – –Other reserves (refer Notes 46.1, 46.2 and 46.3) 1,703,246 (698,578) 1,004,668
Total 28,757,784 (1,828,712) 26,929,074

Governance Financial Reports Supplementary Information
386 National Savings Bank │ Annual Report 2019 Notes to the Financial Statements
46. Other reserves (contd.)46.1 Unclaimed deposit reserve
Bank Group
As at 31 December 2019Rs. ’000
2018Rs. ’000
2019Rs. ’000
2018Rs. ’000
Opening balance 417,815 1,116,401 417,815 1,116,401Transferred to share capital – (2,700,000) – (2,700,000)Transferred during the year 677,811 2,001,414 677,811 2,001,414
Closing balance 1,095,626 417,815 1,095,626 417,815
In terms of the Section 47 of the National Savings Bank Act No. 30 of 1971 as amended by the Section 30 of the National Savings Bank (Amendment) Act No. 28 of 1995, where an amount lain dormant in a savings or deposit account for a period of ten years, it should be transferred to Unclaimed Deposit Reserve. Accordingly, amount transferred (net) to the reserve during the year 2019, was Rs. 677.8 Mn.
46.2 Special reserve
Bank Group
As at 31 December 2019Rs. ’000
2018Rs. ’000
2019Rs. ’000
2018Rs. ’000
Opening balance 2,184 2,185 2,184 2,185Transferred during the year – (1) – (1)
Closing balance 2,184 2,184 2,184 2,184
The special reserve represents the amount transferred from the dormant accounts of customers where the aggregate of the amount dormant is less than Rs. 10.00 (Ten rupees).
The whole or such part of the monies lying to the credit of “Special Reserve” and “Unclaimed Deposit Reserve” may be capitalised and shares to the value of money capitalised may be issued in the name of Secretary to the Treasury. The entirety of the issue and fully-paid share capital of Rs. 9,400 Mn. reflected in the Statement of Financial Position was issued by capitalising the unclaimed deposit reserve time to time.
46.3 Special risk reserve – (NSB Fund Management Company Limited)
Bank Group
As at 31 December 2019Rs. ’000
2018Rs. ’000
2019Rs. ’000
2018Rs. ’000
Opening balance – – 584,669 584,660Transferred during the year – 25% of profit after tax – – 128,852 9
Closing balance – – 713,521 584,669

Governance Financial Reports Supplementary Information
387Annual Report 2019 │ National Savings BankNotes to the Financial Statements
46. Other reserves (contd.)46.3 Special risk reserve – (NSB Fund Management Company Limited) (contd.)
In order to promote the safety, soundness and the stability of the primary dealer (PD) system and to build up PD capital base, primary dealers (PDs) are required to annually transfer a percentage of their profit after tax to a special risk reserve as follows, with effect from 1 July 2004.
I. 50% of the profit after tax annually by the PDs who maintain capital funds less than Rs. 400 Mn.
II. 25% of the profit after tax annually by the PDs who maintain capital funds in excess of Rs. 400 Mn.
Bank Group
As at 31 December 2019Rs. ’000
2018Rs. ’000
2019Rs. ’000
2018Rs. ’000
Other reserves
Total other reserves 1,097,810 419,999 1,811,331 1,004,668
47. Non-controlling interest
Bank has two fully own subsidiaries. Therefore no values to be disclosed under Non-controlling Interest.
48. Contingent liabilities and commitments
Accounting policy
Contingent liabilities are possible obligations whose existence will be confirmed only by uncertain future event or present obligation where the transfer of economic benefit is not probable or cannot be reliably measured as defined in the Sri Lanka Accounting Standard – LKAS 37 on “Provisions, Contingent Liabilities and Contingent Assets”.
To meet the financial needs of customers, the Bank enters into various irrevocable commitments and contingent liabilities. These consist of finance guarantees, letters of credit and other undrawn commitments to lend. Letters of credit and guarantees commit the Bank to make payments on behalf of customers in the event of a specific act, generally related to the import or export of goods. Guarantees and standby letters of credit carry a similar credit risk to loans.
Contingent liabilities are not recognised in the Statement of Financial Position but are disclosed unless its occurrence is remote.
Bank Group
As at 31 December 2019Rs. ’000
2018Rs. ’000
2019Rs. ’000
2018Rs. ’000
CommitmentsCommitment for unutilised credit facilities 5,108,362 1,579,548 5,120,152 1,579,548Other commitments indirect credit facilities 718,367 57,525 718,367 57,525Capital commitments (Note 48.1) 2,298,887 678,624 2,614,452 678,624
8,125,616 2,315,697 8,452,971 2,315,697
Contingent liabilitiesDocumentary credit 277,056 277,937 286,106 277,937Guarantees 1,952,525 1,887,763 1,952,525 1,887,763
2,229,581 2,165,700 2,238,631 2,165,700
Total commitment and contingencies 10,355,197 4,481,397 10,691,602 4,481,397

Governance Financial Reports Supplementary Information
388 National Savings Bank │ Annual Report 2019 Notes to the Financial Statements
48. Contingent liabilities and commitments (contd.)48.1 Capital commitments
Capital expenditure approved by the Board of Directors, for which provisions have not been made in the Financial Statements are detailed below:
Bank Group
As at 31 December 2019Rs. ’000
2018Rs. ’000
2019Rs. ’000
2018Rs. ’000
Approved and contracted for 2,292,887 498,624 2,608,452 498,624Approved but not contracted for 6,000 180,000 6,000 180,000
2,298,887 678,624 2,614,452 678,624
49. Related party disclosures
Accounting policy
The Bank carried out transactions in the ordinary course of business on an arm’s length basis at commercial rates with parties who are defined as related parties as per the Sri Lanka Accounting Standard – LKAS 24 on “Related Party Disclosures” i.e. Government of Sri Lanka, subsidiaries, post employment benefit plans for the Bank’s employees, Key Management Personnel (KMPs). Those transactions include lending activities, placements, off-balance sheet transactions and provision of other banking and financial services that are carried out in the ordinary course of business on an arm’s length basis at commercial rates, other than, transactions that the Key Management Personnel (KMP) have availed under schemes uniformly applicable to all staff at concessionary rates. Particulars of transactions with related parties are tabulated below.
49.1 Parent and ultimate controlling party
National Savings Bank is a Government owned bank.
49.2 Transactions with Government of Sri Lanka (Parent) and state controlled entities
The financial dealings carried out with the Government of Sri Lanka and state controlled entities for the year are disclosed below.

Governance Financial Reports Supplementary Information
389Annual Report 2019 │ National Savings BankNotes to the Financial Statements
49. Related party disclosures (contd.)49.2 Transactions with Government of Sri Lanka (Parent) and state controlled entities (contd.)49.2.1 Transactions which are collectively significant
Bank Group
As at 31 December 2019Rs. ’000
2018Rs. ’000
2019Rs. ’000
2018Rs. ’000
AssetsLoans to Government 2,075,000 2,075,000 2,075,000 2,075,000Investments made on Government Securities 612,724,627 523,205,915 628,082,735 538,670,193Investments on state and state-controlled entities 151,791,144 148,027,411 151,791,144 148,027,411Securities purchased under resale agreements 795,713 1,432,088 795,713 1,432,088Tax receivable (notional tax) 2,695,348 5,761,291 2,695,348 5,769,803Postmaster-General’s current account 413,785 376,392 413,785 376,392Advance payment to Government 3,840,000 4,160,000 3,840,000 4,160,000Other receivables from Government 20,580,561 14,942,050 20,669,501 14,942,050Total 794,916,178 699,980,147 810,363,226 715,452,937
LiabilitiesSecurities sold under repurchase agreements 14,778,087 60,456,305 14,778,087 60,456,305
Commitment
Undrawn loan commitment 3,275,522 460,596 3,275,522 460,596
Taxes paidIncome tax 3,763,405 3,441,213 4,061,569 3,444,056Value added tax 3,045,921 2,577,657 3,208,584 2,584,220Nation building tax 366,157 343,688 383,614 344,563Debt repayment levy 1,785,171 308,371 1,803,225 308,371Contribution to consolidated fund – dividend/levy 2,000,000 500,000 2,000,000 500,000
Total 10,960,654 7,170,929 11,456,992 7,181,210
49.2.2 Transactions which are individually significant
Since Bank is Government owned entity, and as per NSB Act Bank should invest 60% of its deposit in Government Securities. Therefore Bank has significant transactions with GOSL in the day-to-day operation which are collectively represent on above. Individually significant transaction other than day-to-day operations is as follow:
01. Purchased 100% ownership of Sri Lanka Savings Bank from Treasury on behalf of Sri Lanka Government for a net consideration of Rs. 3.111 Bn. on 11 October 2019.

Governance Financial Reports Supplementary Information
390 National Savings Bank │ Annual Report 2019 Notes to the Financial Statements
49. Related party disclosures (contd.)49. 3 Transactions with subsidiary company (NSB Fund Management Company Limited)
The Bank has contributed Rs. 1,700 Mn. towards the share capital of the Company. The Company invested its funds in Treasury Bills, Treasury Bonds, and Repos during the year on a regular basis. All investment in Treasury Bills and Treasury Bonds of the Bank are being made through the NSB Fund Management Co. Ltd., on which a service charge of Rs. 42.6 Mn. has been made (Rs. 39.4 Mn. in 2018).
The Bank holds following balances with NSB Fund Management Company Ltd. at the reporting date.
Bank
As at 31 December 2019Rs. ’000
2018Rs. ’000
AssetsInter-company current account 9 41Securities purchased under resale agreement 1,300 –Other receivable 1,169 164
LiabilitiesOther payable 547 750
The above outstanding balances arose in the ordinary course of business and on substantially the same terms, including interest rates and security, as for comparable transactions with third-party counterparties. Particulars of income and expenses with related parties are tabulated below:
Bank
As at 31 December 2019Rs. ’000
2018Rs. ’000
IncomeRent income 1,758 1,874Interest income reverse repo 10,859 7,885
Total 12,617 9,759
ExpensesService charges 42,600 39,421RTGS charges 1,242 992Custodian fee 6,000 6,000Trustee fee 1,250 500Interest expenses on repo 23,521 46,105
Total 74,613 93,018

Governance Financial Reports Supplementary Information
391Annual Report 2019 │ National Savings BankNotes to the Financial Statements
49. Related party disclosures (contd.)49.4 Transactions with subsidiary company (Sri Lanka Savings Bank Limited)
The Sri Lanka Savings Bank Limited (SLSBL) was established in July 2006 under the Banking Act and incorporated under the provisions of the Companies Act. The Sri Lanka Savings Bank commenced business on 10 March 2008 as a state owned Licensed Specialised Bank. The Bank has acquired SLSBL as fully owned subsidiary by paying Rs. 3,111 Mn. on 11 October 2019. The CBSL has given special approval to acquisition.
The Bank holds following balances with Sri Lanka Savings Bank Limited at the reporting date.
Bank
As at 31 December 2019Rs. ’000
2018Rs. ’000
LiabilitiesSecurities sold under repurchase agreement 264,330 –Securities sold under repurchase agreement – Interest payables 1,564 –Due to depositors 1,947,270 –
Due to depositors – Interest payables 67,773 –
Total 2,280,937 –
The above outstanding balances arose in the ordinary course of business and on substantially the same terms, including interest rates and security, as for comparable transactions with third-party counterparties. Particulars of income and expenses with related parties are tabulated below:
Bank
For the year ended 31 December 2019Rs. ’000
2018Rs. ’000
ExpensesInterest expenses on securities sold under repurchase agreement 7,612 –Interest expenses on due to depositors 31,676 –Total 39,288 –
The above expenses are related to after acquisition date of 11 October 2019.

Governance Financial Reports Supplementary Information
392 National Savings Bank │ Annual Report 2019 Notes to the Financial Statements
49. Related party disclosures (contd.)49. 5 Transactions with key managerial persons49.5.1 Compensation to Key Management Personnel (KMPs)
As per the Sri Lanka Accounting Standard – LKAS 24 on “Related Party Disclosures”, the KMPs include those who are having authority and responsibility for planning, directing and controlling the activities of the Bank. Accordingly, Key managerial persons include members of the Board of Directors of the Bank and key employees of the Bank holding directorships in subsidiary, NSB Fund Management Company Ltd. Ex. Chairman’s, Directors’ GM/CEO’s and DGM’s.
Bank and Group
For the year ended 31 December 2019Rs. ’000
2018Rs. ’000
Compensation to KMPs of the BankShor-term employee benefit 99,717 94,840
Total 99,717 94,840
*In addition to the above, the Bank has also provided non-cash benefits to the KMP in line with the approved benefit plan of the Bank.
(iii) Chairman’s, Directors’ GM/CEO’s and DGMM’s emoluments and fees amounted to Rs. 99.72 Mn. in 2019. (Rs. 94.84 Mn. in 2018).
49.5.2 Transactions, arrangements, and agreements involving Key Management Personnel (KMPs)
Bank
As at 31 December 2019Rs. ’000
2018Rs. ’000
Assets
Loans and advances 73,494 80,358
49.5.3 Net accommodation granted to related parties
(Disclosure under Rule 3 (8) (ii) (e) of the Governance Direction of No. 12 of 2007 issued by the Central Bank of Sri Lanka).
Bank and Group
As at 31 December 2019Rs. ’000
2018Rs. ’000
Key Managerial PersonsLoan and advances 73,494 80,358Total net accommodation 73,494 80,358Regulatory capital 36,641,062 36,859,411
Net accommodation as a percentage of the Bank’s regulatory capital (%) 0.2 0.2

Governance Financial Reports Supplementary Information
393Annual Report 2019 │ National Savings BankNotes to the Financial Statements
49. Related party disclosures (contd.)49.6 Transactions with post-employment benefit plans of the Bank
Financial position transactions which were taken place between the Bank and Post-Employment Benefit Plans of the Bank as at the year end are summarised below:
The Bank holds following balances with Post-Employment Benefit Plans at the reporting date.
Bank Group
As at 31 December 2019Rs. ’000
2018Rs. ’000
2019Rs. ’000
2018Rs. ’000
Liabilities
National Savings Bank Employees’ Provident FundFixed deposits 155,000 186,800 155,000 186,800Securities purchased under resale agreements 47,805 – 47,805 –Debentures 325,000 125,000 325,000 125,000
National Savings Bank Employees’ Pension Scheme IFixed deposits 110,000 394,810 110,000 394,810Securities purchased under resale agreements 187,017 139,087 187,017 139,087Debentures 2,000,000 1,700,000 2,000,000 1,700,000
National Savings Bank Employees’ Pension Scheme IIFixed deposits 656,053 106,617 656,053 106,617Securities purchased under resale agreements 400 74,548 400 74,548
Medical Assistance Scheme for the Retired Employees of NSBFixed deposits 306,475 61,619 306,475 61,619Securities purchased under resale agreements 100 10,075 100 10,075
Widows’/Widowers’ and Orphans Pension FundFixed deposits 95,711 24,147 95,711 24,147Securities purchased under resale agreements – 11,100 – 11,100

Governance Financial Reports Supplementary Information
394 National Savings Bank │ Annual Report 2019 Notes to the Financial Statements
49. Related party disclosures (contd.)49.6 Transactions with post-employment benefit plans of the Bank (contd.)
Income statement transactions which were taken place between the Bank and post-employment benefit plans of the Bank as at the year end are summarised below in veiw of Bank:
Bank Group
For the year ended 31 December 2019Rs. ’000
2018Rs. ’000
2019Rs. ’000
2018Rs. ’000
Interest IncomeNational Savings Bank Employees’ Provident Fund 19,680 27,468 19,680 27,468National Savings Bank Employees’ Pension Scheme I 8,641 13,628 8,641 13,628National Savings Bank Employees’ Pension Scheme II 86 62 86 62Medical Assistance Scheme for the Retired Employees of NSB 11 44 11 44
Interest ExpensesNational Savings Bank Employees’ Provident Fund 38,077 17,426 38,077 17,426National Savings Bank Employees’ Pension Scheme I 271,732 232,218 271,732 232,218National Savings Bank Employees’ Pension Scheme II 30,895 10,129 30,895 10,129Medical Assistance Scheme for the Retired Employees of NSB 10,586 5,210 10,586 5,210Widows’/Widowers’ and Orphans Pension Fund 2,705 1,011 2,705 1,011
49. 7 Due from other related parties
Bank Group
As at 31 December 2019Rs. ’000
2018Rs. ’000
2019Rs. ’000
2018Rs. ’000
Securities purchased under resale agreements – Entrust Securities PLC 19,063 38,910 19,063 38,910Receivable from Entrust Securities PLC 859,160 153,596 859,160 153,596
Total 878,223 192,506 878,223 192,506
49. 8 Due to other related parties
Bank Group
As at 31 December 2019Rs. ’000
2018Rs. ’000
2019Rs. ’000
2018Rs. ’000
Other Payable – Entrust Securities PLC 734,788 716,608 734,788 716,608Securities sold under repurchase agreements – Entrust Securities PLC – – 357,755 208,790
Total 734,788 716,608 1,092,543 925,398

Governance Financial Reports Supplementary Information
395Annual Report 2019 │ National Savings BankNotes to the Financial Statements
50. Net assets value per ordinary share
Bank Group
As at 31 December 2019Rs. ’000
2018Rs. ’000
2019Rs. ’000
2018Rs. ’000
Amount used as the numeratorShareholders’ funds 44,377,324 43,095,259 47,834,222 44,118,079Number of ordinary share used as the denominatorTotal number of shares 940,000 940,000 940,000 940,000
Net assets value per ordinary share (Rs.) 47.21 45.85 50.89 46.93
51. Litigation against the Bank and the Group
Litigation is a common occurrence in the banking industry due to the nature of the business. The Bank has an established protocol for dealing with such legal claims. Once professional advice has been obtained on the certainty of the outcome and the amount of damages reasonably estimated, the Bank makes adjustments to account for any adverse effects which the claims may have on its financial standing. The unresolved court cases against the Bank as at the year end for which adjustments to the Financial Statements have not been made due to the uncertainty of its outcome are as follows.
Bank
As at 31 December 2019Number
2018Number
Tribunal/CourtLabour Tribunal 12 11Labour Commission 0 0Industrial Court 2 2Magistrate’s Court 5 4District Court 81 53High Court/Civil Appellate High Court/Provincial High Court 3 3Court of Appeal 2 5Supreme Court 1 1
52. Events occurring after the reporting date
Accounting policy
Events occurring after the reporting date are those events, both favourable and unfavourable, that occur between the reporting date and the date when the Financial Statements are authorised for issue.
Where necessary all material events after the reporting date have been considered and appropriate adjustments/disclosures have been made in the Financial Statements as per the LKAS 10 on “Events after the Reporting Period”.
No circumstances have arisen since the reporting date which would require adjustments to or disclosure in the Financial Statements.

Governance Financial Reports Supplementary Information
396 National Savings Bank │ Annual Report 2019 Notes to the Financial Statements
53. Comparative figures
The comparative information is reclassifed wherever necessary, to comply with current year’s classification in order to provide better presentation. There is no any reclassification other than followings prior years adjustment.
53.1 Prior years adjustment of the Bank
A sum of Rs. 637,405,736.50 has been deducted from the Retained Earnings and Loan and Advances (Pawning) in the financial position as a prior years adjustment and this represents overstated pawning interest in relation to the previous years prior to 1 January 2018. The detail is given below:
Bank
2018Rs. ’000Audited
Adjustment
Rs. ’000
2018Rs. ’000
Restated
AssetsFinancial assets at amortised cost – Loans and advances 423,532,145 (637,406) 422,894,740
EquitiesRetained earnings 4,622,080 (637,406) 3,984,674
Group
2018Rs. ’000Audited
Adjustment
Rs. ’000
2018Rs. ’000
Restated
AssetsFinancial assets at amortised cost – Loans and advances 423,557,119 (637,406) 422,919,713
EquitiesRetained earnings 5,198,451 (637,406) 4,561,045
54. Financial risk managementRisk management framework
Integrated risk management framework of NSB encompasses policies and procedures covering various risks, mechanism to identify such risks, and effective measures to manage and mitigate risks.
Risk Management Framework of the Bank begins with the oversight of the Board of Directors. It has set-up Board Integrated Risk Management Committee (BIRMC) to assist the Board of Directors in discharging its risk management responsibility. The Risk Management Division (RMD) independently reports to the Board through BIRMC. These Management Committees review regular reports from respective Business Divisions and RMD, to ensure adequacy and effectiveness of Bank’s risk management with meticulous focus.
The following Management Subcommittees, are responsible for the coordination of risk matters for each of the areas of risk management with meticulous focus:
z Operational Risk Management Committee z Asset and Liability Management Committee z Credit Committee z Investment Committee z IT steering Committee z Human Resource Committee

Governance Financial Reports Supplementary Information
397Annual Report 2019 │ National Savings BankNotes to the Financial Statements
z Branch Operation Steering Committee z Corporate Procurement Committee z Performance Review Committee z Marketing Committee z Corporate Management Committee
Internal Audit Division engages both regular and ad hoc reviews of risk management controls and procedures and the results are reported to the Board Audit Committee (BAC).
Broad risk categories in focusThe Bank is exposed to the following key risks from financial instruments:
54.1 Credit risk54.1.1 Credit quality analysis54.1.1 (a) Net exposure to credit risk by class of financial assets54.1.1 (b) Management of the credit portfolio54.1.1 (c) Credit quality (past due) by classes of financial assets54.1.1 (d) Credit quality by classes of financial asset – stage-wise
54.2 Liquidity risk54.2.1 Concentration of liquid assets54.2.2 Remaining contractual period to maturity 54.2.3 Financial assets available to support future funding
54.3 Market risk54.3.1 Market risk – trading and non-trading exposure54.3.2 Foreign exchange risk54.3.3 Equity risk54.3.4 Interest rate risk
54.4 Operational risk
54.1 Credit riskCredit risk is the risk of losses resulting from the failure of a borrower or counterparty to honour its financial or contractual obligations to the Bank which could materialise from the banking book and both on or off-balance sheet. The on-balance sheet credit risk arises mainly from notional value of financial products such as retail loans, corporate loans, loans to banks and financial institutions, loans to State-Owned Enterprises (SOEs) and loans to the Government. The off-balance sheet credit risk arises from undrawn loan commitments.
Credit risk exposures of the Bank
The total credit exposure which is 39.3% of the Bank’s total assets is the second major line of business (the investment in risk free securities is 53.1% of total assets). Hence the magnitude of credit risk is comparatively moderate to the Bank, albeit the fact that the Bank considers credit risk as a major type of risk.
The credit exposure of the Bank is created from two main categories i.e., “lending to banks” and “lending to other customers” such as corporate and retail borrowers, Government and Government institutions.
54.1.1 Credit quality analysis
54.1.1 (a) Net exposure to credit risk by class of financial assets
The following tables show the maximum exposure and net exposure (fair value of any collateral held, value of risk-free investments, Government guarantees and impairment provision made were deducted in arriving the net exposure) to credit risk by class of financial assets.
54. Financial risk management (contd.)

Governance Financial Reports Supplementary Information
398 National Savings Bank │ Annual Report 2019 Notes to the Financial Statements
54. Financial risk management (contd.)54.1 Credit risk (contd.)54.1.1 Credit quality analysis (contd.)
54.1.1. (a) Net exposure to credit risk by class of financial assets (contd.)
As at 31 December 2019 2018
Note Maximum exposure to
credit riskRs. ’000
Net exposure
Rs. ’000
Maximum exposure to
credit riskRs. ’000
Netexposure
Rs. ’000
BankCash and cash equivalents 16 5,376,715 4,435,614 3,434,524 2,735,123 Balances with central banks 17 – – – – Placements with banks 18 12,364,469 12,364,469 17,588,445 17,588,445 Derivative financial instruments 19 11,622 11,622 4,740,106 4,740,106 Financial assets recognised through profit or loss 20– measured at fair value 11,459,882 1,782,337 16,680,382 1,878,919 – designated at fair value – – – – Financial assets at amortised cost– loans and advances 21 454,394,957 182,933,575 422,894,740 159,585,358 – debt and other instruments 22 615,634,321 12,591,720 518,947,969 12,978,764 Financial assets measured at fair value through other Comprehensive income 23 3,478,811 3,478,811 6,184,430 3,750,515
Gross total 1,102,720,778 217,598,148 990,470,596 203,257,231
Net exposure to credit risk – Bank
D DE EF FG GA AB BC C
100
80
60
40
20
0
100
80
60
40
20
0
% %
Maximum exposure to Credit Risk Net Exposure
A – Cash and cash equivalents B – Placements with banks C – Derivative financial instruments
D – Financial assets recognised through profit or loss E – Loans and advances F – Debt and other instruments
G – Financial assets measured at FV OCI
2018 2019

Governance Financial Reports Supplementary Information
399Annual Report 2019 │ National Savings BankNotes to the Financial Statements
54. Financial risk management (contd.)54.1 Credit risk (contd.)54.1.1 Credit quality analysis (contd.)
54.1.1 (a) Net exposure to credit risk by class of financial assets (contd.)
As at 31 December 2019 2018
Note Maximum exposure to
credit riskRs. ’000
Net exposure
Rs. ’000
Maximum exposure to
credit riskRs. ’000
Netexposure
Rs. ’000
GroupCash and cash equivalents 16 5,564,824 4,617,584 3,436,929 2,737,518 Balances with central banks 17 58 58 177 177 Placements with banks 18 15,745,184 15,745,184 17,588,445 17,588,445 Derivative financial instruments 19 11,622 11,622 4,740,106 4,740,106 Financial assets recognised through profit or loss 20– measured at fair value 22,130,273 1,782,337 26,867,533 1,878,919 – designated at fair value – – – – Financial assets at amortised cost– loans and advances 21 456,636,285 183,908,249 422,919,713 159,585,358 – debt and other instruments 22 619,567,786 12,847,174 522,973,159 13,329,958 Financial assets measured at fair value through other Comprehensive income 23 4,626,582 3,616,876 7,788,560 3,751,515
Gross total 1,124,282,614 222,529,084 1,006,314,622 203,611,997
54.1.1 (b) Management of the credit portfolio
Collateral and other credit enhancement The amount and type of collateral required depends as an assessment of the credit risk of the counterparty. Guidelines are in place covering the accessibility and valuation of each type of collateral.
The main type of collateral obtained are as follows:
a.forcorporatelending–Governmentguarantees,mortgagesoverimmovableandmovablefixedassets,inventory,corporateandpersonal guarantees
b. for retail lending – mortgage over residential property, gold, personal guarantees, vehicles.

Governance Financial Reports Supplementary Information
400 National Savings Bank │ Annual Report 2019 Notes to the Financial Statements
54. Financial risk management (contd.)54.1 Credit risk (contd.)54.1.1 Credit quality analysis (contd.)
54.1.1 (b) Management of the credit portfolio (contd.)
Concentration of credit risk by product and sector The Bank monitors the concentration of credit risk by product and sectors. An analysis of concentration risk of the Bank portfolio (Loans and receivables to other customers) is given below:
Concentration by product
Bank Group
As at 31 December 2019Rs. ’000
2018Rs. ’000
2019Rs. ’000
2018Rs. ’000
Loans and advancesLease rental and receivable – – 472,747 – Pawning 36,754,318 29,893,320 36,792,150 29,893,320 Staff loans 7,565,685 6,103,442 7,689,104 6,103,442
Term loans –Short term 922,161 6,080,407 922,161 6,080,407 Long term 408,213,779 380,231,640 411,338,726 380,231,640
Others –Sri Lanka Government Securities – – – – Loan to Government 2,075,000 2,075,000 2,075,000 2,075,000 Securities purchased under resale agreement 3,130,955 2,357,240 3,150,592 2,382,213
Gross total 458,661,898 426,741,049 462,440,480 426,766,022
Concentration by sector
Bank Group
As at 31 December 2019Rs. ’000
2018Rs. ’000
2019Rs. ’000
2018Rs. ’000
Loans and advancesAgriculture and fishing 32,854,359 20,817,480 33,543,973 20,817,480 Manufacturing – – 960,704 – Tourism 46,264 38,746 136,981 38,746 Transport 1,695,189 1,356,593 1,763,130 1,356,593 Construction/housing 128,128,654 116,223,402 128,361,035 116,223,402 Traders – – 708,986 – New economy – – 13,462 –
OthersFinancial and business services 11,663,968 26,413,837 11,663,968 26,413,837 Infrastructure 71,020,455 76,286,787 71,020,455 76,286,787 Power and energy 12,674,792 6,801,197 12,674,792 6,801,197 Education 36,724,769 36,362,632 36,724,769 36,362,632 Personal/pawning/other 163,853,448 142,440,375 164,868,223 142,465,348
Gross total 458,661,898 426,741,049 462,440,480 426,766,022

Governance Financial Reports Supplementary Information
401Annual Report 2019 │ National Savings BankNotes to the Financial Statements
54. Financial risk management (contd.)54.1 Credit risk (contd.)54.1.1 Credit quality analysis (contd.)
54.1.1 (b) Management of the credit portfolio (contd.)
Sector classification of loan and advances – Bank
FG
H
I
2018
D
C
E
A B
2019%
2018%
A – Agriculture and fishing 7.16 4.88
B – Tourism 0.01 0.01
C – Transport 0.37 0.32
D – Construction/housing 27.94 27.24
E – Financial and business services 2.54 6.19
2019%
2018%
F – Infrastructure 15.48 17.87
G – Power and energy 2.76 1.59
H – Education 8.01 8.52
F – Personal/Pawning/Other 35.73 33.38
2019
FGH
ID
E
ACB
54.1.1 (c) Credit quality (past due) by classes of financial assets – Bank
As at 31 December 2019 Note Neither past duenor impaired
Rs. ’000
Past due butnot impaired
Rs. ’000
Individuallyimpaired
Rs. ’000
Total
Rs. ’000
AssetsCash and cash equivalents (gross)* 16 5,377,505 – – 5,377,505 Balances with central banks 17 – – – – Placements with banks (Gross)* 18 12,366,455 – – 12,366,455 Derivative financial instruments 19 11,622 – – 11,622 Financial assets recognised through profit or loss– measured at fair value 20 11,459,882 – – 11,459,882 – designated at fair value – – – – Financial assets at amortised cost– loans and advances (gross)* 21 416,280,504 40,692,576 1,688,818 458,661,898 – debt and other instruments (gross)* 22 615,648,775 – – 615,648,775 Financial assets measured at fair value through other Comprehensive income 23 3,478,811 – – 3,478,811
Total 1,064,623,554 40,692,576 1,688,818 1,107,004,948
* Collectively assessed for the impairment.

Governance Financial Reports Supplementary Information
402 National Savings Bank │ Annual Report 2019 Notes to the Financial Statements
54. Financial risk management (contd.)54.1 Credit risk (contd.)54.1.1 Credit quality analysis (contd.)
54.1.1 (c) Credit quality (past due) by classes of financial assets – Bank (contd.)
Aging analysis of past due (i.e., facilities in arrears of 1 day and above) but not impaired loans, by class of financial assets.
Past due but not impaired
As at 31 December 2019 1 to 30 daysRs. ’000
31 to 60 daysRs. ’000
61 to 90 daysRs. ’000
More than 90 daysRs. ’000
TotalRs. ’000
Financial assets at amortised cost – loans and advances (gross)* 27,801,150 5,098,118 342,470 7,450,837 40,692,576
68% 13% 1% 18% 100%
Facilities in area’s of 1 day and above considered as “past due”.
As at 31 December 2018 Note Neither past duenor impaired
Rs. ’000
Past due butnot impaired
Rs. ’000
Individuallyimpaired
Rs. ’000
Total
Rs. ’000
AssetsCash and cash equivalents (gross)* 16 3,434,751 – – 3,434,751 Balances with central banks 17 – – – – Placements with banks (gross)* 18 17,591,466 – – 17,591,466 Derivative financial instruments 19 4,740,106 – – 4,740,106 Financial assets recognised through profit or loss– measured at fair value 20 16,680,382 – – 16,680,382 – designated at fair value – – – – Financial assets at amortised cost– loans and advances (gross)* 21 387,848,052 38,892,997 – 426,741,049 – debt and other instruments (gross)* 22 518,957,041 – – 518,957,041 Financial assets measured at fair value through Other comprehensive income 23 6,184,430 – – 6,184,430
Total 955,436,228 38,892,997 – 994,329,225
* Collectively assessed for the impairment.
Aging analysis of past due (i.e., facilities in arrears of 1 day and above) but not impaired loans, by class of financial assets.
Past due but not impaired
As at 31 December 2018 1 to 30 daysRs. ’000
31 to 60 daysRs. ’000
61 to 90 daysRs. ’000
More than 90 daysRs. ’000
TotalRs. ’000
Financial assets at amortised cost – loans and advances (gross)* 27,584,888 4,503,702 400,153 6,404,254 38,892,997
71% 12% 1% 16% 100%
Facilities in area’s of 1 day and above considered as “past due”.

Governance Financial Reports Supplementary Information
403Annual Report 2019 │ National Savings BankNotes to the Financial Statements
54. Financial risk management (contd.)54.1 Credit risk (contd.)54.1.1 Credit quality analysis (contd.)
54.1.1 (d) Credit quality by classes of financial asset – stage wise – Bank
Amortised cost Impairment provision
As at 31 December 2019 Note Non-credit Impaired
Rs. ’000
Stage 1
Rs. ’000
Stage 2
Rs. ’000
Stage 3
Rs. ’000
Total
Rs. ’000
Stage 1
Rs. ’000
Stage 2
Rs. ’000
Stage 3
Rs. ’000
Total
Rs. ’000
As per financial positionRs. ’000
Assets
Cash and cash equivalents 16 1,082,288 4,295,217 – – 5,377,505 790 – – 790 5,376,715 Balances with central banks 17 – – – – – – – – – –
Placements with banks 18 – 12,366,455 12,366,455 1,986 – – 1,986 12,364,469 Derivative financial instruments 19 11,622 – – – 11,622 – – – – 11,622 Financial assets recognised through profit or loss 20
– measured at fair value 11,459,882 – – – 11,459,882 – – – – 11,459,882
– designated at fair value – – – – – – – – – – Financial assets at amortised cost
– loans and advances 21 31,896,777 387,398,241 30,227,995 9,138,886 458,661,898 1,601,273 271,001 2,394,667 4,266,941 454,394,957 – debt and other instruments 22 602,630,531 11,222,987 1,795,257 – 615,648,775 8,602 5,852 – 14,454 615,634,321 Financial assets measured at fair value through other comprehensive income 23 3,478,811 – – – 3,478,811 – – – – 3,478,811
Total 650,559,911 415,282,900 32,023,252 9,138,886 1,107,004,948 1,612,651 276,853 2,394,667 4,284,171 1,102,720,777
Credit quality by classes of financial asset – stage wise – Bank Amortised cost Impairment provision
As at 31 December 2018 Note Non-credit impaired
Rs. ’000
Stage 1
Rs. ’000
Stage 2
Rs. ’000
Stage 3
Rs. ’000
Total
Rs. ’000
Stage 1
Rs. ’000
Stage 2
Rs. ’000
Stage 3
Rs. ’000
Total
Rs. ’000
As per financial positionRs. ’000
Assets
Cash and cash equivalents 16 893,805 2,540,946 – – 3,434,751 227 – – 227 3,434,524 Balances with central banks 17 – – – – – – – – – –
Placements with banks 18 – 17,591,466 17,591,466 3,021 – – 3,021 17,588,445 Derivative financial instruments 19 4,740,106 – – – 4,740,106 – – – – 4,740,106 Financial assets recognised through profit or loss 20
– measured at fair value 16,680,382 – – – 16,680,382 – – – – 16,680,382
– designated at fair value – – – – – – – – – – Financial assets at amortised cost
– loans and advances 21 28,819,417 385,084,341 6,433,037 6,404,254 426,741,049 1,610,731 272,348 1,963,230 3,846,310 422,894,740 – debt and other instruments 22 505,791,978 13,165,063 – – 518,957,041 9,072 – – 9,072 518,947,969 Financial assets measured at fair value through other comprehensive income 23 6,184,430 – – – 6,184,430 – – – – 6,184,430
Total 563,110,118 418,381,815 6,433,037 6,404,254 994,329,225 1,623,051 272,348 1,963,230 3,858,630 990,470,594

Governance Financial Reports Supplementary Information
404 National Savings Bank │ Annual Report 2019 Notes to the Financial Statements
54. Financial risk management (contd.)54.2 Liquidity risk
Liquidity risk is the Bank’s inability to meet “on” or “off ” balance sheet contractual and contingent financial obligations as they fall due, without incurring material losses.
54.2.1 Concentration of liquid assets
The Bank’s regulatory requirement to invest 60% of its deposits in Government Securities forces the Bank to maintain a high statutory liquid assets ratio. Currently, the Bank maintains a liquidity ratio at 60.2% which is well above the statutory requirement of 20%. The investment in Government Securities represents 96.6% from the total liquid assets of the Bank.
Bank
As at 31 December 2019Rs. ’000
2018Rs. ’000
Liquidly assets ratio –Year end 60.2 54.930 June 57.5 71.7Year beginning 54.9 73.4
Liquidity assets and liabilities of the Bank
Domestic business unit
2019Rs. ’000
2018Rs. ’000
Total liquid assetsCash 1,173,535 1,026,726 Balances with licensed commercial bank 17,014,229 20,372,364 Money at call in Sri Lanka – – Treasury bills and securities issued or guaranteed by the Government of Sri Lanka 22,242,323 25,230,190 Cash item in the process of collection 251,951 271,129 Balances with banks abroad 807,801 685,650 Treasury Bonds 526,603,370 376,736,980 Sri Lanka development bonds 397,376 167,067 Total liquid assets (Daily average statutory liquid assets during the month of December) 568,490,585 424,490,106 Total liability based subject to minimum liquid assets requirement 944,400,252 773,498,104 Liquidity asset ratio (%) 60.20 54.88
Details are given as per regulatory reporting.
54.2.2 Remaining contractual period to maturity – Bank and the Group
Disclosures are given in the Note 55 on pages 415 to 418.

Governance Financial Reports Supplementary Information
405Annual Report 2019 │ National Savings BankNotes to the Financial Statements
54. Financial risk management (contd.)54.2 Liquidity risk (contd.)54.2.3 Financial assets available to support future funding
The table below sets out the availability of the Bank’s financial assets to support future funding:
Bank Group
Encumbered Unencumbered Total * Encumbered Unencumbered Total *
As at 31 December 2019 Note Pledge as collateral
Rs. ’000
Other
Rs. ’000
Available as collateral
Rs. ’000
Other
Rs. ’000 Rs. ’000
Pledge as collateral
Rs. ’000
Other
Rs. ’000
Available as collateral
Rs. ’000
Other
Rs. ’000 Rs. ’000
Cash and cash equivalents 16 – – 5,377,505 – 5,377,505 – – 5,565,618 – 5,565,618
Balances with central banks 17 – – – – – – 58 – 58
Placements with banks 18 – – 12,366,455 12,366,455 – – 15,749,077 – 15,749,077
Derivative financial instruments 19 – – – 11,622 11,622 – – 11,622 11,622
Financial assets recognised through profit or loss 20 – –
– measured at fair value – – 11,459,882 – 11,459,882 10,216,289 11,913,983 – 22,130,273
– designated at fair value – – – – – – – – – –
Financial assets at amortised cost
– loans and advances 21 – – 458,661,898 – 458,661,898 – – 462,440,480 – 462,440,480
– debt and other instruments 22 48,813,600 – 566,835,175 – 615,648,775 52,120,996 567,632,981 – 619,753,977
Financial assets measured at fair value through other comprehensive income 23 – – 3,478,811 – 3,478,811 582,476 – 4,044,106 – 4,626,582
Total 48,813,600 – 1,058,179,726 11,622 1,107,004,948 62,919,761 58 1,067,346,246 11,622 1,130,277,688
Bank Group
Encumbered Unencumbered Total * Encumbered Unencumbered Total *
As at 31 December 2018 Note Pledge as collateral
Rs. ’000
Other
Rs. ’000
Available as collateral
Rs. ’000
Other
Rs. ’000 Rs. ’000
Pledge as collateral
Rs. ’000
Other
Rs. ’000
Available as collateral
Rs. ’000
Other
Rs. ’000 Rs. ’000
Cash and cash equivalents 16 – – 3,434,751 – 3,434,751 – – 3,437,156 – 3,437,156
Balances with central banks 17 – – – – – – 177 – 177
Placements with banks 18 – – 17,591,466 17,591,466 – – 17,591,466 – 17,591,466
Derivative financial instruments 19 – – – 4,740,106 4,740,106 – – 4,740,106 4,740,106
Financial assets recognised through profit or loss 20 –
– measured at fair value – – 16,680,382 – 16,680,382 9,595,990 17,271,543 – 26,867,533
– designated at fair value – – – – – – – – – –
Financial assets at amortised cost – –
– loans and advances 21 – – 426,741,049 – 426,741,049 – – 426,766,022 – 426,766,022
– debt and other instruments 22 69,160,408 – 449,796,633 – 518,957,041 72,546,833 450,435,443 – 522,982,276
Financial assets measured at fair value through other comprehensive income 23 – – 6,184,430 – 6,184,430 1,524,097 – 6,264,463 – 7,788,560
Total 69,160,408 – 920,428,710 4,740,106 994,329,225 83,666,920 177 921,766,093 4,740,106 1,010,173,296
* Figures are stated before the impairment provisions.

Governance Financial Reports Supplementary Information
406 National Savings Bank │ Annual Report 2019 Notes to the Financial Statements
54. Financial risk management (contd.)54.3 Market risk
Market risk to the Bank stems from movements in market prices, in particular, changes in interest rates, foreign exchange rates and equity prices. Market risk is often propagated by other forms of financial risk such as credit and market liquidity risk. The risk of losses would arise from on-balance sheet as well as off-balance sheet activities.
Sources of market risk to NSB
The exposure to market risk arises to National Savings Bank from the following sources:
z Treasury securities portfolio (Government Securities and other permitted fixed income securities) z Repo and reverse repo transaction z Bank’s operations in foreign currency z Equity investments z Derivatives z Rate sensitive assets liabilities mismatch
54.3.1 Market risk – trading and non-trading exposure
Following table present the assets and liabilities subject to market risk between fair value through profit or loss and other than fair value through profit or loss:
Bank Group
As at 31 December 2019 Note Carrying amount
Rs. ’000
Amount exposure
to trading Rs. ’000
Non-trading exposure
Rs. ’000
Carrying amount
Rs. ’000
Amount exposure to
trading Rs. ’000
Non-trading exposure
Rs. ’000
Assets subject to market riskCash and cash equivalents 16 5,376,715 – 5,376,715 5,564,824 – 5,564,824 Balances with central banks 17 – – – 58 – 58 Placements with banks 18 12,364,469 – 12,364,469 15,745,184 – 15,745,184 Derivative financial instruments 19 11,622 – 11,622 11,622 – 11,622 Financial assets recognised through profit or loss 20 – measured at fair value 11,459,882 11,459,882 – 22,130,273 22,130,273 – – designated at fair value – – – – – – Financial assets at amortised cost – loans and advances 21 454,394,957 – 454,394,957 456,636,285 – 456,636,285 – debt and other instruments 22 615,634,321 – 615,634,321 619,567,786 – 619,567,786 Financial assets measured at fair value through other comprehensive income 23 3,478,811 – 3,478,811 4,626,582 – 4,626,582
Total 1,102,720,778 11,459,882 1,091,260,896 1,124,282,614 22,130,273 1,102,152,342

Governance Financial Reports Supplementary Information
407Annual Report 2019 │ National Savings BankNotes to the Financial Statements
54. Financial risk management (contd.)54.3 Market risk (contd.)54.3.1 Market risk – trading and non-trading exposure (contd.)
Bank Group
As at 31 December 2019 Note Carrying amount
Rs. ’000
Amount exposure
to trading Rs. ’000
Non-trading exposure
Rs. ’000
Carrying amount
Rs. ’000
Amount exposure to
trading Rs. ’000
Non-trading exposure
Rs. ’000
Liabilities subject to market riskDue to banks 32 35,045,251 – 35,045,251 36,139,122 – 36,139,122 Derivative financial instruments 33 – – – – – – Financial liabilities recognised through profit or loss 33 – – – – – – Financial liabilities at amortised cost 34– due to depositors 1,016,574,286 – 1,016,574,286 1,015,635,421 – 1,015,635,421 – due to debt securities holders – – – – – – – due to other borrowers 36 21,203,242 – 21,203,242 32,808,023 – 32,808,023 Lease Liability 1,066,882 – 1,066,882 1,121,441 – 1,121,441 Debt securities issued 37 26,691,711 – 26,691,711 26,955,697 – 26,955,697
Total 1,100,581,372 – 1,100,581,372 1,112,659,704 – 1,112,659,704
Bank Group
As at 31 December 2018 Note Carrying amount
Rs. ’000
Amount exposure
to trading Rs. ’000
Non-trading exposure
Rs. ’000
Carrying amount
Rs. ’000
Amount exposure to
trading Rs. ’000
Non-trading exposure
Rs. ’000
Assets subject to market riskCash and cash equivalents 16 3,434,524 – 3,434,524 3,436,929 – 3,436,929 Balances with central banks 17 – – – 177 – 177 Placements with banks 18 17,588,445 – 17,588,445 17,588,445 – 17,588,445 Derivative financial instruments 19 4,740,106 – 4,740,106 4,740,106 – 4,740,106 Financial assets recognised through profit or loss 20 – measured at fair value 16,680,382 16,680,382 – 26,867,533 26,867,533 – – designated at fair value – – – – – – Financial assets at amortised cost – loans and advances 21 422,894,740 – 422,894,740 422,919,713 – 422,919,713 – debt and other instruments 22 518,947,969 – 518,947,969 522,973,159 – 522,973,159 Financial assets measured at fair value through other comprehensive income 23 6,184,430 – 6,184,430 7,788,560 – 7,788,560
Total 990,470,596 16,680,382 973,790,214 1,006,314,622 26,867,533 979,447,089

Governance Financial Reports Supplementary Information
408 National Savings Bank │ Annual Report 2019 Notes to the Financial Statements
54. Financial risk management (contd.)54.3 Market risk (contd.)54.3.1 Market risk – trading and non-trading exposure (contd.)
Bank Group
As at 31 December 2018 Note Carrying amount
Rs. ’000
Amount exposure to
trading Rs. ’000
Non-trading exposure
Rs. ’000
Carrying amount
Rs. ’000
Amount exposure to
trading Rs. ’000
Non-trading exposure
Rs. ’000
Liabilities subject to market riskDue to banks 32 77,119,146 – 77,119,146 83,615,264 – 83,615,264 Derivative financial instruments 33 1,533 – 1,533 1,533 – 1,533 Financial liabilities recognised through profit or loss 34 – – – – – – Financial liabilities at amortised cost 35– due to depositors 839,574,411 – 839,574,411 839,574,411 – 839,574,411 – due to debt securities holders – – – – – – – due to other borrowers 14,804,802 – 14,804,802 21,750,178 – 21,750,178 Debt securities issued 37 52,389,133 – 52,389,133 52,389,133 – 52,389,133
Total 983,889,025 – 983,889,025 997,330,519 – 997,330,519
54.3.2 Foreign exchange riskForeign exchange rate risk arises from the movement of the rate of exchange of one currency against another, leading to an adverse impact on the Bank’s earnings or equity. The Bank is exposed to foreign exchange rate risk that the value of a financial instrument or the investment in its foreign assets, may fluctuate due to changes in foreign exchange rates.
An impact analysis of the foreign currency Net Open Position (NOP) was carried out applying shock levels of 5%, 10% and 15%, for depreciation on the current exchange rate and the impact on the currency-wise NOP and the impact on Income Statement is shown in the tables below as at 31 December 2019:
Bank
2019 2018
USD ’000 Rs. ’000 USD ’000 Rs. ’000
Net open position 906 164,403 864 157,818
Stress level Effect on income statement
Rs. ’000
Revised rupee positionRs. ’000
Effect on income statement
Rs. ’000
Revised rupee positionRs. ’000
Shock of 5% on exchange rate (rupee depreciation) 8,220 172,623 7,891 165,709 Shock of 10% on exchange rate (rupee depreciation) 16,440 180,843 15,782 173,600 Shock of 15% on exchange rate (rupee depreciation) 24,660 189,063 23,673 181,491

Governance Financial Reports Supplementary Information
409Annual Report 2019 │ National Savings BankNotes to the Financial Statements
54. Financial risk management (contd.)54.3 Market risk (contd.)54.3.2 Foreign exchange risk (contd.)
Bank
2019 2018
JPY ’000 Rs. ’000 JPY ’000 Rs. ’000
Net open position (1,935) (3,232) (165,415) (272,935)
Stress level Effect on income statement
Rs. ’000
Revised rupee positionRs. ’000
Effect on income statement
Rs. ’000
Revised rupee positionRs. ’000
Shock of 5% on exchange rate (rupee depreciation) (162) (3,394) (13,647) (286,582)Shock of 10% on exchange rate (rupee depreciation) (323) (3,555) (27,294) (300,229)Shock of 15% on exchange rate (rupee depreciation) (485) (3,717) (40,940) (313,875)
Bank
2019 2018
GBP ’000 Rs. ’000 GBP ’000 Rs. ’000
Net open position 511 121,775 503 116,581
Stress level Effect on income statement
Rs. ’000
Revised rupee positionRs. ’000
Effect on income statement
Rs. ’000
Revised rupee positionRs. ’000
Shock of 5% on exchange rate (rupee depreciation) 6,090 127,865 5,829 122,410 Shock of 10% on exchange rate (rupee depreciation) 12,180 133,955 11,658 128,239 Shock of 15% on exchange rate (rupee depreciation) 18,270 145,448 17,487 134,068
Bank
2019 2018
EUR ’000 Rs. ’000 EUR ’000 Rs. ’000
Net open position 9,264 1,885,075 4,307 900,431
Stress level Effect on income statement
Rs. ’000
Revised rupee positionRs. ’000
Effect on income statement
Rs. ’000
Revised rupee positionRs. ’000
Shock of 5% on exchange rate (rupee depreciation) 94,252 1,979,327 45,022 945,453 Shock of 10% on exchange rate (rupee depreciation) 188,504 2,073,579 90,043 990,474 Shock of 15% on exchange rate (rupee depreciation) 282,756 2,167,831 135,065 1,035,496
The Bank has entered in to swap and forward foreign exchange contract to minimise the foreign exchange risk (refer Note 19 on pages 339 to 342).

Governance Financial Reports Supplementary Information
410 National Savings Bank │ Annual Report 2019 Notes to the Financial Statements
54. Financial risk management (contd.)54.3.3 Equity risk
Equity risk is the risk that one’s investments will depreciate because of stock market dynamic causing one to lose money.
The investment in equity represents 0.54% of the total assets while investments in quoted and unquoted equity are 0.5% and 0.04% respectively. Hence, the Bank does not have a major exposure to equity risk. However, the adverse movements in the stock market affected the return on equity investments. The investment in unquoted companies are made due to policy decisions on market and economic development and strategic reasons.
The Bank conducts mark-to-market calculations on a monthly, quarterly and on a need basis to identify the impact due to changes in equity prices.
Equity price shock
The table below summarises the impact (both to the Income Statement and to the equity).
Bank and Group
2019 2018
Note Financial assets recognised
through profit or loss
Rs. ’000
Financial assets
measured at FVOCI
Rs. ’000
Total
Rs. ’000
Financial assets recognised
through profit or loss
Rs. ’000
Financial assets
measured at FVOCI
Rs. ’000
Total
Rs. ’000
Market value of equity securities as at 31 December
20 & 23 1,782,337 3,208,101 4,990,438 1,878,919 3,447,888 5,326,807
2019 2018
Stress Level Impact to P&LRs. ’000
Impact to OCIRs. ’000
Impact to equityRs. ’000
Impact to P&LRs. ’000
Impact to OCIRs. ’000
Impact to equityRs. ’000
Shock of 5% on equity prices (upward) 89,117 160,405 249,522 93,946 172,394 266,340 Shock of 5% on equity prices (downward) (89,117) (160,405) (249,522) (93,946) (172,394) (266,340)Shock of 10% on equity prices (upward) 178,234 320,810 499,044 187,892 344,789 532,681 Shock of 10% on equity prices (downward) (178,234) (320,810) (499,044) (187,892) (344,789) (532,681)Shock of 15% on equity prices (upward) 267,351 481,215 748,566 281,838 517,183 799,021 Shock of 15% on equity prices (downward) (267,351) (481,215) (748,566) (281,838) (517,183) (799,021)Shock of 20% on equity prices (upward) 356,467 641,620 998,088 375,784 689,578 1,065,361 Shock of 20% on equity prices (downward) (356,467) (641,620) (998,088) (375,784) (689,578) (1,065,361)

Governance Financial Reports Supplementary Information
411Annual Report 2019 │ National Savings BankNotes to the Financial Statements
54. Financial risk management (contd.)
54.3 Market risk (contd.)54.3.3 Equity risk (contd.)
Investment in equity shares by industry
Following table presents the bank diversification of trading portfolio to minimise the risk associate with particular sector:
As at 31 December 2019 2018
Industry Cost
Rs. ’000
As % of total cost
%
Market value
Rs. ’000
As % of total market value
%
Cost
Rs. ’000
As % of total cost
%
Market value
Rs. ’000
As % of total market value
%
1. Banks, finance and insurance 499,341 16.9 302,655 18.8 507,640 15.5 372,564 21.72. Beverage, Food and Tobacco – – – – – – – – 3. Chemical and pharmaceuticals 39,543 1.3 36,282 2.3 100,527 3.1 63,927 3.74. Construction and engineering 403,299 13.7 150,811 9.3 408,295 12.5 117,577 6.85. Diversified holdings 678,351 23.0 450,526 28.0 782,405 23.9 515,862 30.06. Hotels and Travels 623,790 21.1 279,621 17.4 694,592 21.2 302,858 17.67. Investment trusts 11,307 0.4 6,297 0.4 11,307 0.3 6,857 0.48. Land and property 23,777 0.8 15,096 0.9 23,777 0.7 15,567 0.99. Manufacturing 290,557 9.8 230,325 14.3 301,773 9.2 189,007 11.010. Power and energy 46,066 1.6 34,550 2.1 46,066 1.4 38,695 2.211. Telecommunication 81,332 2.8 45,982 2.9 81,332 2.5 37,757 2.212. Trading 253,948 8.6 57,862 3.6 315,149 9.6 60,085 3.5
Subtotal 2,951,311 100 1,610,007 100 3,272,863 100 1,720,756 100
13. Unit trust 95,110 2.8 172,330 8.4 95,110 2.8 158,163 8.4
Total 3,046,421 1,782,337 3,367,973 1,878,919
Market value of investment in equity shares by industry – Bank and Group
2019%
2018%
A – Banks, finance and insurance 18.80 21.70
B – Chemical and pharmaceuticals 2.30 3.70
C – Construction and engineering 9.30 6.80
D – Diversified holdings 28.00 30.00
E – Hotels and Travels 17.40 17.60
F – Investment trusts 0.40 0.40
2019%
2018%
G – Land and property 0.90 0.90
H – Manufacturing 14.30 11.00
I – Power and energy 2.10 2.20
J – Telecommunication 2.90 2.20
K – Trading 3.60 3.50
D
E
F
H
2018B
A
C
G
KJI
2019
D
E
F
H
B
A
C
G
KJI

Governance Financial Reports Supplementary Information
412 National Savings Bank │ Annual Report 2019 Notes to the Financial Statements
54. Financial risk management (contd.)
54.3 Market risk (contd.)54.3.4 Interest rate risk
Interest rate risk is the risk that an investment’s value will change in the absolute level of interest rates, in the spread between two rates, in the shape of the yield curve or in any other interest rate relationships. The Bank’s major source of funding is deposits which represent 80.93% of total on balance sheet liabilities. of this, 23.62% represent savings deposits where 76.38% represent term deposits.
54.3.4.1 Exposure to interest rate risk
The management of interest rate risk against interest rate gap limits is supplemented by monitoring the sensitivity of the Bank’s financial assets and financial liabilities to various interest rate scenarios.
The following table demonstrates the sensitivity of the Bank’s Income Statement as at the reporting date, due to change in interest rates with all other variables held constant in less than one year maturity bucket.
2019 2018
Parallel increaseRs. ’000
Parallel decreaseRs. ’000
Parallel increaseRs. ’000
Parallel decreaseRs. ’000
Net Interest Income (NII)Change in 25 bps (1,425,250) 1,425,250 (1,267,530) 1,267,530 Change in 50 bps (2,850,501) 2,850,501 (2,535,061) 2,535,061 Change in 100 bps (5,701,002) 5,701,002 (5,070,121) 5,070,121
54.3.4.2 Interest rate risk – sensitivity analysis
Bank’s interest rate sensitivity report as at 31 December 2019 is presented below:
Bank 0-1 monthRs. ’000
0-3 monthsRs. ’000
0-6 monthsRs. ’000
0-12 monthsRs. ’000
Interest-bearing assets 24,109,059 54,473,950 105,233,925 189,860,883
Bank balances and placements 2,227,801 4,370,486 7,605,376 13,785,272 Financial assets recognised through profit or loss– measured at fair value 4,712 87,155 194,238 194,238 Financial assets at amortised cost– loans and advances 14,849,266 31,018,749 50,465,293 104,929,753 – debt and other instruments 7,027,280 18,997,560 46,969,018 70,951,620 Financial assets measured at fair value through Other comprehensive income – – – –
Interest-bearing liabilities 191,275,043 516,247,217 728,691,526 1,048,778,283
Due to banks 5,616,289 17,986,097 26,101,562 29,098,678 Financial liabilities at amortised cost– due to depositors 171,429,048 480,253,272 682,021,373 997,784,652 – due to debt securities holders – – – – – due to other borrowers 14,229,706 18,007,848 19,876,880 21,203,242 Debt securities issued – – 691,711 691,711
Net rate sensitive assets (liabilities) (167,165,984) (461,773,267) (623,457,601) (858,917,400)
Interest rate sensitivity ratio (%) 13 11 14 18

Governance Financial Reports Supplementary Information
413Annual Report 2019 │ National Savings BankNotes to the Financial Statements
54. Financial risk management (contd.)54.3 Market risk (contd.)54.3.4 Interest rate risk (contd.)
54.3.4.2 Interest rate risk – sensitivity analysis (contd.)
Group’s interest rate sensitivity report as at 31 December 2019 is presented below:
Group 0-1 monthRs. ’000
0-3 monthsRs. ’000
0-6 monthsRs. ’000
0-12 monthsRs. ’000
Interest-bearing assets 25,560,709 57,030,319 112,777,982 201,532,457
Bank balances and placements 3,359,980 6,234,335 11,660,435 17,173,871 Financial assets recognised through profit or loss– measured at fair value 71,429 287,306 2,657,276 7,183,051 Financial assets at amortised cost– loans and advances 14,964,102 31,363,256 51,064,664 106,037,551 – debt and other instruments 7,150,109 19,100,154 47,350,339 71,092,716 Financial assets measured at fair value through other comprehensive income 15,089 45,268 45,268 45,268
Interest-bearing liabilities 195,121,278 527,785,925 740,787,652 1,059,707,010
Due to banks 5,616,313 17,986,169 26,101,633 30,192,550 Financial liabilities at amortised cost– due to depositors 171,469,630 480,375,018 682,266,294 996,260,877 – due to debt securities holders – – – – – due to other borrowers 17,947,340 29,160,752 31,464,028 32,297,886 Debt securities issued 87,995 263,986 955,697 955,697
Net rate sensitive assets (liabilities) (169,560,569) (470,755,606) (628,009,670) (858,174,553)
Interest rate sensitivity ratio (%) 13 11 15 19
Bank’s interest rate sensitivity report as at 31 December 2018 is presented below:
Bank 0-1 monthRs. ’000
0-3 monthsRs. ’000
0-6 monthsRs. ’000
0-12 monthsRs. ’000
Interest-bearing assets 37,126,827 71,149,238 104,526,636 216,552,684
Bank balances and placements 749,722 8,975,812 12,068,111 17,601,973 Financial assets recognised through profit or loss– measured at fair value 190,318 526,079 570,635 571,242 Financial assets at amortised cost– loans and advances 14,642,598 24,859,047 41,533,244 101,172,738 – debt and other instruments 21,455,536 36,694,607 50,258,536 97,110,621 Financial assets measured at fair value through Other comprehensive income 88,653 93,693 96,110 96,110
Interest-bearing liabilities 225,453,233 498,851,396 659,431,869 947,717,986
Due to banks 53,842,968 58,368,770 61,920,449 65,087,313 Financial liabilities at amortised cost– due to depositors 158,160,107 425,141,386 582,029,005 821,436,738 – due to debt securities holders – – – – – due to other borrowers 13,450,158 14,619,083 14,762,981 14,804,802 Debt securities issued – 722,157 719,434 46,389,133
Net rate sensitive assets (liabilities) (188,326,406) (427,702,158) (554,905,233) (731,165,302)
Interest rate sensitivity ratio (%) 16 14 16 23
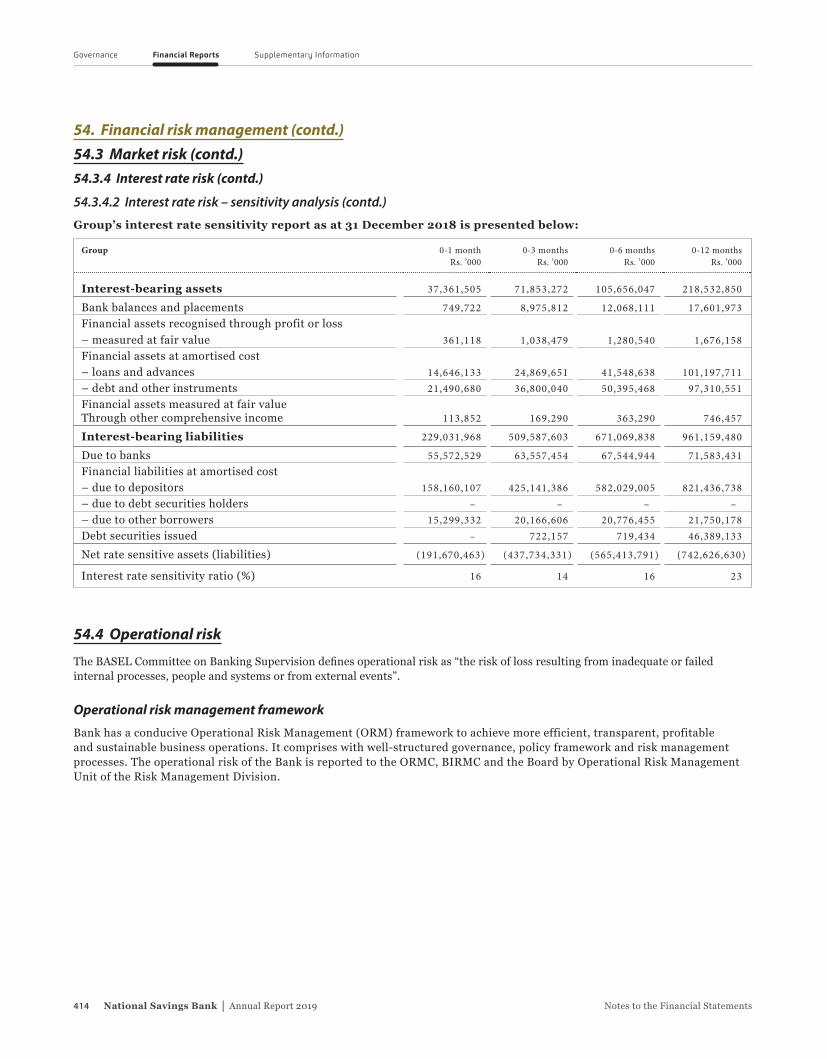
Governance Financial Reports Supplementary Information
414 National Savings Bank │ Annual Report 2019 Notes to the Financial Statements
54. Financial risk management (contd.)54.3 Market risk (contd.)54.3.4 Interest rate risk (contd.)
54.3.4.2 Interest rate risk – sensitivity analysis (contd.)
Group’s interest rate sensitivity report as at 31 December 2018 is presented below:
Group 0-1 monthRs. ’000
0-3 monthsRs. ’000
0-6 monthsRs. ’000
0-12 monthsRs. ’000
Interest-bearing assets 37,361,505 71,853,272 105,656,047 218,532,850
Bank balances and placements 749,722 8,975,812 12,068,111 17,601,973 Financial assets recognised through profit or loss– measured at fair value 361,118 1,038,479 1,280,540 1,676,158 Financial assets at amortised cost– loans and advances 14,646,133 24,869,651 41,548,638 101,197,711 – debt and other instruments 21,490,680 36,800,040 50,395,468 97,310,551 Financial assets measured at fair value Through other comprehensive income 113,852 169,290 363,290 746,457
Interest-bearing liabilities 229,031,968 509,587,603 671,069,838 961,159,480
Due to banks 55,572,529 63,557,454 67,544,944 71,583,431 Financial liabilities at amortised cost– due to depositors 158,160,107 425,141,386 582,029,005 821,436,738 – due to debt securities holders – – – – – due to other borrowers 15,299,332 20,166,606 20,776,455 21,750,178 Debt securities issued – 722,157 719,434 46,389,133
Net rate sensitive assets (liabilities) (191,670,463) (437,734,331) (565,413,791) (742,626,630)
Interest rate sensitivity ratio (%) 16 14 16 23
54.4 Operational risk
TheBASELCommitteeonBankingSupervisiondefinesoperationalriskas“theriskoflossresultingfrominadequateorfailedinternal processes, people and systems or from external events”.
Operational risk management framework
Bank has a conducive Operational Risk Management (ORM) framework to achieve more efficient, transparent, profitable and sustainable business operations. It comprises with well-structured governance, policy framework and risk management processes. The operational risk of the Bank is reported to the ORMC, BIRMC and the Board by Operational Risk Management Unit of the Risk Management Division.

Governance Financial Reports Supplementary Information
415Annual Report 2019 │ National Savings BankNotes to the Financial Statements
55. Maturity analysis
Bank Up to 3 monthsRs. ’000
3-12 months
Rs. ’000
1-3 years
Rs. ’000
3-5 years
Rs. ’000
More than 5 years
Rs. ’000
Total as at 31.12.2019
Rs. ’000
Total as at 31.12.2018
Rs. ’000
Assets with contractual maturity (interest-bearing asset)Cash and cash equivalents 1,420,802 – – – – 1,420,802 186,026Placements with banks 2,949,684 9,414,785 – – – 12,364,469 17,588,445Financial assets recognised through profit or loss
– measured at fair value 87,155 107,083 51,730 3,965,012 5,466,566 9,677,546 14,801,463Financial assets at amortised cost
– loans and advances 31,018,749 73,911,004 134,262,802 80,148,900 135,053,502 454,394,957 422,894,740– debt and other instruments 18,997,560 51,954,060 126,072,425 193,141,220 225,469,056 615,634,321 518,947,969
Financial assets measured at fair value through other comprehensive income – – – – – – 2,433,915
54,473,950 135,386,932 260,386,957 277,255,132 365,989,124 1,093,492,097 976,852,558
Other assets (non-interest-bearing assets)Cash and cash equivalents 3,955,913 – – – – 3,955,913 3,248,498Derivative financial instruments – – 11,622 – – 11,622 4,740,106Financial assets recognised through profit or loss
– measured at fair value 445,585 1,336,752 – – – 1,782,336 1,878,919Financial assets measured at fair value through other comprehensive income – – – – 3,478,811 3,478,811 3,750,515Investments in subsidiaries – – – – 4,811,000 4,811,000 1,700,000Property, plant and equipment – – – – 14,163,454 14,163,454 13,465,755Right-of-use assets 67,064 183,944 384,935 206,523 231,041 1,073,507 –Investment properties – – – – – – –Goodwill and intangible assets – – – – – – –Deferred tax assets – – – – – – –Other assets 1,494,490 9,607,760 9,049,258 8,479,918 6,566,497 35,197,923 31,209,216
5,963,051 11,128,456 9,445,815 8,686,441 29,250,803 64,474,567 59,993,009
Total assets 60,437,001 146,515,388 269,832,772 285,941,573 395,239,927 1,157,966,664 1,036,845,567

Governance Financial Reports Supplementary Information
416 National Savings Bank │ Annual Report 2019 Notes to the Financial Statements
55. Maturity analysis (contd.)
Bank Up to 3 monthsRs. ’000
3-12 months
Rs. ’000
1-3 years
Rs. ’000
3-5 years
Rs. ’000
More than 5 years
Rs. ’000
Total as at 31.12.2019
Rs. ’000
Total as at 31.12.2018
Rs. ’000
Liabilities with contractual maturity (interest-bearing liabilities)Due to banks 17,986,097 11,112,581 5,946,572 – – 35,045,251 77,119,146Financial liabilities at amortised cost
– due to depositors 480,253,272 517,531,380 13,675,940 5,113,695 – 1,016,574,286 839,574,411– due to other borrowers 18,007,848 3,195,394 – – – 21,203,242 14,804,802
Debt securities issued – 691,711 19,677,000 6,323,000 – 26,691,711 52,389,133
516,247,217 532,531,066 39,299,512 11,436,695 – 1,099,514,490 983,887,491
Other liabilities (non-interest-bearing liabilities)Derivative financial instruments – – – – – – 1,533Financial liabilities recognised through profit or loss – – – – – – –Lease liability 39,587 135,305 330,776 224,533 336,681 1,066,882 –Retirement benefit obligations – – – – 6,508,707 6,508,707 3,830,795Deferred tax liabilities 2,880 8,856 58,883 351,075 125,556 547,250 582,463Other liabilities 3,974,564 1,523,085 200,537 168,640 84,639 5,951,464 5,447,277Due to subsidiaries 547 – – – – 547 750Stated capital/Assigned capital – – – – 9,400,000 9,400,000 9,400,000Statutory reserve fund – – – – 3,562,872 3,562,872 3,227,960Retained earnings – – – – 4,464,442 4,464,442 3,984,674Other reserves – – – – 26,950,010 26,950,010 26,482,625
4,017,578 1,667,246 590,196 744,248 51,432,907 58,452,174 52,958,076
Total liabilities 520,264,795 534,198,312 39,889,708 12,180,943 51,432,907 1,157,966,664 1,036,845,567
*Represents the aggregate of the contractual maturities based on undiscounted cash flows.

Governance Financial Reports Supplementary Information
417Annual Report 2019 │ National Savings BankNotes to the Financial Statements
55. Maturity analysis (contd.)
Group Up to 3 monthsRs. ’000
3-12 months
Rs. ’000
1-3 years
Rs. ’000
3-5 years
Rs. ’000
More than 5 years
Rs. ’000
Total as at 31.12.2019
Rs. ’000
Total as at 31.12.2018
Rs. ’000
Assets with contractual maturity (interest-bearing asset)Cash and cash equivalents 1,428,686 – – – – 1,428,686 186,026Placements with banks 4,805,649 10,939,535 – – – 15,745,184 17,588,445Financial assets recognised through profit or loss
– measured at fair value 287,306 6,895,745 2,065,817 5,541,724 5,557,345 20,347,937 24,988,614Financial assets at amortised cost
– loans and advances 31,361,955 74,675,596 134,960,060 80,406,631 135,232,043 456,636,285 422,919,713– debt and other instruments 19,100,154 51,992,562 128,066,945 194,735,142 225,672,983 619,567,786 522,973,159
Financial assets measured at fair value through other comprehensive income 45,268 – 788,289 – 178,149 1,011,706 4,038,045
57,029,018 144,503,438 265,881,111 280,683,497 366,640,520 1,114,737,584 992,694,002
Other assets (non-interest-bearing assets)Cash and cash equivalents 4,136,138 – – – – 4,136,138 3,250,903Balances with central banks 58 – – – – 58 177Derivative financial instruments – – 11,622 – – 11,622 4,740,106Financial assets recognised through profit or loss
– measured at fair value 445,584 1,336,753 – – – 1,782,337 1,878,919Financial assets measured at fair value through other comprehensive income – – 136,065 – 3,478,811 3,614,876 3,750,515Investments in subsidiaries – – – – – – –Property, plant and equipment – – – – 14,457,494 14,457,494 13,468,776Right-of-use assets 69,160 196,036 403,724 214,506 247,442 1,130,868 –Investment properties – – – – 333,315 333,315 –Goodwill and intangible assets – – – – – – –Deferred tax assets – – – – 338 338 73Current tax assets – – – – – – –Other assets 1,329,522 9,870,998 9,096,893 8,497,317 6,575,385 35,370,115 31,532,684
5,980,462 11,403,787 9,648,304 8,711,823 25,092,785 60,837,161 58,622,153
Total assets 63,009,480 155,907,225 275,529,415 289,395,320 391,733,305 1,175,574,745 1,051,316,155

Governance Financial Reports Supplementary Information
418 National Savings Bank │ Annual Report 2019 Notes to the Financial Statements
55. Maturity analysis (contd.)
Group Up to 3 monthsRs. ’000
3-12 months
Rs. ’000
1-3 years
Rs. ’000
3-5 years
Rs. ’000
More than 5 years
Rs. ’000
Total as at 31.12.2019
Rs. ’000
Total as at 31.12.2018
Rs. ’000
Liabilities with contractual maturity (interest-bearing liabilities)Due to banks 19,079,969 11,112,581 5,946,572 – – 36,139,122 83,615,264Financial liabilities at amortised cost
– due to depositors 478,858,100 517,402,778 13,820,779 5,259,869 293,895 1,015,635,421 839,574,411– due to other borrowers 27,799,758 4,498,128 256,028 254,109 – 32,808,023 21,750,178
Debt securities issued 263,986 691,711 19,677,000 6,323,000 – 26,955,697 52,389,133
526,001,813 533,705,198 39,700,379 11,836,978 293,895 1,111,538,263 997,328,986
Other liabilities (non-interest-bearing liabilities)Derivative financial instruments – – – – – – 1,533Financial liabilities recognised through profit or loss – – – – – – –Lease liability 39,587 141,155 350,608 238,408 351,683 1,121,441 –Retirement benefit obligations – – – – 6,536,687 6,536,687 3,832,777Current tax liabilities – 565,704 – – – 565,704 –Deferred tax liabilities 2,880 8,856 58,883 351,075 126,320 548,014 582,463Other liabilities 4,302,222 1,535,258 1,121,319 383,295 88,321 7,430,415 5,452,317Due to subsidiaries – – – – – – –Stated capital/Assigned capital – – – – 9,400,000 9,400,000 9,400,000Statutory reserve fund – – – – 3,571,214 3,571,214 3,227,960Retained earnings – – – – 7,233,981 7,233,981 4,561,045Other reserves – – – – 27,629,027 27,629,027 26,929,074
4,344,689 2,250,973 1,530,810 972,778 54,937,233 64,036,482 53,987,168
Total liabilities 530,346,502 535,956,171 41,231,189 12,809,756 55,231,128 1,175,574,745 1,051,316,155
*Represents the aggregate of the contractual maturities based on undiscounted cash flows.

Governance Financial Reports Supplementary Information
419Annual Report 2019 │ National Savings BankNotes to the Financial Statements
56. Fair value of financial instruments56.1 Financial instruments recorded at fair value
Accounting policy
The following is a description of how fair values are determined for financial instruments that are recorded at fair value using valuation techniques. These incorporate the Group’s estimate of assumptions that a market participant would make when valuing the instruments.
Derivatives
i. Forward exchange purchases
Bank value the forward exchange purchase contracts using the quoted prices available for similar contract for the market.
ii. Foreign currency swaps
Derivative products (Foreign currency swaps/Cash flow hedges) valued using valuation techniques incorporating various inputs such as foreign exchange spot rates and foreign exchange forward rates.
Financial assets recognised through profit or loss
i. Government Treasury Bills and Bonds
Financial assets held for trading are valued using a valuation technique consists of Government Treasury Bills and Treasury Bonds. The Bank values the securities using discounted cash flow valuation models which incorporate observable data. Observable inputs include assumptions regarding current rates of interest, broker statements and market data published by Central Bank of Sri Lanka.
ii. Equity securities
The Bank values the equity securities using the quoted prices available for the identical securities in active market.
Financial assets measured at fair value through other comprehensive incomeThe Bank values the quoted equity securities using the quoted prices available for the identical securities in active market.
The unquoted equity securities have been fair valued using a valuation model based on observable data.
56.2 Determination of fair value and fair value hierarchy
The Bank uses the following hierarchy for determining and disclosing the fair value of financial instruments by valuation technique:
Level 1 Level 2 Level 3
Quoted (unadjusted) price in active markets for identical
assets or liabilities.
Other techniques for which all inputs which have a significant effect on the recorded fair value are observable, either directly
or indirectly.
Techniques which use inputs that have a significant effect
on the recorded fair value that are not based on observable
market data.

Governance Financial Reports Supplementary Information
420 National Savings Bank │ Annual Report 2019 Notes to the Financial Statements
56. Fair value of financial instruments (contd.)56.2 Determination of fair value and fair value hierarchy (contd.)
The following table shown an analysis of financial instruments recorded at fair value by level of the fair value hierarchy:
Bank
As at 31 December 2019 Note Level 1Rs. ’000
Level 2Rs. ’000
Level 3Rs. ’000
TotalRs. ’000
AssetsDerivative financial instruments
Interest rate swaps 19 – – 11,622 11,622
Financial assets recognised through profit or loss 20Government Treasury Bills and Bonds 9,677,545 – – 9,677,545Equity securities 1,782,337 – – 1,782,337
Financial assets at fair value through other comprehensive income 23
Equity securities – quoted 3,208,101 – – 3,208,101Equity securities – unquoted – 213,219 – 213,219
Total 14,667,983 213,219 11,622 14,892,824
Bank
As at 31 December 2018 Note Level 1Rs. ’000
Level 2Rs. ’000
Level 3Rs. ’000
TotalRs. ’000
AssetsDerivative financial instruments
Interest rate swaps 19 – – – –Foreign currency swaps – – 4,740,106 4,740,106
Financial assets recognised through profit or loss 20Government Treasury Bills and Bonds 14,801,463 – – 14,801,463Equity securities 1,878,919 – – 1,878,919
Financial assets at fair value through other comprehensive income 23
Equity securities – quoted 3,447,888 – – 3,447,888Other investments – Government securities 2,433,915 – – 2,433,915Equity securities – unquoted – 245,136 – 245,136
Total 22,562,185 245,136 4,740,106 27,547,427
LiabilitiesDerivative financial instruments – – 1,533 1,533

Governance Financial Reports Supplementary Information
421Annual Report 2019 │ National Savings BankNotes to the Financial Statements
56. Fair value of financial instruments (contd.)56.2 Determination of fair value and fair value hierarchy (contd.)
Group
As at 31 December 2019 Note Level 1Rs. ’000
Level 2Rs. ’000
Level 3Rs. ’000
TotalRs. ’000
AssetsDerivative financial instruments
Interest rate swaps 19 – – 11,622 11,622Foreign currency swaps – – – –
Financial assets recognised through profit or loss 20Government Treasury Bills and Bonds 20,347,936 – – 20,347,936Equity securities 1,782,337 – – 1,782,337
Financial assets at fair value through other comprehensive income 23
Equity securities – quoted 3,344,002 – – 3,344,002Other investments – Government Securities 1,009,706 – – 1,009,706Equity securities – unquoted – 213,219 – 213,219
Total 26,483,981 213,219 11,622 26,708,822
Group
As at 31 December 2018 Note Level 1Rs. ’000
Level 2Rs. ’000
Level 3Rs. ’000
TotalRs. ’000
AssetsDerivative financial instruments
Foreign currency swaps 19 – – 4,740,106 4,740,106
Financial assets recognised through profit or loss 20Government Treasury Bills and Bonds 24,988,614 – – 24,988,614Equity securities 1,878,919 – – 1,878,919
Financial assets at fair value through other comprehensive income 23
Equity securities – quoted 3,447,888 – – 3,447,888Other investments – Government Securities 4,037,045 – – 4,037,045Equity securities – unquoted – 245,136 – 245,136
Total 34,352,466 245,136 4,740,106 39,337,709
LiabilitiesDerivative financial instruments – – 1,533 1,533

Governance Financial Reports Supplementary Information
422 National Savings Bank │ Annual Report 2019 Notes to the Financial Statements
56. Fair value of financial instruments (contd.) 56.3 Reconciliation of movements between levels of fair value measurement hierarchy
The Bank and the Group do not have movements between level of hierarchy during the year. The Bank and the Group use Level 3 in fair value hierarchy to calculate fair value of derivative instruments and details of those instruments are given in the Notes 19 and 33 on pages 339 and 368.
56.4 Fair value of financial instruments
Bank
As at 31 December 2019 2018
Note Carrying amountRs. ’000
Fair value
Rs. ’000
Carrying amountRs. ’000
Fair value
Rs. ’000
Financial assetsCash and cash equivalents 16 5,376,715 5,376,715 3,434,524 3,434,524Balances with central banks 17 – – – –Placement with banks 18 12,364,469 12,364,469 17,588,445 17,588,445Derivative financial instruments 19 11,622 11,622 4,740,106 4,740,106
Financial assets recognised through profit or loss 20– measured at fair value 11,459,882 11,459,882 16,680,382 16,680,382– designated at fair value – – – –
Financial assets at amortised cost– loans and advances 21 454,394,957 454,394,957 422,894,740 422,894,740– debt and other instruments 22 615,634,321 617,433,209 518,947,969 492,759,226Financial assets measured at fair value through other comprehensive income 23 3,478,811 3,478,811 6,184,430 6,184,430
Total financial assets 1,102,720,778 1,104,519,665 990,470,596 964,281,853
Financial liabilitiesDue to banks 32 35,045,251 35,045,251 77,119,146 77,119,146Derivative financial instruments 33 – – 1,533 1,533Financial liabilities recognised through profit or loss 34 – – – –Financial liabilities at amortised cost 35 – due to depositors 1,016,574,286 1,015,205,274 839,574,411 838,307,567 – due to debt securities holders – – – – due to other borrowers 21,203,242 21,203,242 14,804,802 14,804,802Debt securities issued 37 26,691,711 26,691,711 52,389,133 52,389,133
Total financial liabilities 1,099,514,490 1,098,145,478 983,889,024 982,622,180

Governance Financial Reports Supplementary Information
423Annual Report 2019 │ National Savings BankNotes to the Financial Statements
56. Fair value of financial instruments (contd.) 56.4 Fair value of financial instruments (contd.)
Group
As at 31 December 2019 2018
Note Carrying amountRs. ’000
Fair value
Rs. ’000
Carrying amountRs. ’000
Fair value
Rs. ’000
Financial assetsCash and cash equivalents 16 5,564,824 5,564,824 3,436,929 3,436,929Balances with central banks 17 58 58 177 177Placement with banks 18 15,745,184 15,745,184 17,588,445 17,588,445Derivative financial instruments 19 11,622 11,622 4,740,106 4,740,106
Financial assets recognised through profit or loss 20– measured at fair value 22,130,273 22,130,273 26,867,533 26,867,533– designated at fair value – – –
Financial assets at amortised cost– loans and advances 21 456,636,285 456,636,285 422,919,713 422,919,713– debt and other instruments 22 619,567,786 621,193,858 522,973,159 496,656,654Financial assets measured at fair value through other comprehensive income 23 4,626,582 4,626,582 7,788,560 7,788,560
Total financial assets 1,124,282,615 1,125,908,687 1,006,314,622 979,998,117
Financial liabilitiesDue to banks 32 36,139,122 36,139,122 83,615,264 83,615,264Derivative financial instruments 33 – – 1,533 1,533Financial liabilities recognised through profit or loss 34 – – – –Financial liabilities at amortised cost 35 – due to depositors 1,015,635,421 1,014,226,409 839,574,411 838,307,567 – due to debt securities holders – – – – – due to other borrowers 32,808,023 32,808,023 21,750,178 21,750,178Debt securities issued 37 26,955,697 26,955,697 52,389,133 52,389,133
Total financial liabilities 1,111,538,263 1,110,129,251 997,330,518 996,063,674
56.5 Determination of fair value Fair value of financial assets and liabilities not carried at fair value
The following describes the methodologies and assumptions used to determine the fair values for those financial instruments which are not recorded at faire value in the Financial Statements.
Assets for which fair value approximates carrying value
For financial assets and financial liabilities that have a short-term maturity (original maturities less than a year). It is assumed that the carrying amount approximate their fair values. This assumption is also applied to savings deposits without specific maturity.
Long-term deposits accepted from customers for which periodical interest is paid and loan and receivables granted to customers with a variable rate are also considered to be carried at fair value in the books.

Governance Financial Reports Supplementary Information
424 National Savings Bank │ Annual Report 2019 Notes to the Financial Statements
56. Fair value of financial instruments (contd.)56.5 Determination of fair value (contd.)
Fixed rate financial instruments
Carrying amounts are considered as fair values for short-term credit facilities. In fair valuing held-to-maturity securities, rates published by the CBSL for similar trading securities were used. Loans and receivables with fixed interest rates were fair valued using market rates at which fresh loans were granted during the fourth quarter of the reporting year. Conversely, fixed deposits with original tenure above one year and interest paid at maturity were discounted using current market rates offered to customers during the fourth quarter of the reporting year.
Unquoted equities in financial assets
All unquoted equities in financial assets measured at fair value through other comprehensive income (except RDB) are recorded at cost, since its fair value can not be reliably estimated. There is no active market for these investments and Group intends to hold it for the long term. The investment in RDB shares have been fair valued using a valuation model based on observable data. Refer Note 23 (e) on page 356.
57. Capital management (as per regulatory reporting)Objective
The Bank is required to manage its capital in order to meet the regulatory requirements and hold sufficient capital buffers to meet the strategic objectives which are aligned with the risk appetite of the Bank.
Regulatory capital
Central Bank of Sri Lanka sets and monitors regulatory capital requirement on both consolidated and solo basis. The Bank is required to comply with the provisions of the Basel III Direction in respect of regulatory capital and capital to cover any additional risk. The Basel III capital regulations were fully implemented by 1 January 2019, will continue to be based on the three-mutually reinforcing Pillars introduced under Basel II, i.e., minimum capital requirement, supervisory review process and market discipline. Bank was considered as a Domestic Systemically Important Bank (D-SIB) until the issuance of Banking Act Direction No. 12 of 2019 on 20 December 2019 which resulted the Bank no more a D-SIB.
The Bank currently uses the standardised approach for credit risk, standardised measurement method for market risk and basic indicator approach for operational risk. Basel III emphasises on increasing the quality and quantity of capital especially the Core Capital, through redefining the common equity capital and introducing new capital buffers such as the Capital Conservation Buffer and a Capital Surcharge on Domestic Systemically Important Banks (D-SIBs). As per the CBSL Basel III Direction Bank and the Group are required to maintain a minimum Tier 1 Capital Ratio of 8.5% and a minimum Total Capital Ratio of 12.5% as at the end of year 2019.
Regulatory capital comprises Tier 1 capital and Tier 2 capital. The Bank and the Group have always complied with the minimum capital requirements imposed by the Central Bank of Sri Lanka.
Regulatory capital ratios
Bank Group
As at 31 December 2019Basel III
2018Basel III
2019Basel III
2018Basel III
Common equity Tier 1 capital ratio (minimum requirement – 2019 – 7%, 2018 – 7.375%) 12.023 13.078 13.903 13.901
Tier 1 capital ratio (minimum requirement – 2019 – 8.5%, 2018 – 8.875%) 12.023 13.078 13.903 13.901
Total capital ratio (minimum requirement – 2019 – 12.5%, 2017 – 12.875%) 14.349 15.898 16.271 16.649

Governance Financial Reports Supplementary Information
425Annual Report 2019 │ National Savings Bank
SupplementaryInformation426 430 431Products and Services
Income Statement in US Dollars
Statement of Comprehensive Income in US Dollars
432 433 446Statement of Financial Position in US Dollars
Basel III Disclosures as per Schedule III of Banking Act Direction No. 1 of 2016
D-SIB Assessment Exercise – 2019
448 455 457Other Disclosure Requirements as required by CBSL
Statistical Indicators 2009-2018
Analysis of Deposits
458 459 461Correspondent Banks
Exchange Companies
Eurogiro Members
462Glossary of Financial and Banking Terms

Governance Financial Reports Supplementary Information
426 National Savings Bank │ Annual Report 2019
Products and Services GRI 102-2
1. Deposit Products1.1 Savings ProductsOrdinary Savings AccountThe Bank offers ordinary savings accounts to anyone aged over seven years, with a minimum deposit of Rs. 100.00 Account-holder can make deposits or withdrawals at NSB branch or through SMS/Internet-banking facility.
“Hapan” Children’s Savings Account“Hapan” and “Punchi Hapan” are children’s savings accounts designed for those between the ages of 8 to 12 and 1 to 7 years, respectively. Deposits in both the said accounts are paid 1% more interest than what the Bank pays to their other savings accounts.
Neo Savings account Neo is a specially designed account for the teens between 13 to 19. Neo offers extra 1.5% than the normal deposit rate for accounts which are operated only through online. Account holders are entitled to an international debit card. Neo account holders will be eligible for Scholarship upon selecting to university.
I’M Savings AccountI’M savings account is designed for the purpose of fostering the habit of saving in youth aged between 19 to 30 years, and the Bank offers 0.5% more interest than what it pays for an ordinary savings account. I’M Account holders enjoy this higher interest rate up until they reach the age of 35. They also enjoy special gifts on the 21st Birthday, Birth of the first child and scholarships upon selecting to University.
“Sthree” Savings Account“Sthree” Savings Account is designed specifically for women who play different roles in life aged over 16 years with more privileges to celebrate the achievements of life and lend a hand and to shoulder their responsibilities to transform them as heiress to a better tomorrow. Sthree account holders entitle to many gifts up to Rs. 50,000.00 upon celebrating special milestones in life such as Graduation, Wedding, Childbirth and 25th Wedding Anniversary. Also, they enjoy a 0.5% concession for pawning advances.
NSB Pension + Account“NSB Pension +” is a contributory pension scheme that allows holders to invest any amount into the account over a period of time, or make a lump sum investment. With a minimum balance of Rs. 100,000.00 in the account, account holder will start receiving a pension, upon reaching the age of 55 years.
Happy Savings AccountWith a Happy Savings Account, the more you save; the higher the interest you will be paid. The account has no restrictions on withdrawals. This account can be opened by anyone aged over 16 years, with a minimum initial deposit of Rs. 1,000.00.
Smile Savings AccountAny person above the age of 16 years can open and operate a Smile account either individually or jointly. This account can be opened with an initial deposit of Rs. 100.00. Deposits and withdrawals can be made at any NSB branch or Post/Sub Post Office, island-wide.
Five Years Savings AccountThis is a high interest-bearing NSB savings scheme for customers of all ages who prefer long term saving plans. A customer has to continually make a monthly deposit of Rs. 100.00/200.00/300.00/
400.00/500.00 or any multiple of Rs. 1,000.00, over a 60-month period, on any convenient day in a given calendar month. For customers who have completed five years of Savings with Five Years account could open a Five Years+ account and enjoy higher interest rates.
Reality Savings PlanThis is a specially designed savings plan for the Sri Lankan Migrant Community. Can be opened as an Individual, Joint or Minor Savings account and should be maintained only in Sri Lankan Rupees. The maturity period of the plan can be 02, 03, 04 or 05 years and can have the maturity values as minimum of Rs. 500,000.00 or as multiples of Rs. 500,000.00. Account holders enjoy benefits of Insurance cover up to Rs. 1,000,000.00 and Personal loans with relaxed terms.
1.2 Term deposits
The Bank also accepts tenure-based deposits of fixed amounts for different maturity periods. A term deposit customer may withdraw his/her money before the expiry of the relevant maturity period in accordance with the applicable premature rates. Tenures range from three months to five years, and they indeed are targeted at children, senior citizens, societies and corporates.
Fixed Deposits (FDs)Any person of over 16 years of age can open a NSB Fixed Deposit Account, either individually or jointly with someone, while parents/guardians can open and operate an account, on behalf of a child, provided the child concerned is below 16 years old. The minimum amount required to open a 12-month FD is Rs. 1,000.00, and if one wants to open a monthly-interest earning 12-month FD, then, the minimum amount is the Rs. 25,000.00. Fixed Deposit Accounts can be opened for 3/6/12/24/36/60 months maturity periods. FD customer can raise a loan against the deposit.

Governance Financial Reports Supplementary Information
427Annual Report 2019 │ National Savings BankProducts and Services
Gaurawa FD AccountAny Senior Citizen aged over 55 years can open a Gaurawa Fixed Deposit Account, which will earn for the customer a monthly interest, which will always be 0.5% above the rate paid to the bank’s normal FD customer. The minimum deposit, a senior citizen can deposit in a Gaurawa FD a/c is Rs.25,000.00, while the maximum is Rs. 20 Mn.
Senior Citizens’ Special Fixed Deposit It is a fixed deposit for senior citizens aged over 60 years. The Maximum amount that can be deposited in a Senior Citizen’s Special Fixed Deposit is Rs. 1.5 Mn., while a holder of this of the deposit will earn 15% as interest, upon maturity.
PrarthanaPrarthana is a specially designed Minor FD account. Parents or Guardian could open a prarthana FD account on behalf of a child. The account assures a fixed amount of return as mentioned in the face value of the certificate upon turning the age of 16 years. Prarthana guarantees a secured future for children with a higher interest rate in the market.
Prarthana +Prarthana + is an extended version of the Prarthana FD certificate where anyone above the age of 16 could open the account as an individual or joint account for a period from 1 to 20 years. The account could be opened for fixed maturity values from Rs. 25,000.00 to Rs. 10,000,000.00.
1.3 Foreign Currency Products Foreign Currency Savings Accounts/Term depositsThe Bank also offers foreign currency savings deposits or term deposits to both resident and non-resident Sri Lankans. A Personal Foreign Currency Accounts (NR) can be opened by any Sri Lankan national employed abroad, while a Personal Foreign Currency Accounts (R) can be opened by any resident citizen who is either in possession of foreign currency or is receiving foreign currency remittances. Then, Special Inward Investment Accounts (IIA) are on offer for foreign nationals, Sri Lankan citizens resident abroad, Non-nationals of Sri Lankan origin resident abroad, corporate entities incorporated outside Sri Lanka and foreign institutional investors.
Money Changing BusinessWith the approval of Central Bank of Sri Lanka to engage in Money Changing Business, NSB offers the service to the customers who possess Foreign Currency Notes to convert them and also customers who travel abroad could purchase foreign currency notes at the selected branches at competitive exchange rates.
2. Lending ProductsCorporate LendingThe Bank is also engaged in corporate lending for long-term infrastructure or other development projects, in the areas of power-generation, telecommunication, healthcare, highway and irrigation etc. Such loans will be granted in the form of direct loans to a bank/financial institution, either as part of a syndicated loan or as a direct loan to private corporate entities/State Owned Enterprises (SOE).
Home/Property LoansThe bank offers home loans to people who intent to construct, renovate, purchase or repair a home, to purchase a land to build a house on as well as to pay off a home loan obtained from another financial institution. The following are the home loan products which are available for different customer segments.• Ge Dora• Alankara• Vikasitha• Home Loans for Government
Employees
Personal loansThe Bank offers personal loans to its customers for meeting the costs; associated with the purchase of consumer goods, healthcare, travel abroad, Solar Panels and education. The bank obtains the security interest over properties such as primary mortgage of the borrower’s property, item purchased, surrender value of the borrowers’ life insurance policy or Government Securities they own. This loan is also available with personal guarantors. The repayment period and the amount of a loan are dependent on the nature of the collateral provided and the prospective borrower’s circumstances. The following personal loans are available:• Normal Personal Loan;• Buddhi Loan;• Special Pension Loan;• Charika Loan;• Eco Loan.• Auto Loan
Loans against Deposits – Speed LoansSpeed loans are loans granted against the deposits of an account-holder. The Bank offers speed loans of up to 90% of a customer’s deposits with the bank, while the deposits will serve as security.

Governance Financial Reports Supplementary Information
428 National Savings Bank │ Annual Report 2019 Products and Services
3. Card ServicesShopping + ATM CardThe Bank issues “Shopping + ATM Cards’’ connected to customers’ savings accounts which provides easy access to cash by enabling the customers to make ATMs withdrawals and pay for their purchases.
NSB Easy CardThe “NSB Easy Card” is a master card that is issued against the balance in customer’s fixed deposit account, with credit limit of up to 80% of the deposit balance. Additionally cardholders can also withdraw cash with their NSB Easy card from any ATM with Master card logo, including all NSB ATMs.
4. Other ServicesPawningThe Bank provides instant loans for short-term credit needs at comparatively low rates of interest, against the security of jewellery and fully-automated machinery is used to check the valued gold articles. Part payment on pawned articles is also possible
Trade Finance ServicesThe Bank facilitates import trade transactions targeting the retail sector; especially importation of motor vehicles. Issuance of Letters of Credit (LC), handling import bills under LC, issuance of shipping and air freight guarantees, collection of bills and forward exchange bookings are the services offered at all the branches under trade financing.
Treasury ServicesThis services include money market activities, trading in Government Securities and derivative transactions.
NSB U-Trust“NSB U-Trust” is the Bank’s foreign currency remittance service. Through this service, Sri Lankans working abroad can remit their earnings to their families back home. In fact, money can be sent either to a NSB account or to an account elsewhere. A beneficiary can also collect his/her remittance, over the counter, at any NSB branch or main Post Office.
NSB Reach“NSB Reach” is the bank’s POS device-based savings mobilisation programme, which has enabled people to save without going through the hassle of visiting a branch, as its tagline says, “Your Address is our Address”. The Bank comes to the doorstep of the customers to collect deposits to increase the saving habit with convenience.
NSB i Saver NSB i Saver is a digital innovation which is expected to provide customer convenience through Mobitel standalone and all franchisee outlets at any time during the day. This innovative service is expected to further inculcate the habit of savings amongst Sri Lanka’s populace, thus resulting in wealth creation and mobility of funds for investment.
Now from anywhere and at any time anyone can deposit to their NSB Savings Account through your nearest mCash retailers island-wide from the NSB iSaver Service.
Advantages of NSB i Saver• Extended operational hours• Weekend and holiday banking• Real-Time transaction process• Hassle-free customer convenience• Low cost on deposits mobilisation
No fee will be charged from the Savings Account Holders or Third Party depositor.
GuaranteesThis is an instrument, which amounts to an unconditional undertaking by the Bank, to discharge the liability of a depositor; in the event of his/her failing to discharge the obligation. The following types of guarantees can be issued against deposits on the request of the customer: Performance Bonds, Bid Bonds, Retention Bonds, Retention guarantees, Tender Bonds, Advance Payment Guarantees.
Standing OrderA standing order will enable customers to authorise the Bank to make a series of payments on your behalf to a names payee or beneficiary by debiting your savings account with a fixed payment amount. Standing order within the NSB accounts are free of charge.
Safety Deposit LockerNSB provides a safe and trusted place for safekeeping of valued belongings. The facility allows to store valuable belongings and documents under safe custody at a nominal annual rental at selected branches. Safety Lockers are available in three sizes as Small, Medium and Large.
Nomination An account holder can nominate a person who shall be entitled to the money of the stated account in the event of the nominator’s demise. The account holder has the authority to change the nominee/nominees at discretion.
Utility Bill PaymentsUtility Bill Payment Services are available at NSB and anyone can pay utility bills at any of our branches island wide. Bills will be updated online as soon as the payment being made.

Governance Financial Reports Supplementary Information
429Annual Report 2019 │ National Savings BankProducts and Services
SMS BankingSMS Banking service is available to any NSB savings account-holder. With SMS Banking, customers can pay their utility bills and transfers funds between NSB accounts.
Internet BankingNSB relaunched its internet banking facility with a new interface and features in 2019 with the theme “e-connect anytime”. The facility allows NSB customers to check their account balances, transfer funds from their accounts to any account, no matter which bank the transferee’s account is, on top of reloading facility and paying utility bills, online.
Collection Centers at SchoolNSB was involved in establishing Collection Centers at Schools where school children learn the habit of savings and get used to leadership role within the school.
NSB Call CentreThe NSB Call Centre provides assistance to customers to contact the bank and inquire about the bank’s activities. Indeed, any person can come to the Call Centre on 2379379 and get information related to any NSB product or service. As well, they can reach it via e-mail, Skype too. What’s more, web-chatting too is possible, if they so wish to.

Governance Financial Reports Supplementary Information
430 National Savings Bank │ Annual Report 2019
Income Statement in US Dollars
Bank Group
For the year ended 31 December 2019USD ’000
2018USD ’000
Change%
2019USD ’000
2018USD ’000
Change%
Gross income 671,788 612,463 10 693,172 617,161 12
Interest income 654,161 604,827 8 663,098 611,460 8 Less: Interest expenses 495,307 468,628 6 500,653 473,215 6
Net interest income 158,854 136,199 17 162,445 138,246 18 Fee and commission income 6,949 5,502 26 6,995 5,520 27 Less: Fee and commission expenses 727 773 (6) 754 792 (5)
Net fee and commission income 6,222 4,729 32 6,241 4,728 32 Net gain/(loss) from trading 8,218 (3,872) 312 10,817 (5,815) 286 Net fair value gains/(losses) from financial instruments at fair value through profit or loss – – – – – – Net gains/(losses) from derecognition of financial assets 121 38 218 121 38 218 Net other operating income 2,338 5,968 (61) 12,141 5,958 104
Total operating income 175,753 143,062 23 191,765 143,154 34 Less: Impairment charges 3,116 4,767 (35) 3,255 4,767 (32)
Net operating income 172,639 138,295 25 188,510 138,387 36
Less: ExpensesPersonnel expenses 55,967 50,697 10 56,298 50,915 11 Depreciation and amortisation expenses 5,746 3,496 64 5,775 3,502 65 Other expenses 24,651 22,960 7 24,581 22,773 8
Operating profit before VAT, NBT and DRL on financial services 86,275 61,142 41 101,857 61,198 66 Less: Value added tax (VAT) on financial services 16,782 14,108 19 17,678 14,144 25 Nation Building Tax (NBT) on financial services 2,017 1,881 7 2,114 1,886 12 Debt Repayment Levy (DRL) on financial services 9,836 1,688 483 9,935 1,688 489
Operating profit after VAT, NBT and DRL on financial services 57,640 43,465 33 72,130 43,480 66
Share of profits of associates and joint ventures – – – – – –
Profit before income tax 57,640 43,465 33 72,130 43,480 66 Less: Income tax expenses 20,735 18,835 10 22,378 18,850 19
Profit for the year 36,905 24,630 50 49,752 24,630 102
Profit attributable to:Equity holders of the Bank 36,905 24,630 50 49,752 24,630 102 Non-controlling interests – – – – – –
Profit for the year 36,905 24,630 50 49,752 24,630 102
Earnings per share on profitBasic earnings per ordinary share (USD) 0.04 0.03 33 0.05 0.03 67 Diluted earnings per ordinary share (USD) 0.04 0.03 33 0.05 0.03 67
Profit for the year 36,905 24,630 50 49,752 24,630 102

Governance Financial Reports Supplementary Information
431Annual Report 2019 │ National Savings Bank
Statement of Comprehensive Income in US Dollars
Bank Group
For the year ended 31 December 2019USD ’000
2018USD ’000
Change%
2019USD ’000
2018USD ’000
Change%
Profit for the year 36,905 24,630 50 49,752 24,630 102
Items that will be reclassified to income statementExchange differences on translation of foreign operations – – – – – – Net gains/(losses) on cash flow hedges – (1,598) 100 – (1,598) 100 Net gains/(losses) on investments in debt instruments measured at fair value through other comprehensive income – – – – – – Share of profits of associates and joint ventures – – – – – – Debt instruments at fair value through other comprehensive income 705 (699) 200 1,252 (816) 253 Less: Fair value gains/(losses) transferred to income statement on disposal of debt instrument at fair value through other comprehensive income (76) 7 (986) (76) 7 (986)Less: Tax expense relating to items that will be reclassified to income statement – – – – – –
Total items that will be reclassified to income statement 629 (2,289) (127) 1,177 (2,407) (196)
Items that will not be reclassified to income statementChange in fair value on investments in equity instruments designated at fair value through other comprehensive income (1,789) (3,779) 53 (1,765) (3,779) (53)Change in fair value attributable to change in the Bank's own credit risk on financial liabilities designated at fair value through profit or loss – – – – – – Remeasurement of post-employment benefit obligations (20,391) (1,154) (1,667) (20,399) (1,156) (1,664)Changes in revaluation surplus – – – – – – Share of profits of associates and joint ventures – – – – – – Less: Tax expense relating to items that will not be reclassified to income statement – – – – – –
Total items that will not be reclassified to income statement (22,180) (4,933) 350 (22,163) (4,935) 349 Other comprehensive income for the year, net of taxes (21,550) (7,222) (198) (20,987) (7,342) (186)
Total comprehensive income for the year 15,355 17,408 (12) 28,766 17,289 66
Attributable to:Equity holders of the Bank 15,355 17,408 (12) 28,766 17,289 66 Non-controlling interests
Total comprehensive income for the year 15,355 17,408 (12) 28,766 17,289 66
US Dollars conversion rate (Rs.) 181.4992 182.7084 181.4992 182.7084

Governance Financial Reports Supplementary Information
432 National Savings Bank │ Annual Report 2019
Statement of Financial Position in US Dollars
Bank Group
As at 31 December 2019USD ’000
2018USD ’000
Change%
2019USD ’000
2018USD ’000
Change%
AssetsCash and cash equivalents 29,624 18,798 57.59 30,660 18,811 63 Balances with central banks – – – – 1 (100)Placements with banks 68,124 96,265 (29.23) 86,751 96,265 (10)Derivative financial instruments 64 25,944 (100) 64 25,944 (100)Financial assets recognised through profit or loss – measured at fair value 63,140 91,295 (31) 121,930 147,051 (17) – designated at fair value – – – – – – Financial assets at amortised cost – loans and advances 2,503,565 2,314,588 8 2,515,913 2,314,725 9 – debt and other instruments 3,391,940 2,840,307 19 3,413,612 2,862,338 19 Financial assets measured at fair value through other comprehensive income 19,167 33,849 (43) 25,491 42,628 (40)Investments in subsidiaries 26,507 9,304 185 – – – Investments in associates and joint ventures – – – – – – Property, plant and equipment 78,036 73,701 6 79,656 73,717 8 Right of used assets 5,915 – 100 6,231 – 100 Investment properties – – – 1,836 – 100 Goodwill and intangible assets – – – – – – Deferred tax assets – – – 2 – 100 Other assets 193,929 170,814 14 194,878 172,585 13 Total assets 6,380,010 5,674,865 12 6,477,024 5,754,066 13
LiabilitiesDue to banks 193,088 422,089 (54) 199,114 457,643 (56)Derivative financial instruments – 8 (100) – 8 (100)Financial liabilities recognised through profit or loss – – – – – – Financial liabilities at amortised cost – due to depositors 5,600,985 4,595,160 22 5,595,812 4,595,160 22 – due to debt securities holders – – – – – – – due to other borrowers 116,823 81,030 44 180,761 119,043 52 Lease liability 5,878 – 100 6,179 – 100 Debt securities issued 147,062 286,736 (49) 148,517 286,736 (48)Retirement benefit obligations 35,861 20,967 71 36,015 20,978 72 Current tax liabilities – – – 3,117 – 100Deferred tax liabilities 3,015 3,188 (5) 3,019 3,188 (5)Other provisions – – – – – – Other liabilities 32,791 29,814 10 40,939 29,842 37 Due to subsidiaries 3 4 (25) – – – Total liabilities 6,135,506 5,438,996 13 6,213,474 5,512,599 13
EquityStated capital/assigned capital 51,791 51,448 1 51,791 51,448 1 Statutory reserve fund 19,630 17,667 11 19,676 17,667 11 Retained earnings 24,598 21,809 13 39,857 24,964 60 Other reserves 148,486 144,945 2 152,227 147,388 3 Total shareholders’ equity 244,504 235,869 4 263,551 241,467 9 Non-controlling interests – – – – – –
Total equity 244,504 235,869 12 263,551 241,467 11
Total equity and liabilities 6,380,010 5,674,865 3 6,477,024 5,754,066 3
Contingent liabilities and commitments 57,054 24,528 133 58,907 24,528 140 US Dollars conversion rate (Rs.) 181.4992 182.7084 181.4992 182.7084

Governance Financial Reports Supplementary Information
433Annual Report 2019 │ National Savings Bank
Basel III Disclosures as per Schedule III of Banking Act Direction No. 1 of 2016
Basel III – Minimum Disclosure Requirements under Pillar III
Key Regulatory Ratios – Capital and Liquidity
Item Bank Group
31.12.2019 31.12.2018 31.12.2019 31.12.2018
Regulatory capital (Rs. ’000)Common equity Tier 1 30,699,940 29,786,983 35,233,934 32,109,803 Tier 1 capital 30,699,940 29,786,983 35,233,934 32,109,803 Total capital 36,641,062 36,209,220 41,235,169 38,458,283
Regulatory capital ratios (%)Common Equity Tier 1 capital ratio (minimum requirement: 2019 – 7% , 2018 – 7.375%) 12.023 13.078 13.903 13.901Tier 1 capital ratio (minimum requirement: 2019 – 8.5%, 2018 – 8.875%) 12.023 13.078 13.903 13.901Total Capital Ratio (minimum requirement: 2019 – 12.50%, 2018 – 12.875%) 14.349 15.898 16.271 16.649Leverage ratio (minimum requirement: 3%) 5.13 4.76 5.57 4.91
Regulatory liquidityStatutory liquid assets (Rs. ’000) 568,490,585 424,490,106 N/A N/AStatutory liquid assets ratio (minimum requirement – 20%) N/A N/ADomestic banking unit (%) 60.20 54.88 N/A N/AOff-shore banking unit (%) N/A N/ALiquidity coverage ratio (%) – rupee (minimum requirement – 2019 – 100%, 2018 – 90%) 278.12 245.06 N/A N/A
Liquidity coverage ratio (%) – all currency (minimum requirement – 2019 – 100%, 2018 – 90%) 276.64 321.29 N/A N/ANet stable funding ratio (minimum requirement: 2019 – 100%) 175.00 147.00 N/A N/A

Governance Financial Reports Supplementary Information
434 National Savings Bank │ Annual Report 2019 Basel III Disclosures as per Schedule III of Banking Act Direction No. 1 of 2016
Basel III – Computation of Capital Ratios
Item Bank Group
31.12.2019Rs. ’000
31.12.2018Rs. ’000
31.12.2019Rs. ’000
31.12.2018Rs. ’000
Common Equity Tier 1 (CET1) Capital after adjustments 30,699,940 29,786,983 35,233,934 32,109,803 Total Common Equity Tier 1 (CET1) Capital 35,731,231 35,083,863 38,964,292 36,016,061 Equity capital (stated capital)/Assigned capital 9,400,000 9,400,000 9,400,000 9,400,000 Reserve fund 3,562,872 3,227,960 3,571,214 3,227,960 Published retained earnings/(Accumulated retained losses) (323,526) (521,772) 2,446,077 54,687 Published accumulated other comprehensive income (OCI) (0) (114,210) (38,843) (252,431)General and other disclosed reserves 23,091,885 23,091,885 23,585,844 23,585,844 Unpublished current year’s profit/(losses) and gains reflected in OCI – – – – Ordinary shares issued by consolidated banking and financial subsidiaries of the Bank and held by third parties – – – – Total adjustments to CET1 Capital 5,031,291 5,296,879 3,730,357 3,906,257 Goodwill (net) – – – – Intangible assets (net) 598,876 576,075 599,063 576,341 Revaluation losses of property, plant and equipment 19,183 19,183 19,183 19,183 Deferred tax assets (net) – – 338 73 Cash flow hedge reserve – – – – Investments in the capital of banking and financial institutions where the Bank does not own more than 10% of the issued ordinary share capital of the entity 3,034,023 3,313,374 3,111,774 3,310,660 Significant investments in the capital of financial institutions where the Bank owns more than 10% of the issued ordinary share capital of the entity 1,379,209 1,388,248 – – Additional Tier 1 (AT1) Capital after adjustments – – – – Total Additional Tier 1 (AT1) Capital – – – – Qualifying Additional Tier 1 capital instruments – – – – Instruments issued by consolidated banking and financial subsidiaries of the Bank and held by third parties – – – – Total adjustments to AT1 Capital – – – – Investment in own shares – – – – Tier 2 Capital after adjustments 5,941,122 6,422,237 6,001,235 6,348,481 Total Tier 2 Capital 7,716,942 8,846,497 7,844,414 8,846,497 Qualifying Tier 2 Capital instruments 2,400,000 3,600,000 2,400,000 3,600,000 Revaluation gains 3,565,866 3,565,866 3,565,866 3,565,866 Loan loss provisions 1,751,076 1,680,631 1,878,548 1,680,631 Instruments issued by consolidated banking and financial subsidiaries of the Bank and held by third parties – – – –
Total adjustments to Tier 2 Capital 1,775,820 2,424,260 1,843,179 2,498,016
Basel III Disclosures as per Schedule III of Banking Act Direction No. 1 of 2016

Governance Financial Reports Supplementary Information
435Annual Report 2019 │ National Savings BankBasel III Disclosures as per Schedule III of Banking Act Direction No. 1 of 2016
Item Bank Group
31.12.2019Rs. ’000
31.12.2018Rs. ’000
31.12.2019Rs. ’000
31.12.2018Rs. ’000
Investment in own shares – – – – Investments in the capital of financial institutions and where the Bank does not own more than 10% of the issued capital carrying voting rights of the issuing entity 1,775,820 2,424,260 1,843,179 2,498,016 CET 1 Capital 30,699,940 29,786,983 35,233,934 32,109,803 Total Tier 1 Capital 30,699,940 29,786,983 35,233,934 32,109,803 Total Capital 36,641,062 36,209,220 41,235,169 38,458,283 Total Risk Weighted Assets (RWA) 255,352,931 227,764,971 253,429,495 230,996,164RWAs for Credit Risk 210,553,851 185,160,694 205,801,527 184,740,583RWAs for Market Risk 10,397,072 11,393,908 12,539,688 14,825,756RWAs for Operational Risk 34,402,008 31,210,369 35,088,280 31,429,825
CET 1 Capital Ratio (including Capital Conservation Buffer, Countercyclical Capital Buffer and Surcharge on D-SIBs (%) 12.023 13.078 13.903 13.901of which: Capital Conservation Buffer (%) 2.500 1.875 2.500 1.875of which: Countercyclical Buffer (%) 0.000 0.000 0.000 0.000of which: Capital Surcharge on D-SIBs (%) 0.000 1.000 0.000 1.000Total Tier 1 Capital Ratio (%) 12.023 13.078 13.903 13.901
Total Capital Ratio (including Capital Conservation Buffer, Countercyclical Capital Buffer and Surcharge on D-SIBs) (%) 14.349 15.898 16.271 16.649of which: Capital Conservation Buffer (%) 2.500 1.875 2.500 1.875of which: Countercyclical Buffer (%) 0.000 0.000 0.000 0.000of which: Capital Surcharge on D-SIBs (%) 0.000 1.000 0.000 1.000
The difference arises between the retained earnings balance in Basel III capital adequacy computation and the financial reporting are due to the following:
(1) The Bank’s practice was to transfer the current year retained earnings to the general reserve until end of 2015 and it was changed to maintain part of the current year retained earnings to a separately maintained Retained Earnings Reserve with effect from 31 December 2016. Therefore one of the differences between the retained earnings balance in the financial reporting and the Basel III capital adequacy computation is the accumulated actuarial loss of Rs. 5.351 Bn. on retirement benefit plan which has been adjusted to the general reserve prior to 2016.
(2) Further, with the adoption of the SLFRS 9, only 50% of the first day impact of Rs. 1.126 Bn. considered in Basel III capital adequacy computation as the Bank is allowed to stagger the first day impact throughout a transitional period of four years by CBSL, whereas first day impact in full is considered in the financial reporting.

Governance Financial Reports Supplementary Information
436 National Savings Bank │ Annual Report 2019 Basel III Disclosures as per Schedule III of Banking Act Direction No. 1 of 2016
Computation of Leverage Ratio
Item Bank Group
Rs. ’000 Rs. ’000
Tier 1 Capital 30,699,940 35,233,934 Total Exposures 598,970,403 632,644,534 On-Balance Sheet Items (excluding derivatives, and securities financing transactions, but including collateral) 539,867,408 559,965,812 Derivative Exposures 30,271 30,271 Securities Financing Transaction Exposures 54,004,335 67,580,062 Other Off-Balance Sheet Exposures 5,068,389 5,068,389 Basel III Leverage Ratio (%) (Tier 1/Total Exposure) 5.13 5.57
Basel III – Computation of Liquidity Coverage Ratio (Bank) – All Currency
Item 2019 2018
Total unweighted
valueRs. ’000
Total weighted
valueRs. ’000
Total unweighted
valueRs. ’000
Total weighted
valueRs. ’000
Total Stock of high-quality liquid assets (HQLA) 573,969,613 571,476,200 422,527,455 419,793,574 Total adjusted Level 1A assets 571,069,898 571,069,898 423,926,486 423,926,486 Level 1 assets 568,492,786 568,492,786 416,569,693 416,569,693 Total adjusted Level 2A assets 700,000 595,000 700,000 595,000 Level 2A assets 700,000 595,000 700,000 595,000 Total adjusted Level 2B assets 4,776,827 2,388,413 5,257,763 2,628,881 Level 2B assets 4,776,827 2,388,413 5,257,763 2,628,881 Total cash outflows 1,050,359,131 219,206,052 942,681,904 185,180,897 Deposits 782,572,753 78,257,275 686,030,059 68,603,006 Unsecured wholesale funding 235,430,751 135,531,774 140,398,948 72,159,192 Secured funding transactions 19,658,863 – 66,860,079 – Undrawn portion of committed (irrevocable) facilities and other contingent funding obligations 8,882,727 1,602,966 5,198,560 238,338 Additional requirements 3,814,037 3,814,037 44,194,258 44,194,258 Total cash inflows 24,866,670 12,624,833 23,871,472 54,523,804 Maturing secured lending transactions backed by collateral 5,985,702 2,855,380 4,801,432 2,450,006 Committed facilities – – – – Other inflows by counterparty which are maturing within 30 days 14,223,114 9,769,453 16,118,248 11,262,873 Operational deposits 4,657,854 – 2,951,791 – Other cash inflows – – 40,810,925 40,810,925 Liquidity Coverage Ratio (%) (stock of high quality liquid assets/total net cash outflow over the next 30 calendar days)*100 – 276.64 – 321.29

Governance Financial Reports Supplementary Information
437Annual Report 2019 │ National Savings BankBasel III Disclosures as per Schedule III of Banking Act Direction No. 1 of 2016
Main Features of Regulatory Capital Instruments
Description of the capital instrument
Issuer National Savings BankUnique identifierGoverning law(s) of the instrument Sri LankaOriginal date of issuance 29 December 2016Par value of instrument 100Perpetual or dated DatedOriginal maturity date 29 December 2021Amount recognised in regulatory capital (Rs. ’000) 2,400,000 Accounting classification (equity/liability) Liability
Issuer call subject to prior supervisory approvalOptional call date, contingent call dates and redemption amount (Rs. ’000) N/ASubsequent call dates N/A
Coupons/dividendsFixed or floating dividend/coupon FixedCoupon rate and any related index 13%Non-cumulative or cumulative Non-cumulative
Convertible or non-convertibleIf convertible, conversion trigger(s) N/AIf convertible, fully or partially N/AIf convertible, mandatory or optional N/AIf convertible, conversion rate N/A
Summary discussion on adequacy/meeting current and future capital requirementsFor summary discussion on adequacy/meeting current and future capital requirements, refer risk management report on pages 271 to 274.

Governance Financial Reports Supplementary Information
438 National Savings Bank │ Annual Report 2019 Basel III Disclosures as per Schedule III of Banking Act Direction No. 1 of 2016
Credit Risk under Standardised Approach (Bank)
Credit Risk Exposures and Credit Risk Mitigation (CRM) Effects
As at 31 December 2019 Exposures before Credit conversion factor (CCF)
and CRM
Exposures post CCF and CRM
RWA and RWA density
Asset class
On-balance sheet amountRs. ’000
Off-balance sheet amountRs. ’000
On-balance sheet amountRs. ’000
Off-balance sheet amountRs. ’000
RWA
Rs. ’000
RWA density (ii)
(%)
Claims on Central Government and CBSL 635,717,189 – 632,586,234 – 82,414 0.0 Claims on foreign sovereigns and their central banks – – – – – – Claims on public sector entities 134,234,567 1,275,522 9,359,595 – 3,296,817 35.2 Claims on official entities and multilateral development banks – – – – – – Claims on banks exposures 34,633,043 2,000,000 34,633,043 1,000,000 13,394,791 37.6 Claims on financial institutions 9,442,798 936,386 9,442,798 468,193 5,112,969 51.6 Claims on corporates 11,588,134 – 11,588,134 – 5,528,761 47.7 Retail claims 214,887,258 2,229,581 184,107,837 134,713 110,921,355 60.2 Claims secured by residential property 71,763,720 896,454 71,763,720 448,227 36,335,722 50.3 Claims secured by commercial real estate – – – – – – Non-performing assets (NPAs)(i) 4,980,569 – 4,980,569 – 4,490,125 90.2 Higher risk categories 3,431,791 – 3,431,791 – 8,579,479 250.0
Cash items and other assets 20,824,818 3,017,254 20,824,818 3,017,254 22,811,422 95.7
Total 1,141,503,885 10,355,197 982,718,540 5,068,387 210,553,851 21.3
Note:(i) NPAs – As per Banking Act Directions on classification of loans and advances, income recognition and provisioning.(ii) RWA Density – Total RWA/exposures post CCF and CRM.

Governance Financial Reports Supplementary Information
439Annual Report 2019 │ National Savings BankBasel III Disclosures as per Schedule III of Banking Act Direction No. 1 of 2016
Credit Risk under Standardised Approach (Group)
Credit Risk Exposures and Credit Risk Mitigation (CRM) Effects
As at 31 December 2019 Exposures before Credit conversion factor (CCF)
and CRM
Exposures post CCF and CRM
RWA and RWA density
Asset class
On-balance sheet amountRs. ’000
Off-balance sheet amountRs. ’000
On-balance sheet amountRs. ’000
Off-balance sheet amountRs. ’000
RWA
Rs. ’000
RWA density (ii)
(%)
Claims on Central Government and CBSL 639,666,379 – 636,515,788 – 82,414 0.0 Claims on foreign sovereigns and their central banks – – – – – – Claims on public sector entities 134,234,731 1,275,522 9,359,759 – 3,296,981 35.2 Claims on official entities and multilateral development banks – – – – – – Claims on banks exposures 38,222,225 2,000,000 38,222,223 1,000,000 14,358,533 36.6 Claims on financial institutions 9,443,747 936,386 9,443,747 468,193 5,113,443 51.6 Claims on corporates 11,597,200 – 11,597,200 – 5,534,515 47.7 Retail claims 216,947,350 2,238,631 186,161,446 134,713 112,698,439 60.5 Claims secured by residential property 71,969,636 896,454 71,969,636 448,227 36,541,639 50.5 Claims secured by commercial real estate – – – – – – Non-performing assets (NPAs)(i) 5,085,310 – 5,085,310 – 4,594,421 90.3 Higher risk categories – – – – – –
Cash items and other assets 21,600,679 3,017,254 21,600,679 3,017,254 23,581,144 95.8
Total 1,148,767,253 10,364,247 989,955,787 5,068,387 205,801,527 20.7
Note:(i) NPAs – As per Banking Act Directions on classification of loans and advances, income recognition and provisioning.(ii) RWA Density – Total RWA/Exposures post CCF and CRM.

Governance Financial Reports Supplementary Information
440 National Savings Bank │ Annual Report 2019 Basel III Disclosures as per Schedule III of Banking Act Direction No. 1 of 2016
Credit Risk under Standardised Approach: Exposures by Asset Classes and Risk Weights (Bank)
As at 31 December 2019Description (Post CCF and CRM)
Risk weight
Asset classes
0%
Rs. ’000
20%
Rs. ’000
50%
Rs. ’000
75%
Rs. ’000
100%
Rs. ’000
150%
Rs. ’000
>150%
Rs. ’000
Total credit exposures
amountRs. ’000
Claims on Central Government and CBSL 632,174,164 412,070 – – – – – 632,586,234
Claims on foreign sovereigns and their central banks – – – – – – – –
Claims on public sector entities – 7,578,473 – – 1,781,122 – – 9,359,595
Claims on official entities and multilateral development banks – – – – – – – –
Claims on banks exposures – 18,730,607 14,507,537 – 2,394,900 – – 35,633,044
Claims on financial institutions – 543,655 8,726,197 – 641,139 – – 9,910,990
Claims on corporates – 5,232,940 3,746,042 – 2,609,153 – – 11,588,134
Retail claims 35,895,601 616,104 – 147,730,845 – – – 184,242,551
Claims secured by residential property – – 71,752,449 – 459,497 – – 72,211,947
Claims secured by commercial real estate – – – – – – – –
Non-performing assets (NPAS) – – 1,216,002 – 3,529,449 235,117 – 4,980,568
Higher risk categories – – – – – – 3,431,791 3,431,791
Cash items and other assets 928,018 128,290 – – 22,785,763 – – 23,842,071
Total 668,997,783 33,242,138 99,948,227 147,730,845 34,201,023 235,117 3,431,791 987,786,925

Governance Financial Reports Supplementary Information
441Annual Report 2019 │ National Savings BankBasel III Disclosures as per Schedule III of Banking Act Direction No. 1 of 2016
Credit Risk under Standardised Approach: Exposures by Asset Classes and Risk Weights (Group)
As at 31 December 2019Description (Post CCF and CRM)
Risk weight
Asset classes
0%
Rs. ’000
20%
Rs. ’000
50%
Rs. ’000
75%
Rs. ’000
100%
Rs. ’000
150%
Rs. ’000
>150%
Rs. ’000
Total credit exposures
amountRs. ’000
Claims on Central Government and CBSL 636,103,718 412,070 – – – – – 636,515,788
Claims on foreign sovereigns and their central banks – – – – – – – –
Claims on public sector entities – 7,578,473 – – 1,781,287 – – 9,359,759
Claims on official entities and multilateral development banks – – – – – – – –
Claims on banks exposures – 21,500,101 15,327,223 – 2,394,900 – – 39,222,224
Claims on financial institutions – 543,655 8,727,146 – 641,139 – – 9,911,939
Claims on corporates – 5,232,940 3,752,665 – 2,611,595 – – 11,597,200
Retail claims 35,899,396 639,434 – 148,747,107 1,010,222 – – 186,296,159
Claims secured by residential property – – 71,752,449 – 665,414 – – 72,417,863
Claims secured by commercial real estate – – – – – – – –
Non-performing assets (NPAS) – – 1,225,593 – 3,615,898 243,818 – 5,085,309
Higher risk categories – – – – – – – –
Cash items and other assets 934,157 128,290 – – 23,555,485 – – 24,617,932
Total 672,937,272 36,034,962 100,785,076 148,747,107 36,275,939 243,818 – 995,024,175

Governance Financial Reports Supplementary Information
442 National Savings Bank │ Annual Report 2019 Basel III Disclosures as per Schedule III of Banking Act Direction No. 1 of 2016
Market Risk under Standardised Measurement Method
Bank Group
Item RWAAmount as at
31.12.2019Rs. ’000
RWAAmount as at
31.12.2019Rs. ’000
(a) RWA for interest rate risk 4,329,904 6,452,804General Interest Rate Risk 4,329,904 6,452,804(i) Net long or short position 4,329,904 6,452,804(ii) Horizontal disallowance – – (iii) Vertical disallowance – – (iv) Options – – Specific interest rate risk – –
(b) RWA for equity 3,806,886 3,826,604(i) General Equity Risk 2,032,522 2,044,249(ii) Specific Equity Risk 1,774,363 1,782,355
(c) RWA for Foreign Exchange and Gold 2,260,290 2,260,290Capital charge for market risk [(a)+(b)+(c)] *CAR 1,299,635 1,567,462
Operational Risk under Basic Indicator Approach
Bank
Capital Charge Factor
%
Gross income as at 31.12.2019
Rs. ’000Capital Charge 1st year
Rs. ’000 2nd year
Rs. ’000 3rd yearRs. ’000
The basic indicator approach 15 27,981,561 26,157,586 31,865,882Capital charge 4,300,251Risk weighted amount for operational risk 34,402,008
Group
Capital Charge Factor
%
Gross income as at 31.12.2019
Rs. ’000Capital Charge 1st year
Rs. ’000 2nd year
Rs. ’000 3rd yearRs. ’000
The basic indicator approach 15 28,423,674 26,174,478 33,122,544Capital charge 4,386,035Risk weighted amount for operational risk 35,088,280

Governance Financial Reports Supplementary Information
443Annual Report 2019 │ National Savings BankBasel III Disclosures as per Schedule III of Banking Act Direction No. 1 of 2016
Differences between Accounting and Regulatory Scopes and Mapping of Financial Statement Categories with Regulatory Risk Categories
Bank
As at 31 December 2019 a b c d e
Item Carrying values as reported
in Published Financial
Statements
Rs. ’000
Carrying values under Scope
of Regulatory Reporting
Rs. ’000
Subject to Credit Risk Framework
Rs. ’000
Subject to Market Risk Framework
Rs. ’000
Not subject to Capital
Requirements or subject to
Deduction from Capital
Rs. ’000
Assets 1,157,966,664 1,158,415,877 981,454,119 11,388,483 165,573,275 Cash and cash equivalents 5,376,715 8,507,827 5,350,892 25,981 3,130,955 Balances with Central Bank – – – – – Placements with banks 12,364,469 12,062,950 12,062,950 – – Derivative financial instruments 11,622 – – – – Financial assets recognised through profit or loss measured at fair value 11,459,882 14,396,525 – 11,362,502 3,034,023 Financial assets designated at fair value through profit or loss – – – – –
Financial assets at amortised cost: – – – – – – Loans and receivables to banks 18,619,616 16,699,404 16,699,404 – – – Loans and receivables to other customers 435,775,341 438,345,208 282,690,816 – 155,654,393 – Debt and other instruments/financial – investments held to maturity 615,634,321 599,120,141 597,344,321 – 1,775,820
Financial assets measured at fair value through OCI 3,478,811 – – – – Investments in subsidiaries 4,811,000 4,811,000 3,431,791 – 1,379,209 Investments in associates and joint ventures – – – – – Property, plant and equipment 14,163,454 13,564,578 13,564,578 – – Investment properties – – – – – Intangible assets – 598,876 – – 598,876 Deferred tax assets – – – – – Other assets 36,271,431 50,309,367 50,309,367 – –

Governance Financial Reports Supplementary Information
444 National Savings Bank │ Annual Report 2019 Basel III Disclosures as per Schedule III of Banking Act Direction No. 1 of 2016
Differences between Accounting and Regulatory Scopes and Mapping of Financial Statement Categories with Regulatory Risk Categories (Contd.)
Bank (Contd.)
As at 31 December 2019 a b c d e
Carrying values as reported
in Published Financial
Statements
Rs. ’000
Carrying values under Scope
of Regulatory Reporting
Rs. ’000
Subject to Credit Risk Framework
Rs. ’000
Subject to Market Risk Framework
Rs. ’000
Not subject to Capital
Requirements or subject to
Deduction from Capital
Rs. ’000
Liabilities 1,113,589,340 1,106,811,080 – – – Due to banks 35,045,251 34,788,732 – – – Derivative financial instruments – – – – – Financial liabilities recognised through profit – – – – – Financial liabilities at amortised cost: – – – – – – Due to other customers 1,016,574,286 984,583,051 – – – – Due to debt securities holders – – – – – – Due to other borrowers 21,203,242 20,880,039 – – – Debt securities issued 20,685,300 20,000,000 – – – Retirement benefit obligations 6,508,707 – – – – Current tax liabilities – – – – – Deferred tax liabilities 547,250 547,250 – – – Other provisions – – – – – Other liabilities 7,018,346 40,011,461 – – – Due to subsidiaries 547 547 – – – Subordinated term debt 6,006,411 6,000,000 – – –
Off-balance sheet liabilities 10,355,197 10,355,197 5,068,387 – – Guarantees 1,952,525 1,952,525 – – – Performance bonds – – – – – Letters of credit 277,056 277,056 134,713 – – Other contingent items – – – – – Undrawn loan commitments 5,108,362 5,108,362 1,916,420 – – Other commitments 3,017,254 3,017,254 3,017,254 – –
Shareholders’ equity 9,400,000 9,400,000 – – – Equity capital (stated capital)/ assigned capital – – – – – of which amount eligible for CET 1 9,400,000 9,400,000 – – – of which amount eligible for AT 1 – – – – – Retained earnings 4,464,442 – – – – Accumulated other comprehensive income 318,006 – – – – Other reserves 30,194,877 42,204,798 – – – Total shareholders’ equity 44,377,324 51,604,798 – – –

Governance Financial Reports Supplementary Information
445Annual Report 2019 │ National Savings BankBasel III Disclosures as per Schedule III of Banking Act Direction No. 1 of 2016
Explanations of Differences between Accounting and Regulatory Exposure Amounts (Bank)
The carrying value of loans and advances in the published Financial Statements has been subject to impairment provisions based on the principles of “expected credit loss” as per SLFRS 9 (Refer Note 21 of the Financial Statements for details) while the carrying value of regulatory reporting is as per the Banking Act Direction No. 4 of 2008 on "Classification of Loans and Advances, Income Recognition and Provisioning" issued by the CBSL are “time/delinquency based”. Bank assess the impairment of loans and advances individually or collectively. The impairment allowance is based on the credit losses expected to arise by considering the change in the risk of default occurring over the remaining life of the financial instrument. As per the Banking Act Direction on the prudential norms for classification, valuation and operation of the Bank’s investment portfolio, Financial assets recognised through profit or loss – measured at fair value and Financial assets measured at fair value through OCI are classified as Held for trading under regulatory reporting and accrued interest classified under other assets category. Financial assets at amortised cost – debt and other instruments are classified as Held to maturity investments (Banking Book) under regulatory reporting and accrued interest classified under other assets category. The “Fair value” is defined as the best estimate of the price that would be received to sell an asset or be paid to transfer a liability in an orderly transaction between market participants at the measurement date. A variety of valuation techniques combined with the range of plausible market parameters as at a given point in time may still generate unexpected uncertainty beyond fair value. Refer Note 56 of the Financial Statements for details on valuation methodologies.
Further, all financial instruments except equity considered in regulatory reporting differs with the published Financial Statements since impairment allowances based on expected losses under SLFRS 9 were netted off for publication purposes.
A “Day 1 difference” is recognised as per SLFRS 9 in contrary to regulatory reporting, when the transaction price differs from the fair value of other observable current market transactions in the same instrument E.g. Employee loans below market rates. Derivatives are financial instruments which derive values in response to changes in interest rates, financial instrument prices, commodity prices, foreign exchange rates, credit risk and indices. The fair value of these derivative financial instruments is determined using forward pricing models. The positive fair value changes of these financial instruments as at reporting date are reported as assets while the negative fair value changes are reported as liabilities. The details of derivative financial instruments have been disclosed in Note 19 to the Financial Statements. Derivatives are disclosed under off-balance sheet in the regulatory reporting.
Bank’s Risk Management Approach and Risk Management Related to Key Risk Exposures
Bank’s Risk Management Approach and Risk Management Related to Key Risk Exposures are explained in Risk Management Report on pages 248 to 274.

Governance Financial Reports Supplementary Information
446 National Savings Bank │ Annual Report 2019
D-SIB Assessment Exercise – 2019
(As per the Banking Act Direction No. 10 of 2019) GroupRs. Mn.
Size indicator Section 1 – Total exposuresTotal exposures measure 1,241,380
Interconnectedness IndicatorsSection 2 – Intra-Financial system assetsa. Funds deposited with or lent to other financial institutions (including unused portion of committed lines extended) 43,224 (i) Funds deposited 19,776 (ii) Lending 23,448b. Holdings of securities issued by other financial institutions 10,283c. Net positive current exposure of securities financing transactions (SFTs) with other financial institutions 5,158d. Over-the-counter (OTC) derivatives with other financial institutions that have a net positive mark to market value 12Intra-financial system assets 58,677
Section 3 – Intra-Financial system liabilitiesa. Funds deposited by or borrowed from other financial institutions (including unused portion of committed lines obtained) 12,667 (i) Funds deposited 643 (ii) Borrowings 12,024b. Net negative current exposure of securities financing transactions with other financial institutions 332 c. Over-the-counter derivatives with other financial institutions that have a net negative mark to market value – Intra-financial system liabilities 13,000
Section 4 – Securities outstandingSecurities outstanding 26,264
Substitutability/Financial institution infrastructure indicatorsSection 5 – Payments made in the reporting year (excluding intragroup payments)Payments activity 3,739,961
Section 6 – Assets Under custodyAssets under custody –
Section 7 – Underwritten transactionUnderwritten transaction –
Section 8 – Trading volumeTrading Volume (No. of Shares) 19,723,038

Governance Financial Reports Supplementary Information
447Annual Report 2019 │ National Savings BankD-SIB Assessment Exercise – 2019
(As per the Banking Act Direction No. 10 of 2019) GroupRs. Mn.
Complexity indicatorsSection 9 – Notional amount of over-the-counter (OTC) Derivatives OTC derivatives 2,000
Section 10 – Level 2 assetsLevel 2 assets 5,479
Section 11 – Trading and available for sale (AFS) securitiesa. debt instruments 21,358b. equity instruments 5,399c. derivatives 12
Section 12 – Cross-Jurisdictional liabilitiesCross-jurisdictional liabilities (excluding derivatives and intragroup liabilities) 13,642
Section 13 – Cross-Jurisdictional claimsCross-jurisdictional claims (excluding derivatives and intragroup claims) 1,651

Governance Financial Reports Supplementary Information
448 National Savings Bank │ Annual Report 2019
Disclosure requirements under the prescribed format issued by the Central Bank of Sri Lanka for preparation of Annual Financial Statements of licensed specialised banks.
Other Disclosure Requirements as required by CBSL
Disclosure requirements Description Page number/s
1. Information about the significance of financial instruments for financial position and performance
1.1 Statement of financial position
1.1.1 Disclosures on categories of financial assets and financial liabilities. Notes to the Financial Statements:Note 15 – Analysis of financial instruments by measurement basis
335-337
1.1.2 Other disclosures
i. Special disclosures about financial assets and financial liabilities designated to be measured at fair value through profit or loss, including disclosures about credit risk and market risk, changes in fair values attributable to these risks and the methods of measurement.
Significant accounting policies:Note 2.5.1.4.5 Financial assets measured at fair value through profit or loss (FVPL)Note 2.5.1.5.1 Financial liabilities at fair value through profit or loss (FVPL)
313-314
314
ii. Reclassifications of financial instruments from one category to another.
Significant accounting policies:Note 2.5.1.7 Reclassification of financial assets and liabilities
315-316
iii. Information about financial assets pledged as collateral and about financial or non-financial assets held as collateral.
Notes to the Financial Statements:Note 22 – Financial assets at amortised cost – Debt and other instruments
351-352
iv. Reconciliation of the allowance account for credit losses by class of financial assets.
Note 16 – Cash and cash equivalentNote 18 – Placement with banksNote 21 (d) – Movement in impairment during the year (Loan and advances)Note 22 (b) – Movement in impairment during the year (debt and other instruments)
338338-339348-350
352
v. Information about compound financial instruments with multiple embedded derivatives.
The Bank does not have financial instruments with multiple embedded derivatives
vi. Breaches of terms of loan agreements. None
1.2 Statement of comprehensive income
1.2.1 Disclosures on items of income, expense, gains and losses Notes to the Financial Statements:Notes 3-13 to the Financial Statements 323-333
1.2.2 Other disclosures
i. Total interest income and total interest expense for those financial instruments that are not measured at fair value through profit and loss.
Notes to the Financial Statements:Note 4 – Net interest income 323-325

Governance Financial Reports Supplementary Information
449Annual Report 2019 │ National Savings BankOther Disclosure Requirements as required by CBSL
Disclosure requirements Description Page number/s
ii. Fee income and expense. Notes to the Financial Statements:Note 5 – Net fee and commission income 325-326
iii. Amount of impairment losses by class of financial assets. Notes to the Financial Statements:Note 10 – Impairment charges 329
iv. Interest income on impaired financial assets. Notes to the Financial Statements:Note 4 (a) interest income 324
1.3 Other disclosures
1.3.1 Accounting policies for financial instruments. Note 2.5 – Significant accounting policies – recognition of assets and liabilitiesFinancial instruments
312
1.3.2 Information on financial liabilities designated at FVPL. The Bank/Group has not designated any financial liability at FVPL. Notes to the Financial Statements:Note 2.5.1.5.1 – Financial liabilities at fair value through profit or loss
314
1.3.3 Investments in equity instruments designated at FVOCI
i. Details of equity instruments that have been designated as at FVOCI and the reasons for the designation.
Notes to the Financial Statements:Note 23 – Financial assets at fair value through other comprehensive income 353-356
ii. Fair value of each investment at the reporting date. Notes to the Financial Statements:Note 23 (d) – Quoted investments – Equity securitiesNote 23 (e) – Unquoted investments – Equity securities
355
356
iii. Dividends recognised during the period, separately for investments derecognised during the reporting period and those held at the reporting date.
Notes to the Financial Statements:Note 9 – Net other operating income 328
iv. Transfer cumulative gain or loss within equity during the period and the reasons for those transfers.
Income Statement, Statement of Other Comprehensive Income and Statement of Changes in Equity
296-303
v. If investments in equity instruments measured at FVOCI are derecognised during the reporting period:– reasons for disposing of the investments– fair value of the investments at the date of derecognition– the cumulative gain or loss on disposal
Income Statement, Statement of Other Comprehensive Income and Statement of Changes in Equity
296-303

Governance Financial Reports Supplementary Information
450 National Savings Bank │ Annual Report 2019 Other Disclosure Requirements as required by CBSL
Disclosure requirements Description Page number/s
1.3.4 Reclassification of financial assets
i. For all reclassifications of financial assets in the current or previous reporting period:– date of reclassification– detailed explanation of the change in the business model and a
qualitative description of its effect on the financial statements– the amount reclassified into and out of each category
During the period the Bank did not reclassify financial assets
ii. For reclassifications from FVTPL to amortised cost or FVOCI:– the effective interest rate (EIR) determined on the date of
reclassification– the interest revenue recognised
During the period, the Bank has not classified financial instruments from FVOCI to amortised cost
iii. For reclassifications from FVOCI to amortised cost, or from FVTPL to amortised cost or FVOCI:– The fair value of the financial assets at the reporting date– The fair value gain or loss that would have been recognised
in profit or loss or OCI during the reporting period if the financial assets had not been reclassified.
During the period, the Bank has not classified financial instruments from FVPL to amortised cost or FVOCI
1.3.5 Information on hedge accounting Notes to the Financial Statements:Note 19 – Derivative financial instruments 339-342
1.3.6 Information about the fair values of each class of financial asset and financial liability, along with:
i. Comparable carrying amounts. Notes to the Financial Statements:Note 56.4 – Fair value of financial instruments 422-423
ii. Description of how fair value was determined. Notes to the Financial Statements:2.1.12.2 – Fair value of financial instruments2.3 – Fair value measurementNote 56.2 – Determination of fair value and fair value hierarchyNote 56.5 Determination of fair value
308
419-421423-424
iii. The level of inputs used in determining fair value. Notes to the Financial Statements:Note 56 – Fair value of financial instruments
419-424
iv. a. Reconciliations of movements between levels of fair value measurement hierarchy.
b. Additional disclosures for financial instruments that fair value is determined using level 3 inputs.
No movements between levels of fair value hierarchy during the yearNote 56.3 – Reconciliation of movements between levels of fair value measurement hierarchy 422
v. Information if fair value cannot be reliably measured. Notes to the Financial Statements:Note 23 (e) – Unquoted investments – equity securitiesNote 56.5 – Determination of fair value
356423-424

Governance Financial Reports Supplementary Information
451Annual Report 2019 │ National Savings BankOther Disclosure Requirements as required by CBSL
Disclosure requirements Description Page number/s
2. Information about the nature and extent of risks arising from financial instruments
2.1 Qualitative disclosures.
2.1.1 Risk exposures for each type of financial instrument. Notes to the Financial Statements:Note 54 – Financial risk managementRisk management report
396-414248-274
2.1.2 Management’s objectives, policies, and processes for managing those risks.
Notes to the Financial Statements:Note 54 – financial risk managementRisk management report
396-414248-274
2.1.3 Changes from the prior period. No major policy changes during the period under review
2.2 Quantitative disclosures.
2.2.1 Summary of quantitative data about exposure to each risk at the reporting date.
Notes to the Financial Statements:Note 54 – Financial risk managementRisk management report
396-414248-274
2.2.2 Disclosures about credit risk, liquidity risk, market risk, operational risk, interest rate risk and how these risks are managed.
i. Credit risk
(a) Maximum amount of exposure (before deducting the value of collateral), description of collateral, information about credit quality of financial assets that are neither past due nor impaired and information about credit quality of financial assets.
Notes to the Financial Statements:Note 54.1.1 – Credit quality analysis 397-403
(b) For financial assets that are past due or impaired, disclosures on age, factors considered in determining as impaired and the description of collateral on each class of financial asset.
Notes to the Financial Statements:Note 54.1.1 – Credit quality analysis 397-403
(c) Information about collateral or other credit enhancements obtained or called.
Notes to the Financial Statements:Note 54.1.1. (b) – Management of the credit portfolio 399-401
(d) Credit risk management practices: Notes to the Financial Statements:
– CRM practices and how they relate to the recognition and measurement ECL, including the methods, assumptions and information used to measure ECL.
Note 2.5.2.3 – Overview of the ECL principlesNote 10 – Impairment charges
317-318329
– Quantitative and qualitative information to evaluate the amounts in the Financial Statements arising from ECL, including changes and the reasons for those changes.
Note 10 – Impairment charges 329
– How the Bank determines whether the credit risk of financial instruments has increased significantly since initial recognition
Note 2.5.2.7 – Significant increase in credit risk 319
– The Bank’s definitions of default for different financial instruments, including the reasons for selecting those definitions.
Note 2.5.2.8 – Definition of default and credit impaired assets 319
– How instruments are grouped if ECL are measured on a collective basis.
Note 10 – Impairment charges 329

Governance Financial Reports Supplementary Information
452 National Savings Bank │ Annual Report 2019 Other Disclosure Requirements as required by CBSL
Disclosure requirements Description Page number/s
– How the bank determines that financial assets are credit-impaired.
Note 2.5.2 – Impairment of financial assets (Policy applicable from 1 January 2019) 317-319
– The Bank’s write-off policy, including the indicators that there is no reasonable expectation of recovery.
Note 21 (d) – Movements in impairment during the year 348-350
– How the modification requirements have been applied. Note 2.5.1.9 – Modification of financial assets and financial liabilities 316-317
(e) ECL calculations:
– Basis of the inputs, assumptions and the estimation techniques used when estimating ECL.
Note 2.5.2.4 – The calculation of ECL 318-319
– How forward-looking information has been incorporated into the determination of ECL.
Note 2.5.2.6 – Forward looking information 319
– Changes in estimation techniques or significant assumptions made during the reporting period.
Note 2.2 – Changes in accounting policies 309-310
(f) Amounts arising from ECL:
– Reconciliation for each class of financial instrument of the opening balance to the closing balance of the impairment loss allowance.
Note 16 – Cash and cash equivalentNote18 – Placement with banksNote 21 (d) – Movement in impairment during the year (Loan and advances)
338338-339
348-350
– Explain the reasons for changes in the loss allowances in the reconciliation.
Note 22 (b) – Movement in impairment during the year (debt and other instruments)
352
(g) Collateral: Notes to the Financial Statements:
– Bank’s maximum exposure to credit risk at the reporting date Note 54.1.1 (a) – Net exposure to Credit risk by class of financial assets 397-399
– Description of collateral held as security and other credit enhancements
Note 54.1.1 (b) – Management of the credit portfolio 399-401
(h) Written-off assets Notes to the Financial Statements:Note 21 (d) – Movement in impairment during the year (loans and advances) 348-350
i. Pillar III disclosures of the Banking Act Directions No. 1 of 2016 on Capital requirements under Basel III for Licensed Banks
Risk Management Report 248-274
ii. Liquidity risk
(a) A maturity analysis of financial liabilities. Notes to the Financial Statements:Note 55 – Maturity analysis 415-418
(b) Description of approach to risk management. Notes to the Financial Statements:Note 54 – Financial risk managementRisk management report
396-414248-274
(c) Pillar III disclosures of the Banking Act Direction No. 1 of 2016 on capital requirements under Basel III for Licensed Banks
Risk management report 248-274

Governance Financial Reports Supplementary Information
453Annual Report 2019 │ National Savings BankOther Disclosure Requirements as required by CBSL
Disclosure requirements Description Page number/s
iii. Market risk
(a) A sensitivity analysis of each type of market risk to which the Bank exposed.
Notes to the Financial Statements:Note 54.3 – Market riskRisk management report
406-414248-274
(b) Additional information, if the sensitivity analysis is not representative of the Bank's risk exposure.
Risk management report 248-274
(c) Pillar III disclosures of the Banking Act Direction No. 1 of 2016 on Capital requirements under Basel III for Licensed Banks
Risk management report 248-274
iv. Operational risk
Pillar III disclosures of the Banking Act Direction No. 1 of 2016 on capital requirements under Basel III for Licensed Banks
Risk management report 248-274
v. Equity risk in the banking book
(a) Qualitative disclosures:
Differentiation between holdings on which capital gains are expected and those taken under other objectives including for relationship and strategic reasons.
Notes to the Financial Statements:Note 23 – Financial assets at fair value through other comprehensive income 353-356
Discussion of important policies covering the valuation and accounting of equity holdings in the banking book.
Notes to the Financial Statements:Note 23 – Financial assets at fair value through other comprehensive income 353-356
(b) Quantitative disclosures:
Value disclosed in the statement of financial position of investments, as well as the fair value of those investments; for quoted securities, a comparison to publicly quoted share values where the share price is materially different from fair value.
Notes to the Financial Statements:Note 20 – Financial assets recognised at through profit or lossNote 23 – Financial assets at fair value through other comprehensive income
343-346
353-356
The types and nature of investments
The cumulative realised gains/(losses) arising from sales and liquidations in the reporting period.
Notes to the Financial Statements:Note 6 – Net Gain/(loss) from tradingNote 8 – Net Gain/(loss) from derecognition of financial assets
327
328
vi. Interest rate risk in the banking book
(a) Qualitative disclosures:
Nature of interest rate risk in the banking book (IRRBB) and key assumptions
Notes to the Financial Statements:Note 54 – Financial risk managementRisk management report
396-414248-274
(b) Quantitative disclosures:
The increase/(decline) in earnings or economic value (or relevant measure used by Management) for upward and downward rate shocks according to Management’s method for measuring IRRBB, broken down by currency (as relevant).
Risk management report 248-274
2.2.3 Information on concentrations of risk Notes to the Financial Statements:Note 54 Financial risk managementRisk Management Report
396-414248-274
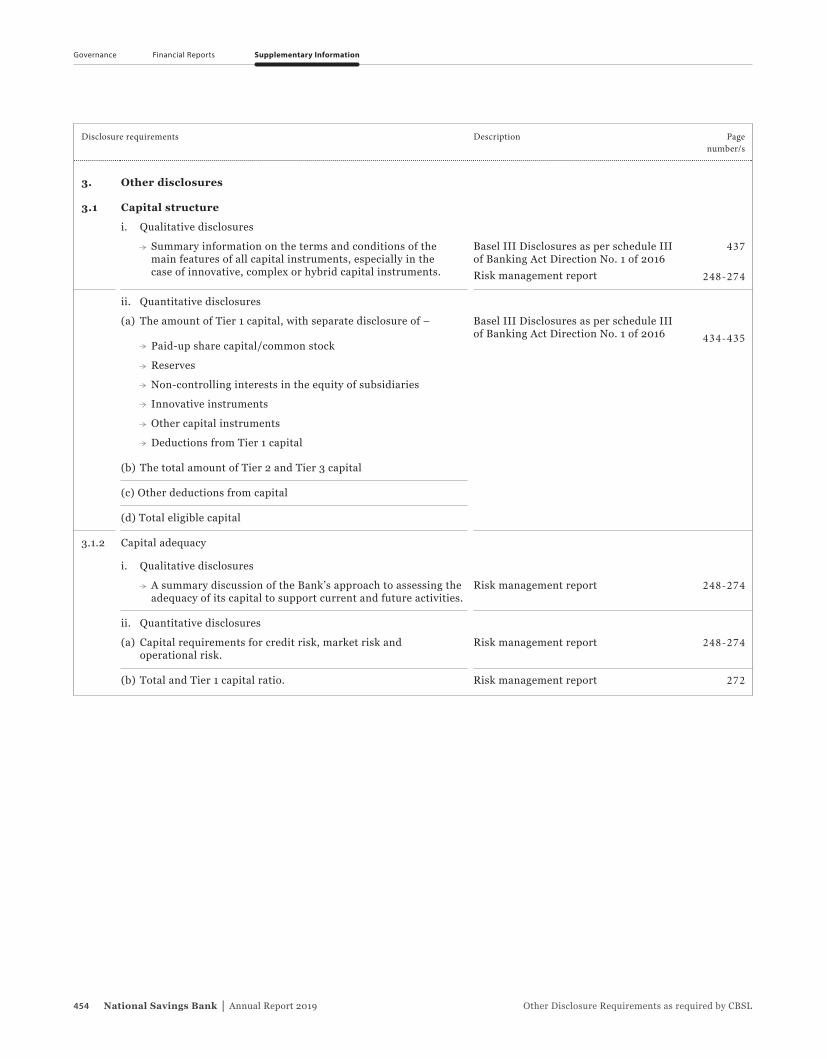
Governance Financial Reports Supplementary Information
454 National Savings Bank │ Annual Report 2019 Other Disclosure Requirements as required by CBSL
Disclosure requirements Description Page number/s
3. Other disclosures
3.1 Capital structure
i. Qualitative disclosures
Summary information on the terms and conditions of the main features of all capital instruments, especially in the case of innovative, complex or hybrid capital instruments.
Basel III Disclosures as per schedule III of Banking Act Direction No. 1 of 2016Risk management report
437
248-274
ii. Quantitative disclosures
(a) The amount of Tier 1 capital, with separate disclosure of – Basel III Disclosures as per schedule III of Banking Act Direction No. 1 of 2016 434-435
Paid-up share capital/common stock
Reserves
Non-controlling interests in the equity of subsidiaries
Innovative instruments
Other capital instruments
Deductions from Tier 1 capital
(b) The total amount of Tier 2 and Tier 3 capital
(c) Other deductions from capital
(d) Total eligible capital
3.1.2 Capital adequacy
i. Qualitative disclosures
A summary discussion of the Bank’s approach to assessing the adequacy of its capital to support current and future activities.
Risk management report 248-274
ii. Quantitative disclosures
(a) Capital requirements for credit risk, market risk and operational risk.
Risk management report 248-274
(b) Total and Tier 1 capital ratio. Risk management report 272

Governance Financial Reports Supplementary Information
455Annual Report 2019 │ National Savings Bank
Statistical Indicators 2010-2019
2010 2011 2012 2013 2014 2015 2016 2017 2018 2019
Operating results (Rs. Mn.)Gross income 50,070 46,545 52,903 65,573 77,890 79,282 87,399 107,996 111,902 121,929 Interest income 48,142 47,096 52,531 64,248 74,023 78,128 86,390 103,579 110,507 118,730 Interest expenses 31,487 29,296 39,142 54,141 52,642 51,146 60,923 78,445 85,622 89,898 Net interest income 16,655 17,800 13,389 10,107 21,380 26,983 25,467 25,134 24,885 28,832 Other income 1,929 (578) 347 1,292 3,798 1,043 872 4,308 1,254 3,067Operating expenses, provisions and VAT 8,807 7,967 7,396 9,120 14,706 14,991 13,036 15,307 18,197 21,438Profit before tax 9,777 9,255 6,340 2,279 10,472 13,034 13,303 14,135 7,941 10,462 Income tax 4,386 3,193 2,578 1,095 3,606 4,361 3,805 4,419 3,441 3,763 Profit after tax 5,391 6,062 3,763 1,184 6,867 8,672 9,498 9,716 4,500 6,698
Contribution to the Government 10,107 7,970 6,327 4,731 11,043 11,016 19,251 13,440 7,536 11,348
ASSETS (Rs. Mn.)Cash and short-term funds 1,355 1,398 1,466 1,546 1,927 3,240 4,620 3,850 3,435 5,377Loans and investments 395,334 455,914 492,009 632,187 757,182 821,494 878,046 969,036 988,736 1,102,155Property, plant and equipment 4,971 5,247 5,264 5,692 5,594 7,025 7,277 12,396 13,466 15,237Other assets 2,733 3,415 10,075 14,943 14,764 16,320 21,761 25,696 31,209 35,198
Total 404,393 465,974 508,813 654,368 779,466 848,079 911,704 1,010,977 1,036,846 1,157,967
Liabilities and shareholders’ funds (Rs. Mn.)Total deposits 364,430 421,849 457,650 501,890 554,060 595,776 657,280 737,213 839,574 1,016,574Repo/borrowings/ subordinated liabilities 11,436 16,270 22,958 120,561 191,192 207,101 213,162 224,143 144,313 82,940Differed taxation 27 96 123 143 270 504 416 507 582 547Other liabilities 5,997 4,707 4,314 9,557 10,684 12,274 8,600 10,019 9,280 13,528Shareholders’ funds 22,503 23,052 23,767 22,217 23,260 32,424 32,246 39,096 43,095 44,377
Total 404,393 465,974 508,813 654,368 779,466 848,079 911,704 1,010,977 1,036,846 1,157,967
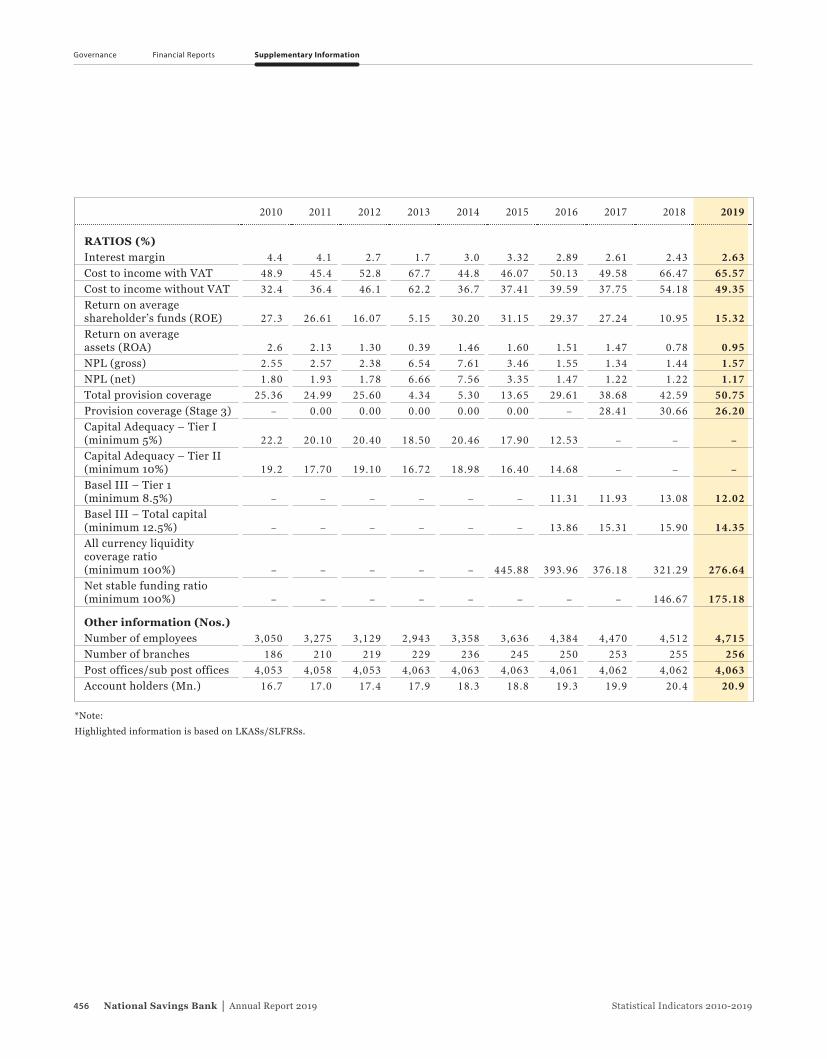
Governance Financial Reports Supplementary Information
456 National Savings Bank │ Annual Report 2019 Statistical Indicators 2010-2019
2010 2011 2012 2013 2014 2015 2016 2017 2018 2019
RATIOS (%)Interest margin 4.4 4.1 2.7 1.7 3.0 3.32 2.89 2.61 2.43 2.63 Cost to income with VAT 48.9 45.4 52.8 67.7 44.8 46.07 50.13 49.58 66.47 65.57 Cost to income without VAT 32.4 36.4 46.1 62.2 36.7 37.41 39.59 37.75 54.18 49.35 Return on average shareholder’s funds (ROE) 27.3 26.61 16.07 5.15 30.20 31.15 29.37 27.24 10.95 15.32 Return on average assets (ROA) 2.6 2.13 1.30 0.39 1.46 1.60 1.51 1.47 0.78 0.95 NPL (gross) 2.55 2.57 2.38 6.54 7.61 3.46 1.55 1.34 1.44 1.57 NPL (net) 1.80 1.93 1.78 6.66 7.56 3.35 1.47 1.22 1.22 1.17 Total provision coverage 25.36 24.99 25.60 4.34 5.30 13.65 29.61 38.68 42.59 50.75Provision coverage (Stage 3) – 0.00 0.00 0.00 0.00 0.00 – 28.41 30.66 26.20 Capital Adequacy – Tier I (minimum 5%) 22.2 20.10 20.40 18.50 20.46 17.90 12.53 – – – Capital Adequacy – Tier II (minimum 10%) 19.2 17.70 19.10 16.72 18.98 16.40 14.68 – – – Basel III – Tier 1 (minimum 8.5%) – – – – – – 11.31 11.93 13.08 12.02Basel III – Total capital (minimum 12.5%) – – – – – – 13.86 15.31 15.90 14.35All currency liquidity coverage ratio (minimum 100%) – – – – – 445.88 393.96 376.18 321.29 276.64Net stable funding ratio (minimum 100%) – – – – – – – – 146.67 175.18
Other information (Nos.)Number of employees 3,050 3,275 3,129 2,943 3,358 3,636 4,384 4,470 4,512 4,715Number of branches 186 210 219 229 236 245 250 253 255 256Post offices/sub post offices 4,053 4,058 4,053 4,063 4,063 4,063 4,061 4,062 4,062 4,063Account holders (Mn.) 16.7 17.0 17.4 17.9 18.3 18.8 19.3 19.9 20.4 20.9
*Note:
Highlighted information is based on LKASs/SLFRSs.

Governance Financial Reports Supplementary Information
457Annual Report 2019 │ National Savings Bank
Analysis of Deposits
2010Rs. Mn.
2011Rs. Mn.
2012Rs. Mn.
2013Rs. Mn.
2014Rs. Mn.
2015Rs. Mn.
2016Rs. Mn.
2017Rs. Mn.
2018Rs. Mn.
2019Rs. Mn.
Local currency depositsSavings 94,118 105,108 106,177 113,165 139,384 160,814 173,583 185,201 194,946 215,010Time 266,007 311,569 345,794 379,969 408,309 427,588 475,220 542,647 633,632 789,540
360,125 416,677 451,971 493,134 547,692 588,402 648,803 727,849 828,579 1,004,549Growth (%) 13.5 15.7 8.5 9.1 11.1 7.4 10.3 12.2 13.8 21.2
Foreign currency depositsSavings 1,517 1,750 1,963 2,101 2,215 2,568 2,764 2,990 3,376 3,541Time 2,788 3,422 3,717 6,654 4,153 4,806 5,714 6,373 7,620 8,484
4,305 5,172 5,679 8,755 6,368 7,373 8,478 9,364 10,996 12,025Growth (%) 20.3 20.1 9.8 54.2 -27.3 15.8 15.0 10.5 17.4 9.4
Total deposits 364,430 421,849 457,650 501,890 554,060 595,776 657,280 737,213 839,574 1,016,574
Growth (%) 13.5 15.8 8.5 9.7 10.4 7.5 10.3 12.2 13.9 21.1
*Note: Highlighted information is based on LKASs/SLFRSs.

Governance Financial Reports Supplementary Information
458 National Savings Bank │ Annual Report 2019
Correspondent Banks
Banca Popolare
Piazza Garibaldi 1623100,Sondrlom SO,ItalyPOSOIT22 [email protected]: +390342528111 +390342528204
Bank of Tokyo Mitsubishi Japan
2-7-1, Marunouchi,Chiyoda-ku,Tokyo,100-8388,JapanBOTKGPJTwww.bk.mufg.jpTel: +81-3-3240-1111
Citi Bank – NY
388,Greenwich Street New York, NY 10013,USACITIUS33www.citibank.comTel: +800-285-3000
Commerz Bank – German
Commerzbank AG,Kaiser Platz.60311,Frankfurt am Main, GermanyCOBADEFFWWW.fi.commerzbank.comTel: +496913626650
DBS Bank – Singapore
DBS Bank Ltd,2 Changi Business park crescent,Lobby A # 04-02, DBS Asia Hub,Singapore 486029DBSSSGSGwww.dbs.comTel: +65-6-2222200 +65-6-8789010
Deutsche Bank NY Trust Company Americas
No. 60,Wall Street,New York,NY 10005,USABKTRUS33www.deutsche-bank.comTel: +12122502500 +1 212 7970291
Deutsche Bank AG Frankfurt – German
Deutsche Bank AG,P.O. Box: 60202 Frankfurt am Main,GermanyDEUTDEFFwww.deutsche-bank.cemTel: +49 6991000 +49 6991034225
Emirates NBD Bank PJSC
P.O. Box 777,Deira, DubaiUnited Arab Emirateswww.emiratesnbd.comTel: +971-600 540000
Erste Group Bank AG
Am Belvedere 1,1100,Vienna,Austriawww.erstebank.atTel: +43 50100 10100
Keb Hana – Korea
55, Eulji-ro, Jung-gu,Seoul-Republic of Korea KOEXKRSEwww.hanabank.comTel: +82-02-2002-1111
Kookmin Bank
9-1,Namdaemunno 2-Ga,Jung-GuSeoul 100-092CZNBKRSEwww.kbstar.comTel: +82-(2)-2073-2869
Post Finance Bank – Switzerland
Mingerstrasse 20,3030 Berne,SwitzerlandPOFICHBETel: +41-8-4888710
Uni Credito Italiano
Piazza Gae Aulenti 3 Tower A20154 Mingerstrasse 20,54,Italy UNICRITMMwww. unicreditgroup.euTel: +39 02 88 621 +39 02 88 623340
Woori Bank S.Korea
1-203,Hoehyeon-dong,Jung-gu,SeoulHVBKKRSEwww.wooribank.comTel: +82-2-2006 5000

Governance Financial Reports Supplementary Information
459Annual Report 2019 │ National Savings Bank
Exchange Companies
Al Ahalia Exchange
P.O. Box: 35245 Electra Street, Abu Dhabi UAETel: +971229666
Al Ansari Exchange
Al Ansari Exchange LLCAl Ansari Business CentreLevel 8UAETel: +97143772890/ +97143772788
Al Fardan Exch Qatar
Al Fardan Centre Grand HamadAvenueP.O. Box: 339,Doha,QatarTel: +97444537755
Al Fardan Exch UAE
POB 498,Liwa Street,Abu DhabiUAE
Al Fardan Exchange – QatarP.O. Box: 9948,Doha QatarTel: +974444408408
Al Mulla Exchange
P.O. Box: 177 Safat 13002 KuwaitTel: +96522478250/+22478242
Al Rajhi Bank
Olayya Street,Aqaria 3,Riyadh,11411,Kingdom of Saudi Arabiawww.alrajhibank.com.saTel: +96614603333
Al Rostamani
The Maze TowerLevel 18Sheikh Zayed RDPOB 10072,DubaiUAETel: +97144543200 +97144543284
Al Dar for Exchange Works
AlDar for Exchange worksIBA bldg C RingDohaQatar
Arab National Bank – KSA
Building King Faysal StreetAl Mou raba Area 56921. Saudi ArabiaTel: +966114029000
Arabian Exchange
Mercure Grand Hotel(Sofitel Shopping Complex),Ground Floor,Mushaireb Street,P.O. Box: 3535,DohaQatarTel: +97444438300
Bahrain Exchange
Bahrain Exchange CompanyW.L.L M Floor Al Hajery BuildingP.O. Box: 29149,Safat 13152KuwaitTel: +96522089039/+96522280520
Bahrain Finance Company
(Ez remit is a product of BFC)P.O. Box: 243,3rd Floor,Bab Al Bahrain BuildingManamaBahrainTel: +97339958195
Bank Al Bilad
Corporate Banking DivisionP.O. Box: 140Riyadh 11411Saudi ArabiaTel: +96692000/002
City Exchange Company
City Exchange Co. LLC,Al wathan Doha QatarCity-Exchange Main Branch and Head OfficeTel: +974 4476 9777
City International Exchange
Abdullah Dashti BuildingNear KPTC Bus Depot.,Al Mirqab Abdullah MubarakStreet P.O. Box: 21804Safat 13079KuwaitTel: +9652448507/2441845
Delma Exchange
304,Al Montazah Tower,Zayed the first street, Khalidiya,Abu DhabiUAETel: +97124915757
Doha Bank – Qatar
Doha Bank Head Office Tower,Corniche Street West BayP.O. Box 3818,Doha, QatarTel: +97444257683
Dollarco Exchange Co Ltd
P.O. Box: 26270 Safat 13123 KuwaitTel: +96522412767/22454713
Gmoney Trans Co Ltd
305-2,Jong ro,Jongno-gu,Seoul,Republic of Koreawww.gmoneytrans.comTel: +82-2-1670-4565
Habib Qatar Exchange
Al Asmakh BuildingGrand Hamad Street Doha QatarTel: +97444425151/44328853
Index Exchange/former Habib Exchange UAE
Office 201,2nd Floor,Sons of Jassim Darwish Building,Zayad 1st street,KhalidiyahP.O. Box: 2370Abu DhabiUAETel: +97126272656
Instant Cash
Instant Cash FZEP.O. Box: 3014DubaiUAETel:+ 971 4 2059000/Ext: 260
Kapruka Pvt Limited
Kapruka Pty Limited,2251,Princes Highway,Mulgrave,AustraliaTel: +61395445060/95432123
Lulu Exchange
P.O. Box: 881Postal Code 112,Ruwi High Street Muscat,Sultanate of OmanTel: +97126547019
Majan Exchange
P.O. Box: 583P.C. 117RuwiSultanate of OmanTel:+ 96824794017/18
National Exchange Company
Via Ferruccio30,00185RomeItaliaTel:+ 390644341221(Direct)

Governance Financial Reports Supplementary Information
460 National Savings Bank │ Annual Report 2019 Correspondent Banks
Oman & UAE Exchange Centre
P.O. Box: 1116Al HamriyahP.C. 131MuscatSultanate of OmanTel:+ 96824796533
Samba Financial Group
P.O. Box: 833Riyadh 11421Kingdom of Saudi ArabiaTel: +966112117473/+966112117424
Small World
Parliament House, 12 Salamanca Place, London, SE 1 7HB,United KingdomTel: +44 20 7407 1800
Transfast
44 Wall Street,4th FloorNew YorkNY10005 Trans-Fast GCC 903Al Thurayya 2 Dubai Media CityDubai UAETel: +971 4 4587251
UAE Exchange – Abu Dhabi
UAE Exchange Centre LLC, P.O. Box:170, 5th Floor,Tamouh Tower (Building No. 12),Marina Square,Al Reem Island,Abu Dhabi,UAETel: +97124945406
Unistream
20,Verhnyaya Maskovka Street Building 2 127083 Moscow RussiaTel: +74955179260
Valutrans
Valutrans SPAVia M.Gioia,168 20125 MilanItalyTel: +39 0291431306
Wall Street
Wall Street Exchange Center LLC2201 Twin TowersBaniyas Road,DubaiUAETel: +97142284889/ +971508764289/ +971504801659
Xpress Money
X Press Money Services Limited6th FloorAl Ameri Bldg TECOM,P.O. Box: 643996Sheikh Zayad Road, DubaiUAETel: +97148186000Ext: 6132/+97148186227

Governance Financial Reports Supplementary Information
461Annual Report 2019 │ National Savings Bank
Eurogiro Members
Deutsche Post
Deutsche Post Bank Ag Friedrich-Ebert-Allee 53113 Bonn GermanyPBNKDEFFwww.postbank.deTel:+ 114-126, 49 22855005500
Israel Postal Company Ltd
217,Jaffa Street,Jerusalem,91999,Israelwww.israelpost.co.il
Korea Post
(The 8th building of Government Complex) 19, Doum-5ro, 339-012 Sejong City, Repubpic of Koreawww.koreapost.go.kr
La Banque Postale France
115 rue de sevres CP.P210 75275 Paris Cedex 06 FranceTel:+ 33157754947

Governance Financial Reports Supplementary Information
462 National Savings Bank │ Annual Report 2019
A
Accounting policiesThe specific principles, bases, conventions, rules and practices adopted by an entity in preparing and presenting Financial Statements.
Accrual basisRecognising the effects of transactions and other events when they occur without waiting for receipt or payment of cash or its equivalent.
Actuarial gainGain or loss arising from the difference between estimates and actual experience in an entity’s pension plan.
AmortisationThe systematic allocation of the depreciable amount of an intangible asset over its useful life.
Amortised costAmount at which the financial asset or financial liability is measured at initial recognition, minus principal repayments, plus or minus the cumulative amortisation using the effective interest method of any difference between that initial amount and the maturity amount and minus any reduction for impairment or uncollectability.
Available-for-sale financial assetsAvailable-for-sale financial assets are those non-derivative financial assets that are designated as available-for sale or are not classified as loans and receivables, held-to-maturity investments or financial assets at fair value through profit or loss.
B
Basel IIIBasel III is the global voluntary regulatory framework issued by the Basel Committee on Banking Supervision (BCBS) on Bank Capital Adequacy and Liquidity.
Basis point (BP)One hundredth of a percentage point (0.01 per cent); 100 basis points is 1 percentage point. Used in quoting movements in interest rates or yields on securities. Business model assessmentBusiness model assessment is carried out as the first step of the financial assets classification process. Business model refers to how an entity manages its financial assets in order to generate cash flows. It is determined at a level that reflects how groups of financial assets are managed rather than at an instrument level. SLFRS 9 identifies three types of business models: “hold to collect”, “hold to collect and sell” and “other”. In order to determine the business model, it is necessary to understand the objectives of each business model. An entity would need to consider all relevant information including, for example, how business performance is reported to the entity’s Key Management personnel and how Managers of the business are compensated.
C
Capital adequacy ratioThe relationship between capital and risk-weighted assets as defined in the framework developed by the Bank for International Settlements (BIS)
and as modified by the Central Bank of Sri Lanka to suit local requirements.
Capital conservation buffer (CCB)A capital buffer prescribed by regulators under Basel III and designed to ensure banks build up capital buffers outside periods of stress that can be drawn down as losses are incurred. Should a bank’s capital levels fall within the capital conservation buffer range, capital distributions will be constrained by the regulators
Capital expenditureTotal of additions to property, plant and equipment.
Capital gain(capital profit)The gain on the disposal of an asset calculated by deducting the cost of the asset from the proceeds received on its disposal.
Capital reservesCapital reserves consist of revaluation reserves arising from revaluation of properties owned by the Bank and Reserve Fund set aside for specific purposes defined under the Banking Act No. 30 of 1988 and shall not be reduced or impaired without the approval of the Monetary Board.
Carrying valueValue of an asset or a liability as per books of the Organisation before adjusting for fair value.
Cash GeneratingUnit (CGU)The smallest group of assets that independently generates cash flow and the cash flow is largely independent of the cash flows generated by other assets.
Cash equivalentsShort-term highly liquid investments that are readily convertible to known amounts of cash and which are subject to an insignificant risk of changes in value.
Collective agreementA tripartite agreement entered into among the NSB, Ministry of Finance and Trade Unions.
Collectively assessed loanimpairment provisionsAlso known as portfolio impairment provisions. Impairment assessment on a collective basis for homogeneous groups of loans that are not considered individually significant and to cover losses that has been incurred but has not yet been identified at the reporting date. Loans (housing, personal, auto loans etc.) are assessed on a portfolio basis.
CommitmentsCredit facilities approved but not yet utilised by the clients as at the reporting date.
Concentration riskRisk arisen from uneven distribution of counterparty and portfolio exposures to business sector or geographic region.
ContingenciesA condition or situation existing at reporting date where the outcome will be confirmed only by occurrence or non-occurrence of one or more future events.
Corporate governanceThe process by which corporate entities are governed. It is concerned with the way in which power is exercised over the Management and the direction of entity, the supervision of executive actions and accountability to owners and others.
Glossary of Financial and Banking Terms

Governance Financial Reports Supplementary Information
463Annual Report 2019 │ National Savings BankGlossary of Financial and Banking Terms
Cost/income ratioOperating expenses excluding impairment provision and provisioning for fall in value in dealing securities as a percentage of net income.
Cost methodA method of accounting whereby the investment is recorded at cost. The Income Statement reflects income from the investment only to the extent that the investor receives distributions from accumulated net profits of the investee.
Credit ratingsAn evaluation of a corporate’s ability to repay its obligation or the likelihood of not defaulting, carried out by an independent rating agency.
Credit riskCredit risk or default risk is most simply defined as the potential that a borrower or counterparty will fail to meet its obligations in accordance with agreed terms and conditions.
Currency SWAPsThe simultaneous purchase of an amount of a currency for spot settlement and the sale of the same amount of the same currency for forward settlement.
Customer depositsMoney deposited by account holders. Such funds are recorded as liabilities.
D
Dealing securitiesMarketable securities that are acquired and held with the intention of reselling them in the short term.
DebentureA medium-term debt instrument issued by a corporate entity.
Deferred taxSum set aside for tax in the Financial Statements that will become payable in a financial year other than the current financial year.
DepreciationThe systematic allocation of the depreciable amount of an asset over its useful life.
DerecognitionRemoval of previously recognised financial assets or financial liability from an entity’s Statement of Financial Position.
DelinquencyA debt or other financial obligation is considered to be in a state of delinquency when payments are overdue. Loans and advances are considered to be delinquent when consecutive payments are missed. Also known as “Arrears”.
DerivativeFinancial contract of which the value is derived from the value of underlined assets.
Documentary letters of credit (LCs)Written undertakings by a bank on behalf of its customers, authorising a third party to draw on the Bank up to a stipulated amount under specific terms and conditions. Such undertakings are established for the purpose of facilitating international trade.
Domestic Systemically Important Banks (D-SIBs)Systemically Important Banks (SIBs) are perceived as banks that are “Too Big To Fail”. D-SIBs are critical for the uninterrupted availability of essential banking services to the country’s real economy even during crisis. The CBSL has designated LCBs with total assets equal to or greater than Rs. 500 Bn. as D-SIBs.
E
Earnings per ordinaryshare (EPS)Profit attributable to ordinary shareholders divided by the number of ordinary shares in issue.
Economic value added (EVA)A measure of productivity which takes into consideration cost of total invested equity.
Effective income tax rateProvision for taxation divided by the profit before taxation
Effective interest rate (EIR)Rate that exactly discounts estimated future cash payments or receipts through the expected life of the financial instruments or when appropriate a shorter period to the net carrying amount of the financial asset or financial liability.
Equity instrumentAn equity instrument is any contract that evidences a residual interest in the assets of an entity after deducting all its liabilities.
Equity methodThe equity method is a method of accounting whereby the investment is initially recognised at cost and adjusted thereafter for the post-acquisition changes in the investor’s share of net assets of the investee. The profit or loss of the investor includes the investor’s share of the profit or loss of the investee.
Equity riskRisk of depreciating equity investments due to stock market dynamics.
Exposure at default (EAD)EAD is an estimate of the exposure at a future default date, taking into account expected changes in the exposure after the reporting date, including repayments
of principal and interest and expected draw downs of committed facilities.
Expected credit losses (ECLs)ECL approach is the loan loss impairment method under SLFRS 9 on “Financial Instruments”. ECLs are the discounted product of the Probability of Default (PD), Exposure at Default (EAD) and Loss Given Default (LGD). ECL measurements are unbiased and are determined by evaluating a range of possible outcomes.
Exchange gain/lossProfit earned on foreign currency transactions arising from the difference in foreign exchange rates between the transaction/last reporting date and the settlement/ reporting date. Also arises from trading in foreign currencies.
F
Fair valueThe amount for which an asset could be exchanged or a liability settled, between knowledgeable, willing parties in an arm’s length transaction.
Financial assetFinancial asset is any asset that is cash, an equity instrument of another entity or a contractual right to receive cash or another financial asset from another entity.
Financial assets measured atamortised costA financial asset is measured at amortised cost if the asset is held within a business model whose objective is to hold assets to collect contractual cash flows and the contractual terms of the financial asset give rise on specified dates to cash flows that are solely payments of principal and interest on the principal amount outstanding.

Governance Financial Reports Supplementary Information
464 National Savings Bank │ Annual Report 2019 Glossary of Financial and Banking Terms
Financial assets measuredat fair value through othercomprehensive income (FVOCI) FVOCI include debt and equity instruments measured at fair value through other comprehensive income. A debt instrument is measured at FVOCI, if it is held within a business model whose objective is achieved by both collecting contractual cash flows and selling financial assets and the contractual terms of the financial asset give rise on specified dates to cash flows that are solely payments of principal and interest on the principal amount outstanding. Equity investments may be irrevocably classified as FVOCI when they meet the definition of Equity under LKAS 32 Financial Instruments: Presentation and are not held for trading.
Financial assets measured atfair value through profit or loss (FVPL)All financial assets other than those classified at Amortised Cost or FVOCI are classified as measured at FVPL. These are held for trading or managed, and their performance is evaluated on a fair value basis as they are neither held to collect contractual cash flows nor held both to collect contractual cash flows and to sell financial assets.
Financial instrumentFinancial instrument is any contract that gives rise to a financial asset of one entity and a financial liability or equity instrument of another entity.
Financial liabilityFinancial Liability is a contractual obligation to deliver cash or another financial asset to another entity.
Foreclosed propertiesProperties acquired in full or partial; satisfaction of debts.
Foreign currency riskRisk exists in transaction other than the local currency. Adverse movements in foreign exchange rates may decline the value of assets/liabilities held in terms of foreign currency.
Foreign exchange contractAgreement between two parties to exchange one currency for another at a future date at a rate agreed upon today.
G
General provisionsThese are provisions made on loans and advances for anticipated losses on aggregate exposures where credit losses cannot yet be determined on an individual facility basis.
Group A group is a parent and all its subsidiaries.
GuaranteesThree party agreement involving a promise by one party (the guarantor) to fulfil the obligations of a person owing a debt if that person fails to perform.
Global ReportingInitiatives (GRI)The GRI is an international independent standards organisation that helps businesses, governments and other organisations to understand and communicate their impacts on issues such as climate change, human rights and corruption. GRI promotes sustainability reporting as a way for organisations to become more sustainable and contribute to sustainable development.
H
HedgingA strategy under which transactions are effected with the aim of providing cover against the risk of unfavourable price movements (interest rates and prices of commodities etc.).
Held-to-maturity investments(HTM)Non-derivative financial assets with fixed or determinable payments and fixed maturity that an entity has the positive intention and ability to hold to maturity.
Held-for-trading (HFT)Debt and equity investments that are purchased with the intent of selling them within a short period of time (usually less than one year).
High quality liquid assets(HQLA)Assets that are unencumbered, liquid in markets during a time of stress and, ideally, be central bank eligible. These include, for example, cash and claims on central governments and central banks.
I
ICCAPProcess by which the Bank ensures additional capital is provided for banking risks other than those covered in Pillar.
ImpairmentThis occurs when recoverable amount of an asset is less than its carrying amount.
Impaired assets portfolioImpaired assets portfolio is the total of the individually significant impaired loans and individually insignificant loans which are overdue above 180 days.
Impairment allowancesImpairment allowances are provisions held on the Statement of Financial Position as a result of the raising of a charge against profit for the incurred loss. An impairment allowance may either be identified or unidentified as individual (specific) or collective (portfolio) impairment allowance.
Impairment charge/(reversal)the difference between the carrying value of an asset and the sum of discounted future cash flows generating from the same asset.
Impaired loansLoans where the Group does not expect to collect all the contractual cash flows or expects to collect them later than they are contractually due.
Individually assessedimpairmentExposure to loss is assessed on all individually significant accounts and all other accounts that do not qualify for collective assessment.
Intangible assetAn asset that is not physical in nature. Corporate intellectual property (items such as patents, trademarks, copyrights, business methodologies), goodwill software and brand recognition are all common intangible assets in today’s marketplace.
Interest in suspenseInterest suspended on non-performing loans and advances.
Interest rate riskThe risk that the fair value or future cash flows of a financial instrument will fluctuate because of changes in market interest rates.
Interest spreadRepresents the difference between the average interest rate earned and the average interest rate paid on interest earning assets and interest bearing liabilities, respectively. variables such as interest rates, exchange rates, credit spreads and other asset prices.
Investment propertiesInvestment property is property (land or a building – or part of a building – or both) held (by the owner or by the lessee under a finance lease) to earn rentals or for capital appreciation or both, rather than for use or sale.

Governance Financial Reports Supplementary Information
465Annual Report 2019 │ National Savings BankGlossary of Financial and Banking Terms
Investment securitiesSecurities acquired and held for yield or capital growth purposes and are usually held-for-maturity.
Interest rate SWAPAn agreement between two parties (known as counter parties) where one stream of future interest payments is exchanged for another stream of future interest payments based on a specified principal amount.
K
Key Managerial Personnel (KMP)Key managerial personnel are those persons having authority and responsibility for planning, directing and controlling the activities of the Bank, directly or indirectly.
L
Leverage ratioA measure that is the ratio of tier 1 capital to total exposures. This supplementary measure to the risk-based capital requirements is intended to constrain the build-up of excess leverage in the banking sector.
Liquid assetsAssets that are held in cash or in a form that can be converted to cash readily, such as deposits with other banks, bills of exchange and Treasury Bills.
Liquid assets ratioAssets that are held in cash or in a form that can be converted to cash readily (as prescribed by the Central Bank of Sri Lanka) divided by the total liabilities including contingent liabilities.
Lifetime expected credit losses(LTECL)Lifetime ECL are the expected credit losses that result from all possible default events over the expected life of the financial instrument. According
to SLFRS 9 on “Financial instruments”, the ECL allowance should be based on LTECL unless there has been no significant increase in credit risk since origination.
Liquidity coverageratio – LCRRefers to highly liquid assets held by Banks to meet short-term obligations. The ratio represents a generic stress scenario that aims to anticipate market-wide shocks.
Liquidity riskThe risk that an entity will encounter difficulty in meeting obligations associated with financial liabilities.
Loans and advancesConventional loan assets that are unquoted (originated or acquired).
Loss given default (LGD)LGD is the percentage of an exposure that a lender expects to loose in the event of obligor default.
Loan-to-value ratio (LTV)The LTV ratio is a mathematical expression which expresses the amount of a first mortgage lien as a percentage of the total appraised value of real property. The LTV ratio is used in determining the appropriate level of risk for the loan and therefore the correct price of the loan to the borrower.
M
Market riskThis refers to the possibility of loss arising from changes in the value of a financial instrument as a result of changes in market variables such as interest rates, exchange rates, credit spreads and other asset prices.
MaterialityThe relative significance of a transaction or an event, the omission or misstatement of which could influence the decisions of users of Financial Statements.
N
Net interest income (NII)The difference between the amount a bank earns on assets such as loans and securities and the amount it pays on liabilities such as deposits, refinance funds and inter-bank borrowings.
Net interest margin (NIM)The margin is expressed as net interest income divided by average interest earning assets.
Non-performing loans (NPL)The loans which are in default for more than three months.
NOSTRO accountsA bank account held in foreign country by a domestic bank, denominated in the currency of that country. NOSTRO accounts are used to facilitate the settlement of foreign exchange trade transactions.
NPL ratioTotal non-performing loans and advances (net of interest in suspense) divided by total loans and advances portfolio (net of interest in suspense).
Net stable funding ratio (NSFR) Measures the amount of longer-term, stable sources of funding employed by a bank relative to the liquidity profiles of the assets funded and the potential for contingent calls on funding liquidity arising from off-balance sheet commitments and obligations.
O
Off-balance sheet transactions Transactions that are not recognised as assets or liabilities in the Statement of Financial Position, but which give rise to contingencies and commitments.
Operational riskThis refers to the risk of loss resulting from inadequate or failed internal processes,
people and systems or from external events including legal risk.
Open credit exposure ratioTotal net non-performing loans and advances expressed as a percentage of regulatory capital base.
P
ParentA parent is an entity that has one or more subsidiaries.
PortfolioA pool of investments including investment in Government Securities, loans and advances, equities, etc.
Probability of default (PD)PD is an internal estimate for each borrower grade of the likelihood that an obligor will default on an obligation.
Projected Unit Credit Method (PUC)An actuarial valuation method that sees each period of service as giving rise to an additional unit of benefit entitlement and measures each unit separately to build up the final obligation. Inclusion of a degree of caution in the exercise of judgement needed in making the estimates required under conditions of uncertainty, such that assets or income are not overstated, and liabilities or expenses are not understated.
R
Return on averageassets (ROA)Profit after tax expressed as a percentage of the average assets.
Return on average equity(ROE) Net profit attributable to owners expressed as a percentage of average ordinary shareholders’ equity.

Governance Financial Reports Supplementary Information
466 National Savings Bank │ Annual Report 2019 Glossary of Financial and Banking Terms
Related partiesParties where one party has the ability to control the other party or exercise significant influence over the other party in making financial and operating decisions, directly or indirectly.
Related party transaction (RPT)RPT is a transfer of resources, services or obligations between a reporting entity and a related party, regardless whether a price is charged.
REPOsRepurchase agreements. Securities sold to lenders with the commitment to buy back on a later date at a fixed price plus interest.
Reverse repurchase agreement Transaction involving the purchase of securities by a bank or a dealer and resale back to the seller at a future date at a specified price.
Revenue reserveReserves set aside for future distribution and investment.
Risk-weighted assetsThe sum of assets as per the Statement of Financial Position and the credit equivalent of assets that are not on the Statement of Financial Position multiplied by the relevant risk-weighting factors.
Rupee loanRupee securities issued by the Central Bank of Sri Lanka on behalf of the Government of Sri Lanka.
S
Shareholders’ fundsA capital reserve created as per the provisions of the Banking Act No. 30 of 1988.
Significant increase in creditrisk (SICR)According to SLFRS 9, an entity should assess whether the risk of default on a financial instrument has increased significantly since initial recognition. The assessment should consider reasonable and supportable information that is relevant and available without undue cost or effort. There is a rebuttable presumption in the Standard that the credit risk on a financial asset has increased significantly since initial recognition when contractual payments are more than 30 days past due.
SPPI TestSolely Payments of Principal and Interest Test (SPPI) is carried out as the second step of the classification process. “Principal” is defined as the fair value of the financial asset at initial recognition and may change due to repayments of principal or amortisation of the premium or discount. “Interest” is defined as consideration for the time value of money and for the credit risk associated with the principal amount outstanding. If a financial asset passes the SPPI test, then it will either be classified at amortised cost if the “hold to collect” business model test is met, or at Fair Value Through Other Comprehensive Income (FVOCI) if the “hold to collect and sell” business model test is met. If a financial asset fails, the SPPI test it must be classified at Fair Value Through Profit or Loss (FVPL) in its entirety
Statutory reserve fundA capital reserve created as per the provisions of the Banking Act No. 30 of 1988.
Subordinated liabilitiesLiabilities that rank after the claims of other creditors of the issuer in the event of insolvency or liquidation.
Stress testIntegrated test that shows to varying degrees whether the Bank can withstand unforeseen scenarios of varying severity.
SubsidiaryAn entity that is controlled by another entity.
Substance over formThe consideration that the accounting treatment and the presentation in Financial Statements of transactions and events should be governed by their substance and financial reality and not merely by legal form.
Swaps (currency)The simultaneous purchase of an amount of a currency for spot settlement and the sale of the same amount of the same currency for forward settlement. Alternatively, a simultaneous spot sale and forward purchase of a currency.
T
Tier 1 capitalA component of regulatory capital, comprising common equity Tier 1 and additional Tier 1 capital. Core measure of financial strength of the Bank representing permanent shareholders’ equity and reserves created or increased by appropriations of retained earnings or other surpluses.
Tier 2 capitalTier 2 capital represents revaluation gains, general provisions and other capital instruments which combine certain characteristics of equity and debt such as subordinated term debts.
Total capitalTotal Capital is summation of the Tier 1 and the Tier 2 capital.
Treasury BillA short-term debt instrument issued on auction basis by the Central Bank of Sri Lanka on behalf of the Government of Sri Lanka.
Treasury BondA long-term debt instrument issued on auction basis by the Central Bank of Sri Lanka on behalf of the Government of Sri Lanka.
Twelve-monthexpected credit losses(12-Month ECL)The portion of lifetime expected credit losses that represent the expected credit losses that result from default events on a financial instrument that are possible within the 12-months after the reporting date.
U
Unit trustAn undertaking formed to invest in securities under the terms of a trust deed.
Useful lifeUseful life is the period over which an asset is expected to be available for use by an entity or the number of production or similar units expected to be obtained from the asset by an entity.
V
Value addedWealth created by providing banking and other services less the cost of providing such services. The value added is allocated among the employees, the providers of capital, to Government by way of taxes and retained for expansion and growth.
Value at risk (“VaR”)A measure of the loss that could occur on risk positions as a result of adverse movements in market risk factors (e.g. rates, prices, volatilities) over a specified time horizon and to a given level of confidence.
Y
Yield to maturity (YTM)Discount rate at which the present value of future cash flows would equal the security’s current price.

Annual Report 2019 │ National Savings Bank
Notes

National Savings Bank │ Annual Report 2019 Notes

Global Standard Annual Report Number© LKA8355NSBXX0190000E106