A comparison of three hearing aid manufacturers ...
56
Washington University School of Medicine Washington University School of Medicine Digital Commons@Becker Digital Commons@Becker Independent Studies and Capstones Program in Audiology and Communication Sciences 2006 A comparison of three hearing aid manufacturers' recommended A comparison of three hearing aid manufacturers' recommended first fit to two generic prescriptive targets with the pediatric first fit to two generic prescriptive targets with the pediatric population population Kristen Bretz Follow this and additional works at: https://digitalcommons.wustl.edu/pacs_capstones Part of the Medicine and Health Sciences Commons Recommended Citation Recommended Citation Bretz, Kristen, "A comparison of three hearing aid manufacturers' recommended first fit to two generic prescriptive targets with the pediatric population" (2006). Independent Studies and Capstones. Paper 189. Program in Audiology and Communication Sciences, Washington University School of Medicine. https://digitalcommons.wustl.edu/pacs_capstones/189 This Thesis is brought to you for free and open access by the Program in Audiology and Communication Sciences at Digital Commons@Becker. It has been accepted for inclusion in Independent Studies and Capstones by an authorized administrator of Digital Commons@Becker. For more information, please contact [email protected].
-
Upload
khangminh22 -
Category
Documents
-
view
0 -
download
0
Transcript of A comparison of three hearing aid manufacturers ...
Washington University School of Medicine Washington University School of Medicine
Digital Commons@Becker Digital Commons@Becker
Independent Studies and Capstones Program in Audiology and Communication Sciences
2006
A comparison of three hearing aid manufacturers' recommended A comparison of three hearing aid manufacturers' recommended
first fit to two generic prescriptive targets with the pediatric first fit to two generic prescriptive targets with the pediatric
population population
Kristen Bretz
Follow this and additional works at: https://digitalcommons.wustl.edu/pacs_capstones
Part of the Medicine and Health Sciences Commons
Recommended Citation Recommended Citation Bretz, Kristen, "A comparison of three hearing aid manufacturers' recommended first fit to two generic prescriptive targets with the pediatric population" (2006). Independent Studies and Capstones. Paper 189. Program in Audiology and Communication Sciences, Washington University School of Medicine. https://digitalcommons.wustl.edu/pacs_capstones/189
This Thesis is brought to you for free and open access by the Program in Audiology and Communication Sciences at Digital Commons@Becker. It has been accepted for inclusion in Independent Studies and Capstones by an authorized administrator of Digital Commons@Becker. For more information, please contact [email protected].

A COMPARISON OF THREE HEARING AID MANUFACTURERS’ RECOMMENDED FIRST FIT TO TWO GENERIC PRESCRIPTIVE
TARGETS WITH THE PEDIATRIC POPULATION
By
Kristen Bretz
A Capstone Project Submitted in Partial Fulfillment of the
Requirements for the Degree of:
Doctor of Audiology
Washington University School of Medicine Program in Audiology and Communication Sciences
May 10, 2006
Approved by: Lisa S Davidson, Ph.D., Capstone Project Advisor
Abstract: The purpose of this study is to compare three hearing aid manufacturers’ recommended “First Fit” to the generic recommended
fittings by DSL i/o and NAL-NL1 for a 12 month old child with varying degrees of sensorineural hearing loss.

Bretz
Introduction
Audiologists are able to choose from a variety of prescriptive methods for fitting hearing
aids. While some may choose to use a generic fitting prescription, others may accept the
manufacturer fitting. Each of these methods will prescribe specific gain, frequency response and
compression characteristics based on some underlying rationale for amplification. If a generic
formula is used the audiologist will verify that the target has been met using some type of
verification procedure (i.e. electroacoustic measures using real ear or coupler measures). The
audiologist will then validate that the hearing aid fitting is appropriate for the patient using a
variety of measures including: aided thresholds, speech perception testing and hearing aid benefit
surveys or questionnaires. The age of the patient may limit the validation measures that can be
used. For example, formal speech perception testing and patient benefit surveys cannot be
administered to very young children, and parent reports as well as aided threshold testing can be
unreliable.
Audiologists who use manufacturer recommendations may fit hearing aids in a variety of
ways. Some audiologists will accept the manufacturer recommended “First Fit.” The “First Fit”
refers to the gain, frequency response and compression characteristics that are recommended by
the manufacturer without making any adjustments to the fitting. Audiologists who are familiar
with a certain manufacturer may not use formal verification measures, but accept the “First Fit”
with modifications based on patient reports. For example, due to past experience from patients
with a certain device, an audiologist may know that most patients prefer a reduction in gain in
the low frequencies or an increase in gain in the high frequencies. The audiologist will modify
the gain and frequency responses of the initial manufacturer fitting based on this experience and
then validate the fitting by patient report. The gain, frequency response and the compression
2

Bretz
characteristics of the hearing aid may also be gradually modified to reach the manufacturer target
by using what most manufacturers term as the adaptation level. The adaptation level is a process
that manufacturers build into the software in order to slowly increase the amount of gain in a
patient’s hearing aid. The idea is that a new patient with no prior hearing aid experience will
initially prefer lower gain and output and gradually adapt to higher levels of gain and output. As
the patient wears the hearing aid for a couple of weeks or months and starts to adapt to hearing
with amplification, the adaptation level is increased. Some audiologists always fit their patients
with the highest adaptation level because in theory the highest adaptation level is the closest to
the target prescription of a given fitting rational. The audiologist may also choose to use a
middle adaptation level as a compromise between a conservative and aggressive approach to
prescribing gain and output.
The use of digital speech processing (DSP) in hearing aids has allowed hearing aid
manufacturers to employ very complex algorithms for compression, noise reduction and
frequency shaping, and many manufacturers now have their own proprietary fitting algorithms.
A major advantage of this technology is increased flexibility in programming capabilities, which
allows audiologists to more accurately fit a hearing aid to a prescriptive target (Fabry, 2003).
However, recent survey data indicates that few audiologists are verifying their hearing aid
fittings at the initial visit (Kirkwood, 2004). As hearing aid processing strategies have become
more complex and more specific to the manufacturer, audiologists are showing an increase in
reliance on manufacturers’ prescriptions rather than verifying using a prescriptive target (Fabry,
2003). Given this trend in hearing aid fittings it is important to understand the differences in
manufacturers’ prescriptions versus generic prescriptive targets as well as to understand how
manufacturer prescriptions differ from each other.
3

Bretz
Due to the rapid advances in technology it difficult to conduct timely research on new
devices. This is reflected in the fact that there is little research published on how the different
manufacturers proprietary fitting algorithms compare to each other and to generic prescriptive
measures. In addition, the research that has been conducted on this topic will be quickly
outdated as new technology and fitting algorithms become available.
Background Information
Prescriptive Measures: NAL-NL1 vs. DSL i/o
There are several generic hearing aid prescriptive procedures available for linear as well
as nonlinear amplification. These procedures are designed to provide a prescription of gain,
frequency response and compression characteristics for hearing aids from any manufacturer that
are of a similar type (i.e. WDRC). Two common generic nonlinear prescriptive procedures used
by audiologists are the National Acoustics Laboratory Nonlinear fitting procedure version 1
(NAL-NL1) (Byrne, Dillon, Ching, Katsch, and Keidser, 2001) and the Desired Sensation Level
input/output formula (DSL i/o) (Cornelisse, Seewald, and Jamieson, 1995). Although both
procedures are designed to apply to nonlinear hearing aids, they differ in the frequency response
and amount of gain prescribed.
The underlying rationale of NAL-NL1 is loudness equalization and the goal is to
maximize speech intelligibility. NAL-NL1 uses a modified form of the Speech Intelligibility
Index (SII) in order to assure that speech is intelligible to the hearing aid user. The SII accounts
for distortion that is present as speech intensity exceeds 73 dB SPL by reducing the intensity
proportionately. This amount of reduction has been shown to be insufficient for the high
4

Bretz
listening levels hearing aid users often experience with amplification. Therefore, the NAL-NL1
procedure has incorporated a further reduction in gain of the hearing aid associated with greater
degrees of hearing loss. This is important because as the degree of hearing loss increases, speech
discrimination ability decreases. Additionally the NAL-NL1 procedure takes into account the
number of channels in the aid and also reduces the prescribed gain for binaural fits (Byrne et al,
2001).
The DSL i/o prescription is quite different. The underlying rationale of DSL i/o is
loudness normalization, thus it aims to make loudness similar to a hearing impaired ear as it does
a normal hearing ear. The goal is for the hearing impaired user to hear soft sounds as soft,
medium sounds as comfortable and loud sounds as loud, but not uncomfortable. Basically the
DSL i/o prescription aims to fit the long-term average speech spectrum into the hearing-impaired
user’s dynamic range. The formula also incorporates the sound field to eardrum transfer
function so that the acoustic features that are lost by placing a hearing aid in the ear are still
available to the hearing impaired user. This contributes to speech sounding more “normal” to the
hearing impaired ear. The DSL i/o prescription also allows for more than threshold information
to be entered if it is available. For example, if measured, the audiologist can enter the patient’s
real ear to coupler difference (RECD) or loudness discomfort levels (LDL). This is done to
ensure that the hearing aid will not amplify sounds so that they are uncomfortable for the user
(Cornelisse et al, 1995).
As mentioned above NAL-NL1 and DSL i/o have different theoretical perspectives,
which lead to different hearing aid prescriptions. Byrne et al (2001) examined the prescriptions
of four different generic procedures including NAL-NL1 and DSL i/o for five different
audiograms. Comparisons were made using 13 audiograms with varying degrees and
5

Bretz
configurations of hearing loss. For standardization purposes all hearing losses were considered
to be sensorineural. For the flat audiograms DSL i/o prescribed more low frequency gain than
NAL-NL1. For the reverse sloping audiograms the NAL-NL1 prescribed more gain for the
higher frequencies, while both prescribed similar gain for the mid frequencies and DSL i/o
prescribed more gain for the low frequencies. For the moderately sloping high frequency
hearing loss DSL i/o prescribed more gain at the highest frequencies (above 4000 Hz) and at the
low frequencies with the mid frequencies given approximately the same amount of gain. For the
steeply sloping high frequency hearing loss DSL i/o again prescribed more gain at the low and
highest frequencies than NAL-NL1 with similar prescriptions for the mid frequencies. Recall
that NAL-NL1 assumes that prescribing gain for hearing loss exceeding 73 dB SPL will not have
a positive effect on speech intelligibility and therefore, the amount of gain for those frequencies
in which the hearing loss is severe or profound is reduced. DSL i/o aims to normalize loudness
and extend the dynamic range, thus it prescribes more gain for low frequencies and for high
frequencies when there is a more severe hearing loss (Byrne et al, 2001).
Manufacturer Prescriptions
In addition to the generic prescriptive measures discussed above most manufacturers
have developed their own propriety fitting algorithms to prescribe the appropriate gain,
frequency response and compression characteristics of hearing aids. These prescriptions are
often tailored to a specific hearing aid’s capability. Hearing aid manufacturers may use different
underlying rationales when prescribing the appropriate gain for a patients hearing loss. Some
different rationales include loudness equalization, loudness normalization, loudness growth
methods and threshold based methods (Smeds and Leijon, 2001).
6
Bretz
Generic prescriptive measures are often validated with substantial research conducted by
unbiased persons not associated with a specific manufacturer and the data is published for the
audiologists to determine the best procedure for use with their particular group of patients.
However, manufacturer prescriptions often are developed through research conducted by persons
associated with the manufacturer. The basic rationale behind the manufacturer proprietary fitting
algorithms may be made available to audiologists through brochures or other publications.
However, complete information about fitting targets, variations with different degrees or
configurations of hearing loss and comparison to other manufacturers’ algorithms or generic
prescriptive measures may not be available (Keidser, Brew and Peck, 2003). The limited amount
of information about manufacturer prescriptions may be problematic and result in hearing aid
patients being inappropriately amplified.
Previous Research: Hearing Aid Differences
A few studies have examined the differences in nonlinear hearing aids among
manufacturers and generic prescriptive measures. Smeds and Leijon (2001) examined the
differences among hearing aids programmed with six different prescriptive methods. The
prescriptive methods included two generic methods, DSL i/o in the Siemens Prisma and FIG6 in
the Unitron Ikon. Four other nonlinear hearing aids using their own proprietary fitting methods
were also examined including the Oticon DigiFocus, Widex Senso, Danavox Danasound and
ReSound BT4. The hearing aids were programmed according to the specific manufacturers’
recommended “First Fit” for a mild gradually sloping to severe audiogram with no additional
information given. Testing was conducted in three listening conditions: 1.) soft speech (55 dB
SPL) in a quiet background, 2.) average level speech (65 dB SPL) in a quiet background and 3.)
7

Bretz
loud speech (74 dB SPL) in a background of speech babble (71 dB SPL). Results indicated
substantial differences across the six prescriptive methods in prescribed gain for all listening
situations. The differences ranged from 10 to 20 dB. Differences in prescribed gain by the two
generic methods (DSL i/o and FIG6) and measured gain in the implemented version of these
prescriptions in the Siemens Prisma and the Unitron Ikon were found. Differences of
approximately 10 dB in the 1 – 2 kHz region were found in all three listening conditions. Large
differences were also found in the calculated loudness levels for the six hearing aids. Loudness
calculations were made in units of phon where 0 phons means the loudness is perceived by a
hearing impaired person the same as a normal hearing person. The differences in loudness levels
were 16 phons for listening situation 1, 12 phons for listening situation 2 and 9 phons for
listening situation 3. In general, DSL i/o was louder than normal, Danavox and ReSound were
softer than normal, and FIG6, Oticon and Widex were fairly close to normal (Smeds and Leijon,
2001).
This study showed that prescriptive methods have large differences in the amount of gain
prescribed and these differences are likely to result in different loudness percepts by patients.
Also, even though a manufacturer fitting algorithm may have an underlying rationale that is
similar to a prescriptive target such as DSL i/o or FIG6, large differences still may be seen
between the prescriptive target and the actual output of the hearing aid (Smeds and Leijon,
2001).
Another study by Keidser et al (2003) examined how the gain and output of four different
hearing aids (Oticon DigiFocus II, Phonak Claro, ReSound Danalogic and Widex Senso Diva)
compared to the prescriptive targets recommended by NAL-NL1 and DSL i/o. The Phonak and
ReSound algorithms are similar to DSL i/o in that they aim to normalize loudness, however the
8

Bretz
Oticon algorithm aims to maximize speech intelligibility similar to NAL-NL1. The Widex
algorithm aims to compensate for loudness recruitment. Given the differences in the two
underlying rationales the authors expected that the differences in prescribed gain and hearing aid
parameters would be small among the two groups, but larger across groups. Comparisons were
made using three input levels (50, 65, and 80 dB SPL) and five configurations of hearing loss
(flat loss, reverse sloping loss, gently sloping loss, steeply sloping loss with normal low
frequencies and steeply sloping loss with low frequency hearing loss).
The results indicated in all cases that DSL i/o provided the most gain at all three input
levels for all five audiogram configurations. When the overall gain from 500, 1000, 2000, and
4000 Hz was averaged, the order of most to least gain was DSL i/o (21.4dB), NAL-NL1
(17.8dB), Oticon DigiFocus II (16 dB), Phonak Claro (15.2 dB) and Widex Senso Diva (14.1
dB). The differences in prescribed gain among the six procedures varied by approximately 10
dB at each of the input levels. Additional comparisons were made for each of the five
audiograms using the 65 dB input signal. The curves were normalized to have equal gain level at
1000 Hz in order to compare differences in the shape of the prescriptions. For the flat and
reverse sloping losses the Senso Diva and DigiFocus II responses were similar in shape to DSL
i/o despite neither of them having the underlying rationale of loudness normalization. The
Danalogic response was most similar to NAL-NL1 while it would be expected to be most similar
to DSL i/o as they both have loudness normalization as an underlying rationale. For the gently
sloping high-frequency hearing loss, Danalogic and DigiFocus II more closely followed the DSL
i/o target and Claro more closely follows the NAL-NL1 target. The Senso Diva showed a
relatively flat response. For the two steeply sloping hearing loss configurations DSL i/o had
9

Bretz
more high frequency gain than NAL-NL1. The Senso Diva again showed a relatively flat
response. There were no other consistent patterns (Keidser et al, 2003).
The authors summarized that in general DSL i/o and NAL-NL1 prescribe responses that
are different in shape. None of the hearing aids consistently prescribed a response shape that
was similar to either DSL i/o or NAL-NL1 despite having similar underlying rationales.
Differences in prescribed gain varied by approximately 10 dB and overall differences in slope of
10 – 30 dB were seen in the low and high frequencies. The authors concluded that “with the
current level of information available on the various proprietary fitting methods, it is not possible
for the audiologist to make an informed choice of which device and procedure will best benefit
their client (Keidser et al, 2003).”
Various software programs often allow the audiologist to choose what information is
displayed on the programming screen with a number of options including: 2-cc gain, 2-cc output,
insertion gain, real-ear aided gain, amplified long term average speech spectrum, etc. A study by
Hawkins and Cook (2003) examined the differences between the predicted real-ear insertion gain
(REIG) values seen on the programming screen of several manufacturers’ software to the
measured 2cc coupler and REIG for 12 subjects. The results of the study indicated that the
simulated values in the manufacturer software often overestimated the actual values, thus the
actual amount of amplification received by the patient was less than that predicted by the
manufacturer software. The differences in the amount of simulated gain and actual gain provided
by the different hearing aids varied by as much as 20 dB. A similar study by Aarts and Caffee
(2005) examined the difference from the software implemented real ear aided responses (REAR)
to the measured REAR in 41 subjects with one manufacturer. The results found that the software
did not predict a similar REAR in 90% of the ears tested. In addition the authors found a gender
10
Bretz
effect in that the difference in the predicted versus the measured REAR was greater for females
due to the smaller ear canal volumes.
The results of these studies show that the manufacturer hearing aid fittings are highly
variable. Given these studies, audiologists must use extreme caution in interpreting the values
displayed on the hearing aid programming screen and keep in mind that the simulated values
may vary considerably from those measured on the actual patient. The large difference seen
between manufacturers’ hearing aid fittings reiterates the message that audiologists must verify
their hearing aid fittings. Without verification through real ear or coupler measures it is
impossible to know how much amplification the patient is receiving.
Verification of Nonlinear Hearing Aids
Many clinicians use generic prescriptive targets such as NAL-NL1 and DSL i/o to verify
the output of nonlinear hearing aids. Verification can be done using real ear or coupler measures
to assure the hearing aid output matches the prescriptive target. However, some researchers have
suggested that this method of fitting hearing aids is not appropriate for nonlinear hearing aids.
The generic prescriptive targets may not take into consideration several features available in
digital hearing aids including: the number of channels in the hearing aid, the bandwidths of each
channel, the compression threshold, the attack and release times and the distortion characteristics
of the hearing aid. These factors may affect the output of the hearing aid in many ways as
discussed below (Kuk and Ludvigsen, 1999; Kuk, 2002).
The features available in nonlinear hearing aids often result in an increase in the amount
of output. Nonlinear hearing aids often have a variable number of channels depending on the
11

Bretz
hearing aid and more channels results in power summation. Power summation means that the
more channels a hearing aid has the higher the output of the hearing aid. In addition a narrower
bandwidth in each channel also leads to a higher amount of output even when a complex signal
is used. These effects may create differences of three to five decibels. Compression thresholds
also affect the hearing aid output. A hearing aid with a lower compression threshold will have
more gain for low input sounds than a hearing aid with a higher compression threshold. This
allows for the audibility of low level speech sounds in a hearing aid with a lower compression
threshold (Kuk and Ludvigsen, 1999; Kuk, 2002). Longer release times have been shown to
result in greater gain and output from hearing aids especially in the high frequencies (Ellison,
Harris, and Muller, 2003). Hearing aid distortion may affect how much gain a user prefers. For
example, a high amount of distortion may cause the user to prefer less gain. Since these factors
are not taken into account in generic prescriptive methods, there may be a need for updated
targets that take into account these advances in technology (Kuk and Ludvigsen, 1999; Kuk,
2002).
Another important issue surrounds the digital noise reduction (DNR) feature of nonlinear
hearing aids. DNR may interpret a composite test signal as noise and reduce gain in order to
suppress the “noise.” This results in a reduced real ear insertion gain and thus an underestimate
of the actual gain provided to the patient during everyday use. These problems with DNR may
be addressed by simply turning off the DNR feature when doing real ear measurements. This
solution is controversial in that the measurement may not reflect how the hearing aid performs in
the “real world” when the feature is on. Another simple solution is that the audiologist may turn
the signal on and off quickly when making real ear measurements so that the DNR feature does
not have enough time to be activated and reduce the gain of the hearing aid (Fabry, 2003). In
12

Bretz
addition, current real ear systems have made adjustments to the properties of the test signal in
order to facilitate a more accurate measurement of hearing aid output. In order to “trick” the
DNR system into thinking that the test signal is speech, the systems have adapted the spectral
and/or temporal properties of the test signal to be more like speech. For example, a system may
us a modulated composite noise (Revit, 2002). In addition some newer real ear systems use
recorded speech passages as the test signal providing a valid indication of real world
performance of nonlinear hearing aids (Fabry, 2003).
Purpose
The purpose of this study is to compare three hearing aid manufacturers’ recommended
pediatric fittings (“first fit”) to two generic prescriptive methods for fitting hearing aids. The
three hearing aids used in the study are routinely fit on very young hearing impaired infants. The
manufacturer recommended fitting of these three hearing aids will be compared to the generic
recommended fittings by DSL i/o and NAL-NL1 for a 12 month old child with varying degrees
of sensorineural hearing loss.
Research Methods
General Methods
Three behind the ear hearing aids were obtained from three different hearing aid
manufacturers. All three products represent the top of the line digital hearing aids that were
available from each manufacturer at the time this study was completed. These hearing aids were
13

Bretz
programmed as similarly as possible and compared to targets for NAL-NL1 and DSL i/o for
varying degrees of hearing loss as depicted in the table below.
250 500 1000 2000 4000Hearing Loss 1 35 35 40 45 45 Hearing Loss 2 45 45 50 55 55
Hearing Loss 3 55 55 60 65 65
Hearing Loss 4 65 65 70 75 75
Hearing Loss 5 75 75 80 85 85
Hearing Aid Fitting Rationales
As discussed previously hearing aid manufacturers may use different underlying
rationales when prescribing the appropriate gain for a patients hearing loss. Some different
rationales include loudness equalization and loudness normalization, a combination of these two
rationales, or a manufacturer may have their own proprietary fitting rationale. The three hearing
aids used in this study had different underlying fitting rationales. The Manufacturer 1 fitting
rationale is a proprietary rationale called Voice Aligned Compression. The goal is to preserve
speech intelligibility while providing natural sound quality to the hearing aid user. The fitting
algorithm provides more amplification for low to medium input sounds, little amplification for
moderate to loud input sounds and very loud sounds are fully compressed for the users listening
comfort (Voice Aligned Compression, 2005). The Manufacturer 2 hearing aid allows for the
selection of the DSL i/o, NAL-NL1 or a manufacturer proprietary algorithm. The Manufacturer
2 proprietary algorithm fitting rationale is loudness restoration. This rationale is similar to the
loudness normalization rationale which DSL i/o also incorporates (Lutzen, n.d.). The
14

Bretz
Manufacturer 3 fitting rationale is loudness equalization at medium input levels and the goal is to
amplify speech to the user’s most comfortable listening level. For soft and loud input levels
Manufacturer 3 utilizes a loudness mapping strategy. The objective is for soft sounds to be
slightly above the hearing thresholds and for loud input sounds to be slightly below the
uncomfortable listening level of the user (Ludvigsen and Kuk, 2001).
Hearing Aid Programming
All devices were programmed using the same audiograms, a pediatric fitting rationale,
average RECD’s, and long term user. In addition earmold characteristics were held consistent
across hearing aids (no venting, standard tubing etc.). It was not possible to program all hearing
aids exactly the same due to differences in manufacturer software. For example, some
manufacturers allowed you to choose the age of the patient from a list, while other manufacturers
claimed to take into account the age by the birthdate as entered into the software. In addition,
one manufacturer allowed the audiologist to select which algorithm (NAL-NL1, DSL i/o, and
manufacturer proprietary algorithm) to use for programming, while the other two only allowed
the use of their manufacturer proprietary algorithm. The NAL-NL1 algorithm was selected when
comparisons were made to the NAL-NL1 target, the DSL i/o algorithm was selected when
comparisons were made to the DSL i/o target and the manufacturer proprietary algorithm was
also compared to both the NAL-NL1 and DSL i/o targets.
Measurement Equipment
The Audioscan Verifit Real Ear Hearing Aid Analyzer model VF-1 was used to measure
the output for the hearing aids in this study. This system uses a variety stimuli for measuring the
15
Bretz
output of hearing aids including a variety of recorded speech signals (speech shaped, male,
female or child talker), ICRA noise, and pink noise. The speech signals can be presented at
different input levels and are designed to simulate the vocal efforts of soft, average and loud
speech. Since all the devices were multichannel, non-linear, digital hearing aids, the speech-
shaped signal was used to measure the output of the hearing aids. This speech stimulus is a male
talker speaking a 10 – 15 second passage and the signal is filtered to closely match the Cox and
Moore (1988) long term average speech spectrum (LTASS) (Audioscan, 2005).
The Audioscan Verifit system uses a hearing aid fitting method called Speechmap. The
Speechmap deviates away from the insertion gain target and aims to put amplified speech into
the dynamic range of the user. The Verifit system Speechmap converts the audiometric
thresholds to dB SPL and will display the average uncomfortable loudness levels (UCL) or the
audiologist can enter the measured UCL’s if these are available. The goal is for the amplified
speech spectrum to be above threshold and below the UCL. The DSL Speechmap on the Verifit
was created using the DSL amplified LTASS target. The NAL Speechmap was created by
converting the NAL insertion gain targets to amplified LTASS targets (Audioscan, 2005).
In addition this system allows for the entry of individual real ear to coupler difference
(RECD) or an average RECD can be used based on the age of the patient (Bagatto, Scollie,
Seewald, Moodie, and Hoover, 2002). For the purposes of this study the average RECD for a
one year child was used. However, when using the NAL Speechmap the only RECD values
available were for adults. In order to keep all the testing as similar as possible when using the
NAL Speechmap the average RECD values from the DSL Speechmap were entered and used.
16

Bretz
The Verifit system will also calculate the Speech Intelligibility Index (SII) for the various
input levels used in the system. The SII represents what portion of speech is audible to a listener.
The calculation can represent what portion of speech is audible when a patient is or is not
wearing a hearing aid. The SII is related to speech understanding, but it is not a direct
calculation of speech understanding because the SII does not take into account the loss in
discrimination ability that accompanies hearing loss (Hornsby, 2004). For the purposes of this
study the SII will refer to the portion of speech that is audible to an aided listener. The Verifit
system calculates the SII using the 1/3 octave band method as recommended by ANSI S3.5-1997
with the modification of removing the 160 Hz band and the masking level effects (Audioscan,
2005).
Measurement Methods
Each hearing aid was measured using the Audioscan Verifit hearing aid measurement
system in a 2cc coupler using simulated real ear measures and average real ear to coupler
difference (RECD’s) for a one-year-old child. Hearing aid output was measured at four input
levels (55, 60, 70 and 75 dB SPL). The Verifit system uses the 70 dB SPL signal to represent
average conversational speech as the targets provided for DSL and NAL are based on this level.
In addition each hearing aid was measured using a 90 dB SPL MPO sweep.
Comparisons
The following comparisons were made:
1. The initial hearing aid fit recommended by the manufacturers’ algorithms compared to DSL i/o and NAL-NL1 targets for the 70 dB SPL input level on the Verifit system.
17

Bretz
2. The initial DSL i/o and NAL-NL1 fit (only available on one manufacturer) implemented by the manufacturer compared to DSL i/o and NAL-NL1 targets for 70 dB SPL input level on the Verifit system.
3. The maximum output (90 dB SPL MPO sweep) of the hearing aids recommended by the
manufacturer algorithm compared to the DSL i/o and NAL-NL1 targets on the Verifit system.
4. The maximum output (90 dB SPL MPO sweep) of the hearing aids recommended by the
DSL i/o and NAL-NL1 algorithms as implemented by the manufacturer compared to DSL i/o and NAL-NL1 targets on the Verifit system.
5. The output curves for each hearing aid using the recommended initial fit of the manufacturer
and/or the manufacturer implemented DSL i/o and NAL-NL1 when applicable, using 55, 60 and 75 dB SPL input levels.
6. The Speech Intelligibility Index scores as a percentage for average speech (70 dB SPL) and
soft speech (55 dB SPL).
Results
Although measurements were recorded with four input levels (55, 60, 70 and 75 dB SPL)
only the results of 55 and 70 dB SPL input levels will be presented, as the findings at the other
levels were redundant to those obtained at 55 and 70 dB SPL. The 55 dB SPL input level
represents the hearing aids responses to soft level speech and the 70 dB SPL input level
represents the hearing aids responses to average conversational level speech. The 70 dB SPL
input level is also used for comparisons to DSL i/o and NAL-NL1 targets.
Comparison to Targets for Average Conversational Speech (70 dB SPL)
The first comparison examined how the initial hearing aid fit recommended by the
manufacturers’ algorithms compared to DSL i/o and NAL-NL1 targets for the 70 dB SPL input
level (See Appendices A and B). The absolute value of the difference from the target output to
the measured output was averaged for frequencies 250, 500, 750, 1000, 1500, 2000, 3000 and
4000 Hz.
18

Bretz
For hearing loss 1 (figure 1) the average deviations from DSL target were as follows: 1.8
dB (Manufacturer 2 DSL), 7.5 dB (Manufacturer 2 Proprietary), 8.1 dB (Manufacturer 3), and 18
dB (Manufacturer 1). For hearing loss 2 (figure 2) the average deviations from DSL target were
as follows: 2.75 dB (Manufacturer 2 DSL), 9.1 dB (Manufacturer 2 Proprietary), 10 dB
(Manufacturer 3), and 21 dB (Manufacturer 1). For hearing loss 3 (figure 3) the average
deviations from DSL target were as follows: 2.5 dB (Manufacturer 2 DSL), 9.1 dB
(Manufacturer 2 Proprietary), 11.5 dB (Manufacturer 3), and 19.5 dB (Manufacturer 1). For
hearing loss 4 (figure 4) the average deviations from DSL target were as follows: 3.8 dB
(Manufacturer 2 DSL), 7.6 dB (Manufacturer 2 Proprietary), 9.5 dB (Manufacturer 3), and 17.5
dB (Manufacturer 1). For hearing loss 5 (figure 5) the average deviations from DSL target were
as follows: 6.2 dB (Manufacturer 2 DSL), 6.8 dB (Manufacturer 2 Proprietary), 8.3 dB
(Manufacturer 3), and 18.2 dB (Manufacturer 1).
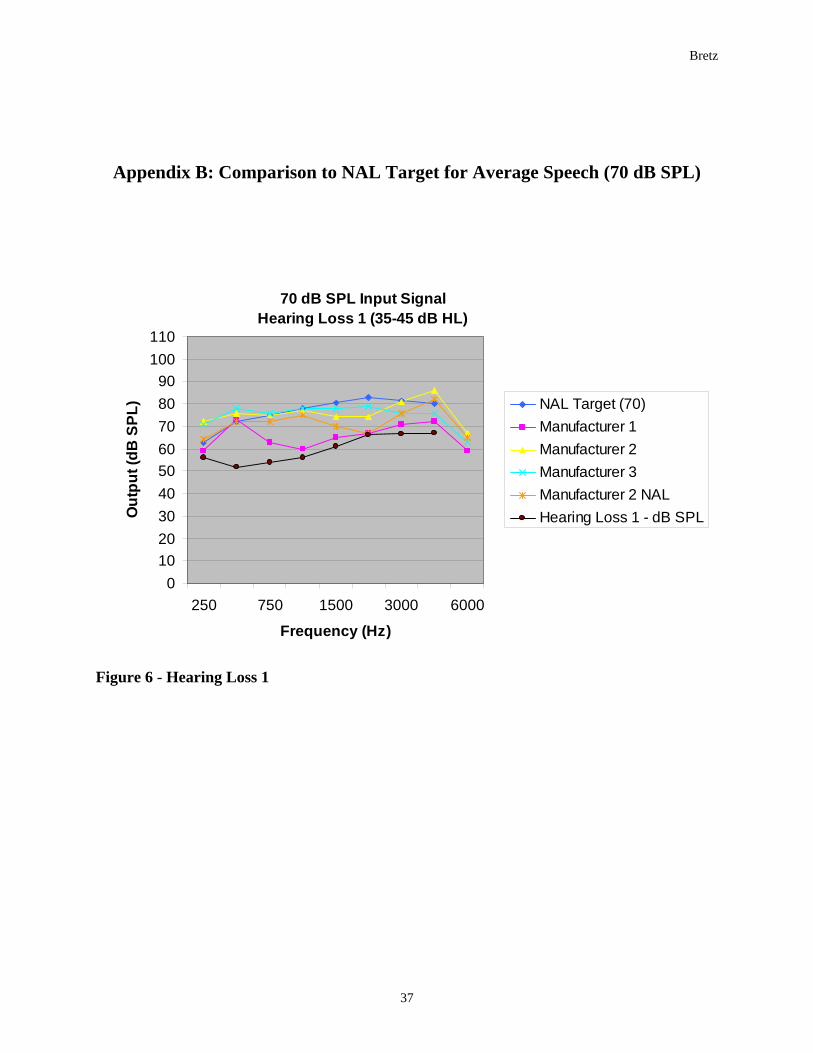
For hearing loss 1 (figure 6) the average deviations from NAL target were as follows: 3.8
dB (Manufacturer 3), 4.5 dB (Manufacturer 2 Proprietary), 5.1 dB (Manufacturer 2 NAL), and
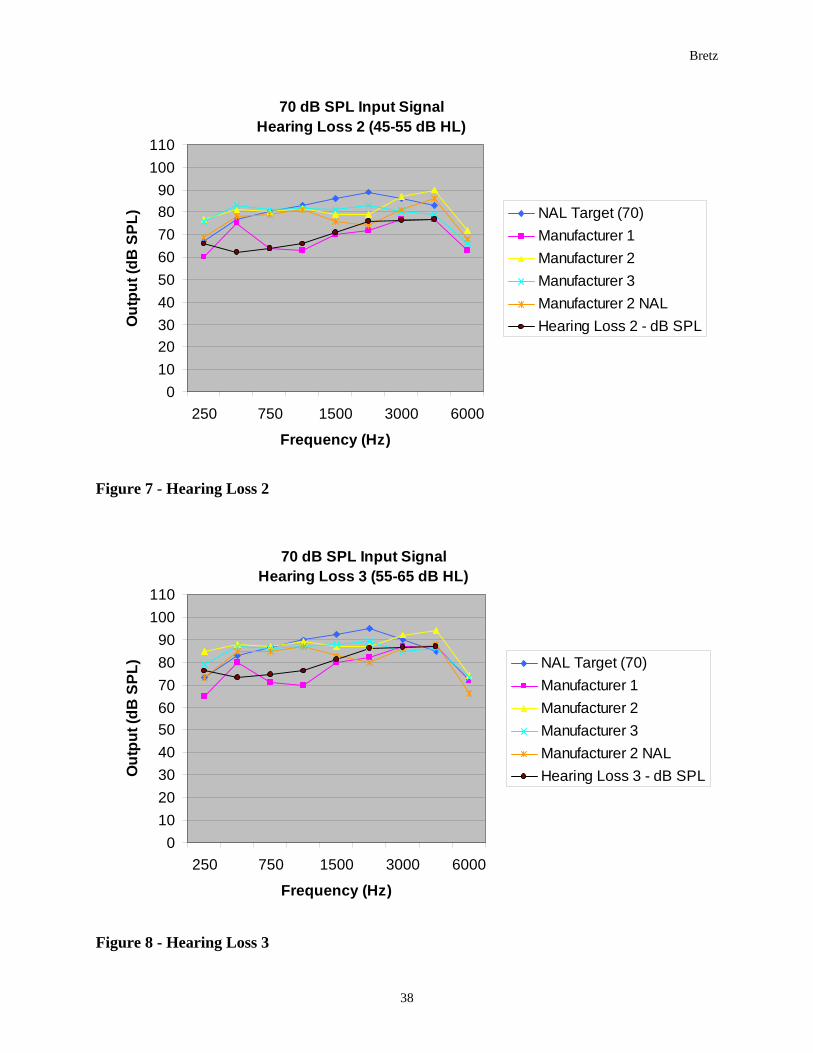
10.6 dB (Manufacturer 1). For hearing loss 2 (figure 7) the average deviations from NAL target
were as follows: 4.7 dB (Manufacturer 3), 4.8 dB (Manufacturer 2 NAL), 5 dB (Manufacturer 2
Proprietary), and 11.6 dB (Manufacturer 1). For hearing loss 3 (figure 8) the average deviations
from NAL target were as follows: 3.75 dB (Manufacturer 3), 4.7 dB (Manufacturer 2 NAL), 5.3
dB (Manufacturer 2 Proprietary), and 9.6 dB (Manufacturer 1). For hearing loss 4 (figure 9) the
average deviations from NAL target were as follows: 3.9 dB (Manufacturer 3), 5 dB
(Manufacturer 2 Proprietary), 5.1 dB (Manufacturer 2 NAL), and 8.3 dB (Manufacturer 1). For
hearing loss 5 (figures 5 and 10) the average deviations from NAL target were as follows: 2.9 dB
19

Bretz
(Manufacturer 3), 6.3 dB (Manufacturer 2 NAL), 6.6 dB (Manufacturer 2 Proprietary), and 9.6
dB (Manufacturer 1).
There is a consistent pattern seen through all the hearing losses. The Manufacturer 2
DSL program was most similar to the DSL target, while the Manufacturer 3 hearing aid was
most similar to the NAL target. The Manufacturer 1 hearing aid consistently shows a great
amount of deviation from both targets.
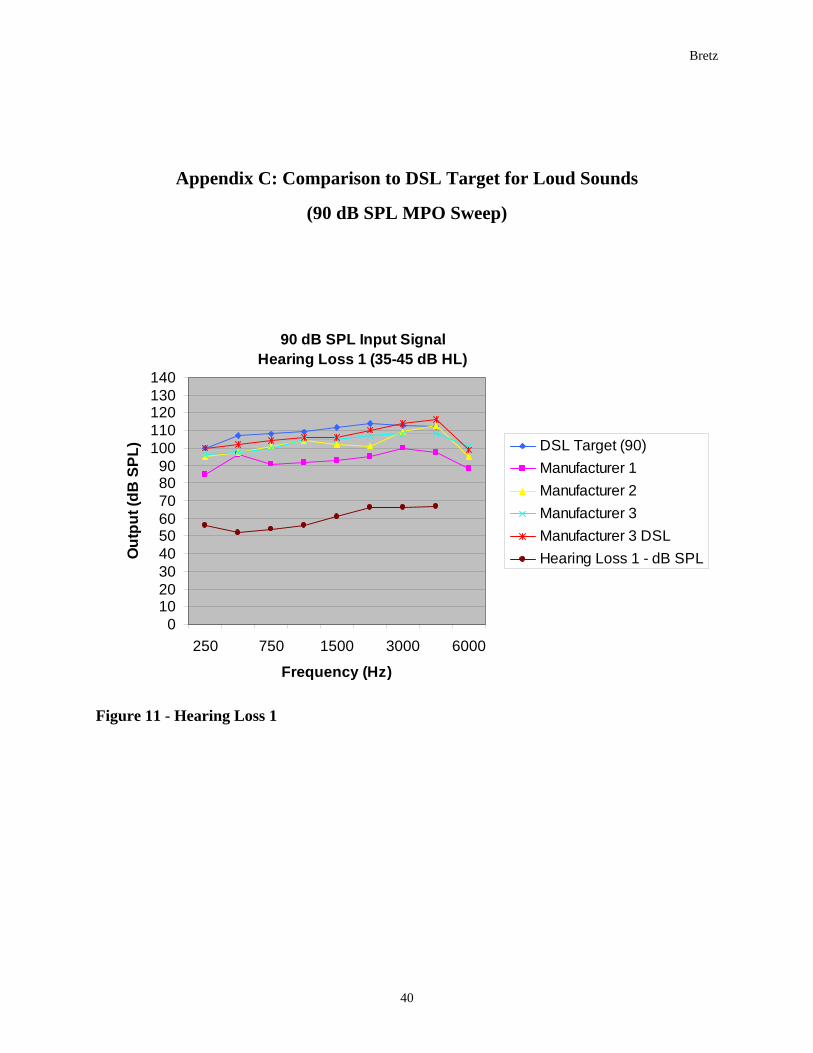
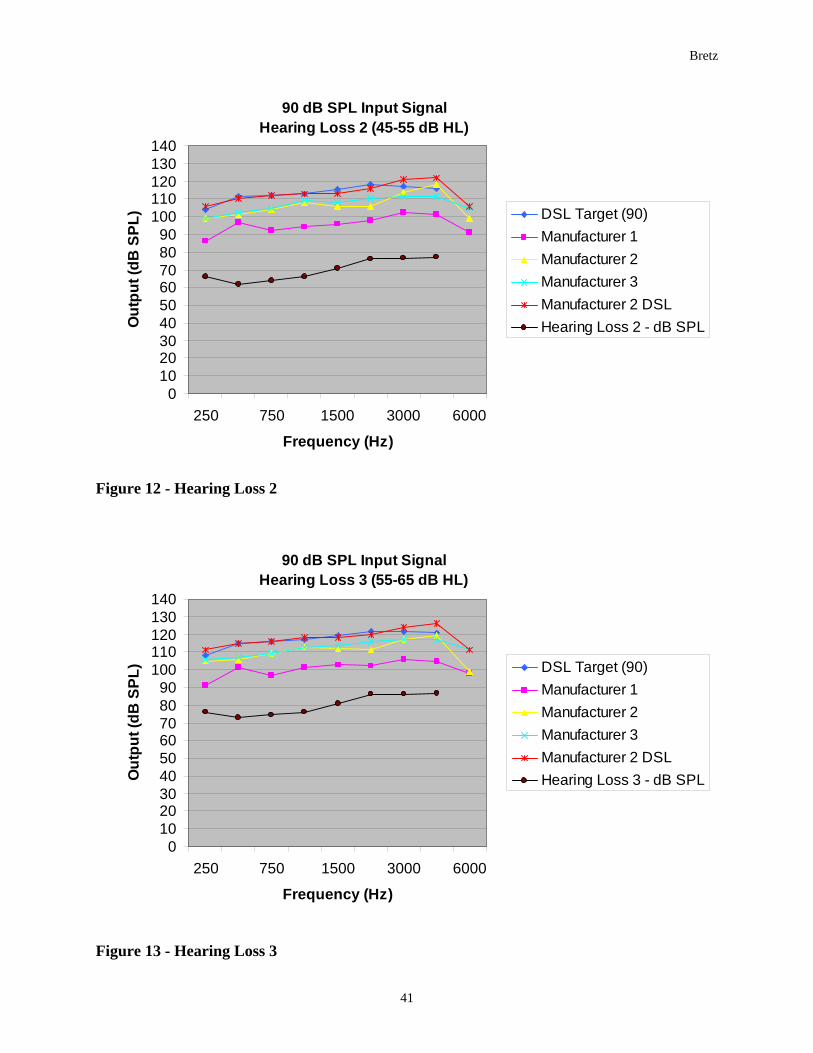
Comparison to Targets for Loud Sounds (90 dB SPL MPO Sweep)
The second comparison examined how well the initial hearing aid fit recommended by
the manufacturers’ algorithms compared to DSL i/o and NAL-NL1 targets for the 90 dB SPL
MPO Sweep (See Appendices C and D). Again the absolute value of the difference from the
target output to the measured output was averaged for frequencies 250, 500, 750, 1000, 1500,
2000, 3000 and 4000 Hz.
For hearing loss 1 (figure 11) the average deviations from DSL target were as follows:
3.3 dB (Manufacturer 2 DSL), 6 dB (Manufacturer 3), 6.8 dB (Manufacturer 2 Proprietary), and
15.6 dB (Manufacturer 1). For hearing loss 2 (figure 12) the average deviations from DSL target
were as follows: 2.1 dB (Manufacturer 2 DSL), 6.4 dB (Manufacturer 3), 6.8 dB (Manufacturer 2
Proprietary), and 17.5 dB (Manufacturer 1). For hearing loss 3 (figure 13) the average deviations
from DSL target were as follows: 1.8 dB (Manufacturer 2 DSL), 5.1 dB (Manufacturer 3), 6 dB
(Manufacturer 2 Proprietary), and 16.7 dB (Manufacturer 1). For hearing loss 4 (figure 14) the
average deviations from DSL target were as follows: 1.8 dB (Manufacturer 3), 2.2 dB
(Manufacturer 2 DSL), 4 dB (Manufacturer 2 Proprietary), and 15.2 dB (Manufacturer 1). For
hearing loss 5 (figure 15) the average deviations from DSL target were as follows: 2 dB
20

Bretz
(Manufacturer 2 DSL), 3.1 dB (Manufacturer 3), 6.6 dB (Manufacturer 2 Proprietary), and 15.2
dB (Manufacturer 1).
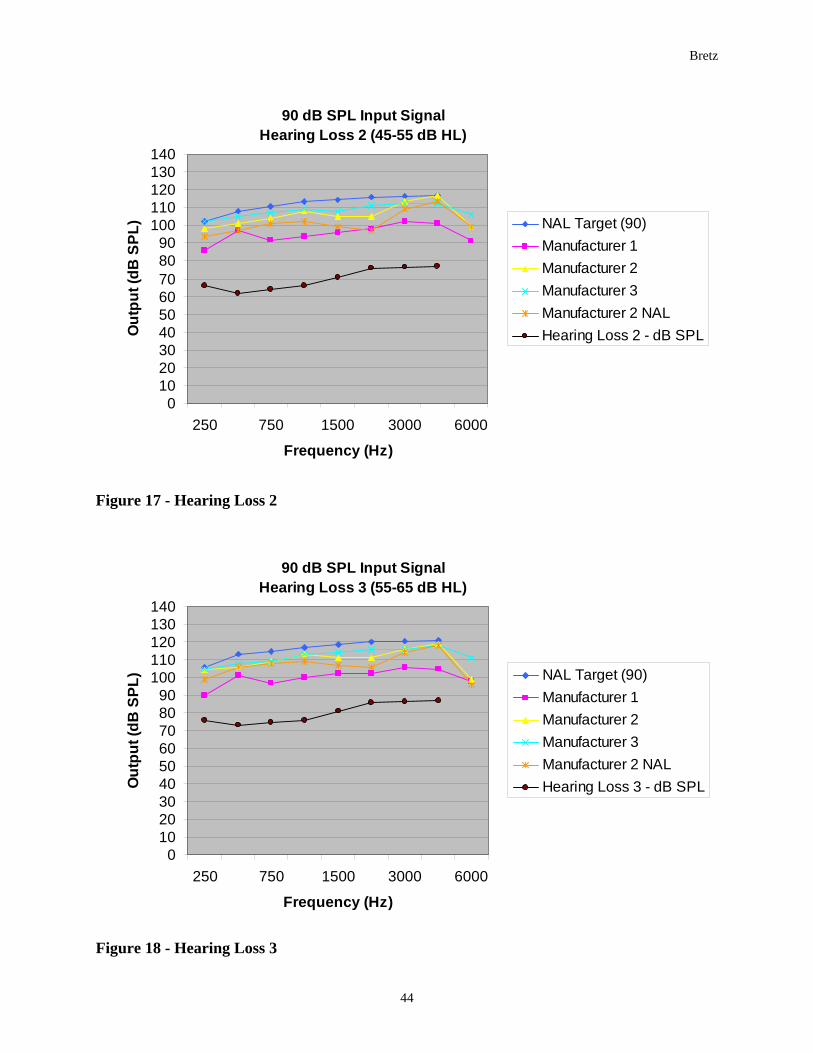
For hearing loss 1 (figure 16) the average deviations from NAL target were as follows: 5
dB (Manufacturer 3), 5.9 dB (Manufacturer 2 Proprietary), 12.4 dB (Manufacturer 2 NAL), and
14.8 dB (Manufacturer 1). For hearing loss 2 (figure 17) the average deviations from NAL target
were as follows: 3.9 dB (Manufacturer 3), 5.8 dB (Manufacturer 2 Proprietary), 10.6 dB
(Manufacturer 2 NAL), and 16.4 dB (Manufacturer 1). For hearing loss 3 (figure 18) the average
deviations from NAL target were as follows: 4 dB (Manufacturer 3), 5.2 dB (Manufacturer 2
Proprietary), 8 dB (Manufacturer 2 NAL), and 16 dB (Manufacturer 1). For hearing loss 4
(figure 19) the average deviations from NAL target were as follows: 1.8 dB (Manufacturer 3),
3.7 dB (Manufacturer 2 Proprietary), 7.2 dB (Manufacturer 2 NAL), and 14.6 dB (Manufacturer
1). For hearing loss 5 (figure 20) the average deviations from NAL target were as follows: 3.8
dB (Manufacturer 3), 6.7 dB (Manufacturer 2 NAL), 7.2 dB (Manufacturer 2 Proprietary), and
15.8 dB (Manufacturer 1).
There was a consistent pattern seen through all the hearing losses that was similar to the
results of the 70 dB SPL input level. The Manufacturer 2 DSL program was the most similar to
DSL target and Manufacturer 3 was most similar to NAL target. The Manufacturer 1 hearing aid
consistently deviated the most from both targets.
Soft Speech (55 dB SPL)
The third comparison examined the difference in the output of the hearing aids with soft
speech (55 dB SPL) as the input (See Appendix E). The output was averaged for frequencies
250, 500, 750, 1000, 1500, 2000, 3000, 4000 and 6000 Hz. For hearing loss 1 (figure 21) the
average output across frequencies were as follows: 55.3 dB SPL (Manufacturer 1), 60.4 dB SPL
21
Bretz
(Manufacturer 2 NAL), 63.5 dB SPL, (Manufacturer 2 Proprietary), 64.4 dB SPL (Manufacturer
3), and 70.5 dB SPL (Manufacturer 2 DSL). For hearing loss 2 (figure 22) the average output
across frequencies were as follows: 59.5 dB SPL (Manufacturer 1), 65.5 dB SPL (Manufacturer
2 NAL), 69.5 dB SPL (Manufacturer 2 Proprietary), 69.7 dB SPL (Manufacturer 3), and 80.7 dB
SPL (Manufacturer 2 DSL). For hearing loss 3 (figure 23) the average output across frequencies
were as follows: 67.6 dB SPL (Manufacturer 1), 69.8 dB SPL (Manufacturer 2 NAL), 75 dB SPL
(Manufacturer 3), 76.1 dB SPL (Manufacturer 2 Proprietary), and 85.6 dB SPL (Manufacturer 2
DSL). For hearing loss 4 (figure 24) the average output across frequencies were as follows: 75.8
dB SPL (Manufacturer 1), 76.7 dB SPL (Manufacturer 2 NAL), 82.2 dB SPL (Manufacturer 3),
84.4 dB SPL (Manufacturer 2 Proprietary), and 90.6 dB SPL (Manufacturer 2 DSL). For hearing
loss 5 (figure 25) the average output across frequencies were as follows: 83 dB SPL
(Manufacturer 1), 83.2 dB SPL (Manufacturer 2 NAL), 90.5 dB SPL (Manufacturer 3), 91.7 dB
SPL (Manufacturer 2 Proprietary), and 95 dB SPL (Manufacturer 2 DSL). There was a
consistent pattern seen through all the hearing losses that was similar to the previous results. The
Manufacturer 2 DSL program had the most output and Manufacturer 1 had the least output.
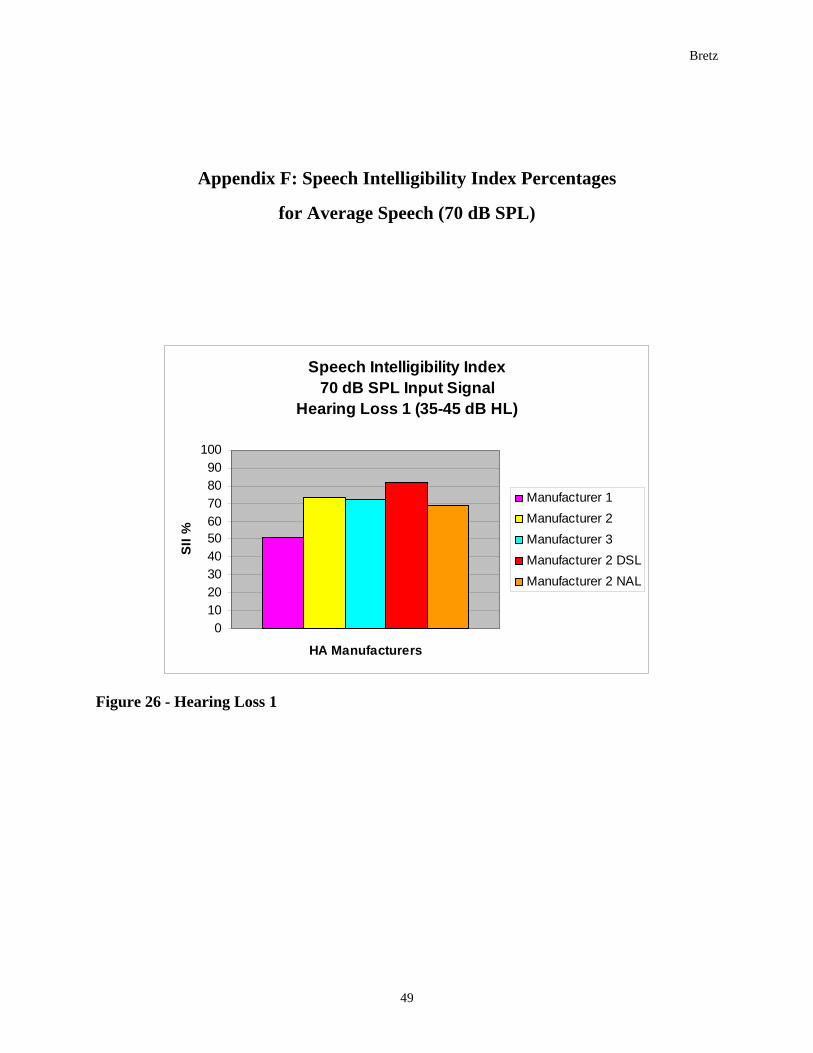
Speech Intelligibility Index Score for Average (70 dB SPL) and Soft (55 dB SPL) Speech
In addition to measuring the output of the hearing aids the Verifit system also calculates
the Speech Intelligibility Index (SII) as a percentage. The SII on the Verifit system represents
the percentage of the LTASS that is above threshold and is audible to the hearing impaired user
when wearing the hearing aids (See Appendix F). For average conversational level speech (70
dB SPL) the SII percentages for hearing loss 1 (figure 26) were as follows: 51% (Manufacturer
1), 69% (Manufacturer 2 NAL), 72% (Manufacturer 3), 73% (Manufacturer 2 Proprietary) and
82% (Manufacturer 2 DSL). For hearing loss 2 (figure 27) the SII percentages were as follows:
22

Bretz
32% (Manufacturer 1), 54% (Manufacturer 2 NAL), 59% (Manufacturer 3), 61% (Manufacturer
2 Proprietary) and 76% (Manufacturer 2 DSL). For hearing loss 3 (figure 28) the SII
percentages were as follows: 25% (Manufacturer 1), 40% (Manufacturer 2 NAL), 45%
(Manufacturer 3), 49% (Manufacturer 2 Proprietary) and 65% (Manufacturer 2 DSL). For
hearing loss 4 (figure 29) the SII percentages were as follows: 20% (Manufacturer 1), 29%
(Manufacturer 2 NAL), 39% (Manufacturer 3), 41% (Manufacturer 2 Proprietary), and 52%
(Manufacturer 2 DSL). For hearing loss 5 (figure 30) the SII percentages were as follows: 11%
(Manufacturer 1), 21% (Manufacturer 2 NAL), 32% (Manufacturer 3), 34% (Manufacturer 2
Proprietary), and 39% (Manufacturer 2 DSL). The results show a consistent pattern for all the
hearing losses that Manufacturer 1 hearing aid was providing the least audibility of speech, while
the Manufacturer 2 DSL aid was providing the greatest audibility of speech.
The SII percentages were also calculated for soft level (55 dB SPL) speech (See
Appendix G). The SII percentages for hearing loss 1 (figure 31) were as follows: 22%
(Manufacturer 1), 38% (Manufacturer 2 NAL), 47% (Manufacturer 2 Proprietary), 52%
(Manufacturer 3), and 64% (Manufacturer 2 DSL). For hearing loss 2 (figure 32) the SII
percentages were as follows: 9% (Manufacturer 1), 25% (Manufacturer 2 NAL), 33%
(Manufacturer 2 Proprietary), 38% (Manufacturer 3), and 60% (Manufacturer 2 DSL). For
hearing loss 3 (figure 33) the SII percentages were as follows: 6% (Manufacturer 1), 16%
(Manufacturer 2 NAL), 24% (Manufacturer 3), 25% (Manufacturer 2 Proprietary), and 47%
(Manufacturer 2 DSL). For hearing loss 4 (figure 34) the SII percentages were as follows: 4%
(Manufacturer 1), 11% (Manufacturer 2 NAL), 19% (Manufacturer 3), 24% (Manufacturer 2
Proprietary), and 36% (Manufacturer 2 DSL). For hearing loss 5 (figure 35) the SII percentages
were as follows: 3% (Manufacturer 1), 7% (Manufacturer 2 NAL), 14% (Manufacturer 3), 23%
23

Bretz
(Manufacturer 2 Proprietary), and 27% (Manufacturer 2 DSL). Again the results show a
consistent pattern for all the hearing losses that the Manufacturer 1 hearing aid was providing the
least audibility of speech, while the Manufacturer 2 DSL aid was providing the greatest
audibility of speech.
Discussion
Comparison to Targets for Average Speech (70 dB SPL)
The targets for the 70 dB SPL input level represent the output levels where average
conversational speech should be audible and comfortable. The DSL and NAL targets represent
the place in the user’s dynamic range one would expect to find this comfortable level (ASHA,
1998; Lindley and Palmer, 1997). The graphs in Appendix A and B demonstrate that the
Manufacturer 2 DSL program was the most similar to the DSL target, while the Manufacturer 3
hearing aid was the most similar to the NAL target for all five hearing losses. The Manufacturer
1 hearing aid consistently showed a great amount of deviation from both targets, as it was much
lower than either target. The average output varied across manufacturers by approximately 20
dB. Given the large differences in output across the three manufacturers, it is difficult to
determine whether a patient is receiving an appropriate amount of amplification.
Manufacturer 2’s implementation of DSL and NAL targets are of special interest. The
DSL algorithm as implemented by Manufacturer 2 was a very close match to the DSL target
only, deviating from target by 2 - 5 dB. The NAL algorithm as implemented by Manufacturer 2
was not the best match and deviated from the NAL target by 5 - 6 dB. The Manufacturer 2
Proprietary algorithm was closer to NAL target deviating from target by 4 - 5 dB. Although
Manufacturer 3 only uses a proprietary algorithm it was closest to the NAL target and deviated
from NAL target by only 3 - 4 dB. However, the results for the Manufacturer 2 NAL,
24

Bretz
Manufacturer 2 Proprietary and Manufacturer 3 hearing aids were all very close for the 70 dB
SPL input level.
Of significant interest was the finding that for the average conversational speech input
level (Appendices A and B) the average LTASS of the Manufacturer 1 hearing aid was below
threshold for the mid and high frequencies for hearing loss 2 and nearly all frequencies for
hearing losses 3, 4 and 5. While the plots on the graphs show the average aided LTASS was
below threshold, the peaks of speech would still be partially audible to the patient. However,
patients fit in this manner would be unable to detect the majority of average conversational
speech, as will be demonstrated by the Speech Intelligibility Index scores.
Comparison to Targets for Loud Sounds (90 dB SPL MPO Sweep)
The goal of this portion of the hearing aid fitting is to determine if loud sounds are below
either predicted or measured levels of discomfort so that the hearing aids do not amplify speech
to levels that would be uncomfortably loud for the patient. However, it is desirable to utilize the
full auditory dynamic range of the patient in order to hear soft speech as well as loud speech.
Most importantly the output of the hearing aid should not be great enough to cause additional
hearing loss. An appropriately set maximum output will accomplish these goals (Mueller and
Hornsby, 2002).
Again the results showed a consistent pattern where the Manufacturer 2 DSL program
was the most similar to DSL target, Manufacturer 3 was most similar to NAL target, and
Manufacturer 1 consistently deviated the most from both targets. The average output varied
across manufacturers by approximately 15 dB. The maximum output of some manufacturers was
very close to the predicted level of discomfort, while other manufacturers were much more
conservative.
25
Bretz
When comparing the manufacturer implementation of the DSL and NAL algorithm in the
Manufacturer 2 hearing aid to the DSL and NAL targets, the results were similar to those seen
with the 70 dB SPL input level. The DSL algorithm as implemented by Manufacturer 2 was a
very close match to the DSL target only deviating from target by 2 - 3 dB. The NAL algorithm
as implemented by Manufacturer 2 was not the best match for the NAL target deviating from
target by 7 - 12 dB. Again the Manufacturer 2 Proprietary algorithm was closer to NAL target
than the NAL algorithm and deviated from the NAL target by 3 - 7 dB. Although Manufacturer
3 only uses a proprietary algorithm it was closest to the NAL target and deviated from the NAL
target by 2 - 4 dB. However, the results for the Manufacturer 2 NAL, Manufacturer 2
Proprietary and Manufacturer 3 hearing aids showed a larger difference from each other than was
seen with the 70 dB input level. In this case the Manufacturer 2 NAL algorithm showed a much
larger deviation from target than both the Manufacturer 2 Proprietary and the Manufacturer 3
hearing aid.
The figures in Appendix C and D illustrate two important points. First, the maximum
output of the Manufacturer 2 DSL hearing aid was above target consistently in the high and low
frequencies for most of the hearing losses. This could be problematic as the hearing aid may
allow some sounds to become too loud for some hearing aid users. Second, the Manufacturer 1
hearing aid was far below both the DSL and NAL targets for all of the hearing losses. This
drastically reduces the dynamic range available to the patient and limits the amount of audible
speech at all levels. This finding was even more prominent for the more severe hearing losses.
Audibility of Soft Speech (55 dB SPL)
The goal of this portion of a hearing aid fitting is to adjust the aid so that soft speech is
audible in order for the patient to hear all the components of speech especially all of the soft
26
Bretz
consonant sounds (ASHA, 1998; Lindley and Palmer, 1997). The pattern for audibility of soft
speech was consistent with the other input levels and showed that Manufacturer 2 DSL program
had the most output and Manufacturer 1 had the least output. The average output varied across
manufacturers by approximately 15 to 20 dB. These large differences would likely result in
some manufacturers providing much more audibility for soft sounds to the hearing aid users than
other manufacturers.
Examination of the figures (Appendix E) shows that the average LTASS for even the
mildest hearing loss (hearing loss 1) the Manufacturer 1 hearing aid was below threshold for the
mid and high frequencies, and the LTASS for Manufacturer 3 and Manufacturer 2 NAL was
below threshold for the high frequencies. The hearing aid outputs for soft speech began to drop
further below threshold as the severity of the hearing losses increased. For hearing loss 3 the
outputs for the Manufacturer 1 hearing aid were below threshold for all frequencies, while
Manufacturer 3, Manufacturer 2 Proprietary and Manufacturer 2 NAL all dropped below
threshold for the mid and high frequencies. The Manufacturer 2 DSL program started to dip
below threshold in the high frequencies. For hearing loss 5 the outputs for Manufacturer 1,
Manufacturer 2 NAL and Manufacturer 3 were all below threshold at all frequencies. The
Manufacturer 2 Proprietary and Manufacturer 2 DSL were still audible in the low and mid
frequencies. While the plots on the graphs signify the average aided LTASS was below
threshold, the peaks of speech would still be partially audible to the patient. These results show
that many of these fitting algorithms are failing to meet the goal of making soft speech audible to
the user. Although this result is partially expected as the gain and output required by more
severe losses may exceed the capability of the hearing aid, the Manufacturer 2 DSL and
27
Bretz
Manufacturer 2 Proprietary algorithm were able to keep a portion of the LTASS above threshold
for even the most severe hearing loss.
Speech Intelligibility Index Score for Average (70 dB SPL) and Soft (55 dB SPL) Speech
The SII results help to illustrate a real picture of how the hearing aid fittings impact
speech audibility for hearing aid users. The Manufacturer 1 hearing aid consistently provided
the least amount of speech audibility, while the Manufacturer 2 DSL aid provided the greatest
amount of speech audibility for both the average and soft speech levels. The difference across
the manufacturers was approximately 30 to 40% for average level speech depending on the
hearing loss and 35 to 45% for soft speech depending on the hearing loss. The differences seen
between manufacturers were very large with some manufacturers providing up to 45% greater
SII scores.
For the average conversational speech input level (70 dB SPL) the SII scores were quite
surprising. The majority of speech at this level should be audible to patients, however, one does
expect to see decreasing scores with an increase in the severity of the hearing loss. As shown in
the results section, the Manufacturer 1 hearing aid only provided a small portion of speech
audibility to the hearing aid user for even the mild and moderate hearing losses (25% - 50%).
The Manufacturer 2 DSL program, however, provided 65% - 82% for the mild and moderate
hearing losses. For the more severe hearing losses, the Manufacturer 1 hearing aid only provided
11% - 20%, while Manufacturer 2 DSL provided 39% - 52%. This is simply not acceptable and
these results were only worse for the soft speech input level.
For the soft speech input level (55 dB SPL) the SII scores were quite poor. As shown in
the results section the Manufacturer 1 hearing aid only provided very limited audibility of speech
to the hearing aid user for even the mild and moderate hearing losses (6% - 22%), while the
28
Bretz
Manufacturer 2 DSL program provided 47% - 64% for the mild and moderate hearing losses.
For the more severe hearing losses Manufacturer 1 only provided 3% - 4%, while Manufacturer
2 DSL provided 27% - 36%. It is of interest to note the wide variability in SII’s across hearing
aid manufacturers for the same degree of hearing loss. Although it is expected that the SII for
soft speech will be relatively low compared to average conversational levels, the use of WDRC
should make the goal hearing soft speech more attainable than with more traditional linear
hearing aids. Some of these hearing aids have failed at meeting that goal.
Conclusions
The results of this study along with previous research demonstrate that the manufacturer
recommended “first fits” are highly variable. Even when a manufacturer states that the DSL or
NAL prescriptions have been implemented in their software, differences were still seen. The
large difference seen between manufacturers’ hearing aid fittings reiterates the message that
audiologists must verify their hearing aid fittings. This is especially important for young
pediatric patients who cannot give accurate reports on how well they are hearing and little
information can be obtained through validation procedures (i.e. speech perception testing).
Verification through real ear or coupler measures is essential for determining the amount of
amplification the patient is receiving. The recent advances in hearing aid technology have called
for improved verification methods. Researchers are working on improving generic prescriptive
methods and new DSL and NAL prescriptions will soon become available that will take into
account more of the features available with digital signal processing hearing aids. Verification
should be considered an essential part of the hearing aid fitting process. It is hoped that
improved prescriptive methods will facilitate increasing the number of audiologists verifying all
hearing aid fittings.
29
Bretz
Future Directions for Research
As mentioned previously, hearing aid technology is improving at an incredibly fast rate.
There are many opportunities for future research on the subject of manufacturer’s recommended
“first fit” that were not addressed in this study including:
1. Comparing different manufacturers recommended first fit using different configurations of hearing loss.
2. Comparing speech perception abilities of a child or adult with different manufacturers’
first fit recommendations. 3.
4.
Comparing differences in recommended first fit within a manufacturer using different levels of hearing aid technology.
Comparing subjective views of a child or adult with different manufacturers’ first fit recommendations.
30
Bretz
References
Aarts N. Caffee C. (2005). Manufacturer predicted and measured REAR values in adult hearing aid fitting: Accuracy and clinical usefulness. International Journal of Audiology, 44:293-301.
American National Standards Institute (1997). American national standard methods for calculation of the speech intelligibility index, ANSI S3.5 – 1997. New York: ANSI, 1997a.
ASHA Ad Hoc Committee on Hearing Aid Selection and Fitting (1998). Guidelines for hearing aid fitting for adults. American Journal of Audiology, 7:5-13.
Audioscan (2005). Audioscan Verifit VF-1 Real Ear Hearing Aid Analyzer User’s Guide Version 2.6.
Bagatto M. Scollie S. Seewald R. Moodie K. Hoover B. (2002). Real-Ear-to-Coupler difference predictions as a function of age for two coupling procedures. Journal of the American Academy of Audiology, 13:407-415.
Byrne D. Dillon H. Ching T. Katsch R. Keidser G. (2001). NAL-NL1 procedure for fitting nonlinear hearing aids: characteristics and comparisons with other procedures. Journal of the American Academy of Audiology, 12(1):37-51.
Cornelisse LE. Seewald RC. Jamieson DG (1995). The input/output formula: A theoretical approach to the fitting of personal amplification devices. Journal of the Acoustical Society of America, 97(3):1854-1864.
Cox R. Moore J. (1988). Composite speech spectrum for hearing aid gain prescriptions. Journal of Speech and Hearing Research, 31:102-107.
Ellison J. Harris F. Muller T. (2003). Interactions of hearing aid compression release time and fitting formula: Effects on speech acoustics. American Academy of Audiology, 14(2):59-71.
Fabry D. (2003). Nonlinear hearing aids and verification of fitting targets. Trends in Amplification, 7(3):99-115.
31

Bretz
Hawkins D. Cook J. (2003). Hearing aid software predictive gain values: How accurate are they? The Hearing Journal, 56(7):26-34.
Hornsby B. (2004). Page Ten: The speech intelligibility index: What is it and what is it good for? The Hearing Journal, 57(10):10-17.
Keidser G. Brew C. Peck A. (2003). How proprietary fitting algorithms compare to each other and to some generic algorithms. The Hearing Journal, 56(3):28-38.
Kirkwood D. (2004). Survey finds most dispensers bullish, but not on over-the-counter devices. The Hearing Journal, 57(3):19-30.
Kuk F. Ludvigsen C. (1999). Variables affecting the use of prescriptive formulae to fit modern nonlinear hearing aids. Journal of the American Academy of Audiology, 10:458-465.
Kuk F. (2002). Considerations in modern multichannel nonlinear hearing aids. In: Valente M. ed. Hearing Aids: Standards, Options and Limitations. NY: Thieme Medical Publishers, pp.178-213.
Lindley G. Palmer C. (1997). Fitting wide dynamic range compression hearing aids: DSL i/o, the IHAFF Protocol, and FIG6. American Journal of Audiology, 6(3):19-28.
Ludvigsen M. Kuk F. (2001). New solutions for age-old hearing aid problems. Hearing Review. 8(11).
Lutzen M. (no date). How much fine tuning does a modern hearing system require? Phonak Focus. Retrieved May 4, 2006, from
http://www.phonak.com/com_028-0610-xx_focus_35.pdf
Mueller H. Hornsby B. (2002). Selection, verification, and validation of maximum output. In: Valente M. ed. Strategies for Selecting and Verifying Hearing Aid Fittings. NY: Thieme Medical Publishers, pp. 23-65.
Revit L. (2002). Real-Ear measures. In: Valente M. ed. Strategies for Selecting and Verifying Hearing Aid Fittings. NY: Thieme Medical Publishers, pp. 66-124.
32

Bretz
Smeds K. and Leijon A. (2001). Threshold-based fitting methods for non-linear (WDRC) hearing instruments--comparison of acoustic characteristics. Scandinavian Audiology, 30(4):213-22.
Voice Aligned Compression (2005). Retrieved May 4, 2006, from http://www.oticon.com/eprise/main/Oticon/US_en/SEC_Professionals/ProductInformatio n/Syncro/Syncro_ArtificialIntelligence/Syncro_VoiceAlignedCompression/_Index.
33

Bretz
Appendix A: Comparison to DSL Target for Average Speech (70 dB SPL)
70 dB SPL Input SignalHearing Loss 1 (35-45 dB HL)
0102030405060708090
100110
250 750 1500 3000 6000
Frequency (Hz)
Out
put (
dB S
PL) DSL Target (70)
Manufacturer 1Manufacturer 2Manufacturer 3Manufacturer 2 DSLHearing Loss 1 - dB SPL
Figure 1 – Hearing Loss 1

Bretz
35
70 dB SPL Input SignalHearing Loss 2 (45-55 dB HL)
0102030405060708090
100110
250 750 1500 3000 6000
Frequency (Hz)
Out
put (
dB S
PL) DSL Target (70)
Manufacturer 1Manufacturer 2Manufacturer 3Manufacturer 2 DSLHearing Loss 2 - dB SPL
Figure 2 - Hearing Loss 2
70 dB SPL Input SignalHearing Loss 3 (55-65 dB HL)
0102030405060708090
100110
250 750 1500 3000 6000
Frequency (Hz)
Out
put (
dB S
PL) DSL Target (70)
Manufacturer 1Manufacturer 2Manufacturer 3Manufacturer 2 DSLHearing Loss 3 - dB SPL
Figure 3 - Hearing Loss 3

Bretz
36
70 dB SPL Input SignalHearing Loss 4 (65-75 dB HL)
0102030405060708090
100110120
250 750 1500 3000 6000
Frequency (Hz)
Out
put (
dB S
PL) DSL Target (70)
Manufacturer 1Manufacturer 2Manufacturer 3Manufacturer 2 DSLHearing Loss 4 - dB SPL
Figure 4 - Hearing Loss 4
70 dB SPL Input Signal Hearing Loss 5 (75-85 dB HL)
0102030405060708090
100110120130
250 750 1500 3000 6000
Frequency (Hz)
Out
put (
dB S
PL)
DSL Target (70)Manufacturer 1Manufacturer 2Manufacturer 3Manufacturer 2 DSLHearing Loss 5 - dB SPL
Figure 5 - Hearing Loss 5
Bretz
37
Appendix B: Comparison to NAL Target for Average Speech (70 dB SPL)
70 dB SPL Input SignalHearing Loss 1 (35-45 dB HL)
0102030405060708090
100110
250 750 1500 3000 6000
Frequency (Hz)
Out
put (
dB S
PL) NAL Target (70)
Manufacturer 1Manufacturer 2Manufacturer 3Manufacturer 2 NALHearing Loss 1 - dB SPL
Figure 6 - Hearing Loss 1
Bretz
38
70 dB SPL Input SignalHearing Loss 2 (45-55 dB HL)
0102030405060708090
100110
250 750 1500 3000 6000
Frequency (Hz)
Out
put (
dB S
PL) NAL Target (70)
Manufacturer 1Manufacturer 2Manufacturer 3Manufacturer 2 NALHearing Loss 2 - dB SPL
Figure 7 - Hearing Loss 2
70 dB SPL Input SignalHearing Loss 3 (55-65 dB HL)
0102030405060708090
100110
250 750 1500 3000 6000
Frequency (Hz)
Out
put (
dB S
PL) NAL Target (70)
Manufacturer 1Manufacturer 2Manufacturer 3Manufacturer 2 NALHearing Loss 3 - dB SPL
Figure 8 - Hearing Loss 3

Bretz
39
70 dB SPL Input SignalHearing Loss 4 (65-75 dB HL)
0102030405060708090
100110
250 750 1500 3000 6000
Frequency (Hz)
Out
put (
dB S
PL) NAL Target (70)
Manufacturer 1Manufacturer 2Manufacturer 3Manufacturer 2 NALHearing Loss 4 - dB SPL
Figure 9 - Hearing Loss 4
70 dB SPL Input SignalHearing Loss 5 (75-85 dB HL)
0102030405060708090
100110120
250 750 1500 3000 6000
Frequency (Hz)
Out
put (
dB S
PL) NAL Target (70)
Manufacturer 1Manufacturer 2Manufacturer 3Manufacturer 2 NALHearing Loss 5 - dB SPL
Figure 10 - Hearing Loss 5
Bretz
40
Appendix C: Comparison to DSL Target for Loud Sounds
(90 dB SPL MPO Sweep)
90 dB SPL Input SignalHearing Loss 1 (35-45 dB HL)
0102030405060708090
100110120130140
250 750 1500 3000 6000
Frequency (Hz)
Out
put (
dB S
PL) DSL Target (90)
Manufacturer 1Manufacturer 2Manufacturer 3Manufacturer 3 DSLHearing Loss 1 - dB SPL
Figure 11 - Hearing Loss 1
Bretz
41
90 dB SPL Input SignalHearing Loss 2 (45-55 dB HL)
0102030405060708090
100110120130140
250 750 1500 3000 6000
Frequency (Hz)
Out
put (
dB S
PL) DSL Target (90)
Manufacturer 1Manufacturer 2Manufacturer 3Manufacturer 2 DSLHearing Loss 2 - dB SPL
Figure 12 - Hearing Loss 2
90 dB SPL Input SignalHearing Loss 3 (55-65 dB HL)
0102030405060708090
100110120130140
250 750 1500 3000 6000
Frequency (Hz)
Out
put (
dB S
PL) DSL Target (90)
Manufacturer 1Manufacturer 2Manufacturer 3Manufacturer 2 DSLHearing Loss 3 - dB SPL
Figure 13 - Hearing Loss 3

Bretz
42
90 dB SPL Input SignalHearing Loss 4 (65-75 dB HL)
0102030405060708090
100110120130140
250 750 1500 3000 6000
Frequency (Hz)
Out
put (
dB S
PL) DSL Target (90)
Manufacturer 1Manufacturer 2Manufacturer 3Manufacturer 2 DSLHearing Loss 4 - dB SPL
Figure 14 - Hearing Loss 4
90 dB SPL Input SignalHearing Loss 5 (75-85 dB HL)
0102030405060708090
100110120130140
250 750 1500 3000 6000
Frequency (Hz)
Out
put (
dB S
PL) DSL Target (90)
Manufacturer 1Manufacturer 2Manufacturer 3Manufacturer 2 DSLHearing Loss 5 - dB SPL
Figure 15 - Hearing Loss 5

Bretz
43
Appendix D: Comparison to NAL Target for Loud Sounds
(90 dB SPL MPO Sweep)
90 dB SPL Input SignalHearing Loss 1 (35-45 dB HL)
0102030405060708090
100110120130140
250 750 1500 3000 6000
Frequency (Hz)
Out
put (
dB S
PL) NAL Target (90)
Manufacturer 1Manufacturer 2Manufacturer 3Manufacturer 2 NALHearing Loss 1 - dB SPL
Figure 16 - Hearing Loss 1
Bretz
44
90 dB SPL Input SignalHearing Loss 2 (45-55 dB HL)
0102030405060708090
100110120130140
250 750 1500 3000 6000
Frequency (Hz)
Out
put (
dB S
PL) NAL Target (90)
Manufacturer 1Manufacturer 2Manufacturer 3Manufacturer 2 NALHearing Loss 2 - dB SPL
Figure 17 - Hearing Loss 2
90 dB SPL Input SignalHearing Loss 3 (55-65 dB HL)
0102030405060708090
100110120130140
250 750 1500 3000 6000
Frequency (Hz)
Out
put (
dB S
PL) NAL Target (90)
Manufacturer 1Manufacturer 2Manufacturer 3Manufacturer 2 NALHearing Loss 3 - dB SPL
Figure 18 - Hearing Loss 3

Bretz
45
90 dB SPL Input SignalHearing Loss 4 (65-75 dB HL)
0102030405060708090
100110120130140
250 750 1500 3000 6000
Frequency (Hz)
Out
put (
dB S
PL) NAL Target (90)
Manufacturer 1Manufacturer 2Manufacturer 3Manufacturer 2 NALHearing Loss 4 - dB SPL
Figure 19 - Hearing Loss 4
90 dB SPL Input Signal Hearing Loss 5 (75-85 dB HL)
0102030405060708090
100110120130140
250 750 1500 3000 6000
Frequency (Hz)
Out
put (
dB S
PL) NAL Target (90)
Manufacturer 1Manufacturer 2Manufacturer 3Manufacturer 2 NALHearing Loss 5 - dB SPL
Figure 20 - Hearing Loss 5

Bretz
46
Appendix E: Output for Soft Speech (55 dB SPL)
55 dB SPL Input SignalHearing Loss 1 (35-45 dB HL)
0102030405060708090
100110
250 750 1500 3000 6000
Frequency (Hz)
Out
put (
dB S
PL)
Manufacturer 1Manufacturer 2Manufacturer 3Manufacturer 2 DSLManufacturer 2 NALHearing Loss 1 - dB SPL
Figure 21 - Hearing Loss 1

Bretz
47
55 dB SPL Input SignalHearing Loss 2 (45-55 dB HL)
0102030405060708090
100110
250 750 1500 3000 6000
Frequency (Hz)
Out
put (
dB S
PL)
Manufacturer 1Manufacturer 2Manufacturer 3Manufacturer 2 DSLManufacturer 2 NALHearing Loss 2 - dB SPL
Figure 22 - Hearing Loss 2
55 dB SPL Input SignalHearing Loss 3 (55-65 dB HL)
0102030405060708090
100110
250 750 1500 3000 6000
Frequency (Hz)
Out
put (
dB S
PL)
Manufacturer 1Manufacturer 2Manufacturer 3Manufacturer 2 DSLManufacturer 2 NALHearing Loss 3 - dB SPL
Figure 23 - Hearing Loss 3

Bretz
48
55 dB SPL Input SignalHearing Loss 4 (65-75 dB HL)
0102030405060708090
100110
250 750 1500 3000 6000
Frequency (Hz)
Out
put (
dB S
PL)
Manufacturer 1Manufacturer 2Manufacturer 3Manufacturer 2 DSLManufacturer 2 NALHearing Loss 4 - dB SPL
Figure 24 - Hearing Loss 4
55 dB SPL Input SignalHearing Loss 5 (75-85 dB HL)
0102030405060708090
100110120
250 750 1500 3000 6000
Frequency (Hz)
Out
put (
dB S
PL)
Manufacturer 1Manufacturer 2Manufacturer 3Manufacturer 2 DSLManufacturer 2 NALHearing Loss 5 - dB SPL
Figure 25 - Hearing Loss 5
Bretz
49
Appendix F: Speech Intelligibility Index Percentages
for Average Speech (70 dB SPL)
Speech Intelligibility Index 70 dB SPL Input Signal
Hearing Loss 1 (35-45 dB HL)
0102030405060708090
100
HA Manufacturers
SII %
Manufacturer 1Manufacturer 2Manufacturer 3Manufacturer 2 DSLManufacturer 2 NAL
Figure 26 - Hearing Loss 1

Bretz
50
Speech Intelligibility Index70 dB SPL Input Signal
Hearing Loss 2 (45-55 dB HL)
0102030405060708090
100
HA Manufacturers
SII %
Manufacturer 1Manufacturer 2Manufacturer 3Manufacturer 2 DSLManufacturer 2 NAL
Figure 27 - Hearing Loss 2
Speech Intelligibility Index70 dB SPL Input Signal
Hearing Loss 3 (55-65 dB HL)
0102030405060708090
100
HA Manufacturers
SII %
Manufacturer 1Manufacturer 2Manufacturer 3Manufacturer 2 DSLManufacturer 2 NAL
Figure 28 - Hearing Loss 3

Bretz
51
Speech Intelligibility Index70 dB SPL Input Signal
Hearing Loss 4 (65-75 dB HL)
0102030405060708090
100
HA Manufacturers
SII
%
Manufacturer 1Manufacturer 2Manufacturer 3Manufacturer 2 DSLManufacturer 2 NAL
Figure 29 - Hearing Loss 4
Speech Intelligibility Index70 dB SPL Input Signal
Hearing Loss 5 (75-85 dB HL)
0102030405060708090
100
HA Manufacturers
SII %
Manufacturer 1Manufacturer 2Manufacturer 3Manufacturer 2 DSLManufacturer 2 NAL
Figure 30 - Hearing Loss 5

Bretz
52
Appendix G: Speech Intelligibility Index Percentages
for Soft Speech (55 dB SPL)
Speech Intelligibility Index55 dB SPL Input Signal
Hearing Loss 1 (35-45 dB HL)
0102030405060708090
100
HA Manufacturers
SII %
Manufacturer 1Manufacturer 2Manufacturer 3Manufacturer 2 DSLManufacturer 2 NAL
Figure 31 - Hearing Loss 1

Bretz
53
Speech Intelligibility Index55 dB SPL Input Signal
Hearing Loss 2 (45-55 dB HL)
0102030405060708090
100
HA Manufacturers
SII %
Manufacturer 1Manufacturer 2Manufacturer 3Manufacturer 2 DSLManufacturer 2 NAL
Figure 32 - Hearing Loss 2
Speech Intelligibility Index55 dB SPL Input Signal
Hearing Loss 3 (55-65 dB HL)
0102030405060708090
100
HA Manufacturers
SII %
Manufacturer 1Manufacturer 2Manufacturer 3Manufacturer 2 DSLManufacturer 2 NAL
Figure 33 - Hearing Loss 3

Bretz
54
Speech Intelligibility Index55 dB SPL Input Signal
Hearing Loss 4 (65-75 dB HL)
0102030405060708090
100
HA Manufacturers
SII %
Manufacturer 1Manufacturer 2Manufacturer 3Manufacturer 2 DSLManufacturer 2 NAL
Figure 34 - Hearing Loss 4
Speech Intelligibility Index55 dB SPL Input Signal
Hearing Loss 5 (75-85 dB HL)
0102030405060708090
100
HA Manufacturers
SII %
Manufacturer 1Manufacturer 2Manufacturer 3Manufacturer 2 DSLManufacturer 2 NAL
Figure 35 - Hearing Loss 5

Bretz