A comparison of nondestructive evaluation methods for bridge deck assessment
11
A comparison of nondestructive evaluation methods for bridge deck assessment M. Scott a, * , A. Rezaizadeh a,1 , A. Delahaza b,2 , C.G. Santos c,3 , M. Moore d,4 , B. Graybeal e,5 , G. Washer f,6 a Wiss, Janney, Elstner, Assoc., Inc., Turner-Fairbank Highway Research Center, 6300 Georgetown Pike, McLean, VA 22101, USA b Wiss, Janney, Elstner, Assoc., Inc., 330 Pfingsten Rd., Northbrook, IL 60062, USA c Wiss, Janney, Elstner, Assoc., Inc., 14 Washington Rd., Suite 501, Princeton Junction, NJ 08550, USA d Wiss, Janney, Elstner, Assoc., Inc., 225 Peachtree Street, N.E. Suite 1600, Atlanta, GA 30303, USA e PSI, Inc., Turner-Fairbank Highway Research Center, 6300 Georgetown Pike, McLean, VA 22101, USA f Federal Highway Administration, Turner-Fairbank Highway Research Center, 6300 Georgetown Pike, McLean, VA 22101, USA Received 4 February 2002; accepted 1 July 2002 Abstract Concrete bridge deck deterioration is a significant problem that must be addressed to preserve highway infrastructure investments in bridges around the world. Reducing the cost of bridge deck maintenance is critical to government and private agencies responsible for maintenance of bridges. Maintenance challenges increase as many bridges begin to approach the end of their design life and traffic loads continue to increase. One means of reducing the cost of bridge deck maintenance is to accurately evaluate the condition of the structure and its constituent materials. Current methods used to evaluate deterioration of bridge decks include acoustic, electrochemical, electromagnetic, and visual inspection techniques. The purpose of this study was to assess the advantages and limitations of three available evaluation methods. The evaluation techniques included in this study were ground penetrating radar, the chain drag method, and IE. These techniques represent an important group of inspection methods currently used to evaluate in-service bridge decks. The bridge deck used in the study contains significant delaminations but exhibits virtually no outwardly visible signs of these deficiencies, so a detailed visual inspection survey of the deck was not included. Cores were taken from the bridge deck at selected locations to confirm the accuracy of the results obtained through each evaluation method. This paper presents the findings from each method and describes their respective advantages and limitations. Published by Elsevier Science Ltd. Keywords: Nondestructive evaluation; Radar; Bridge decks; Concrete; Corrosion-induced delamination 1. Introduction The highway infrastructure in the United States and around the world faces a deterioration problem of unprecedented magnitude. Challenging environmental con- ditions and increased traffic volumes make bridges more susceptible than ever to deterioration. Reinforced and precast concrete bridge decks are subjected to very demanding conditions, and virtually all bridge decks will fail to serve out the useful life of the bridge [1]. Accurately evaluating the condition of a bridge deck over time and using this information to choose appropriate maintenance techniques has become critical for the efficient allocation of bridge deck maintenance resources. Many nondestructive evaluation (NDE) methods have been developed for bridge deck assessment but few have been evaluated in a performance-based comparison. Further, most of these methods have not been integrated into a working bridge management system that makes use of the important data provided by these methods. Four basic categories of bridge deck assessment methods utilized include visual inspection, acoustic, electromagnetic, and electrochemical testing. Methods within these four basic 0963-8695/03/$ - see front matter Published by Elsevier Science Ltd. PII: S0963-8695(02)00061-0 NDT&E International 36 (2003) 245–255 www.elsevier.com/locate/ndteint 1 Tel.: þ1-202-493-3119; fax: þ 1-202-493-3126. 2 Tel.: þ1-847-272-4236; fax: þ 1-847-291-9599. 3 Tel.: þ1-609-799-7799; fax: þ 1-609-799-7088. 4 Tel.: þ1-404-577-7444; fax: þ 1-404-577-0066. 5 Tel.: þ1-202-493-3122. 6 Tel.: þ1-202-493-3082; fax: þ 1-202-493-3126. * Corresponding author. Tel.: þ 1-202-493-3124; fax: þ1-202-493-3126.
-
Upload
independent -
Category
Documents
-
view
2 -
download
0
Transcript of A comparison of nondestructive evaluation methods for bridge deck assessment

A comparison of nondestructive evaluation methods for bridge
deck assessment
M. Scotta,*, A. Rezaizadeha,1, A. Delahazab,2, C.G. Santosc,3, M. Moored,4,B. Graybeale,5, G. Washerf,6
aWiss, Janney, Elstner, Assoc., Inc., Turner-Fairbank Highway Research Center, 6300 Georgetown Pike, McLean, VA 22101, USAbWiss, Janney, Elstner, Assoc., Inc., 330 Pfingsten Rd., Northbrook, IL 60062, USA
cWiss, Janney, Elstner, Assoc., Inc., 14 Washington Rd., Suite 501, Princeton Junction, NJ 08550, USAdWiss, Janney, Elstner, Assoc., Inc., 225 Peachtree Street, N.E. Suite 1600, Atlanta, GA 30303, USA
ePSI, Inc., Turner-Fairbank Highway Research Center, 6300 Georgetown Pike, McLean, VA 22101, USAfFederal Highway Administration, Turner-Fairbank Highway Research Center, 6300 Georgetown Pike, McLean, VA 22101, USA
Received 4 February 2002; accepted 1 July 2002
Abstract
Concrete bridge deck deterioration is a significant problem that must be addressed to preserve highway infrastructure investments in
bridges around the world. Reducing the cost of bridge deck maintenance is critical to government and private agencies responsible for
maintenance of bridges. Maintenance challenges increase as many bridges begin to approach the end of their design life and traffic loads
continue to increase. One means of reducing the cost of bridge deck maintenance is to accurately evaluate the condition of the structure and
its constituent materials. Current methods used to evaluate deterioration of bridge decks include acoustic, electrochemical, electromagnetic,
and visual inspection techniques. The purpose of this study was to assess the advantages and limitations of three available evaluation
methods. The evaluation techniques included in this study were ground penetrating radar, the chain drag method, and IE. These techniques
represent an important group of inspection methods currently used to evaluate in-service bridge decks. The bridge deck used in the study
contains significant delaminations but exhibits virtually no outwardly visible signs of these deficiencies, so a detailed visual inspection survey
of the deck was not included. Cores were taken from the bridge deck at selected locations to confirm the accuracy of the results obtained
through each evaluation method. This paper presents the findings from each method and describes their respective advantages and
limitations.
Published by Elsevier Science Ltd.
Keywords: Nondestructive evaluation; Radar; Bridge decks; Concrete; Corrosion-induced delamination
1. Introduction
The highway infrastructure in the United States and
around the world faces a deterioration problem of
unprecedented magnitude. Challenging environmental con-
ditions and increased traffic volumes make bridges more
susceptible than ever to deterioration. Reinforced and
precast concrete bridge decks are subjected to very
demanding conditions, and virtually all bridge decks will
fail to serve out the useful life of the bridge [1]. Accurately
evaluating the condition of a bridge deck over time and
using this information to choose appropriate maintenance
techniques has become critical for the efficient allocation of
bridge deck maintenance resources.
Many nondestructive evaluation (NDE) methods have
been developed for bridge deck assessment but few have
been evaluated in a performance-based comparison.
Further, most of these methods have not been integrated
into a working bridge management system that makes use of
the important data provided by these methods. Four basic
categories of bridge deck assessment methods utilized
include visual inspection, acoustic, electromagnetic, and
electrochemical testing. Methods within these four basic
0963-8695/03/$ - see front matter Published by Elsevier Science Ltd.
PII: S0 96 3 -8 69 5 (0 2) 00 0 61 -0
NDT&E International 36 (2003) 245–255
www.elsevier.com/locate/ndteint
1 Tel.: þ1-202-493-3119; fax: þ1-202-493-3126.2 Tel.: þ1-847-272-4236; fax: þ1-847-291-9599.3 Tel.: þ1-609-799-7799; fax: þ1-609-799-7088.4 Tel.: þ1-404-577-7444; fax: þ1-404-577-0066.5 Tel.: þ1-202-493-3122.6 Tel.: þ1-202-493-3082; fax: þ1-202-493-3126.
* Corresponding author. Tel.: þ1-202-493-3124; fax: þ1-202-493-3126.

categories have been implemented in a variety of ways, but
the commonly accepted approaches have narrowed to only a
few widely used methods. These include visual inspection,
chain drag, IE, ground penetrating radar (GPR), infrared
thermography (IR), and half-cell potential.
The primary goal of these methods is to detect corrosion-
related damage in a bridge deck. For most of these methods,
the delaminations in a deck (which result from volume
expanding corrosion processes at the reinforcing steel) are
detected or measured. However, half-cell potential methods
are designed to identify locations in the deck, where
corrosion activity is likely to be ongoing, which may result
in or may already be areas of delaminated concrete.
Commonly used bridge deck assessment methods are
briefly described here. Visual inspection involves the
assessment of the bridge deck for cracks, spalls and other
irregularities in the deck surface that can be detected
visually [2]. Visual inspection is the most common method
of deck assessment, and requires few tools and minimal
training of inspectors. Subsurface or internal defects in the
deck are difficult to evaluate by this method.
Common acoustic techniques include the chain drag
method and IE. The chain drag method involves dragging a
chain across the bridge deck surface while listening for
changes in the acoustic response. This method involves only
a qualitative assessment, but is rapid and inexpensive. IE is
frequently used when a more thorough acoustic assessment
is needed [3]. The more expensive and time consuming IE
method is quantitative, since the response to an impact is
detected by an acoustic transducer, recorded, and sub-
sequently analyzed for anomalies.
Two electromagnetic methods used for bridge deck
assessment are GPR [4] and IR. GPR systems record the
response to a radar impulse or a series of radar impulses
incident on the bridge deck surface. Careful assessment of the
GPR responses can often yield information about the material
properties of the deck and its condition. IR can be used for
bridge deck assessment, but it is highly susceptible to
environmental conditions. IR records electromagnetic waves
emitted in the infrared portion of the electromagnetic
frequency spectrum. These infrared wavelength emissions
vary in response to environmental conditions as well as the
geometry and emissivity properties of the feature under
investigation. For a bridge deck application, diurnal tem-
perature variations can lead to temperature variations in the
deck that are manifested in thermal gradients on the bridge
deck surface. Under favorable conditions, these gradients
may be related to subsurface bridge deck features. Factors
such as wind, rain, shadows and small diurnal temperature
variation can present challenges for this method [5].
Finally, electrochemical methods that measure corrosion
activity by half-cell potentials are common methods of
bridge deck assessment [6]. These methods can be effective
for locating active corrosion sites, but are time consuming
and expensive to implement. Further, because half-cell
measurements relate to corrosion activity, physical
characteristics of the bridge deck such as delaminations
are not directly assessed.
Three of the six aforementioned methods of bridge deck
evaluation are described and compared in this study. Each
method has advantages and limitations that can be assessed
more thoroughly when they are compared to one another.
Some work comparing bridge deck evaluation methods has
been done in the past [7] but results from these studies have
not been conclusive. The Van Buren Road Bridge (Fig. 1),
which spans Quantico Creek in Virginia west of Interstate
95, was selected as the test bridge for this study.
2. Methods
A comparison of different NDE methods for detecting
bridge deck delamination damage requires reliable ground
truth information. In this study, ground truth data was
derived from cores that were extracted from the bridge deck
and from a reference chain drag study that was conducted by
nondestructive evaluation validation center (NDEVC) staff
using a comprehensive chain drag test. The reference chain
drag survey conducted by the NDEVC tested the entire
bridge deck area, which was subdivided into grid squares for
the survey. Good agreement between chain drag test results
and coring test results were found and details are presented
in Section 2.1 of this paper.
IE testing was conducted at regular intervals over a two-
dimensional grid on the bridge deck. Each IE test result
collected relates to the local condition below the surface of
the bridge deck at that test location. The basic principle of
the IE method involves impacting the surface of the material
with a small diameter impactor and detecting and recording
the response. Appropriate interpretation of the IE data
usually allows the physical condition of concrete to be
assessed. A discussion in Section 2.2 of this paper provides
details on how these assessments are made.
GPR was also applied to the Van Buren Road Bridge
deck, and it was carried out with two different instruments.
GPR data was collected using a commercially available
Fig. 1. Van Buren Road Bridge viewed from the east.
M. Scott et al. / NDT&E International 36 (2003) 245–255246

radar system made by Geological Survey Systems, Inc.
(GSSI) and with a prototype system developed by Lawrence
Livermore National Laboratory (LLNL) for the federal
highway administration (FHWA). Both systems take
advantage of synthetic aperture radar techniques that
capture a series of radar waveform responses at regularly
spaced intervals. The GSSI system features a ground
coupled, broadband antenna pair with a 1.5 GHz center
frequency. The LLNL prototype system, called High Speed
Electromagnetic Roadway Mapping and Evaluation System
(HERMES) utilizes an array of 64 air coupled antenna pairs
that transmit a radar pulse spanning a band of frequencies
centered around 2.4 GHz. Details about the operational
characteristics of each of these systems and the development
of the HERMES prototype are provided in Section 2.3 of
this paper.
The application of a range of NDE methods to a single
bridge deck provides a very rich data set for analysis. This
paper presents a summary of an initial analysis of the
test data. This analysis may be appended or supplemented in
Fig. 2. Data sets from (a) a series of chain drag surveys, (b) an IE survey overlaid with reference chain drag data, (c) reconstructed HERMES data overlaid with
reference chain drag data and (d) raw HERMES data A–A along with raw GSSI data B–B.
M. Scott et al. / NDT&E International 36 (2003) 245–255 247
the future. A preliminary analysis of this data was presented
in Ref. [8]. Results from each NDE technique are
summarized in Fig. 2.
The results in Fig. 2 were collected from the 17.7 m long
center span of the Van Buren Road Bridge deck. Fig. 2(a)
summarizes a series of chain drag tests performed by state
inspectors and a reference chain drag survey performed by
the NDEVC. The NDEVC reference chain drag survey
results are indicated by continuous lines, which enclose the
boundaries of detected delaminations. In Fig. 2(a), the gray
areas in this figure indicate detected delamination locations
as determined by twenty-two pairs of state bridge inspectors
from various states in the United States. Darker shades of
gray indicate stronger agreement between surveys while
lighter shades of gray indicate fewer of the twenty-two
survey results in agreement. Locations of cores extracted
from this section of bridge deck are also indicated. Fig. 2(b)
presents the results from an IE survey of the center span.
Light gray filled circles indicate that a delamination was
detected at a given location while open circles indicate solid
concrete based on IE test results. Dark gray filled circles
indicate suspect IE test results that cannot be definitively
interpreted solely as responses to shallow delaminations.
Fig. 2(c) presents plan view images that were extracted from
a three-dimensional reconstruction of a HERMES GPR data
set. Fig. 2(d) presents raw data collected with HERMES
(section A–A) and the GSSI radar system (section B–B).
2.1. Chain drag and coring
The chain drag test was conducted in accordance with
ASTM D 4580-86 [3]. Two bridge inspectors participating
in the NDEVC visual inspection study [9] are illustrated
carrying out the chain drag procedure in Fig. 3. The chain
drag procedure is often most efficiently done using two
people working together. The two-person team allows the
tasks of dragging the chains over the deck, clarifying defect
boundaries using a rock hammer and recording findings to
be divided. Frequently, this method is employed with a
Fig. 3. Bridge inspectors carrying out a chain drag survey on the Van Buren
Road Bridge.
Fig. 4. Bridge deck cores in the process of being extracted from the Van
Buren Road Bridge.
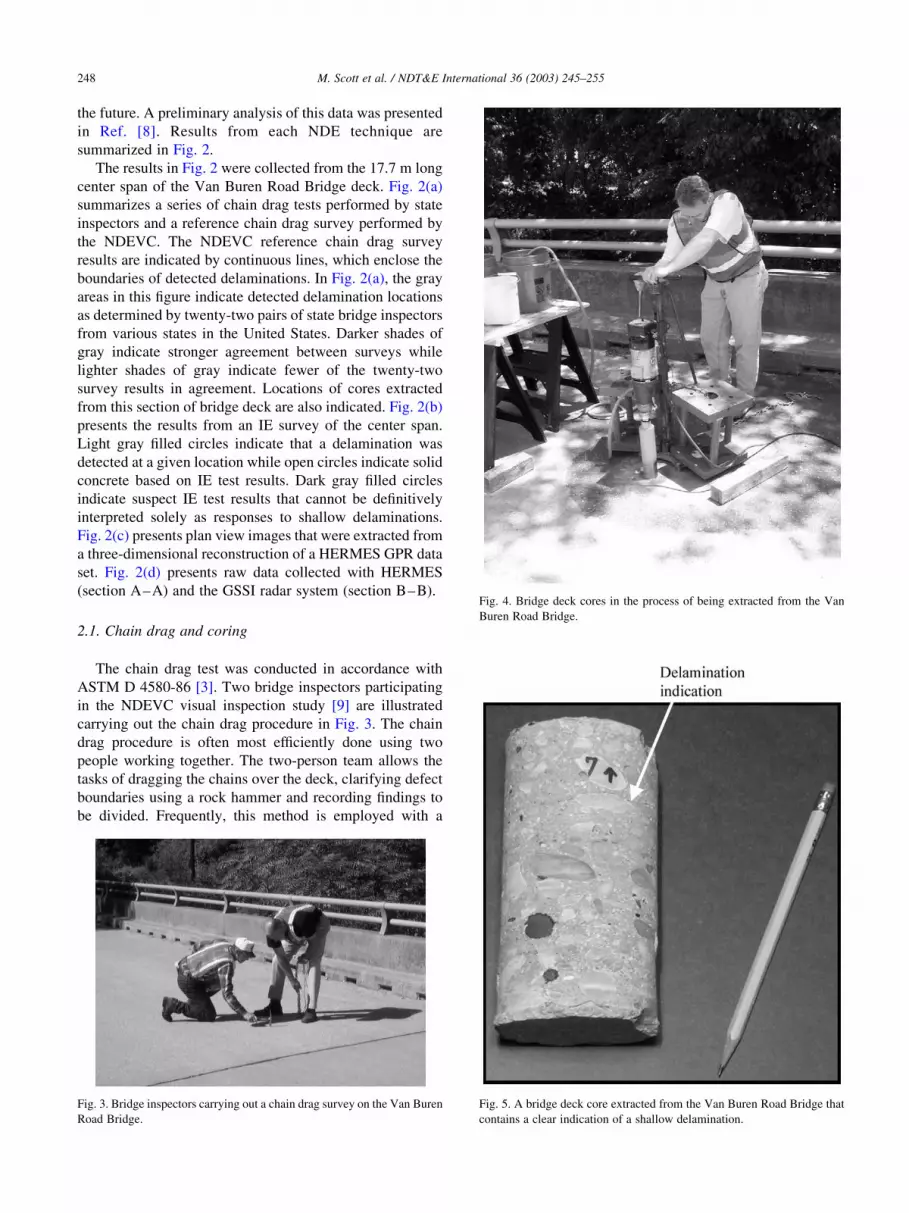
Fig. 5. A bridge deck core extracted from the Van Buren Road Bridge that
contains a clear indication of a shallow delamination.
M. Scott et al. / NDT&E International 36 (2003) 245–255248

single inspector using only a chain to define boundaries. In
addition to acoustic responses, visual indications of surface
distress are often indicated on the data sheets. Fig. 4 shows a
coring machine being used to remove cores from the Van
Buren Road bridge deck. Fig. 5 shows one of the ten
extracted cores (Core No. 7). As shown in Fig. 5, Core 7
exhibits indications of a delamination directly below the top
surface. The cracks observed in this core, and in other cores
that were removed from the deck, were confirmed by
making visual observations of the interior surface of the
core hole and by IE testing.
As shown in Fig. 2(a), the chain drag surveys performed
by state bridge inspectors were not entirely consistent with
the reference chain drag survey performed by NDEVC staff.
A thorough analysis of all of this chain drag data is provided
in Ref. [9]. From Ref. [9], if the NDEVC reference chain
drag survey is used as a basis for comparison, (therefore
leading to an estimate that 19% of the bridge deck is
delaminated) and an allowance of ^5 percentage points is
permitted as a reasonable error, five of the twenty-two
inspection teams had overall delamination estimates that
were in this range. The data also show that location, where
five inspection teams indicated a delamination response
collectively represent a 21% delaminated deck estimate.
Varying the level of inspection team overlap for detected
delamination indications, from one team to twenty-two
teams, results in the delamination percentage estimate
varying from 2 to 69%, respectively. These statistics are
indicative of the variability inherent in the chain drag
method.
NDEVC reference chain drag data was compared to the
data from cores taken from the bridge deck. All ten of the
cores removed from the bridge deck matched results from
the reference chain drag survey and one of the data sampling
methods implemented for the IE survey (Table 1). Five
cores contained delaminations while the remaining five
cores did not, as shown in Table 1. These results support the
confidence that can be placed in the reference coring and
chain drag tests and allows for a basis of comparison with
other NDE methods. In addition, the comparison between IE
and chain drag results in Section 2.2 indicates the sensitivity
of the IE test to defect proximity. The differences between
IE results at core locations relative to results at adjacent grid
points indicate this sensitivity. This effect may account for
the differences observed between the delamination percen-
tages determined using chain drag and IE, (Table 2).
The quality of chain drag surveys is affected by many
factors. For the results presented in this study, two person
teams of State bridge inspectors with different levels of
experience and using different procedures (based upon the
individual state inspection guidelines that each inspector
was accustomed to) carried out chain drag surveys that
showed variability in results from this technique. Although
this variability is significant, it should be noted that
improved training of inspectors and more accurate docu-
mentation of the results by inspectors could improve
inspection quality [9]. The accuracy of the NDEVC
reference chain drag survey was much higher than a typical
chain drag survey due to the extensive time taken to conduct
it (two days) and the refined two-foot grid that the results
were recorded on.
2.2. Impact-echo
The IE NDE technique was used to determine the
extent of concrete deck delaminations at the Van Buren
Bridge in a comparison with test results from other
bridge deck evaluation methods. The IE testing technique
is a stress-wave method, which uses mechanical energy
to transmit a sound wave into the concrete. A spectral
analysis of reflected compression waves (from internal
interfaces or external boundaries) is then performed to
Table 1
Results from cores and acoustic based bridge deck evaluation methods
Core number Core result NDEVC chain drag result IE (at core location) IE(at grid location)
1 Delaminated Delaminated Delaminated Delaminated
2 Delaminated Delaminated Delaminated Solid
3 Solid Solid Solid Solid
4 Solid Solid Solid Solid
5 Solid Solid Solid Solid
6 Delaminated Delaminated Delaminated Suspect distress
7 Delaminated Delaminated Delaminated Suspect distress
8 Solid Solid Solid Solid
9 Delaminated Delaminated Delaminated Delaminated
10 Solid Solid Solid Solid
Table 2
Percent of bridge deck found delaminated based on the NDEVC reference
chain drag survey and an IE survey at the Van Buren Bridge
NDEVC chain drag (deck
area percent delaminated)
IE (deck area percent
delaminated)
North span 6.3 10.3
Center span 17.7 28.3
South span 20.6 27.3
Total 14.8 22.0
M. Scott et al. / NDT&E International 36 (2003) 245–255 249

determine the internal characteristics of the concrete at
that location.
When the material is stressed with a suddenly applied
load, stress waves propagate through the material at a finite
speed. This velocity is a characteristic of the material the
waves propagate through. When a concrete surface is
impacted, a transducer mounted on the same concrete
surface receives the longitudinal wave reflections from
discontinuities within the concrete, as shown in Fig. 6.
Since concrete is a heterogeneous material, detecting
reflected stress waves or echoes is very difficult. However,
by using fast Fourier transform (FFT) analysis, the time
domain signal is converted into a frequency domain
function, simplifying signal interpretation. Therefore, by
knowing the compression wave propagation velocity (Cp)
through the material, the frequency spectrum ( f ) can be
evaluated to determine the location of the discontinuity or
the thickness of the material. An assessment of the thickness
of the concrete is made by using the following Eq. 1
T ¼ Cp=2f ð1Þ
where T is the thickness of the medium (m), Cp,
compression wave velocity in the medium (m/s), and F is
the frequency (Hz).
IE testing of the Van Buren Bridge was carried out over
locations on a two-dimensional grid with a two-foot spacing
between grid locations (Fig. 2b). A small diameter steel
sphere (impactor) is used to generate a transient stress-wave
that propagates through the concrete deck. Fig. 7 shows the
IE test being performed using the Docter IE system
manufactured by Germann Instruments of Copenhagen,
Denmark. The Docter system consists of a hand-held testing
unit and a computer-based data acquisition system. The
hand-held unit contains a displacement transducer with a
conical piezoelectric tip attached to a cylindrical brass
backing. The transducer has a nominal resonance frequency
of approximately 1 kHz. The computer-based data acqui-
sition system consists of a portable computer with a data-
acquisition card and a proprietary IE software known as
Echo-Blue. The IE technique can be applied to a variety of
civil infrastructure elements, including plate-like structures.
Structures such as bridge decks, slabs and walls are
considered plate-like structures. Plate-like structures are
defined as those in which the lateral dimensions of the
structure are at least five times its thickness. Unlike other
concrete structures such as beams and columns, in which
reflections from the boundaries (the sides or edges of the
structure) introduce additional peaks in the spectral plot,
plate-like structures are typically characterized by a single
peak from the back side or bottom of the structure when data
is collected from a solid concrete area.
Fig. 8 shows the IE result for a test conducted at Grid
Point B8 (Core No. 4). Fig. 8(a) shows the detected
waveform in the time domain. A FFT analysis is then
performed to convert the waveform into a frequency domain
function, as shown in Fig. 8(b). This spectral plot has a
predominant frequency of 9.3 kHz. This frequency was
determined to be a typical full-thickness result from a solid
section. The frequency associated with the full-thickness of
the slab (9.3 kHz) was determined by calibrating the IE
equipment with nominal deck thickness (obtained from
extracted cores) and Eq. (1). This type of IE response
(shown in Fig. 8) is typical of plate structures, where a
single predominant peak is expected.
Fig. 9 shows the result for a test conducted at Grid Point
C26. The frequency content of the waveform can be
observed in Fig. 9(a). Correspondingly, the transformation
into the frequency domain (Fig. 9(b)) reveals multiple peaks
with high amplitudes and a predominant low frequency at
3.8 kHz. This type of response is characteristic of shallow
(thin) delaminated concrete. A shallow delaminationFig. 6. A schematic illustration of the IE test.
Fig. 7. The IE technique is being carried out on the Van Buren Road Bridge.
M. Scott et al. / NDT&E International 36 (2003) 245–255250

response is fundamentally different than a full thickness
response obtained from a solid section. The wave produced
by impacting the concrete surface excites the flexural modes
of vibration of the thin layer of concrete above the
delamination or crack. These modes of vibration correspond
to the hollow sound one hears in a delaminated test area in a
chain drag or hammer tap delamination survey. The
difference in the amplitude of the response in Figs. 8(a)
and 9(a) may be accounted for by the presence of the defect
for the Fig. 9(a) response and the variability associated with
using the manually actuated impactor.
The description of Figs. 8 and 9 shows the typical
analysis method for interpreting the collected IE data from a
bridge deck. Many other features can be observed in typical
data obtained using this technique [10], but are beyond the
scope of this paper.
2.3. Radar
Two types of radar systems were used to survey the Van
Buren Road bridge deck for delaminations. These systems
included a commercially available GPR system built by
GSSI called the subsurface radar system (SIR), and a
prototype system known as HERMES designed and
developed by LLNL for the FHWA. Both radars were
employed to survey all three spans of the Van Buren Road
bridge deck. Results from testing over the center span are
shown in Fig. 2(c) and 2(d) and are discussed in Sections
2.3.1 and 2.3.2.
2.3.1. Survey using the GSSI SIR-2000 system
The GSSI SIR-2000 system was used to scan along the
surface as shown in Fig. 10. Scanning was conducted at
0.61 m (2 ft) intervals across the bridge deck, following
reference lines placed on the deck surface. Data were
collected by passing the ground coupled antenna of the radar
over the locations marked with longitudinal reference lines,
labeled A–J in Fig. 2(b). The system was moved at a steady
rate over the reference lines and a trigger switch on the hand
grip of the system was used to start and stop the data
acquisition. The testing was conducted by collecting a series
of scans that were saved line by line for each span.
The GSSI system used in this survey employed a
broadband ground coupled antenna with a center frequency
Fig. 8. IE test response from a solid concrete location (Core 4), (a) time
domain plot; (b) frequency domain plot.
Fig. 9. IE test response from a shallow delamination location near grid point
C26, (a) time domain plot; (b) frequency domain plot.
Fig. 10. The GSSI’s SIR GPR system as used on the Van Buren Road
Bridge.
M. Scott et al. / NDT&E International 36 (2003) 245–255 251

of 1.5 GHz. The system consists of an enclosure box with a
small survey wheel that houses a pair of antennas (one
transmitter and one receiver) and a long fiberglass rod fitted
with a handle attached to the box. The PC based controller
and data acquisition unit with LCD screen are built in a
separate sealed unit that can be carried on a shoulder strap.
The two units are integrated together so that the operator can
walk comfortably at normal and consistent speed to survey
the designated area.
Data was displayed as a two-dimensional image in real
time to confirm that the acquisition was proceeding as
expected. An example of typical data obtained by the
system during the testing is shown in Fig. 2(d), section
B–B. The data is presented as a two-dimensional GPR B-
scan image such that the horizontal axis is the spatial
dimension along the length of the bridge deck and the
vertical axis corresponds to the time required for the
reflected radar pulse to return to the antenna. For this data,
gray scale intensity represents the amplitude of the radar
reflection at a given location and time. High positive
amplitudes are indicated by light shades up to white and low
to negative amplitudes are indicated by dark shades down to
Fig. 11. Test data collected near Core 7 using (a) chain drag and IE (b) HERMES and (c) GSSI radar.
M. Scott et al. / NDT&E International 36 (2003) 245–255252

black. It should be noted that the GSSI data in Fig. 2(d) B–B
is keyed to a color bar with alternating gray and white areas,
positioned directly above the data. This color bar indicates
delamination locations based on the NDEVC reference
chain drag survey. The white portion of the color bar
indicates locations where the chain drag test showed there
was solid concrete and the gray portion indicates locations
where the chain drag test indicated delaminated concrete
was present. The results indicated by the color bar were
obtained from locations that correspond to the path of the
GSSI antenna that was followed to collect the data displayed
below the color bar.
Examination of the amplitude and phase of radar
reflections in delaminated and solid concrete locations
does not reveal a consistent response that distinguishes
delaminated concrete areas from solid concrete areas. The
dominant response is to transverse reinforcing steel in the
bridge deck, positioned orthogonal to the direction of
antenna motion. The response to this steel is indicated by
high amplitude reflections produced, where reinforcing steel
is directly beneath the antenna and trailing parabolic shaped
tails on either side of the steel as the antenna approaches and
passes it. Other notable features include distinct parabolic
features near the extreme left and right ends of the data
corresponding to responses to the bridge joints.
Observations of similar features in the GSSI data can be
made in Fig. 11(c), where a short section of GSSI data from
the middle span of the Van Buren Road Bridge, (passing
over a delamination near Core 7) is presented. The data in
this figure was collected as the GSSI antenna was moved
along the path indicated by the dashed line in Fig. 11(a). As
this GSSI data set is traversed from left to right, the top layer
of reinforcing steel (indicated by parabolic shaped
responses near the top of the figure) is detected at response
times that vary by a few tenths of a nanosecond. This may be
indicative of a physical change in the reinforcing steel
depth, but it may also be indicative of local material
property variation [11]. Another important feature in the
GSSI data is the variation in the amplitude of the response to
reinforcing steel. These variations can be observed in both
Figs. 2(d) and 11(c). A definitive reason for this amplitude
variation could not be determined, but these variations are
probably explained by attenuation with depth. An observed
reduction in the magnitude of the radar response to
reinforcing steel detected at later relative times supports
this hypothesis. It should be noted that the path traversed by
the HERMES response shown in Fig. 11(b) came from data
collected along a nearby but different path than the GSSI
radar data, as shown by the dotted line.
2.3.2. Survey using the HERMES system
HERMES is a unique prototype GPR system that was
designed and built as a specialized bridge deck inspection
tool. HERMES is capable of surveying a deck surface one
lane at a time at a scan width of about 1.9 m at normal traffic
speeds. The antennas are mounted in the back of a trailer
that can be towed at highway speeds over the bridge deck
while collecting and acquiring data. The HERMES
controller unit powers the antennas to launch ultra-wide
band microwave pulses. The antenna controller unit is
coupled with a distance encoder wheel that determines the
antenna’s firing time sequence as well as the trailer’s
position over the bridge deck. The HERMES shown in
Fig. 12 is collecting data over a bridge deck in Tennessee.
HERMES was used to collect data over the Van
Buren Road Bridge deck, providing coverage of the
majority of the bridge deck area. HERMES uses software
to manipulate the data collected by each of the antennas
in its array. The collected data from each antenna is very
similar to the data collected by a typical GPR system, as
shown in Fig. 2(d) section A–A. Parabolic shaped
responses to transverse reinforcing steel can be clearly
observed in the HERMES response, in a similar data
display to the GSSI data in Fig. 2(d) section B–B. One
notable difference between the two system responses is
the sharper definition of the reinforcing steel in the raw
data from the GSSI system (observed as a narrower
parabolic shape), relative to the raw data from HERMES.
This is due to the wide beamwidth HERMES employs
relative to GSSI to gain advantages for imaging using
wavefield backpropagation techniques. In the case of the
HERMES data, high amplitudes are displayed as white
and low amplitudes are displayed as increasingly dark
shades of gray. The data from all 64 antennas in the
array can be reconstructed using a procedure called
wavefield-backpropagation [12] that mathematically esti-
mates the location of the reflection sources imaged in the
original raw radar data. When this type of calculation is
done in three dimensions using HERMES data, a three-
dimensional volume of data can be generated to allow
interior bridge deck features to be imaged with a much
more realistic appearance than available by conventional
GPR systems.
The end result is data that can be examined in a variety of
ways. An example is presented in Fig. 2(c), where a
horizontal slice from a reconstruction obtained at the level
of the reinforcing steel is displayed as an overlay on
Fig. 12. Photograph of HERMES collecting data over a bridge deck in
Tennessee.
M. Scott et al. / NDT&E International 36 (2003) 245–255 253

reference NDEVC chain drag data. This slice of recon-
structed data highlights the response to reinforcing steel in
the deck that are aligned with the skew of the deck. The high
magnitude reflections from the reinforcing steel are
displayed as light gray up to white while the background
reflections from other features are displayed in dark gray to
black. Note that the responses in the horizontal layer from
the reconstruction do not show a direct correspondence
between locations where HERMES data indicates a strong
reflection and areas where delaminations were detected by
the NDEVC reference chain drag survey. Additional raw
HERMES data is provided in Fig. 11(b). This data was
collected along a path that traversed Core 7, and is marked
with a dotted line in Fig. 11(a). The area, where the data was
collected traversed a delaminated area, according to the
NDEVC reference chain drag survey, and was later
confirmed to be delaminated based on observations of the
extracted core. The data presented in Fig. 11 shows a B-scan
image of the HERMES waveforms from this collected data
set. An arrow pointing downward in the figure defines the
location of the extracted core relative to the collected data.
An examination of these waveforms does not indicate a
significant amplitude change or phase shift in the delami-
nated area that included Core 7 and the surrounding area.
These findings are consistent with laboratory test results
[13], where simulated delaminations were not detectable
using the current generation HERMES technology. The
response to aluminum marking tape that was placed on the
deck is observed to the right of the core location in Fig. 11
and should not be mistaken for a response to any other
bridge deck feature.
3. Conclusion
Nondestructive evaluation techniques that have been
developed for the purpose of inspecting bridge decks
were tested on a concrete bridge deck for a comparison
study. Techniques included in the study were primarily
directed at detecting corrosion-induced delaminations
below the surface of the concrete. These techniques
included the chain drag method, IE, and two types of
GPR. Ground truth data based on a careful implemen-
tation of the standard chain drag method were confirmed
by examining concrete cores that were extracted from the
deck. The IE and GPR methods were compared to this
original reference data. Although the chain drag method
was used as a reference, it was also investigated to assess
its reliability. The results showed that current technology
implementing acoustic techniques, such as the chain drag
method and IE, are generally consistent with results from
coring when they are carefully performed. However,
there are significant drawbacks to the two acoustic
methods implemented in this study. The chain drag
method is susceptible to inconsistencies and errors due to
subjective interpretations an inspector must make to carry
out this method. The more quantitative IE method
reduces the chances of subjective errors but it is
extremely time consuming and results may not always
be conclusive. The drawbacks of these acoustic methods,
which also include a reduced or often complete inability
to investigate asphalt-overlaid decks, motivate the
investigation of the radar methods that were also
included in this study.
The two GPR systems that were included in this study
were investigated because they represent a potentially faster
and easier way of conducting bridge deck investigations.
Although the technology is continuing to be improved, the
current state of the art commercial systems and even the
prototype system used in this study did not produce
consistent responses to delamination features in the tested
bridge deck. The FHWA and a state pooled fund study are
supporting the development of a new system called
HERMES II that may have a capability to detect delamina-
tion features and may also allow for more rapid bridge
inspections in the future. This technology may also mature
to allow delaminations to be detected through asphalt
overlays.
Acknowledgements
The authors acknowledge the support provided by the
Federal Highway Administration’s Turner-Fairbank High-
wayResearchCenter(TFHRC).Contributions tothis research
were also made by Dr Brent Phares (Iowa State University)
and Dennis Rolander (Wiss, Janney, Elstner Associates) and
they are gratefully acknowledged for their efforts.
References
[1] Bettigole N, Robison R. Bridge decks: design, construction,
rehabilitation, replacement. ASCE press; 1997. p. 5.
[2] Hartle RA, Amrhein WJ, Wilson III KE, Baughman DR, Tkacs JJ.
Bridge inspector’s training manual/90. FHWA-PD-91-015, McLean,
VA, May 1991; 1990. p. 1–24 [chapter 14].
[3] ASTM D 4580-86 (Reapproved 1992), Standard practice for
measuring delamination in concrete bridge decks by sounding.
Annual book of ASTM standards, ASTM; 1992.
[4] ASTM D 6087, Evaluating asphalt covered concrete bridge decks
using ground penetrating radar. Test method for, annual book of
ASTM standards, ASTM; 1999.
[5] Schickert G. NDT in civil engineering in Germany. Insight Non-
Destruct Test Condition Monitor 1994;36(7).
[6] ASTM C 876-91, Half-cell potentials of uncoated reinforcing steel in
concrete. Test method for annual book of ASTM standards, ASTM;
1998.
[7] Reis HLM, Baright MD. Evaluation of bridge deck delamination
investigation methods. Final Report, Project IC-H1, 95/96, Report
No. ITRC FR 95/96-1. Illinois Transportation Research Center;
July 1998.
[8] Scott M, Rezaizadeh A, Delahaza A, Moore M, Graybeal B, Washer
G. A comparison of nondestructive evaluation methods for bridge
deck assessment. Structural faults þ repair 2001. Ninth International
Conference and Exhibition, London, UK; July 4–6, 2001.
M. Scott et al. / NDT&E International 36 (2003) 245–255254

[9] Moore M, Phares B, Graybeal B, Rolander D, Washer G. Reliability
of visual inspection for highway bridges, vol. I. Final report, FHWA-
RD-01-020; June 2001.
[10] Sansalone MJ, Streett WB. Impact-echo nondestructive evaluation
of concrete and masonry. Ithaca, NY: Bullbrier Press; 1997. p. 46.
[11] Halabe UB, Maser KR, Kausel EA. Condition assessment of
reinforced concrete structures using electromagnetic waves. ACI
Mater J 1995;92(5).
[12] Mast JE. Microwave pulse-echo radar imaging for the nondestructive
evaluation of civil structures. Doctoral Thesis. University of Illinois at
Urbana-Champaign; 1993.
[13] Scott M, Rezaizadeh A, Delahaza A, Moore M, Graybeal B,
Washer G. A phenomenology study of ground penetrating radar
for applications to bridge decks. Structural faults þ repair 2001.
Ninth International Conference and Exhibition, London, UK; July
4–6, 2001.
M. Scott et al. / NDT&E International 36 (2003) 245–255 255